Abstract
Visual localization is a core part of many computer vision and geospatial perception applications; however, the ever-changing time phase and environment present challenges. Moreover, the ever-enriching spatial data types and sensors create new conditions for visual localization. Based on the prior 3D model and the location sensor, the current study proposes a visual localization method using semantic information. This method integrates panoptic segmentation and the matching network to refine the sensor’s position and orientation and complete the target perception. First, the panoptic segmentation and the match network are used together to segment and match the 3D- model-rendered image and the truth image. The matching results are then optimized based on the semantic results. Second, the semantic consistency score is introduced in the RANSAC process to estimate the optimal 6 degree-of-freedom (6DOF) pose. In the final stage, the estimated 6DOF pose, the instance segmentation results, and the depth information are used to locate the target. Experimental results show that the proposed method is a significant improvement on advanced methods for the long-term visual localization benchmark dataset. Additionally, the proposed method is seen to provide improved localization accuracy and is capable of accurately perceiving the target for self-collected data.
1. Introduction
The field of geospatial perceptual intelligence is gradually gaining attention, and geospatial cognitive intelligence is currently the subject of active research [1]. Visual localization plays an important role in many computer vision and geospatial perception-based applications, but it represents of the major challenges faced in these applications. The core task of these applications is to accurately locate and register the data acquired by the sensors. The obtained data is further used for advanced applications like augmented reality [2,3], autonomous driving [4,5,6], and closed-loop detection in Simultaneous localization and Mapping (SLAM) [7,8].
Currently used visual localization methods mainly comprise two-dimensional (2D) image-based localization techniques [9,10,11,12], three-dimensional (3D) structure-based methods [13,14,15], hierarchical localization methods [16,17], and learning-based localization methods [18,19]. The 2D image-based localization method is successful in retrieving images similar to those in the database. Furthermore, it closely approximates the pose of the query image. This method transforms the localization problem into an image retrieval problem, reducing the accuracy of the method. The 3D structure-based methods initially relate the 2D features in the query image and the 3D points in the structure-from-motion (SFM) point cloud by a descriptor-matching process. It estimates the 6DOF pose camera of the query image by the 2D-3D-matching process. This method is more accurate than the 2D image-based method but is time consuming for larger scene scales. The hierarchical localization method combines the above two localization methods. It uses the image retrieval as the initial step of the 3D structure-based approach for constraining the localization problem to a smaller 3D model. This method provides reasonable accuracy and efficiency. The learning-based method uses the learning model for the descriptor learning or the direct regression model to obtain the 6DOF camera pose. In addition to this, some methods use the position sensors to complete geographical localization and registration [20,21,22]. Although such methods can adapt to the various types and scales of the scenes, the localization accuracy completely depends on the accuracy of the position sensors. Localization accuracy is very low for the disturbed (unstable) signals.
Except in the absolute location method, which uses a sensor, the feature matching process is the most critical step in all the other methods. Sensor advancements have allowed the generation of different types of rich spatial data and features. However, rich feature information brings some challenges to the feature matching process. Feature description is greatly affected by changes in light, weather, and season. Additionally, due to the increasingly rich structure of the spatial data and the huge heterogeneous data set, different imaging mechanisms generate different image features. Different imaging phases and mechanisms bring challenges for feature matching, leading to difficulties related to location and subsequent effects on geospatial sensing applications. Figure 1 shows An example of a scene and the 3D model changing over the time. To overcome this difficulty, the methods developed in [23,24] generate feature descriptors with stronger stability. This is achieved by training the neural networks. The obtained feature descriptors provide improved performance in comparison to the traditional SIFT features. However, such methods are inefficient in handling the temporal changes and provide long-term localization services. To handle the long-term localization, the method developed in [25,26,27] integrated image semantic information and the geometric positioning process. High-level semantic information is more stable over varying time phase and image structures. The introduction of semantic information in visual localization effectively improved positioning stability.
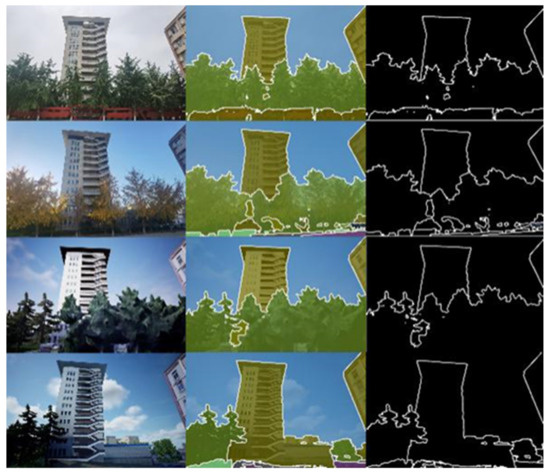
Figure 1.
An example of a scene and the 3D model changing over the time. The second column represents the semantic segmentation. Except for the vegetation, the section with the same semantic information is observed to show less variation. The third column represents the segmentation edge. It is observed that the edge of the ground object (except the vegetation) is very similar. This indicates that the confidence rate of the feature points on the edge is high when used as a matching feature.
Combining the advanced methods of panoptic segmentation [28] and cross-modality image matching, this paper presents a visual localization method based on semantic information and the SuperGlue algorithm, a feature matching algorithm based on the graph convolution neural network [29]. A complete perception of the specific targets in geographical space using instance results of the panoramic segmentation is also presented. The study is focused on building a real 3D model of the scene in advance, in contrast to the 2D image-based and 3D structure-based methods. A relation between the 2D sensor image and 3D model data is developed by comparing the relation of the sensor image and the image rendered by the real model. The proposed method can be integrated to a hierarchical localization method. First, the GNSS and IMU data are used to replace the image retrieval for the initial geographic localization. Subsequently, the 2D-3D matching is used to optimize the 6DOF pose by integrating the semantic information to obtain highly accurate positioning results. Specifically, the proposed method uses the 3D model, GNSS, and IMU as a priori data. Furthermore, it uses the semantic results from panoptic segmentation to optimize SuperGlue matching scores. This is followed by introducing the semantic consistency score in RANSAC. The 6DOF pose of the sensor is then optimized by the polar geometry solution. Finally, the optimized 6DOF pose, instance segmentation results, and depth information are used to locate the target. The developed method has several advantages. In case of limited interference of the GNSS signal, using the position sensor instead of image retrieval can effectively improve the efficiency and accuracy of the initial localization. Furthermore, the developed method is computationally fast, as 2D-3D matching is converted to 2D-2D matching through the prior 3D model. Furthermore, localization stability can be improved effectively by combining panoptic segmentation and the learning-based matching method.
Our research contributions can be summarized as:
- A visual localization method with semantic consistency is proposed to improve the localization accuracy in a different time phase.
- A semantic optimization matching method is proposed, which can improve the matching accuracy effectively.
- Extensive experimental results are provided to demonstrate the performance of the proposed method. The experimental results demonstrate its superiority compared with state-of-the-art methods.
2. Related Work
3D structure-based localization. Methods described in [13,14,15] established a relation between the 2D feature of the target image and the 3D points in the SFM point cloud. The 6DOF pose of the target image was then estimated through 2D-3D matching. The method in [15] proposed a priority matching strategy wherein priority was given to features more likely to achieve 2D-3D matching. The searching process continued until the matching conditions of adapting to the large-scale scenes were satisfied. The method in [13] can effectively process and reduce the search range by introducing Accurate Approximation and a fast polynomial solver into camera pose estimation, which improved pose estimation accuracy. In contrast, the method used in [16,17] used image retrieval as the initial step while constraining the localization to a smaller 3D model. This effectively reduced the number of abnormal features and improved positioning accuracy.
Learning-based localization. The authors of [30] evaluated the localization methods of the local features [29,31,32] based on deep learning techniques, which provided excellent localization results. D2-Net [31] proposed a method that uses a single convolutional neural network to simultaneously detect features and extract feature descriptors. More stable key points were obtained with this method. The neural network trained in method [18] used the relevant feature descriptors and fraction prediction to obtain sparse key points. Furthermore, it was used with the traditional pose estimation solution method for long-term positioning. This helped overcome the influence of illumination changes on localization. The authors of [19] proposed a weakly supervised learning method to learn seasonal invariable features so as to realize the matching and long-term localization of the data in different periods. Method [33] extracts the domain-invariant features through a multi-domain image translation technique and introduces a gradient-weighted mapping loss to obtain accurate localization. Stable localization results were obtained for an environment with varying light and vegetation.
Localization with semantic. Method [25] applied gravity direction and camera height as a priori information to measure semantic consistency by projecting the 3D points with the semantic label into the target semantic image. Methods [26] designed a localization algorithm based on semantic segmentation and semantic feature mapping. The use of semantic features with seasonal invariance effectively improves the accuracy of the long-term localization. In methods [17,34], a hierarchical visual localization algorithm combining the semantic information is proposed, which uses the semantic matching score as the weight for the RANSAC’s sampling to obtain the pose. This provides significant improvement over the original hierarchical localization method. Method [35] combines multiple learning-based feature descriptions, the semantic consistency check, and the deep consistency verification to identify the false key-matching relationships. This effectively improves the performance of the long-term localization. Method [36] proposes a fine-grained segmentation network to generate a large number of fine image semantic labels. Further, the semantic labels are applied to the original visual localization method, effectively improving accuracy. Method [37] is based on the initial pose predicted using the Visual Inertial Odometry (VIO) and uses semantic edge features for key image mapping registration. This is observed to effectively optimize localization accuracy. The author of [38] proposes a vision-aided GNSS positioning method using semantic information by integrating stereo cameras and the GNSS into a loosely coupled navigation system. This method can achieve continuous high-accuracy positioning in GNSS-challenged environments.
Panoptic segmentation. Method [39] develops a segmentation task that unifies instance and semantic segmentation. It simultaneously requires full pixel classification and instance target detection in the images. MaskFormer [28] along with [37] develop a method to compute the class score and mask score of the point pairs to complete panoramic segmentation. DeepLab [40] uses the dual-ASPP and dual-decoder structures for semantic information and the instance segmentation, respectively. The model so developed is a simple, powerful, and fast-anticipating panoramic segmentation system that uses a top-down approach and generates advanced panoramic segmentation results. In method [41], a dynamic instance mask head network is designed to replace the fixed weight instance mask head network, helping to improve the accuracy and reasoning speed of the panoramic segmentation. Based on the method developed in YOLOv3 [42], the authors of [43] propose a real-time panoramic segmentation network by adding semantic and instance segmentation branches.
3. Methodology
The method proposed in this study is based on a pre-established 3D scene model. The detailed methodology is as shown in Figure 2. The details of the steps followed are as described hereafter. First, a position sensor is used to obtain the initial pose. It is subsequently used as a viewpoint to render the image from the 3D model. In the second step, the MaskFormer [28] and SuperGlue [29] networks are used to segment the image and match these two images to obtain the instance, semantic, and matching information. The third step involves the use of segmentation information to adjust the matching score for optimizing the matching result. The fourth step introduces the semantic consistency score into the RANSAC process. The position and pose of the sensor are then optimized using the polar geometry solution. In the last step, the optimized pose, instance target information, and depth information are used to complete target perception. This section briefly introduces the initial positioning and the rendering process and the highlights of the MaskFormer network and the SuperGlue matching network. The details of the segmentation-based matching optimization and the semantic consistency RANSAC steps are discussed, thus describing the target perception process.
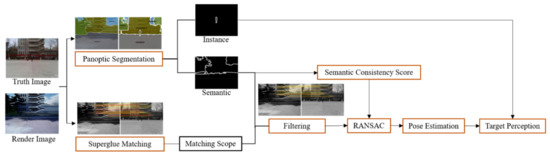
Figure 2.
Overview of the proposed method.
3.1. Initial Positioning and 2D Image Rendering
The method developed in this paper takes a 3D model, GNSS, and IMU as a priori information. If there is no serious interference resulting in the complete failure of the position sensors, the initial positioning and the geographical registration between the sensor and the 3D model are relatively reliable. In addition to this, the 2D images are used to generate the rendered image. The method transforms the relationship between the 2D image and the 3D model scene into 2D-2D matching between the rendered image and the real image. This process simplifies the matching relationship, and a relation with an acceptable error range is obtained. The essence of the 2D rendering is the process of simulating a virtual camera, generating related parameters and poses approximately consistent with the real camera. Another crucial step is using projection mapping to get the 2D images from the a priori 3D models. During the process, the initial 6DOF pose obtained by the sensor is used as the exterior orientation, while the internal parameters are set to be consistent with the real camera. It should be noted that in the process of projection, while internal and external parameters of the camera can be simulated, some inherent differences in the image are inevitable. These differences were regarded as an acceptable error in this study.
3.2. Segmentation-Based Matching Optimization
3.2.1. Panoptic Segmentation
Panoptic segmentation combines semantic and instance segmentation, which can segment instance objects while assigning a semantic label to each pixel. In this study, segmentation results (semantic category and semantic contour) are used to adjust the matching score, followed by optimizing the matching results. Instance results are further used for target perception. MaskFormer utilizes the set prediction mechanism to compute a set of class prediction and mask prediction vectors using a transformer decoder. As shown in Figure 3, the MaskFormer model consists of the pixel-level, Transformer, and segmentation modules. The pixel-level module extracts per-pixel embeddings to generate binary mask predictions. The transformer module is used to calculate the N per-segments embeddings. Lastly, the segmentation module generates the final prediction results through these embeddings. During the panoramic segmentation task, each prediction is supervised by a per-pixel binary mask loss function and a per-pixel mask classification loss function. The existing per-pixel classification model is transformed into a mask classification model without changing the model. The model used for the experiment in this study was trained on a COCO dataset that includes 80 instance segmentation tags and 52 semantic segmentation tags. The dataset is such that it covers the majority of the nature scenes. The developed model demonstrated excellent performance for both the semantic segmentation task (ADE20K, 55.6mIOU) and the panoramic segmentation task (Coco-panoptic, 52.7PQ).
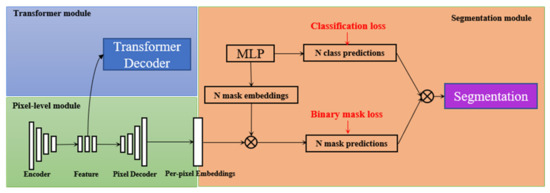
Figure 3.
Overview of the MaskFormer.
3.2.2. SuperGlue Matching
SuperGlue is a graph convolution feature matching network that can simultaneously perform feature matching and screen out false matching points. The network input is the feature points and descriptors extracted from two images by SuperPoint [20], and the output is the matching scores. As shown in Figure 4, the model framework is composed of the attentional graph neural network and the optimal matching layer. In the attentional graph neural network, the feature matching vectors are made up of the position of feature points and the feature descriptors through an encoder. The characteristic vectors are enhanced by the self-attention and cross-attention mechanisms. The attention mechanism is one of the key features of the SuperGlue network. It simulates artificial checking and confirming of matching features repeatedly through the self-attention and cross-attention mechanisms. The function of the whole module is to aggregate these attentions. In the optimal matching layer module, the attention aggregation feature is taken as the input to calculate the score matrix. The Sinkhorn algorithm is used to maximize the total matching score. The feature allocation matrix is then solved. The SuperGlue network demonstrated the powerful performance of the attentional graph neural network for local feature matching. This enabled high-precision relative to the 6DOF pose estimation and real-time indoors and outdoors operations.
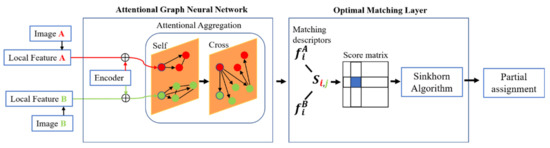
Figure 4.
Overview of the SuperGlue network.
3.2.3. Matching Optimization
In this paper, a 3D model with the geographic coordinates is used as prior information. The optimized localization is estimated by the matching relationship between the rendered image and the truth image. The 3D model scene is established in advance. If the model is not regularly updated, a time difference will be obtained between the rendered image and the truth image, corresponding to changes in weather, light, and season. In addition to this, the quality of the rendered image depends on the quality of the 3D model. Furthermore, as the imaging mechanism is different from that of the real camera, feature differences exist between the images. The difference in time phase and the imaging mechanism generates difficulties in the matching process. The results obtained using the SuperGlue matching network will therefore involve many mismatches. In contrast, line and corner features are the two primary features associated with the visual effect. For 2D images, line and corner features are more unique and invariable than the internal texture features of ground objects. For example, in a building area, the texture features of various windows are repetitive. This similar texture situation presents a challenge for the image matching process. In view of the challenges to the matching process arising from the above situations, the method developed in this study combined the results of the MaskFormer panoptic segmentation network and the SuperGlue matching network to optimize matching results.
First, the rendered image and the truth image are segmented and matched to obtain the semantic label matrix and the matching score matrix. Second, the consistency of the semantic labels is checked for each pair of matching points. Matching pairs with inconsistent semantic labels are treated as false matches and deleted. Then, the matching fraction matrix is adjusted by using the segmentation contour and corner information. Specifically, the matching score matrix will assign a matching score (value in the range of 0–1) to each pair of matching points. A large value for the matching score results in a higher confidence rate for correct matching. The score adjustment scheme is expressed as follows:
where the score represents the original matching score. , , and represent the matching score of the matching point on the contour corner, on the contour, and inside the ground object region, respectively. It is possible to adjust the matching score to further distinguish the matching points located in the different regions, thus improving overall matching reliability.
3.3. RANSAC with Semantic Consistency
Incorrect matching is inevitable, owing to the time phase changes, different imaging mechanisms, texture repetition, and other reasons. The confidence rate of the matching fraction obtained with the original SuperGlue cannot fully guarantee the accuracy of matching. In this study, the semantic information is used to verify the estimated 6DOF pose, while RANSAC based on semantic consistency is used to obtain the exact pose. The developed method retains the models with the top five interior points. This is the difference between the developed model and the original RANSAC. The developed method obtains the transformation matrix by solving these models using epipolar geometry. Finally, the semantic consistency score is calculated for each transformed pose. The pose with the highest score is considered as the optimal result.
Subsequently, after the optimized matching score matrix is obtained, a higher confidence rate threshold of 0.75 is used to retain more reliable matching point pairs. Unlike the methods [21,23] (wherein the 3D points are projected in the target image to verify the semantics), the proposed method maps the positions of the feature points in the rendered image to the truth image. This helps in detecting the number of semantically consistent feature points. It should be noted that in the process of checking semantic consistency, we actively screen out characteristic points with label attributes such as plants and clouds. This helps reduce seasonal and weather change influence. The number of semantically consistent feature points is taken as the semantic consistency score. A high semantic consistency score results in a highly accurate estimated 6DOF pose.
3.4. Target Perception
In this method, the panoptic segmentation network MaskFormer is used to obtain instance segmentation results, on which basis target perception is completed. The model includes 80 examples of natural objects, such as human, vehicle, and animal. The objects that satisfy the basic target perception task are selected. A monocular depth camera is used to locate the target in the experimental setup. After target detection, depth information and the orientation of the image are used to locate the target. To simplify the process, the target centroid depth information is selected in the method for positioning. The camera coordinate calculation formula of the target is expressed as the following equation:
where is the principal point, and are the focal lengths of the camera, represents the camera coordinates of the point P in the current 6DOF pose, D represents the absolute distance between the camera and the target, and depth denotes the camera’s internal parameter with a fixed value of 1000. After obtaining the camera coordinates of the target centroid, the target coordinates corresponding to the coordinate system of the 3D model can be calculated using the 6DOF camera pose in the 3D model and the coordinate transformation relationship. Such models are useful in the development of advanced task-based applications.
4. Experimental Details
4.1. Experimental Data
We tested the developed model on two datasets: a public RobotCar Season dataset and a dataset consisting of the rendered and real images along with the corresponding pose data. The RobotCar Season dataset is a subset of the University of Oxford RobotCar dataset [23]. The reference and query images were captured by three synchronized cameras mounted on a car. The cameras were focused to the rear-left, rear, and rear-right of the car. The images were captured by driving on the same route over a period of 12 months. The dataset contained a total of 26,121 reference images from 8707 viewpoints, and 11,934 query images from 3978 viewpoints. The effectiveness of the proposed method was verified by comparing it with advanced long-term localization methods on the RobotCar Season dataset. In addition to this, we also conducted a comparative experiment on a set of self-collected data. A 3D scene model was developed in advance using precise geographic coordinates. The real images and initial pose data in the dataset were acquired using the multisensor intelligent platform equipped with the high-precision GNSS and IMU inertial navigation combination; the depth images were captured using the Realsense depth camera. The proposed method was verified using this data set. Reduced error and improved localization accuracy were obtained using the developed model.
4.2. Evaluation Measures
A standard practice [23] was followed for the public dataset, wherein the pose accuracy of a method was measured by the deviation between the estimated and the ground truth pose. Specifically, the position error was measured as the Euclidean distance between the estimated point and the ground truth point, whereas the orientation error α was measured as the minimum rotation required to align two angles. The error was computed using , where and are the ground truth rotation matrix and the estimated rotation matrix, respectively. After calculating the position error and the orientation error, three pose precision intervals were defined: high precision (0.25 m, 2°), medium precision (0.5 m, 5°), and coarse precision (5 m, 10°). The percentage of query image localized within this interval was defined as the evaluation measure.
We applied the proposed matching method to SLAM and measured accuracy by taking the Euclidian distance between the points in the 3D model as the localization error.
4.3. RobotCar Season Dataset
The experiment was performed using the RobotCar Season dataset. The daytime long-term localization results were obtained and compared with those of other representative methods. The experiment was carried out using the DenseVLAND [8] and NetLVLAD [9] as the 2D image-based method; the Active Search [12] and CityScalelocalization [10] as the 3D structure-based method; the hierarchical-localization, DenseVLAND, and D2-Net; and the methods [14,21,31] with the semantic information. The results presented in [26] were used in this study.
Table 1 and Figure 5 show the comparison. Table 1 shows that poor performance was obtained using the 2D image-based methods; this is because these methods avoid using spatial structure to reason localization. The performance of the hierarchical localization method and semantic fusion method is better than that of the structure-based method. This indicates that the prior usage of image retrieval or semantic information can effectively reduce the search space. This results in error reduction and increases feature matching accuracy. The hierarchical localization and the three semantic methods are similar to the proposed method. The accuracy of the five different methods is compared in Figure 4 using three different accuracy measures; the performance of the proposed method is reasonably good when evaluating high and medium precision. In addition to this, as seen in Table 1, better results are obtained using the proposed method in the majority of the cases, except for the dusk and snow scenarios. In high-precision and medium-precision evaluation measures, the proposed method improves upon the second-best method by 6.2% and 0.5 on average, respectively. It is also extremely close to the best result in coarse-precision evaluation measures.

Table 1.
Performance of state-of-the-art methods on the RobotCar Seasons dataset.
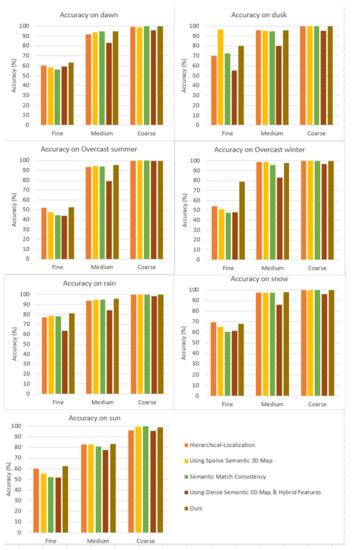
Figure 5.
Performance on the five different methods for the RobotCar Season dataset.
Few images were subjected to localization in the dusk and snow scenarios. It was found that some of the extreme data values caused problems with semantic segmentation, resulting in reduced positioning performance. A comprehensive analysis shows that the proposed method can effectively improve the accuracy of the long-term localization by integrating the semantically based method with the learning-based matching algorithm.
4.4. Self-Collected Dataset
The experiment was performed using the self-collected data to evaluate the obtained improvement in the matching effect and the localization accuracy. A comparison of three conditions was carried out. First, the original SuperGlue network and the regular RANSAC were compared. Second, the matching results of the SuperGlue were optimized using semantics and the regular RANSAC. Third, the proposed method was deployed, wherein the matching results of the SuperGlue using semantics are optimised. Later, the semantic consistency score was then added in RANSAC. Figure 6 shows matching results obtained before and after semantic optimization. The matching line starting from red to orange shows the matching score from high to low (only the confidence ranking is represented in the graph, and it cannot be compared with the other graphs). As can be seen from Figure 5, for the same threshold matching score, the number of optimized matching point pairs is observed to reduce significantly. Further, it is observed that some mismatching situations were eliminated. This helped reduce the workload of the RANSAC. Moreover, it effectively improved matching and 6DOF pose estimation accuracy. The qualitative analysis helps demonstrate that the matching optimization scheme in the proposed method can effectively improve the accuracy of matching for the cross-modality condition (the rendered image and the truth image in Figure 6), fluctuating phase, and similar textures. Figure 7 compares the positioning results of the experiment under three different conditions and the ORB-SLAM2 [44]. As observed from Figure 7, the traditional ORB-SLAM2 algorithm provided results with an error accumulation. The error was observed to increase with an increase in the odometer. Although the SuperGlue + RANSAC network can effectively reduce positioning error, matching accuracy was affected, owing to the presence of a large amount of vegetation along the data. Moreover, fluctuations in positioning accuracy were also recorded. Additionally, the developed method uses the semantic optimization technique on the basis of SuperGlue. This results in a higher positioning accuracy and helps to maintain a stable state.
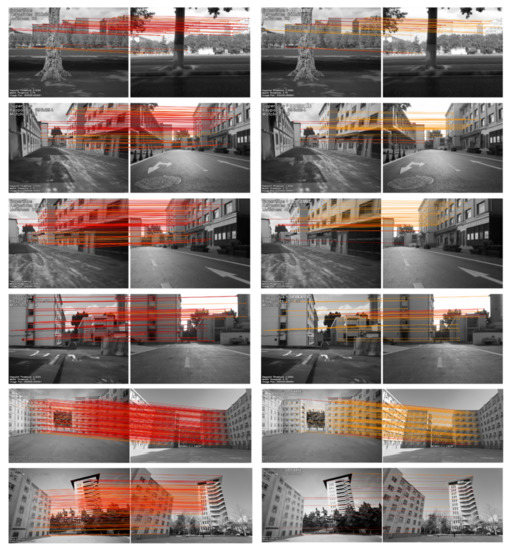
Figure 6.
Matching results obtained before and after the semantic optimization. (The yellow to red lines show confidence rates from low to high).
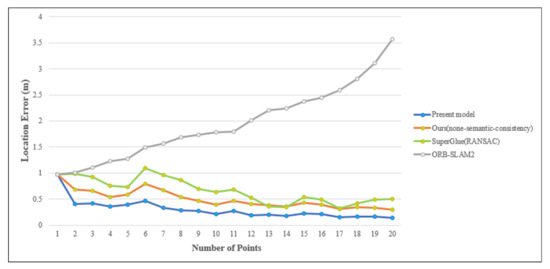
Figure 7.
Location error obtained for the self-collected data.
4.5. Target Perception
Figure 8 shows the target perception results. From left to right are the original image, depth image, instance results, and perception results. The results show that in the short range, the target can be effectively perceived with the segmentation results and depth information. Target perception can not only detect the class, but also can detect the range and orientation of the target. In addition, we tested the accuracy of the Realsense depth camera in obtaining depth information in outdoor scenes, and the results are shown in Figure 9. When the target distance is within the range of 0–6 m, the ranging accuracy reaches the highest; when the target distance is within the range of 6–15 m, the ranging error is not more than 1%; when the distance exceeds 15 m, the error of the depth camera starts to increase sharply; and when it exceeds 21 m, it almost fails. This is the result of the gradually smaller target and light factors. The experimental results show that the depth camera can effectively perceive the target in a close range when the light and other environmental factors are appropriate. The accuracy decreases with the increase of the distance.
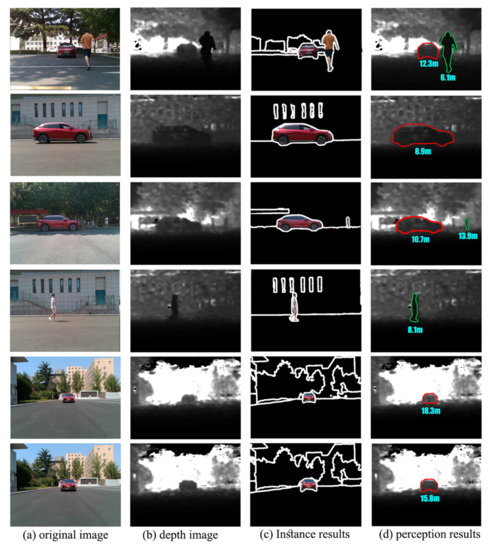
Figure 8.
The results of target perception.
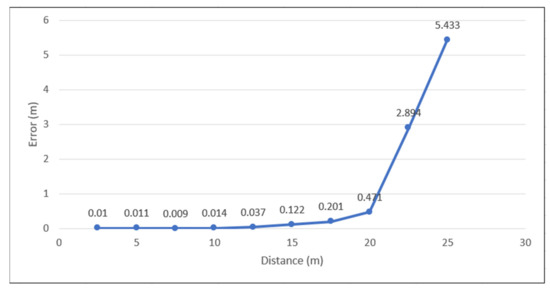
Figure 9.
Location error obtained for the self-collected data.
4.6. Timing Analysis
Table 2 shows the time results. Tests showed that the average time of the whole process was 5.07 s on the self-collected dataset. The semantic consistency verification process takes up most of the time in the whole process. Note that we did not optimize the algorithm; we only completed the implementation of the process. The time results show that the proposed method can achieve nearly real-time localization, but it cannot be directly used in the traditional localization and mapping process. However, its superior accuracy makes it a reliable method for initial positioning or repositioning.
Table 2.
Results of test time.
5. Discussion
5.1. Matching Optimization
The proposed method uses semantic information to optimize the matching results by combining a panoptic segmentation network and deep learning matching network. Semantic information can effectively eliminate semantically inconsistent false matches and adjust the confidence of matching point pairs. Experimental results show that the proposed method is a significant improvement on advanced methods for the long-term visual localization benchmark dataset. Specifically, the RobotCar Season dataset contains large appearance variations caused by changes in seasonal and illumination conditions, which bring challenges for visual localization. High-level semantic information is more stable, so introducing semantic information into visual localization can effectively improve the robustness of localization.
Different imaging mechanisms and repeated textures also increase the number of false matches. The proposed method uses a graph convolution matching network and segmentation results to optimize the matching results. The matching results in Figure 6 show that the matching network based on graph convolution can effectively overcome the difficulties caused by different imaging mechanisms and texture repetition. In addition, using semantic information to optimize matching results can reduce the number of matching points to half under the same threshold value. Fewer matching points can provide a more reliable matching basis for the subsequent 6DOF pose estimation process and can also reduce the subsequent workload.
5.2. RANSAC with Semantic Consistency
The proposed method calculates the transformation matrix between two images by matching results and then estimates the position and orientation. Matching results will inevitably have errors, even after optimization. In order to obtain more accurate position and orientation, semantic consistency is introduced into the RANSAC process to verify the accuracy of localization. The orange curve in Figure 9 shows the 6DOF pose estimation results without introducing semantic consistency, and the blue curve shows the 6DOF pose estimation results without introducing semantic consistency. As can be seen from the comparison, the error of the blue curve is lower than that of the orange curve at each point. It is proved that a semantic consistency check can effectively improve 6DOF pose accuracy.
It should be noted that the method in this paper retains the models with the top five interior points in RANSAC process for semantic consistency checking. This is due to the consideration of the balance between efficiency and performance for visual localization, so we chose to retain five models. Specifically, for each 6DOF pose estimated by the model, a semantic consistency score is calculated. Therefore, the number of models retained will determine the time cost. Although the proposed method can obviously improve the visual positioning accuracy, it also means that more time is needed.
6. Conclusions
A matching optimization method using semantic information was developed by integrating the panoptic segmentation and SuperGlue. A prior 3D model and the truth image were used for visual localization. The instance results were used to complete target perception in the geographical space. Experiments showed that the proposed method could effectively improve matching and localization accuracies for changing environmental and repeating texture conditions. For a GNSS signal with limited interference, the sensor using the geographic coordinate information of the prior model and the visual localization method was able to provide accurate locations. However, in circumstances of serious GNSS signal interference, invalid matching was obtained. A possible solution to this problem was to set up a reference image depot of the 3D scene and retrieve the image to initially locate the target image. However, this retrieval-based method required a lot of prior data and was highly inefficient. Therefore, in the case of severe GNSS signal interference, improved techniques for the initial visual localization must be developed. In addition to this, the target location obtained using depth information from the depth camera was highly affected by the environment, target distance, size, and other factors. Therefore, further research needs to be carried out to develop target location methods that provide stronger stability and applicability.
Another limitation of the proposed method lies in the large time cost. The semantic consistency verification process takes up most of the time in the whole process. This method may not be suitable for real-time visual localization due to its inefficiency, but its superior accuracy makes it a reliable method for initial positioning or repositioning. Whether through algorithm optimization or other approaches, more research is still needed to optimize the accuracy and speed of visual localization. This is also key to making visual localization more suitable for higher-level tasks.
Author Contributions
Conceptualization, K.L., Y.Z. and Y.Y.; Data curation, K.L. and L.L.; Funding acquisition, Y.Y.; Investigation, K.L., Y.Y. and Z.Z.; Methodology, K.L., Y.Z. and Y.Y.; Resources, Y.Z. and Z.Z.; Visualization, L.L.; Writing review & editing, K.L. and Y.Y. All authors have read and agreed to the published version of the manuscript.
Funding
This research was funded by the National Natural Science Foundation of China (grant no. 42071340).
Data Availability Statement
Not applicable.
Conflicts of Interest
The authors declare no conflict of interest.
References
- Zhang, Y.; Zhang, Z.; Tong, X.; Ji, S.; Yu, Y.; Lai, G. Progress and challenges of geospatial artificial intelligence. Acta Geod. Et Cartogr. Sin. 2021, 50, 1137–1146. [Google Scholar]
- Yu, K.; Eck, U.; Pankratz, F.; Lazarovici, M.; Wilhelm, D.; Navab, N. Duplicated Reality for Co-located Augmented Reality Collaboration. IEEE Trans. Vis. Comput. Graph. 2022, 28, 2190–2200. [Google Scholar] [CrossRef] [PubMed]
- Wang, Y. Multi-Sensor Fusion Tracking Algorithm Based on Augmented Reality System. IEEE Sens. J. 2021, 21, 25010–25017. [Google Scholar] [CrossRef]
- Herb, M.; Lemberger, M.; Schmitt, M.M.; Kurz, A.; Weiherer, T.; Navab, N.; Tombari, F. Semantic Image Alignment for Vehicle Localization. In Proceedings of the 2021 IEEE/RSJ International Conference on Intelligent Robots and Systems (IROS), Prague, Czech Republic, 27 September–1 October 2021; pp. 1124–1131. [Google Scholar]
- Guo, C.; Lin, M.; Guo, H.; Liang, P.; Cheng, E. Coarse-to-fine Semantic Localization with HD Map for Autonomous Driving in Structural Scenes. In Proceedings of the 2021 IEEE/RSJ International Conference on Intelligent Robots and Systems (IROS), Prague, Czech Republic, 27 September–1 October 2021; pp. 1146–1153. [Google Scholar]
- Kälin, U.; Staffa, L.; Grimm, D.E.; Wendt, A. Highly Accurate Pose Estimation as a Reference for Autonomous Vehicles in Near-Range Scenarios. Remote Sens. 2022, 14, 90. [Google Scholar] [CrossRef]
- Chen, Z.; Jacobson, A.; Sünderhauf, N.; Upcroft, B.; Liu, L.; Shen, C.; Reid, I.D.; Milford, M. Deep learning features at scale for visual place recognition. In Proceedings of the 2017 IEEE International Conference on Robotics and Automation (ICRA), Singapore, 29 May–3 June 2017. [Google Scholar]
- Sünderhauf, N.; Shirazi, S.; Jacobson, A.; Dayoub, F.; Pepperell, E.; Upcroft, B.; Milford, M. Place Recognition with ConvNet Landmarks: Viewpoint-Robust, Condition-Robust, Training-Free. In Proceedings of the Robotics: Science and Systems Conference, Rome, Italy, 13–17 July 2015. [Google Scholar]
- Sattler, T.; Torii, A.; Sivic, J.; Pollefeys, M.; Taira, H.; Okutomi, M.; Pajdla, T. Are Large-Scale 3D Models Really Necessary for Accurate Visual Localization? IEEE Trans. Pattern Anal. Mach. Intell. 2021, 43, 814–829. [Google Scholar]
- Arandjelović, R.; Gronat, P.; Torii, A.; Pajdla, T.; Sivic, J. NetVLAD: CNN Architecture for Weakly Supervised Place Recognition. IEEE Trans. Pattern Anal. Mach. Intell. 2018, 40, 1437–1451. [Google Scholar] [CrossRef] [PubMed]
- Wang, R.; Wan, W.; Di, K.; Chen, R.; Feng, X. A High-Accuracy Indoor-Positioning Method with Automated RGB-D Image Database Construction. Remote Sens. 2019, 11, 2572. [Google Scholar] [CrossRef]
- Wilson, D.; Alshaabi, T.; Van Oort, C.; Zhang, X.; Nelson, J.; Wshah, S. Object Tracking and Geo-Localization from Street Images. Remote Sens. 2022, 14, 2575. [Google Scholar] [CrossRef]
- Svärm, L.; Enqvist, O.; Kahl, F.; Oskarsson, M. City-Scale Localization for Cameras with Known Vertical Direction. IEEE Trans. Pattern Anal. Mach. Intell. 2016, 39, 1455–1461. [Google Scholar] [CrossRef]
- Liu, L.; Li, H.; Dai, Y. Efficient Global 2D-3D Matching for Camera Localization in a Large-Scale 3D Map. In Proceedings of the 2017 IEEE International Conference on Computer Vision (ICCV), Venice, Italy, 22–29 October 2017; pp. 2391–2400. [Google Scholar]
- Sattler, T.; Leibe, B.; Kobbelt, L. Efficient & Effective Prioritized Matching for Large-Scale Image-Based Localization. IEEE Trans. Pattern Anal. Mach. Intell. 2017, 39, 1744–1756. [Google Scholar]
- Germain, H.; Bourmaud, G.; Lepetit, V. Sparse-to-Dense Hypercolumn Matching for Long-Term Visual Localization. In Proceedings of the 2019 International Conference on 3D Vision (3DV), Quebec City, QC, Canada, 16–19 September 2019; pp. 513–523. [Google Scholar]
- Shi, T.; Shen, S.; Gao, X.; Zhu, L. Visual Localization Using Sparse Semantic 3D Map. In Proceedings of the 2019 IEEE International Conference on Image Processing (ICIP), Taipei, Taiwan, 22–25 September 2019; pp. 315–319. [Google Scholar]
- Gridseth, M.; Barfoot, T.D. Keeping an Eye on Things: Deep Learned Features for Long-Term Visual Localization. IEEE Robot. Autom. Lett. 2022, 7, 1016–1023. [Google Scholar] [CrossRef]
- Spencer, J.; Bowden, R.; Hadfield, S. Same Features, Different Day: Weakly Supervised Feature Learning for Seasonal Invariance. In Proceedings of the 2020 IEEE/CVF Conference on Computer Vision and Pattern Recognition (CVPR), Seattle, WA, USA, 13–19 June 2020; pp. 6458–6467. [Google Scholar]
- Georges, B.; Olivier, S.; Kevin, K.; Marc, P. Large Scale Visual Geo-Localization of Images in Mountainous Terrain. In The European Conference on Computer Vision; Springer: Berlin, Germany, 2012; pp. 517–530. [Google Scholar]
- Deng, C.; You, X.; Zhi, M. Evaluation on Geo-registration Accuracy of Outdoor Augmented Reality. J. Syst. Simul. 2020, 32, 1693–1704. [Google Scholar]
- He, X.; Pan, S.; Gao, W.; Lu, X. LiDAR-Inertial-GNSS Fusion Positioning System in Urban Environment: Local Accurate Registration and Global Drift-Free. Remote Sens. 2022, 14, 2104. [Google Scholar] [CrossRef]
- Sun, J.; Shen, Z.; Wang, Y.; Bao, H.; Zhou, X. LoFTR: Detector-Free Local Feature Matching with Transformers. In Proceedings of the 2021 IEEE/CVF Conference on Computer Vision and Pattern Recognition (CVPR), Nashville, TN, USA, 20–25 June 2021; pp. 8918–8927. [Google Scholar]
- DeTone, D.; Malisiewicz, T.; Rabinovich, A. SuperPoint: Self-Supervised Interest Point Detection and Description. In Proceedings of the 2018 IEEE/CVF Conference on Computer Vision and Pattern Recognition Workshops (CVPRW), Salt Lake City, UT, USA, 18–22 June 2018; pp. 337–33712. [Google Scholar]
- Carl, T.; Erik, S.; Lars, H.; Lucas, B.; Marc, P.; Torsten, S.; Fredrik, K. Semantic match consistency for long-term visual localization. In European Conference on Computer Vision; Springer: Berlin, Germany, 2018; pp. 391–408. [Google Scholar]
- Stenborg, E.; Toft, C.; Hammarstrand, L. Long-Term Visual Localization Using Semantically Segmented Images. In Proceedings of the 2018 IEEE International Conference on Robotics and Automation (ICRA), Brisbane, QLD, Australia, 21–25 May 2018; pp. 6484–6490. [Google Scholar] [CrossRef]
- Sattler, T.; Maddern, W.; Toft, C.; Torii, A.; Hammarstrand, L.; Stenborg, E.; Safari, D.; Okutomi, M.; Pollefeys, M.; Sivic, J.; et al. Benchmarking 6DOF Outdoor Visual Localization in Changing Conditions. In Proceedings of the 2018 IEEE/CVF Conference on Computer Vision and Pattern Recognition, Salt Lake City, UT, USA, 18–23 June 2018; pp. 8601–8610. [Google Scholar]
- Cheng, B.; Schwing, A.G.; Kirillov, A. Per-Pixel Classification is Not All You Need for Semantic Segmentation. Adv. Neural Inf. Processing Syst. 2021, 34, 17864–17875. [Google Scholar]
- Sarlin, P.-E.; Detone, D.; Malisiewicz, T.; Rabinovich, A. SuperGlue: Learning Feature Matching with Graph Neural Networks. In Proceedings of the 2020 IEEE/CVF Conference on Computer Vision and Pattern Recognition (CVPR), Seattle, WA, USA, 13–19 June 2020; pp. 4937–4946. [Google Scholar]
- Toft, C.; Maddern, W.; Torii, A.; Hammarstrand, L.; Stenborg, E.; Safari, D.; Okutomi, M.; Pollefeys, M.; Sivic, J.; Pajdla, T.; et al. Long-Term Visual Localization Revisited. IEEE Trans. Pattern Anal. Mach. Intell. 2022, 44, 2074–2088. [Google Scholar] [CrossRef]
- Dusmanu, M.; Rocco, I.; Pajdla, T.; Pollefeys, M.; Sivic, J.; Torii, A.; Sattler, T. D2-Net: A Trainable CNN for Joint Description and Detection of Local Features. In Proceedings of the 2019 IEEE/CVF Conference on Computer Vision and Pattern Recognition (CVPR), Long Beach, CA, USA, 15–20 June 2019; pp. 8084–8093. [Google Scholar]
- Revaud, J.; De Souza, C.; Humenberger, M.; Weinzaepfel, P. R2d2: Reliable and repeatable detector and descriptor. Adv. Neural Inf. Process. Syst. 2019, 32, 12405–12415. [Google Scholar]
- Hu, H.; Wang, H.; Liu, Z.; Chen, W. Domain-Invariant Similarity Activation Map Contrastive Learning for Retrieval-Based Long-Term Visual Localization. IEEE/CAA J. Autom. Sin. 2022, 9, 313–328. [Google Scholar] [CrossRef]
- Shi, T.; Cui, H.; Song, Z.; Shen, S. Dense Semantic 3D Map Based Long-Term Visual Localization with Hybrid Features. arXiv 2020, arXiv:2005.10766. [Google Scholar]
- Fan, H.; Zhou, Y.; Li, A.; Gao, S.; Li, J.; Guo, Y. Visual Localization Using Semantic Segmentation and Depth Prediction. arXiv 2020, arXiv:2005.11922. [Google Scholar]
- Larsson, M.; Stenborg, E.; Toft, C.; Hammarstrand, L.; Sattler, T.; Kahl, F. Fine-Grained Segmentation Networks: Self-Supervised Segmentation for Improved Long-Term Visual Localization. In Proceedings of the 2019 IEEE/CVF International Conference on Computer Vision (ICCV), Seoul, Korea, 27 October–2 November 2019; pp. 31–41. [Google Scholar]
- Carion, N.; Massa, F.; Synnaeve, G.; Usunier, N.; Kirillov, A.; Zagoruyko, S. End-to-End Object Detection with Transformers; Springer: Cham, Switzerland, 2020. [Google Scholar] [CrossRef]
- Zhai, R.; Yuan, Y. A Method of Vision Aided GNSS Positioning Using Semantic Information in Complex Urban Environment. Remote Sens. 2022, 14, 869. [Google Scholar] [CrossRef]
- Kirillov, A.; He, K.; Girshick, R.; Rother, C.; Girshick, P. Panoptic Segmentation. In Proceedings of the 2019 IEEE/CVF Conference on Computer Vision and Pattern Recognition (CVPR), Long Beach, CA, USA, 15–20 June 2019; pp. 9396–9405.43. [Google Scholar]
- Cheng, B.; Collins, M.D.; Zhu, Y.; Liu, T.; Huang, T.S.; Adam, H.; Chen, L.C. Panoptic-DeepLab: A Simple, Strong, and Fast Baseline for Bottom-Up Panoptic Segmentation. In Proceedings of the 2020 IEEE/CVF Conference on Computer Vision and Pattern Recognition (CVPR), Seattle, WA, USA, 13–19 June 2020; pp. 12472–12482. [Google Scholar]
- Tian, Z.; Zhang, B.; Chen, H.; Shen, C. Instance and Panoptic Segmentation Using Conditional Convolutions. IEEE Trans. Pattern Anal. Mach. Intell. 2022, 2022, 3145407. [Google Scholar] [CrossRef]
- Redmon, J.; Farhadi, A. YOLOv3: An Incremental Improvement. arXiv 2018, arXiv:1804.02767. [Google Scholar]
- Diaz-Zapata, M.; Erkent, Ö.; Laugier, C. YOLO-based Panoptic Segmentation Network. In Proceedings of the 2021 IEEE 45th Annual Computers, Software, and Applications Conference (COMPSAC), Madrid, Spain, 12–16 July 2021; pp. 1230–1234. [Google Scholar]
- Mur-Artal, R.; Mur-Artal, J.D. ORB-SLAM2: An Open-Source SLAM System for Monocular, Stereo, and RGB-D Cameras. IEEE Trans. Robot. 2017, 33, 1255–1262. [Google Scholar] [CrossRef]
Publisher’s Note: MDPI stays neutral with regard to jurisdictional claims in published maps and institutional affiliations. |
© 2022 by the authors. Licensee MDPI, Basel, Switzerland. This article is an open access article distributed under the terms and conditions of the Creative Commons Attribution (CC BY) license (https://creativecommons.org/licenses/by/4.0/).