
Bibliometric Analysis of Global NDVI Research Trends from 1985 to 2021


Abstract
:1. Introduction
- (1)
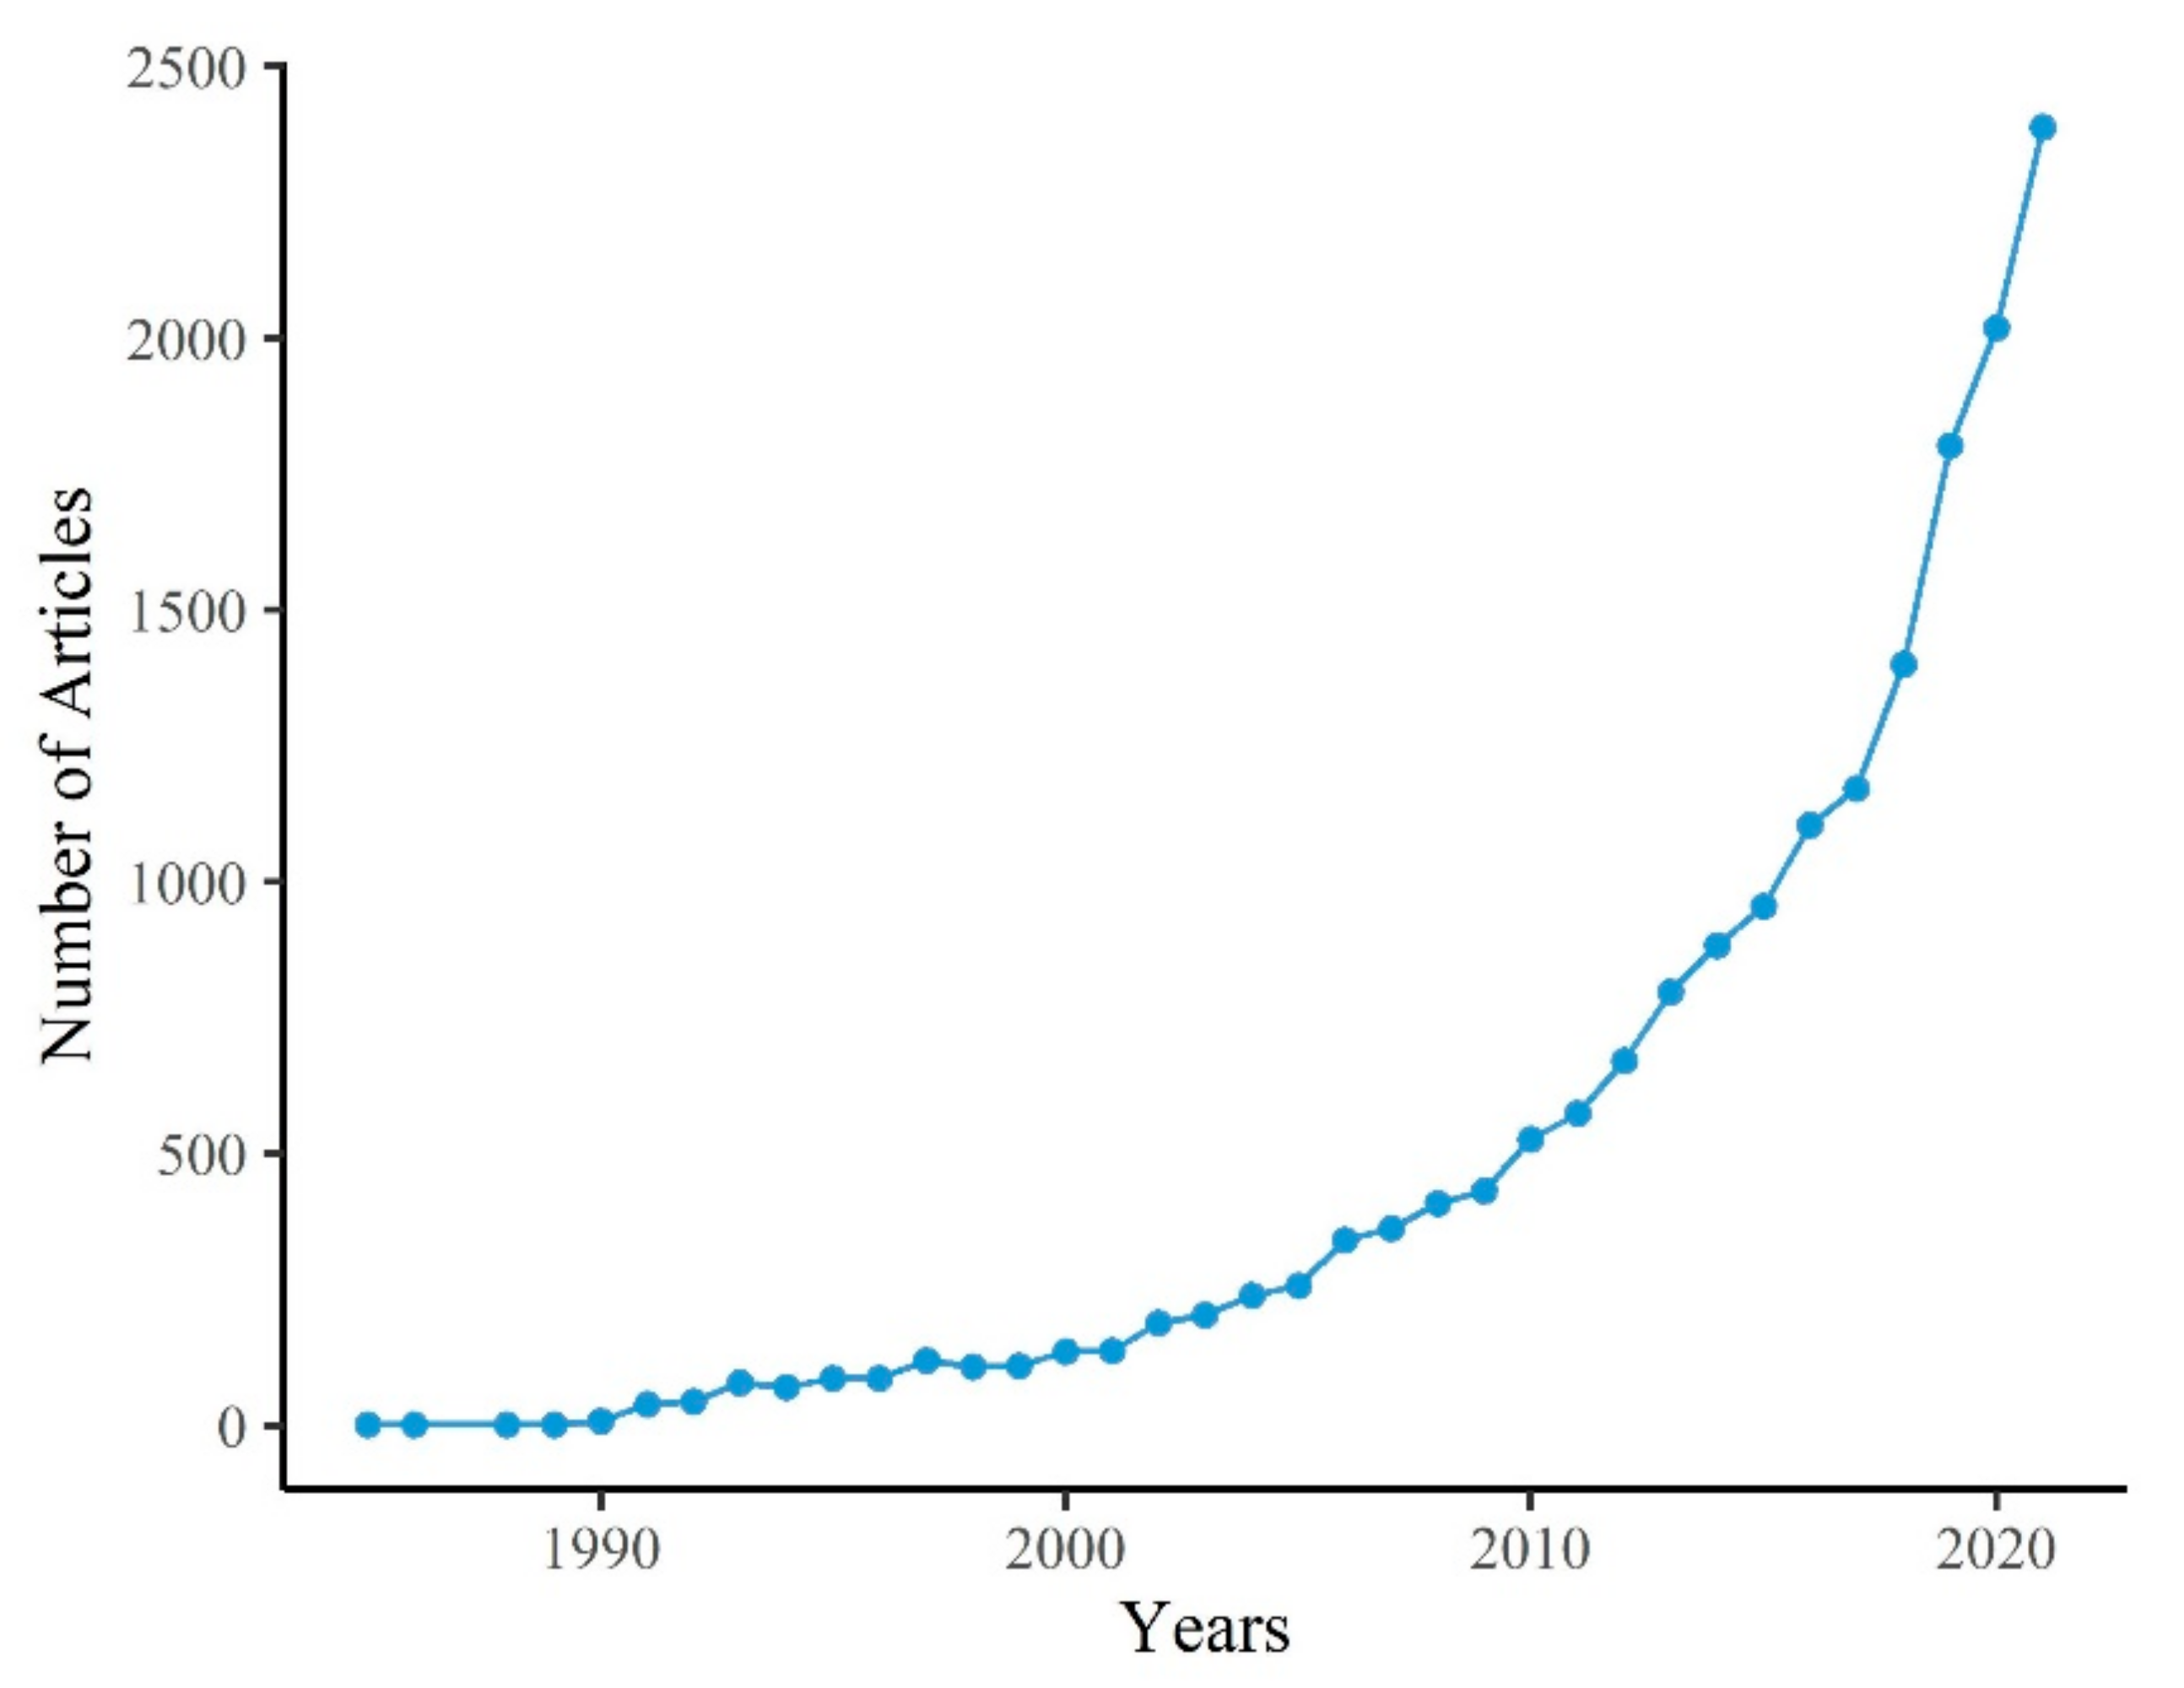
- Provide bibliometric information on 17,755 scientific studies extracted from the Web of Science (WOS) Scientific Citation Indexing (SCI) Expanded database;
- (2)
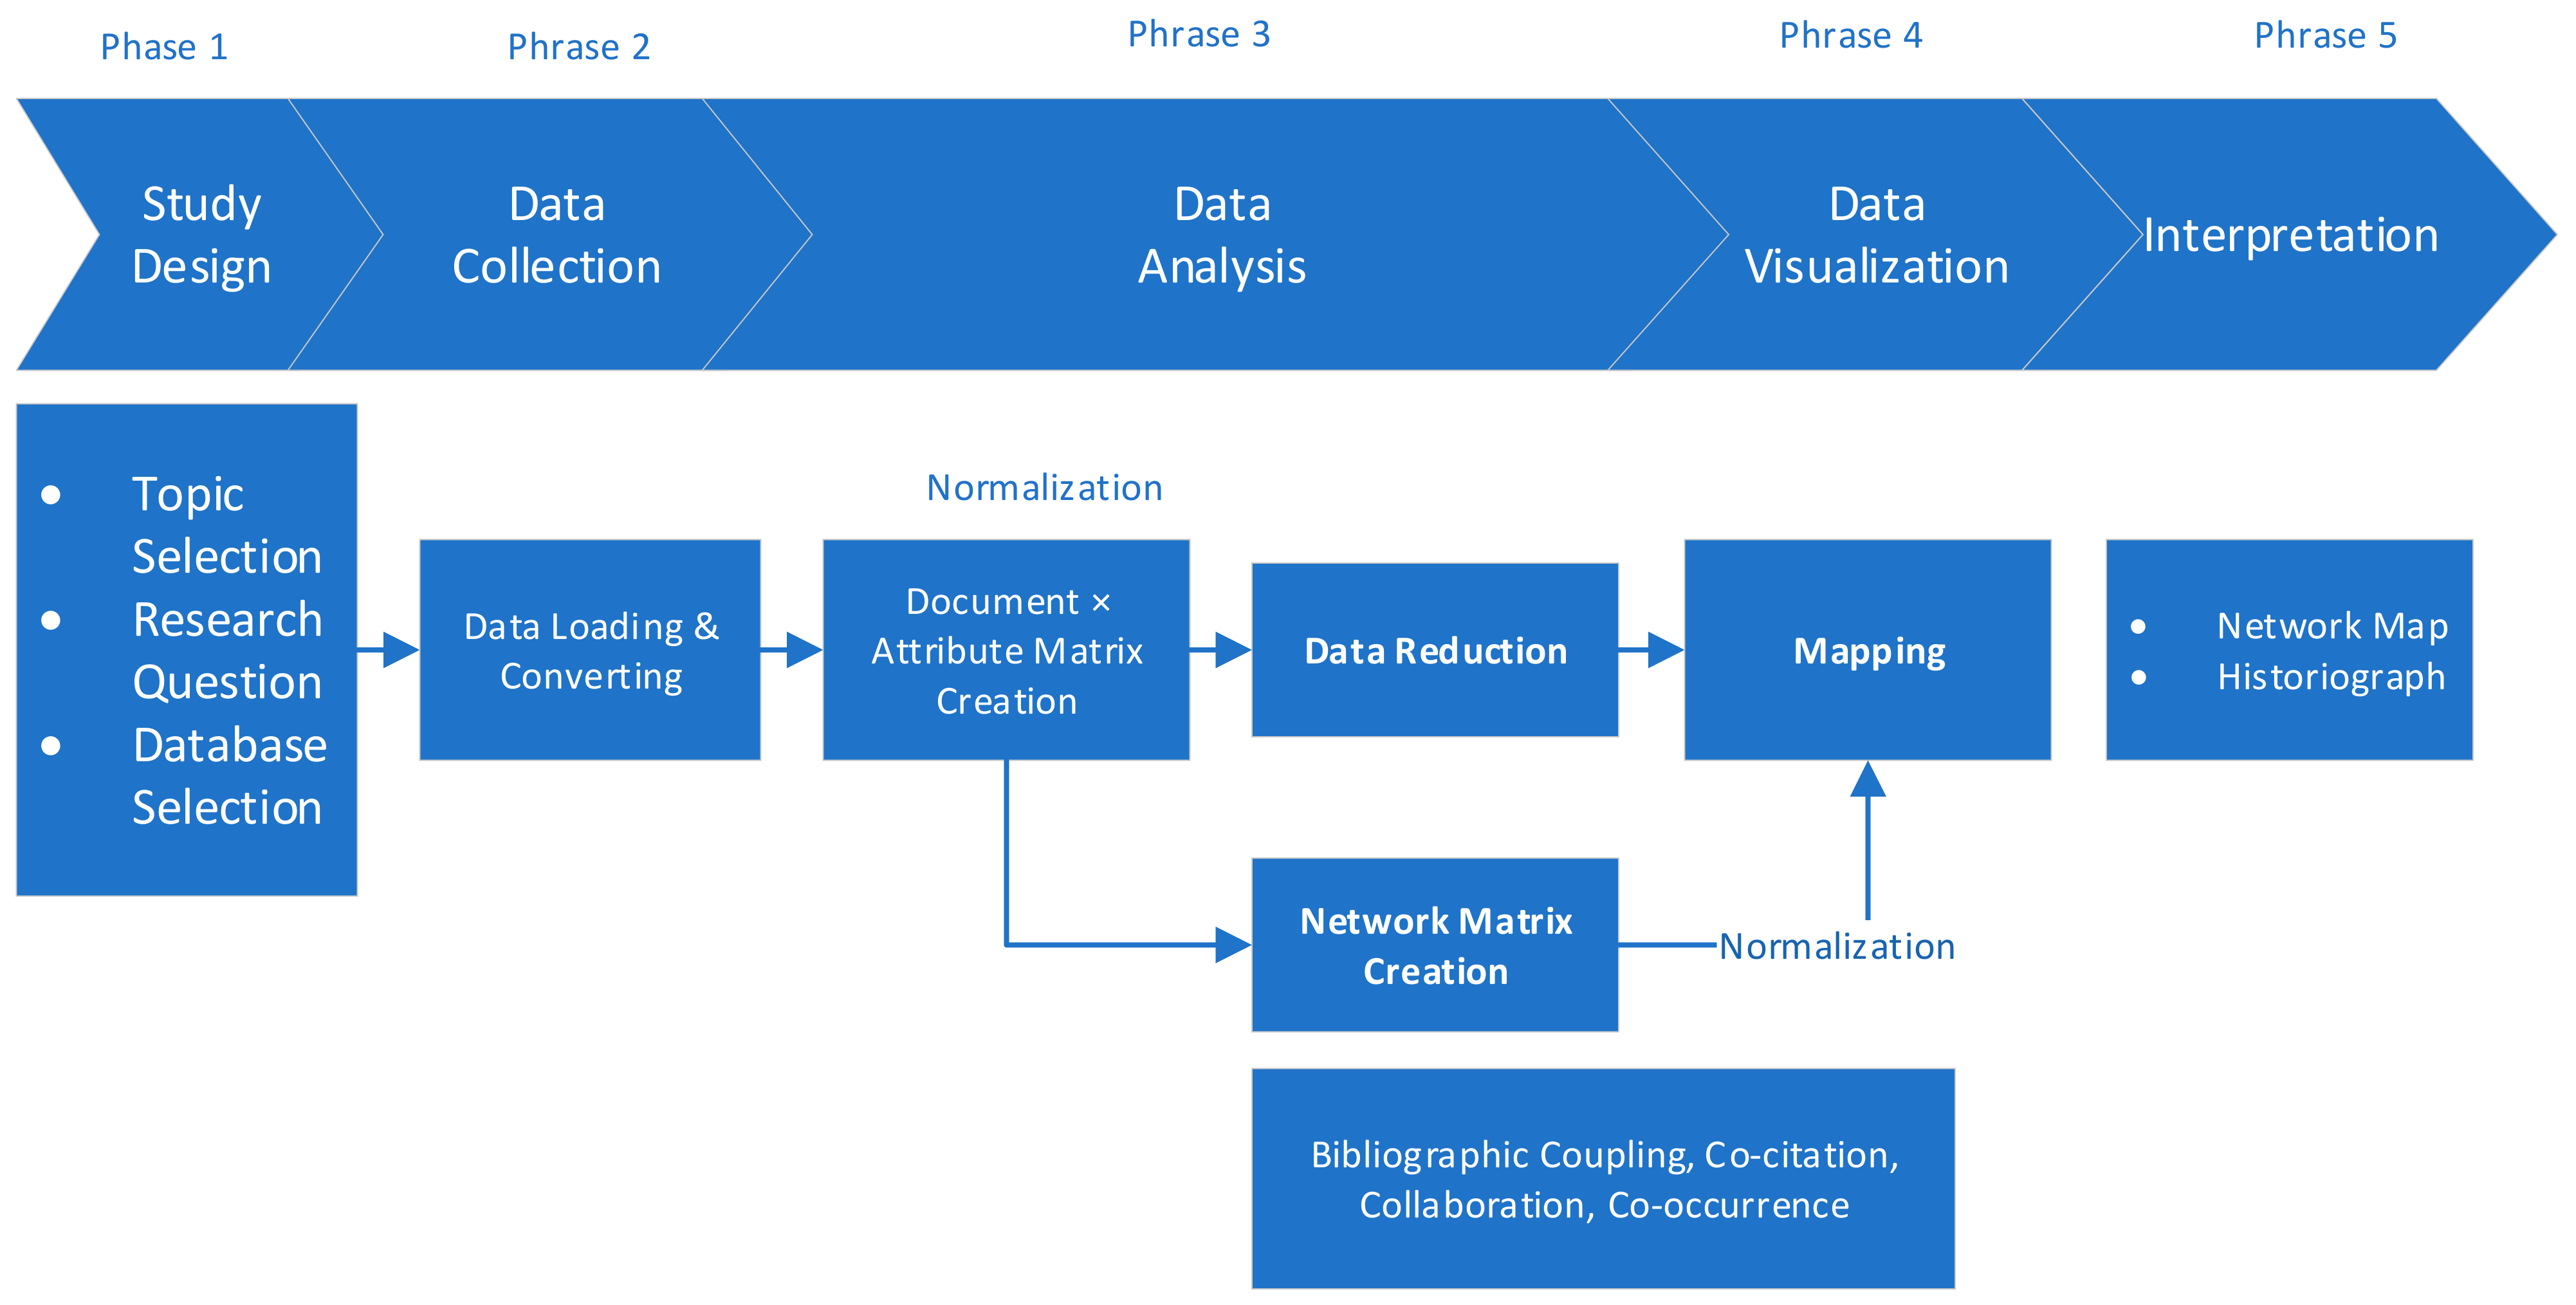
- Use the bibliometrix R-package and biblioshiny web app to convert and analyze quantitative data of the selected articles;
- (3)
- Use the total citations or H index to identify the leading authors, countries, and institutions in NDVI research;
- (4)
- Use the keywords to analyze the research history and current research hotspots.
2. Related Literature
3. Materials and Methods
3.1. Literature Search Strategy
3.2. Bibliometric Analysis
4. Results and Discussion
4.1. Descriptive Bibliometric Analysis
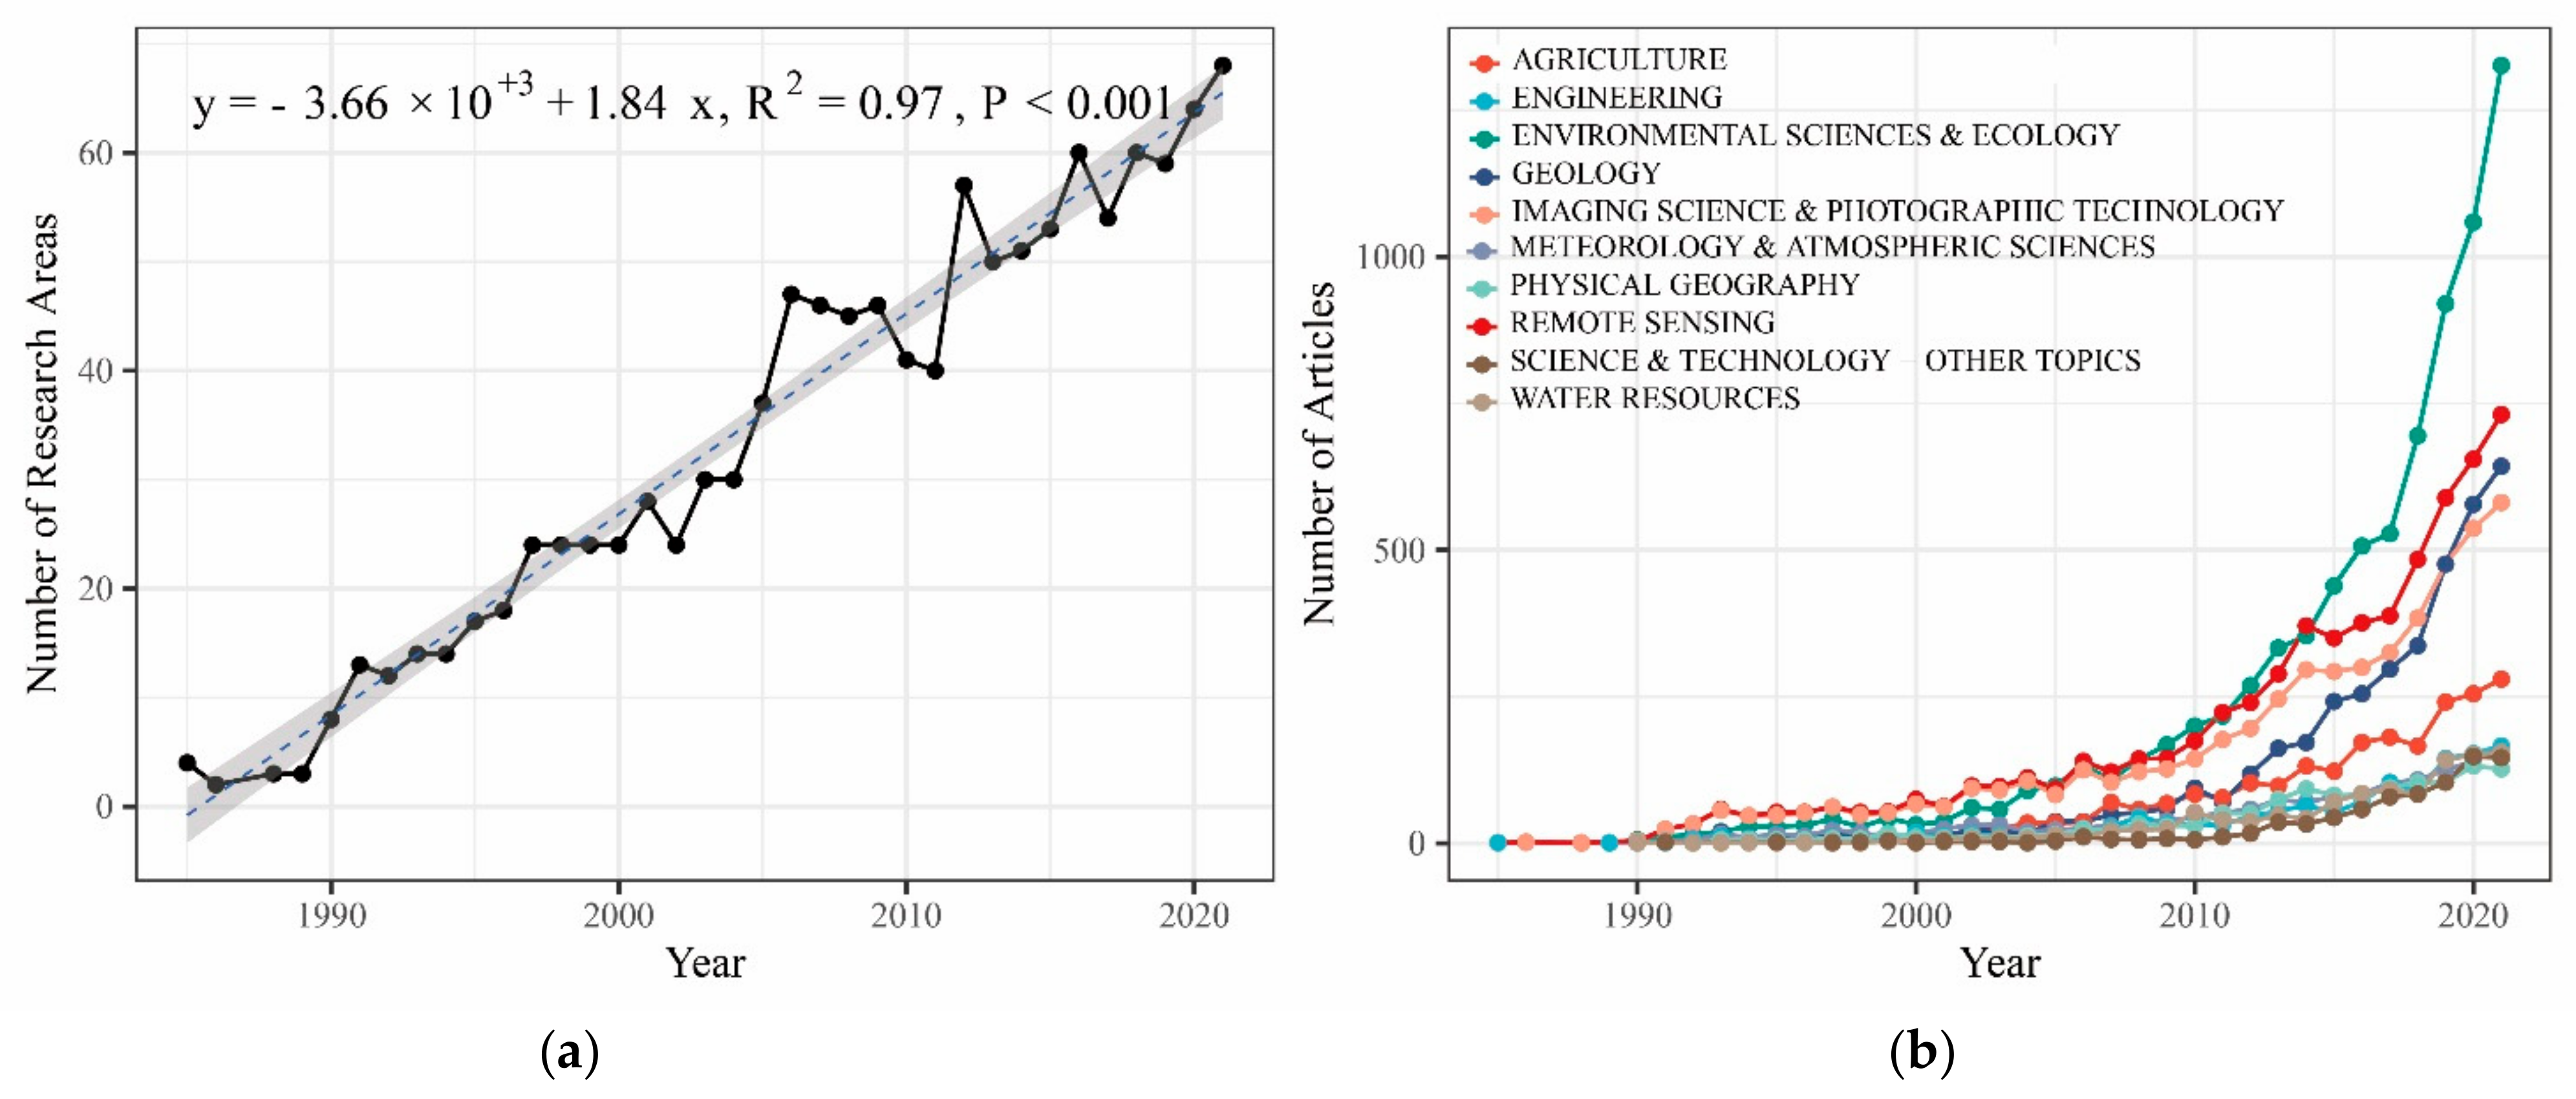
4.2. WOS Research Areas
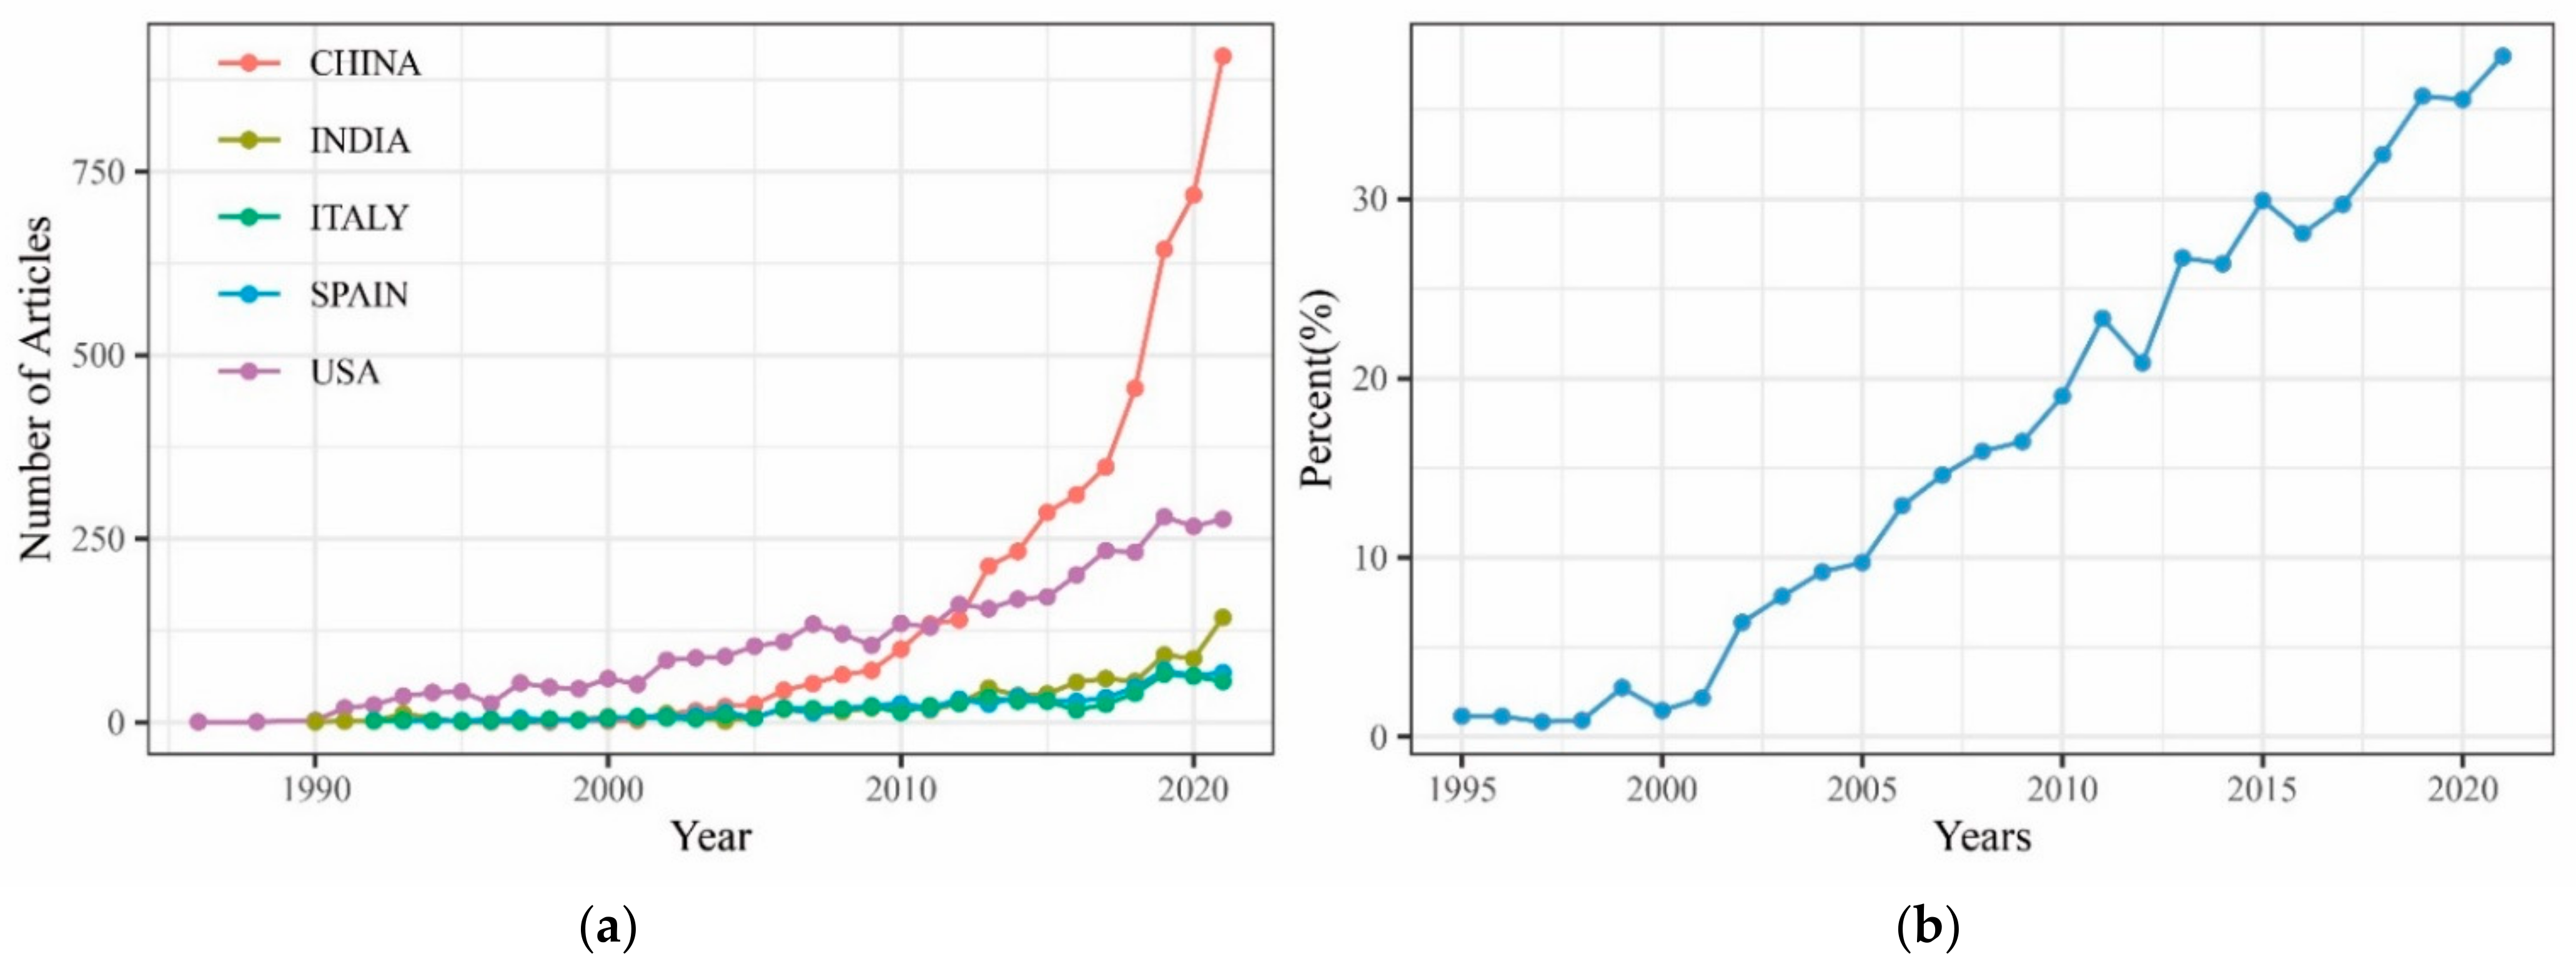
4.3. Research Countries and Institutions
4.4. Most Influential Source Journals
4.5. Most Influential Authors
4.6. Most Influential Papers
4.7. Analysis of Historical and Current Research Hotspots
5. Conclusions and Future Directions
Supplementary Materials
Author Contributions
Funding
Data Availability Statement
Acknowledgments
Conflicts of Interest
References
- Foley, J.A.; Levis, S.; Costa, M.H.; Cramer, W.; Pollard, D. Incorporating Dynamic Vegetation Cover Within Global Climate Models. Ecol. Appl. 2000, 10, 1620–1632. [Google Scholar] [CrossRef]
- Zhang, G.; Zhang, Y.; Dong, J.; Xiao, X. Green-up Dates in the Tibetan Plateau Have Continuously Advanced from 1982 to 2011. Proc. Natl. Acad. Sci. USA 2013, 110, 4309–4314. [Google Scholar] [CrossRef] [PubMed]
- Pettorelli, N.; Vik, J.O.; Mysterud, A.; Gaillard, J.-M.; Tucker, C.J.; Stenseth, N.C. Using the Satellite-Derived NDVI to Assess Ecological Responses to Environmental Change. Trends Ecol. Evol. 2005, 20, 503–510. [Google Scholar] [CrossRef] [PubMed]
- Kriegler, F.J.; Malila, W.A.; Nalepka, R.F.; Richardson, W. Preprocessing Transformations and Their Effects on Multispectral Recognition. In Proceedings of the Sixth International Symposium on Remote Sensing of Environment, Ann Arbor, MI, USA, 13–16 October 1969; Volume II, p. 97. [Google Scholar]
- Kong, D.; Zhang, Q.; Singh, V.P.; Shi, P. Seasonal Vegetation Response to Climate Change in the Northern Hemisphere (1982–2013). Glob. Planet. Chang. 2017, 148, 1–8. [Google Scholar] [CrossRef]
- Liu, Y.; Li, Y.; Li, S.; Motesharrei, S. Spatial and Temporal Patterns of Global NDVI Trends: Correlations with Climate and Human Factors. Remote Sens. 2015, 7, 13233–13250. [Google Scholar] [CrossRef]
- Lee, G.; Hwang, J.; Cho, S. A Novel Index to Detect Vegetation in Urban Areas Using UAV-Based Multispectral Images. Appl. Sci. 2021, 11, 3472. [Google Scholar] [CrossRef]
- Carlson, T.N.; Ripley, D.A. On the Relation between NDVI, Fractional Vegetation Cover, and Leaf Area Index. Remote Sens. Environ. 1997, 62, 241–252. [Google Scholar] [CrossRef]
- Hansen, M.C.; Defries, R.S.; Townshend, J.R.G.; Sohlberg, R. Global Land Cover Classification at 1 Km Spatial Resolution Using a Classification Tree Approach. Int. J. Remote Sens. 2000, 21, 1331–1364. [Google Scholar] [CrossRef]
- Coops, N.C.; Waring, R.H.; Landsberg, J.J. Assessing Forest Productivity in Australia and New Zealand Using a Physiologically-Based Model Driven with Averaged Monthly Weather Data and Satellite-Derived Estimates of Canopy Photosynthetic Capacity. For. Ecol. Manag. 1998, 104, 113–127. [Google Scholar] [CrossRef]
- Jiménez-Muñoz, J.C.; Sobrino, J.A.; Gillespie, A.; Sabol, D.; Gustafson, W.T. Improved Land Surface Emissivities over Agricultural Areas Using ASTER NDVI. Remote Sens. Environ. 2006, 103, 474–487. [Google Scholar] [CrossRef]
- Brown, M.E.; Pinzon, J.E.; Didan, K.; Morisette, J.T.; Tucker, C.J. Evaluation of the Consistency of Long-Term NDVI Time Series Derived from AVHRR, SPOT-Vegetation, SeaWiFS, MODIS, and Landsat ETM+ Sensors. IEEE Trans. Geosci. Remote Sens. 2006, 44, 1787–1793. [Google Scholar] [CrossRef]
- Tian, F.; Fensholt, R.; Verbesselt, J.; Grogan, K.; Horion, S.; Wang, Y. Evaluating Temporal Consistency of Long-Term Global NDVI Datasets for Trend Analysis. Remote Sens. Environ. 2015, 163, 326–340. [Google Scholar] [CrossRef]
- Chen, X.; Vierling, L.; Rowell, E.; DeFelice, T. Using Lidar and Effective LAI Data to Evaluate IKONOS and Landsat 7 ETM+ Vegetation Cover Estimates in a Ponderosa Pine Forest. Remote Sens. Environ. 2004, 91, 14–26. [Google Scholar] [CrossRef]
- Lasaponara, R.; Masini, N. Identification of Archaeological Buried Remains Based on the Normalized Difference Vegetation Index (NDVI) from Quickbird Satellite Data. IEEE Geosci. Remote Sens. Lett. 2006, 3, 325–328. [Google Scholar] [CrossRef]
- Potgieter, A.B.; George-Jaeggli, B.; Chapman, S.C.; Laws, K.; Suárez Cadavid, L.A.; Wixted, J.; Watson, J.; Eldridge, M.; Jordan, D.R.; Hammer, G.L. Multi-Spectral Imaging from an Unmanned Aerial Vehicle Enables the Assessment of Seasonal Leaf Area Dynamics of Sorghum Breeding Lines. Front. Plant Sci. 2017, 8, 1532. [Google Scholar] [CrossRef]
- Paruelo, J.M.; Epstein, H.E.; Lauenroth, W.K.; Burke, I.C. Anpp Estimates from Ndvi for the Central Grassland Region of the United States. Ecology 1997, 78, 953–958. [Google Scholar] [CrossRef]
- Jobbágy, E.G.; Sala, O.E.; Paruelo, J.M. Patterns and Controls of Primary Production in the Patagonian Steppe: A Remote Sensing Approach. Ecology 2002, 83, 307–319. [Google Scholar] [CrossRef]
- Mu, Q.; Heinsch, F.A.; Zhao, M.; Running, S.W. Development of a Global Evapotranspiration Algorithm Based on MODIS and Global Meteorology Data. Remote Sens. Environ. 2007, 111, 519–536. [Google Scholar] [CrossRef]
- Yuan, W.; Liu, S.; Yu, G.; Bonnefond, J.-M.; Chen, J.; Davis, K.; Desai, A.R.; Goldstein, A.H.; Gianelle, D.; Rossi, F.; et al. Global Estimates of Evapotranspiration and Gross Primary Production Based on MODIS and Global Meteorology Data. Remote Sens. Environ. 2010, 114, 1416–1431. [Google Scholar] [CrossRef]
- Jonsson, P.; Eklundh, L. Seasonality Extraction by Function Fitting to Time-Series of Satellite Sensor Data. IEEE Trans. Geosci. Remote Sens. 2002, 40, 1824–1832. [Google Scholar] [CrossRef]
- White, M.A.; De Beurs, K.M.; Didan, K.; Inouye, D.W.; Richardson, A.D.; Jensen, O.P.; O’keefe, J.; Zhang, G.; Nemani, R.R.; Van Leeuwen, W.J.D.; et al. Intercomparison, Interpretation, and Assessment of Spring Phenology in North America Estimated from Remote Sensing for 1982–2006. Glob. Chang. Biol. 2009, 15, 2335–2359. [Google Scholar] [CrossRef]
- Verbesselt, J.; Hyndman, R.; Zeileis, A.; Culvenor, D. Phenological Change Detection While Accounting for Abrupt and Gradual Trends in Satellite Image Time Series. Remote Sens. Environ. 2010, 114, 2970–2980. [Google Scholar] [CrossRef]
- Pettorelli, N.; Ryan, S.; Mueller, T.; Bunnefeld, N.; Jedrzejewsk, B.; Lima, M.; Kausrud, K. The Normalized Difference Vegetation Index (NDVI): Unforeseen Successes in Animal Ecology. Clim. Res. 2011, 46, 15–27. [Google Scholar] [CrossRef]
- de Araujo Barbosa, C.C.; Atkinson, P.M.; Dearing, J.A. Remote Sensing of Ecosystem Services: A Systematic Review. Ecol. Indic. 2015, 52, 430–443. [Google Scholar] [CrossRef]
- Baldi, G.; Nosetto, M.D.; Aragón, R.; Aversa, F.; Paruelo, J.M.; Jobbágy, E.G. Long-Term Satellite NDVI Data Sets: Evaluating Their Ability to Detect Ecosystem Functional Changes in South America. Sensors 2008, 8, 5397–5425. [Google Scholar] [CrossRef] [PubMed]
- Ehrlich, D.; Estes, J.E.; Singh, A. Applications of NOAA-AVHRR 1 Km Data for Environmental Monitoring. Int. J. Remote Sens. 1994, 15, 145–161. [Google Scholar] [CrossRef]
- Devi, R.M.; Patasaraiya, M.K.; Sinha, B.; Saran, S.; Dimri, A.P.; Jaiswal, R. Understanding the Linkages between Climate Change and Forest. Curr. Sci. 2018, 114, 987–996. [Google Scholar] [CrossRef]
- Carlson, T. An Overview of the “Triangle Method” for Estimating Surface Evapotranspiration and Soil Moisture from Satellite Imagery. Sensors 2007, 7, 1612–1629. [Google Scholar] [CrossRef]
- Glenn, E.P.; Nagler, P.L.; Huete, A.R. Vegetation Index Methods for Estimating Evapotranspiration by Remote Sensing. Surv. Geophys. 2010, 31, 531–555. [Google Scholar] [CrossRef]
- Gilmanov, T.G.; Tieszen, L.L.; Wylie, B.K.; Flanagan, L.B.; Frank, A.B.; Haferkamp, M.R.; Meyers, T.P.; Morgan, J.A. Integration of CO2 Flux and Remotely-Sensed Data for Primary Production and Ecosystem Respiration Analyses in the Northern Great Plains: Potential for Quantitative Spatial Extrapolation. Glob. Ecol. Biogeogr. 2005, 14, 271–292. [Google Scholar] [CrossRef]
- Balzarolo, M.; Anderson, K.; Nichol, C.; Rossini, M.; Vescovo, L.; Arriga, N.; Wohlfahrt, G.; Calvet, J.-C.; Carrara, A.; Cerasoli, S.; et al. Ground-Based Optical Measurements at European Flux Sites: A Review of Methods, Instruments and Current Controversies. Sensors 2011, 11, 7954–7981. [Google Scholar] [CrossRef] [PubMed]
- Wylie, B.K.; Johnson, D.A.; Laca, E.; Saliendra, N.Z.; Gilmanov, T.G.; Reed, B.C.; Tieszen, L.L.; Worstell, B.B. Calibration of Remotely Sensed, Coarse Resolution NDVI to CO2 Fluxes in a Sagebrush–Steppe Ecosystem. Remote Sens. Environ. 2003, 85, 243–255. [Google Scholar] [CrossRef]
- Zulueta, R.C.; Oechel, W.C.; Verfaillie, J.G.; Hastings, S.J.; Gioli, B.; Lawrence, W.T.; Paw U, K.T. Aircraft Regional-Scale Flux Measurements over Complex Landscapes of Mangroves, Desert, and Marine Ecosystems of Magdalena Bay, Mexico. J. Atmos. Ocean. Technol. 2013, 30, 1266–1294. [Google Scholar] [CrossRef]
- Lentile, L.B.; Holden, Z.A.; Smith, A.M.S.; Falkowski, M.J.; Hudak, A.T.; Morgan, P.; Lewis, S.A.; Gessler, P.E.; Benson, N.C. Remote Sensing Techniques to Assess Active Fire Characteristics and Post-Fire Effects. Int. J. Wildland Fire 2006, 15, 319–345. [Google Scholar] [CrossRef]
- Zhang, J.-H.; Yao, F.-M.; Liu, C.; Yang, L.-M.; Boken, V.K. Detection, Emission Estimation and Risk Prediction of Forest Fires in China Using Satellite Sensors and Simulation Models in the Past Three Decades—An Overview. Int. J. Environ. Res. Public Health 2011, 8, 3156–3178. [Google Scholar] [CrossRef]
- Zargar, A.; Sadiq, R.; Naser, B. A Review of Drought Indices. Environ. Rev. 2011, 19, 333–349. [Google Scholar] [CrossRef]
- McVicar, T.R.; Jupp, D.L.B. The Current and Potential Operational Uses of Remote Sensing to Aid Decisions on Drought Exceptional Circumstances in Australia: A Review. Agric. Syst. 1998, 57, 399–468. [Google Scholar] [CrossRef]
- Vicente-Serrano, S.M. Evaluating the Impact of Drought Using Remote Sensing in a Mediterranean, Semi-Arid Region. Nat. Hazards 2007, 40, 173–208. [Google Scholar] [CrossRef]
- McKenzie, B.M.; Bengough, A.G.; Hallett, P.D.; Thomas, W.T.B.; Forster, B.; McNicol, J.W. Deep Rooting and Drought Screening of Cereal Crops: A Novel Field-Based Method and Its Application. Field Crops Res. 2009, 112, 165–171. [Google Scholar] [CrossRef]
- Bai, Z.G.; Dent, D.L.; Olsson, L.; Schaepman, M.E. Proxy Global Assessment of Land Degradation. Soil Use Manag. 2008, 24, 223–234. [Google Scholar] [CrossRef]
- Wessels, K.J.; Prince, S.D.; Malherbe, J.; Small, J.; Frost, P.E.; VanZyl, D. Can Human-Induced Land Degradation Be Distinguished from the Effects of Rainfall Variability? A Case Study in South Africa. J. Arid Environ. 2007, 68, 271–297. [Google Scholar] [CrossRef]
- Wessels, K.J.; Prince, S.D.; Frost, P.E.; van Zyl, D. Assessing the Effects of Human-Induced Land Degradation in the Former Homelands of Northern South Africa with a 1 Km AVHRR NDVI Time-Series. Remote Sens. Environ. 2004, 91, 47–67. [Google Scholar] [CrossRef]
- Atzberger, C. Advances in Remote Sensing of Agriculture: Context Description, Existing Operational Monitoring Systems and Major Information Needs. Remote Sens. 2013, 5, 949–981. [Google Scholar] [CrossRef]
- Gago, J.; Douthe, C.; Coopman, R.E.; Gallego, P.P.; Ribas-Carbo, M.; Flexas, J.; Escalona, J.; Medrano, H. UAVs Challenge to Assess Water Stress for Sustainable Agriculture. Agric. Water Manag. 2015, 153, 9–19. [Google Scholar] [CrossRef]
- Huang, S.; Tang, L.; Hupy, J.P.; Wang, Y.; Shao, G. A Commentary Review on the Use of Normalized Difference Vegetation Index (NDVI) in the Era of Popular Remote Sensing. J. For. Res. 2021, 32, 1–6. [Google Scholar] [CrossRef]
- Li, S.; Xu, L.; Jing, Y.; Yin, H.; Li, X.; Guan, X. High-Quality Vegetation Index Product Generation: A Review of NDVI Time Series Reconstruction Techniques. Int. J. Appl. Earth Obs. Geoinf. 2021, 105, 102640. [Google Scholar] [CrossRef]
- Pritchard, A. Statistical Bibliography or Bibliometrics? J. Doc. 1969, 25, 348–349. [Google Scholar]
- Ellegaard, O.; Wallin, J.A. The Bibliometric Analysis of Scholarly Production: How Great Is the Impact? Scientometrics 2015, 105, 1809–1831. [Google Scholar] [CrossRef]
- Chen, C. Science Mapping: A Systematic Review of the Literature. J. Data Inf. Sci. 2017, 2, 1–40. [Google Scholar] [CrossRef]
- Zupic, I.; Čater, T. Bibliometric Methods in Management and Organization. Organ. Res. Methods 2015, 18, 429–472. [Google Scholar] [CrossRef]
- Zhang, H.; Huang, M.; Qing, X.; Li, G.; Tian, C. Bibliometric Analysis of Global Remote Sensing Research during 2010–2015. ISPRS Int. J. Geo-Inf. 2017, 6, 332. [Google Scholar] [CrossRef]
- Zhang, Y.; Chen, Y. Research Trends and Areas of Focus on the Chinese Loess Plateau: A Bibliometric Analysis during 1991–2018. CATENA 2020, 194, 104798. [Google Scholar] [CrossRef]
- Tamiminia, H.; Salehi, B.; Mahdianpari, M.; Quackenbush, L.; Adeli, S.; Brisco, B. Google Earth Engine for Geo-Big Data Applications: A Meta-Analysis and Systematic Review. ISPRS J. Photogramm. Remote Sens. 2020, 164, 152–170. [Google Scholar] [CrossRef]
- Li, T.; Cui, L.; Xu, Z.; Hu, R.; Joshi, P.K.; Song, X.; Tang, L.; Xia, A.; Wang, Y.; Guo, D.; et al. Quantitative Analysis of the Research Trends and Areas in Grassland Remote Sensing: A Scientometrics Analysis of Web of Science from 1980 to 2020. Remote Sens. 2021, 13, 1279. [Google Scholar] [CrossRef]
- Zhao, Q.; Yu, L.; Du, Z.; Peng, D.; Hao, P.; Zhang, Y.; Gong, P. An Overview of the Applications of Earth Observation Satellite Data: Impacts and Future Trends. Remote Sens. 2022, 14, 1863. [Google Scholar] [CrossRef]
- Aria, M.; Cuccurullo, C. Bibliometrix: An R-Tool for Comprehensive Science Mapping Analysis. J. Informetr. 2017, 11, 959–975. [Google Scholar] [CrossRef]
- Secinaro, S.; Brescia, V.; Calandra, D.; Biancone, P. Employing Bibliometric Analysis to Identify Suitable Business Models for Electric Cars. J. Clean. Prod. 2020, 264, 121503. [Google Scholar] [CrossRef]
- Townshend, J.R.G.; Goff, T.E.; Tucker, C.J. Multitemporal Dimensionality of Images of Normalized Difference Vegetation Index at Continental Scales. IEEE Trans. Geosci. Remote Sens. 1985, GE-23, 888–895. [Google Scholar] [CrossRef]
- Elango, B.; Rajendran, P. Authorship Trends and Collaboration Pattern in the Marine Sciences Literature: A Scientometric Study. Int. J. Inf. Dissem. Technol. 2012, 2, 166–169. [Google Scholar]
- Hák, T.; Janoušková, S.; Moldan, B. Sustainable Development Goals: A Need for Relevant Indicators. Ecol. Indic. 2016, 60, 565–573. [Google Scholar] [CrossRef]
- Huete, A.; Didan, K.; Miura, T.; Rodriguez, E.P.; Gao, X.; Ferreira, L.G. Overview of the Radiometric and Biophysical Performance of the MODIS Vegetation Indices. Remote Sens. Environ. 2002, 83, 195–213. [Google Scholar] [CrossRef]
- Gao, B. NDWI—A Normalized Difference Water Index for Remote Sensing of Vegetation Liquid Water from Space. Remote Sens. Environ. 1996, 58, 257–266. [Google Scholar] [CrossRef]
- Myneni, R.B.; Hoffman, S.; Knyazikhin, Y.; Privette, J.L.; Glassy, J.; Tian, Y.; Wang, Y.; Song, X.; Zhang, Y.; Smith, G.R.; et al. Global Products of Vegetation Leaf Area and Fraction Absorbed PAR from Year One of MODIS Data. Remote Sens. Environ. 2002, 83, 214–231. [Google Scholar] [CrossRef]
- Haboudane, D.; Miller, J.R.; Pattey, E.; Zarco-Tejada, P.J.; Strachan, I.B. Hyperspectral Vegetation Indices and Novel Algorithms for Predicting Green LAI of Crop Canopies: Modeling and Validation in the Context of Precision Agriculture. Remote Sens. Environ. 2004, 90, 337–352. [Google Scholar] [CrossRef]
- Qi, J.; Chehbouni, A.; Huete, A.R.; Kerr, Y.H.; Sorooshian, S. A Modified Soil Adjusted Vegetation Index. Remote Sens. Environ. 1994, 48, 119–126. [Google Scholar] [CrossRef]
- Rondeaux, G.; Steven, M.; Baret, F. Optimization of Soil-Adjusted Vegetation Indices. Remote Sens. Environ. 1996, 55, 95–107. [Google Scholar] [CrossRef]
- Gamon, J.A.; Peñuelas, J.; Field, C.B. A Narrow-Waveband Spectral Index That Tracks Diurnal Changes in Photosynthetic Efficiency. Remote Sens. Environ. 1992, 41, 35–44. [Google Scholar] [CrossRef]
- Hirsch, J.E. An Index to Quantify an Individual’s Scientific Research Output. Proc. Natl. Acad. Sci. USA 2005, 102, 16569–16572. [Google Scholar] [CrossRef]
- Garfield, E. Introducing Citation Classics. The Human Side of Scientific Reports. Essays Inf. Sci. 1977, 3, 5–7. [Google Scholar]
- Tucker, C.J.; Pinzon, J.E.; Brown, M.E.; Slayback, D.A.; Pak, E.W.; Mahoney, R.; Vermote, E.F.; El Saleous, N. An Extended AVHRR 8-km NDVI Dataset Compatible with MODIS and SPOT Vegetation NDVI Data. Int. J. Remote Sens. 2005, 26, 4485–4498. [Google Scholar] [CrossRef]
- Chen, J.; Jönsson, P.; Tamura, M.; Gu, Z.; Matsushita, B.; Eklundh, L. A Simple Method for Reconstructing a High-Quality NDVI Time-Series Data Set Based on the Savitzky–Golay Filter. Remote Sens. Environ. 2004, 91, 332–344. [Google Scholar] [CrossRef]
- Zhou, L.; Tucker, C.J.; Kaufmann, R.K.; Slayback, D.; Shabanov, N.V.; Myneni, R.B. Variations in Northern Vegetation Activity Inferred from Satellite Data of Vegetation Index during 1981 to 1999. J. Geophys. Res. Atmos. 2001, 106, 20069–20083. [Google Scholar] [CrossRef]
- Jönsson, P.; Eklundh, L. TIMESAT—A Program for Analyzing Time-Series of Satellite Sensor Data. Comput. Geosci. 2004, 30, 833–845. [Google Scholar] [CrossRef]
- Reed, B.C.; Brown, J.F.; VanderZee, D.; Loveland, T.R.; Merchant, J.W.; Ohlen, D.O. Measuring Phenological Variability from Satellite Imagery. J. Veg. Sci. 1994, 5, 703–714. [Google Scholar] [CrossRef]
- McFeeters, S.K. The Use of the Normalized Difference Water Index (NDWI) in the Delineation of Open Water Features. Int. J. Remote Sens. 1996, 17, 1425–1432. [Google Scholar] [CrossRef]
- Xu, H. Modification of Normalised Difference Water Index (NDWI) to Enhance Open Water Features in Remotely Sensed Imagery. Int. J. Remote Sens. 2006, 27, 3025–3033. [Google Scholar] [CrossRef]
- Loveland, T.R.; Reed, B.C.; Brown, J.F.; Ohlen, D.O.; Zhu, Z.; Yang, L.; Merchant, J.W. Development of a Global Land Cover Characteristics Database and IGBP DISCover from 1 Km AVHRR Data. Int. J. Remote Sens. 2000, 21, 1303–1330. [Google Scholar] [CrossRef]
- Hansen, B.U. Monitoring Natural Vegetation in Southern Greenland Using NOAA AVHRR and Field Measurements. ARCTIC 1991, 44, 94–101. [Google Scholar] [CrossRef]
- Santamaria-Artigas, A.; Vermote, E.F.; Franch, B.; Roger, J.-C.; Skakun, S. Evaluation of the AVHRR Surface Reflectance Long Term Data Record between 1984 and 2011. Int. J. Appl. Earth Obs. Geoinf. 2021, 98, 102317. [Google Scholar] [CrossRef]
- Pinzon, J.; Tucker, C. A Non-Stationary 1981–2012 AVHRR NDVI3g Time Series. Remote Sens. 2014, 6, 6929–6960. [Google Scholar] [CrossRef]
- Law, B.E.; Waring, R.H. Combining Remote Sensing and Climatic Data to Estimate Net Primary Production Across Oregon. Ecol. Appl. 1994, 4, 717–728. [Google Scholar] [CrossRef]
- Gamon, J.A.; Field, C.B.; Goulden, M.L.; Griffin, K.L.; Hartley, A.E.; Joel, G.; Penuelas, J.; Valentini, R. Relationships Between NDVI, Canopy Structure, and Photosynthesis in Three Californian Vegetation Types. Ecol. Appl. 1995, 5, 28–41. [Google Scholar] [CrossRef]
- Catorci, A.; Lulli, R.; Malatesta, L.; Tavoloni, M.; Tardella, F.M. How the Interplay between Management and Interannual Climatic Variability Influences the NDVI Variation in a Sub-Mediterranean Pastoral System: Insight into Sustainable Grassland Use under Climate Change. Agric. Ecosyst. Environ. 2021, 314, 107372. [Google Scholar] [CrossRef]
- Chladil, M.A.; Nunez, M. Assessing Grassland Moisture and Biomass in Tasmania—The Application of Remote-Sensing and Empirical-Models for a Cloudy Environment. Int. J. Wildland Fire 1995, 5, 165–171. [Google Scholar] [CrossRef]
- Piao, S.; Mohammat, A.; Fang, J.; Cai, Q.; Feng, J. NDVI-Based Increase in Growth of Temperate Grasslands and Its Responses to Climate Changes in China. Glob. Environ. Chang. 2006, 16, 340–348. [Google Scholar] [CrossRef]
- Fu, Y.H.; Zhou, X.; Li, X.; Zhang, Y.; Geng, X.; Hao, F.; Zhang, X.; Hanninen, H.; Guo, Y.; De Boeck, H.J. Decreasing Control of Precipitation on Grassland Spring Phenology in Temperate China. Glob. Ecol. Biogeogr. 2021, 30, 490–499. [Google Scholar] [CrossRef]
- Suzuki, R.; Nomaki, T.; Yasunari, T. Spatial Distribution and Its Seasonality of Satellite-Derived Vegetation Index (NDVI) and Climate in Siberia. Int. J. Climatol. 2001, 21, 1321–1335. [Google Scholar] [CrossRef]
- Delbart, N.; Kergoat, L.; Le Toan, T.; Lhermitte, J.; Picard, G. Determination of Phenological Dates in Boreal Regions Using Normalized Difference Water Index. Remote Sens. Environ. 2005, 97, 26–38. [Google Scholar] [CrossRef]
- Epstein, H.E.; Walker, D.A.; Frost, G.V.; Raynolds, M.K.; Bhatt, U.; Daanen, R.; Forbes, B.; Geml, J.; Kaärlejarvi, E.; Khitun, O.; et al. Spatial Patterns of Arctic Tundra Vegetation Properties on Different Soils along the Eurasia Arctic Transect, and Insights for a Changing Arctic. Environ. Res. Lett. 2020, 16, 014008. [Google Scholar] [CrossRef]
- Myneni, R.B.; Ramakrishna, R.; Nemani, R.; Running, S.W. Estimation of Global Leaf Area Index and Absorbed Par Using Radiative Transfer Models. IEEE Trans. Geosci. Remote Sens. 1997, 35, 1380–1393. [Google Scholar] [CrossRef]
- Sanz, E.; Saa-Requejo, A.; Díaz-Ambrona, C.H.; Ruiz-Ramos, M.; Rodríguez, A.; Iglesias, E.; Esteve, P.; Soriano, B.; Tarquis, A.M. Normalized Difference Vegetation Index Temporal Responses to Temperature and Precipitation in Arid Rangelands. Remote Sens. 2021, 13, 840. [Google Scholar] [CrossRef]
- Joshi, R.C.; Ryu, D.; Sheridan, G.J.; Lane, P.N.J. Modeling Vegetation Water Stress over the Forest from Space: Temperature Vegetation Water Stress Index (TVWSI). Remote Sens. 2021, 13, 4635. [Google Scholar] [CrossRef]
- Hereher, M.E. Detection of Rainstorm Pattern in Arid Regions Using MODIS NDVI Time Series Analysis. Geocarto Int. 2021, 36, 861–873. [Google Scholar] [CrossRef]
- Yuan, F.; Bauer, M.E. Comparison of Impervious Surface Area and Normalized Difference Vegetation Index as Indicators of Surface Urban Heat Island Effects in Landsat Imagery. Remote Sens. Environ. 2007, 106, 375–386. [Google Scholar] [CrossRef]
- Liu, L.; Zhang, Y. Urban Heat Island Analysis Using the Landsat TM Data and ASTER Data: A Case Study in Hong Kong. Remote Sens. 2011, 3, 1535–1552. [Google Scholar] [CrossRef]
- Walawender, J.P.; Szymanowski, M.; Hajto, M.J.; Bokwa, A. Land Surface Temperature Patterns in the Urban Agglomeration of Krakow (Poland) Derived from Landsat-7/ETM+ Data. Pure Appl. Geophys. 2014, 171, 913–940. [Google Scholar] [CrossRef]
- Lazzarini, M.; Marpu, P.R.; Ghedira, H. Temperature-Land Cover Interactions: The Inversion of Urban Heat Island Phenomenon in Desert City Areas. Remote Sens. Environ. 2013, 130, 136–152. [Google Scholar] [CrossRef]
- Teluguntla, P.; Thenkabail, P.S.; Oliphant, A.; Xiong, J.; Gumma, M.K.; Congalton, R.G.; Yadav, K.; Huete, A. A 30-m Landsat-Derived Cropland Extent Product of Australia and China Using Random Forest Machine Learning Algorithm on Google Earth Engine Cloud Computing Platform. ISPRS J. Photogramm. Remote Sens. 2018, 144, 325–340. [Google Scholar] [CrossRef]
- Bhatti, S.S.; Tripathi, N.K. Built-up Area Extraction Using Landsat 8 OLI Imagery. GISci. Remote Sens. 2014, 51, 445–467. [Google Scholar] [CrossRef]
- Neigh, C.S.R.; Tucker, C.J.; Townshend, J.R.G. North American Vegetation Dynamics Observed with Multi-Resolution Satellite Data. Remote Sens. Environ. 2008, 112, 1749–1772. [Google Scholar] [CrossRef]
- Senf, C.; Leitão, P.J.; Pflugmacher, D.; van der Linden, S.; Hostert, P. Mapping Land Cover in Complex Mediterranean Landscapes Using Landsat: Improved Classification Accuracies from Integrating Multi-Seasonal and Synthetic Imagery. Remote Sens. Environ. 2015, 156, 527–536. [Google Scholar] [CrossRef]
- Jackson, T.J.; Chen, D.; Cosh, M.; Li, F.; Anderson, M.; Walthall, C.; Doriaswamy, P.; Hunt, E.R. Vegetation Water Content Mapping Using Landsat Data Derived Normalized Difference Water Index for Corn and Soybeans. Remote Sens. Environ. 2004, 92, 475–482. [Google Scholar] [CrossRef]
- Chen, D.; Huang, J.; Jackson, T.J. Vegetation Water Content Estimation for Corn and Soybeans Using Spectral Indices Derived from MODIS Near- and Short-Wave Infrared Bands. Remote Sens. Environ. 2005, 98, 225–236. [Google Scholar] [CrossRef]
- Pan, Y.; Li, L.; Zhang, J.; Liang, S.; Zhu, X.; Sulla-Menashe, D. Winter Wheat Area Estimation from MODIS-EVI Time Series Data Using the Crop Proportion Phenology Index. Remote Sens. Environ. 2012, 119, 232–242. [Google Scholar] [CrossRef]
- Dong, J.; Xiao, X.; Chen, B.; Torbick, N.; Jin, C.; Zhang, G.; Biradar, C. Mapping Deciduous Rubber Plantations through Integration of PALSAR and Multi-Temporal Landsat Imagery. Remote Sens. Environ. 2013, 134, 392–402. [Google Scholar] [CrossRef]
- Kontgis, C.; Schneider, A.; Ozdogan, M. Mapping Rice Paddy Extent and Intensification in the Vietnamese Mekong River Delta with Dense Time Stacks of Landsat Data. Remote Sens. Environ. 2015, 169, 255–269. [Google Scholar] [CrossRef]
- Frampton, W.J.; Dash, J.; Watmough, G.; Milton, E.J. Evaluating the Capabilities of Sentinel-2 for Quantitative Estimation of Biophysical Variables in Vegetation. ISPRS J. Photogramm. Remote Sens. 2013, 82, 83–92. [Google Scholar] [CrossRef]
- Delegido, J.; Verrelst, J.; Alonso, L.; Moreno, J. Evaluation of Sentinel-2 Red-Edge Bands for Empirical Estimation of Green LAI and Chlorophyll Content. Sensors 2011, 11, 7063–7081. [Google Scholar] [CrossRef]
- Zhang, C.; Pattey, E.; Liu, J.; Cai, H.; Shang, J.; Dong, T. Retrieving Leaf and Canopy Water Content of Winter Wheat Using Vegetation Water Indices. IEEE J. Sel. Top. Appl. Earth Obs. Remote Sens. 2018, 11, 112–126. [Google Scholar] [CrossRef]
- Vrieling, A.; Meroni, M.; Darvishzadeh, R.; Skidmore, A.K.; Wang, T.; Zurita-Milla, R.; Oosterbeek, K.; O’Connor, B.; Paganini, M. Vegetation Phenology from Sentinel-2 and Field Cameras for a Dutch Barrier Island. Remote Sens. Environ. 2018, 215, 517–529. [Google Scholar] [CrossRef]
- Jönsson, P.; Cai, Z.; Melaas, E.; Friedl, M.A.; Eklundh, L. A Method for Robust Estimation of Vegetation Seasonality from Landsat and Sentinel-2 Time Series Data. Remote Sens. 2018, 10, 635. [Google Scholar] [CrossRef]
- Stendardi, L.; Karlsen, S.R.; Niedrist, G.; Gerdol, R.; Zebisch, M.; Rossi, M.; Notarnicola, C. Exploiting Time Series of Sentinel-1 and Sentinel-2 Imagery to Detect Meadow Phenology in Mountain Regions. Remote Sens. 2019, 11, 542. [Google Scholar] [CrossRef]
- Misra, G.; Cawkwell, F.; Wingler, A. Status of Phenological Research Using Sentinel-2 Data: A Review. Remote Sens. 2020, 12, 2760. [Google Scholar] [CrossRef]
- Pelletier, C.; Valero, S.; Inglada, J.; Champion, N.; Dedieu, G. Assessing the Robustness of Random Forests to Map Land Cover with High Resolution Satellite Image Time Series over Large Areas. Remote Sens. Environ. 2016, 187, 156–168. [Google Scholar] [CrossRef]
- Xiong, J.; Thenkabail, P.S.; Tilton, J.C.; Gumma, M.K.; Teluguntla, P.; Oliphant, A.; Congalton, R.G.; Yadav, K.; Gorelick, N. Nominal 30-m Cropland Extent Map of Continental Africa by Integrating Pixel-Based and Object-Based Algorithms Using Sentinel-2 and Landsat-8 Data on Google Earth Engine. Remote Sens. 2017, 9, 1065. [Google Scholar] [CrossRef]
- Van Tricht, K.; Gobin, A.; Gilliams, S.; Piccard, I. Synergistic Use of Radar Sentinel-1 and Optical Sentinel-2 Imagery for Crop Mapping: A Case Study for Belgium. Remote Sens. 2018, 10, 1642. [Google Scholar] [CrossRef]
- Sitokonstantinou, V.; Papoutsis, I.; Kontoes, C.; Lafarga Arnal, A.; Armesto Andrés, A.P.; Garraza Zurbano, J.A. Scalable Parcel-Based Crop Identification Scheme Using Sentinel-2 Data Time-Series for the Monitoring of the Common Agricultural Policy. Remote Sens. 2018, 10, 911. [Google Scholar] [CrossRef]
- Gao, F.; Anderson, M.; Daughtry, C.; Johnson, D. Assessing the Variability of Corn and Soybean Yields in Central Iowa Using High Spatiotemporal Resolution Multi-Satellite Imagery. Remote Sens. 2018, 10, 1489. [Google Scholar] [CrossRef]
- Zarco-Tejada, P.J.; González-Dugo, V.; Berni, J.A.J. Fluorescence, Temperature and Narrow-Band Indices Acquired from a UAV Platform for Water Stress Detection Using a Micro-Hyperspectral Imager and a Thermal Camera. Remote Sens. Environ. 2012, 117, 322–337. [Google Scholar] [CrossRef]
- Mwinuka, P.R.; Mbilinyi, B.P.; Mbungu, W.B.; Mourice, S.K.; Mahoo, H.F.; Schmitter, P. The Feasibility of Hand-Held Thermal and UAV-Based Multispectral Imaging for Canopy Water Status Assessment and Yield Prediction of Irrigated African Eggplant (Solanum aethopicum L). Agric. Water Manag. 2021, 245, 106584. [Google Scholar] [CrossRef]
- Bahat, I.; Netzer, Y.; Grünzweig, J.M.; Alchanatis, V.; Peeters, A.; Goldshtein, E.; Ohana-Levi, N.; Ben-Gal, A.; Cohen, Y. In-Season Interactions between Vine Vigor, Water Status and Wine Quality in Terrain-Based Management-Zones in a ‘Cabernet Sauvignon’ Vineyard. Remote Sens. 2021, 13, 1636. [Google Scholar] [CrossRef]
- Hunt, E.R.; Hively, W.D.; Fujikawa, S.J.; Linden, D.S.; Daughtry, C.S.T.; McCarty, G.W. Acquisition of NIR-Green-Blue Digital Photographs from Unmanned Aircraft for Crop Monitoring. Remote Sens. 2010, 2, 290–305. [Google Scholar] [CrossRef]
- Nevavuori, P.; Narra, N.; Lipping, T. Crop Yield Prediction with Deep Convolutional Neural Networks. Comput. Electron. Agric. 2019, 163, 104859. [Google Scholar] [CrossRef]
- Fu, Z.; Jiang, J.; Gao, Y.; Krienke, B.; Wang, M.; Zhong, K.; Cao, Q.; Tian, Y.; Zhu, Y.; Cao, W.; et al. Wheat Growth Monitoring and Yield Estimation Based on Multi-Rotor Unmanned Aerial Vehicle. Remote Sens. 2020, 12, 508. [Google Scholar] [CrossRef]
- Kim, H.; Kim, W.; Kim, S.D. Damage Assessment of Rice Crop after Toluene Exposure Based on the Vegetation Index (VI) and UAV Multispectral Imagery. Remote Sens. 2021, 13, 25. [Google Scholar] [CrossRef]
- Giuseppi, A.; Germanà, R.; Fiorini, F.; Delli Priscoli, F.; Pietrabissa, A. UAV Patrolling for Wildfire Monitoring by a Dynamic Voronoi Tessellation on Satellite Data. Drones 2021, 5, 130. [Google Scholar] [CrossRef]
- Choi, S.-K.; Ramirez, R.A.; Kwon, T.-H. Preliminary Report of a Catastrophic Landslide That Occurred in Gokseong County, South Jeolla Province, South Korea, on August 7, 2020. Landslides 2021, 18, 1465–1469. [Google Scholar] [CrossRef]
- Kong, D.; Zhang, Y.; Gu, X.; Wang, D. A Robust Method for Reconstructing Global MODIS EVI Time Series on the Google Earth Engine. ISPRS J. Photogramm. Remote Sens. 2019, 155, 13–24. [Google Scholar] [CrossRef]
- Robinson, N.P.; Allred, B.W.; Jones, M.O.; Moreno, A.; Kimball, J.S.; Naugle, D.E.; Erickson, T.A.; Richardson, A.D. A Dynamic Landsat Derived Normalized Difference Vegetation Index (NDVI) Product for the Conterminous United States. Remote Sens. 2017, 9, 863. [Google Scholar] [CrossRef]
- Chen, Y.; Cao, R.; Chen, J.; Liu, L.; Matsushita, B. A Practical Approach to Reconstruct High-Quality Landsat NDVI Time-Series Data by Gap Filling and the Savitzky–Golay Filter. ISPRS J. Photogramm. Remote Sens. 2021, 180, 174–190. [Google Scholar] [CrossRef]
- Long, T.; Zhang, Z.; He, G.; Jiao, W.; Tang, C.; Wu, B.; Zhang, X.; Wang, G.; Yin, R. 30 m Resolution Global Annual Burned Area Mapping Based on Landsat Images and Google Earth Engine. Remote Sens. 2019, 11, 489. [Google Scholar] [CrossRef]
- Xie, S.; Liu, L.; Zhang, X.; Yang, J.; Chen, X.; Gao, Y. Automatic Land-Cover Mapping Using Landsat Time-Series Data Based on Google Earth Engine. Remote Sens. 2019, 11, 3023. [Google Scholar] [CrossRef]
- Aghababaei, M.; Ebrahimi, A.; Naghipour, A.A.; Asadi, E.; Verrelst, J. Vegetation Types Mapping Using Multi-Temporal Landsat Images in the Google Earth Engine Platform. Remote Sens. 2021, 13, 4683. [Google Scholar] [CrossRef]


| Reference | Fields |
|---|---|
| (Zhang et al., 2017, pp. 2010–2015) | Remote Sensing |
| (Zhang and Chen, 2020, pp. 1991–2018) | Chinese Loess Plateau |
| (Tamiminia et al., 2020) | Google Earth Engine |
| (Li et al., 2021) | Grassland Remote Sensing |
| (Zhao et al., 2022) | Earth Observation Satellite Data |
| This paper | NDVI |
| Main Information | Description | Value |
|---|---|---|
| Documents | Total number of documents | 17,755 |
| Sources | The frequency distribution of sources as journals, books, etc. | 1258 |
| Timespan | Years of publication | 1985–2021 |
| References | Total number of references | 369,335 |
| Author’s keywords (DE) | Total number of author’s keywords | 27,664 |
| Keywords Plus (ID) | Total number of phrases that frequently appear in the title of an article’s references | 15,425 |
| Authors | Total number of authors | 39,838 |
| Authors Appearances | The authors’ frequency distribution | 85,789 |
| Authors of single-authored documents | The number of single authors per articles | 455 |
| Authors of multi-authored documents | The number of authors of multi-authored articles | 39,383 |
| Authors per document | Average number of authors in each document | 2.24 |
| Co-Authors per Documents | Average number of co-authors in each document | 4.83 |
| Average citations per documents | Average number of citations in each document | 32.29 |
| Collaboration Index | 2.29 |
| Institution | Country | TC | TA |
|---|---|---|---|
| Goddard Space Flight Center | USA | 18,493 | 102 |
| IGSNRR, CAS | China | 5771 | 240 |
| University Arizona | USA | 5285 | 4 |
| IRSDE, CAS | China | 3651 | 161 |
| University Copenhagen | Denmark | 3024 | 21 |
| Peaking University | China | 2915 | 19 |
| Beijing Normal University | China | 2698 | 25 |
| EROS Data Center | USA | 2584 | 12 |
| University of Nebraska | USA | 2579 | 1 |
| Ben-Gurion University of the Negev | Israel | 2525 | 6 |
| Sources | N. LC | ND | IF | H Index |
|---|---|---|---|---|
| Remote Sensing of Environment * | 94,096 | 1063 | 10.164 | 238 |
| International Journal of Remote Sensing * | 45,760 | 1289 | 3.151 | 151 |
| Remote Sensing * | 23,047 | 1843 | 4.848 | 81 |
| IEEE Transactions on Geoscience and Remote Sensing | 15,488 | 180 | 5.600 | 216 |
| Agricultural And Forest Meteorology * | 12,776 | 226 | 5.734 | 144 |
| Global Change Biology | 12,649 | 131 | 10.86 | 217 |
| Journal of Geophysical Research-Atmospheres | 10,363 | 117 | 4.261 | - |
| Science | 9463 | 1 | 47.728 | 1058 |
| International Journal of Applied Earth Observation and Geoinformation * | 8623 | 378 | 5.933 | 76 |
| Nature | 8547 | 3 | 49.962 | 1096 |
| Author | H Index | G Index | TC | NP | PY_Start | Country |
|---|---|---|---|---|---|---|
| Tucker C.J. | 57 | 83 | 15385 | 83 | 1985 | USA |
| Myneni R.B. | 46 | 68 | 10160 | 68 | 1992 | USA |
| Piao S.L. | 40 | 54 | 7408 | 54 | 2003 | China |
| Chen W. | 35 | 62 | 3939 | 67 | 2010 | USA |
| Pradhan B. | 35 | 55 | 5385 | 55 | 2010 | Germany |
| Fensholt R. | 34 | 67 | 4963 | 67 | 2003 | Denmark |
| Paruelo J.M. | 33 | 54 | 3155 | 54 | 1993 | USA |
| Xiao X.M. | 32 | 56 | 4353 | 56 | 2001 | USA |
| Huete A.R. | 31 | 44 | 6835 | 44 | 1992 | USA |
| Eklundh L. | 29 | 43 | 5798 | 43 | 1993 | Sweden |
| Paper | DOI | Year | LCS | GCS |
|---|---|---|---|---|
| HUETE A, 2002, REMOTE SENS ENVIRON | 10.1016/S0034-4257(02)00096-2 | 2002 | 1725 | 4784 |
| PETTORELLI N, 2005, TRENDS ECOL EVOL | 10.1016/j.tree.2005.05.011 | 2005 | 898 | 1690 |
| TUCKER CJ, 2005, INT J REMOTE SENS | 10.1080/01431160500168686 | 2005 | 865 | 1566 |
| GAO BC, 1996, REMOTE SENS ENVIRON | 10.1016/S0034-4257(96)00067-3 | 1996 | 773 | 2819 |
| CARLSON TN, 1997, REMOTE SENS ENVIRON | 10.1016/S0034-4257(97)00104-1 | 1997 | 749 | 1626 |
| CHEN J, 2004, REMOTE SENS ENVIRON | 10.1016/j.rse.2004.03.014 | 2004 | 599 | 1174 |
| ZHOU LM, 2001, J GEOPHYS RES-ATMOS | 10.1029/2000JD000115 | 2001 | 563 | 1068 |
| JONSSON P, 2004, COMPUT GEOSCI-UK | 10.1016/j.cageo.2004.05.006 | 2004 | 539 | 1172 |
| REED BC, 1994, J VEG SCI | 10.2307/3235884 | 1994 | 529 | 987 |
| QI J, 1994, REMOTE SENS ENVIRON | 10.1016/0034-4257(94)90134-1 | 1994 | 458 | 1442 |
| Paper | DOI | Year | LCS | GCS |
|---|---|---|---|---|
| HUETE A, 2002, REMOTE SENS ENVIRON | 10.1016/S0034-4257(02)00096-2 | 2002 | 1725 | 4784 |
| GAO BC, 1996, REMOTE SENS ENVIRON | 10.1016/S0034-4257(96)00067-3 | 1996 | 773 | 2819 |
| MCFEETERS SK, 1996, INT J REMOTE SENS | 10.1080/01431169608948714 | 1996 | 324 | 2579 |
| XU HQ, 2006, INT J REMOTE SENS | 10.1080/01431160600589179 | 2006 | 256 | 1877 |
| PETTORELLI N, 2005, TRENDS ECOL EVOL | 10.1016/j.tree.2005.05.011 | 2005 | 898 | 1690 |
| LOVELAND TR, 2000, INT J REMOTE SENS | 10.1080/014311600210191 | 2000 | 169 | 1671 |
| HANSEN MC, 2000, INT J REMOTE SENS | 10.1080/014311600210209 | 2000 | 180 | 1656 |
| CARLSON TN, 1997, REMOTE SENS ENVIRON | 10.1016/S0034-4257(97)00104-1 | 1997 | 749 | 1626 |
| TUCKER CJ, 2005, INT J REMOTE SENS | 10.1080/01431160500168686 | 2005 | 865 | 1566 |
| QI J, 1994, REMOTE SENS ENVIRON | 10.1016/0034-4257(94)90134-1 | 1994 | 458 | 1442 |
Publisher’s Note: MDPI stays neutral with regard to jurisdictional claims in published maps and institutional affiliations. |
© 2022 by the authors. Licensee MDPI, Basel, Switzerland. This article is an open access article distributed under the terms and conditions of the Creative Commons Attribution (CC BY) license (https://creativecommons.org/licenses/by/4.0/).
Share and Cite
Xu, Y.; Yang, Y.; Chen, X.; Liu, Y. Bibliometric Analysis of Global NDVI Research Trends from 1985 to 2021. Remote Sens. 2022, 14, 3967. https://doi.org/10.3390/rs14163967
Xu Y, Yang Y, Chen X, Liu Y. Bibliometric Analysis of Global NDVI Research Trends from 1985 to 2021. Remote Sensing. 2022; 14(16):3967. https://doi.org/10.3390/rs14163967
Chicago/Turabian StyleXu, Yang, Yaping Yang, Xiaona Chen, and Yangxiaoyue Liu. 2022. "Bibliometric Analysis of Global NDVI Research Trends from 1985 to 2021" Remote Sensing 14, no. 16: 3967. https://doi.org/10.3390/rs14163967
APA StyleXu, Y., Yang, Y., Chen, X., & Liu, Y. (2022). Bibliometric Analysis of Global NDVI Research Trends from 1985 to 2021. Remote Sensing, 14(16), 3967. https://doi.org/10.3390/rs14163967