Article

Multi-Path Interactive Network for Aircraft Identification with Optical and SAR Images

1
School of Artificial Intelligence, Xidian University, Xi’an 710071, China
2
Intelligent Decision and Cognitive Innovation Center of State Administration of Science, Technology and Industry for National Defense, Beijing 100048, China
3
School of Mathematics and Statistics, Beijing Jiaotong University, Beijing 100044, China
*
Author to whom correspondence should be addressed.
Remote Sens. 2022, 14(16), 3922; https://doi.org/10.3390/rs14163922
Submission received: 24 June 2022 / Revised: 25 July 2022 / Accepted: 8 August 2022 / Published: 12 August 2022
(This article belongs to the Section AI Remote Sensing)

Abstract

:
Aircraft identification has been a research hotspot in remote-sensing fields. However, due to the presence of clouds in satellite-borne optical imagery, it is difficult to identify aircraft using a single optical image. In this paper, a Multi-path Interactive Network (MIN) is proposed to fuse Optical and Synthetic Aperture Radar (SAR) images for aircraft identification on cloudy days. First, features are extracted from optical and SAR images separately by convolution backbones of ResNet-34. Second, a piecewise residual fusion strategy is proposed to reduce the effect of clouds. A plug-and-play Interactive Attention Sum-Max fusion module (IASM), is thus constructed to interact with features from multi-modal images. Moreover, multi-path IASM is designed to mix multi-modal features from backbones. Finally, the fused features are sent to the neck and head of MIN for regression and classification. Extensive experiments are carried out on the Fused Cloudy Aircraft Detection (FCAD) dataset that is constructed, and the results show the efficiency of MIN in identifying aircraft under clouds with different thicknesses.Compared with the single-source model, the multi-source fusion model MIN is improved by more than 20 % , and the proposed method outperforms the state-of-the-art approaches.

1. Introduction

Aircraft identification in satellite-borne optical remote-sensing imagery has long been playing an important role in military and civil applications. Optical images can provide rich edges, textures, and color information of aircraft, as shown in Figure 1a. Therefore, aircraft can be accurately identified from optical images on cloudless days. However, reports on global cloud data from the international satellite cloud climatology project-flux data (ISCCP-FD) show that, more than 66% of the earth’s surface area is often covered with clouds [1]. Due to the short electromagnetic wavelength of optical sensors, they cannot penetrate clouds and acquire the information of ground objects under clouds, haze, and other low-visibility climatic conditions.There has been rapid development of object detection in computer vision, such as Once learning [2], YOLO [3], SSD [4], Vision Transformer [5] and SWIN Transformer [6]. Meanwhile, there are some works on optical image aircraft detection [7,8,9,10,11], but most of them focus on the cloudless image. For the aircraft identification of images with cloud cover, especially thick clouds, there is a remarkable degradation of accuracy.
In order to improve the detection accuracy of optical imagery with clouds, works use key points to identify occluded aircraft [12,13,14,15,16], and some works make efforts at cloud removal [17,18,19,20,21,22]. In order to evaluate the thickness of cloud layers, some works on cloud detection and removal [23,24,25,26,27,28] are also proposed. However, these algorithms can only be applied to objects covered with thin clouds. When there are thick clouds in images, it is challenging to accurately detect aircraft.
Synthetic Aperture Radar (SAR) can remotely map the reflectivity of objects or environments through the reception of electromagnetic waves emitted by the radar. An antenna receives a portion of the backscattered energy from objects for SAR imaging, and the area under the cloud can be illuminated by microwave radiations. However, as shown in Figure 1b, compared to optical images, SAR images have relatively lower resolution, and lack the color and texture information of objects. Moreover, complex scattering characteristics of aircraft are discreteness and infeasibility of transfer learning from optical networks [29]. There are remarkable speckle noises in SAR images and the scattering features of the aircraft are not easily extracted. The scattering mechanisms of the targets could be easily influenced by the surroundings. Although some works have tried to utilize SAR images for aircraft detection [29,30,31,32,33,34], the detection accuracy is still low when compared with optical images. Moreover, it is difficult to recognize various types of aircraft from SAR images. Consequently, it is still challenging and significant to identify aircraft covered with clouds, especially thick clouds.
Fusion of optical and SAR images provides an approach for accurately identifying aircraft under clouds. Nowadays, optical- and SAR-image fusion has been investigated for building detection and disaster prediction [35,36,37,38,39]. Most of these works adopt feature-level fusion [40,41,42,43,44,45] and decision-level fusion [46,47]. For example, Qin et al. [46] used saliency maps and single-class support vector machine to initially detect candidate aircraft, and then recognize objects from the combinational features of the multi-modal images. Spröhnle et al. [47] used optical and SAR images to, respectively, detect refugee camps and then fuse the detection results according to some decision rule. Since there are few public datasets for optical- and SAR-image fusion, there is relatively little research on this topic, especially for cloud-obscured object identification.
In this paper, a Multi-path Interactive Network (MIN) is proposed for detecting and recognizing aircraft with cloud cover, via the fusion of optical and SAR images. First, features are extracted from optical and SAR images separately by two convolution backbones of Resnet-34. Second, a piecewise residual fusion strategy is proposed to reduce the effect of clouds. A plug-and-play Interactive Attention Sum-Max fusion module (IASM), is thus constructed to interact with features from multi-modal images. Moreover, multi-path IASM is designed to mix multi-modal features from backbones. Finally, the fused features are sent to the neck and head of MIN for regression and classification. Extensive experiments are conducted on the cloudy image dataset, and the results show the efficiency of MIN for identifying aircraft under clouds with different thicknesses. The main contributions of our work can be summarized as:
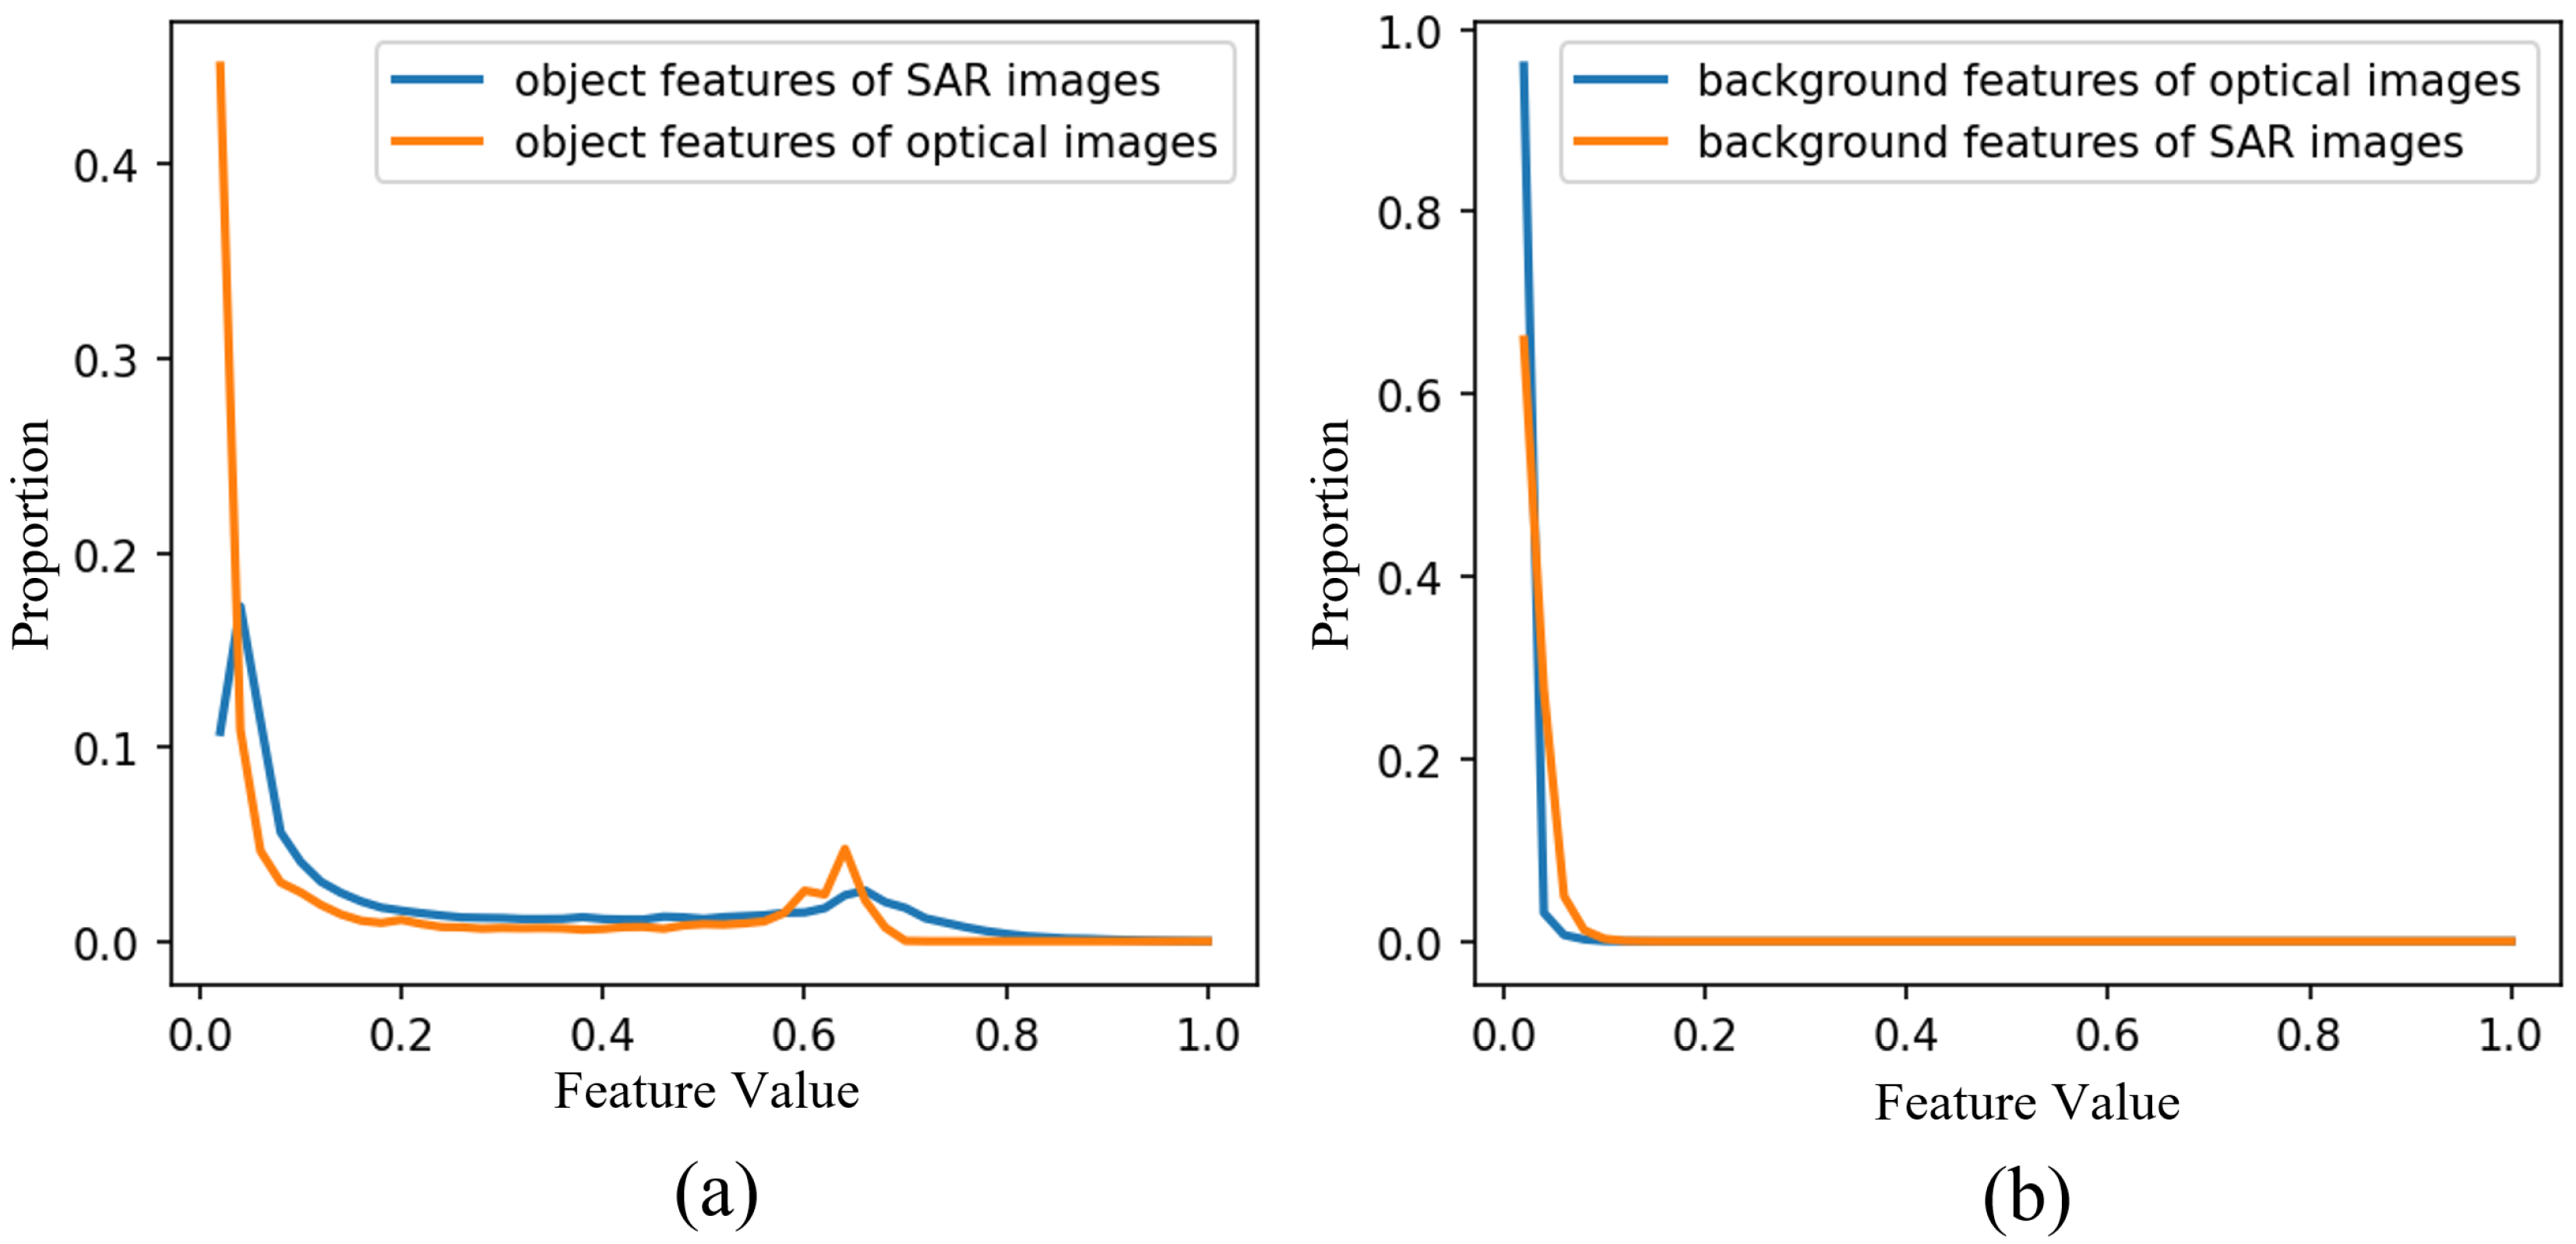
  • A residual Sum-Max fusion strategy is proposed to reduce the effect of clouds. A new plug-and-play Interactive Attention Sum-Max Fusion Module (IASM) is thus constructed for synthesizing task-related features from multi-module images.
  • A deep Multi-path Interactive Network (MIN) is proposed for aircraft identification with optical and SAR images by employing multi-modal IASM in the deep network. It can accurately identify aircraft with clouds, especially thick clouds.
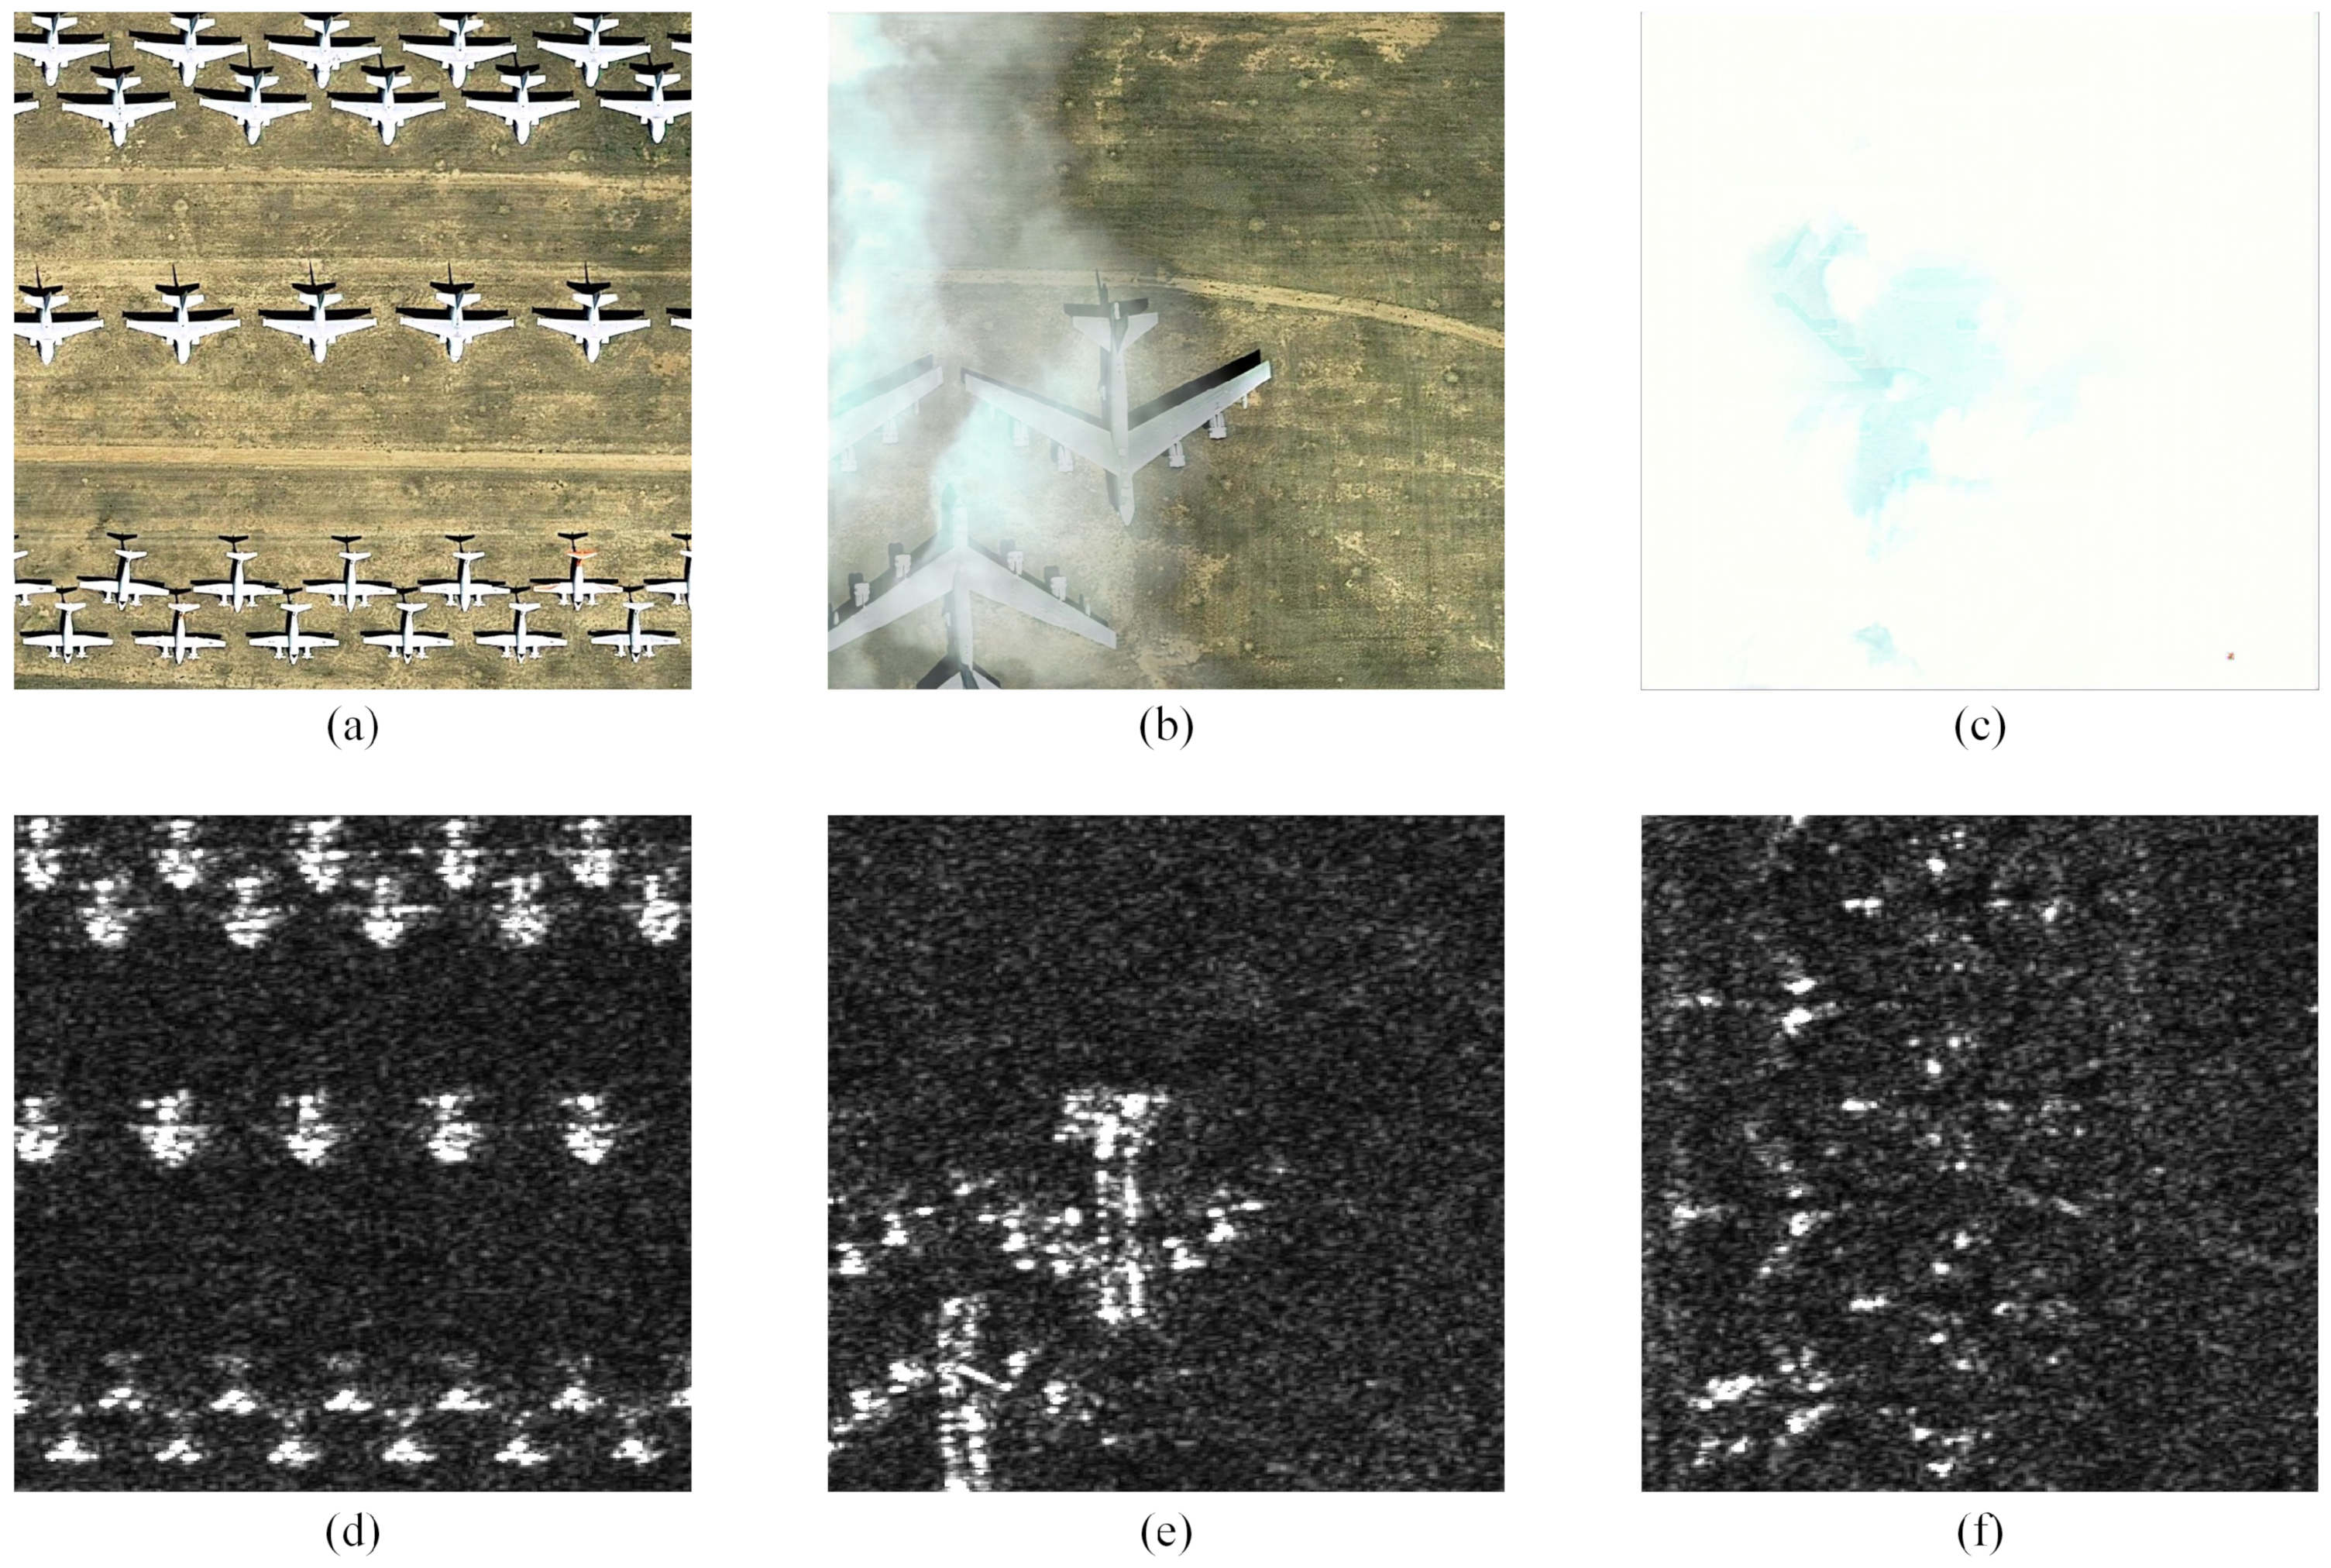
  • A new validation dataset consisting of 4720 scenes, named Fused Cloudy Aircraft Detection (FCAD), is constructed to evaluate the MIN performance by average accuracy.
The rest of this paper is organized as follows: Section 2 elaborates on our proposed MIN structure and the IASM module. Section 3 shows the experimental settings and results. Finally, the conclusions are drawn in Section 4.

2. Methodlogy

In this section, the overall structure of MIN and the detailed operations of several blocks are described.

2.1. Overall Structure of MIN

The structure of MIN is shown in Figure 2. The backbone of MIN is ResNet-34 [48], which is composed of five convolution layers. The first three convolution layers of ResNet-34 are utilized to learn features of optical and SAR images (denoted as C o n v X O and C o n v X S , respectively). Figure 2 shows the optical stream (purple part) and the SAR stream (green part). The features extracted from the two streams are sent to our constructed IASM for fusion (denoted “I”, colored with blue in Figure 2). Then the fused features are sent to the last two convolution layers (yellow part) of ResNet-34 (denoted C o n v 4 , C o n v 5 ). Next the extracted features are sent to the neck Feature Pyramid Network (FPN) [49] to obtain new features from the C o n v 5 to the C o n v 2 . An IASM + Up sampling module (denoted as “F” colored with pink in Figure 2) is employed for further feature enhancement. Finally, the enhanced features are sent to the prediction module (pink part) for classification and regression.
Figure 3 shows the structure of IASM + Up sampling, where C o n v 3 O and C o n v 3 S features are sent to IASM for feature fusion, and combined with Up sampling to obtain C o n v 3 . Similarly, C o n v 2 O and C o n v 2 S features are sent to IASM for feature fusion and the fused features are sent to the IASM + Up sampling module for feature enhancement to obtain C o n v 2 . In the following, we will describe the IASM in detail.

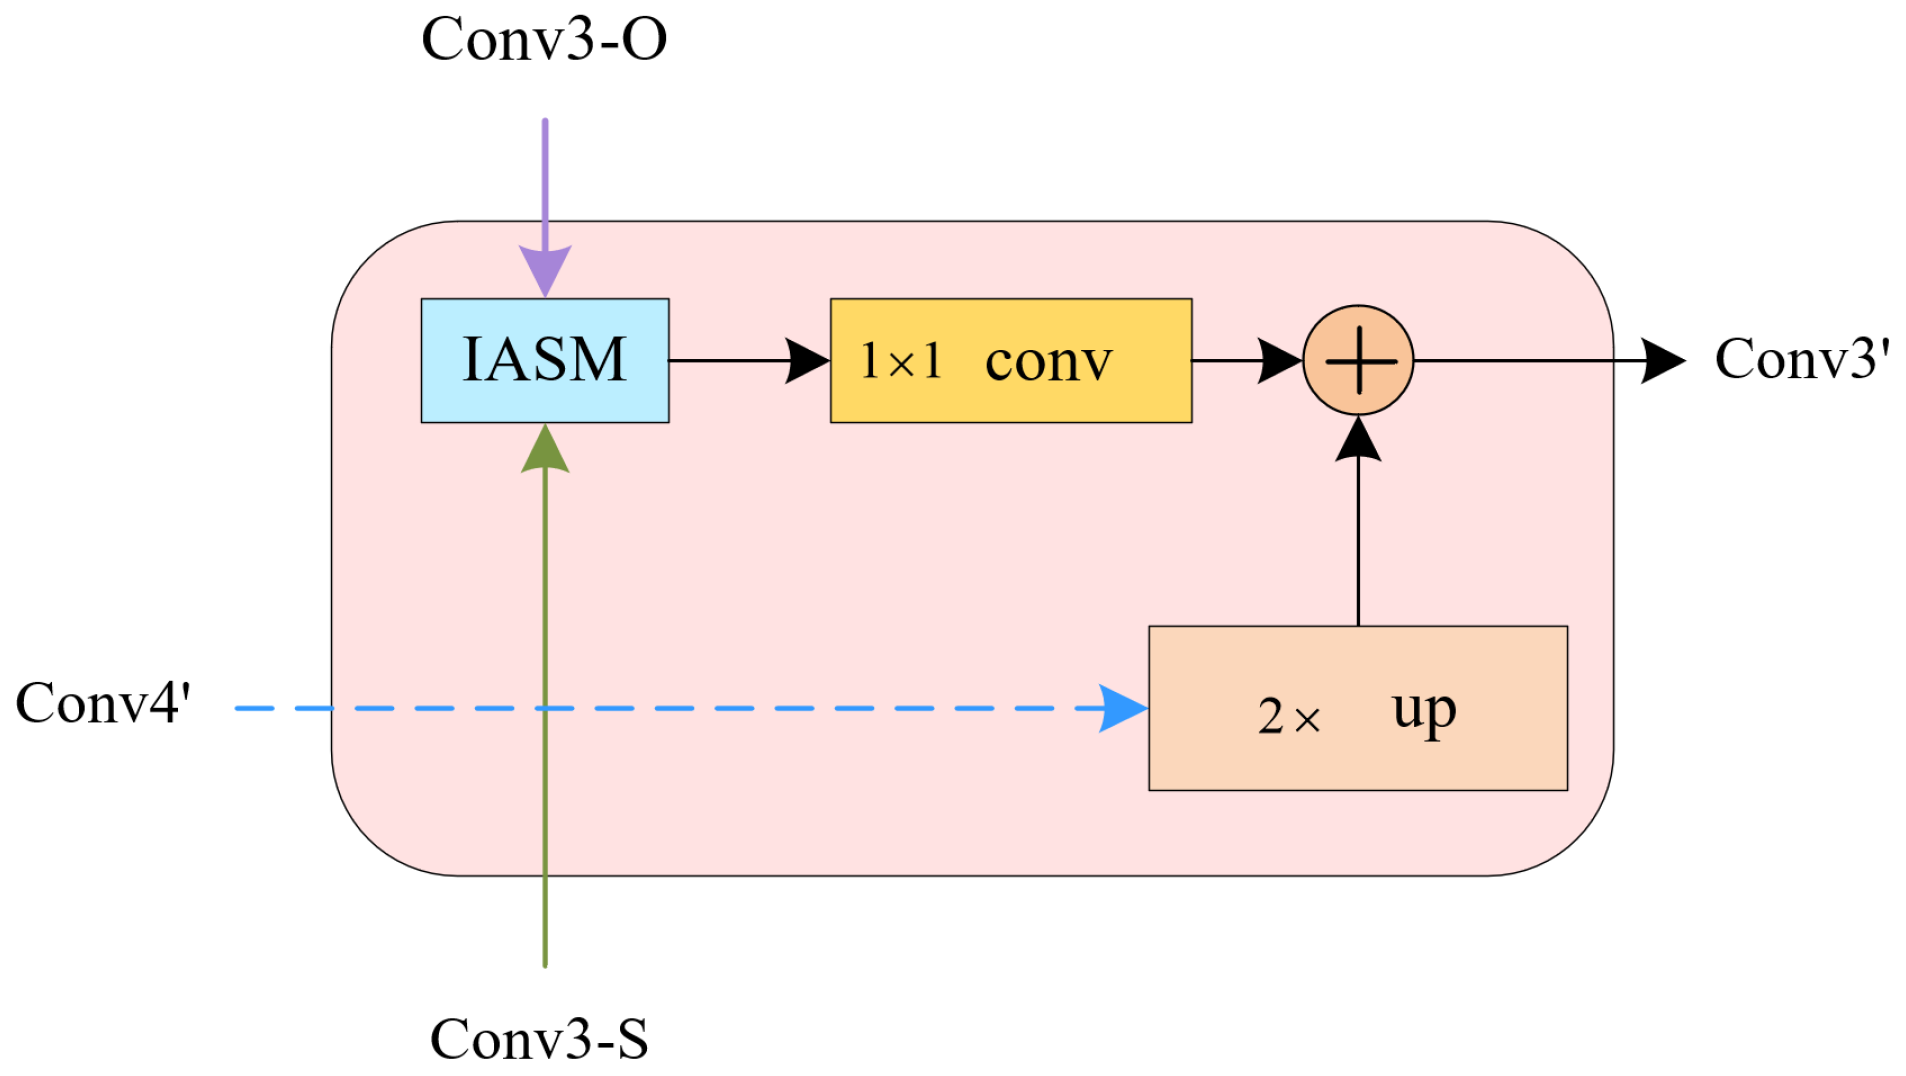
2.2. Residual SM (Sum-Max) Fusion

The feature fusion rule is very crucial in MIN. In order to synthesize task-related features from multi-module images, we advance a new residual Sum-Max fusion rule. In the available works on DNN-based multi-modal image fusion, several feature-level fusion strategies have been proposed, including Sum Fusion, Max Fusion, and Concat Fusion.
Sum Fusion: This rule calculates the sum of features of optical image o and SAR image s, at the same channel c, width w and height h. It can be described as
y c , w , h sum = o c , w , h + s c , w , h
where c ( 1 , 2 , , C ) , w ( 1 , 2 , , W ) , h ( 1 , 2 , , W ) and C, W, H represent the number of channels, width and height of image features, respectively. It can combine the features of optical and SAR streams together to generate more robust features.
Max Fusion: This rule takes the maximum value in the optical features o and the SAR features s at the same channel c, width w and height h. The formulation of Max Fusion is
y c , w , h max = max o c , w , h , s c , w , h .
Under this rule, more distinct features in the optical and SAR channels are selected to generate the synthetic features.
Concat Fusion: This rule concatenates the optical features o and SAR features s at the same spatial locations ( w , h ) across different channels. It can be described as
y c , w , h c a t = o c , w , h y C + c , w , h c a t = s c , w , h
where y * cat R 2 C × W × H . Their correlation is then learned in the subsequent convolutional layer,
y c , w , h c a t = conv y 2 c , w , h c a t .
Several works [50,51,52] have compared these strategies and indicated that Sum Fusion presents relatively better results. However, Sum Fusion has poor performance when optical images have thick clouds for reducing the object features. Because clouds in the optical image often present bright or salient features, Max Fusion always adopts the cloud features in the fusion. Concat Fusion is a neutral rule, but could not enhance the object information in some senses. Recent studies on the human brain have indicated that human cognition is complex functions that involve several parts of the cerebral cortex [53]. A substantial body of literature has indicated that about 50% of the neurons of the brain deal with single-modality information, while 20–30% of the neurons deal with information of two or three modalities. For most modality pairings and perceptual tasks, humans behave in accordance with the optimal prescription for sensory integration via hybrid fusion rules [53]. Inspired by this principle of the human brain, in our work we propose a new residual SM (Sum-Max) Fusion rule.
Residual SM Fusion: The residual SM Fusion calculates the sum or maximum of residual optical and SAR features at the same channel c, width w and height h. First, the average features of each channel of multi-modal features are calculated by
o c , 1 , 1 mean = mean w , h o c , w , h s c , 1 , 1 mean = mean w , h s c , w , h
where mean w , h { · } calculates the average feature vector in each channel. Second, the differences or residuals between the expanded average features and original features are calculated,
o c , w , h r e s = o c , w , h p o c , 1 , 1 mean s c , w , h r e s = s c , w , h p s c , 1 , 1 mean
where p { · } represents a reproduction operation, and a the c × 1 × 1 feature is reproduced and expanded to c × w × h . Third, the mean of the optical feature and SAR feature is calculated
f c , w , h mean = p mean w , h o c , w , h + s c , w , h 2 .
After feature normalization, image features are limited within [ 0 , 1 ] . In aircraft identification, the feature value of the object is always larger than that of the background area. Figure 4a,b plots the statistical histogram of object and background areas, respectively. From them we can observe that the values of most object features are near 0.6, while the features in the background area are near 0.1. If we subtract this mean in formula from the object features and background features o c , w , h , s c , w , h , the remainder o c , w , h r e s , s c , w , h r e s will take a positive value and a negative value, respectively.
Consequently, we split o c , w , h r e s and s c , w , h r e s into the following situation in formula to obtain the residual SM Fusion rule,
y c , w , h S M = f c , w , h mean + o c , w , h r e s + s c , w , h r e s , if : o c , w , h r e s × s c , w , h r e s 0 f c , w , h mean + max o c , w , h r e s , s c , w , h res , if : o c , w , h r e s × s c , w , h r e s < 0
where y * S M R C × W × H . The first case indicates that the multi-modal images either detect the objects or miss the objects. In this case, the Sum Fusion rule is performed on the residuals to enhance the objects or backgrounds. The second case indicates that only the single-modal sort detects the objects.
In this case, the multi-modal features should be carefully selected to enhance the objects, so the Max Fusion rule is adopted to fuse the residuals. Conducting an analysis, we will find that this piecewise residual SM Fusion rule is applicable in both cloudless and cloudy scenes. In cloudless scenes, this rule can accumulate the features of optical and SAR images, which can help to enhance objects. In cloudy scenes, the features from the optical image and the SAR image can interfere with each other for compensation to capture objects. Figure 5 shows the features of the original multi-modal images and the fused images by different methods in the cloudless, thin cloud and thick-cloud scenes, respectively. From Figure 5, we can observe that Sum Fusion suppresses optical features in cloudless scenes, Max Fusion cannot fuse more obvious features when both optical features and SAR are strong, residual SM Fusion can reduce the negative influence of optical features in the cloudy scene. Compared with other fusion rules, it can enhance the features of aircraft. Their comparative evaluation is also provided in Section 3.

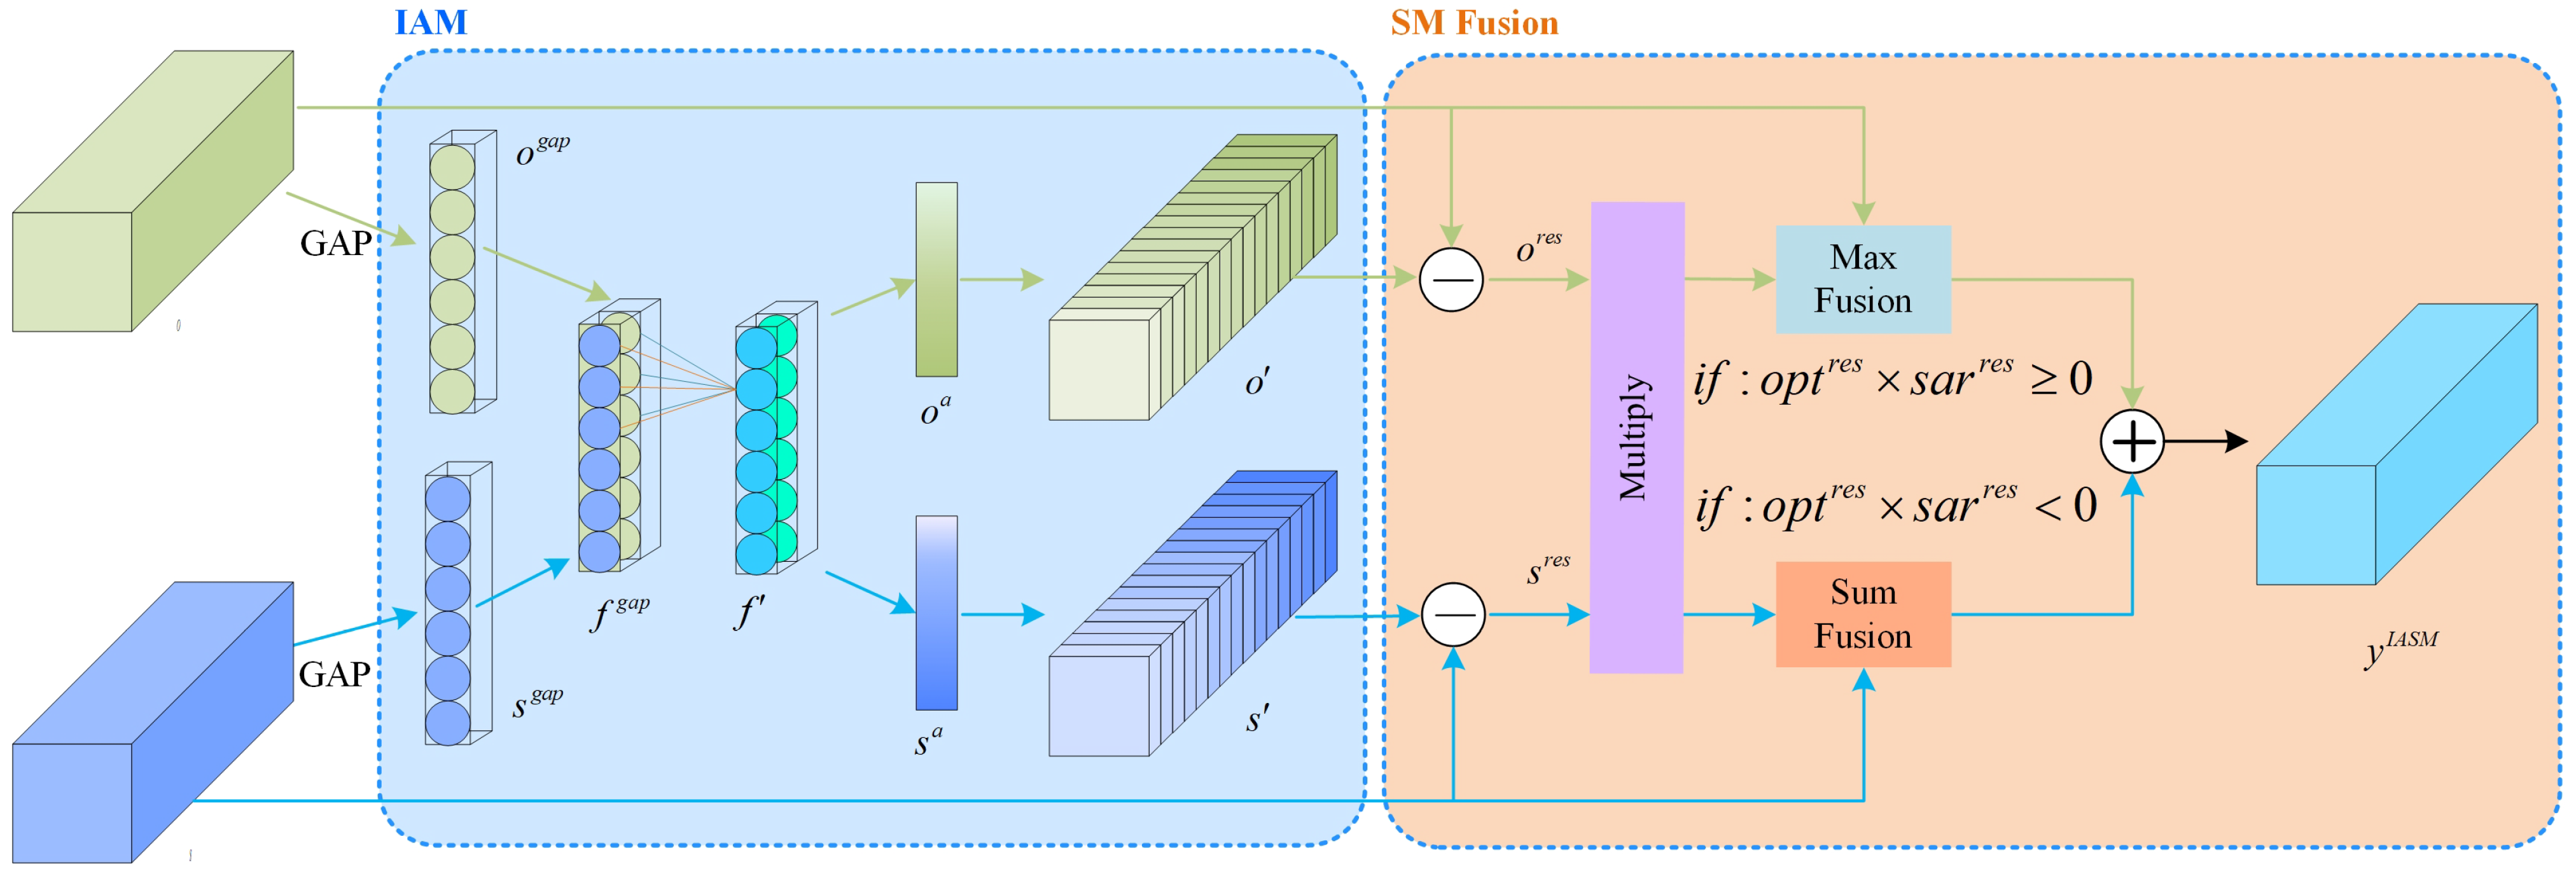
2.3. IASM (Interactive Attention Sum-Max Fusion Module)

In residual SM Fusion, there is a clear distinction between the object and the background. However, the fusion results rely heavily on the distinction between the object and background. In this section, inspired by ECA [54], an Interactive Spatial Attention Module (IASM) is built to fuse features from multi-modal images. The IASM structure is shown in Figure 6, which consists of two sub-modules: Interactive Attention Module (IAM) and residual SM Fusion modules. IAM can implement the information exchange between the optical and SAR image features, and SM mainly fuses optical and SAR features.
IAM integrates optical features and SAR features by interacting with the channel attention of optical features and SAR features. IAM can implement the information exchange between the optical and SAR image features. It can be described as follows:
o c , 1 , 1 g a p = f g a p ( o c , w , h ) s c , 1 , 1 g a p = f g a p ( s c , w , h )
where f g a p ( · ) refers to the global average pooling. Next, the optical and SAR features are concatenated
f c , 2 , 1 g a p = f c a t o c , 1 , 1 g a p s c , 1 , 1 g a p
This combines the pooled feature tensors in the channel. Then, the concatenated features are compressed,
f c , 2 g a p = f c o m f c , 2 , 1 g a p
where f c o m ( · ) refers to the tensor dimensionality compression. One-dimensional convolution is then cast on the compressed feature
f c . 2 = conv f c . 2 g a p .
Then, we split the fusion features into two groups
o c , 1 a s c , 1 a = f sp f c , 2
where f s p ( · ) refers to the separate operation of one tensor feature to two tensors according to the channel. The first channel contains optical features, and the second channel contains SAR features,
o c , w , h = f exp o c , 1 a s c , w , h = f exp s c , 1 a .
Next, similar to formula (6), we calculate the residual features
o c , w , h r e s = o c , w , h o c , w , h s c , w , h r e s = s c , w , h s c , w , h
for a fusion via the residual SM Fusion rule in Section 2.2. By the above operation, the constructed IASM fuses features to interact in not only different channels from one sensor, but also multi-modal sensors. The fused feature is obtained according to formula (8).

2.4. Other Parts

FPN is a top-down architecture with lateral connections, and is used for building high-level semantic features at all scales. Therefore, FPN is used as the neck of our proposed MIN. It shares convolution features of the image with the detection network, thus enabling nearly cost-free region proposals. In our proposed MIN, the Region Proposal Network (RPN) [55] is used as the head of the network, which is trained end to end to generate high-quality region proposals. In the network training, cross-entropy loss and L1 loss are adopted as the classification loss and regression loss, respectively.

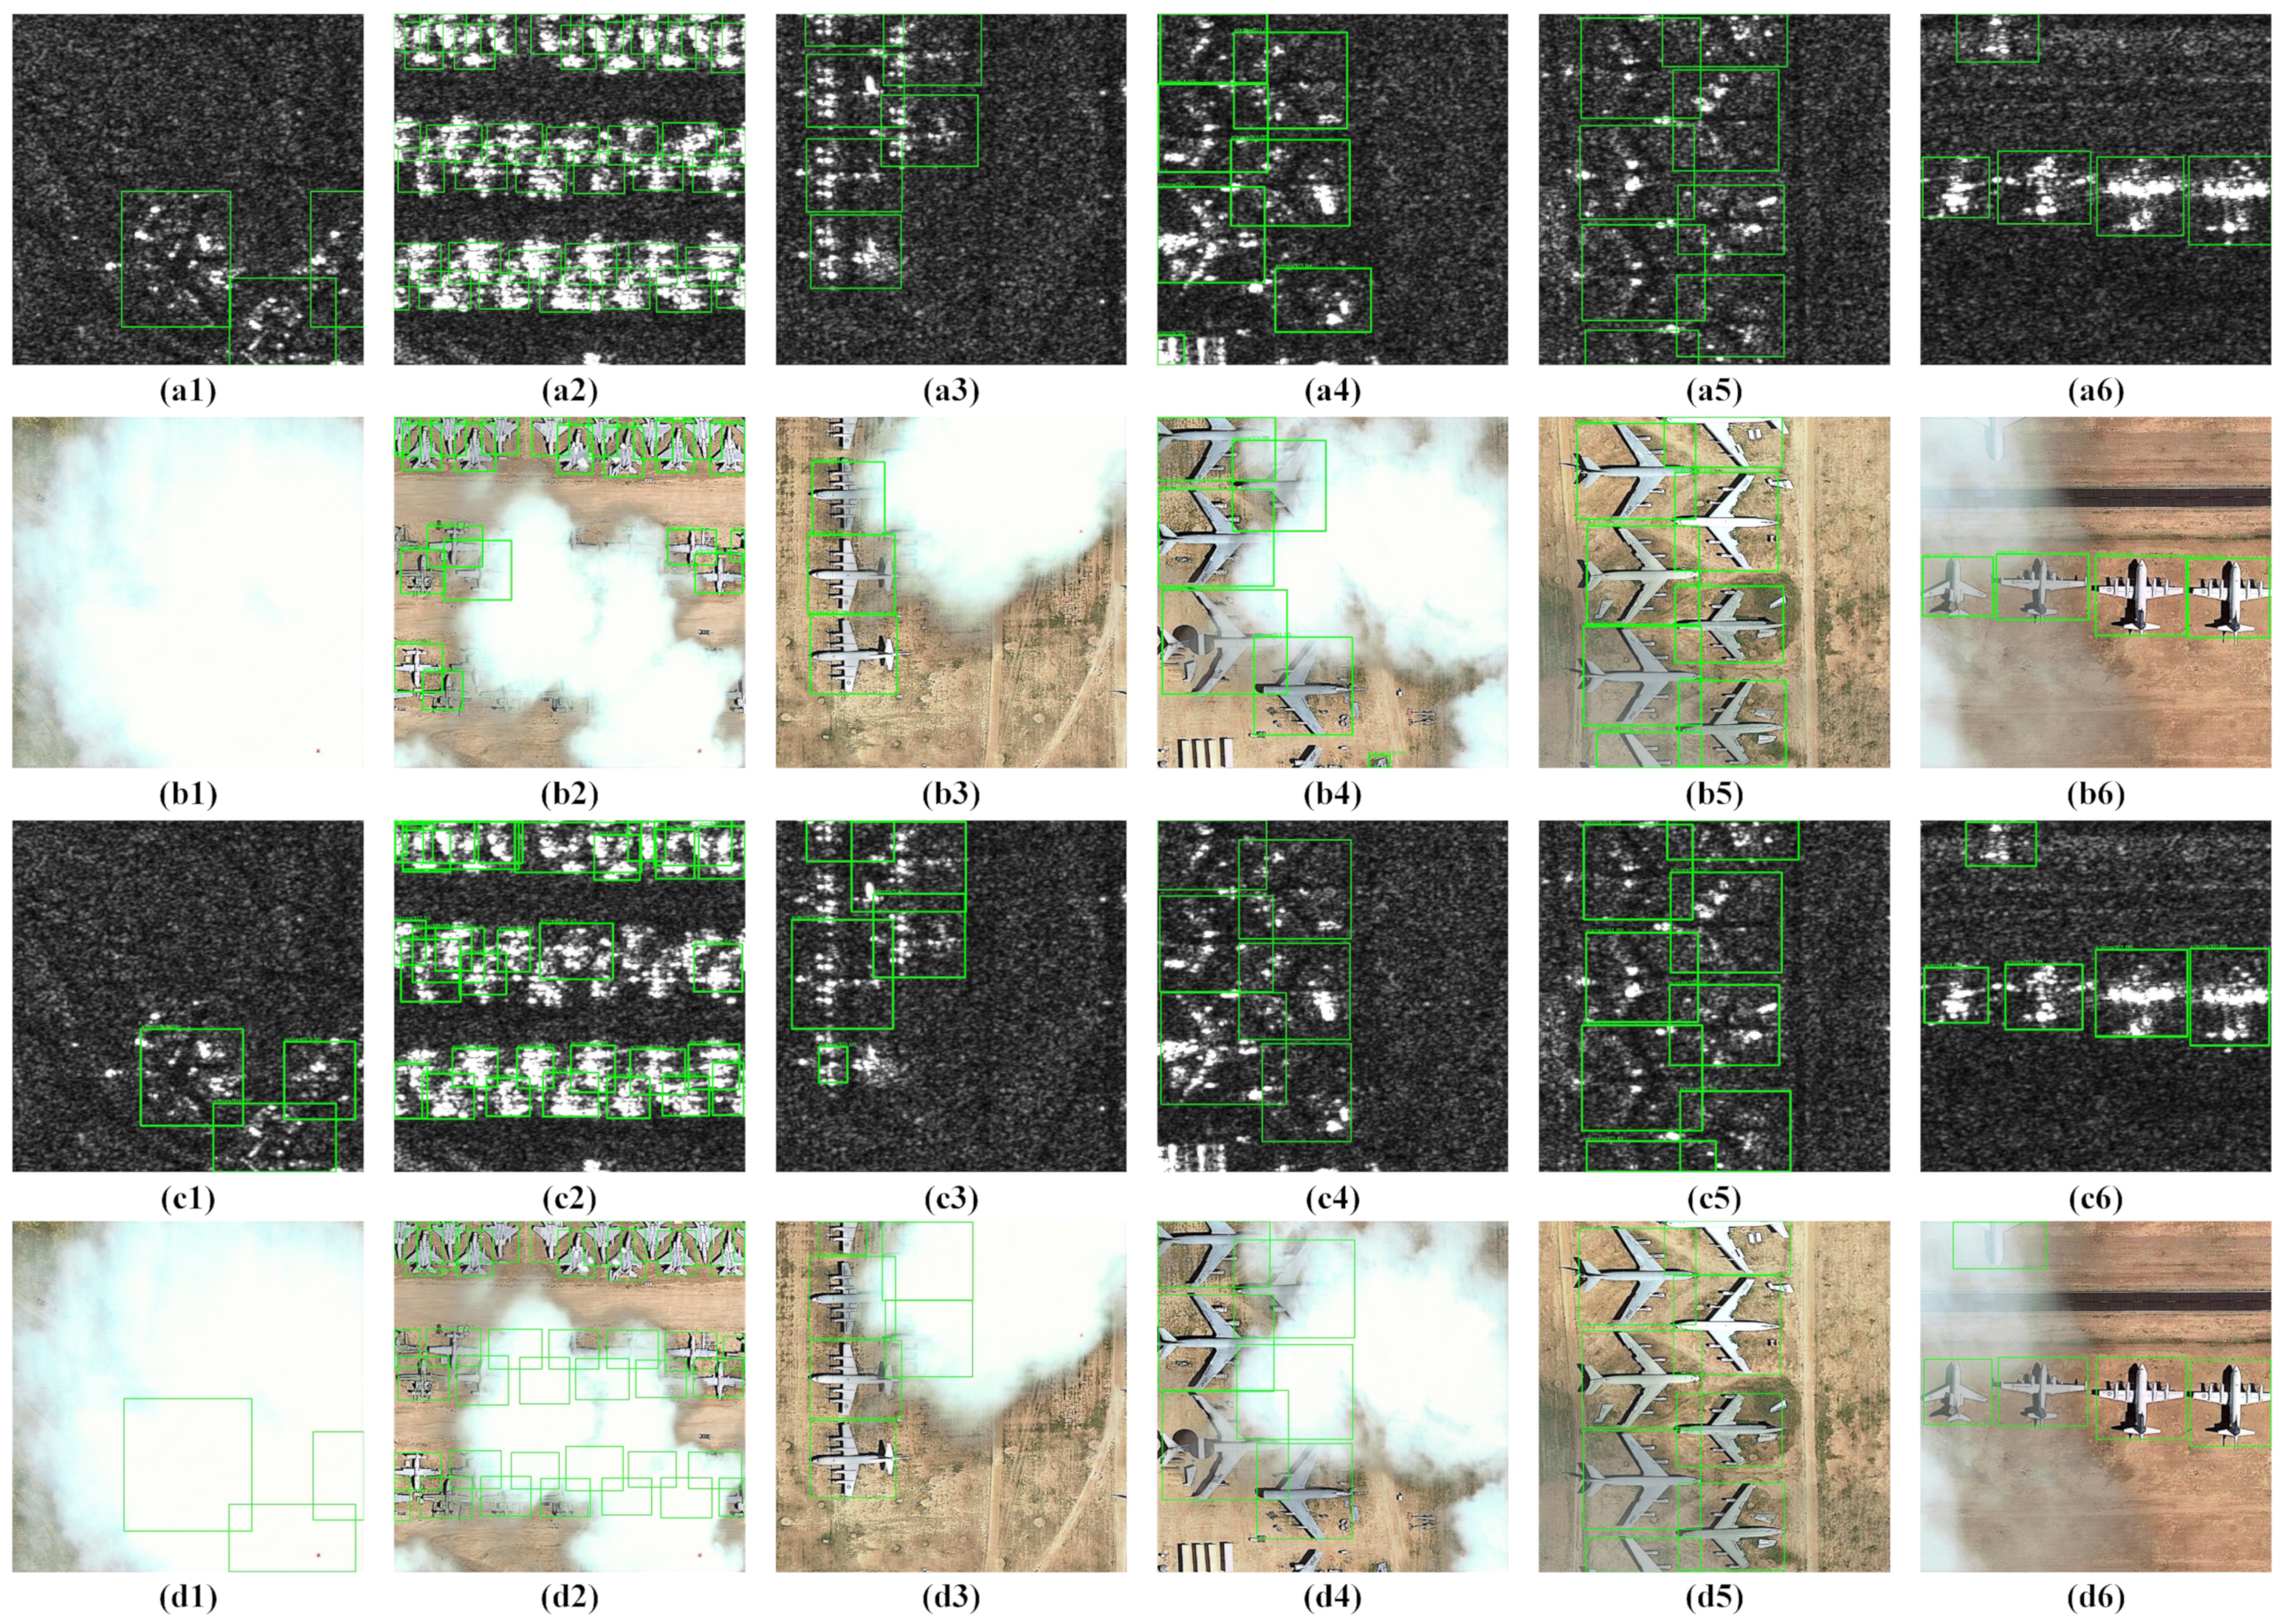
3. Experimental Results and Analysis

3.1. Datasets and Training Details

In this section, a new validation dataset consisting of 4720 scenes, named Fused Cloudy Aircraft Detection (FCAD), is constructed to evaluate the MIN performance by average accuracy. It contains the optical images from Google Earth and the SAR images from the GF-3 satellite of China. Optical images are three-channel images with a resolution of 0.12 m. SAR images are single-channel images with a resolution of 1 m. The image annotation goes through the following steps. First, we register the optical image with the SAR image. At the same time, SAR images are resized to the same size as the optical image and expanded from a single channel to three channels. Next, aircraft are marked in optical images and SAR images. Then, the images are cropped according to the size of the optical image, and an image pair with the same field of view as the optical image and the SAR image is obtained. Finally, the images are divided into 4014 pairs of training images, and 706 pairs of test images. Example images of FCAD dataset are shown in Figure 7. The optical image (Figure 7a) and the SAR image (Figure 7d) in the cloudless scene; the optical image (Figure 7b) and the SAR image (Figure 7e) in the thin-cloud scene; the optical image (Figure 7c) and the SAR image (Figure 7f) in the thick cloud scene.
The proposed MIN is implemented based on the mmdetection architecture [56]. In the training, Stochastic Gradient Descent (SGD) with a momentum of 0.9 is adopted. The initial learning rate is set as 0.001. All the experiments were performed on the Ubuntu 18.04 operating system and run in NVIDIA RTX 3090. In addition, all experiments in this paper are repeated to calculate the average value of the guidelines.

3.2. Experiments on Single-Modal and Multi-Modal Images

In this section, we evaluate the MIN performance by average accuracy and compare it with that of single optical image and single SAR image. Faster R-CNN [49] is adopted to deal with single-modal image, and the backbone of Faster R-CNN is single-stream ResNet-34. The remaining modules of Faster R-CNN are the same as those of MIN. The optical extraction feature branch and the SAR feature extraction branch use Faster R-CNN (O) and Faster R-CNN (S) trained weights separately.
The results in the cloudless scene, thin-cloud scene and thick-cloud scene are compared and shown in Table 1. Because there is no cloud in the SAR image, we only calculate the total accuracy. From the table, we can observe that the fusion of optical and SAR image can remarkably enhance the aircraft identification results in both scenes with thin clouds and thick clouds. The visual detection results are shown in Figure 8, where Figure 8(a1–a6) are the Ground Truth (GT), Figure 8(b1–b6) are the optical images and Figure 8(c1–c6) are the SAR images. Figure 8(d1–d6) show the fusion results of our proposed MIN. Figure 8(b1–b6) are the results using single optical images. From Figure 8(b5,b6) we can observe that using single optical image has better results in the cloudless scenes, the evaluation index of A P 50 reaches 0.887. However, its performance degrades on cloudy days, especially with thick clouds. Figure 8(b1–b4) indicate that the optical image cannot detect the object under the thick cloud. A P 50 drops to 0.807 in thin clouds and drops to 0.352 in thick clouds. SAR can penetrate clouds to obtain images without clouds, but the resolution of SAR images is relatively low, which will also influence the detection of aircraft. As shown in Figure 8(c2), in SAR images, the adjacent aircraft and small aircraft are prone to being misclassified. As shown in Figure 8(d1–d4), the identification accuracy can be improved by the fusion of optical and SAR images. For aircraft occluded by thick clouds, the evaluation index of A P 50 can also reach 0.726. From Figure 8(d1–d6) we can observe that using our proposed MIN to detect aircraft by the optical- and SAR-image fusion, we obtain the best results in the cloudless, thin-cloud and thick-cloud scenes, respectively; the evaluation index of A P 50 reaches 0.925 in different cloud-thickness scenes. Meanwhile, this can be seen from the observation in Table 1. Although the single-source target detection inference time is shorter and Frames Per Second (FPS) is dropped, the A P 50 drops by more than 20%.

3.3. Experiments on Multi-Path IASM

In this section, we investigate the construction of Multi-path IASM. Our proposed IASM module is plug-and-play and can be assigned in different levels of deep neural networks. As shown in Figure 9, we analyze six kinds of fusion positions. Conventional data fusion is divided into Input Fusion, Early Fusion, Halfway Fusion and Late Fusion, corresponding to the first, second, fourth and sixth stages, respectively. Figure 2 employs Late Fusion to perform fusion detection on images. The identification results of different sizes of aircraft (small and large) are also calculated separately, denoted as A P M and A P L , respectively. In terms of evaluation indicators, we mainly use COCOAPI indicators as our reference. The size of the aircraft is not smaller than 32 × 32 in the image, so there are no A R S and A P S in the evaluation index. A R 1 , A R 10 and A R 100 are the average recall given 1 detection, 10 detections and 100 detections per image, respectively. A P 50 and A P 70 are the average precision with I O U = 0.5 and I O U = 0.7 . A P is the average precision with I O U = 0.5 : 0.05 : 0.95 .
It can be seen from Table 2 that with the increase of fusion stages, the inference time also increases. Input Fusion presents relatively low accuracy with the evaluation index of A P 50 being only 0.902. Compared with Input Fusion, Early Fusion extracts multi-module image features and simply fuses them, and the accuracy rate can be improved, but the evaluation index of A P 50 is only 0.911. Halfway Fusion extracts the features of the optical image and the SAR image in the first three stages of ResNet-34, and merges them together for further identification, the evaluation index of A P 50 is 0.925. Compared with Input Fusion and Early Fusion, Halfway Fusion has relatively high computational complexity and accuracy. Late Fusion fuses optical and SAR images in the five stages of ResNet-34, and then uses IASM to fuse the features of different channels. However, the evaluation index of A P 50 decreases to 0.919. Conducting an analysis, we will find that Halfway Fusion may benefit from the balance between the semantic information and low-level clues, so resulting in the best results among these methods.

3.4. Ablation Experiments

This experiment verifies the influence of designed modules on the performance of MIN, and the results are shown in Table 3. The residual SM Fusion and IAM modules are separately analyzed. Index 1 in Table 3 uses Faster R-CNN to detect aircraft in optical images. Index 2 uses Max Fusion to detect aircraft by optical- and SAR-image fusion. We compare the results with a single optical image.
From the results, we can observe that the introduction of the SAR image can remarkably improve the results in the identification of cloud-occluded aircraft, and the A P 50 index increases by 21.2%. Index 3 uses residual Max Fusion to detect aircraft by optical- and SAR-image fusion. The introduction of residual SM Fusion also has an improvement of 0.7% over the Max Fusion method. Index 4 constructs IASM to fuse optical and SAR images by index 3 and the IAM module. The introduction of IAM has an improvement of 0.4% over the SM Fusion method.

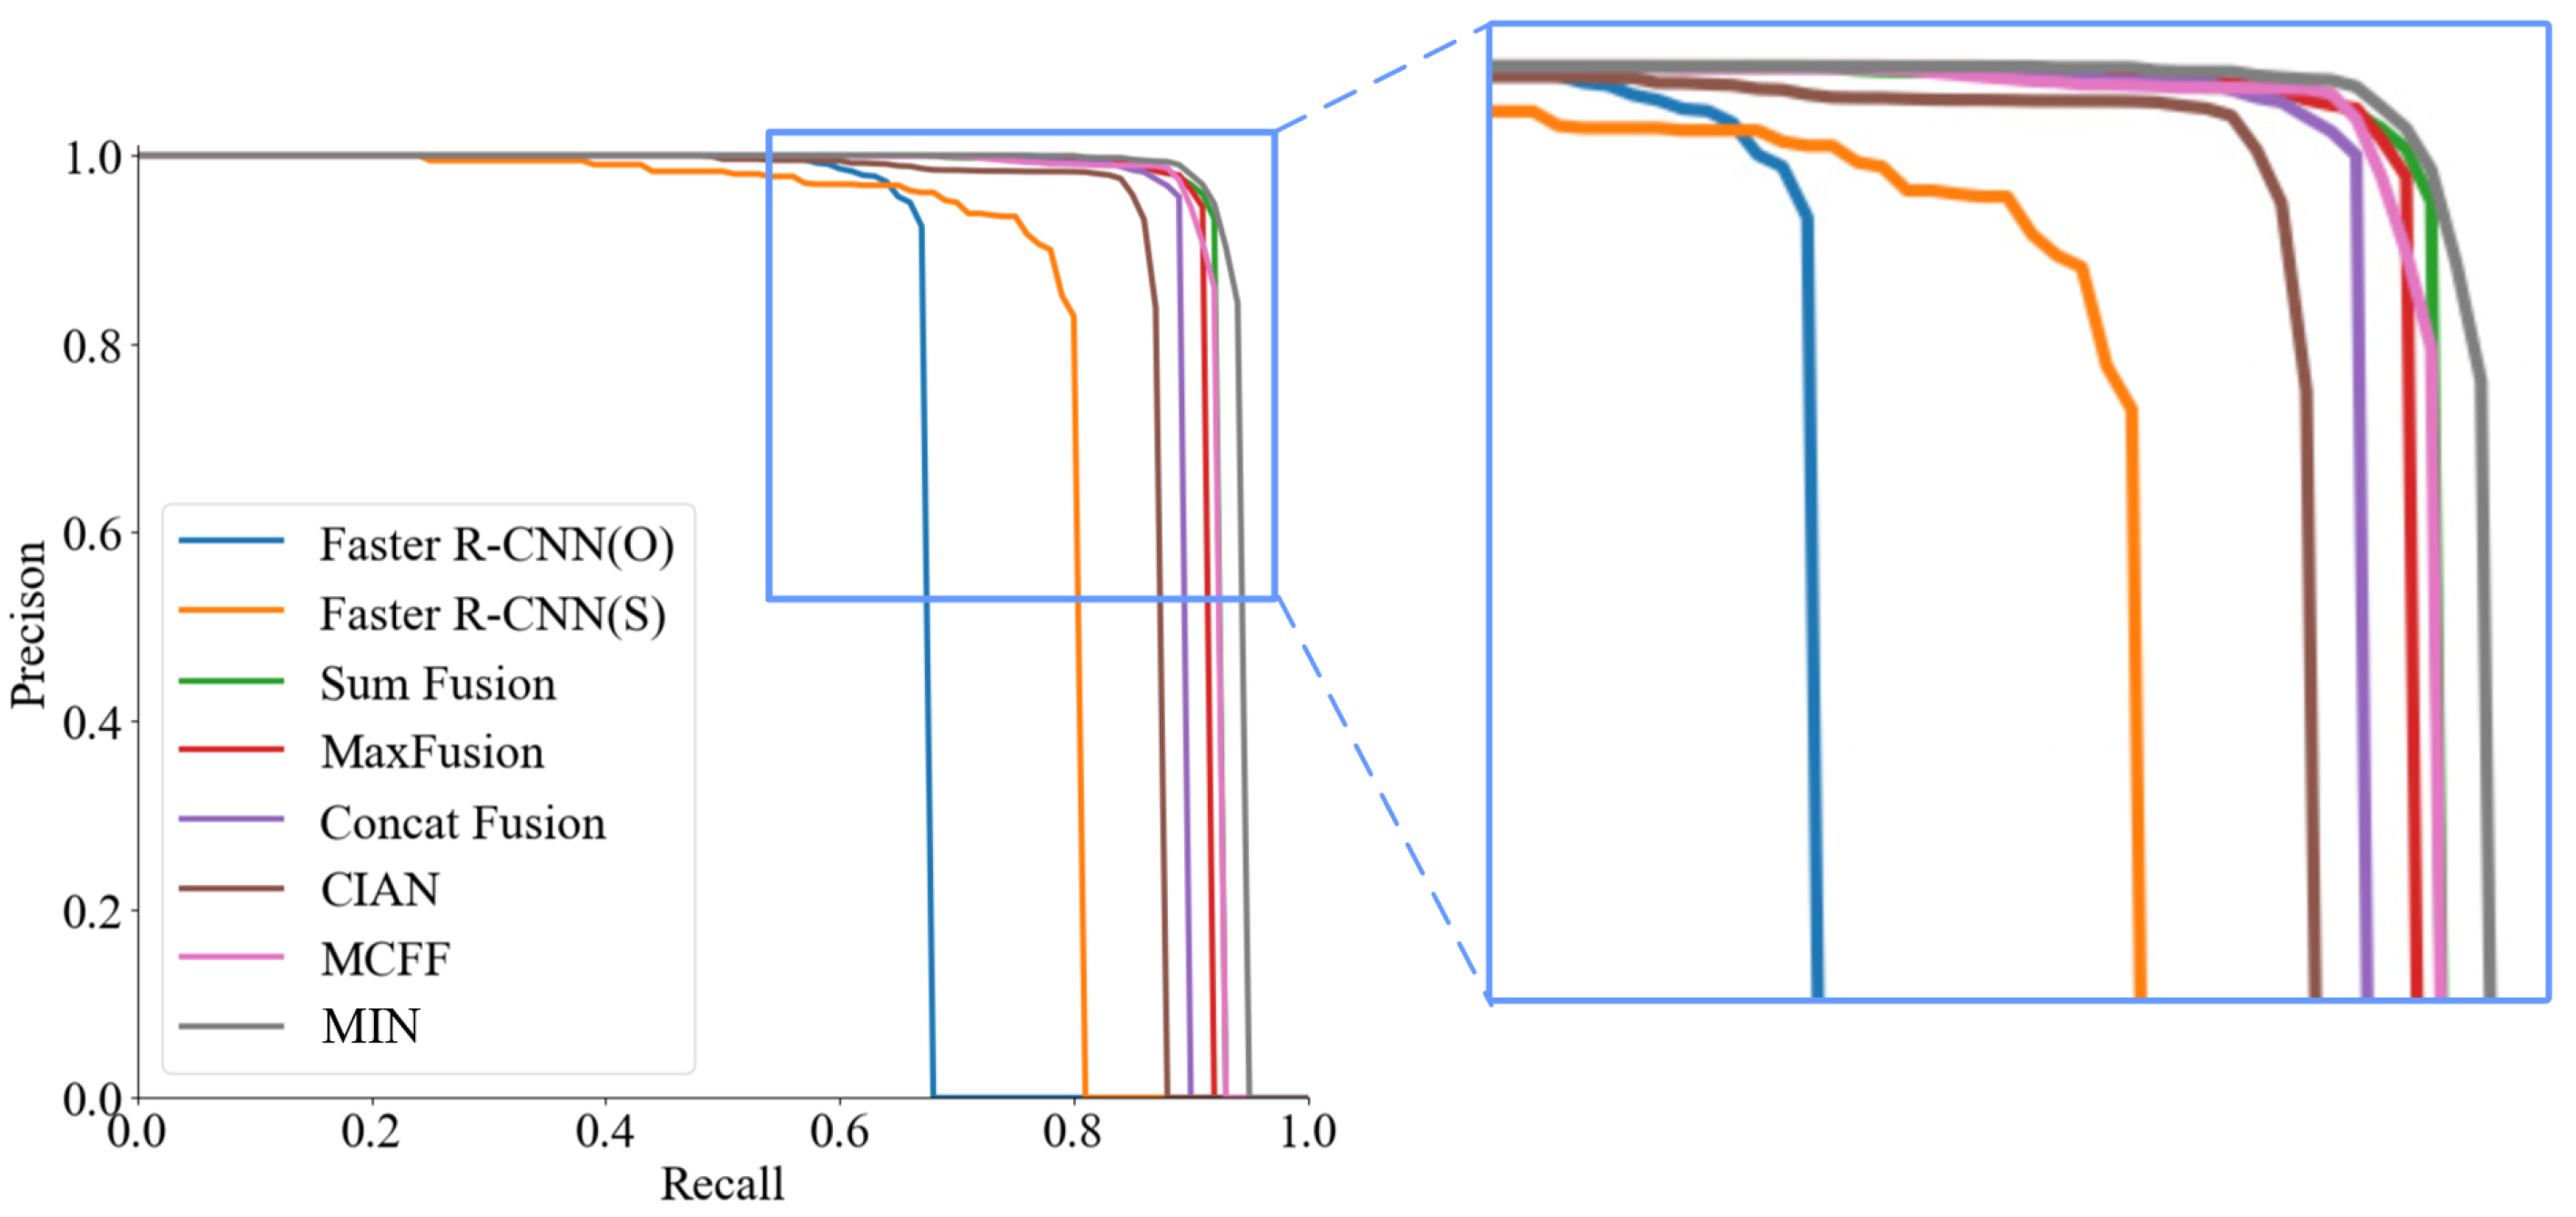
3.5. Comparison with SOTA Methods

In this section, the performance of MIN is investigated and compared with its counterparts and SOTA methods. First, since the Sum Fusion, Max Fusion and Concat Fusion methods are widely used in multi-source fusion object detection methods, we compare the proposed residual SM Fusion with these classic fusion methods. In these methods, the IAM module is not used. Moreover, two attention mechanism-based deep neural networks— CIAN [57] and MCFF [58]—are also used for a comparison.
Methods of different feature fusion detection results are shown in Table 4. The P-R curves of different fusion models are shown in Figure 10. The visual detection results are shown in Figure 11, where Figure 11(a1–a6) are the GT. Figure 11(b1–b6,c1–c6,d1–d6,e1–e6,f1–f6,g1–g6,h1–h6), respectively, show the fusion results of Sum Fusion, Max Fusion, Concat Fusion, MCFF, CIAN, SM Fusion, MIN. From the results, we can observe that compared with other classic fusion approaches, the SM Fusion method proposed in this paper has the best results, at least 0.8% higher than the other three methods in the A P 50 index. Different from the conclusions of previous multispectral pedestrian detection work [43,44,45], Sum Fusion is better than Max Fusion in only A P 50 , and the other indicators are lower than Max Fusion. Concat Fusion has the worst performance among the four fusion methods. The reason for this result is the difference in fusion data sources. The fusion work in this paper is based on optical sensors and radar sensors. Other classic fusion approaches compared are based on RGB cameras and thermal cameras before. SM Fusion outperforms other classic fusion approaches in optical images and SAR image fusion detection.
By comparing the results of CIAN, MCFF, and MIN, it is found that MIN has the best performance. The P-R curves of different fusion models are shown in Figure 10. By comparing the visual detection results and the PR curve, it can be found that the MIN has the best performance. Although the MIN model has a slight increase in inference time, there is a significant improvement in performance.

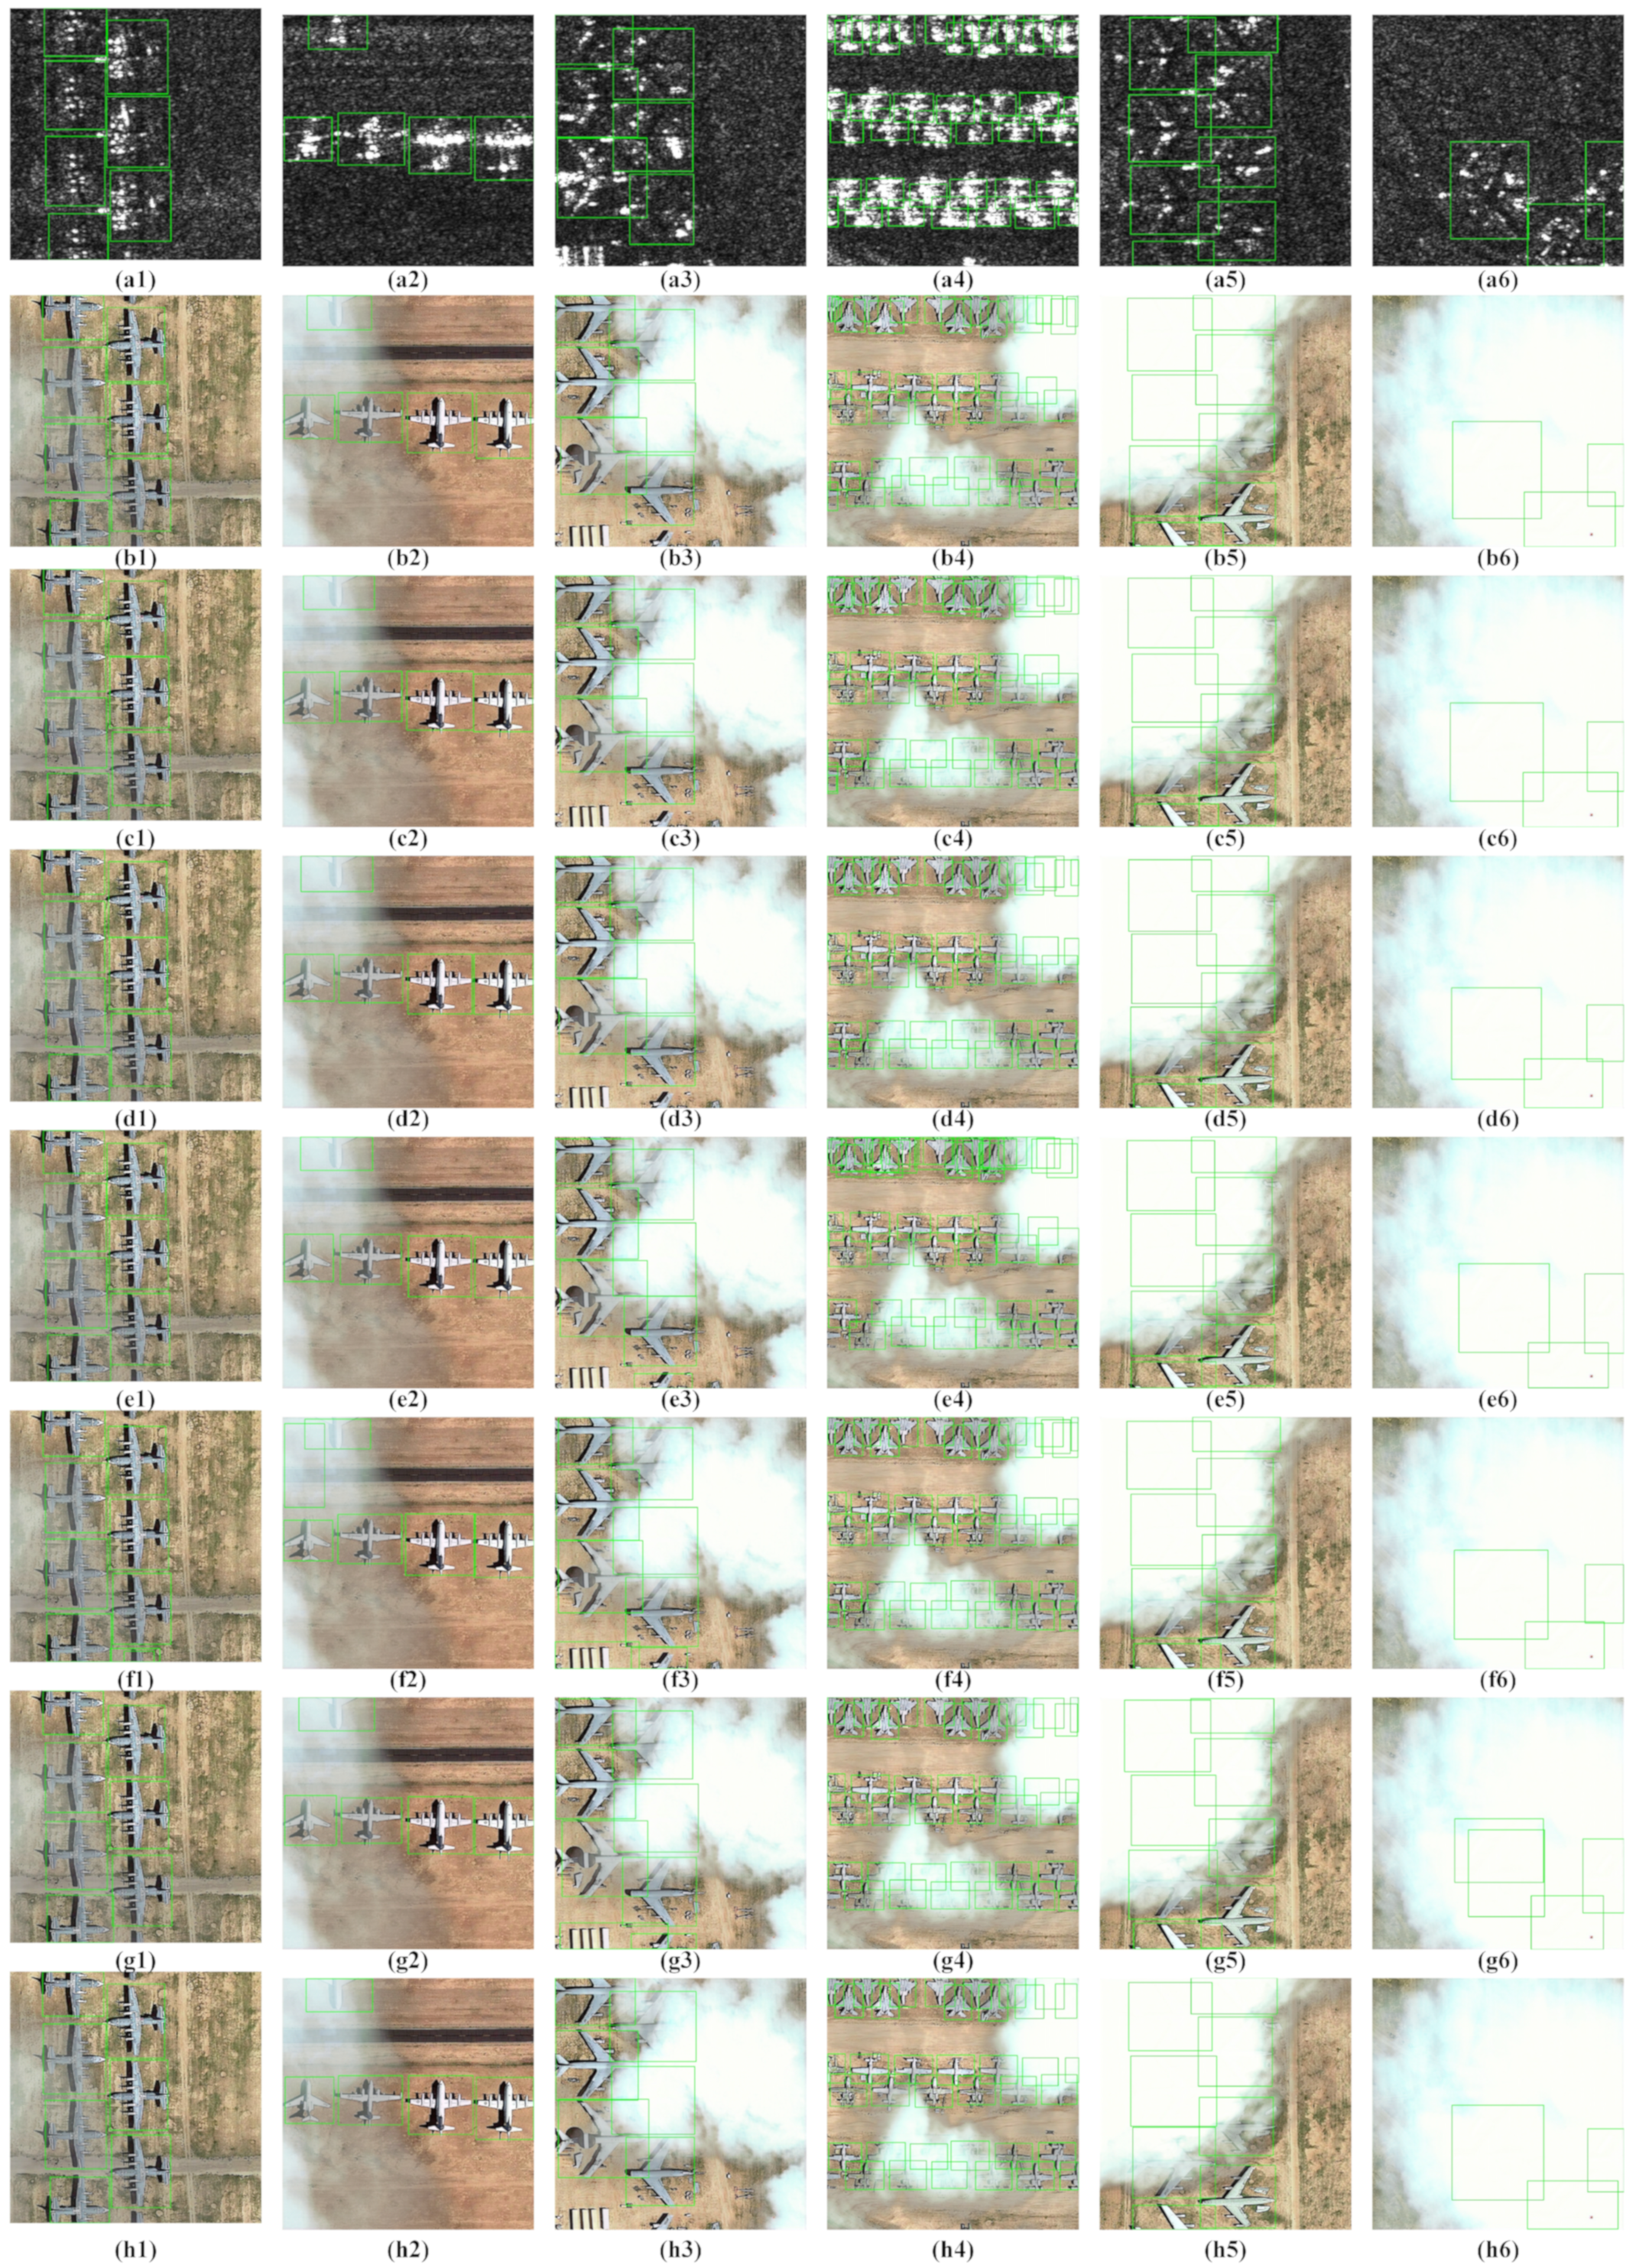
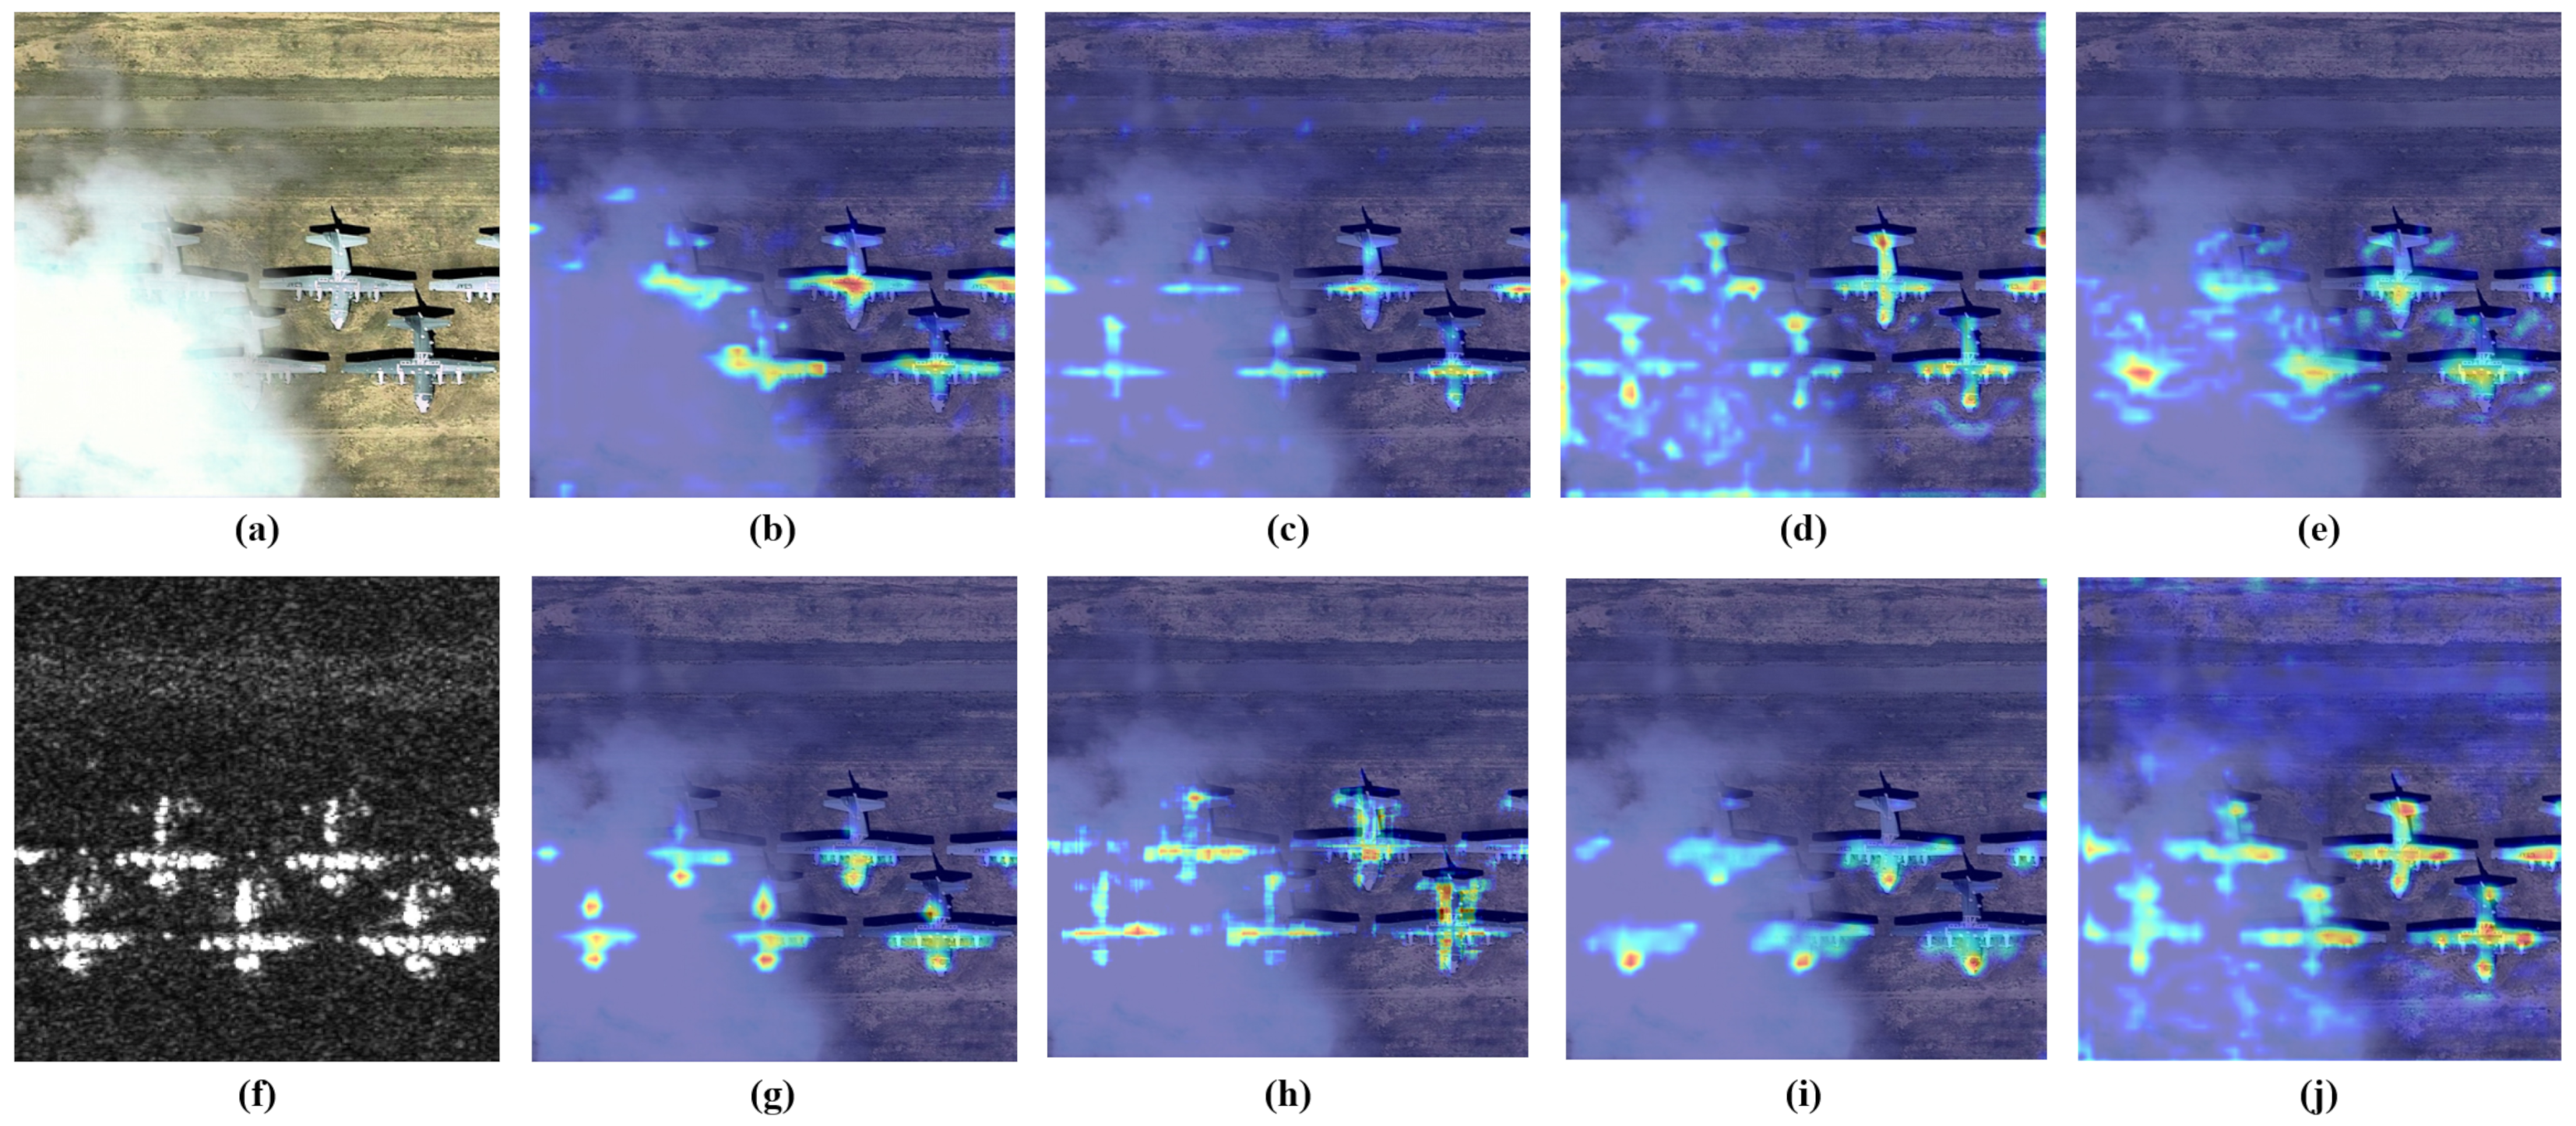
3.6. Visualization of Feature Maps of Different Fusion Methods

The visualization of feature maps for different fusion methods is shown in Figure 12. The optical image is shown in Figure 12a. There is thick-cloud occlusion in the lower left of the image. The SAR image is shown in Figure 12f. Figure 12b shows the extracted features of the optical image.
From Figure 12b, we can observe that optical images can only obtain the features of objects that are not covered by clouds, and the feature information of objects covered by clouds is lost. The SAR image extraction feature is shown in Figure 12g. Due to the low resolution of the SAR image, only the approximate contours of the aircraft are extracted from it. The feature hot map extracted by the Sum Fusion is shown in Figure 12c. The object feature is highlighted in the cloudless area, but when there are clouds, the occluded object features are lost. Figure 12d shows the feature hot map extracted by the Max Fusion. The boundary between the target area and the background area is blurred, and the target feature area becomes smaller. The feature hot maps extracted by Concat Fusion and CIAN are shown in Figure 12e,h, separately. The fused features of these two methods appear in different degrees of blurred and ghosted. The feature hot map extracted by MCFF is shown in Figure 12i. The features mainly focus on the head and backbone of the aircraft, and the loss of features of the aircraft tail is more obvious. The feature hot map extracted by Max Fusion is shown in Figure 12j. Compared with other fusion methods, it achieves better fusion methods, and the difference between the target area and the background area is more obvious.

4. Conclusions

Aircraft identification has been a research hotspot in remote-sensing fields. However, when there are thick clouds in optical images, it is very difficult to accurately detect aircraft. In this paper, we propose a MIN to fuse optical and SAR images for aircraft identification on cloudy days. The backbone of MIN uses convolution backbones for feature extraction. Then, the IASM module is designed for fusing features of optical and SAR images. Extensive experiments are taken on the FCAD dataset, and the results show SAR images are helpful concerning identifying aircraft on cloudy days. Moreover, from the heat map, we can observe that the IASM can fuse features of optical and SAR images more efficiently. The results also show the superiority of MIN to its counterparts. This work is limited by the available data, only fusion detection of aircraft can be performed and validated. We will collect more abundant targets to validate the performance of different object detection with more dynamic and uncertain scenarios in future work. Meanwhile, we will consider the heuristic method by introducing time and momentum in future work.

Author Contributions

Conceptualization, Q.G. and R.W.; methodology, Q.G.; software, Z.C.; validation, Q.G., Z.F. and Z.C.; formal analysis, Z.C.; investigation, Z.C.; resources, R.W.; data curation, Z.C.; writing—original draft preparation, S.Y.; writing—review and editing, S.Y.; visualization, Z.F.; supervision, S.Y.; project administration, S.Y.; funding acquisition, Z.F. All authors have read and agreed to the published version of the manuscript.

Funding

This work was supported by the National Natural Science Foundation of China (Nos. 61906145, 61771376, 61771380); the Science and Technology Innovation Team in Shaanxi Province of China (Nos. 2020TD-017); the 111 Project, the Foundation of Key Laboratory of Aerospace Science and Industry Group of CASIC, China; the Key Project of Hubei Provincial Natural Science Foundation under Grant 2020CFA001, China.

Conflicts of Interest

The authors announce no collision of interest.

Abbreviations

The following abbreviations are used in this manuscript:
SARSynthetic Aperture Radar
MINMulti-path Interactive Network
SMSum-Max
IAMInteractive Attention Module
IASMInteractive Attention Sum-Max fusion module
FCADFused Cloudy Aircraft Detection
FPNFeature Pyramid Network
FPSFrames Per Second
RPNRegion Proposal Network
SGDStochastic Gradient Descent
ISCCP-FDthe international satellite cloud climatology project-flux data

References

  1. Zhang, Y.; Rossow, W.B.; Lacis, A.A.; Oinas, V.; Mishchenko, M.I. Calculation of radiative fluxes from the surface to top of atmosphere based on isccp and other global data sets: Refinements of the radiative transfer model and the input data. J. Geophys. Res. Atmos. 2004, 109, D19. [Google Scholar] [CrossRef]
  2. Weigang, L.; da Silva, N. A study of parallel neural networks. In Proceedings of the IJCNN’99 International Joint Conference on Neural Networks, Washington, DC, USA, 10–16 July 1999; pp. 1113–1116. [Google Scholar]
  3. Redmon, J.; Divvala, S.; Girshick, R.; Farhadi, A. You only look once: Unified, real-time object detection. In Proceedings of the IEEE Conference on Computer Vision and Pattern Recognition, Las Vegas, NV, USA, 27–30 June 2016; pp. 779–788. [Google Scholar]
  4. Liu, W.; Anguelov, D.; Erhan, D.; Szegedy, C.; Reed, S.; Fu, C.-Y.; Berg, A.C. Ssd: Single shot multibox detector. In Proceedings of theEuropean Conference on Computer Vision, Amsterdam, The Netherlands, 8–16 October 2016; pp. 21–37. [Google Scholar]
  5. Dosovitskiy, A.; Beyer, L.; Kolesnikov, A.; Weissenborn, D.; Zhai, X.; Unterthiner, T.; Dehghani, M.; Minderer, M.; Heigold, G.; Gelly, S.; et al. An image is worth 16 × 16 words: Transformers for image recognition at scale. arXiv 2020, arXiv:2010.11929. [Google Scholar]
  6. Liu, Z.; Lin, Y.; Cao, Y.; Hu, H.; Wei, Y.; Zhang, Z.; Lin, S.; Guo, B. Swin transformer: Hierarchical vision transformer using shifted windows. In Proceedings of the IEEE/CVF International Conference on Computer Vision, Montreal, BC, Canada, 11–17 October 2021; pp. 10012–10022. [Google Scholar]
  7. Ji, F.; Ming, D.; Zeng, B.; Yu, J.; Qing, Y.; Du, T.; Zhang, X. Aircraft detection in high spatial resolution remote sensing images combining multi-angle features driven and majority voting cnn. Remote Sens. 2021, 13, 2207. [Google Scholar] [CrossRef]
  8. Shi, L.; Tang, Z.; Wang, T.; Xu, X.; Liu, J.; Zhang, J. Aircraft detection in remote sensing images based on deconvolution and position attention. Int. J. Remote Sens. 2021, 42, 4241–4260. [Google Scholar] [CrossRef]
  9. Wang, P.; Sun, X.; Diao, W.; Fu, K. Fmssd: Feature-merged single-shot detection for multiscale objects in large-scale remote sensing imagery. IEEE Trans. Geosci. Remote Sens. 2019, 58, 3377–3390. [Google Scholar] [CrossRef]
  10. Wei, H.; Zhang, Y.; Wang, B.; Yang, Y.; Li, H.; Wang, H. X-linenet: Detecting aircraft in remote sensing images by a pair of intersecting line segments. IEEE Trans. Geosci. Remote Sens. 2020, 59, 1645–1659. [Google Scholar] [CrossRef]
  11. Zhou, L.; Yan, H.; Shan, Y.; Zheng, C.; Liu, Y.; Zuo, X.; Qiao, B. Aircraft detection for remote sensing images based on deep convolutional neural networks. J. Electr. Comput. Eng. 2021, 2021, 4685644. [Google Scholar] [CrossRef]
  12. Qiu, S.; Wen, G.; Deng, Z.; Fan, Y.; Hui, B. Automatic and fast pcm generation for occluded object detection in high-resolution remote sensing images. IEEE Geosci. Remote Sens. Lett. 2017, 14, 1730–1734. [Google Scholar] [CrossRef]
  13. Zhou, M.; Zou, Z.; Shi, Z.; Zeng, W.-J.; Gui, J. Local attention networks for occluded airplane detection in remote sensing images. IEEE Geosci. Remote Sens. Lett. 2019, 17, 381–385. [Google Scholar] [CrossRef]
  14. Qiu, S.; Wen, G.; Fan, Y. Occluded object detection in high-resolution remote sensing images using partial configuration object model. IEEE J. Sel. Top. Appl. Earth Obs. Remote Sens. 2017, 10, 1909–1925. [Google Scholar] [CrossRef]
  15. Ren, Y.; Zhu, C.; Xiao, S. Deformable faster r-cnn with aggregating multi-layer features for partially occluded object detection in optical remote sensing images. Remote Sens. 2018, 10, 1470. [Google Scholar] [CrossRef]
  16. Qiu, S.; Wen, G.; Liu, J.; Deng, Z.; Fan, Y. Unified partial configuration model framework for fast partially occluded object detection in high-resolution remote sensing images. Remote Sens. 2018, 10, 464. [Google Scholar] [CrossRef]
  17. Wen, X.; Pan, Z.; Hu, Y.; Liu, J. Generative adversarial learning in yuv color space for thin cloud removal on satellite imagery. Remote Sens. 2021, 13, 1079. [Google Scholar] [CrossRef]
  18. Ji, S.; Dai, P.; Lu, M.; Zhang, Y. Simultaneous cloud detection and removal from bitemporal remote sensing images using cascade convolutional neural networks. IEEE Trans. Geosci. Remote Sens. 2020, 59, 732–748. [Google Scholar] [CrossRef]
  19. Zheng, J.; Liu, X.-Y.; Wang, X. Single image cloud removal using u-net and generative adversarial networks. IEEE Trans. Geosci. Remote Sens. 2020, 59, 6371–6385. [Google Scholar] [CrossRef]
  20. Xu, Z.; Wu, K.; Huang, L.; Wang, Q.; Ren, P. Cloudy image arithmetic: A cloudy scene synthesis paradigm with an application to deep learning based thin cloud removal. IEEE Trans. Geosci. Remote. 2021, 60, 1–16. [Google Scholar] [CrossRef]
  21. Ebel, P.; Meraner, A.; Schmitt, M.; Zhu, X.X. Multisensor data fusion for cloud removal in global and all-season sentinel-2 imagery. IEEE Trans. Geosci. Remote Sens. 2020, 59, 5866–5878. [Google Scholar] [CrossRef]
  22. Chen, Y.; Weng, Q.; Tang, L.; Zhang, X.; Bilal, M.; Li, Q. Thick clouds removing from multitemporal landsat images using spatiotemporal neural networks. IEEE Trans. Geosci. Remote Sens. 2020, 60, 1–14. [Google Scholar] [CrossRef]
  23. Li, X.; Yang, X.; Li, X.; Lu, S.; Ye, Y.; Ban, Y. Gcdb-unet: A novel robust cloud detection approach for remote sensing images. Knowl.-Based Syst. 2022, 238, 107890. [Google Scholar] [CrossRef]
  24. Luotamo, M.; Metsämäki, S.; Klami, A. Multiscale cloud detection in remote sensing images using a dual convolutional neural network. IEEE Trans. Geosci. Remote Sens. 2020, 59, 4972–4983. [Google Scholar] [CrossRef]
  25. Li, J.; Wu, Z.; Hu, Z.; Jian, C.; Luo, S.; Mou, L.; Zhu, X.X.; Molinier, M. A lightweight deep learning-based cloud detection method for sentinel-2a imagery fusing multiscale spectral and spatial features. IEEE Trans. Geosci. Remote Sens. 2021, 60, 1–19. [Google Scholar] [CrossRef]
  26. Guo, J.; Yang, J.; Yue, H.; Tan, H.; Hou, C.; Li, K. Cdnetv2: Cnn-based cloud detection for remote sensing imagery with cloud-snow coexistence. IEEE Trans. Geosci. Remote Sens. 2020, 59, 700–713. [Google Scholar] [CrossRef]
  27. Zhang, J.; Wang, Y.; Wang, H.; Wu, J.; Li, Y. Cnn cloud detection algorithm based on channel and spatial attention and probabilistic upsampling for remote sensing image. IEEE Trans. Geosci. Remote Sens. 2021, 60, 5404613. [Google Scholar] [CrossRef]
  28. He, Q.; Sun, X.; Yan, Z.; Fu, K. Dabnet: Deformable contextual and boundary-weighted network for cloud detection in remote sensing images. IEEE Trans. Geosci. Remote Sens. 2021, 60, 5601216. [Google Scholar] [CrossRef]
  29. Guo, Q.; Wang, H.; Xu, F. Scattering enhanced attention pyramid network for aircraft detection in sar images. IEEE Trans. Geosci. Remote Sens. 2020, 59, 7570–7587. [Google Scholar] [CrossRef]
  30. Luo, R.; Xing, J.; Chen, L.; Pan, Z.; Cai, X.; Li, Z.; Wang, J.; Ford, A. Glassboxing deep learning to enhance aircraft detection from sar imagery. Remote Sens. 2021, 13, 3650. [Google Scholar] [CrossRef]
  31. Zhang, P.; Xu, H.; Tian, T.; Gao, P.; Tian, J. Sfre-net: Scattering feature relation enhancement network for aircraft detection in sar images. Remote Sens. 2022, 14, 2076. [Google Scholar] [CrossRef]
  32. Kang, Y.; Wang, Z.; Fu, J.; Sun, X.; Fu, K. Sfr-net: Scattering feature relation network for aircraft detection in complex sar images. IEEE Trans. Geosci. Remote Sens. 2021, 60, 5218317. [Google Scholar] [CrossRef]
  33. Zhang, F.; Du, B.; Zhang, L.; Xu, M. Weakly supervised learning based on coupled convolutional neural networks for aircraft detection. IEEE Trans. Geosci. Remote Sens. 2016, 54, 5553–5563. [Google Scholar] [CrossRef]
  34. Zhao, Y.; Zhao, L.; Liu, Z.; Hu, D.; Kuang, G.; Liu, L. Attentional feature refinement and alignment network for aircraft detection in sar imagery. arXiv 2022, arXiv:2201.07124. [Google Scholar] [CrossRef]
  35. Shahzad, M.; Maurer, M.; Fraundorfer, F.; Wang, Y.; Zhu, X.X. Buildings detection in vhr sar images using fully convolution neural networks. IEEE Trans. Geosci. Remote Sens. 2018, 57, 1100–1116. [Google Scholar] [CrossRef]
  36. Saha, S.; Bovolo, F.; Bruzzone, L. Building change detection in vhr sar images via unsupervised deep transcoding. IEEE Trans. Geosci. Remote Sens. 2020, 59, 1917–1929. [Google Scholar] [CrossRef]
  37. Poulain, V.; Inglada, J.; Spigai, M.; Tourneret, J.-Y.; Marthon, P. High-resolution optical and sar image fusion for building database updating. IEEE Trans. Geosci. Remote Sens. 2011, 49, 2900–2910. [Google Scholar] [CrossRef]
  38. Jiang, X.; He, Y.; Li, G.; Liu, Y.; Zhang, X.-P. Building damage detection via superpixel-based belief fusion of space-borne sar and optical images. IEEE Sens. J. 2019, 20, 2008–2022. [Google Scholar] [CrossRef]
  39. Brunner, D.; Lemoine, G.; Bruzzone, L. Earthquake damage assessment of buildings using vhr optical and sar imagery. IEEE Trans. Geosci. Remote Sens. 2010, 48, 2403–2420. [Google Scholar] [CrossRef]
  40. Ding, L.; Wang, Y.; Laganière, R.; Huang, D.; Luo, X.; Zhang, H. A robust and fast multispectral pedestrian detection deep network. Knowl.-Based Syst. 2021, 227, 106990. [Google Scholar] [CrossRef]
  41. Chen, Y.; Bruzzone, L. Self-supervised sar-optical data fusion of sentinel-1/-2 images. IEEE Trans. Geosci. Remote. Sens. 2021, 60, 5406011. [Google Scholar] [CrossRef]
  42. Shakya, A.; Biswas, M.; Pal, M. Fusion and classification of multi-temporal sar and optical imagery using convolutional neural network. Int. J. Image Data Fusion 2022, 13, 113–135. [Google Scholar] [CrossRef]
  43. Zhang, P.; Ban, Y.; Nascetti, A. Learning u-net without forgetting for near real-time wildfire monitoring by the fusion of sar and optical time series. Remote Sens. Environ. 2021, 261, 112467. [Google Scholar] [CrossRef]
  44. Druce, D.; Tong, X.; Lei, X.; Guo, T.; Kittel, C.M.; Grogan, K.; Tottrup, C. An optical and sar based fusion approach for mapping surface water dynamics over mainland china. Remote Sens. 2021, 13, 1663. [Google Scholar] [CrossRef]
  45. Adrian, J.; Sagan, V.; Maimaitijiang, M. Sentinel sar-optical fusion for crop type mapping using deep learning and google earth engine. ISPRS J. Photogramm. Remote Sens. 2021, 175, 215–235. [Google Scholar] [CrossRef]
  46. Qin, J.; Qu, H.; Chen, H.; Chen, W. Joint detection of airplane targets based on sar images and optical images. In Proceedings of the IGARSS 2019-2019 IEEE International Geoscience and Remote Sensing Symposium, Yokohama, Japan, 28 July–2 August 2019; pp. 1366–1369. [Google Scholar]
  47. Spröhnle, K.; Fuchs, E.-M.; Pelizari, P.A. Object-based analysis and fusion of optical and sar satellite data for dwelling detection in refugee camps. IEEE J. Sel. Top. Appl. Earth Obs. Remote Sens. 2017, 10, 1780–1791. [Google Scholar] [CrossRef]
  48. He, K.; Zhang, X.; Ren, S.; Sun, J. Deep residual learning for image recognition. In Proceedings of the IEEE Conference on Computer Vision and Pattern Recognition, Las Vegas, NV, USA, 27–30 June 2016; pp. 770–778. [Google Scholar]
  49. Lin, T.-Y.; Dollár, P.; Girshick, R.; He, K.; Hariharan, B.; Belongie, S. Feature pyramid networks for object detection. In Proceedings of the IEEE Conference on Computer Vision and Pattern Recognition, Honolulu, HI, USA, 21–26 July 2017; pp. 2117–2125. [Google Scholar]
  50. Pei, D.; Jing, M.; Liu, H.; Sun, F.; Jiang, L. A fast retinanet fusion framework for multi-spectral pedestrian detection. Infrared Phys. Technol. 2020, 105, 103178. [Google Scholar] [CrossRef]
  51. Guan, D.; Cao, Y.; Yang, J.; Cao, Y.; Tisse, C.-L. Exploiting fusion architectures for multispectral pedestrian detection and segmentation. Appl. Opt. 2018, 57, D108–D116. [Google Scholar] [CrossRef] [PubMed]
  52. Chen, Y.; Xie, H.; Shin, H. Multi-layer fusion techniques using a cnn for multispectral pedestrian detection. IET Comput. Vis. 2018, 12, 1179–1187. [Google Scholar] [CrossRef]
  53. Friederici, A.D. Language in Our Brain: The Origins of a Uniquely Human Capacity; MIT Press: Cambridge, MA, USA, 2017. [Google Scholar]
  54. Wang, Q.; Wu, B.; Zhu, P.; Li, P.; Zuo, W.; Hu, Q. Eca-net: Efficient channel attention for deep convolutional neural networks. In Proceedings of the 2020 IEEE/CVF Conference on Computer Vision and Pattern Recognition (CVPR), Seattle, WA, USA, 13–19 June 2020; pp. 11531–11539. [Google Scholar]
  55. Ren, S.; He, K.; Girshick, R.; Sun, J. Faster r-cnn: Towards real-time object detection with region proposal networks. In Proceedings of the 28th International Conference on Neural Information Processing Systems, Bali, Indonesia, 7–12 December 2015; pp. 91–99. [Google Scholar]
  56. Chen, K.; Wang, J.; Pang, J.; Cao, Y.; Xiong, Y.; Li, X.; Sun, S.; Feng, W.; Liu, Z.; Xu, J.; et al. Mmdetection: Open mmlab detection toolbox and benchmark. arXiv 2019, arXiv:1906.07155. [Google Scholar]
  57. Zhang, L.; Liu, Z.; Zhang, S.; Yang, X.; Qiao, H.; Huang, K.; Hussain, A. Cross-modality interactive attention network for multispectral pedestrian detection. Inf. Fusion 2019, 50, 20–29. [Google Scholar] [CrossRef]
  58. Cao, Z.; Yang, H.; Zhao, J.; Guo, S.; Li, L. Attention fusion for one-stage multispectral pedestrian detection. Sensors 2021, 21, 4184. [Google Scholar] [CrossRef]
Figure 1. Optical and SAR images. (a) Optical image. (b) SAR image.
Remotesensing 14 03922 g001
Figure 2. Framework of the proposed MIN. Purple and green modules are feature extraction streams of the optical image and the SAR image, respectively. Blue circle is the Interactive Attention Sum-Max fusion module (IASM). The pink circle is the Feature Pyramid Network (FPN) with IASM.
Remotesensing 14 03922 g002
Figure 3. Structure of IASM + Up sampling.
Remotesensing 14 03922 g003
Figure 4. Statistical histogram of object and background features. (a) The object areas. (b) The background areas.
Remotesensing 14 03922 g004
Figure 5. The comparison of different feature fusion rules. (a1c5) The thickness of cloud v.s. features.
Remotesensing 14 03922 g005
Figure 6. Structure of IASM in detail. The blue part is the interactive attention module. The orange part is the SM Fusion module.
Remotesensing 14 03922 g006
Figure 7. Typical images in the FCAD dataset. (a) The optical image and (d) the SAR image in the cloudless scenes; (b) the optical image and (e) the SAR image in the thin-cloud scenes; (c) the optical image and (f) the SAR image in the thick-cloud scene.
Remotesensing 14 03922 g007
Figure 8. Visual comparison among different sensor image object detection results. (a1a6) GT. (b1b6) Faster R-CNN(O). (c1c6) Faster R-CNN(S). (d1d6) MIN.
Remotesensing 14 03922 g008
Figure 9. The multi-path IASM at different stages. (af) The fusion v.s. stages.
Remotesensing 14 03922 g009
Figure 10. The P-R curves of different fusion models.
Remotesensing 14 03922 g010
Figure 11. Visual comparison of different fusion models. (a1a6) GT. (b1b6) Sum Fusion. (c1c6) Max Fusion. (d1d6) Concat Fusion. (e1e6) MCFF. (f1f6) CIAN. (g1g6) SM Fusion. (h1h6) MIN.
Remotesensing 14 03922 g011
Figure 12. (a) Optical images, (f) SAR image and heat map of different models features: (b) optical image, (c) Sum Fusion, (d) Max Fusion, (e) Concat Fusion, (g) SAR image, (h) CIAN, (i) MCFF, (j) IASM.
Remotesensing 14 03922 g012
Table 1. Average precision (AP) with single-modal and multi-modal images.
MethodsCloudlessThin CloudsThick CloudsTotalFPS
Faster R-CNN (O)0.8870.8070.3520.70723.2
Faster R-CNN (S)---0.72123.2
MIN0.9310.9130.7330.92515.4
Table 2. Analysis on the multi-scale IASM.
Fusion Stages AP AP 50 AP 70 AP M AP L AR 1 AR 10 AR 100 AR M AR L FPS
10.6460.9020.7210.2540.7380.6780.6780.6780.2990.77317.9
20.6720.9110.7750.3380.7490.7030.7030.7030.3830.78317.4
30.6770.9070.7910.3280.7570.7100.7100.7100.3870.79216.8
40.6890.9250.8000.3630.7640.7230.7230.7230.4170.80115.8
50.6800.9210.7990.3310.7600.7130.7130.7130.3830.79615.0
60.6590.9190.7370.2780.7450.6910.6910.6910.3400.77914.4
Table 3. Analysis of the residual SM module and IAM module.
IndexOptical ImageSAR ImageSM FusionIAM AP 50
1 0.707
2 0.913
3 0.921
40.925
Table 4. Feature fusions of different methods are compared.
Methods AP AP 50 AP 70 AP M AP L AR 1 AR 10 AR 100 AR M AR L FPS
Sum Fusion0.6710.9130.7840.3080.7540.7040.7040.7040.3580.79216.1
Max Fusion0.6750.9090.7900.3280.7570.7090.7090.7090.3690.79516.0
Concat Fusion0.6690.9090.7860.3090.7500.7040.7040.7040.3630.78915.3
SM Fusion0.6800.9210.7980.3310.7600.7130.7130.7130.3830.79615.5
CIAN [57]0.5880.8670.6210.1520.6940.6160.6160.6160.1790.72715.9
MCFF [58]0.6760.9170.7740.3150.7510.7030.7030.7030.3770.78515.6
MIN0.6890.9250.8000.3630.7640.7230.7230.7230.4170.80115.8
Publisher’s Note: MDPI stays neutral with regard to jurisdictional claims in published maps and institutional affiliations.

