Article

Spatial and Temporal Variability of Grassland Grasshopper Habitat Suitability and Its Main Influencing Factors

1
Institute of Grassland Research, Chinese Academy of Agricultural Sciences, Hohhot 010010, China
2
Key Laboratory of Biohazard Monitoring and Green Prevention and Control in Artificial Grassland, Ministry of Agriculture and Rural Affairs, Hohhot 010010, China
3
Hulun Buir Forestry and Grassland Development Center, Hulun Buir 021008, China
4
Key Laboratory of Digital Earth Science, Aerospace Information Research Institute, Chinese Academy of Sciences, Beijing 100094, China
5
University of Chinese Academy of Sciences, Beijing 100049, China
*
Author to whom correspondence should be addressed.
Remote Sens. 2022, 14(16), 3910; https://doi.org/10.3390/rs14163910
Submission received: 19 June 2022 / Revised: 8 August 2022 / Accepted: 9 August 2022 / Published: 12 August 2022

Abstract

:
Grasshoppers are highly destructive pests, and their outbreak can directly damage livestock development. Grasshopper outbreaks can be monitored and forecasted through dynamic analysis of their potential geographic distribution and main influencing factors. By integrating vegetation, edaphic, meteorological, topography, and other geospatial data, this study simulated the grasshopper suitability index in Hulunbuir grassland using maximum entropy species distribution modeling (Maxent). The Maxent model showed high accuracy, with the training area under the curve (AUC) value ranging from 0.897 to 0.973 and the testing AUC ranging from 0.853 to 0.971 for the past 13 years. The results showed that suitable areas, including the most suitable area and moderately suitable area, accounted for a small proportion and were mainly located in the eastern and southern parts of the study area. According to model analysis based on 51 environmental factors, not all factors played a significant role in the grasshopper cycle. Moreover, differences in environmental factors drive the spatial variability of suitable areas for grasshoppers. The monitoring and prediction of potential outbreak areas can be improved by identifying major environmental factors having large variability between suitable and unsuitable areas. Future trends in grasshopper suitability indices are likely to contradict past trends in most of the study area, with only approximately 33% of the study area continuing the past trend. The results are expected to guide future monitoring and prediction of grasshoppers in Hulunbuir grassland.

1. Introduction

Grasshoppers, with strong explosive and destructive power, are one of the major insects contributing to forage loss, which affects the development of human economies [1]. During their migration, swarms of grasshoppers can cause serious damage to the ecological environment by reducing and even completely destroying agricultural and livestock production, which directly impacts regional economic development [2,3,4]. In order to avoid or reduce losses, countries and regions at risk of locust and grasshopper outbreak have promoted and applied many effective monitoring and forecasting measures.
Previous studies on grasshopper monitoring focused on estimating the spatial distribution characteristics and identifying the main influencing factors to extract hotspots of grasshopper activity and provide support for pest control [5]. For example, Buckley et al. assessed the impact of climate on changes in the phenology and distribution of grasshoppers [6], and Veran et al. found that precipitation and high temperature have persistent effects on the emergence of grasshopper outbreaks [7]. Considering the relationship between grasshopper outbreaks and climate factors, prediction models have been established to determine potential areas of grasshopper outbreaks [7,8]. Many studies have confirmed that both meteorological factors and other environmental factors (vegetation, soil, terrain, and landforms) are closely related to the probability, distribution, extent, and migration direction of grasshopper and locust outbreaks [9,10]. In particular, soil moisture content and the spatial distribution of vegetation directly increase or decrease the likelihood of nymph survival [11,12,13]. Various studies have applied weather forecasting and remote sensing indices to monitor and predict potential areas of grasshopper outbreak [14,15].
The conventional approach to identification of potential areas of grasshopper outbreak involves manual collection of field data, which is time-consuming and laborious; in addition, grasshoppers usually thrive in remote and relatively inaccessible areas with complicated terrain [16]. Nevertheless, the development of remote sensing technology has significantly increased the availability of relevant data having high spatial and temporal resolutions [17]. Remote sensing imageries are facilitating the accurate and convenient monitoring of grasshoppers. Satellite imagery can be used to identify ecological conditions suitable for grasshopper survival at the continental scale and in near real-time [18]. Since the 1970s, many studies have used remote sensing data for grasshopper and locust monitoring [15,19,20,21,22,23]. It is worth noting that some studies only rely on a single indicator to monitor and forecast grasshopper outbreak. However, grasshopper outbreak is a comprehensive phenomenon involving multiple factors [10]. As a result of global warming and irregular human modification of ecosystems, the variability in factors affecting grasshopper outbreaks has significantly increased [24], and the change in climate has altered the range of locust habitats [25]. Therefore, accurate monitoring and prediction of grasshopper outbreak areas using a single factor are becoming increasingly more difficult. The current demand for accurate monitoring of grasshopper and locust disasters can be met by combining multiple environmental factors, increasing the frequency of ecological monitoring, performing repeated real-time monitoring of habitat factors in potential locust occurrence areas, and estimating locust population densities [26].
Previous studies have explored the development of multi-indicator models combining vegetation cover, ground cover, soil moisture, soil salinity, and surface temperature to monitor and extract locust habitats in order to achieve accurate grasshopper and locust monitoring [27,28]. Machine learning approaches have been applied to predict potential outbreak areas of locusts [29,30,31]. Similar efforts have been made for East Asia, where the prediction and monitoring of grasshopper outbreak are crucial [28,32]. However, some issues remain to be addressed. Different species of grasshoppers are affected by different environmental factors, and suitable monitoring indicators and weighting factors have not been established. The effective integration of remote sensing data, meteorological data, and geospatial data, and extraction of valid information, are significant outstanding issues in the monitoring and forecasting of grasshopper outbreaks. Moreover, spatial-temporal analyses of long time series of grasshopper habitat suitability have rarely been conducted [33].
In this study, taking grasshoppers in Hulunbuir grassland as an example, maximum entropy species distribution modeling (Maxent) was applied to calculate the grassland grasshopper suitability index from 2008 to 2020. Field survey data on vegetation, soil, meteorology, and other geospatial factors were comprehensively taken into account. The objectives of this study were to: (1) calculate the suitability index of grassland grasshoppers and analyze the spatial and temporal distribution characteristics of grasshopper suitability zones over the past 13 years in Hulunbuir grassland; (2) analyze the influence of multiple factors on the grasshopper suitability index and determine the main influencing factors; (3) predict the trend in the grasshopper suitability index of the study area in the future. The findings provide deeper insight into the spatial and temporal characteristics of suitable grasshopper habitats and provide strategies for the effective control of grasshoppers. This study will fill the gap in the research on the spatiotemporal characteristics of grasshopper habitat suitability and contribute to the identification of indicators in grassland grasshopper monitoring and early warning studies.

2. Material and Methods
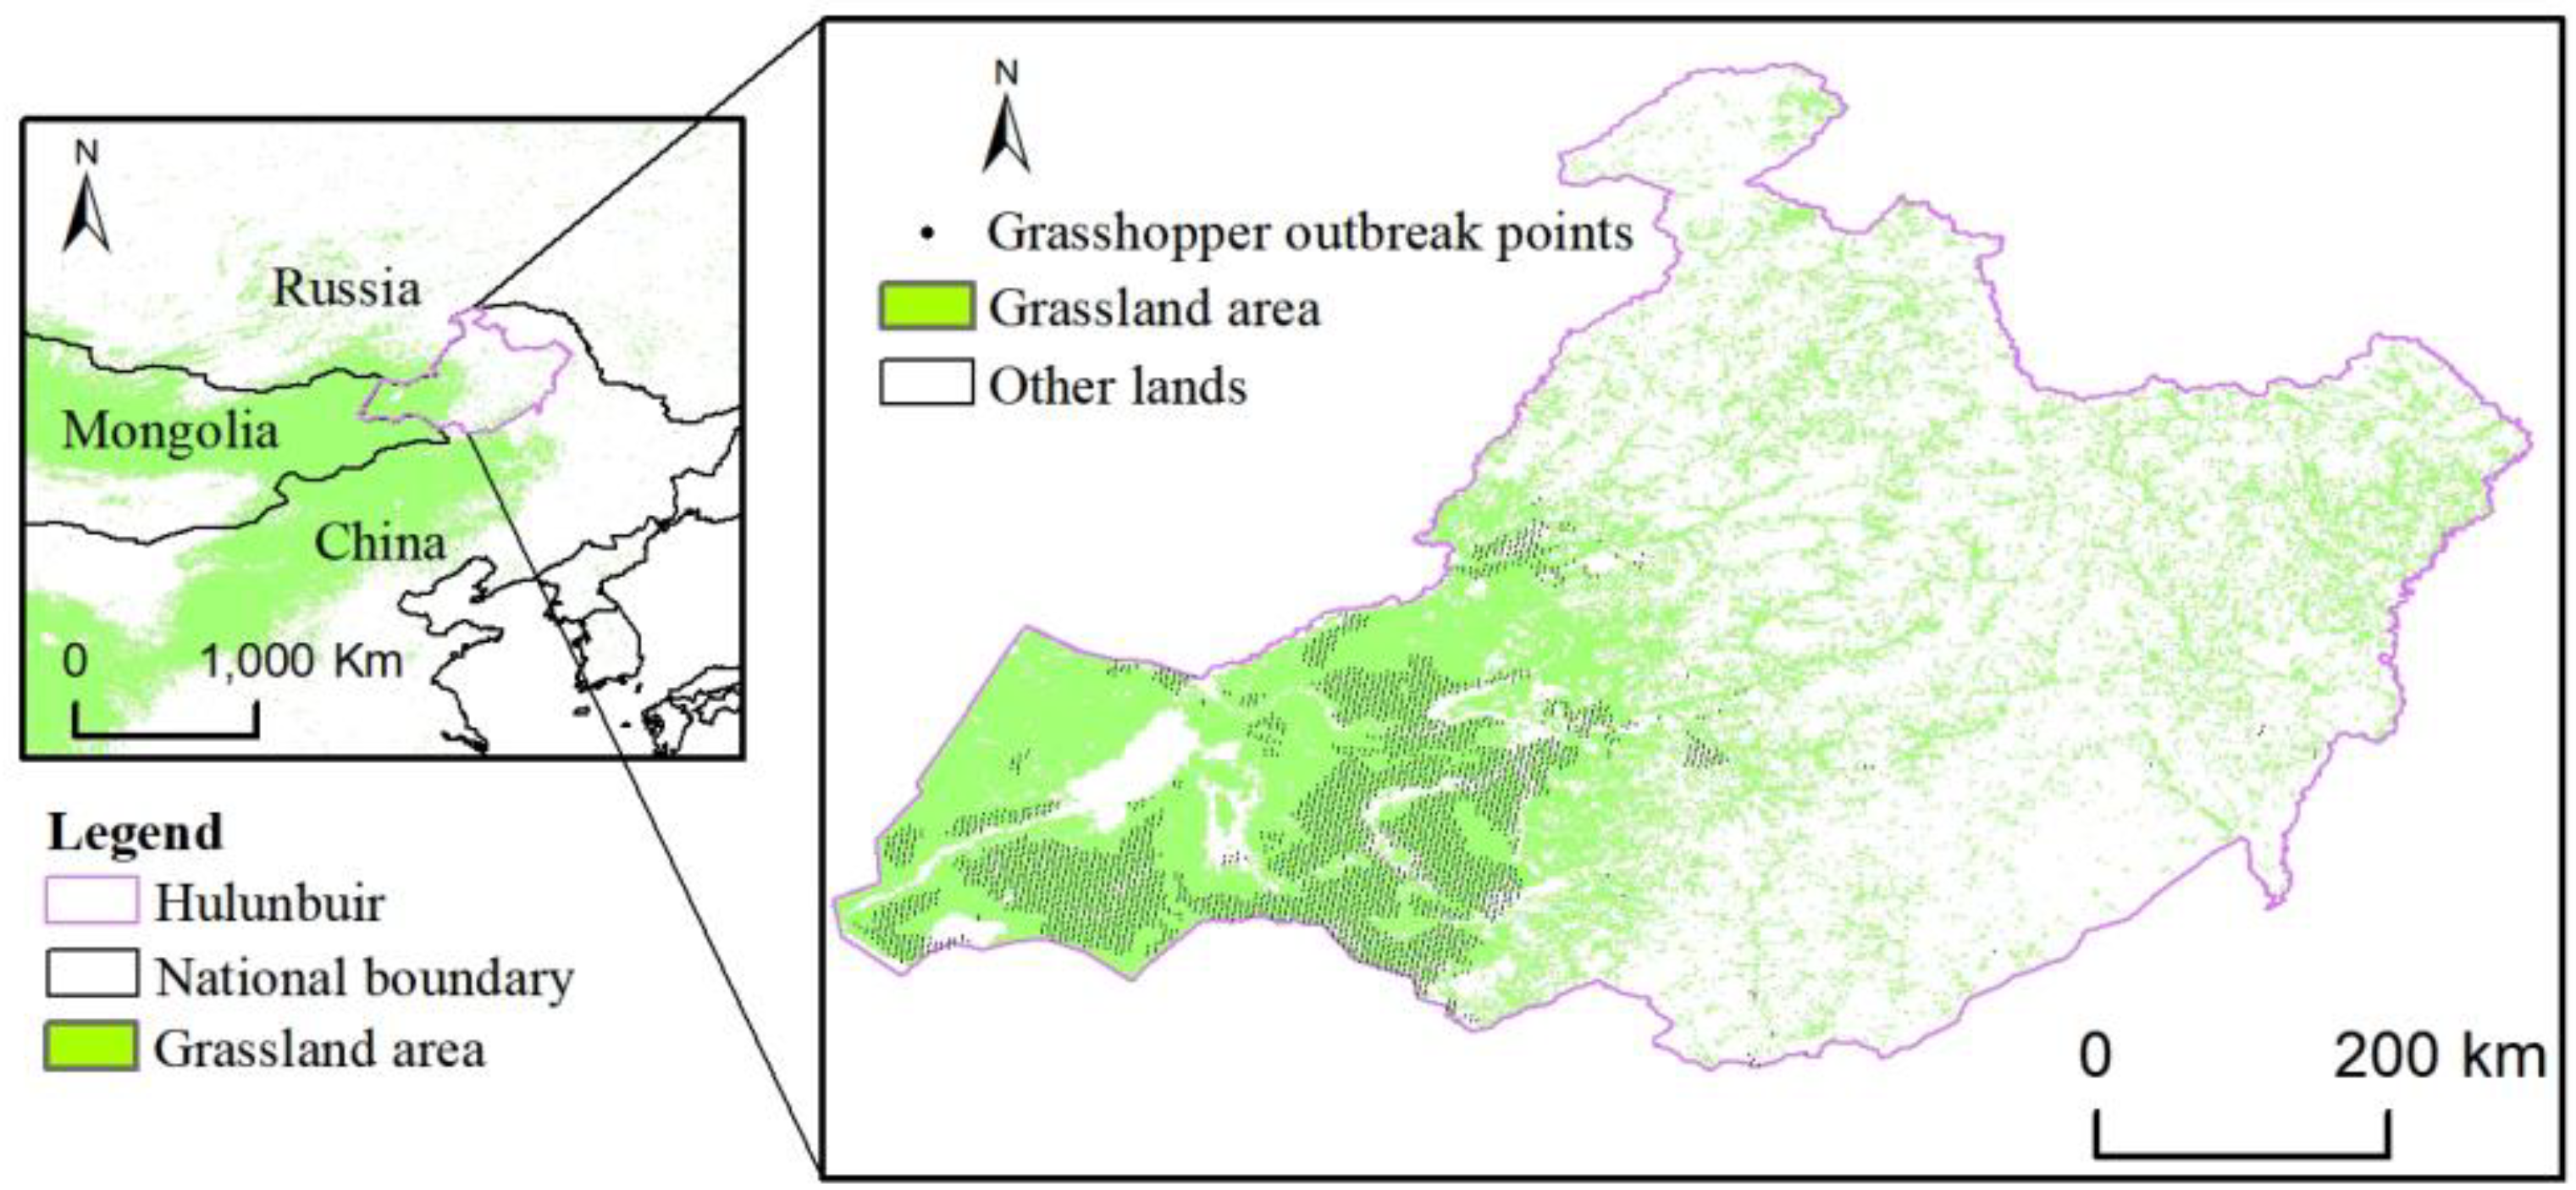
2.1. Study Area

Hulunbuir grassland is located in the northeastern (46°10′–50°12′N, 115°31′–121°09′E) part of Inner Mongolia, China. The western and northern parts of the grassland share borders with Mongolia and Russia, respectively (Figure 1). The study area has a mid-temperate continental climate with an average monthly maximum temperature of 22 °C, minimum temperature of −24 °C, average annual temperature of −1.5 °C, and annual precipitation of around 320 mm [34]. The eastern part of the study area has temperate meadow steppe vegetation, dominated by Stipa baicalensis, Leymus chinensis, Cleistogenes squarrosa, and Filifolium sibiricum. The western part of the study area features a typical steppe, with vegetation mainly composed of Poaceae Barnhart, Stipa grandis, and Stipa crylovii. The soil types are mostly dark brown soil, black soil, and dark meadow soil. Affected by climate change and human activities, the soil is sandy and saline. Moreover, it is mainly weakly alkaline. As the major pests, the grasshoppers in Hulunbuir grassland include Oedaleus decorus asisticus B.-Bienlo, Bryodema luctuosum luctuosum Stoll, Calliptamus abbreviatus Ikonnikov, Pararcypatera microptera meridionalis Ikonnilov, Dasyhippus barbipes Fischer-Waldheim, Angaracris barabensis Pallas, and Angaracris rhodopa Fischer-Waldheim [35]. Many control measures have been taken by local grassland stations, but these grasshoppers continue to cause huge economic losses.

2.2. Data Acquisition and Processing

2.2.1. Satellite Data

This study used the MODIS Product Data of MOD13A2 and MOD11A2 covering 2008–2020 to represent the Normalized Difference Vegetation Index (NDVI) and Land Surface Temperature (LST), respectively. Their spatial resolution is 1 km. The temporal resolution of NDVI is 16 days, and the temporal resolution of LST is 8 days. After maximum synthesis, LST data with a period of 16 days were obtained. These data were used to acquire the vegetation fraction coverage (FVC) and temperature vegetation drought index (TVDI).
F V C = ( N D V I N D V I 0 ) / ( N D V I v N D V I 0 )
where FVC means vegetation coverage with pixel values ranging from 0 to 1, NDVI represents the normalized difference vegetation index, and NDVIv and NDVI0 represent the value of pure vegetation pixel and pure soil pixel, respectively.
T V D I = ( T s T s min ) / ( T s max T s min )
where Tsmin and Tsmax represent the minimum and maximum LST at the pixel NDVI value, respectively. Ts indicates the values of LST. TVDI was used to represent soil moisture.

2.2.2. Meteorological and Other Geospatial Data

Meteorological data, including monthly average temperature and monthly cumulative precipitation, covering nearly 13 years (2008–2020) were obtained from the China meteorological data sharing network (http://www.nmic.cn/ accessed on 11 June 2021). Kriging interpolation was performed in Python to obtain raster data having a spatial resolution of 1 km.
In general, vegetation type, soil type, and ground elevation showed little change over a short period. Therefore, these factors were assumed to show no significant change during the study period. Geospatial data were downloaded from the Geospatial Data Cloud of the Chinese Academy of Sciences. Data on vegetation type and soil type were obtained from a national database, which was updated in 2008 and 2015, with a resolution of 1:1,000,000. The spatial resolution of the digital elevation map was 30 m. After pre-processing, such as mosaic and projection conversion, all data were resampled to a spatial resolution of 1 km. Aspect and slope were calculated using digital elevation data.

2.2.3. Survey Data

Field survey data were obtained from the Hulunbuir Grassland Station of Inner Mongolia, China. The data include the area of grasshopper occurrence in Hulunbuir grassland from 2008 to 2020 (Table 1). All points in the region are believed to have experienced grasshopper infestation. The distribution of locusts was determined from sample points at 3 km intervals from the field survey data in ArcGIS, as shown in Figure 1, and the output, including species, latitude and longitude, was processed as csv files.

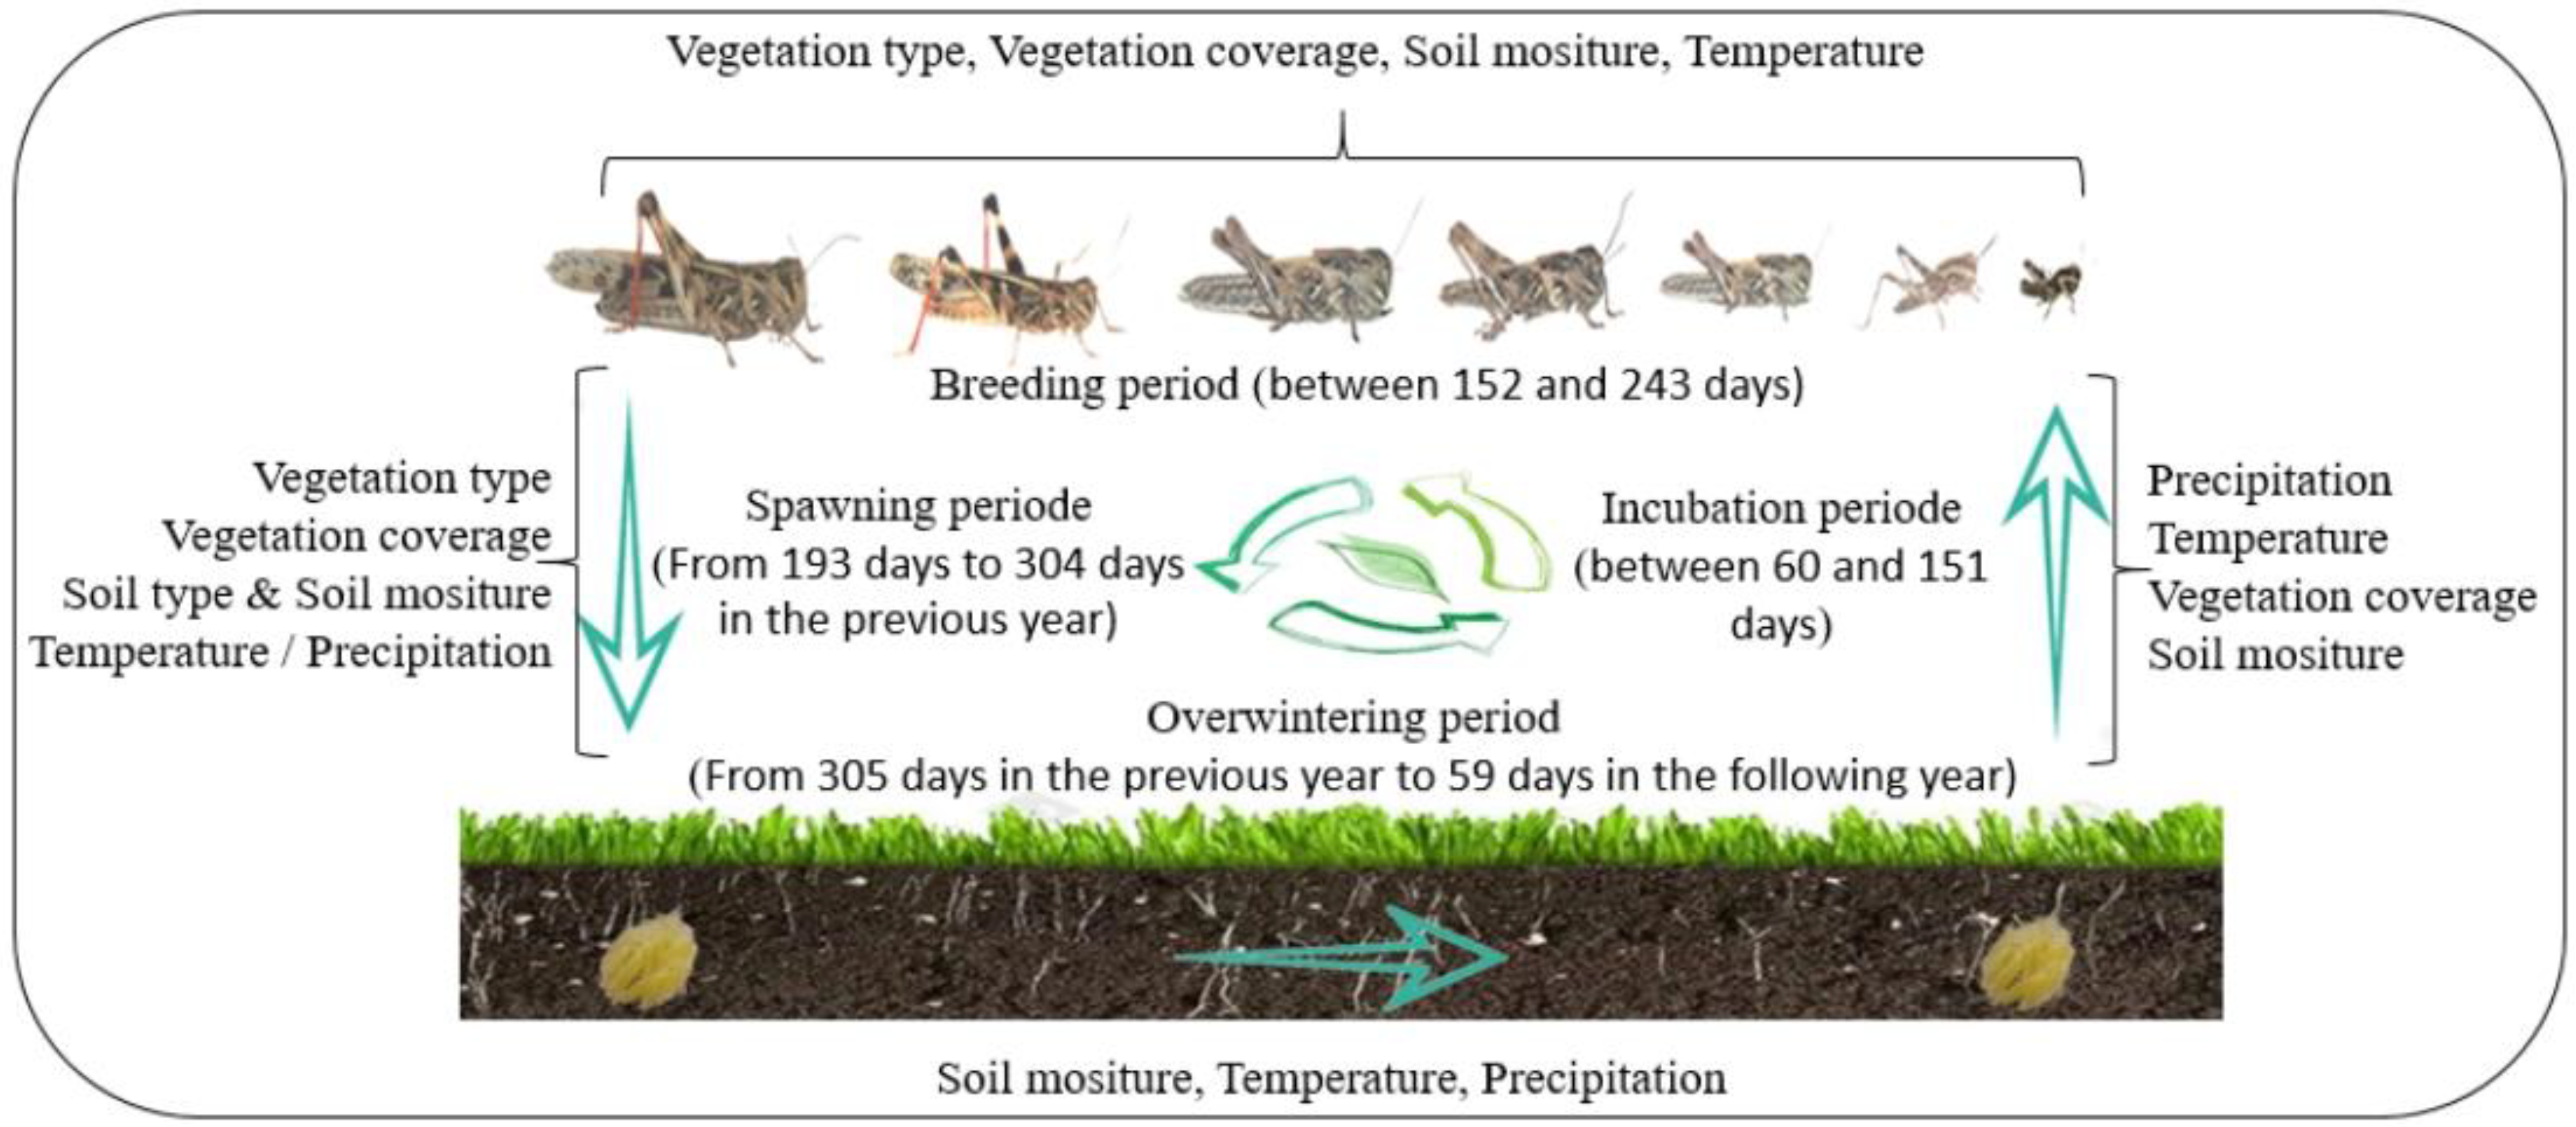
2.3. Influence Factors

The main factors influencing the growth and development of grasshoppers during their life cycle are shown in Figure 2. During the grasshopper spawning period, vegetation type, vegetation coverage, soil type, soil moisture, temperature, precipitation, and terrain (altitude, aspect, slope) determine the selection of grasshopper spawning sites [36,37,38]. Soil moisture and climate change in the previous fall or winter can affect the survival of grasshopper eggs [32]. In spring, grasshopper resurgence is closely related to changes in temperature and precipitation [39]. Suitable temperature and soil moisture directly affect grasshopper hatchability and incubation time. During the breeding period, vegetation type, vegetation coverage, soil moisture, and temperature are crucial factors influencing the growth and development of grasshoppers [40,41]. Regarding vegetation type, grasshoppers prefer broad-leaved vegetation, especially Poaceae, and the spatial distribution of vegetation type affects the appearance of grasshoppers.
Accordingly, these factors were selected as the major factors (Table 2). In total, 51 eco-environmental factors were selected, and were hypothesized to play a vital role in grasshopper development.

2.4. Methods

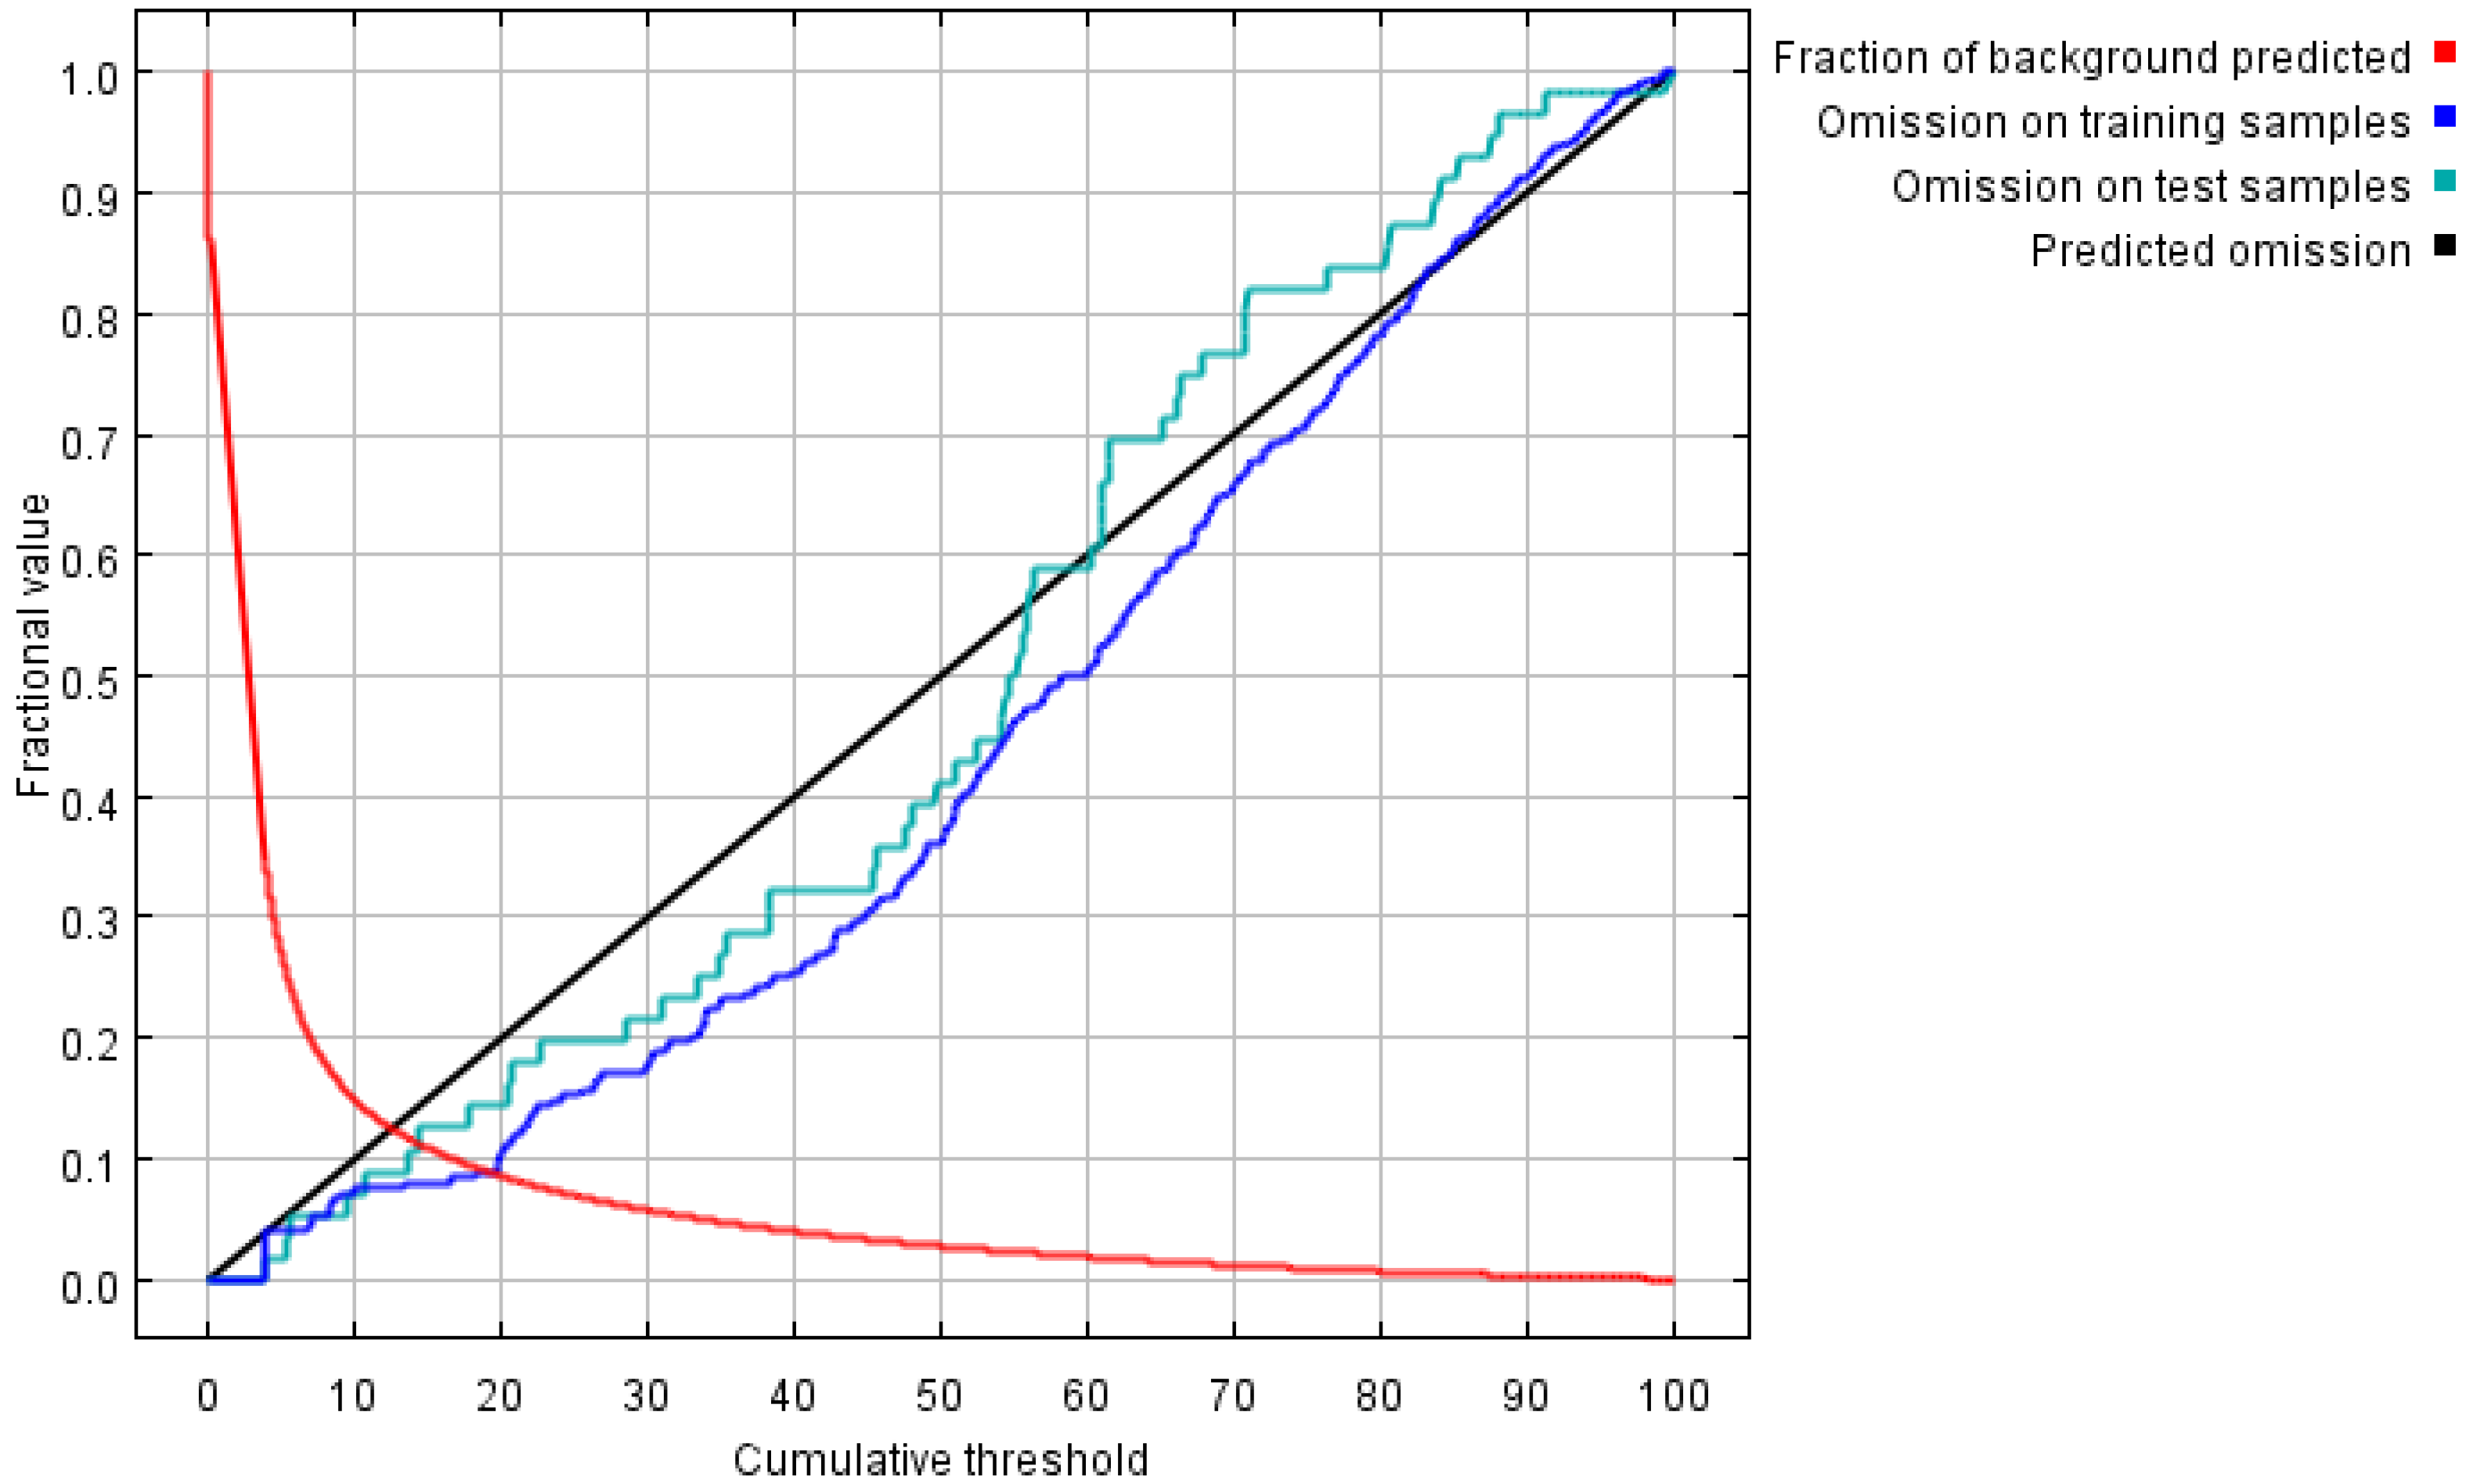
2.4.1. Model and Evaluation

In this study, Maxent (Version 3.4.1) was applied (https://biodiversityinformatics.amnh.org/open_source/maxent/ accessed on 7 July 2021). Maxent is a model for assessing species distribution based on species occurrence records and environmental factors [42]. It can be used to model the geographical distribution of species using existing datasets and generate habitat suitability maps [43].
Grasshopper distribution probability maps were generated using the cross-validation approach with the number of model runs set to 30. Grasshopper occurrence sites were randomly divided into two parts as training (70%) and testing (30%) datasets for each year. Matching environmental factors were used as inputs to Maxent. Model accuracy was evaluated in terms of the omission rate and predicated area (ORPA) and the area under the curve (AUC) of the receiver operating characteristic (ROC) curve. The importance of every factor was evaluated on the basis of the jackknife technique and the response curves reflect the influence of each environmental factor on the prediction result. Maxent provides output in three formats, and the logistic format was selected as the output format in this study. Output values represent the species distribution probability range from 0 to 1. According to a previous study [44] and the characteristics of Hulunbuir grassland, four levels of suitability were set: unsuitable (0–0.05), less suitable (0.05–0.33), moderately suitable (0.33–0.66), and most suitable (0.66–01). The Maxent model is described in detail by Phillips et al. [42,43].

2.4.2. Hurst Index

The Hurst index was first proposed by H.E. Hurst in 1965. The basic idea of the Hurst index is to estimate the data trend through rescaled range analysis (R/S). This index is used to predict the variation trend of features based on long time series datasets, and it has been reported to be effective for predicting future trends [45,46]. In this study, the Hurst index was used to estimate the future trends of grasshopper suitability. The specific calculation formula is as follows.
The time series of the suitable index is defined as SIi (i = 1, 2, 3, …, n). For any positive integer τ, the differential sequence is:
Δ S I i = S I i S I i 1
The mean value sequence of the time series is:
S I τ ¯ = 1 τ i = 1 τ Δ S I i
The cumulative dispersion sequence is:
X ( t , τ ) = i = 1 τ S I i S I τ ¯
The range sequence is:
R ( τ ) = max 1 i τ X ( t , τ ) min 1 i τ X ( t , τ )
The standard deviation sequence is:
S ( τ ) = { 1 τ i = 1 τ ( S I i S I τ ¯ ) 2 }
Finally, the Hurst index can be expressed as:
R ( τ ) / S ( τ ) = ( τ 2 ) H
where H is the Hurst index. When H = 0.5, Ri = 0, indicating no correlation before and after the locust suitability index time series. If 0 ≤ H < 0.5, the future trend opposes the past trend, and the closer H to 0, the more opposite the trend. When 0.5 < H ≤ 1, the future trend is consistent with the past trend, and the closer H to 1, the higher the consistency.

3. Results

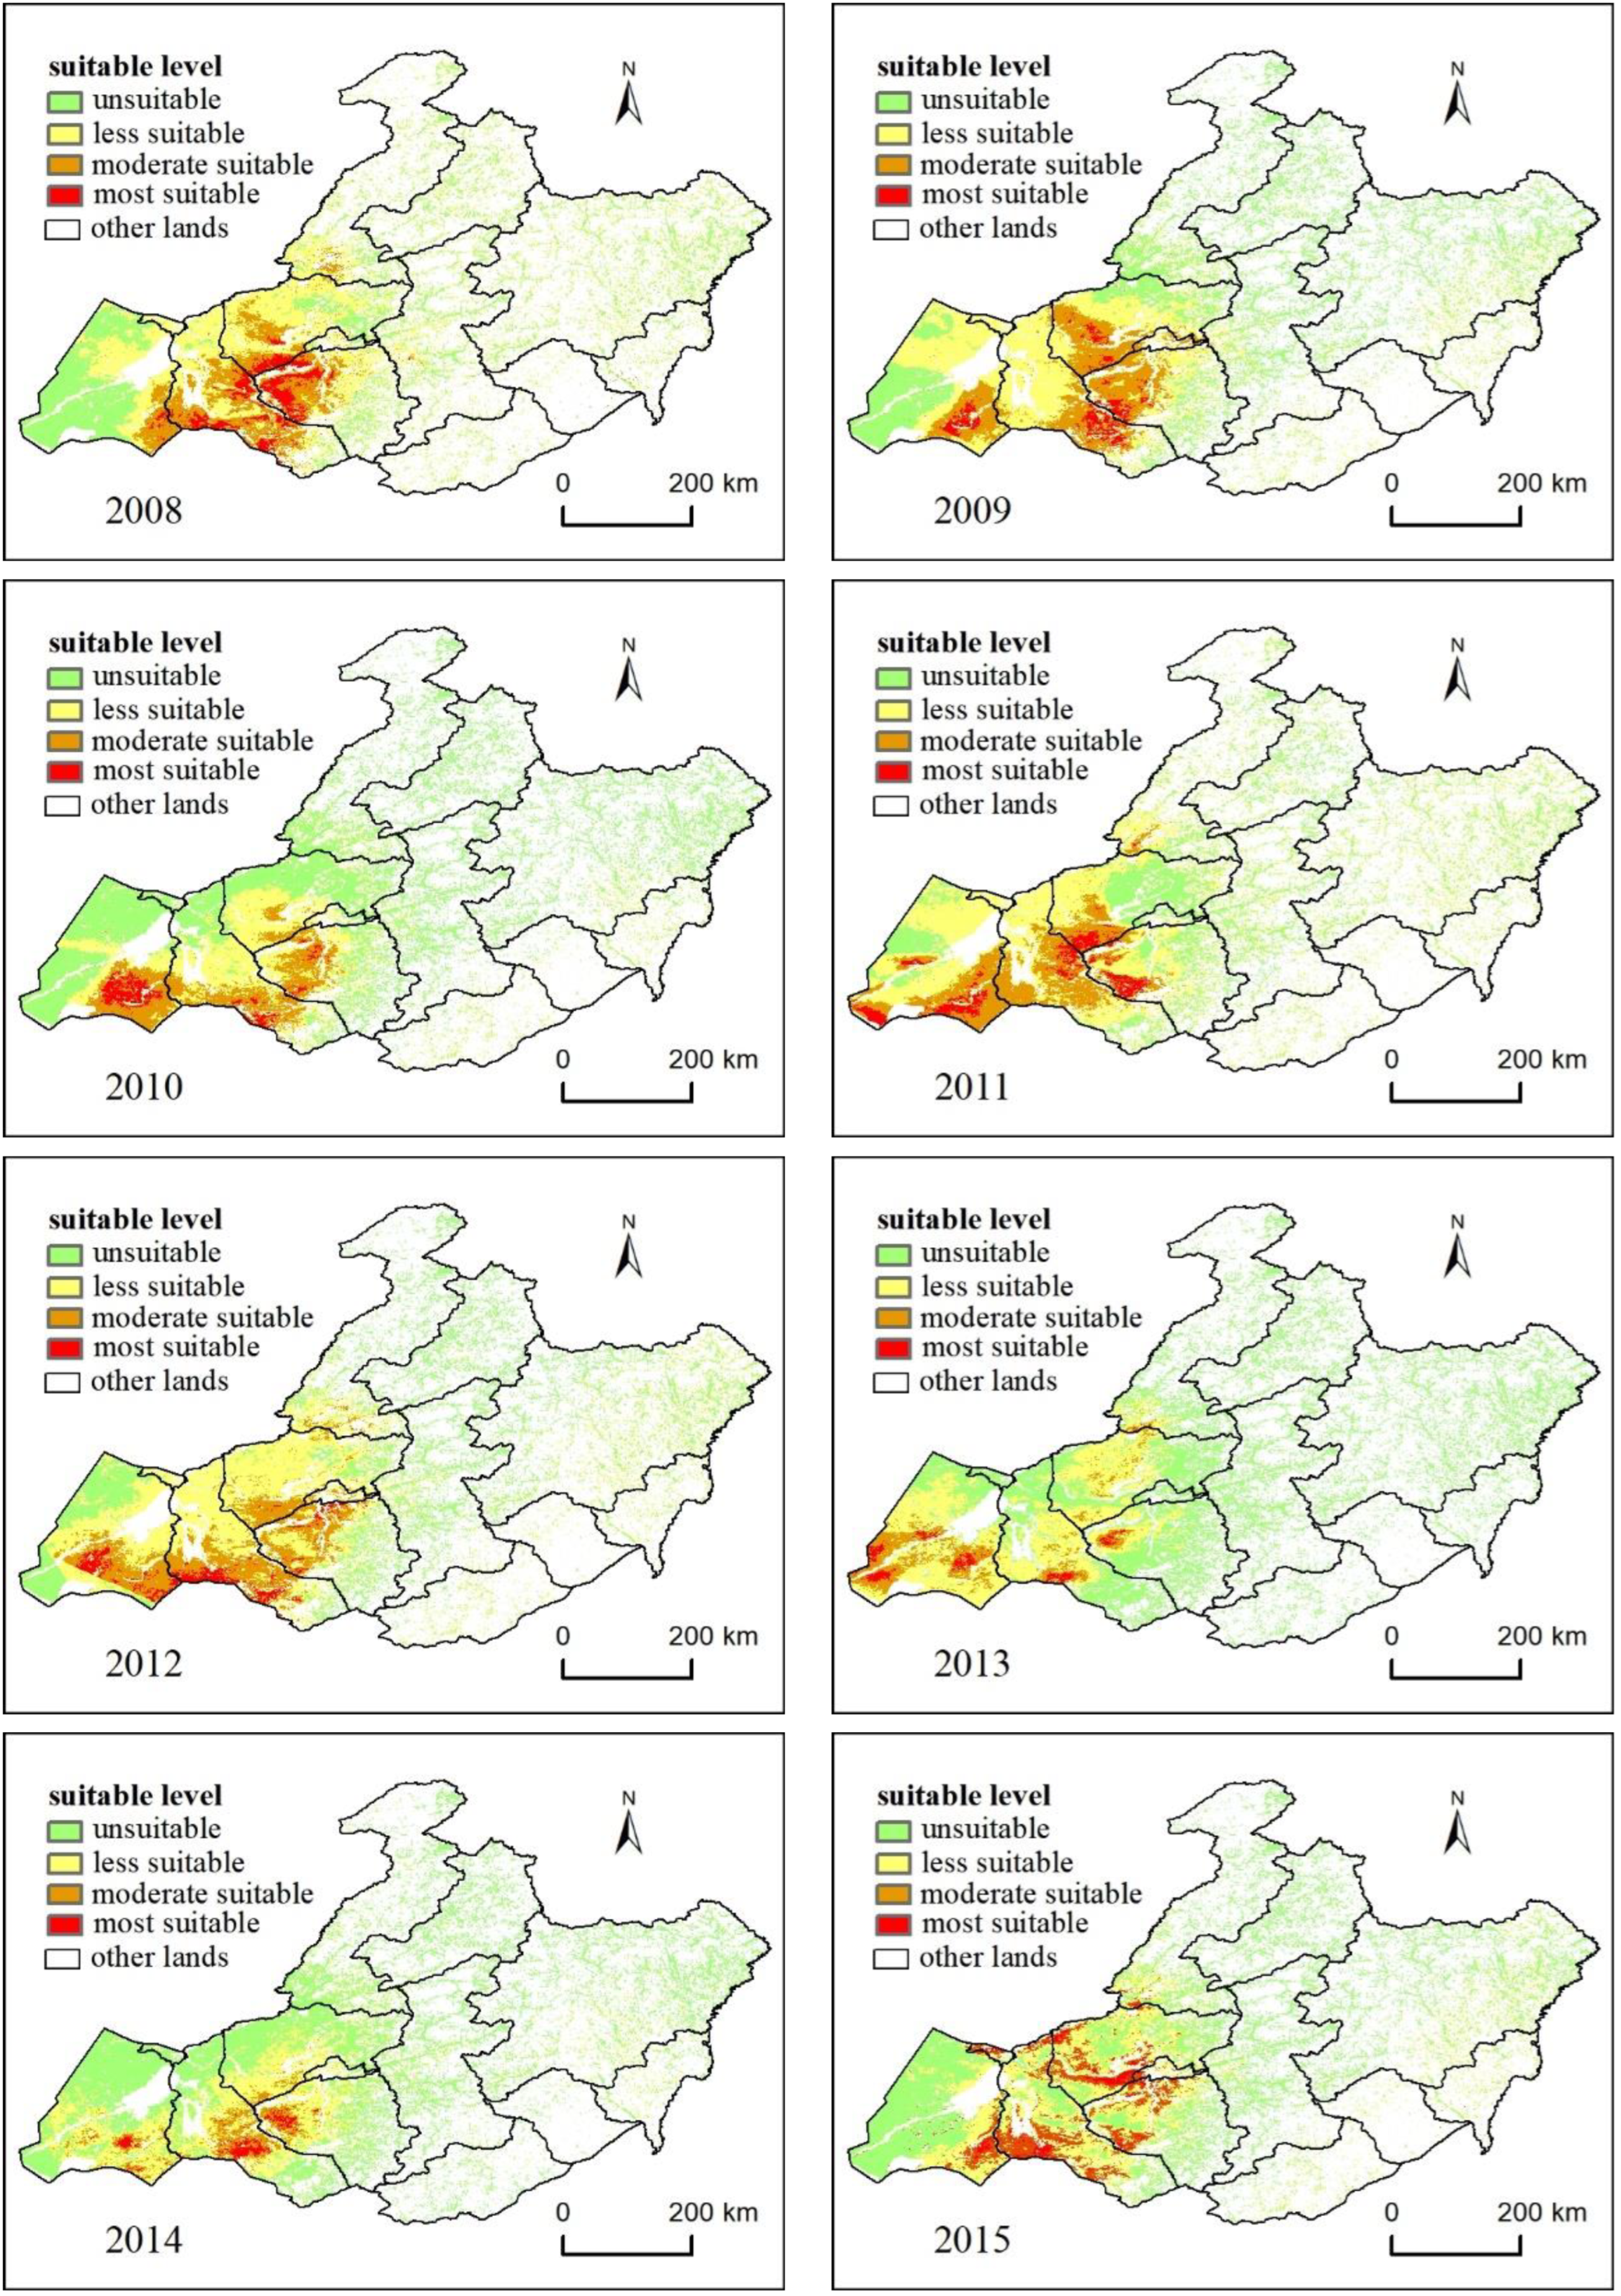
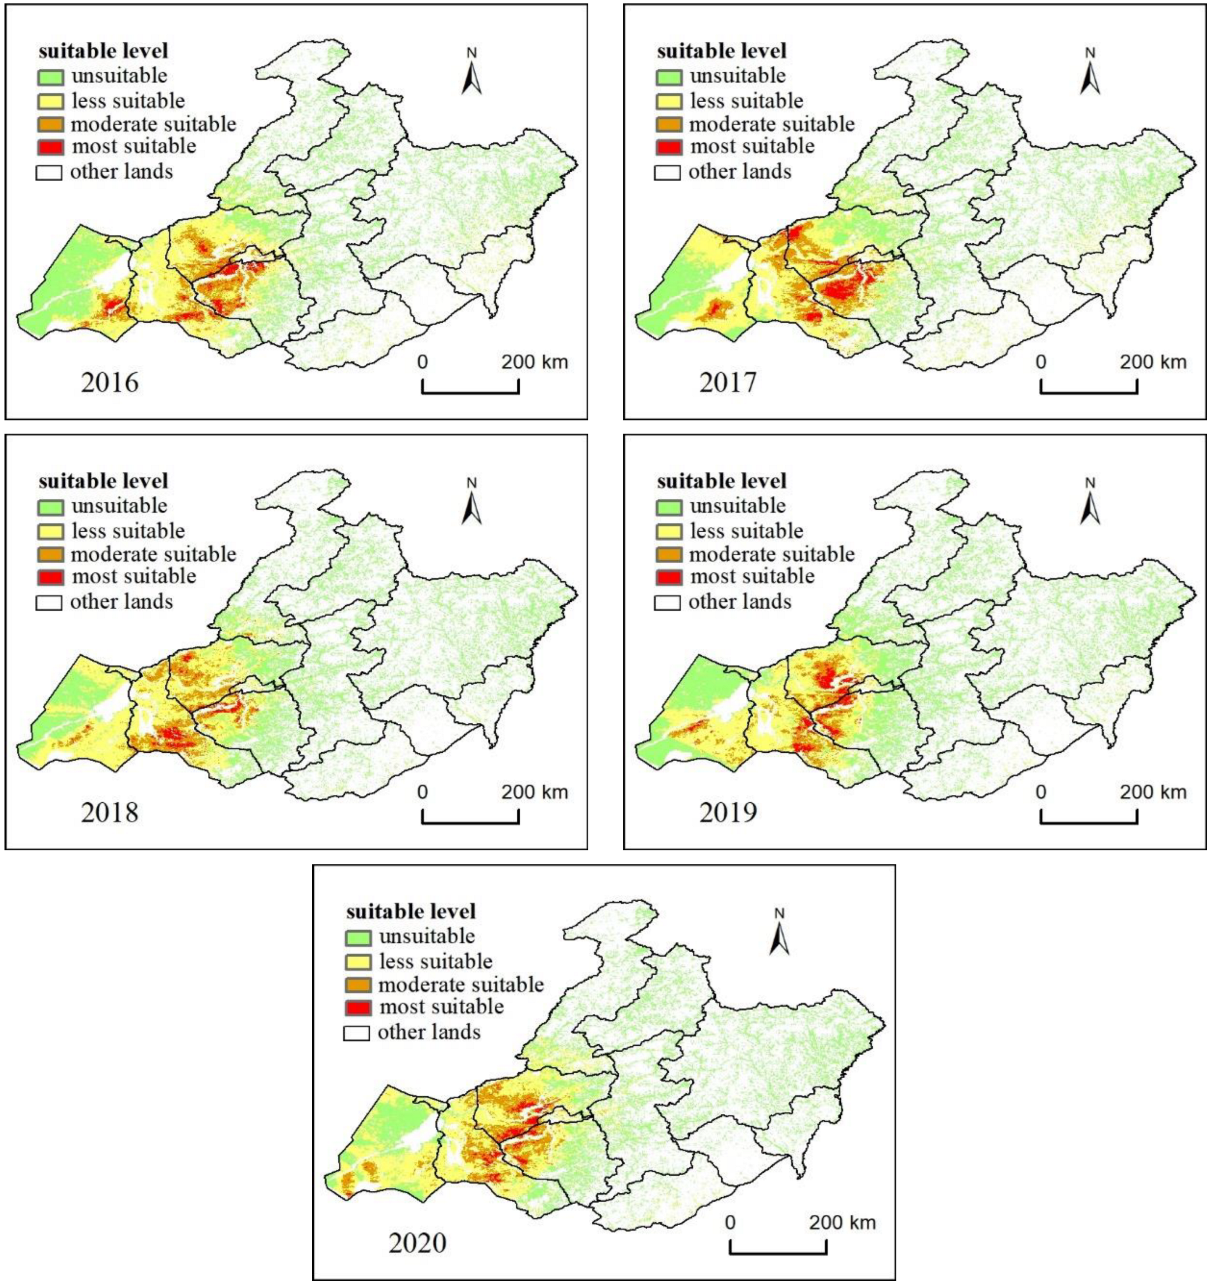
3.1. Spatial-Temporal Distribution Characteristics of Grasshopper Potential Suitable Areas

3.1.1. Distribution Characteristics of Potential Suitable Areas

In this study, grasshopper occurrence sites for each year in the past 13 years and 51 environmental factors were analyzed. For the past 13 years, the AUC of the training data ranged from 0.897 to 0.973, and that of the testing data ranged from 0.853 to 0.971. Omission on training samples and omission on test samples were close to the predicted omission (Figure 3). These results suggest that the Maxent model is fully capable of determining the suitability index of grasshoppers in the study area. AUC values greater than 0.8 indicate good performance. In this study, as AUC values reached higher than 0.9, the Maxent model showed excellent performance in predicting species distributions.
Figure 4 shows maps of potential grasshopper outbreak areas during the study period. These results imply that some changes occurred in the potential grasshopper outbreak areas from 2008 to 2020. In the early years of the study, some spatial changes were observed in the most suitable and moderately suitable areas. However, in most years, they were mainly concentrated in the east of Hulunbuir grassland. Areas of severe outbreak appeared in the western part only in few years, such as in 2010, 2011, 2012, and 2013. The spatial distributions of the most suitable and moderately suitable areas were relatively concentrated in most years, and they were scattered only in 2013 and 2015. The less suitable areas were mainly located in the central and northern parts. The unsuitable area was mainly distributed along the margin of the study area, especially on the western edge. Therefore, it can be concluded that the spatial distribution characteristics of potential grasshopper outbreak vary in most years. The most suitable and moderately suitable areas mainly appeared in the eastern part of Hulunbuir grassland.

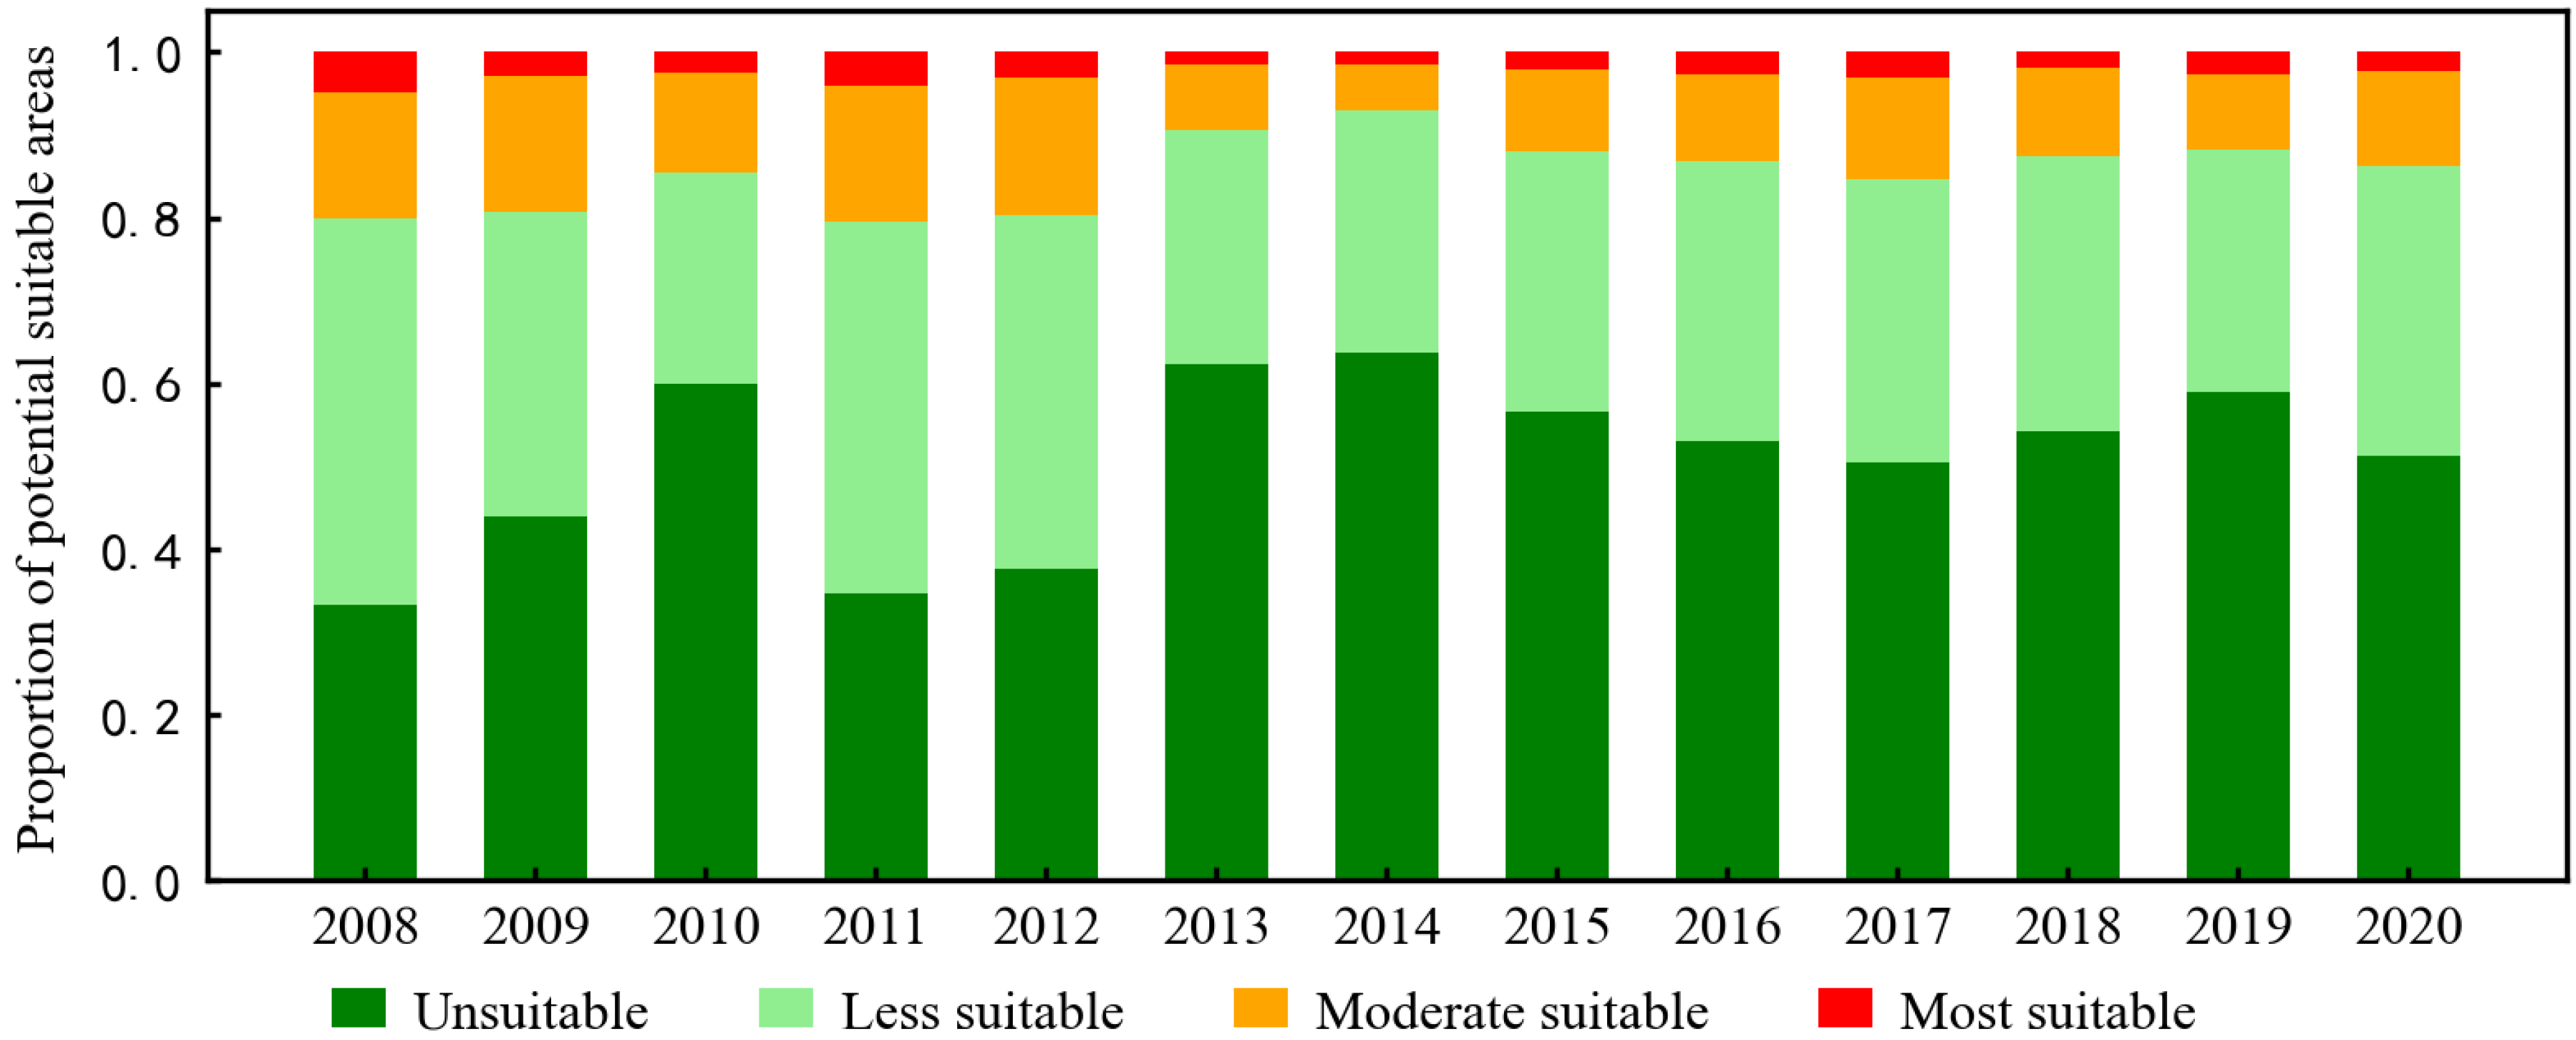
3.1.2. Temporal Variation Characteristics of Potential Suitable Areas

To reveal the trend of the temporal variation in the grasshopper suitability index, the trend of the suitability index for each pixel from 2008 to 2020 was determined (Figure 5a), and the significance of the trend was tested according to the F-value (Figure 5b). Figure 5 shows that the trend of the grasshopper suitability index slightly varied with time and the values ranged from −0.34 to 0.33. Most regions showed the least significant increasing or decreasing trends, with values between −0.1 and 0.1, located in the western or mid-eastern grasslands (Figure 5a). Only a small area exhibited significant changes (Figure 5b): the northeastern region showed a prominent increasing trend (0.15–0.33), whereas the south and southeastern regions showed decreasing trends (−0.34 to −0.15).
Figure 6 presents the proportions of different levels of potentially suitable areas from 2008 to 2020. The proportions of unsuitable areas were the highest in most years, except for 2008, 2011, and 2012, followed by less suitable areas, moderately suitable areas, and most suitable areas. The proportion of different suitable areas changed during the study period. The percentage of unsuitable areas was between 33.2% (2008) and 63.8% (2014). The percentage of less suitable areas was between 25.5% (2010) and 46.7% (2008). The percentage of moderately suitable areas was between 5.7% (2014) and 16.5% (2012). The standard deviations of the proportion of unsuitable areas, less suitable areas, and moderately suitable areas were 0.099, 0.063, and 0.033, respectively. In contrast, the percentage of the most suitable areas showed the smallest change (0.009). The minimum and maximum percentages of the most suitable areas were 1.5% (2014) and 4.8% (2008), respectively. Its standard deviation was 0.009. Over 2008–2020, the areas of potentially unsuitable areas displayed an increasing trend (Slope = 0.0128, R2 = 0.2331). On the contrary, the other three types exhibited a decreasing trend: less suitable area with Slope = −0.0068 and R2 = 0.1653, moderately suitable area with Slope = −0.0048 and R2 = 0.2939, and most suitable area with Slope = −0.0012 and R2 = 0.0095.

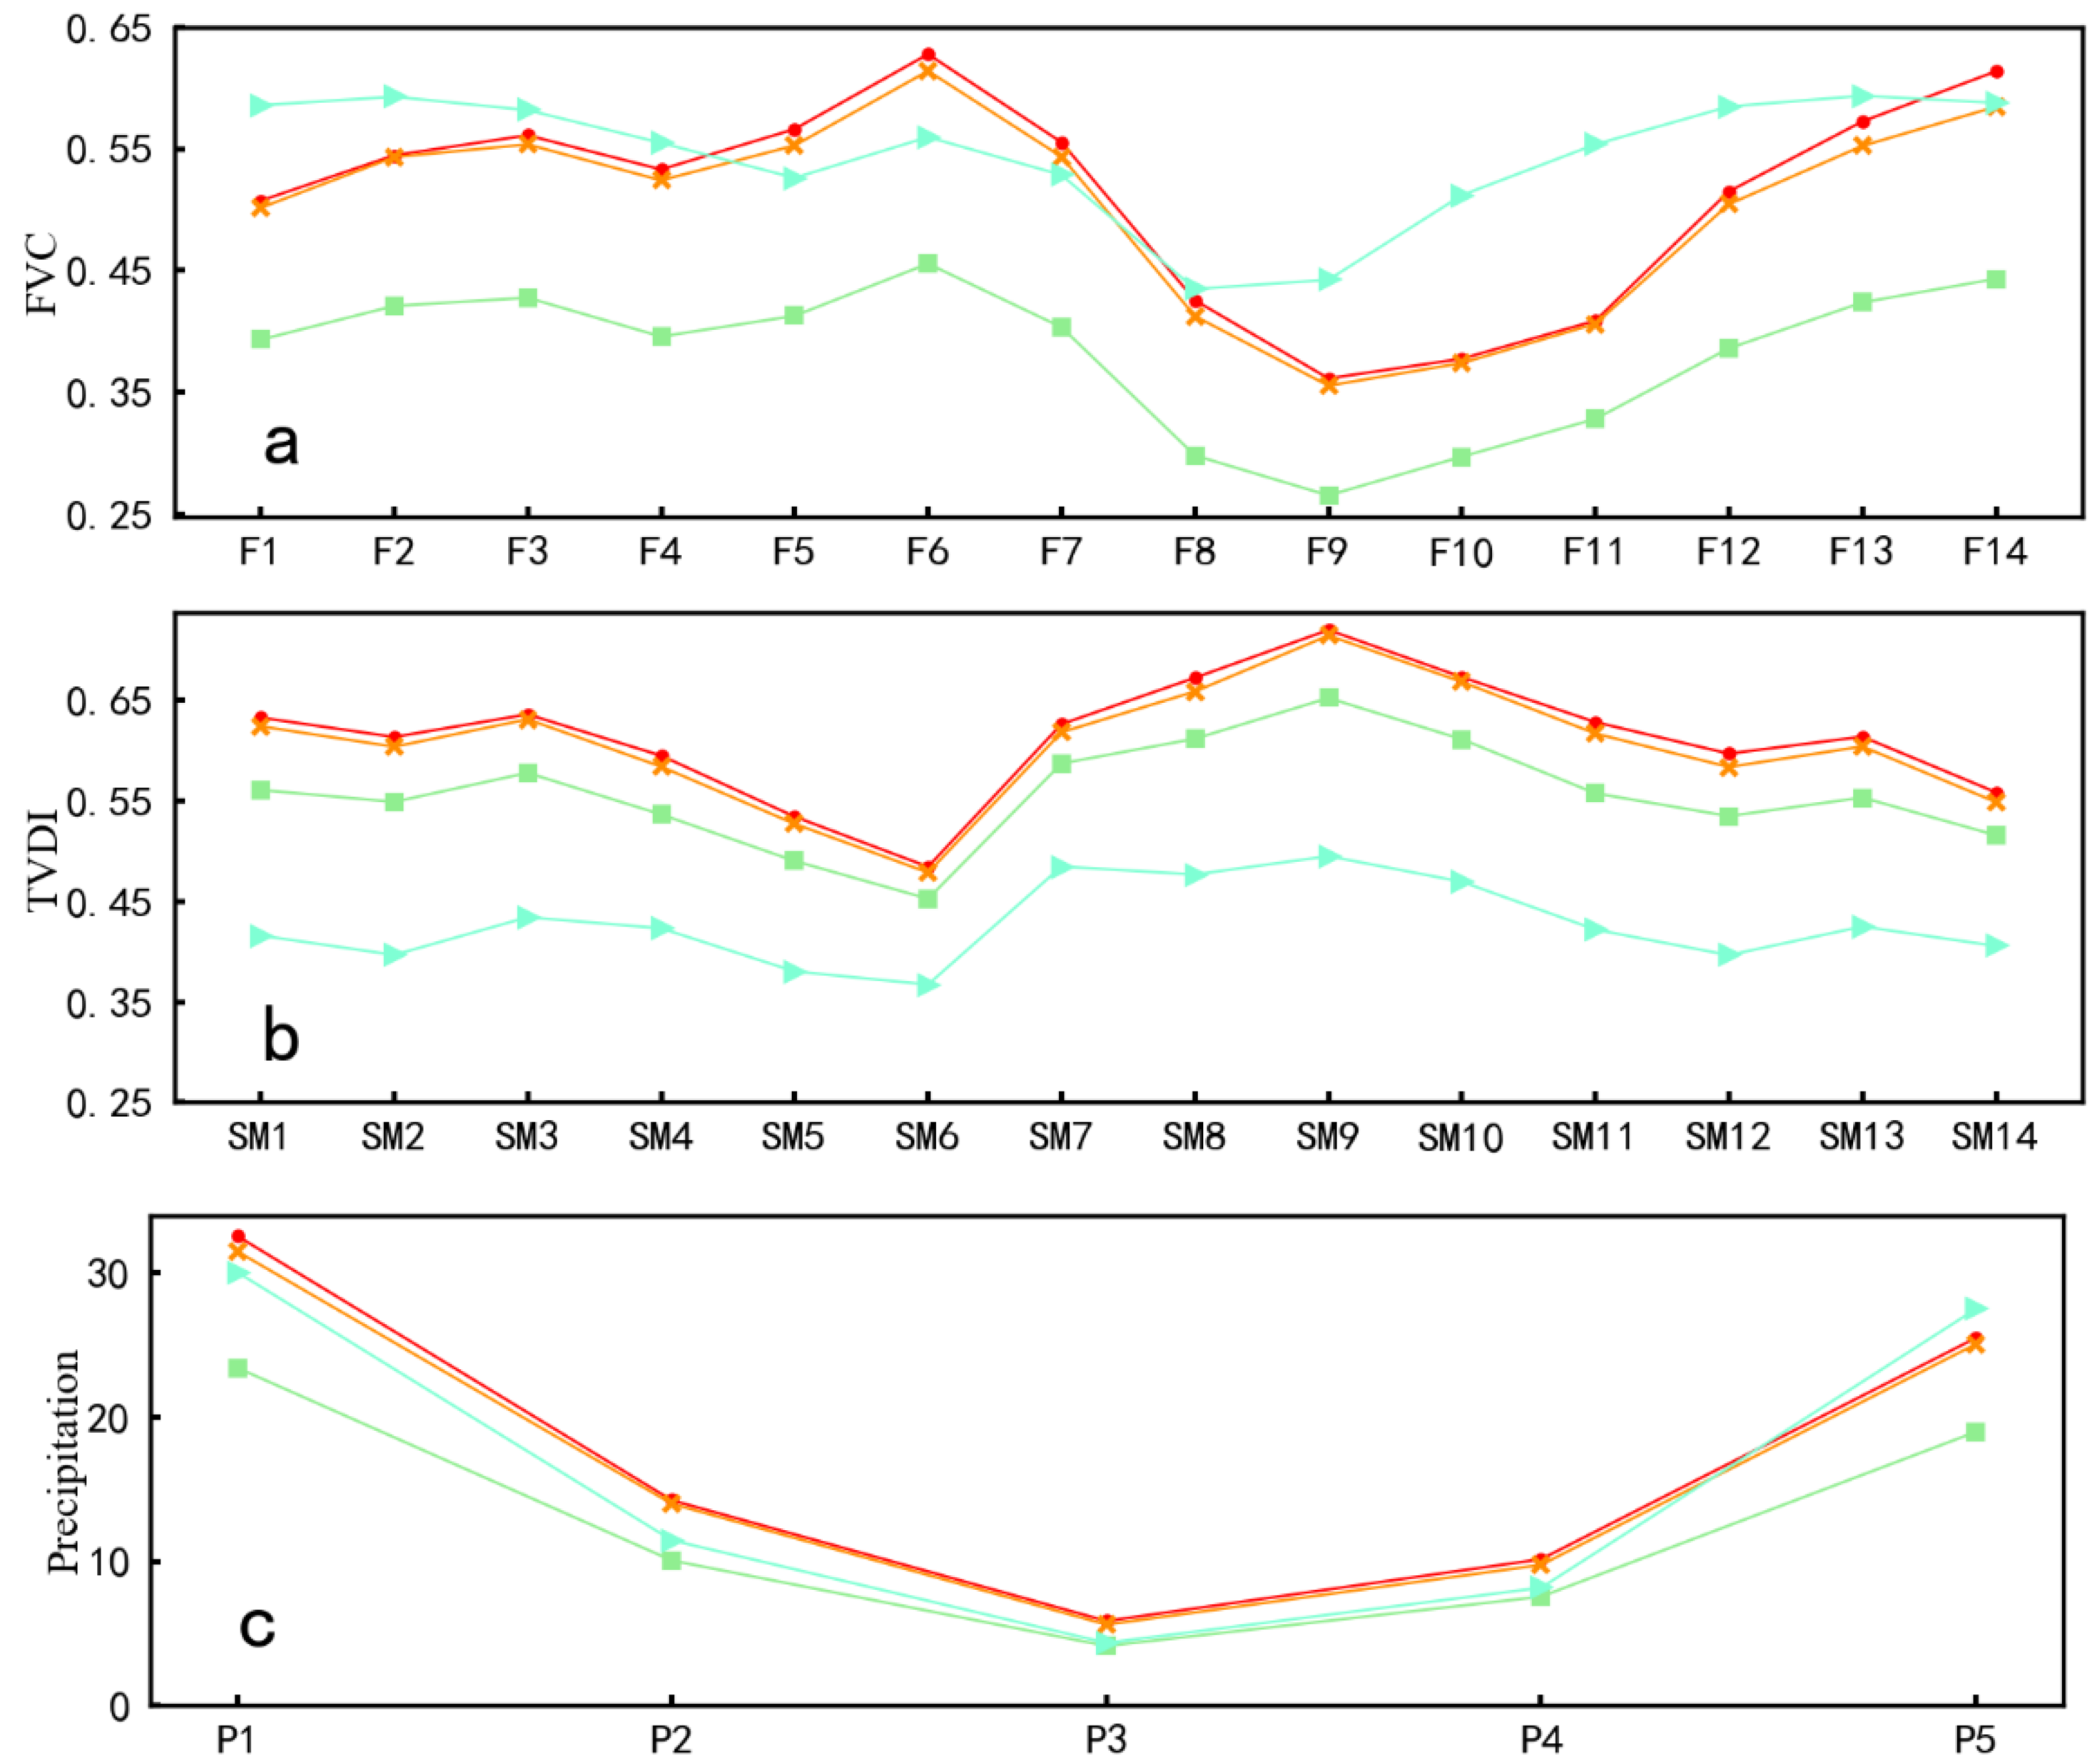
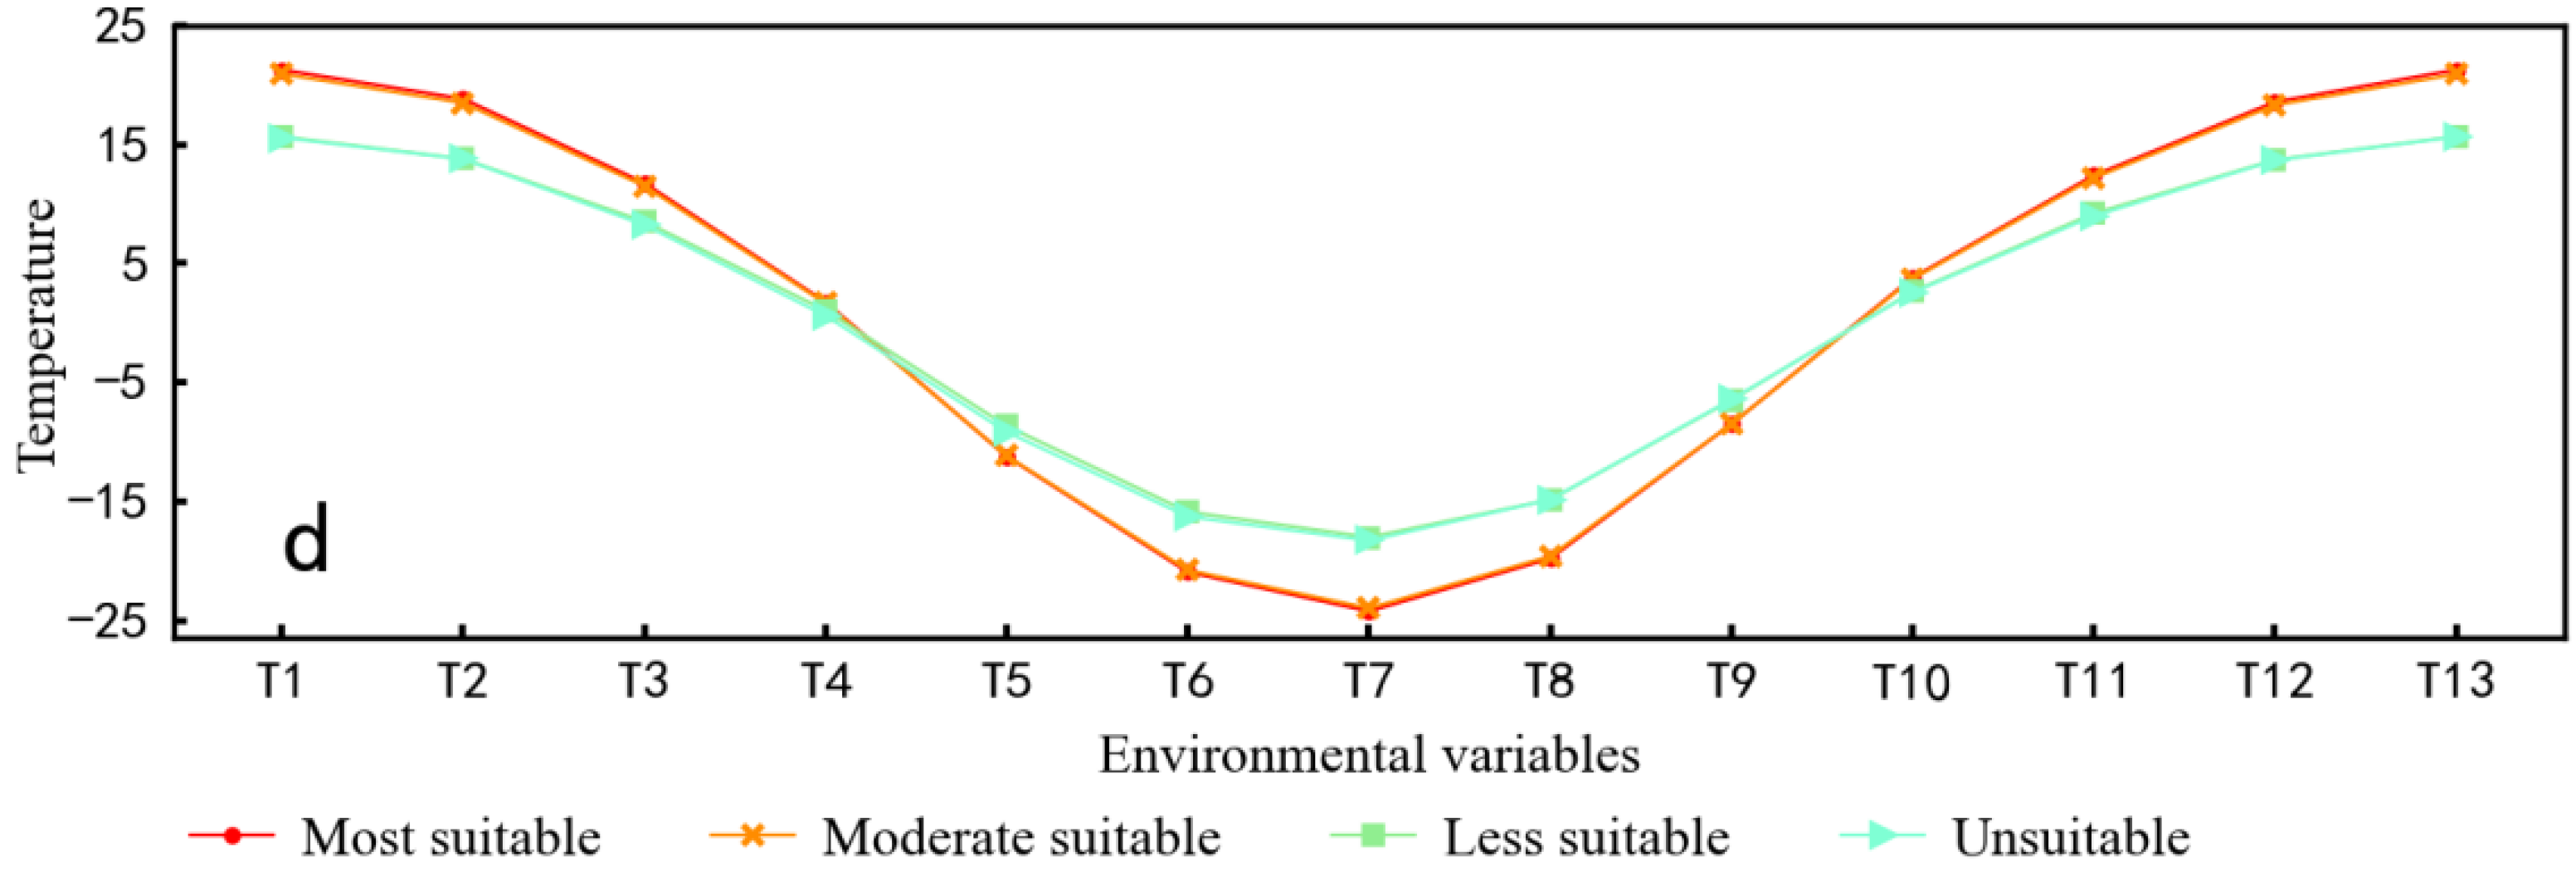
3.2. Correlation between Suitability Levels and Environmental Factors

Maxent can be used to calculate the relative importance of eco-environmental factors through a jackknife test and reveal the influence mechanism of each eco-environmental variable on the prediction. According to the output result, terrain and landforms factors, including ASP and SL, showed weaker effects on the prediction. However, the average altitudes of the most and moderately suitable areas were 678.2 and 652.9 m, respectively, which are significantly higher than those of the less suitable (480.8 m) and unsuitable areas (520.5 m). This suggests that elevation can directly or indirectly influence the grasshopper suitability index. Soil and vegetation type played an important role in determining the distribution of grasshoppers over the past 13 years, with weak influence only in some years. In the most suitable and moderately suitable areas, the main soil types are Chestnut soil (Chestnut soil, Alkalized Chestnut soil, Meadow Chestnut soil), Aeolian soil (Grassland Aeolian soil), and Chernozems (Light Chernozems), and the main vegetation types are temperate grasses. FVC, SM, P, and T showed wide intra- and inter-annual variability in Hulunbuir grassland from 2008 to 2020. In other words, the contribution of the same environmental factor to the delineation of suitable areas varied considerably among different years within the same time period and different time periods within the same year.
In order to further illustrate the influence mechanism of each eco-environmental variable on the grasshopper suitability index in Hulunbuir grassland, the average values of FVC, SM, P, and T at difference suitability levels during the study years were statistically determined. Figure 7 shows that the eco-environmental factors exhibited significant differences among different levels of suitability. Some diversities in environmental variables can be clearly observed between the four levels of suitability. On the whole, the trends of environmental variables were similar between the most suitable and moderately suitable areas, but they varied between the less suitable and unsuitable areas. Key factors directly or indirectly influencing grasshopper distribution could be obtained by comparing differences in the values of these environmental variables among the four levels of suitability.
The diversity of FVC under the four levels of suitability is shown in Figure 7a. The values of F1, F2, and F6 in the spawning period, F9 and F10 in the incubation period, and F11 and F12 in the breeding period significantly varied between suitable areas (most suitable area, moderately suitable area) and non-suitable areas (less suitable area, unsuitable area). During the spawning period, F1 and F2 in the most suitable areas and moderate suitable areas were higher than those in the less suitable areas but less than those in the unsuitable areas. F6 in suitable areas was higher than that in unsuitable areas and far outweighed that in the less suitable areas. During the incubation period, F9 and F10 in the suitable areas (most suitable and moderately suitable areas) were between those in the less suitable areas and unsuitable areas. The change characteristics of FVC (F11, F12) were consistent between the breeding and incubation periods.
TVDI is a good indicator of land surface soil moisture. It ranges between 0 and 1, with lower values representing wet conditions and higher values representing dry conditions. In general, it is divided into five levels: wet (0–0.2), normal (0.2–0.4), slight drought (0.4–0.6), moderate drought (0.6–0.8), and severe drought (0.8–1.0). As shown in Figure 7b, SM showed higher values in suitable areas compared to non-suitable areas. Particularly in suitable areas, the drought condition during the spawning period, including SM1, SM2, and SM3, corresponded to moderate drought. At the same time, less suitable areas experienced slight drought, and unsuitable areas did not face drought. From SM7 to SM9, grasshoppers entered the incubation period, and drought in suitable areas became increasingly more serious. In the breeding period, between SM10 and SM14, suitable areas experienced moderate drought or slight drought, whereas less suitable areas and unsuitable areas experienced slight drought or no drought.
In this study, only five months of precipitation were considered to compensate for the lack of TVDI. P1 and P2 represent precipitation in September and October, respectively, reflecting soil moisture during the overwintering period. P1 and P2 in the suitable areas were both greater than those in the less suitable areas and much greater than those in the unsuitable areas (Figure 7c). This phenomenon indicates that proper precipitation in the fall and early winter can increase the survivability of grasshopper eggs through winter. During the incubation period, precipitation (P3 and P4) in suitable areas remained greater than that in non-suitable areas, but P5 in unsuitable areas was greater than that in suitable areas.
Throughout the life cycle of grasshoppers, temperature is a key factor directly determining the distribution of grasshopper spawning, overwintering, incubation, and breeding. As shown in Figure 7d, temperature was the same between the most suitable areas and moderately suitable areas, and similar between the less suitable areas and unsuitable areas. However, some differences in temperature were observed between suitable areas and less suitable areas (Figure 7d). During the spawning of grasshoppers, T1 and T2 in suitable areas were significantly higher than those in non-suitable areas. Temperature (T6, T7, and T8) was lower in suitable areas than in less suitable areas or unsuitable areas in winter. However, in the incubation period, the temperature in suitable areas gradually increased and exceeded that in less suitable areas (T10, T11, and T12).

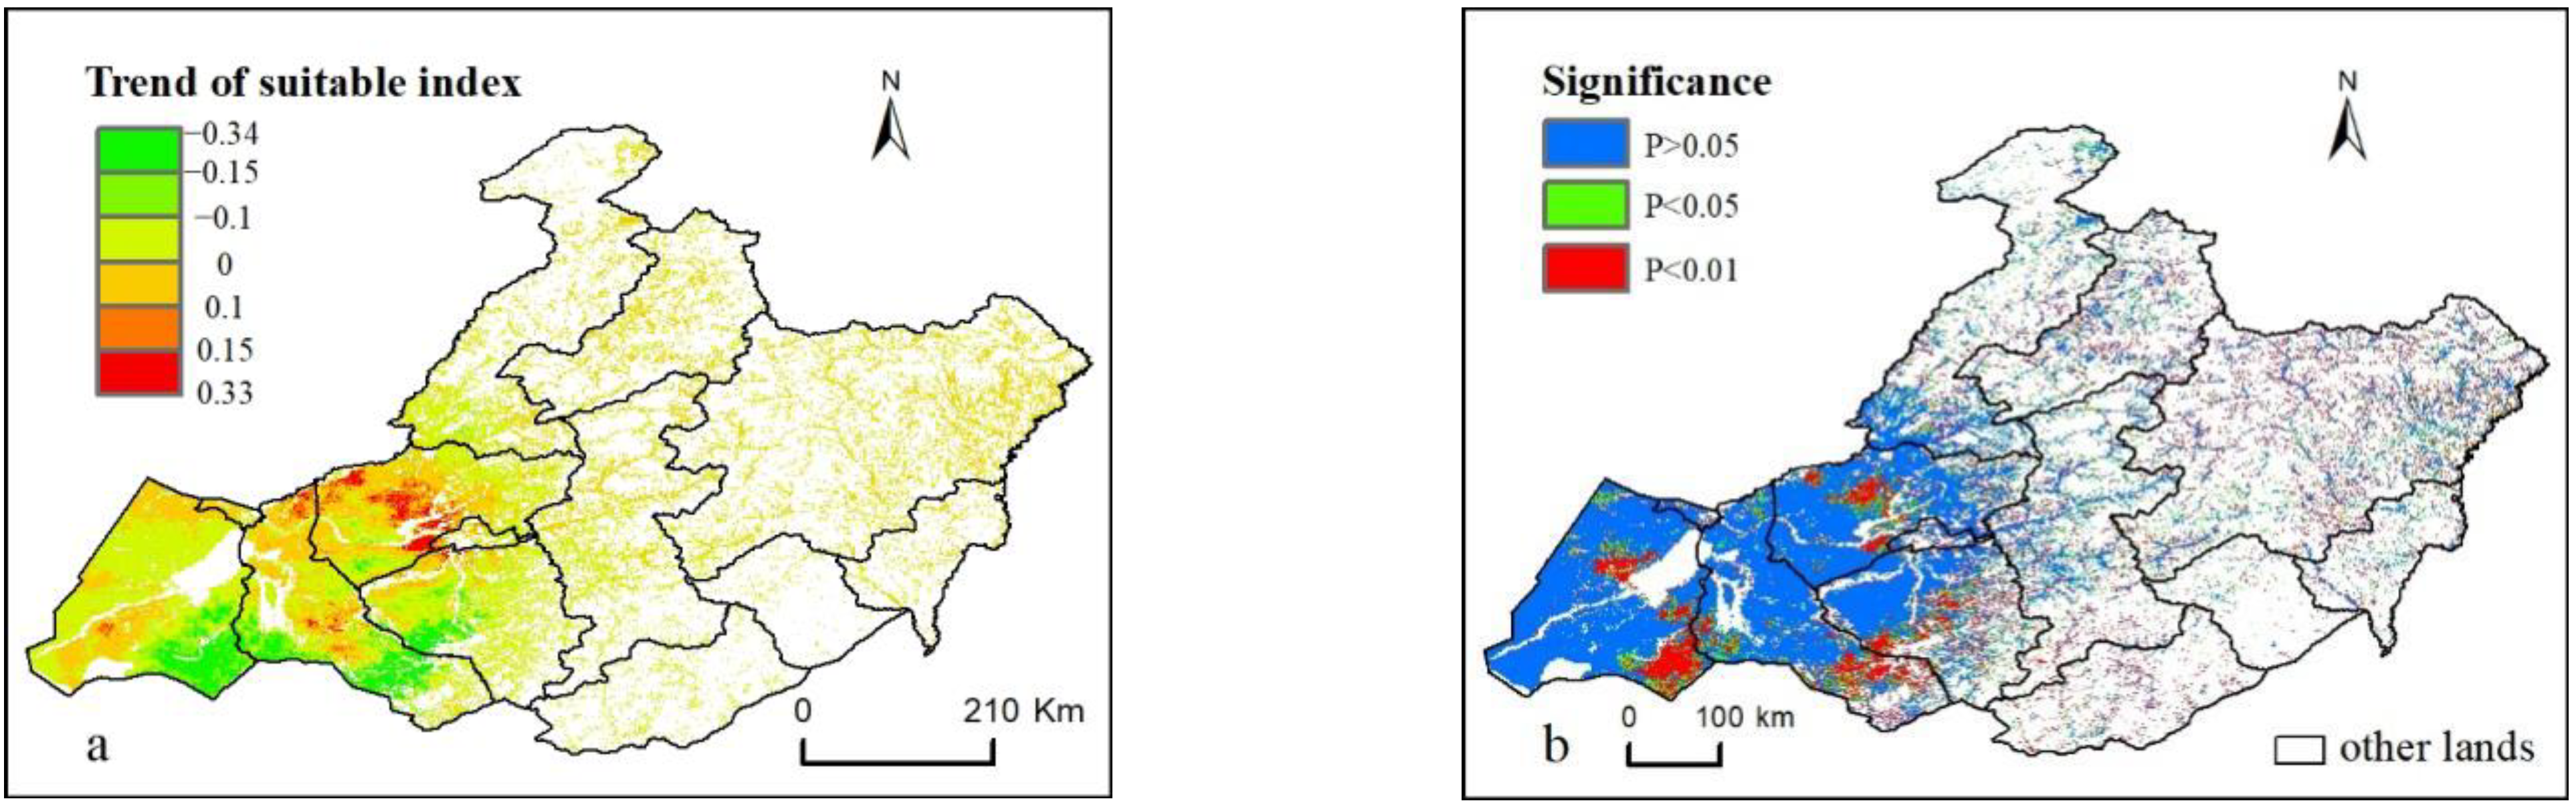
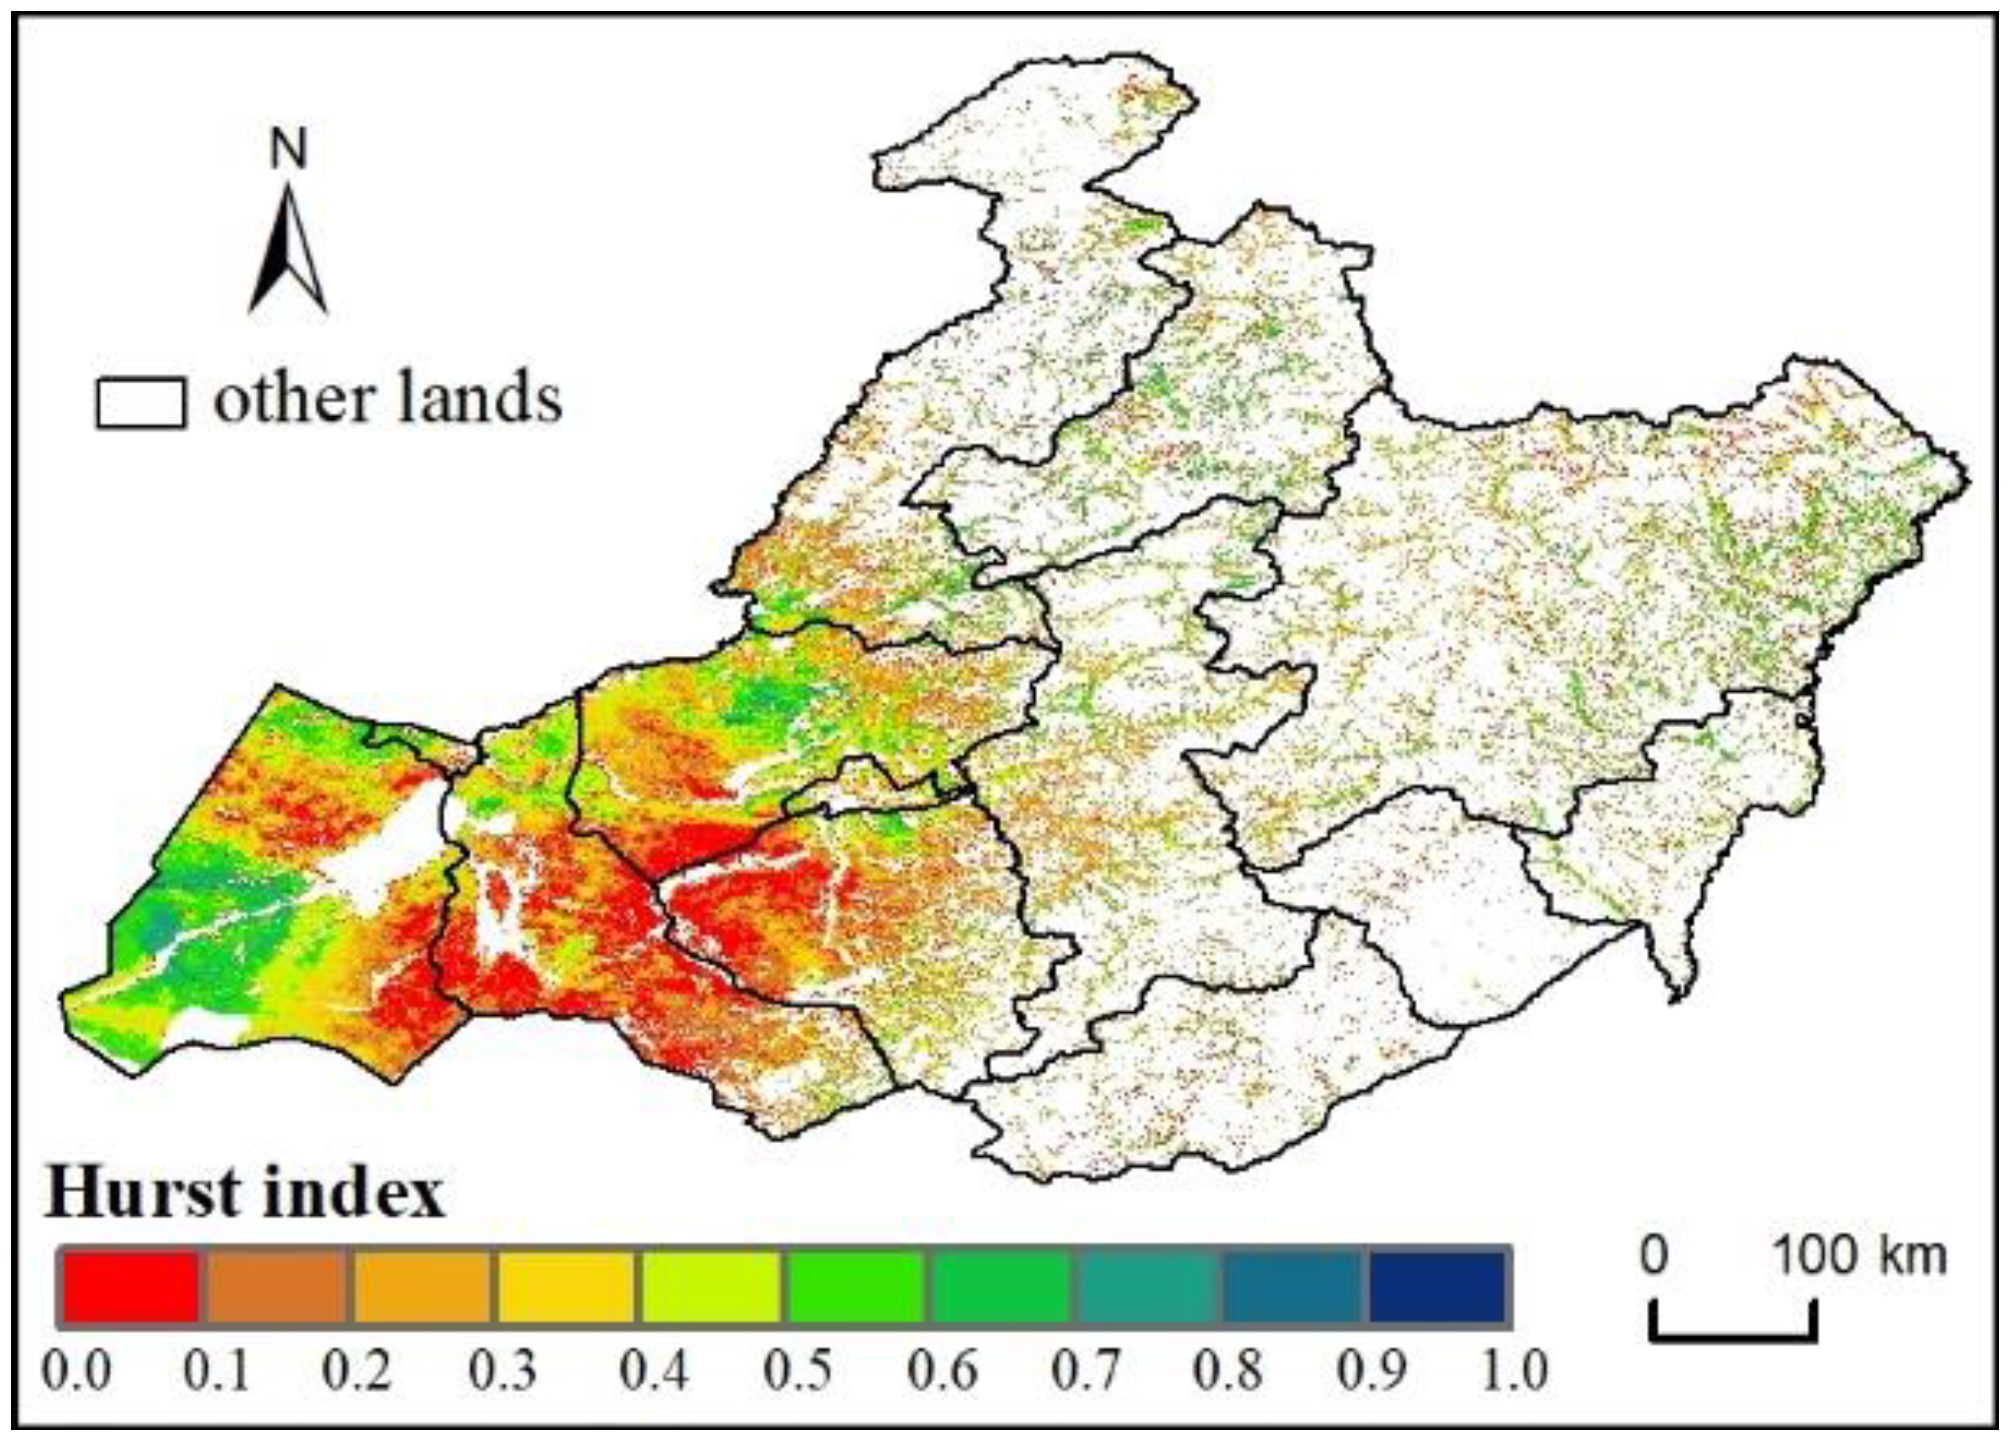
3.3. Trend Prediction of Grasshopper Suitability Index

The Hurst index (H) was used to predict the trend of the grasshopper suitability index in Hulunbuir grassland, and the predicted trend was compared with the trend from 2008 to 2020. The detailed spatial distribution of H is illustrated in Figure 8. H was not equal to 0.5, which confirms that the future trend of the grasshopper suitability index in the study area is correlated to the original trend. Most of the study area showed that H was smaller than 0.5, which indicates that the future trend of the grasshopper suitability index contradicts the past trend shown in Figure 5a. The original trend will probably be reversed in more than 67% of the study area, with most of such areas being located in the east-central part of the grassland. Areas with H between 0.1 and 0.2, between 0.2 and 0.3, and between 0.3 and 0.4 account for approximately 15.8%, 26.9%, and 13.2% of the study area, respectively. Only approximately 33% of the study area will continue the original trend. In these areas, which are located in the western and northeastern parts of the study area, H generally ranges from 0.5 to 0.7. Combined with the trend of the suitability index during the study year (Figure 5), the trend of the grasshopper suitability index can be concluded to contradict the original trend in areas exhibiting a significant increasing trend (distributed in the northeastern part of the study area) or significant decreasing trend (distributed in the south and southeastern parts of the study area) in the past.

4. Discussion

In the study of potential grasshopper outbreak over vast remote areas with complex terrain and low accessibility, a large number of trained researchers are required to collect field survey data [47]. Therefore, it is difficult to perform complete surveying of potential grasshopper outbreak areas within a narrow time frame. The development of satellite remote sensing technology has provided a means of quick and effective monitoring and prediction of potential grasshopper outbreak areas [17,48]. In recent years, large machine learning models have been widely used in grasshopper monitoring and prediction, achieving remarkable results [29]. This study further integrated the Maxent model, satellite remote sensing data, meteorological data, and other geographical environment elements to calculate the suitability index and map suitable zones for grasshoppers in Hulunbuir grassland.
In the proposed model for analyzing the effect of environmental factors on grasshopper habitat suitability, the potential effects of correlation between variables were not considered. These variables may somehow be correlated, but the correlation did not exhibit any significant influence on the results. This is because overgrazing is very common in the study area and may lead to ecosystem degradation, which would further lead to the decrease in vegetation cover and reduce the correlation between vegetation cover and precipitation or soil moisture. Ecosystem degradation also reduces the correlation between monthly vegetation biomass. Moreover, harvesting of forage will directly change the distribution of vegetation biomass, thus reducing the correlation between environmental factors. Nevertheless, the high AUC values (of both training and testing data) and ORPA suggest that the Maxent model is suitable for estimating the grasshopper suitability index.
Analyzing the different levels of suitability, their spatial distributions were found to vary widely from 2013 to 2020. According to output results, some general observations can be made: First, during the past 13 years, suitable areas including the most suitable area and moderately suitable area were mainly located in the eastern part of Hulunbuir grassland. The most suitable area occupied a small proportion and exhibited the smallest change. Over time, the proportion of moderately suitable areas changed considerably. Therefore, to achieve accurate monitoring and prediction of grassland, the monitoring of moderately suitable areas needs to be strengthened. Secondly, altitude was found to play an important role in grasshopper monitoring and prediction. In contrast, aspect and slope showed a weaker influence, which conflicts with some studies [36]. This result can be mainly attributed to the spatial resolution of the raster data in this study (1000 m). Some studies have proven that remote sensing data having high spatial resolution can improve the accuracy and efficiency of identifying suitable grasshopper breeding areas [49]. Therefore, it is necessary to confirm the roles of aspect and slope in the monitoring of potential suitable areas for grasshoppers. Finally, vegetation, edaphic, and meteorological factors are vital variables that directly or indirectly determine the potential distribution of grasshoppers. Nevertheless, not all sub-factors play an important role in grasshopper growth, and the same ecological factors may have different contributions in different years. The major reason for this phenomenon is the large spatial variability in the four grasshopper suitability zones during the study years. This suggests that the weighting coefficients of different eco-environmental factors vary considerably under different spaces within the same period, and the weighting coefficients of the same factor vary considerably in the same space at different times. To identify the key factors influencing the life cycle of grasshoppers, the average values of different environmental factors at four levels of suitability were calculated for each year. Individual factors exhibited distinct variability at the four suitability levels. In most cases, these differences in environmental factors supported the determination of indices for monitoring and predicting the potential areas of grasshoppers.
In this study, only some abiotic indicators were considered. Grasshopper egg laying, overwintering, hatching, and breeding are affected by several other factors, such as soil nitrogen content, soil viscosity, soil bulk density, land use, and land cover [50,51,52]. As a result of the advancement of remote sensing technology, more near real-time remote sensing data with higher spatial resolution will become accessible, and more novel algorithms will be proposed. Such developments will ease the calculation and identification of habitat indicators. To achieve effective monitoring and prevention of grasshopper disasters in the future, the following issues remain to be addressed: selection of critical and significant variables closely related to the distribution of grasshoppers, determination of appropriate thresholds for each variable, development of strategies for integrating relevant variables to build a model, assignment of weighting coefficients for each variable, and determination of a solution for the problem of variability in weighting coefficients induced by spatial and temporal disparities.
Hulunbuir covers typical steppes and meadow steppes in northern China. This study analyzed the characteristics of grasshopper outbreaks and the main factors directly affecting the appearance of grasshoppers. It is helpful to understand the scientific rules of grasshopper occurrence in the whole northern grassland. Previous studies have rarely analyzed the temporal and spatial variability of grasshopper habitat suitability with long time series, or investigated the main influencing factors in Hulunbuir grassland over many years. From this perspective, the findings of this study contribute to the deeper understanding of the main stabilizing factors and laws of grassland grasshoppers in recent years. In addition, future trends of grasshopper habitat suitability were also predicted, which can guide the actual monitoring and early warning of grassland grasshopper outbreaks.

5. Conclusions

This study analyzed the spatial and temporal distribution characteristics of suitable zones for grasshoppers over the past 13 years, identified the main factors affecting grasshopper development, and predicted the trend of the grasshopper suitability index. With the application of the Maxent model, remote sensing, climate, soil, and other geospatial data were combined. The results showed that the Maxent model is applicable for estimating the grasshopper suitability index. The most suitable and moderately suitable areas were mainly located in the eastern and southern regions of Hulunbuir grassland, and their spatial distributions were relatively concentrated in most years. The contribution of environmental factors varied significantly at different levels of suitability. It is worth noting that factors having large variation can be selected for long time series observation and research, which can facilitate the monitoring and prediction of grasshopper disasters. During the study period, most regions showed non-significant increasing or decreasing trends. Only a small portion of the study area, located in the northeastern and southeastern parts of the study area, exhibited a significant change. In the future, the trend of the grasshopper suitability index is expected to reverse in most study areas, with only approximately 33% of the study area maintaining the original trend.

Author Contributions

B.D. and J.W. are co-first authors of the article. Conceptualization, B.D. and J.W.; methodology, N.W.; software, B.D.; validation, K.L., W.H. and N.W.; formal analysis, B.D.; investigation, X.D.; resources, J.W.; data curation, L.L.; writing—original draft preparation, B.D.; writing—review and editing, J.W. and W.H.; visualization, H.Y.; supervision, N.W.; project administration, N.W.; funding acquisition, N.W. All authors have read and agreed to the published version of the manuscript.

Funding

This research was funded by the Central Public-interest Scientific Institution Basal Research Fund, grant number Y2021XK24, Inner Mongolia Autonomous Region Science and Technology Planning Project, grant number 2021GG0069, and National Natural Science Foundation of China, grant number 42071320.

Data Availability Statement

Not applicable.

Conflicts of Interest

The authors declare no conflict of interest.

References

  1. Hewitt, G.B. Review of Forage Losses Caused by Rangeland Grasshoppers; Miscellaneous Publication, United States Department of Agriculture, Agricultural Research Service: Wahshington, DC, USA, 1977; p. 22. [Google Scholar]
  2. Zheng, X.; Song, P.; Li, Y.; Zhang, K.; Zhang, H.; Liu, L.; Huang, J. Monitoring Locusta Migratoria Manilensis Damage Using Ground Level Hyperspectral Data. In Proceedings of the 2019 8th International Conference on Agro-Geoinformatics, Istanbul, Turkey, 16–19 July 2019; pp. 1–5. [Google Scholar]
  3. Jose Escorihuela, M.; Merlin, O.; Stefan, V.; Indrio, G.; Piou, C. Smos Based High Resolution Soil Moisture Estimates for Desert Locust Preventive Management. In Proceedings of the IGARSS 2018:IEEE International Geoscience and Remote Sensing Symposium, Valencia, Spain, 23–27 July 2018; Volume 11, pp. 8275–8278. [Google Scholar]
  4. Propastin, P. Satellite-Based Monitoring System for Assessment of Vegetation Vulnerability to Locust Hazard in the River Ili Delta (Lake Balkhash, Kazakhstan). J. Appl. Remote Sens. 2013, 7, 07509. [Google Scholar] [CrossRef]
  5. He, K.; Huang, J. Remote Sensing of Locust and Grasshopper Plague in China: A Review. In Proceedings of the 2016 Fifth International Conference on Agro-Geoinformatics, Tianjin, China, 18–20 July 2016; pp. 103–108. [Google Scholar]
  6. Buckley, L.B.; Graham, S.I.; Nufio, C.R. Grasshopper Species’ Seasonal Timing Underlies Shifts in Phenological Overlap in Response to Climate Gradients, Variability and Change. J. Anim. Ecol. 2021, 90, 1252–1263. [Google Scholar] [CrossRef]
  7. Veran, S.; Simpson, S.J.; Sword, G.A.; Deveson, E.; Piry, S.; Hines, J.E.; Berthier, K. Modeling Spatiotemporal Dynamics of Outbreaking Species: Influence of Environment and Migration in A Locust. Ecology 2015, 96, 737–748. [Google Scholar] [CrossRef]
  8. Qi, G.; Bai, S.; Pan, X. Study on the Model between the Occurrence Area of Grasshopper and the Characteristic Quantity Indexes of Atmospheric Circulation in Western Aletai. Plant Dis. Pests 2010, 1, 46–50. [Google Scholar]
  9. Ciplak, B. Locust and Grasshopper Outbreaks in the Near East: Review under Global Warming Context. Agron. Basel 2021, 11, 111. [Google Scholar] [CrossRef]
  10. Meynard, C.N.; Lecoq, M.; Chapuis, M.-P.; Piou, C. On the Relative Role of Climate Change and Management in the Current Desert Locust Outbreak in East Africa. Glob. Chang. Biol. 2020, 26, 3753–3755. [Google Scholar] [CrossRef]
  11. Wang, L.; Zhuo, W.; Pei, Z.; Tong, X.; Han, W.; Fang, S. Using Long-Term Earth Observation Data to Reveal the Factors Contributing to the Early 2020 Desert Locust Upsurge and the Resulting Vegetation Loss. Remote Sens. 2021, 13, 680. [Google Scholar] [CrossRef]
  12. Piou, C.; Gay, P.-E.; Benahi, A.S.; Ebbe, M.A.O.B.; Chihrane, J.; Ghaout, S.; Cisse, S.; Diakite, F.; Lazar, M.; Cressman, K.; et al. Soil Moisture from Remote Sensing to Forecast Desert Locust Presence. J. Appl. Ecol. 2019, 56, 966–975. [Google Scholar] [CrossRef]
  13. Zha, Y.; Gao, J.; Ni, S.; Shen, N. Temporal Filtering of Successive MODIS Data in Monitoring a Locust Outbreak. Int. J. Remote Sens. 2005, 26, 5665–5674. [Google Scholar] [CrossRef]
  14. Wang, B.; Deveson, E.D.; Waters, C.; Spessa, A.; Lawton, D.; Feng, P.; Liu, D.L. Future Climate Change Likely to Reduce the Australian Plague Locust (Chortoicetes Terminifera) Seasonal Outbreaks. Sci. Total Environ. 2019, 668, 947–957. [Google Scholar] [CrossRef]
  15. Bryceson, K.P. Digitally Processed Satellite Data as A Tool in Detecting Potential Australian Plague Locust Outbreak Areas. J. Environ. Manag. 1990, 30, 191–207. [Google Scholar] [CrossRef]
  16. Sivanpillai, R.; Latchininsky, A.V. Special Section Guest Editorial: Advances in Remote Sensing Applications for Locust Habitat Monitoring and Management. J. Appl. Remote Sens. 2015, 8, 1. [Google Scholar] [CrossRef]
  17. Zhang, F.; Geng, M.; Wu, Q.; Liang, Y. Study on the Spatial-Temporal Variation in Evapotranspiration in China from 1948–2018. Sci. Rep. 2020, 10, 1–13. [Google Scholar] [CrossRef]
  18. Pekel, J.-F.; Ceccato, P.; Vancutsem, C.; Cressman, K.; Vanbogaert, E.; Defourny, P. Development and Application of Multi-Temporal Colorimetric Transformation to Monitor Vegetation in the Desert Locust Habitat. IEEE J. Sel. Top. Appl. Earth Obs. Remote Sens. 2011, 4, 318–326. [Google Scholar] [CrossRef]
  19. Pedgley, D.E. Satellite Detection of Potential Breeding Sites of the Desert Locust. In Proceedings of the a Symposium on Remote Sensing, S62. Pretoria, South Africa, 3–5 May 1972; pp. 155–158. [Google Scholar]
  20. McCulloch, L. Satellite Detection of Potential Breeding Sites in the Remote Interior. Rep. Aust. Plague Locust Comm. 1979, 46–51. [Google Scholar]
  21. Theron, K.J.; Pryke, J.S.; Samways, M.J. Identifying Managerial Legacies within Conservation Corridors Using Remote Sensing and Grasshoppers as Bioindicators. Ecol. Appl. 2022, 32, e02496. [Google Scholar] [CrossRef]
  22. Wu, T.; Hao, S.; Kang, L. Effects of Soil Temperature and Moisture on the Development and Survival of Grasshopper Eggs in Inner Mongolian Grasslands. Front. Ecol. Evol. 2021, 9, 610. [Google Scholar] [CrossRef]
  23. Yang, N.; Cui, X. Study on Locust Disaster Monitoring Based On Smos L2 Soil Moisture Data. In Proceedings of the 2019 IEEE International Geoscience and Remote Sensing Symposium, Yokohama, Japan, 28 July–2 August 2019; pp. 9413–9415. [Google Scholar]
  24. Dong, Y.; Xu, F.; Liu, L.; Du, X.; Ye, H.; Huang, W.; Zhu, Y. Monitoring and Forecasting for Disease and Pest in Crop Based On Webgis System. In Proceedings of the 2019 8th International Conference on Agro-Geoinformatics, Istanbul, Turkey, 16–19 July 2019; pp. 1–5. [Google Scholar]
  25. Popova, E.N.; Popov, I.O. Climatic Reasons for the Current Expansion of the Range of the Italian Locust in Russia and Neighboring Countries. Dokl. Earth Sci. 2019, 488, 1256–1258. [Google Scholar] [CrossRef]
  26. Mohammed, L.; Diongue, A.; Yang, J.-T.; Bahia, D.-M.; Michel, L. Location and Characterization of Breeding Sites of Solitary Desert Locust Using Satellite Images Landsat 7 ETM+ and Terra MODIS. Adv. Entomol. 2015, 3, 6. [Google Scholar] [CrossRef]
  27. Geng, Y.; Zhao, L.; Dong, Y.; Huang, W.; Shi, Y.; Ren, Y.; Ren, B. Migratory Locust Habitat Analysis with PB-AHP Model Using Time-Series Satellite Images. IEEE Access 2020, 8, 166813–166823. [Google Scholar] [CrossRef]
  28. Shi, Y.; Huang, W.; Dong, Y.; Peng, D.; Zheng, Q.; Yang, P. The Influence of Landscape’s Dynamics on the Oriental Migratory Locust Habitat Change Based on the Time-Series Satellite Data. J. Environ. Manag. 2018, 218, 280–290. [Google Scholar] [CrossRef] [PubMed]
  29. Gomez, D.; Salvador, P.; Sanz, J.; Casanova, C.; Taratiel, D.; Luis Casanova, J. Machine Learning Approach to Locate Desert Locust Breeding Areas Based On ESA CCI Soil Moisture. J. Appl. Remote Sens. 2018, 12, 036011. [Google Scholar] [CrossRef]
  30. Gomez, D.; Salvador, P.; Sanz, J.; Casanova, C.; Taratiel, D.; Casanova, J.L. Desert Locust Detection Using Earth Observation Satellite Data in Mauritania. J. Arid. Environ. 2019, 164, 29–37. [Google Scholar] [CrossRef]
  31. Gomez, D.; Salvador, P.; Sanz, J.; Casanova, J.L. Modelling Desert Locust Presences Using 32-Year Soil Moisture Data on a Large-Scale. Ecol. Indic. 2020, 117, 8. [Google Scholar] [CrossRef]
  32. Qi, X.-L.; Wang, X.-H.; Xu, H.-F.; Kang, L. Influence of Soil Moisture on Egg Cold Hardiness In the Migratory Locust Locusta Migratoria (Orthoptera: Acridiidae). Physiol. Entomol. 2007, 32, 219–224. [Google Scholar] [CrossRef]
  33. Du, G.L.; Zhao, H.L.; Tu, X.B.; Zhang, Z.H. Division of the Inhabitable Areas for Oedaleus Decorus Asiaticus in Inner Mongolia. Plant Prot. 2018, 44, 24–31. [Google Scholar]
  34. Zhang, Q.; Tang, H.; Cui, F.Q.; Dai, L.W. SPEI-Based Analysis of Drought Characteristics and Trends In Hulun Buir Grassland. Acta Ecol. Sin. 2019, 39, 7110–7123. [Google Scholar]
  35. Ma, C.Y.; Du, G.L.; Zhang, Z.R.; Yao, G.M.; Luo, J.P.; Na, R.H. Research of Grassland Locust Regionalization and Its Green Prevention-Control Matching Technology in Inner Mongolia. Acta Agrestia Sin. 2018, 26, 804–810. [Google Scholar]
  36. Zhang, H.Y.; Zhang, N.; Chen, X.Y. An Evaluation of Potential Occurrence of Grasshopper Plague in Xianghuangqi Grasslands of Inner Mongolia, North China. Chin. J. Appl. Ecol. 2012, 23, 222–234. [Google Scholar]
  37. Zhao, L.; Huang, W.; Chen, J.; Dong, Y.; Ren, B.; Geng, Y. Land Use Cover Changes in the Oriental Migratory Locust Area of China: Implications for Ecological Control and Monitoring of Locust Area. Agric. Ecosyst. Environ. 2020, 303, 107110. [Google Scholar] [CrossRef]
  38. Deng, Z.W.; Ni, S.X.; Zhang, H.L. Climatic Background of Rangeland Grasshopper Infestation in the Regions around Qinghai Lake. J. Nat. Disasters 2002, 11, 91–95. [Google Scholar]
  39. Wang, J.C.; Ni, S.X. Preliminary Study on the Relationship between the Grasshopper Plague Formation and the Weather Conditions in the Areas around the Qinghai Lake, China. Arid. Zone Res. 2001, 18, 8–12. [Google Scholar]
  40. Hielkema, J.U.; Roffey, J.; Tucker, C.J. Assessment of Ecological Conditions Associated with the 1980/81 Desert Locustplague Upsurge in West Africa Using Environmental Satellite Data. Int. J. Remote Sens. 1986, 7, 1609–1622. [Google Scholar] [CrossRef]
  41. Renier, C.; Waldner, F.; Jacques, D.C.; Ebbe, M.A.B.; Cressman, K.; Defourny, P. A Dynamic Vegetation Senescence Indicator for Near-Real-Time Desert Locust Habitat Monitoring with MODIS. Remote Sens. 2015, 7, 7545–7570. [Google Scholar] [CrossRef]
  42. Phillips, S.J.; Anderson, R.P.; Dudik, M.; Schapire, R.E.; Blair, M.E. Opening the Black Box: An Open-Source Release of Maxent. Ecography 2017, 40, 887–893. [Google Scholar] [CrossRef]
  43. Phillips, S.J.; Anderson, R.P.; Schapire, R.E. Maximum Entropy Modeling of Species Geographic Distributions. Ecol. Modell. 2006, 190, 231–259. [Google Scholar] [CrossRef]
  44. Duan, J.Q.; Zhou, G.S. Potential Distribution of Rice in China and Its Climate Characteristics. Acta Ecol. Sin. 2011, 31, 6659–6668. [Google Scholar]
  45. Garmendia, A.; Salvador, A. Fractal Dimension of Birds Population Sizes Time Series. Math. Biosci. 2007, 206, 155–171. [Google Scholar] [CrossRef]
  46. Bao, Y.; Wang, F.; Tong, S.; Na, L.; Han, A.; Zhang, J.; Bao, Y.; Han, Y.; Zhang, Q. Effect of Drought on Outbreaks of Major Forest Pests, Pine Caterpillars (Dendrolimus spp.), in Shandong Province, China. Forests 2019, 10, 264. [Google Scholar] [CrossRef]
  47. Van Huis, A.; Cressman, K.; Magor, J.I. Preventing Desert Locust Plagues: Optimizing Management Interventions. Entomol. Exp. Appl. 2007, 122, 191–214. [Google Scholar] [CrossRef]
  48. Ni, S.; Wu, T. Monitoring the Intensity of Locust Damage to Vegetation Using Hyper-Spectra Data Obtained at Ground Surface. In Remote Sensing and Modeling of Ecosystems for Sustainability IV; Gao, W., Ustin, S.L., Eds.; SPIE: Bellingham, WA, USA, 2007; Volume 6679, pp. 89–97. [Google Scholar]
  49. Cressman, K. Role of Remote Sensing in Desert Locust Early Warning. J. Appl. Remote Sens. 2013, 7, 075098. [Google Scholar] [CrossRef]
  50. Cease, A.J.; Elser, J.J.; Ford, C.F.; Hao, S.; Kang, L.; Harrison, J.F. Heavy Livestock Grazing Promotes Locust Outbreaks by Lowering Plant Nitrogen Content. Science 2012, 335, 467–469. [Google Scholar] [CrossRef]
  51. Belovsky, G.E.; Slade, J.B. Grasshoppers Affect Grassland Ecosystem Functioning: Spatial and Temporal Variation. Basic Appl. Ecol. 2018, 26, 24–34. [Google Scholar] [CrossRef]
  52. Klein, I.; van der Woude, S.; Schwarzenbacher, F.; Muratova, N.; Slagter, B.; Malakhov, D.; Oppelt, N.; Kuenzer, C. Predicting Suitable Breeding Areas for Different Locust Species—A Multi-Scale Approach Accounting for Environmental Conditions and Current Land Cover Situation. Int. J. Appl. Earth Obs. Geoinf. 2022, 107, 102672. [Google Scholar] [CrossRef]
Figure 1. Location of the study area. Surveys of occurring species were conducted over the grassland area. Grasshopper outbreak points indicate areas that experienced grasshopper plagues between 2008 and 2020. The considered species include Oedaleus decorus asisticus, Bryodema luctuosum luctuosum, Calliptamus abbreviatus, Pararcypatera microptera meridionalis, Dasyhippus barbipes, Angaracris barabensis, and Angaracris rhodopa.
Remotesensing 14 03910 g001
Figure 2. Life cycle of grasshoppers and major influencing factors.
Remotesensing 14 03910 g002
Figure 3. Average omission rate and predicted area (ORPA) from 2008 to 2020.
Remotesensing 14 03910 g003
Figure 4. Spatial distribution of suitable areas for grasshoppers in Hulunbuir grassland from 2008 to 2020.
Remotesensing 14 03910 g004aRemotesensing 14 03910 g004b
Figure 5. Trend of the grasshopper suitability index (a) and F test (b) in Hulunbuir grassland from 2008 to 2020.
Remotesensing 14 03910 g005
Figure 6. Proportions of area with different levels of suitability for grasshoppers.
Remotesensing 14 03910 g006
Figure 7. Differences in four eco-environmental variables during the grasshopper life cycle at different suitability levels, including the differences of FVC (a), TVDI (b), precipitation (c), and temperature (d).
Remotesensing 14 03910 g007aRemotesensing 14 03910 g007b
Figure 8. Spatial distribution of the Hurst index in Hulunbuir grassland from 2008 to 2020.
Remotesensing 14 03910 g008
Table 1. Number of grasshopper outbreak points from 2008 to 2020.
YearNumber of PointsYearNumber of PointsYearNumber of Points
200863920133232018283
200977420141842019310
201065120152332020280
20116872016268
20125892017270
Table 2. Environmental factors selected in this study.
PeriodEnvironmental FactorsVariablesUnitsExplanation
Spawning periodVegetation F1FVC between 193 and 208 days previous year
F2FVC between 209 and 224 days previous year
F3FVC between 225 and 240 days previous year
F4FVC between 241 and 256 days previous year
F5FVC between 257 and 272 days previous year
F6FVC between 273 and 288 days previous year
F7FVC between 289 and 304 days previous year
EdaphicSM1TVDI between 193 and 208 days previous year
SM2TVDI between 209 and 224 days previous year
SM3TVDI between 225 and 240 days previous year
SM4TVDI between 241 and 256 days previous year
SM5TVDI between 257 and 272 days previous year
SM6TVDI between 273 and 288 days previous year
Meteorological T1°CAverage temperature between 182 and 212 days previous year
T2°CAverage temperature between 213 and 243 days previous year
T3°CAverage temperature between 244 and 273 days previous year
T4°CAverage temperature between 274 and 304 days previous year
Overwintering periodMeteorologicalP1mmPrecipitation between 244 and 273 days previous year
P2mmPrecipitation between 274 and 304 days previous year
T5°CAverage temperature between 305 and 334 days previous year
T6°CAverage temperature between 335 and 361 days previous year
T7°CAverage temperature between 1 and 31 days current year
T8°CAverage temperature between 32 and 59 days current year
Incubation periodVegetationF8FVC between 129 and 144 days current year
F9FVC between 145 and 160 days current year
F10FVC between 161 and 176 days current year
EdaphicSM7TVDI between 129 and 144 days current year
SM8TVDI between 145 and 160 days current year
SM9TVDI between 161 and 176 days current year
MeteorologicalP3mmPrecipitation between 60 and 90 days current year
P4mmPrecipitation between 91 and 120 days current year
P5mmPrecipitation between 121 and 151 days current year
T9°CAverage temperature between 60 and 90 days current year
T10°CAverage temperature between 91 and 120 days current year
T11°CAverage temperature between 121 and 151 days current year
T12°CAverage temperature between 152 and 181 days current year
Breeding periodVegetationF11FVC between 177 and 192 days current year
F12FVC between 193 and 208 days current year
F13FVC between 209 and 224 days current year
F14FVC between 225 and 240 days current year
EdaphicSM10TVDI between 177 and 192 days current year
SM11TVDI between 193 and 208 days current year
SM12TVDI between 209 and 224 days current year
SM13TVDI between 225 and 240 days current year
SM14TVDI between 241 and 256 days current year
Meteorological T13°CAverage temperature between 182 and 212 days current year
Other factorsTerrain and LandformsALTmAltitude
ASPAspect
SLSlope
Soil and Vegetation typeSTSoil type in study area
VTVegetation type in study area
Vegetation fraction coverage (FVC), SM represents soil moisture represented by the temperature vegetation dryness index (TVDI). Current year means the year of grasshopper outbreak. Previous year denotes data for the year before the grasshopper outbreak.
Publisher’s Note: MDPI stays neutral with regard to jurisdictional claims in published maps and institutional affiliations.

