Abstract
Although geologically constrained sandy beaches are ubiquitous along wave-exposed coasts, there is still a limited understanding of their morphological response, particularly under storm conditions, which is mainly due to a critical lack of nearshore bathymetry observations. This paper examines the potential to derive bathymetries from video imagery under challenging wave conditions in order to investigate headland control on morphological beach response. For this purpose, a video-based linear depth inversion algorithm is applied to three consecutive weeks of frames collected during daylight hours from a single fixed camera located at La Petite Chambre d’Amour beach (Anglet, SW France). Video-derived bathymetries are compared against in situ topo-bathymetric surveys carried out at the beginning and end of the field experiment in order to assess the performance of the bathymetric estimates. The results show that the rates of accretion/erosion within the surf zone are strongly influenced by the headland, whereas the beach morphological response can be classified into three main regimes depending on the angle of wave incidence : (1) under deflection configuration (), the alongshore sediment transport was trapped at the updrift side of the headland, promoting sand accretion. (2) Under shadowed configuration (), the interruption of the longshore current drove a deficit of sand supply at the downdrift side of the headland, leading to an overall erosion in the surf zone. (3) Under shore-normal configuration (), rip channels developed, and up-state beach transition was observed. A comparison between video-derived bathymetries and surveys shows an overall root mean square error (RMSE) around 0.49 to 0.57 m with a bias ranging between −0.36 and −0.29 m. The results show that video-derived bathymetries can provide new insight into the morphological change driven by storm events. The combination of such inferred bathymetry with video-derived surface current data is discussed, showing great potential to address the coupled morphodynamics system under time-varying wave conditions.
1. Introduction
Morphological changes of the beach profile are spread over a wide range of spatio-temporal scales that vary from a few hours (storm) to several weeks (changes in swell regimes) at the scale from ripples to sandbars [1]. Such morphological changes are driven by the interactions between flow (waves and currents), sediment transport and the evolving morphology that feeds back into the hydrodynamics, forming the coupled morphodynamic system. Decisions on coastal zone management are mainly based on understanding sediment budgets, which include the subaerial and subtidal zones [2]. Critical to beach response and sediment budget is the nearshore bathymetry, which is the primary source of morphological variability, but it is challenging and expensive to survey in situ. In situ bathymetric data are traditionally obtained using an echo sounder mounted behind a jet ski [3] or a small vessel [4] equipped with a Real-Time Kinematic Differential Global Positioning System sensor (RTK-DGPS) that can retrieve depths within a couple of centimeters of accuracy under calm wave conditions [5]. At best, such a monitoring approach can be performed twice a month on beaches with common periods of low wave conditions and access to the sea for small vessels [6]. Consequently, it is of great interest to find more accessible alternatives to obtain bathymetric data with high spatial and temporal resolution.
A wide range of remote sensing approaches have been proposed to infer subtidal bathymetry by exploiting different signatures associated with water depth. Among these groups of methods are the one based on light penetration in the water column and the subsequent reflection of the seabed (e.g., multi- and hyperspectral depth inversion methods [7,8,9,10]) and the one based on sea surface characteristics. The latter group can broadly be subdivided into methods that rely on wave dissipation patterns caused by depth-induced wave breaking [11,12,13,14,15] and changes in local wave celerity over a varying depth profile [16,17,18,19,20,21]. Much effort has been dedicated to derive bathymetry maps from video imagery through the linear dispersion relationship for free surface waves [18,19,22,23,24,25,26,27,28,29]. In particular, shore-based video systems have the capability to collect large volumes of data with high temporal and spatial resolution over long periods with the advantage of being relatively low cost [30,31].
The cBathy algorithm, developed by Holman et al. [19], is a spectral depth inversion method that is nowadays the most popular algorithm to obtain two-dimensional bathymetries from video stations [6,25,32,33,34,35,36,37,38,39,40,41,42,43,44]. cBathy is based on the linear wave dispersion relationship, and therefore, its validity is inherently bounded to the increasing degree of wave non-linearity (finite amplitude effects) as waves approach the shore, leading to larger propagation speeds for higher waves [45,46]. Although there are several studies that have proposed the correction for the finite-amplitude dispersion in shallow water (e.g., [47,48,49]), these non-linear depth inversion approaches require additional information on wave height evolution, which is difficult to acquire remotely. In any case, the cBathy algorithm still provides a good alternative to estimate robust bathymetry maps as it incorporates data assimilation through a Kalman filter to reduce instantaneous depth errors related to the loss of optical wave signature.
The quality of bathymetric estimates derived from cBathy has previously been compared with conventional bathymetric surveys obtained from echo sounders and acoustic altimeters for a number of different beaches (summarized in Table 1). However, cBathy has rarely been tested in beach environments under storm events with waves larger than 2 m and 10 s due to the difficulty of conducting in situ surveys in the presence of large waves [38]. Moreover, most video-based depth inversion studies have focused on open beaches but not on geologically constrained beaches, which show more complex and less understood morphodynamic processes [50,51,52,53,54]. Geologically constrained beaches are characterized by significant geological controls due to headlands, reefs, platforms, rock outcrops and islets, which determine beach boundaries, beach morphology and morphodynamics [55,56], making them behave differently from unconstrained beaches [57,58,59,60,61,62,63].

Table 1.
cBathy performance statistics from prior work, organized by decreasing . Positive (negative) bias corresponds to cBathy underestimated (overestimated) depth relative to the survey. Note that performance statistics are not all directly comparable, as validations were sometimes performed in different areas (e.g., inner surf zone). Adapted from Brodie et al. [38], Copyright 2018, with permission from Elsevier.
In this study, we explore the potential of the cBathy algorithm to derive nearly continuous (every 30 min during daylight hours) bathymetry maps during a 3-week field experiment in order to examine the morphological evolution of a geologically constrained beach under a wide range of energetic wave and tide conditions. Field measurements are used to assess the capability of cBathy to reproduce underwater morphological features before and after a storm event. Overall, this work aims to extend the limited knowledge we have of cBathy performance under high-energy waves and to explore morphological changes and their driving factors at a geologically constrained beach. The combination of such video-derived nearshore bathymetry with other video-derived products to better understand the morphodynamic system is further discussed.
2. Data and Methods
2.1. Study Site and Field Experiment
La Petite Chambre d’Amour, hereafter referred to as LPCA beach, is the last and southernmost beach of Anglet located on the Basque coast in the southwest of France (Figure 1). LPCA beach is bounded by a 500 m long rocky headland in the South (Saint-Martin headland) and characterized by the presence of a 20 m wide submerged rocky reef located approximately 150 m from the headland. According to Wright and Short [64] classification, Anglet is a high-energy intermediate beach with a bimodal sediment distribution with a steep beach face ( and mm) and a more gentle sloped surf zone ( with 0.3–0.4 mm) [65] with the presence of a seasonally modulated single to double-bar system [66].
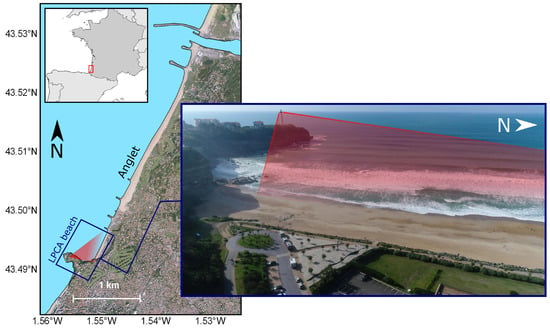
Figure 1.
Location of the study site, LPCA beach (Anglet, SW France; blue rectangle). The video-monitoring area is shown in red color.
An intensive field campaign was conducted at LPCA beach from 3 to 26 October 2018 with the objective to investigate the wave-induced circulation and the morphological response of the beach under energetic wave conditions. The experiment involved the deployment and data collection of a large array of instruments including current profilers, surf-zone drifters, topo-bathymetric surveys and image acquisition from a fixed video-camera station and a camera equipped Unmmaned Aerial Vehicle (UAV).
Wave and tide data were continuously retrieved (every 30 and 60 min, respectively) from a 6 km offshore wave buoy and from the Bayonne–Boucau tide gauge, which is located within the mouth of the Adour river, 4 km north of the study site. Figure 2 shows the offshore wave and tide conditions during the field experiment. LPCA beach was exposed to Atlantic W-NW long-period swells, where significant wave heights ranged from 0.4 to 4.2 m and peak wave periods ranged from 5 to 16 s (Figure 2a). Offshore wave conditions were relatively energetic (average of 1.5 m and average of 12 s) with several high-energy wave events exceeding 2 m. During the experiment, the tidal range varied from 1.1 to 4.4 m for neap tides and spring tides, respectively.
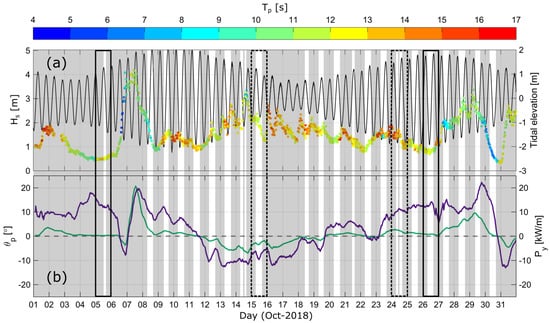
Figure 2.
Field conditions during the October 2018 field experiment. (a) Tidal elevation (black line; see top right axis) and offshore significant wave height (; dots) time-series associated with offshore peak period () depicted with different colors (top left axis). (b) Offshore 12 h averaged angle of peak wave incidence () relative to the shore normal (purple line; bottom left axis) and offshore 12 h averaged alongshore wave energy flux (green line; bottom right axis). Non-shaded regions in the time series indicate video recording during daylight hours. Polygons defined with black solid (dashed) lines show the time during bathymetric (topographic) surveys.
An important parameter governing beach morphological changes is the wave energy flux P (also referred to as “wave power” [67,68]) which can be approximated [69,70] by:
where is the seawater density (1025 kg/) and g is the gravity acceleration (9.81 m/). The longshore component of the energy flux can be obtained as:
where is the offshore peak wave incidence (angle of wave incidence relative to the shore normal). represents the portion of wave power available to drive longshore currents in the surf zone [65,71]. Therefore, can be used as a proxy of sediment transport along the coast [67]. The sign of depends on ; high positive (negative) values of correspond to high-energy swell that arrives obliquely to the shore to the right (left) of the shore normal, whereas near-zero values of indicate shore-normally incident waves. As the LPCA beach is geologically constrained by the headland in the south, three main regimes of wave-induced circulation are identified based on the angle of wave incidence [65,72,73]: (1) a headland-directed longshore current that evolves into a rip current along the headland under deflection configuration ( and kW/m), (2) an onshore-directed current and a weak oscillating eddy induced under a shadowed configuration ( and kW/m), and (3) cross-shore motions with rip cells’ circulation under a shore-normal configuration ( and kW/m). Figure 2b shows the filtered values of the offshore peak wave incidence () and the longshore component of wave power ( kW/m). and time series were smoothed using a 12 h window moving average.
2.2. Topo-Bathymetric Surveys
During October 2018, several surveys were conducted with the purpose to quantify intertidal and subtidal morphological variations throughout the experiment (see Figure 2). Two mono-beam bathymetric surveys with 50 m spaced cross-shore transects were carried out at the beginning (5/Oct/2018) and end (26/Oct/2018) of the field experiment. All bathymetries were obtained through Real-Time Kinematic Global Navigation Satellite System (RTK-GNSS) surveyed from a boat. The upper and intertidal beach topography were surveyed using a Post Processing Kinematic Differential Global Navigation Satellite System (PPK-GNSS) carried in on foot on 15 October 2018. In addition, a high-resolution topographic survey employing photogrammetry [74] obtained by a UAV was performed at spring low tide on 24 October 2018 to measure the headland topography as well as the upper shore-face topography. The vertical uncertainty (95% CI) from bathymetric and topographic surveys is estimated to be less than 0.20 and 0.07 m, respectively [65].
It was decided not to merge the bathymetry data collected on 5 October with the topography collected on 15 October, as a high-energy wave event occurred between the two dates ( up to 4 m on 7 October 2018; see Figure 2), potentially inducing changes in the seabed morphology. On the other hand, the topographic and bathymetric data collected on 24 and 26 October 2018, respectively, were combined and gridded using a natural neighbor interpolation approach accounting for anisotropy to produce a single bathy-topo map. Thus, only the bathymetry data (5/Oct/2018), as well as the topo-bathymetric ensemble (24,26/Oct/2018) representing the morphological conditions during the beginning and end of the experiment, respectively, will be used as ground truth to further validate cBathy estimations.
2.3. Video Data
Images capturing LPCA beach were collected from a single camera installed on top of the Biarritz lighthouse (70 m above mean sea level) located near the tip of Saint-Martin headland (Figure 1). Then, 1 Hz sampled images recorded at 1624 × 1234 px were continuously collected during daylight hours on 5,8–15,18–30/Oct/2018 (Figure 2). Images containing fog, sun glare and raindrops were visually identified and manually excluded. The remaining images were stabilized [75] and rectified [76] into local coordinates using 16 ground control points (GCPs) spatially distributed both on land and water.
2.4. cBathy Algorithm
The cBathy algorithm (Holman et al. [19]; https://github.com/Coastal-Imaging-Research-Network/cBathy-toolbox [44], accessed on 20 January 2020) is based on the linear wave dispersion relationship to estimate depth and thus requires a time series of images with the presence of waves in intermediate or shallow water depths. Images are typically sampled at 1 or 2 Hz over a 17 min collection to yield a burst or stack of images. Data runs are typically collected hourly but can be reduced to half-hourly for field experiments or places where conditions, such as tide or morphology, change rapidly. The image spatial resolution should be adequate to resolve the anticipated dominant wavelengths. For the case of LPCA beach, the wavelength for a typical 10 s wave in 1 m depth is ∼31 m. This means that for a cross-shore spacing () of 5 m, six points will be provided to resolve the wavelength, which is fine to keep the computation time reasonable. As alongshore scales are longer, they can be well resolved with a larger sample spacing (e.g., m). Once the stack of images is recorded, the analysis is carried out sequentially at a series of user-selected analysis points () for which a group of neighboring pixels is used within a user-specified range or tile (Figure 3).
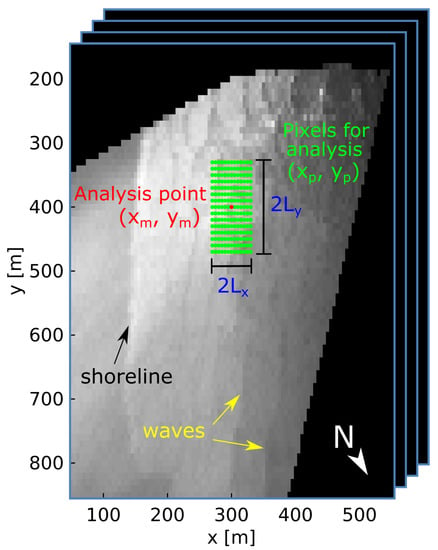
Figure 3.
Pixel array used for cBathy analysis. Time series are collected at every pixel. Analysis at any example location (e.g., red dot) is based on data from the surrounding tile of pixels (green dots) of size +/− and . The image is rotated, since cBathy assumes that the x-axis increases offshore.
The cBathy algorithm consists of three processing steps. The objective of step 1 is to estimate a wavenumber k at the point () for a user-defined set of candidate frequencies . These frequencies are typically defined between 0.056 and 0.250 Hz and correspond to wave periods ranging from 4 to 18 s. Each pixel within the analysis tile is treated as an individual pixel intensity time series and converted to the frequency domain through a Fourier transformation. A cross-spectral matrix is then computed between all possible pixel pairs inside the tile for each of the desired frequency bands . A selection of the most coherent frequencies (commonly four; cBathy default value) are identified and extracted through spatial empirical orthogonal function (EOF) to determine the dominant spatial phase of the wave. The corresponding wavenumbers k are derived by fitting the wave patterns of the observed spatial phase to a forward modeled wave train. A skill value is provided to indicate the percentage of the variance explained by the fit, where a skill score of 1 corresponds to a perfect match. Finally, for each pair, a depth can be estimated using the linear dispersion relationship:
where is the radial frequency, f is the linear frequency, k is the wavenumber, h is the water depth and g is the gravitational acceleration. Since cBathy estimates depth, not bathymetry, tidal elevations must be subtracted from estimates to yield depths relative to a fixed tidal datum.
In step 2, a single depth is computed by combining the multiple pairs estimated from step 1 through a weighted non-linear least squares fit so that the best correspondence to the linear dispersion relationship is found. Step 2 depths, similar to those of step 1, must be tide-corrected to yield bathymetry data referenced with respect to a tidal datum.
Step 3 uses a Kalman filter [77] to smooth and average the datum-referenced depths in order to provide a robust and reliable depth estimate, . As the Kalman filter depends on both the current and the previous cBathy-estimated bathymetry, this step only works if more than one video-derived bathymetry is available. The purpose of the Kalman filter is to provide an estimate of beach morphology over certain areas even when in situ conditions are not favorable by filling gaps in coverage and objectively averaging new estimates with prior estimates.
cBathy Settings
The image time series were rotated and rearranged into stacks of ∼17 min (1024 s) duration, yielding one image stack every 30 min. All images within a stack were rectified by setting the reference level (tidal elevation) according to the time of the middle image of the stack. This was completed to avoid rectifcation inaccuracies (i.e., horizontal pixel shifting) induced by large tidal level changes, as described by Bergsma et al. [36]. The cBathy algorithm was then applied to a total of 330 image stacks. The parameters used for cBathy are shown in Table 2. Time series of water depth were estimated on a 25 × 10 m analysis grid (alongshore × cross-shore spacing) and further referenced to NGF-IGN69 (Global French Levelling) to produce bathymetry maps. For future reference, the zero-elevation contour relative to NGF-IGN69 is located 0.43 m below MSL. The Kalman filter was then consecutively applied over time to yield a stable running average depth by automatically weighting better estimates from prior information. In addition to the Kalman filter, a moving average was applied with a temporal window of two (daylight) days over the whole bathymetry time series in order to remove a spurious depth-diurnal signal, which was probably related to a rectification inaccuracy. It should be noted that for the 5th of October 2018 (the same day as the first bathymetry survey), only one image stack was available, meaning that the Kalman filter could not be applied during that day.

Table 2.
cBathy parameters used for October 2018 field experiment.
3. Results
3.1. Topo-Bathymetric Surveys Comparison
As shown in Figure 4, a comparison between the October 5 and 26 surveys indicates the formation of an alongshore uniform sandbar centered at x = 300 m with a net deposition of sand (around 1 m of accretion) at the respectively cross-shore and longshore position: x = 300 m, y = 400 m. Moreover, there is an overall erosion at x = 400–600 m as well as beach accretion around x = 100 m. The development of a shallow rip channel is also observed at x = 250 m, y = 400–500 m. Based solely on these survey observations, it is difficult to determine under what specific hydrodynamic conditions the morphology responded in relation to the time between wave events and the pre-existing geology. Hence, it highlights the importance of estimating bathymetry more frequently using remote sensing techniques, the results of which are presented in the following subsections.
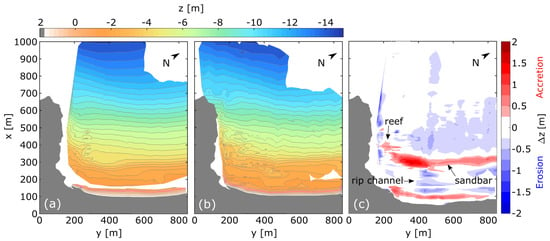
Figure 4.
Topo-bathymetric surveys comparison. (a) Interpolated bathymetry (5/Oct/2018) and intertidal topography (15/Oct/2018). (b) Interpolated bathymetry (26/Oct/2018) and intertidal topography (24/Oct/2018) merged together into a single bathy-topo map. (c) Difference between surveys where red colors indicate sand accretion and blue colors sand erosion.
3.2. cBathy Video-Derived Bathymetries vs. Surveys
Figure 5 presents the non-filtered cBathy bathymetry estimation computed for the same day as the first bathymetry survey (5/Oct/2018). Wave and tide conditions during cBathy computation ( = 0.6 m; = 13 s; = 4°; Tide = 1.6 m) showed no wave breaking as illustrated in the standard deviation image (Figure 5a). The bulk performance of cBathy to reproduce morphological features present in the first bathymetry survey achieves 0.57 m root mean square error (RMSE) with a −0.36 m bias. The intermediate water region comprised between x = 300–450 m and y = 350–800 m is well reproduced by cBathy. However, the remaining shallow water regions, including the sandbar, are fairly reproduced in shape but overestimated in depth (inaccuracies around 1 m), as shown in Figure 5d and the cross-shore and alongshore profile transects in Figure 5e,f.
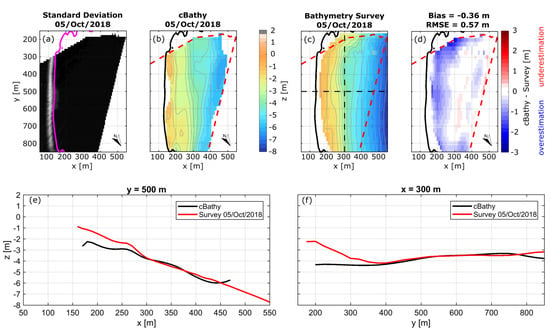
Figure 5.
cBathy vs. surveyed bathymetry for 5 October 2018. (a) Standard deviation image showing the amount of change in pixel intensity over the record length of the stack in order to highlight preferential wave breaking. The magenta line indicates the zero-elevation contour relative to NGF-IGN69. Elevation contours are spaced at 0.5 m intervals relative to NGF-IGN69. (b) cBathy-derived bathymetry, (c) surveyed bathymetry and (d) difference between both, where red (blue) colors indicate depth underestimation (overestimation) in cBathy results. (e) Cross-shore and (f) alongshore transects, indicated by the black dashed lines in panel (c), showing the comparison between cBathy (black solid line) and the surveyed profile (red solid line).
Figure 6 shows the estimated Kalman-filtered cBathy bathymetry corresponding to the topo-bathymetry survey conducted at the end of the field experiment (24,26/Oct/2018). The standard deviation image (Figure 6a) depicts an oblique rip channel within the surf zone range of y = 400–500 m, which is consistent with the surveyed topo-bathy map (Figure 6c). This rip channel is resolved by cBathy estimations but underestimated in depth. cBathy shows an overall RMSE and bias of 0.49 and −0.29 m, respectively, with larger errors near the steep shoreline and reef location, as shown in Figure 6d and the cross-shore and alongshore profile transects in Figure 6e,f. cBathy performance is hypothesized to be lowered by wave breaking due to low tide and relatively large waves ( = 0.8 m; = 11 s; = 14°; tide = −1.5 m).
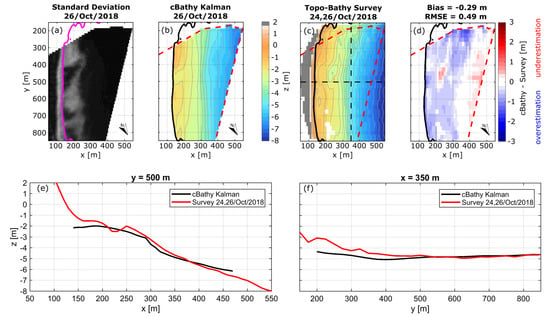
Figure 6.
cBathy (26/Oct/2018) vs. interpolated topo- (24/Oct/2018) bathymetry (26/Oct/2018) survey. (a) Standard deviation image showing the amount of change in pixel intensity over the record length of the stack in order to highlight preferential wave breaking. The magenta line indicates the zero-elevation contour relative to NGF-IGN69. Elevation contours are spaced at 0.5 m intervals relative to NGF-IGN69. (b) Kalman-filtered cBathy-derived bathymetry, (c) surveyed topo-bathy and (d) difference between both, where red (blue) colors indicate depth underestimation (overestimation) in cBathy results. (e) Cross-shore and (f) alongshore transects, indicated by the black dashed lines in panel (c), showing the comparison between cBathy (black solid line) and the surveyed profile (red solid line). The red dashed lines indicate the limits of video-monitoring coverage.
3.3. cBathy Error Assessment
Following the approach proposed by Bouvier et al. [42], a quality assessment was computed for each of the non-filtered cBathy-derived bathymetries by counting the number of points for which the cBathy algorithm returns a physical value (skill higher than 0.5 with associated depth errors lower than 1 m). The quality assessment (Qual) of video-derived bathymetries was assessed in percentage terms in relation to the total number of grid points inside the camera viewfield delimited by values below the zero-elevation contour line. In other words, the quality assessment counts how many non-NaN depth estimates are retrieved from cBathy within the sampled area. Figure 7 shows the cBathy quality assessment for the 330 computed bathymetries according to their corresponding tidal elevation and offshore significant wave heights ().
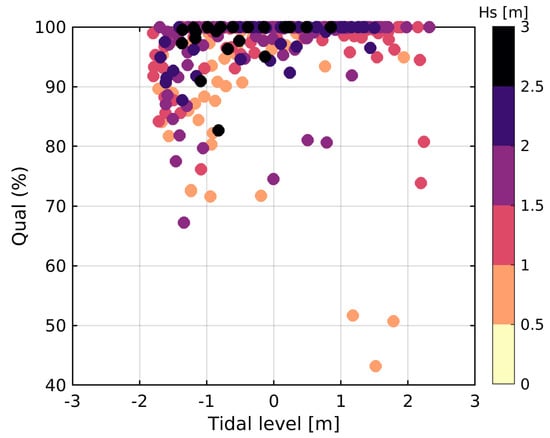
Figure 7.
Bathymetric inversion quality (Qual) as a function of tidal elevation (with respect to MSL) and offshore significant wave height ().
Tidal elevation has an influence on the quality of depth inversion with appreciable errors associated with low tide stage. During low tide, waves break over the reef and sandbar affecting the readability of the wave signature and resulting depth estimates. In addition, non-linear effects affect the estimation of the bathymetry in the outer and inner surf zone as the depth range decreases at low tide. Surprisingly, large waves ( m) do not appear to significantly reduce cBathy estimations in the sampled area as opposed to the results of Bouvier et al. [42]. Nevertheless, it is important to note that this quality assessment is based only on the total number of individual depth outputs within the grid, whose performance at the end is given by the same cBathy algorithm.
3.4. cBathy Video-Derived Morphological Evolution
Figure 8 shows the LPCA beach morphological up-state transition from a Low-Tide Terrace (LTT) to a Transverse Bar and Rip (TBR) beach state according to Wright and Short [64] classification. Table 3 shows the field conditions corresponding to Figure 8. Timex images (Figure 8a–e) computed at low tide provide visual aid to detect surfzone morphological features as they highlight preferential wave breaking and complement the results obtained from the video-derived bathymetries (Figure 8f–j) and their corresponding changes over time (Figure 8k–o) with respect to 8 October 2018 video-derived bathymetry. A movie showing the video-derived morphological evolution is also provided as Supplementary Material (Video S1).
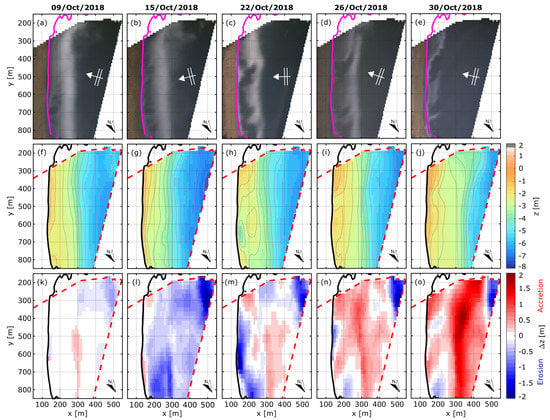
Figure 8.
LPCA beach morphological evolution during October 2018 field experiment. (a–e) Time exposure (timex) image consisting of averaged pixel intensity over the record length of the stack. The magenta line indicates the zero-elevation contour relative to NGF-IGN69 and the white arrows indicate the angle of wave incidence . (f–j) Kalman-filtered cBathy video-derived bathymetries. Elevation contours are spaced at 0.5 m intervals relative to NGF-IGN69. (k–o) Bathymetric change maps; difference between cBathy-derived bathymetries (panels: f–j) and the cBathy-derived bathymetry from 8 October 2018 07:30:00 GMT, where red colors indicate sand accretion and blue colors sand erosion with respect to 8 October 2018 video-derived bathymetry. The red dashed lines indicate the limits of video-monitoring coverage.

Table 3.
Field conditions for Figure 8.
Figure 8a,f,k corresponding to 9 October 2018 capture LPCA beach morphological configuration after the high-energy wave event of 7 October 2018 ( up to 4 m; see Figure 2). Despite the storm, the sandy bed morphology remained reasonably uniform alongshore, showing a subdued terrace bar still attached to the shore. Figure 8b,g,l shows the beach morphology following the second energetic wave event (14/Oct/2018; m) that occurred under a shadowed configuration. Overall, the large waves eroded the surf zone, yielding little more than a pronounced terrace bar. On 22 October 2018, shore-normally incident waves led to a state transition in between LTT and TBR (e.g., [78]) with the formation of rip channels that did not incise the outer edge bar but increased the trough continuity (see Figure 8c,h,m).
After 23 October 2018, the angle of wave incidence augmented under a deflection configuration, inducing a longshore current towards the headland. This period was characterized by persistent accretion, as the sediment supply from the longshore drift was probably trapped by the headland. During the high-angle wave event, the rip channel orientation became more oblique, and the successive infilling of the trough caused part of the sandbar to weld to the shore (see Figure 8d,i,n). The latter description coincides with an erosive Transverse Bar and Rip (eTBR) state, as proposed by Price and Ruessink [71] who related the offshore dominant oblique angle of wave incidence with a discontinuous trough and the presence of oblique rip channels.
By the end of the experiment, LPCA beach was characterized by a TBR state with the presence of two deep skewed rip channels (Figure 8e,j,o). Interestingly, the relatively high-energy wave event of 28 October 2018 ( m; ; kW/m) resulted in accretion rather than erosion; an overall sand deposition along the bar and the region around the reef is observed in accordance with survey measurements from Figure 4c.
3.5. cBathy Video-Derived Profile Response
Different cross-shore transects were selected (Figure 9a–c) to investigate the temporal evolution of the seabed over the 3-week field experiment. Wave and tide conditions are presented in order to associate morphological evolution to hydrodynamic conditions at LPCA beach (Figure 9d). The 2-day smoothed cross-shore profile time-evolution shows progressive sand accumulation along the bar (Figure 9f,g) and the reef (Figure 9e) linked by the increasingly obliquely incident wave conditions after 23 October. Sand deposition is also observed during the energetic wave event of 28 October 2018, which is consistent with the sand accretion observed for the same region in the topo-bathymetric survey conducted at the end of the experiment (Figure 4c). The temporal evolution of the smoothed cross-shore profile transect centered at y = 700 m (Figure 9g) illustrates the temporary dissection of the low tide terrace leading to a rip channel formation on 20–22/Oct/2018, which coincides with the transition to shore-normal incident waves. Overall, the cBathy-derived cross-shore transects (Figure 9h–j) are consistently below the surveyed profiles (negative bias around 1 m depth) and show an offshore migration of the sandbar crest location with a 40 m offset relative to the last survey conducted on 26 October 2018.
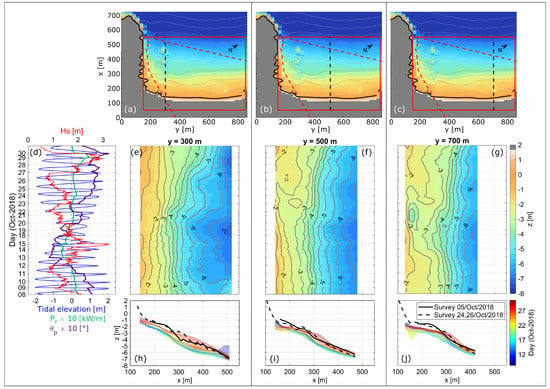
Figure 9.
LPCA beach cross-shore profile morphological evolution over October 2018 derived from 2-day time-averaged Kalman-filtered cBathy estimates. (a–c) The cross-shore profile transects are indicated by the black dashed lines. The red polygon shows the domain used for analysis and the red dashed lines indicate the limits of video-monitoring coverage. (d) Offshore significant wave height (red line; top axis), tidal elevation (blue line; bottom axis), 12 h averaged alongshore wave energy flux (green line; bottom axis) and 12 h averaged angle of peak wave incidence (purple line; bottom axis) time series corresponding to the computed cBathy Kalman-filtered stacks. (e–g) cBathy-derived timestacks along with (h–j) the time evolution of each cBathy cross-shore profile (shown with different colors). The solid and black dashed lines correspond, respectively, to profile transects obtained from bathymetry (5/Oct/2018) and topo-bathymetry (24,26/Oct/2018) surveys. For better visualization, the time is concatenated during available cBathy stacks (i.e., nightlight hours and absent data from 16 and 17 October are removed).
Similarly, Figure 10 shows the LPCA beach 2-day time-averaged vertical profile response over time for three different alongshore transects depicted in Figure 10a–c. A systematic change in seabed elevation is evident after 23 October 2018 with more sand accumulation close to the reef (y ≈ 300 m; Figure 10f,g,i,j). This decrease in depth appears to be related to the transition of the angle of wave incidence from a shadowed configuration to a deflection configuration (see and in Figure 10d). The temporal evolution of the alongshore transect corresponding to the shallowest subtidal region (Figure 10e,h) shows an overall bias with respect to the ground truth surveys that might be related to non-linear effects resulting in depth overestimation.
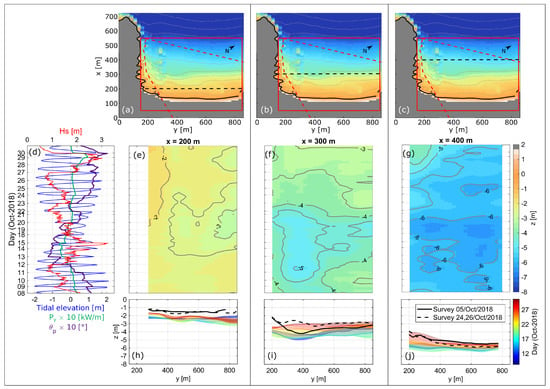
Figure 10.
LPCA beach alongshore profile morphological evolution over October 2018 derived from 2-day time-averaged Kalman-filtered cBathy estimates. (a–c) The alongshore profile transects are indicated by the black dashed lines. The red polygon shows the domain used for analysis and the red dashed lines indicate the limits of video-monitoring coverage. (d) Offshore significant wave height (red line; top axis), tidal elevation (blue line; bottom axis), 12 h averaged alongshore wave energy flux (green line; bottom axis) and 12 h averaged angle of peak wave incidence (purple line; bottom axis) time series corresponding to the computed cBathy Kalman-filtered stacks. (e–g) cBathy-derived timestacks along with (h–j) the time evolution of each cBathy alongshore profile (shown with different colors). The solid and black dashed lines correspond, respectively, to profile transects obtained from bathymetry (5/Oct/2018) and topo-bathymetry (24,26/Oct/2018) surveys. For better visualization, the time is concatenated during available cBathy stacks (i.e., nightlight hours and absent data from 16 and 17 October are removed).
4. Discussion
4.1. cBathy Performance and Sources of Errors
Video-derived bathymetries were obtained under challenging wave conditions. Nevertheless, the comparison between surveys and cBathy estimates revealed typical errors (RMSE = 0.49 to 0.57 m and bias = −0.36 to −0.29 m) similar to previous works (see Table 1). The very upper part of the beach face was related with less accurate results, as analysis tiles may have contained partly wet/dry pixels at the sea–land interface, mixing unuseful subaerial and acceptable subaqueous signals [54]. The systematic shallow water bias (overestimation of true depth) can also be explained by finite amplitude effects that increase wave celerity as waves shoal and break, reducing the validity of the linear dispersion relationship [38,46].
The current cBathy version does not include the effects of currents and Doppler shifting in the dispersion relation (Equation (3)). For the case of LPCA beach, persistent rip currents (e.g., near the headland and within the rip channels) can potentially interact with incident short-period waves, shortening their wavelength (k increases) and thus underestimating local depth. However, with cBathy typical settings (Table 2), short-period waves and rapid cross-shore depth changes over the sample domain cannot be resolved unless a denser pixel spacing is defined and more (higher) frequencies are accounted for analysis, thus requiring more computational effort [19].
Several studies have reported a significant variation in cBathy performance with increasing wave height [19,36,38,39,42] since breaking waves are spread over a wider surf zone, obscuring the optical wave signal and leading to incorrect estimates of f and k from imagery. Moreover, during storm conditions, the Kalman filter is not designed to account for the systematically biased errors that occur on the timescale as real bathymetric change [38], thus resulting in greater faith deterioration of the previous video-derived bathymetry estimate under energetic conditions compared to calm conditions [39]. Despite this issue, the quality assessment computed using the approach of Bouvier et al. [42] indicates the capability of cBathy to return depth estimates for more than 70% of the domain even under waves larger than 2 m.
As previously suggested by Brodie et al. [38], we acknowledge the fact that the cBathy algorithm should preferably not be used during storm events, as video-derived bathymetries may not be quantitatively reliable. Nevertheless, we believe that cBathy is still capable of providing qualitative insight into the morphological evolution of the seabed in between storms despite challenging wave conditions when beach measurements are often intermittent. This is supported based on the timex images computed throughout the field experiment, in which cBathy was able to reproduce the morphological features fairly well and match them qualitatively with the surveys.
4.2. LPCA Beach Morphological Response to Changes in Wave Direction
The 3-week video-derived bathymetry evolution showed that the morphological variability at LPCA beach was essentially influenced by the wave direction regime and the headland control. In contrast to expectations, the high-energy wave events did not necessarily correspond to abrupt erosional state transitions, as evidenced by the wave event of 28 October 2018. Remarkably, a previous study at LPCA beach [66] has even reported steadily onshore migration of the inner bar despite the extreme storms ( m) during the outstanding winter of 2013/2014. The latter highlights the complexity of beach morphodynamics in such environments that are geologically controlled, as outlined by different authors [50,51,52,53]. In the case of LPCA beach, it has been demonstrated that the submerged reef and the headland play an important role in determining the wave-induced circulation patterns within the surf zone depending on offshore wave obliquity [65,72,73,79,80]. Obliquely incident waves approaching from the right side of the headland () induce a strong longshore current that transports sediment along the surf zone ( kW/m) toward the headland that eventually end up being retained by this geological boundary. Although the sediment is assumed to remain accumulated on the updrift side of the headland, strong wave-induced deflection rips can lead to sand bypassing toward the adjacent beach [80]. On the other hand, when obliquely incident waves approach from the left side of the headland (), the lee of the headland remains protected from these incident waves, but the longshore sediment transport is inhibited. This deficit of sediment supply is the cause of downdrift erosion within the shadowed zone ( kW/m). Direct exposition of shore-normally incident waves ( and kW/m) during low tide are associated with rip current activity and rip cell circulations [65,73], resulting in rip channel formation and morphological discontinuities in the surf zone, as shown in Figure 11.
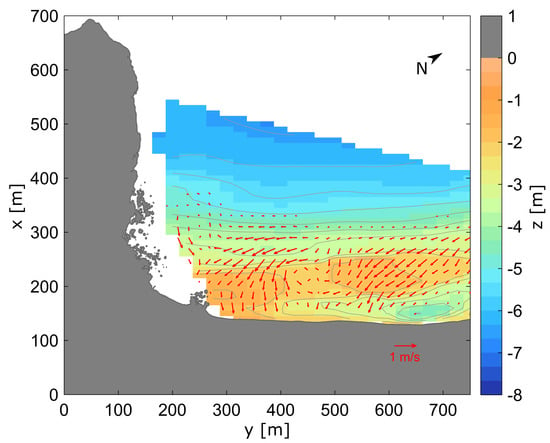
Figure 11.
Optical flow image-derived surf-zone circulation (red arrows) superimposed on cBathy-estimated bathymetry for the same time period when the rip channel was present (22/Oct/2018).
In addition to the longshore drift blocked by the headland, it is hypothesized that onshore sediment transport may have also contributed to the formation of the sandbar throughout the experiment. The field experiment was characterized by long period swell and moderately energetic constructive waves with low steepness that could promote slow sandbar building. This would also explain the overall erosion in the cross-shore distance between 400 and 600 m by the end of the experiment, as evidenced in Figure 4.
4.3. Perspectives and Future Challenges
The classic beach state classification based on the Dean’s parameter [64] and the Relative Tidal Range (RTR) parameter [81] assumes that the cross-shore and alongshore sediment exchange is unconstrained by geology [53]. Thus, traditional models are generally not directly applicable in such complex settings where geological control has a fundamental influence on their morphodynamics [52]. The use of improved morphodynamic models in conjunction with remotely sensed data could help to better understand beach evolution during storm events and assist coastal managers in effective management of geologically controlled beach environments.
Nowadays, the increasing proliferation of low-cost and flexible new platforms such as UAVs [82,83], swift cameras, CoastSnap [84] and online-streaming webcams [31,85,86] offer an attractive option to collect image products and derive measurements of the nearshore. In addition to image-processing techniques that allow estimating the nearshore bathymetry (e.g., cBathy [19,43]), recent works have opened up the possibility to remotely estimate 2D surface currents by tracking the drifting foam, left after the passage of breaking waves, from video imagery (e.g., optical flow-based algorithms [73,87,88]). Future work could be to apply both remote sensing techniques to provide fresh insight into the coupled (hydrodynamic/morphology) morphodynamic system, which is key to the validation of process-based morphodynamic models. So far, processed-based morphodynamic models have been validated based only on surveyed morphological changes and at best with concurrent local wave and flow punctual measurements [89]. However, sandy beach morphodynamics is driven by the interaction of the evolving seabed and rip-cell systems [64]. Measuring in situ the spatial structure of rip current systems requires the deployment of a large number of drifters, which is only possible during a limited duration and under low- to moderate-energy wave conditions (e.g., [90]). In contrast, new optical flow-based algorithms recently showed skill to infer surface currents in the surf zone and to address rip cell circulation [73,88]. Figure 11 shows an example of a 17-min time-averaged image combining both video-based techniques. It highlights the potential to address surf zone morphodynamic processes, i.e., the coupled morphology and hydrodynamics system, at unprecedented frequency and spatial coverage.
5. Conclusions
Bathymetry maps were estimated every 30 min during daylight hours for three consecutive weeks using a video-based linear depth inversion algorithm in order to examine LPCA beach morphological response under a wide range of wave and tide conditions. The smoothed bathymetry time evolution showed that LPCA beach morphology was controlled by the lateral boundary effects of the headland and was strongly dependent on the incident wave direction. The assessment was carried out by comparing concurrent video-derived bathymetries with in situ topo-bathymetric measurements collected during the beginning and end of the field experiment, as well as with timex images computed throughout the entire experiment. Comparisons between surveyed and video-derived bathymetric estimates showed a similar performance with respect to previous studies with an overall RMSE = 0.49 to 0.57 m and bias = −0.36 to −0.29 m. Overall, the morphological features were in approximately the right places but presented a significant vertical offset at the shallowest parts (reef and beach shore face) where depth was consistently overestimated mainly due to non-linear effects. The results suggest that video-derived bathymetries can provide qualitative information on beach morphology evolution in between storm events when environmental conditions are challenging, but caution should be exercised as morphological features may be quantitatively misrepresented. In conclusion, this study highlights the necessity of further modeling and combining existing video-based techniques to improve our understanding of beach morphodynamics near headlands, particularly under extreme wave conditions.
Supplementary Materials
The following are available online at https://zenodo.org/record/6617176#.Yp4WQerMLIU, accessed on 6 June 2022, Video S1: LPCA beach morphological evolution during October 2018 field experiment. (a) Time exposure (timex) image consisting of averaged pixel intensity over the record length of the stack and (b) standard deviation image showing the amount of change in pixel intensity over the record length of the stack in order to highlight preferential wave breaking. The magenta line indicates the zero-elevation contour relative to NGF-IGN69. (c) Kalman-filtered cBathy video-derived bathymetries. Elevation contours are spaced at 0.5 m intervals relative to NGF-IGN69. (d) Bathymetric change maps; difference between cBathy-derived bathymetries (panel c) and the cBathy-derived bathymetry from 8/Oct/2018 07:30:00 GMT, where red colors indicate sand accretion and blue colors sand erosion with respect to 8 October 2018 video-derived bathymetry. (e) Offshore significant wave height (red line; left axis), tidal elevation (blue line; right axis), 12 h averaged alongshore wave energy flux (green line; right axis) and 12 h averaged angle of peak wave incidence (purple line; right axis) time series.
Author Contributions
Conceptualization, I.R.-P., B.C., V.M. and D.M.; methodology, I.R.-P., B.C., V.M. and D.M.; software, I.R.-P. and V.M.; validation, I.R.-P., B.C., V.M. and D.M.; formal analysis, I.R.-P., B.C., V.M. and D.M.; investigation, I.R.-P., B.C. and V.M.; resources, B.C. and D.M.; data curation, I.R.-P.; writing—original draft preparation, I.R.-P.; writing—review and editing, I.R.-P., B.C., V.M. and D.M.; visualization, I.R.-P.; supervision, B.C., V.M. and D.M.; project administration, B.C.; funding acquisition, B.C. All authors have read and agreed to the published version of the manuscript.
Funding
This research received external funding by CONACyT (México) through the PhD scholarship of I.R.-P. (grant 540839). The LPCA field experiment received financial support from Region Nouvelle Aquitaine (contract number 2017-1R20107) and was carried out as part of the project MEPELS (contract number 18CP05), performed under the auspices of the DGA and led by SHOM. B.C. and V.M. are funded by Agence Nationale de la Recherche (ANR) grant number ANR-21-CE01-0015.
Data Availability Statement
Data presented in this study are available on request from the corresponding author.
Acknowledgments
LPCA beach is a monitoring site labeled by the Service National d’Observation (SNO) Dynalit (https://www.dynalit.fr, accessed on 6 June 2022) with additional funding from the Observatoire de la Côte Nouvelle-Aquitaine (OCNA) to ensure the maintenance of the video station. The installation of the video station at the top of Biarritz lighthose was allowed by le Service des Phares et Balises. Storage resources for this study was provided by the computing facilities MCIA (Mésocentre de Calcul Intensif Aquitain) of Univ. Bordeaux and Univ. Pau et Pays de l’Adour.
Conflicts of Interest
The authors declare no conflict of interest.
Abbreviations
The following abbreviations are used in this manuscript:
| eTBR | erosive Transverse Bar and Rip |
| GCPs | Ground Control Points |
| LTT | Low-Tide Terrace |
| LPCA | La Petite Chambre d’Amour |
| PPK-GNSS | Post Processing Kinematic Differential Global Navigation Satellite System |
| RMSE | Root Mean Square Error |
| RTK-DGPS | Real-Time Kinematic Differential Global Positioning System |
| RTK-GNSS | Real-Time Kinematic Global Navigation Satellite System |
| RTR | Relative Tidal Range |
| TBR | Transverse Bar and Rip |
| UAV | Unmanned Aerial Vehicle |
References
- Cowell, P.J.; Thom, B.G. Morphodynamics of coastal evolution. In Coastal Evolution: Late Quaternary Shoreline Morphodynamics; Cambridge University Press: Cambridge, UK, 1994; pp. 33–86. [Google Scholar]
- Davidson, M.; Van Koningsveld, M.; de Kruif, A.; Rawson, J.; Holman, R.; Lamberti, A.; Medina, R.; Kroon, A.; Aarninkhof, S. The CoastView project: Developing video-derived Coastal State Indicators in support of coastal zone management. Coast. Eng. 2007, 54, 463–475. [Google Scholar] [CrossRef]
- Dugan, J.; Morris, W.; Vierra, K.; Piotrowski, C.; Farruggia, G.; Campion, D. Jetski-based nearshore bathymetric and current survey system. J. Coast. Res. 2001, 17, 900–908. [Google Scholar]
- MacMahan, J. Hydrographic surveying from personal watercraft. J. Surv. Eng. 2001, 127, 12–24. [Google Scholar] [CrossRef]
- Van Son, S.; Lindenbergh, R.; De Schipper, M.; De Vries, S.; Duijnmayer, K. Using a personal watercraft for monitoring bathymetric changes at storm scale. In Proceedings of the Hydro9 Conference, Cape Town, South Africa, 10–12 November 2009. [Google Scholar]
- Honegger, D.A.; Haller, M.C.; Holman, R.A. High-resolution bathymetry estimates via X-band marine radar: 1. beaches. Coast. Eng. 2019, 149, 39–48. [Google Scholar] [CrossRef]
- Lyzenga, G.A.; Ahrens, T.J. The relation between the shock-induced free-surface velocity and the postshock specific volume of solids. J. Appl. Phys. 1978, 49, 201–204. [Google Scholar] [CrossRef] [Green Version]
- Lee, Z.; Carder, K.L.; Mobley, C.D.; Steward, R.G.; Patch, J.S. Hyperspectral remote sensing for shallow waters: 2. Deriving bottom depths and water properties by optimization. Appl. Opt. 1999, 38, 3831–3843. [Google Scholar] [CrossRef] [PubMed] [Green Version]
- Mobley, C.D.; Sundman, L.K.; Davis, C.O.; Bowles, J.H.; Downes, T.V.; Leathers, R.A.; Montes, M.J.; Bissett, W.P.; Kohler, D.D.; Reid, R.P.; et al. Interpretation of hyperspectral remote-sensing imagery by spectrum matching and look-up tables. Appl. Opt. 2005, 44, 3576–3592. [Google Scholar] [CrossRef]
- Lyzenga, D.R.; Malinas, N.P.; Tanis, F.J. Multispectral bathymetry using a simple physically based algorithm. IEEE Trans. Geosci. Remote Sens. 2006, 44, 2251–2259. [Google Scholar] [CrossRef]
- Battjes, J.A.; Janssen, J. Energy loss and set-up due to breaking of random waves. In Proceedings of the 16th Conference on Coastal Engineering, Hamburg, Germany, 27 August–3 September 1978; pp. 569–587. [Google Scholar]
- Aarninkhof, S.G.; Ruessink, B.G. Video observations and model predictions of depth-induced wave dissipation. IEEE Trans. Geosci. Remote Sens. 2004, 42, 2612–2622. [Google Scholar] [CrossRef]
- Aarninkhof, S.; Ruessink, B.; Roelvink, J. Nearshore subtidal bathymetry from time-exposure video images. J. Geophys. Res. Ocean. 2005, 110. [Google Scholar] [CrossRef]
- Aarninkhof, S.; Wijnberg, K.; Roelvink, D.; Reniers, A. 2DH-quantification of surf zone bathymetry from video. In Proceedings of the 5th International Conference on Coastal Dynamics 2005, Barcelona, Spain, 4–8 April 2005; pp. 1–14. [Google Scholar]
- van Dongeren, A.; Plant, N.; Cohen, A.; Roelvink, D.; Haller, M.C.; Catalán, P. Beach Wizard: Nearshore bathymetry estimation through assimilation of model computations and remote observations. Coast. Eng. 2008, 55, 1016–1027. [Google Scholar] [CrossRef]
- Bell, P.S. Shallow water bathymetry derived from an analysis of X-band marine radar images of waves. Coast. Eng. 1999, 37, 513–527. [Google Scholar] [CrossRef]
- Mancini, S.; Olsen, R.C.; Abileah, R.; Lee, K.R. Automating nearshore bathymetry extraction from wave motion in satellite optical imagery. In Algorithms and Technologies for Multispectral, Hyperspectral, and Ultraspectral Imagery XVIII; International Society for Optics and Photonics: Baltimore, MD, USA, 2012; Volume 8390, p. 83900P. [Google Scholar]
- Almar, R.; Bonneton, P.; Senechal, N.; Roelvink, D. Wave celerity from video imaging: A new method. In Proceedings of the Coastal Engineering 2008: 31st International Conference, Hamburg, Germany, 31 August–5 September 2008; World Scientific: Singapore, 2009; pp. 661–673. [Google Scholar]
- Holman, R.; Plant, N.; Holland, T. cBathy: A robust algorithm for estimating nearshore bathymetry. J. Geophys. Res. Ocean. 2013, 118, 2595–2609. [Google Scholar] [CrossRef]
- Bian, X.; Shao, Y.; Zhang, C.; Xie, C.; Tian, W. The feasibility of assessing swell-based bathymetry using SAR imagery from orbiting satellites. ISPRS J. Photogramm. Remote Sens. 2020, 168, 124–130. [Google Scholar] [CrossRef]
- Almar, R.; Bergsma, E.W.; Thoumyre, G.; Baba, M.W.; Cesbron, G.; Daly, C.; Garlan, T.; Lifermann, A. Global satellite-based coastal bathymetry from waves. Remote Sens. 2021, 13, 4628. [Google Scholar] [CrossRef]
- Stockdon, H.F.; Holman, R.A. Estimation of wave phase speed and nearshore bathymetry from video imagery. J. Geophys. Res. Ocean. 2000, 105, 22015–22033. [Google Scholar] [CrossRef]
- Plant, N.G.; Holland, K.T.; Haller, M.C. Ocean wavenumber estimation from wave-resolving time series imagery. IEEE Trans. Geosci. Remote Sens. 2008, 46, 2644–2658. [Google Scholar] [CrossRef]
- Matsuba, Y.; Sato, S. Nearshore bathymetry estimation using UAV. Coast. Eng. J. 2018, 60, 51–59. [Google Scholar] [CrossRef]
- Simarro, G.; Calvete, D.; Luque, P.; Orfila, A.; Ribas, F. UBathy: A new approach for bathymetric inversion from video imagery. Remote Sens. 2019, 11, 2722. [Google Scholar] [CrossRef] [Green Version]
- Thuan, D.H.; Almar, R.; Marchesiello, P.; Viet, N.T. Video sensing of nearshore bathymetry evolution with error estimate. J. Mar. Sci. Eng. 2019, 7, 233. [Google Scholar] [CrossRef] [Green Version]
- Abessolo, G.O.; Almar, R.; Bonou, F.; Bergsma, E. Error proxies in video-based depth inversion: Temporal celerity estimation. J. Coast. Res. 2020, 95, 1101–1105. [Google Scholar] [CrossRef]
- Gawehn, M.; de Vries, S.; Aarninkhof, S. A Self-Adaptive Method for Mapping Coastal Bathymetry On-The-Fly from Wave Field Video. Remote Sens. 2021, 13, 4742. [Google Scholar] [CrossRef]
- Santos, D.; Abreu, T.; Silva, P.A.; Santos, F.; Baptista, P. Nearshore Bathymetry Retrieval from Wave-Based Inversion for Video Imagery. Remote Sens. 2022, 14, 2155. [Google Scholar] [CrossRef]
- Splinter, K.D.; Harley, M.D.; Turner, I.L. Remote sensing is changing our view of the coast: Insights from 40 years of monitoring at Narrabeen-Collaroy, Australia. Remote Sens. 2018, 10, 1744. [Google Scholar] [CrossRef] [Green Version]
- Andriolo, U.; Sánchez-García, E.; Taborda, R. Operational use of surfcam online streaming images for coastal morphodynamic studies. Remote Sens. 2019, 11, 78. [Google Scholar] [CrossRef] [Green Version]
- Holman, R.; Stanley, J. cBathy Bathymetry Estimation in the Mixed Wave-Current Domain of a Tidal Estuary. J. Coast. Res. 2013, 2, 1391–1396. [Google Scholar] [CrossRef]
- Wengrove, M.E.; Henriquez, M.; De Schipper, M.A.; Holman, R.; Stive, M. Monitoring morphology of the Sand Engine leeside using Argus’ cBathy. In Proceedings of the Coastal Dynamics 2013: 7th International Conference on Coastal Dynamics, Arcachon, France, 24–28 June 2013; Bordeaux University: Bordeaux, France, 2013. [Google Scholar]
- Radermacher, M.; Wengrove, M.; van Thiel de Vries, J.; Holman, R. Applicability of video-derived bathymetry estimates to nearshore current model predictions. J. Coast. Res. 2014, 70, 290–295. [Google Scholar] [CrossRef] [Green Version]
- Sembiring, L.; Van Dongeren, A.; Winter, G.; Van Ormondt, M.; Briere, C.; Roelvink, D. Nearshore bathymetry from video and the application to rip current predictions for the Dutch Coast. J. Coast. Res. 2014, 70, 354–359. [Google Scholar] [CrossRef]
- Bergsma, E.; Conley, D.; Davidson, M.; O’Hare, T. Video-based nearshore bathymetry estimation in macro-tidal environments. Mar. Geol. 2016, 374, 31–41. [Google Scholar] [CrossRef] [Green Version]
- Aarnink, J. Bathymetry Mapping Using Drone Imagery. Master’s Thesis, Delft University of Technology, Delft, The Netherlands, 2017. [Google Scholar]
- Brodie, K.L.; Palmsten, M.L.; Hesser, T.J.; Dickhudt, P.J.; Raubenheimer, B.; Ladner, H.; Elgar, S. Evaluation of video-based linear depth inversion performance and applications using altimeters and hydrographic surveys in a wide range of environmental conditions. Coast. Eng. 2018, 136, 147–160. [Google Scholar] [CrossRef] [Green Version]
- Bergsma, E.W.; Conley, D.C.; Davidson, M.A.; O’Hare, T.J.; Almar, R. Storm event to seasonal evolution of nearshore bathymetry derived from shore-based video imagery. Remote Sens. 2019, 11, 519. [Google Scholar] [CrossRef] [Green Version]
- Bergsma, E.W.; Almar, R.; de Almeida, L.P.M.; Sall, M. On the operational use of UAVs for video-derived bathymetry. Coast. Eng. 2019, 152, 103527. [Google Scholar] [CrossRef]
- Perugini, E.; Soldini, L.; Palmsten, M.L.; Calantoni, J.; Brocchini, M. Linear depth inversion sensitivity to wave viewing angle using synthetic optical video. Coast. Eng. 2019, 152, 103535. [Google Scholar] [CrossRef]
- Bouvier, C.; Balouin, Y.; Castelle, B.; Valentini, N. Video depth inversion at a microtidal site exposed to prevailing low-energy short-period waves and episodic severe storms. J. Coast. Res. 2020, 95, 1021–1026. [Google Scholar] [CrossRef]
- Holman, R.; Bergsma, E.W. Updates to and Performance of the cBathy Algorithm for Estimating Nearshore Bathymetry from Remote Sensing Imagery. Remote Sens. 2021, 13, 3996. [Google Scholar] [CrossRef]
- Palmsten, M.L.; Brodie, K.L. The Coastal Imaging Research Network (CIRN). Remote Sens. 2022, 14, 453. [Google Scholar] [CrossRef]
- Grilli, S.T. Depth inversion in shallow water based on nonlinear properties of shoaling periodic waves. Coast. Eng. 1998, 35, 185–209. [Google Scholar] [CrossRef]
- Bergsma, E.W.; Almar, R. Video-based depth inversion techniques, a method comparison with synthetic cases. Coast. Eng. 2018, 138, 199–209. [Google Scholar] [CrossRef]
- Holland, T.K. Application of the linear dispersion relation with respect to depth inversion and remotely sensed imagery. IEEE Trans. Geosci. Remote Sens. 2001, 39, 2060–2072. [Google Scholar] [CrossRef]
- Catálan, P.A.; Haller, M.C. Remote sensing of breaking wave phase speeds with application to non-linear depth inversions. Coast. Eng. 2008, 55, 93–111. [Google Scholar] [CrossRef]
- Almar, R.; Cienfuegos, R.; Catalán, P.; Birrien, F.; Castelle, B.; Michallet, H. Nearshore bathymetric inversion from video using a fully non-linear Boussinesq wave model. J. Coast. Res. 2011, 64, 20–24. [Google Scholar]
- Jackson, D.; Cooper, J.; Del Rio, L. Geological control of beach morphodynamic state. Mar. Geol. 2005, 216, 297–314. [Google Scholar] [CrossRef]
- Loureiro, C.; Ferreira, O.; Cooper, J.A.G. Applicability of parametric beach morphodynamic state classification on embayed beaches. Mar. Geol. 2013, 346, 153–164. [Google Scholar] [CrossRef]
- McCarroll, R.J.; Brander, R.W.; Turner, I.L.; Van Leeuwen, B. Shoreface storm morphodynamics and mega-rip evolution at an embayed beach: Bondi Beach, NSW, Australia. Cont. Shelf Res. 2016, 116, 74–88. [Google Scholar] [CrossRef]
- Gallop, S.L.; Kennedy, D.M.; Loureiro, C.; Naylor, L.A.; Muñoz-Pérez, J.J.; Jackson, D.W.; Fellowes, T.E. Geologically controlled sandy beaches: Their geomorphology, morphodynamics and classification. Sci. Total Environ. 2020, 731, 139123. [Google Scholar] [CrossRef]
- Rutten, J.; de Jong, S.M.; Ruessink, G. Accuracy of nearshore bathymetry inverted from X-band radar and optical video data. IEEE Trans. Geosci. Remote Sens. 2016, 55, 1106–1116. [Google Scholar] [CrossRef]
- Short, A.D. Australian beach systems—Nature and distribution. J. Coast. Res. 2006, 22, 11–27. [Google Scholar] [CrossRef]
- Short, A.D. Role of geological inheritance in Australian beach morphodynamics. Coast. Eng. 2010, 57, 92–97. [Google Scholar] [CrossRef]
- González, M.; Medina, R.; Losada, M. Equilibrium beach profile model for perched beaches. Coast. Eng. 1999, 36, 343–357. [Google Scholar] [CrossRef]
- Muñoz-Pérez, J.; Tejedor, L.; Medina, R. Equilibrium beach profile model for reef-protected beaches. J. Coast. Res. 1999, 15, 950–957. [Google Scholar]
- Jackson, D.; Cooper, J. Geological control on beach form: Accommodation space and contemporary dynamics. J. Coast. Res. 2009, 64, 69–72. [Google Scholar]
- Gallop, S.L.; Bosserelle, C.; Eliot, I.; Pattiaratchi, C.B. The influence of limestone reefs on storm erosion and recovery of a perched beach. Cont. Shelf Res. 2012, 47, 16–27. [Google Scholar] [CrossRef]
- Gallop, S.L.; Bosserelle, C.; Eliot, I.; Pattiaratchi, C.B. The influence of coastal reefs on spatial variability in seasonal sand fluxes. Mar. Geol. 2013, 344, 132–143. [Google Scholar] [CrossRef] [Green Version]
- McCarroll, R.J.; Brander, R.W.; Turner, I.L.; Power, H.E.; Mortlock, T.R. Lagrangian observations of circulation on an embayed beach with headland rip currents. Mar. Geol. 2014, 355, 173–188. [Google Scholar] [CrossRef]
- Trenhaile, A. Rocky coasts―Their role as depositional environments. Earth-Sci. Rev. 2016, 159, 1–13. [Google Scholar] [CrossRef]
- Wright, L.; Short, A. Morphodynamic variability of surf zones and beaches: A synthesis. Mar. Geol. 1984, 56, 93–118. [Google Scholar] [CrossRef]
- Mouragues, A.; Bonneton, P.; Castelle, B.; Marieu, V.; Jak McCarroll, R.; Rodriguez-Padilla, I.; Scott, T.; Sous, D. High-Energy Surf Zone Currents and Headland Rips at a Geologically Constrained Mesotidal Beach. J. Geophys. Res. Ocean. 2020, 125, e2020JC016259. [Google Scholar] [CrossRef]
- Huguet, J.R.; Castelle, B.; Marieu, V.; Morichon, D.; de Santiago, I. Shoreline-Sandbar Dynamics at a High-Energy Embayed and Structurally-Engineered Sandy Beach: Anglet, SW France. J. Coast. Res. 2016, 75, 393–397. [Google Scholar] [CrossRef]
- Komar, P.D.; Inman, D.L. Longshore sand transport on beaches. J. Geophys. Res. 1970, 75, 5914–5927. [Google Scholar] [CrossRef]
- Short, A.D. Three dimensional beach-stage model. J. Geol. 1979, 87, 553–571. [Google Scholar] [CrossRef]
- Ruessink, B.; Van Enckevort, I.; Kingston, K.; Davidson, M. Analysis of observed two-and three-dimensional nearshore bar behaviour. Mar. Geol. 2000, 169, 161–183. [Google Scholar] [CrossRef]
- Sénéchal, N.; Gouriou, T.; Castelle, B.; Parisot, J.P.; Capo, S.; Bujan, S.; Howa, H. Morphodynamic response of a meso-to macro-tidal intermediate beach based on a long-term data set. Geomorphology 2009, 107, 263–274. [Google Scholar] [CrossRef] [Green Version]
- Price, T.; Ruessink, B. State dynamics of a double sandbar system. Cont. Shelf Res. 2011, 31, 659–674. [Google Scholar] [CrossRef]
- Sous, D.; Castelle, B.; Mouragues, A.; Bonneton, P. Field Measurements of a High-Energy Headland Deflection Rip Current: Tidal Modulation, Very Low Frequency Pulsation and Vertical Structure. J. Mar. Sci. Eng. 2020, 8, 534. [Google Scholar] [CrossRef]
- Rodríguez-Padilla, I.; Castelle, B.; Marieu, V.; Bonneton, P.; Mouragues, A.; Martins, K.; Morichon, D. Wave-Filtered Surf Zone Circulation under High-Energy Waves Derived from Video-Based Optical Systems. Remote Sens. 2021, 13, 1874. [Google Scholar] [CrossRef]
- Laporte-Fauret, Q.; Marieu, V.; Castelle, B.; Michalet, R.; Bujan, S.; Rosebery, D. Low-cost UAV for high-resolution and large-scale coastal dune change monitoring using photogrammetry. J. Mar. Sci. Eng. 2019, 7, 63. [Google Scholar] [CrossRef] [Green Version]
- Rodriguez-Padilla, I.; Castelle, B.; Marieu, V.; Morichon, D. A Simple and Efficient Image Stabilization Method for Coastal Monitoring Video Systems. Remote Sens. 2020, 12, 70. [Google Scholar] [CrossRef] [Green Version]
- Holland, K.T.; Holman, R.A.; Lippmann, T.C.; Stanley, J.; Plant, N. Practical use of video imagery in nearshore oceanographic field studies. IEEE J. Ocean. Eng. 1997, 22, 81–92. [Google Scholar] [CrossRef]
- Kalman, R.E. A New Approach to Linear Filtering and Prediction Problems. 1960. Available online: https://courses.cs.duke.edu/compsci527/cps274/fall11/papers/Kalman60.pdf (accessed on 20 January 2020).
- Péron, C.; Sénéchal, N. Dynamic of a meso to macro-tidal double barred beach: Inner bar response. J. Coast. Res. 2011, 64, 120–124. [Google Scholar]
- Mouragues, A.; Bonneton, P.; Castelle, B.; Marieu, V.; Barrett, A.; Bonneton, N.; Detand, G.; Martins, K.; McCarroll, J.; Morichon, D.; et al. Field Observations of Wave-induced Headland Rips. J. Coast. Res. 2020, 95, 578–582. [Google Scholar] [CrossRef]
- Mouragues, A.; Bonneton, P.; Castelle, B.; Martins, K. Headland Rip Modelling at a Natural Beach under High-Energy Wave Conditions. J. Mar. Sci. Eng. 2021, 9, 1161. [Google Scholar] [CrossRef]
- Masselink, G.; Short, A.D. The effect of tide range on beach morphodynamics and morphology: A conceptual beach model. J. Coast. Res. 1993, 9, 785–800. [Google Scholar]
- Turner, I.L.; Harley, M.D.; Drummond, C.D. UAVs for coastal surveying. Coast. Eng. 2016, 114, 19–24. [Google Scholar] [CrossRef]
- Holman, R.A.; Brodie, K.L.; Spore, N.J. Surf Zone Characterization Using a Small Quadcopter: Technical Issues and Procedures. IEEE Trans. Geosci. Remote Sens. 2017, 55, 2017–2027. [Google Scholar] [CrossRef]
- Harley, M.; Kinsela, M.; Sánchez-García, E.S.; Vos, K. CoastSnap: Crowd-Sourced Shoreline Change Mapping using Smartphones. In AGU Fall Meeting Abstracts; EP52D–26; American Geophysical Union: Washington, DC, USA, 2018; Volume 2018. [Google Scholar]
- Valentini, N.; Balouin, Y.; Bouvier, C. Exploiting the capabilities of surfcam for coastal morphodynamic analysis. J. Coast. Res. 2020, 95, 1333–1338. [Google Scholar] [CrossRef]
- Mole, M.A.; Mortlock, T.R.; Turner, I.L.; Goodwin, I.D.; Splinter, K.D.; Short, A.D. Capitalizing on the surfcam phenomenon: A pilot study in regional-scale shoreline and inshore wave monitoring utilizing existing camera infrastructure. J. Coast. Res. 2013, 65, 1433–1438. [Google Scholar] [CrossRef]
- Dérian, P.; Almar, R. Wavelet-Based Optical Flow Estimation of Instant Surface Currents from Shore-Based and UAV Videos. IEEE Trans. Geosci. Remote Sens. 2017, 55, 5790–5797. [Google Scholar] [CrossRef]
- Anderson, D.; Bak, A.S.; Brodie, K.L.; Cohn, N.; Holman, R.A.; Stanley, J. Quantifying Optically Derived Two-Dimensional Wave-Averaged Currents in the Surf Zone. Remote Sens. 2021, 13, 690. [Google Scholar] [CrossRef]
- Roelvink, D.; Reniers, A.; Van Dongeren, A.; De Vries, J.V.T.; McCall, R.; Lescinski, J. Modelling storm impacts on beaches, dunes and barrier islands. Coast. Eng. 2009, 56, 1133–1152. [Google Scholar] [CrossRef]
- McCarroll, R.J.; Brander, R.W.; Scott, T.; Castelle, B. Bathymetric controls on rotational surfzone currents. J. Geophys. Res. Earth Surf. 2018, 123, 1295–1316. [Google Scholar] [CrossRef]
Publisher’s Note: MDPI stays neutral with regard to jurisdictional claims in published maps and institutional affiliations. |
© 2022 by the authors. Licensee MDPI, Basel, Switzerland. This article is an open access article distributed under the terms and conditions of the Creative Commons Attribution (CC BY) license (https://creativecommons.org/licenses/by/4.0/).