Article

Long-Term Investigation of Aerosols in the Urmia Lake Region in the Middle East by Ground-Based and Satellite Data in 2000–2021

by
Abbas Ranjbar Saadat Abadi
1,
Nasim Hossein Hamzeh
2,
Karim Shukurov
3,
Christian Opp
4,* and
Umesh Chandra Dumka
5
1
Department of Meteorology, Atmospheric Science & Meteorological Research Center (ASMERC), Tehran 14118-13389, Iran
2
Department Meteorology, Air and Climate Technology Company (ACTC), Tehran 15996-16313, Iran
3
A.M. Obukhov Institute of Atmospheric Physics, Russian Academy of Sciences, 119017 Moscow, Russia
4
Department of Geography, Philipps-Universität Marburg, D-35032 Marburg, Germany
5
Aryabhatta Research Institute of Observational Sciences, Nainital 263001, India
*
Author to whom correspondence should be addressed.
Remote Sens. 2022, 14(15), 3827; https://doi.org/10.3390/rs14153827
Submission received: 7 May 2022 / Revised: 2 August 2022 / Accepted: 4 August 2022 / Published: 8 August 2022
(This article belongs to the Topic Recent Progress in Aerosol Remote Sensing and Products)

Abstract

:
Dried lake beds are some of the largest sources of dust in the world and have caused environmental problems in the surrounding areas in recent decades. In the present work, we studied the monthly and annual occurrence of dust storms at selected weather stations around Urmia Lake in northwestern (NW) Iran. Furthermore, we investigated the variations in the daily aerosol optical depth (AOD at 550 nm) and the Ångström exponent (at 412/470 nm), as well as the vertical profile of the total aerosol extinction coefficient and AOD at 532 nm, using space-borne MODIS (Moderate Resolution Imaging Spectroradiometer) Aqua and CALIPSO Satellite LiDAR data over the Urmia Lake region (36–39°N, 44–47°E). The monthly variations of AOD550 and AOD532 for the regions 37–39°N and 46–59°E were compared, and it was found that the CALIPSO AOD532 and MODIS AOD532 (reconstructed using the Ångström exponent) were in good agreement. In general, the dust storms during 2000–2021 increased the AOD550 above average around the Urmia Lake. The vertical profile of aerosols showed that the largest contribution to total aerosol loading over the Urmia Lake was from 1.5–3 km, 1.5–4 km, 1.5–5 km, and 1.5–3 km during winter, spring, summer, and autumn seasons, respectively.

Graphical Abstract

1. Introduction

Dust storms are among the most serious natural hazards, affecting climate change [1,2,3,4,5], marine life [6,7,8], snow cover and glaciers [9], vegetation, visibility, solar power plants, and animal lives [10,11], as well as various aspects of human health and lives [12,13,14,15,16]. Dust particles are the heaviest particles in the atmosphere, and they are attracted to synoptic scales such as El Niño [17,18] and La Niña [19,20]. Furthermore, the dust storms directly affect the vegetation cover [21,22,23,24], soil texture [25,26], and precipitation rate [27,28,29,30].
Deserts are the largest sources of dust storms in the world [31,32,33]. However, some dried lakes have suddenly emerged as a significant source of dust worldwide. There are many dried lake beds in the Middle East and Central Asia. The Aral Sea, located between Kazakhstan and Uzbekistan [34,35,36,37,38], is one of the most well-known dried lakes. The Hamun Lakes in the Sistan region in Iran [39,40,41] and Urmia Lake in Iran’s Middle East [42,43,44] are two other sources of dust. The chemical composition and grain size of aerosols lifted by dust storms from dried lake beds differ from those of desert dust storms and the majority of saline dust storms lifted from a dried lake [35,45]. Saline aerosols are suspended in the atmosphere for a long time [46].
In the last two decades, dust particles from the lake have influenced the adjacent areas. The number of dust occurrences has grown with significant inverse association to the Urmia Lake area [35,43], as the dry bed of Urmia Lake is one of the largest saline dust sources in Iran (mainly salty dust sources). This lake’s water capacity has recently been depleted. As a result, salty dust storms have become much more common. Although climatic factors played an important role in shrinkage of the Urmia Lake, the long-term investigations of climate and human influences on the lake revealed that the human impact on the watershed played a larger role in the lake’s water body and dryness [47]. On the basis of a 40 year analysis, Delju et al. [48] revealed that the average precipitation over the lake has reduced by 9% while the average maximum surface temperature has increased by 0.8 °C. It is estimated that the anthropogenic impacts have roughly 80% of the desiccation of the Urmia Lake, while the climatic causes account for 20% [49]. The dam construction, agricultural irrigation, and construction of a transportation route across the lake are the primary anthropogenic factors [50]. The same disaster happened in the Aral Sea, which become one of the worst disasters in Central Asia after the 1990s [51,52]. This lake has become an important source of dust and a salt hotspot in the Aralkum desert, which is located on the dried sea bottom, over the last three decades. The water bodies and vegetation cover decreased dramatically in the lake, while dust and salt storms increased significantly [53]. The dust storms caused by the lake mostly affected Kazakhstan, Uzbekistan, and Turkmenistan; however, some dust storms also recently affected NE Iran, Tajikistan, and Afghanistan [35,51]. The main cause of lake water loss is an increase in irrigated land area around the lake, the rise of cotton as the dominant crop, and rapid population growth near the lake [54].
In the current work, we investigate the spatiotemporal dynamic of dust days, as well as the monthly long-term variations, at the meteorological stations in or near Urmia Lake, including variations in daily average aerosol optical depth (AOD550) and Ångström exponent (at 423/470 nm) MODIS Aqua satellite data in 2002–2021, and tropospheric vertical profiles of aerosol extinction coefficient (at 532 nm) from CALIPSO data from 2006–2021. Although previous studies [44,48,49] examined the variability of dust events over NW Iran, the current work provides a comprehensive analysis of MODIS aerosol optical depth at 550 nm, CALIPSO tropospheric profiles of aerosol extinction coefficient at 532 nm, and dust reported by meteorological stations near Urmia Lake.

2. Materials and Methods
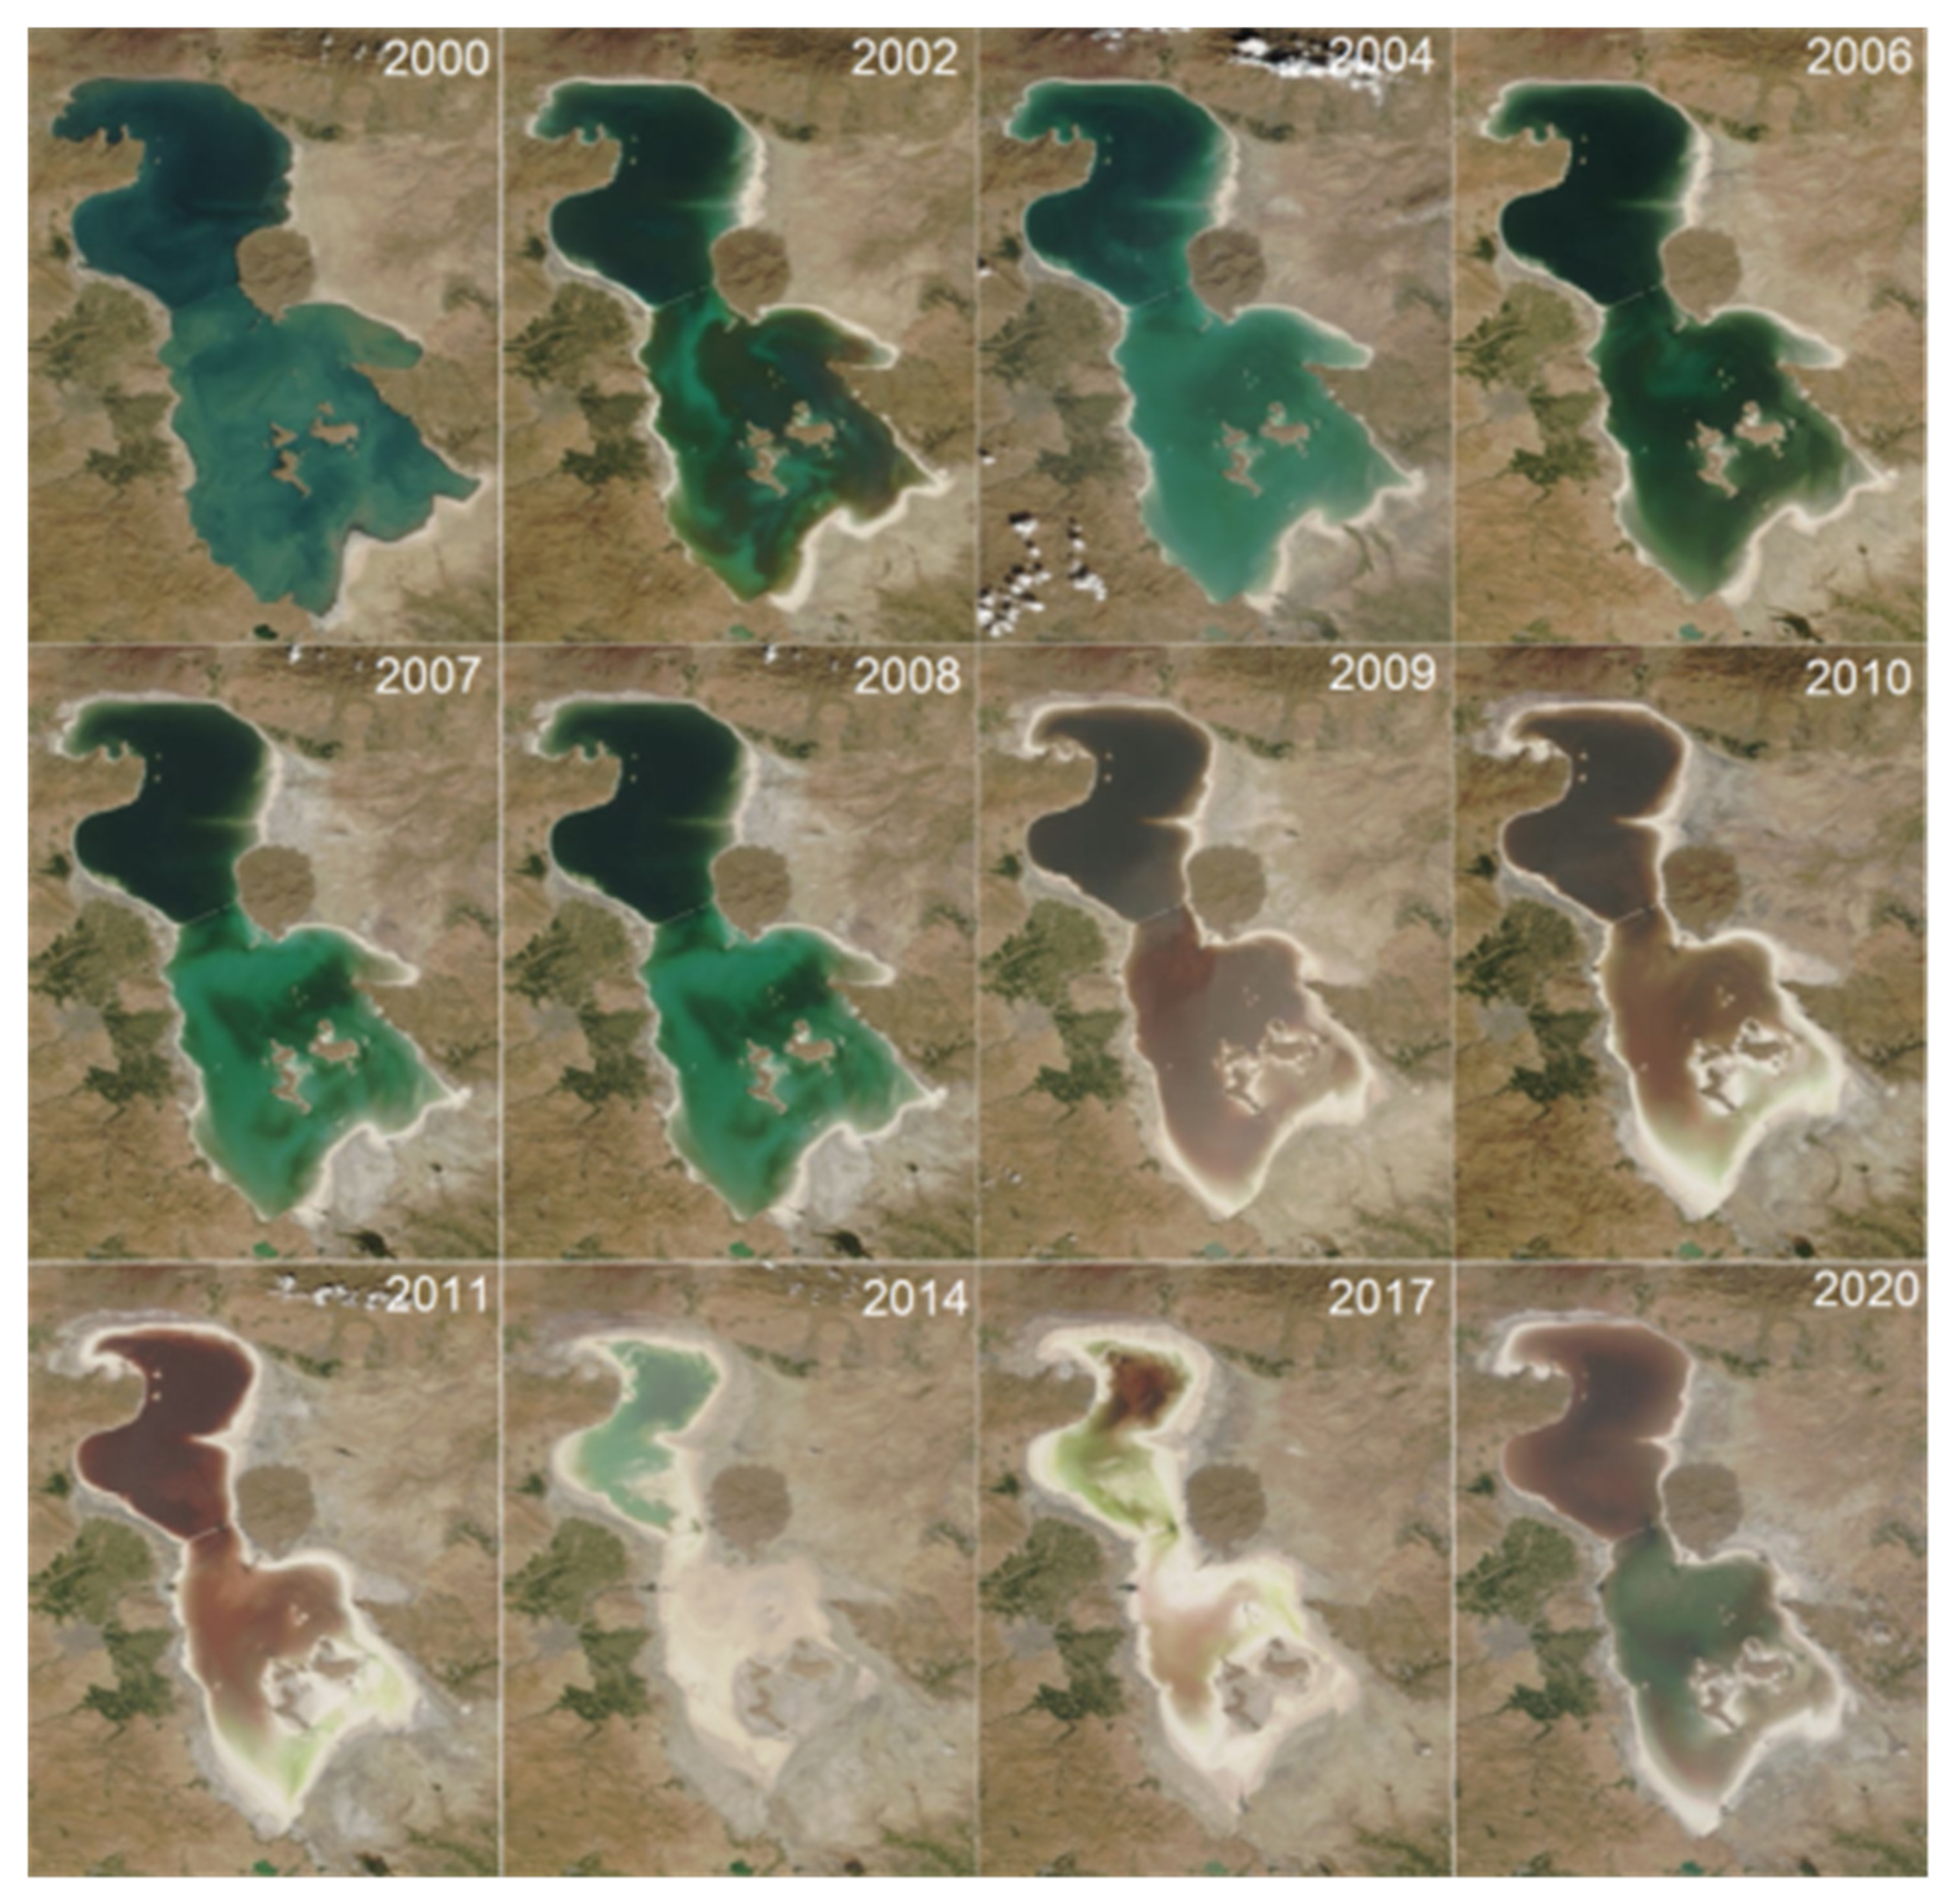
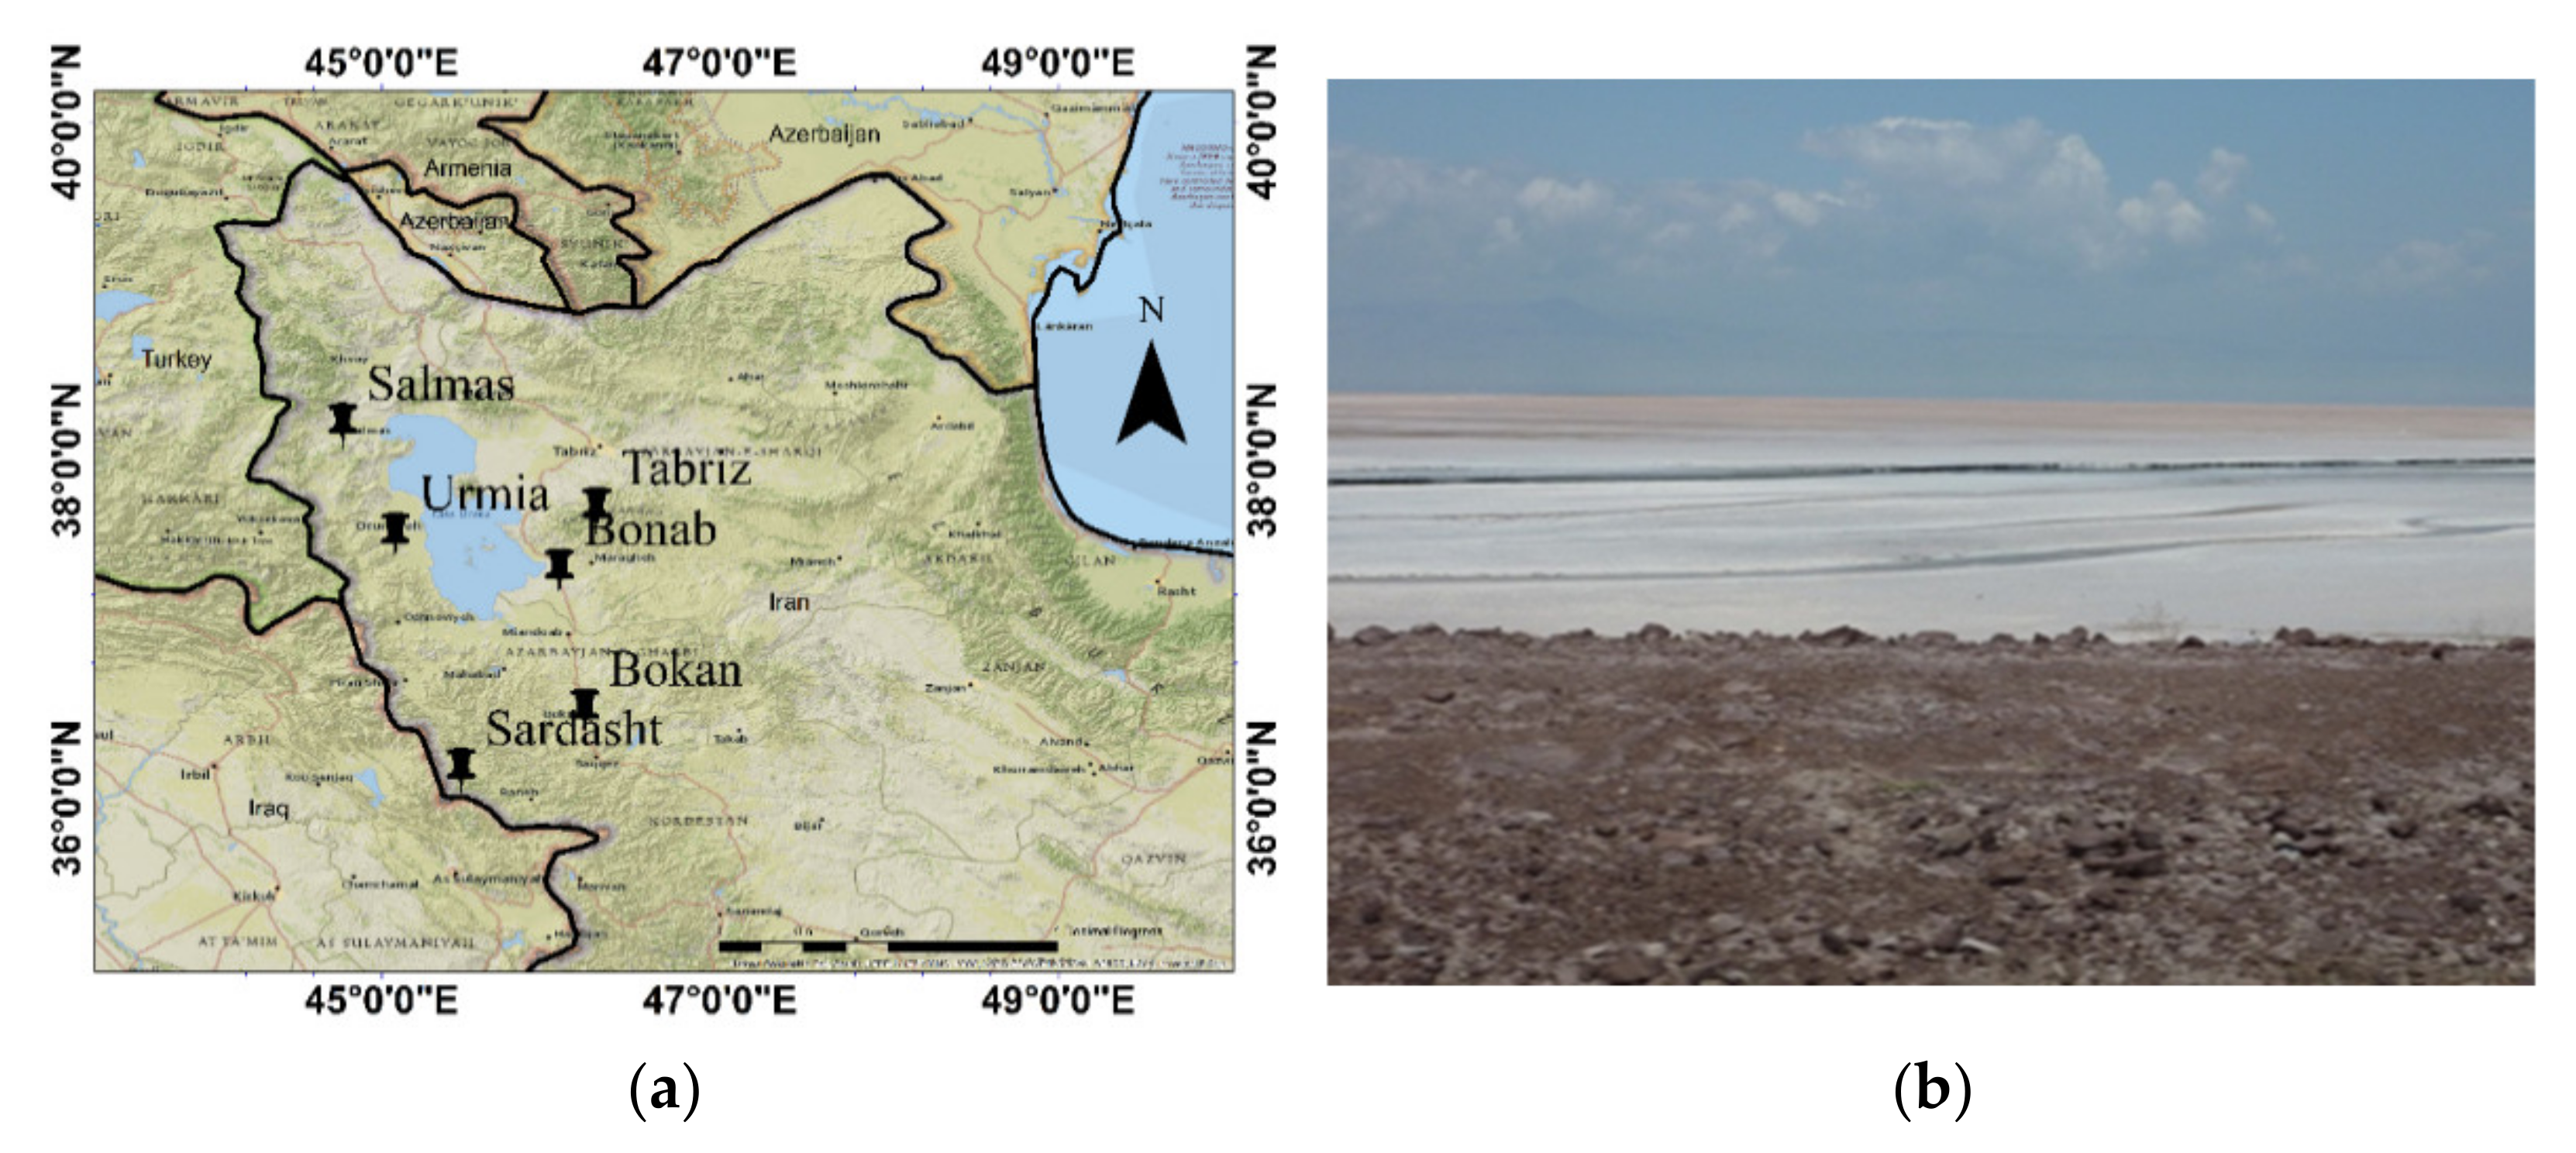
2.1. Study Area

Urmia Lake (37–38.5°N; 45–46°E) is located at a height of 1273 m above mean sea level in the northwest (NW) Iran (Figure 1 and Figure 2a). After the Great Salt Lake in the United States, Urmia Lake is the world’s second-largest salt lake. In recent decades, the lake’s surface area has ranged between 4600 and 6000 km2, depending on the evaporation rate and water influx [35,55]. The salt lake is surrounded by mountains and is not drainable. This lake recently lost the majority of its water body due to several factors, the most significant of which was the construction of the dams within its catchment. One of the most significant anthropogenic impacts on the lake’s water household was the construction of more than 50 dams at the lake’s tributaries in the Urmia Lake catchment for water removal for irrigation and drinking water supply [55]. In the last two decades, Urmia Lake’s southern shallow-water portion has been greatly reduced, and this portion was completely desiccated in some years (Figure 1). The development and operation of more than 300 aquaculture facilities for fish production around the Urmia Lake, which pump up groundwater as process water for the aquaculture fish ponds, have disrupted the groundwater inflow into the lake [35,55], representing another major anthropogenic cause of the Urmia Lake disaster. Therefore, saline dust storms occur easily from the desiccated lake bed [44].

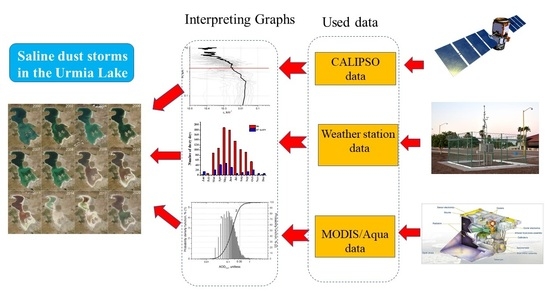
2.2. Dataset and Methodology

2.2.1. In Situ Data

The annual frequency of dusty days at fine weather stations surrounding Urmia Lake was examined in the present study from 2000 to 2020 to investigate the weather codes associated with dust storms (06, 07–09, 30–35 codes). The total number of dusty days (monthly) with the 06 and 07–09 weather codes and the monthly number of dusty days with 06–07 weather codes were investigated for Tabriz and Urmia weather stations. A dusty day is one in which the weather codes related to dust (06, 07–09, 30–35 codes) were reported at least once (in eight reports). Table 1 shows the definitions for the dust-related codes (06, 07, and 30–35), derived from meteorological reports during the study period. Because the dust codes 08, 09, and 98 are uncommon and reported rarely in this region, they were not investigated in the current study. Furthermore, the most frequently reported codes were 06 and 07, while the 30–35 codes were uncommon in the study area.
Table 2 shows the longitude, latitude, elevation, and the annual mean number of dust days at Tabriz and Urmia weather stations from 2000–2021. These two stations serve as the administrative centers for the two provinces on either side of the lake (West Azerbaijan Province and East Azerbaijan Province), and their populations are the highest in NW Iran when compared to other megacities in the region.
Urmia City (1332 m a.s.l.; 37.55°N; 45.08°E), is 20 km from Urmia Lake. Urmia, the capital of Iran’s West Azerbaijan province, has a population of about one million people. Urmia is situated in the Urmia plain, surrounded by Sir Mountain, Qiz Qaleh Mountain, and Jahudha Mountain. Urmia city is situated between Urmia Lake and the city’s western mountain wall [40]. Tabriz (1351 m above mean sea level; 38.09°N; 46.27°E) is the capital city of Iran’s East Azerbaijan province. It is the third-largest industrial megacity in the world, with a population of two million people. Tabriz is a mountain city with a total area of 1014.45 km2. The city is home to industries such as oil refineries, petrochemical complexes, and thermal power plants. Tabriz’s industrial units and a large number of vehicles contribute to one of the city’s major problems with air pollution [57,58,59]. Because the dominant wind direction in the Urmia Lake area is southwesterly [44,57,60,61,62,63], saline dust from the Urmia Lake affects Tabriz more.

2.2.2. CALIPSO Aerosol Extinction Coefficient Profiles

Cloud-free vertical profiles of extinction coefficients (ε (km−1)) of total aerosol, dust, and smoke aerosol at 532 nm wavelength from 2006 to 2021 are obtained by space-based satellite LiDAR (i.e., CALIPSO) [64]. Archived monthly tropospheric aerosol extinction coefficient profiles are the product of averaging all “instantaneous” profiles of the month within 2° × 5° cells. The vertical resolution of tropospheric profiles is 60 m; the altitude range is 0.04–12.04 km a.s.l. (200 layers by 60 m).
The monthly average profiles in the Urmia Lake region refer to the cell 37–39°N, 45–50°E (222 km × 445 km; latitude × longitude), which includes the lake itself, and a mountainous region (average altitude about 1.5 km a.s.l.) to the east from the Urmia Lake and the southwest of the Caspian Sea (see Figure 3; blue rectangle). All the monthly average profiles of tropospheric aerosols were extracted for this cell (centered at 38°N, 47.5°E, marked with red dots in Figure 3), from which the seasonal profiles were calculated for the entire period 2006–2021, as well as monthly tropospheric aerosol optical depths of total aerosol at a wavelength of 532 nm (AOD532).
For this cell (centered at 38°N, 47.5°E, marked with a red dot in Figure 3), all monthly average tropospheric profiles of the total aerosol were extracted, from which seasonal profiles were calculated for the entire period 2006–2021, as well as monthly mean tropospheric aerosol optical depths of the total aerosol at a wavelength of 532 nm (AOD532), were reconstructed.
AOD 532 = ε i × 0.06   km ,  
where ε i is the total aerosol extinction coefficient for layer i with a thickness of 0.06 km, summed over all layers for the range of altitudes of 1.5–12 km a.s.l.
The initial altitude of 1.5 km a.s.l. was chosen to ensure the compatibility between AOD based on CALIPSO and MODIS satellite measurements, as the latter in the cell 37–39°N, 46–49°E refers to heights greater than 1.5 km a.s.l. on average. It is worth noting that the majority of the surface around Urmia Lake features a mountainous area without powerful sources of aerosols, such as deserts.

2.2.3. Aqua MODIS Aerosol Optical Depth and Ångström Exponent Time Series

Out of the Terra and Aqua satellites, we chose Aqua because it flies in the same orbit and nearly simultaneously (2 min ahead) with the CALIPSO satellite. Furthermore, Aqua crosses the equator closer to noon, at 1:30 p.m. local solar time, 3 h later than Terra. Because each orbit lasts approximately 90 min, the Aqua satellite passes over the Urmia Lake region (about 40°N) around 1:20 p.m. local solar time (UTC 8:50 a.m.). In the current work, we used the nine adjacent cells measuring 1° × 1° (111 km × 89 km; latitude × longitude; see Figure 3), and the time series of daily AOD550 and Ångström exponent was studied for the period 2002–2021. These nine cells cover 333 km × 267 km. The central cell (C-cell) covers more than 80% of the Urmia Lake and its shallowest part most affected by desiccation in the 21st century (see Figure 1). The northern cell is the most stable and deep-water part of the lake, while the remainder of the surrounding cells are relatively uniform in the underlying surface and topography. Because it is known [65] that algorithms for reconstructing aerosol parameters from MODIS data work correctly only over a surface with a constant water/land mask, not over ephemeral reservoirs (to which Urmia Lake belongs), seven of the nine cells were used (except the northern and central cells). The direction of the seven cells surrounding Urmia Lake is indicated by the direction on them relative to the C-cell. There are no power dusting surfaces in the area, such as a desert. Tabriz is in the southwestern corner of the northeastern (NE) cell (see Figure 3), while Urmia is in the western corner of the C-cell (see Figure 3).
The resulting daily AOD550 time series for the seven cells were filled at a minimum of ~36% (E-cell) and a maximum of ~70% (SW-cell). The average cell filling rate was ~55%. Furthermore, the correlation coefficients (hereafter Pearson correlation coefficients) and their significance level (i.e., p-values) were estimated to assess the statistical relationship of AOD550 variations over different cells for each pair of AOD550 series. Correlation coefficients with p ≤ 0.05 were considered statistically significant.
For comparison with the CALIPSO satellite data, the daily AOD550 and daily AE series were additionally obtained for four 1° × 1° cells in the area of 37–39°N, 47–49°E east of the Urmia Lake region. Note that the surface within these four cells (except for a narrow strip near the Caspian Sea) differs little from the surface in the cells surrounding the Urmia Lake. The same can be said about the height above sea level; it decreases significantly only near the 49th meridian (see Figure 3). For a correct comparison of AOD532 according to CALIPSO data with AOD550 according to MODIS data, the latter was converted to AOD532 using the known relation for the Ångström exponent.
τ 1 τ 2 = λ 1 λ 2 α ,
where α is the Ångström exponent, τ1 is AOD550, τ2 is AOD532, λ1 = 550 nm, and λ2 = 532 nm. Hereinafter, AOD532 according to CALIPSO and Aqua MODIS data are designated as CAL-AOD532 and MOD-AOD532, respectively.

3. Results

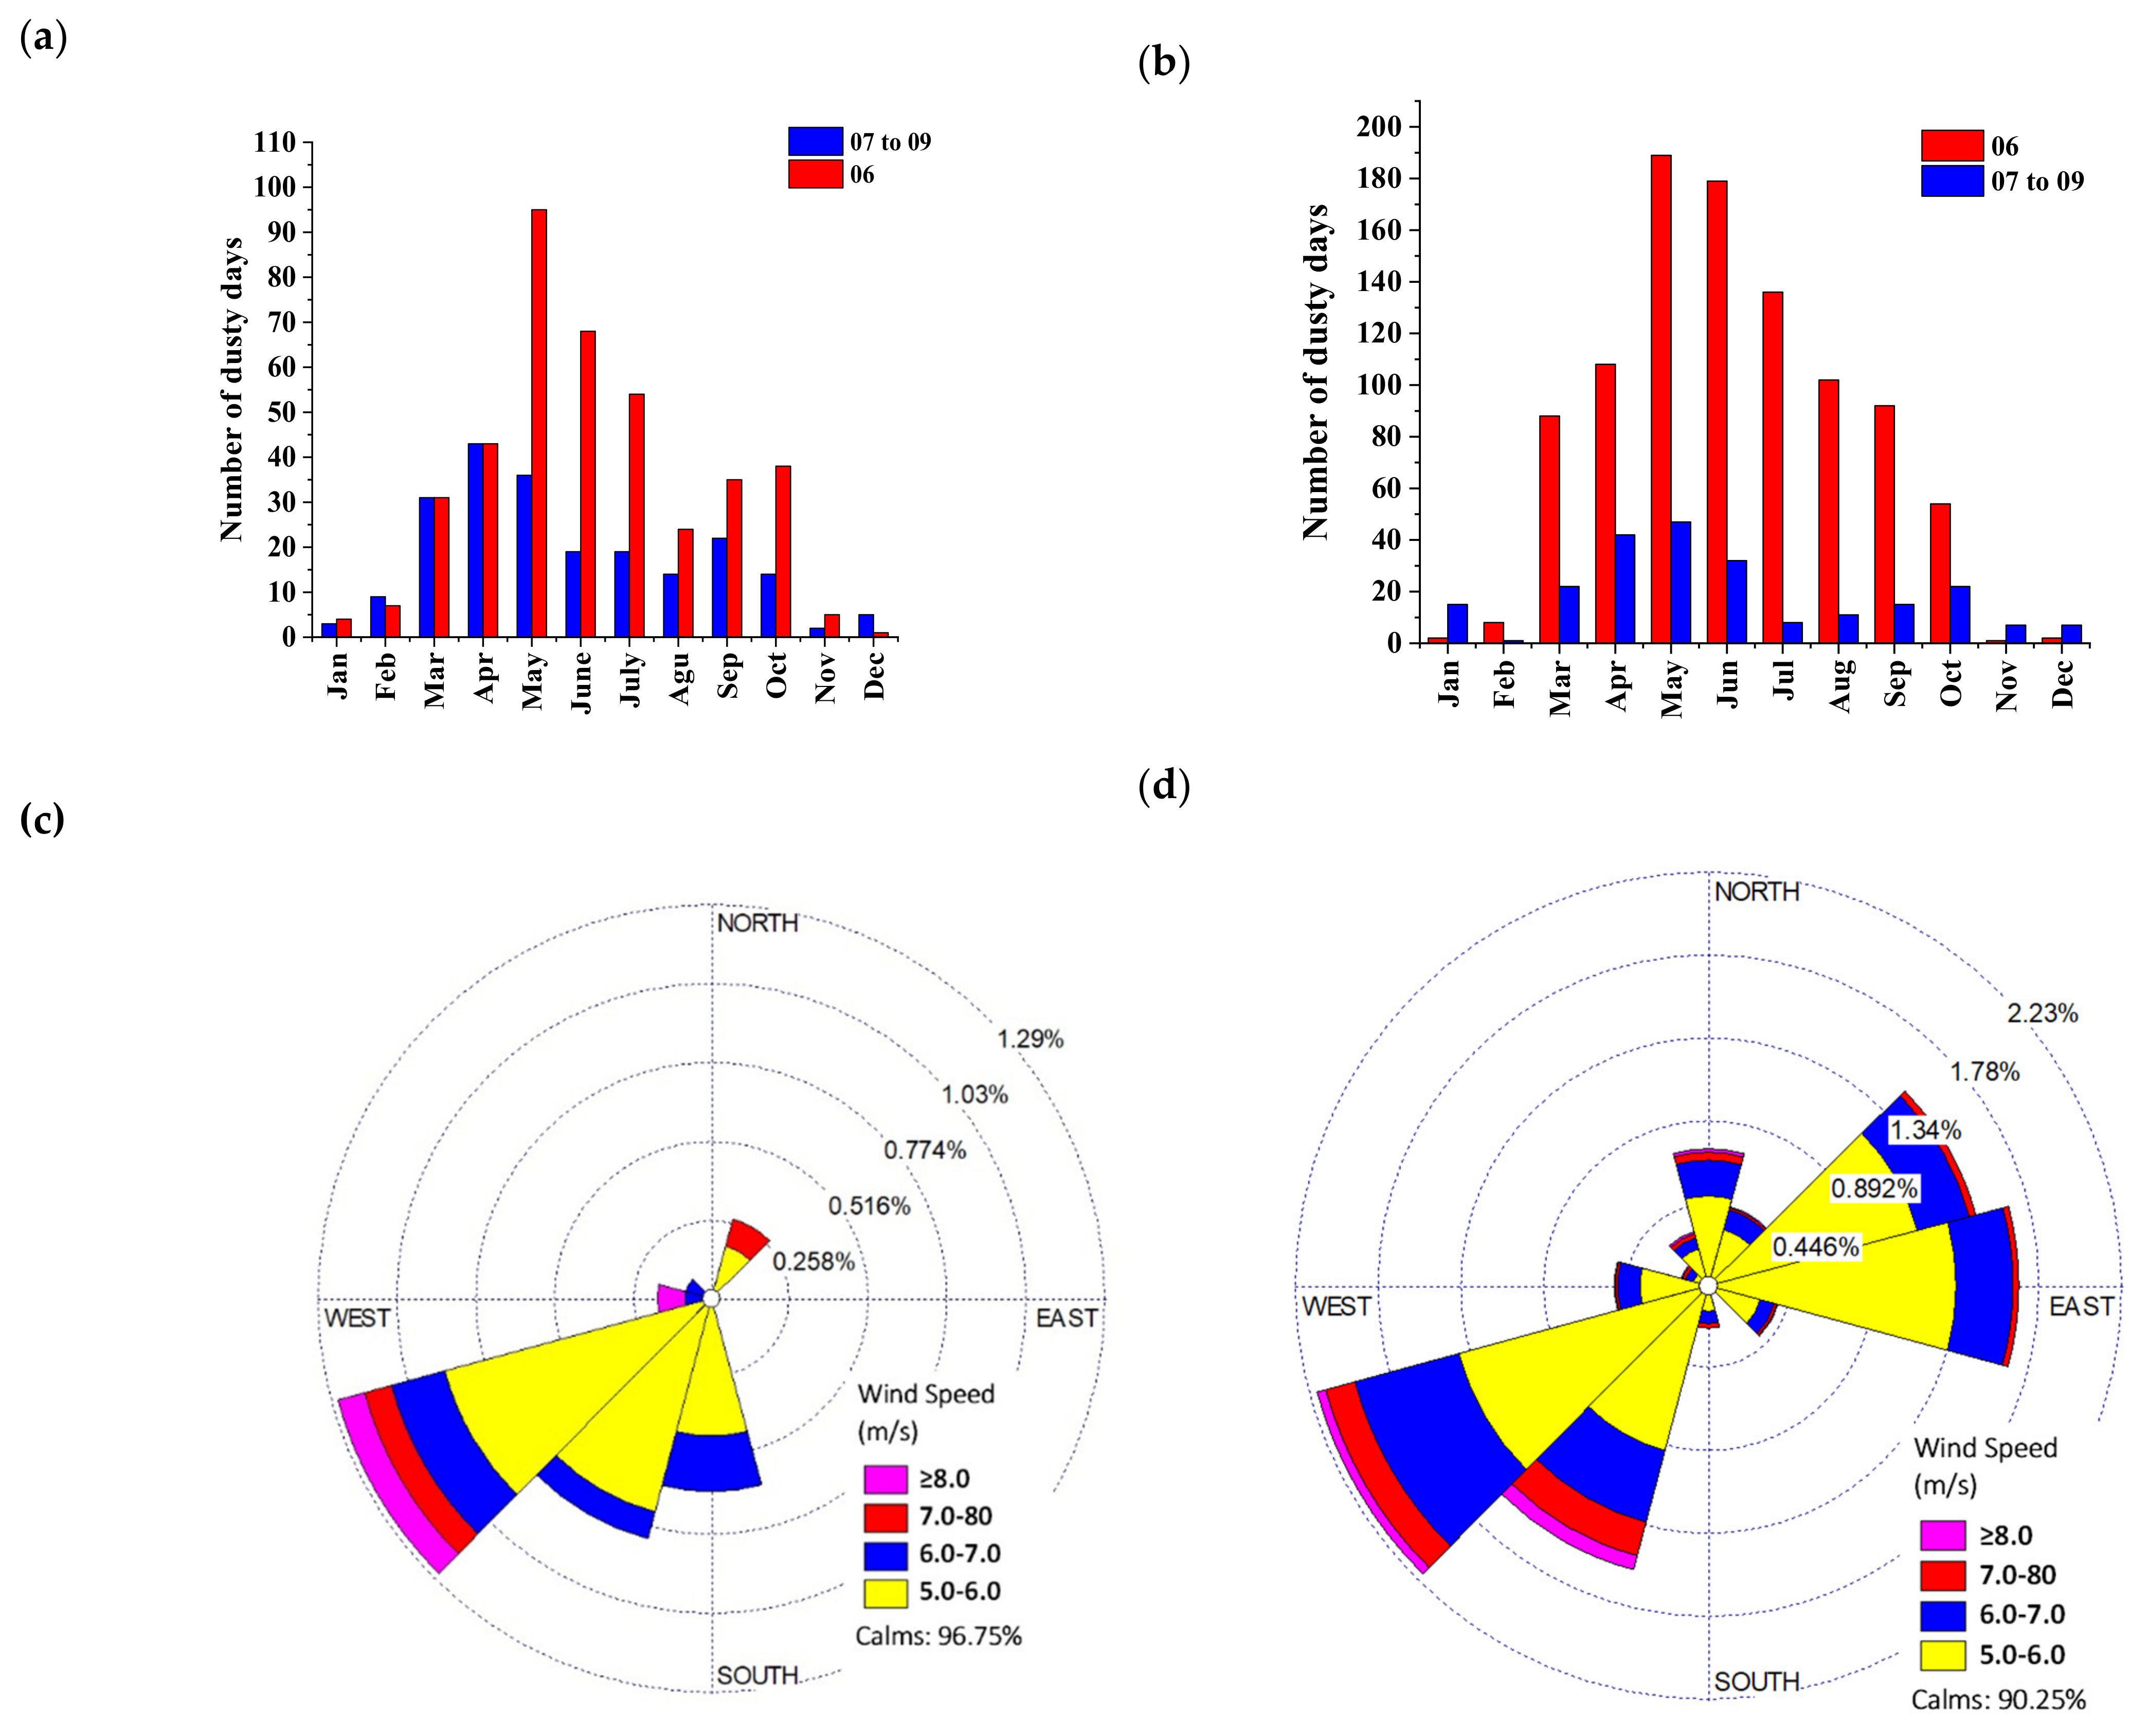
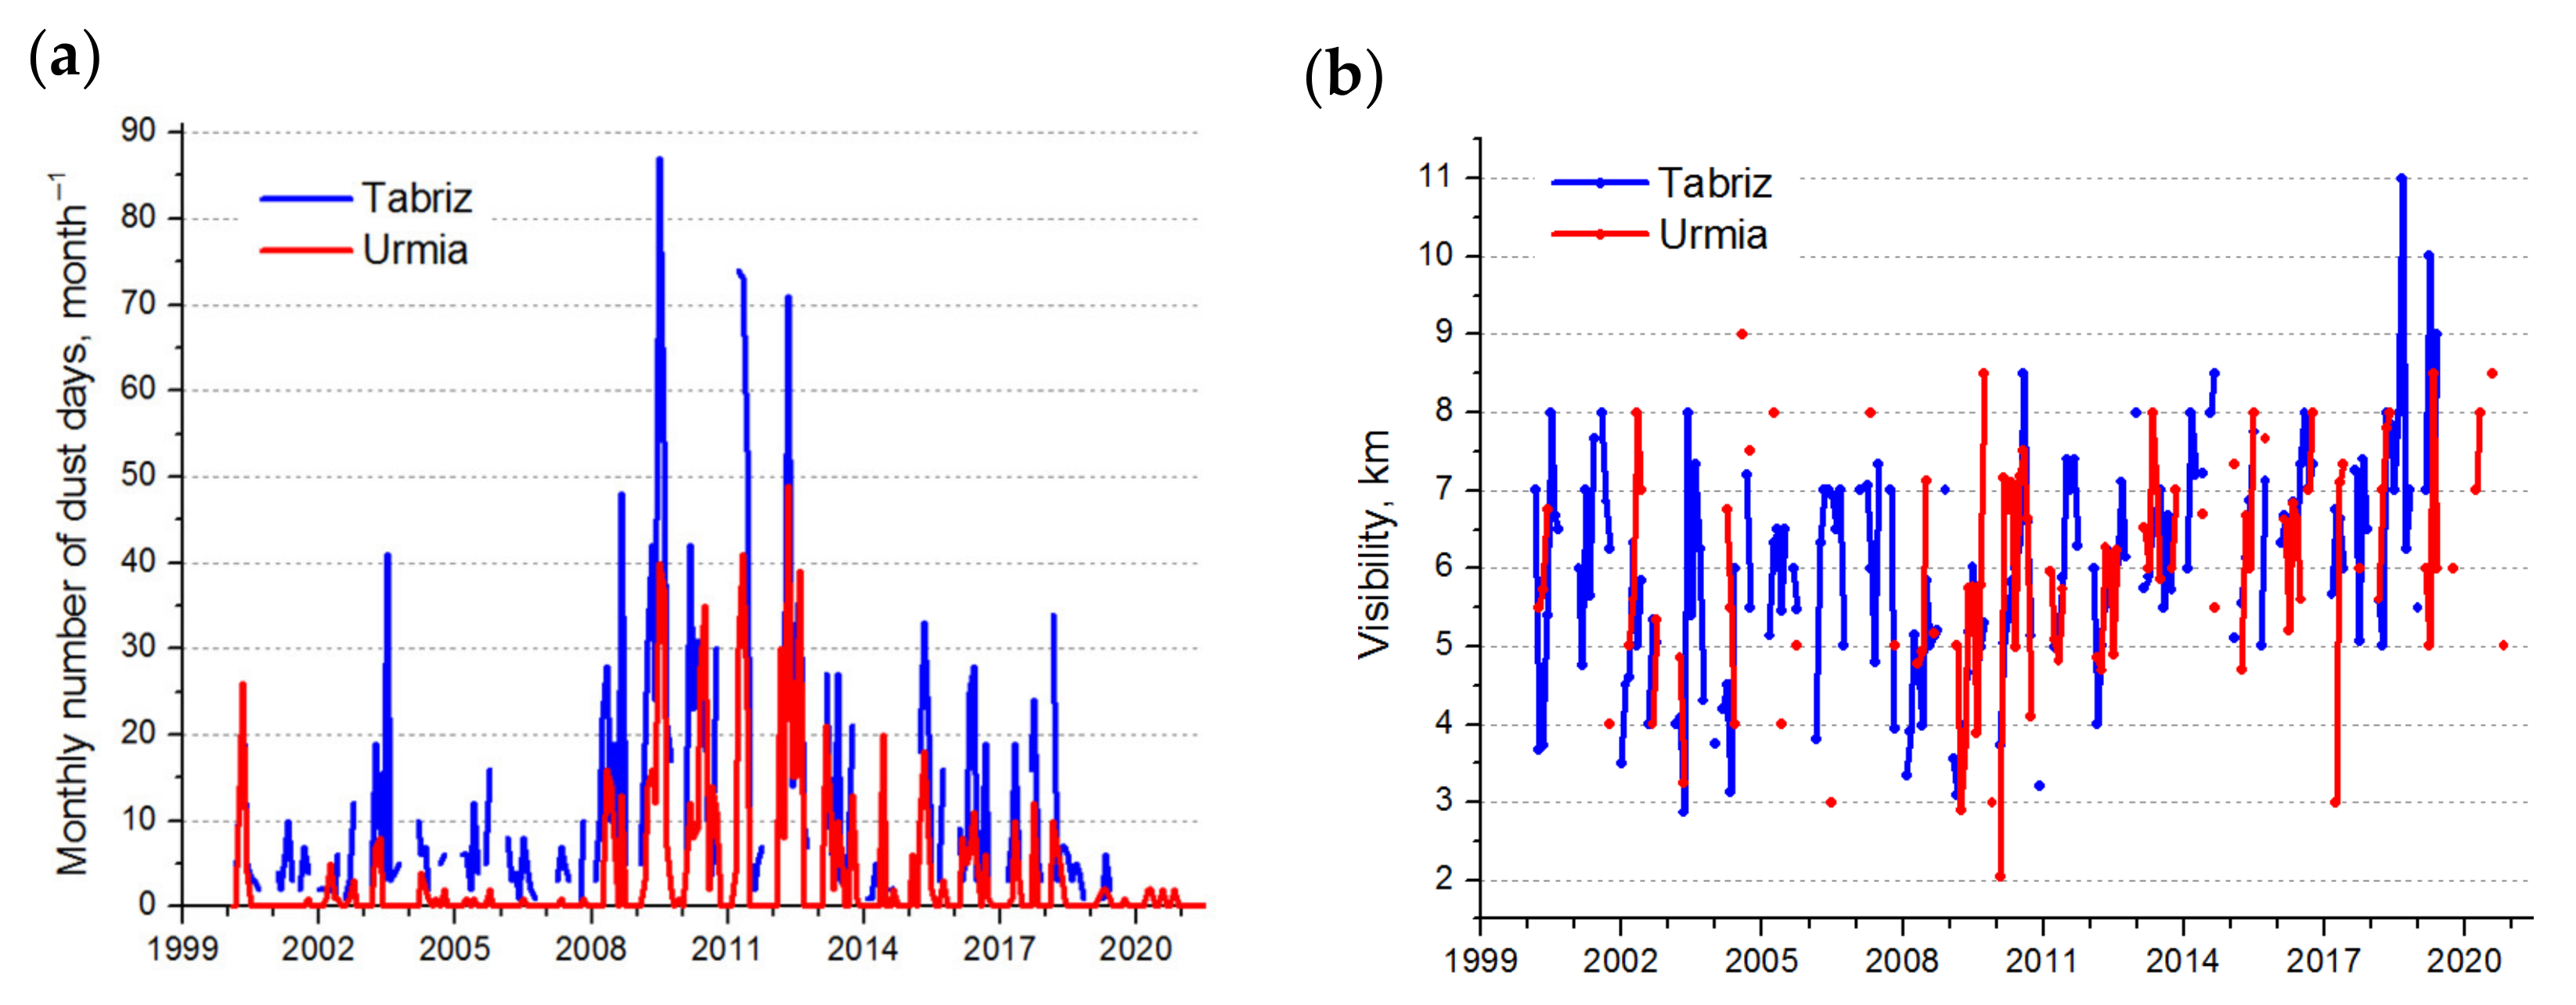
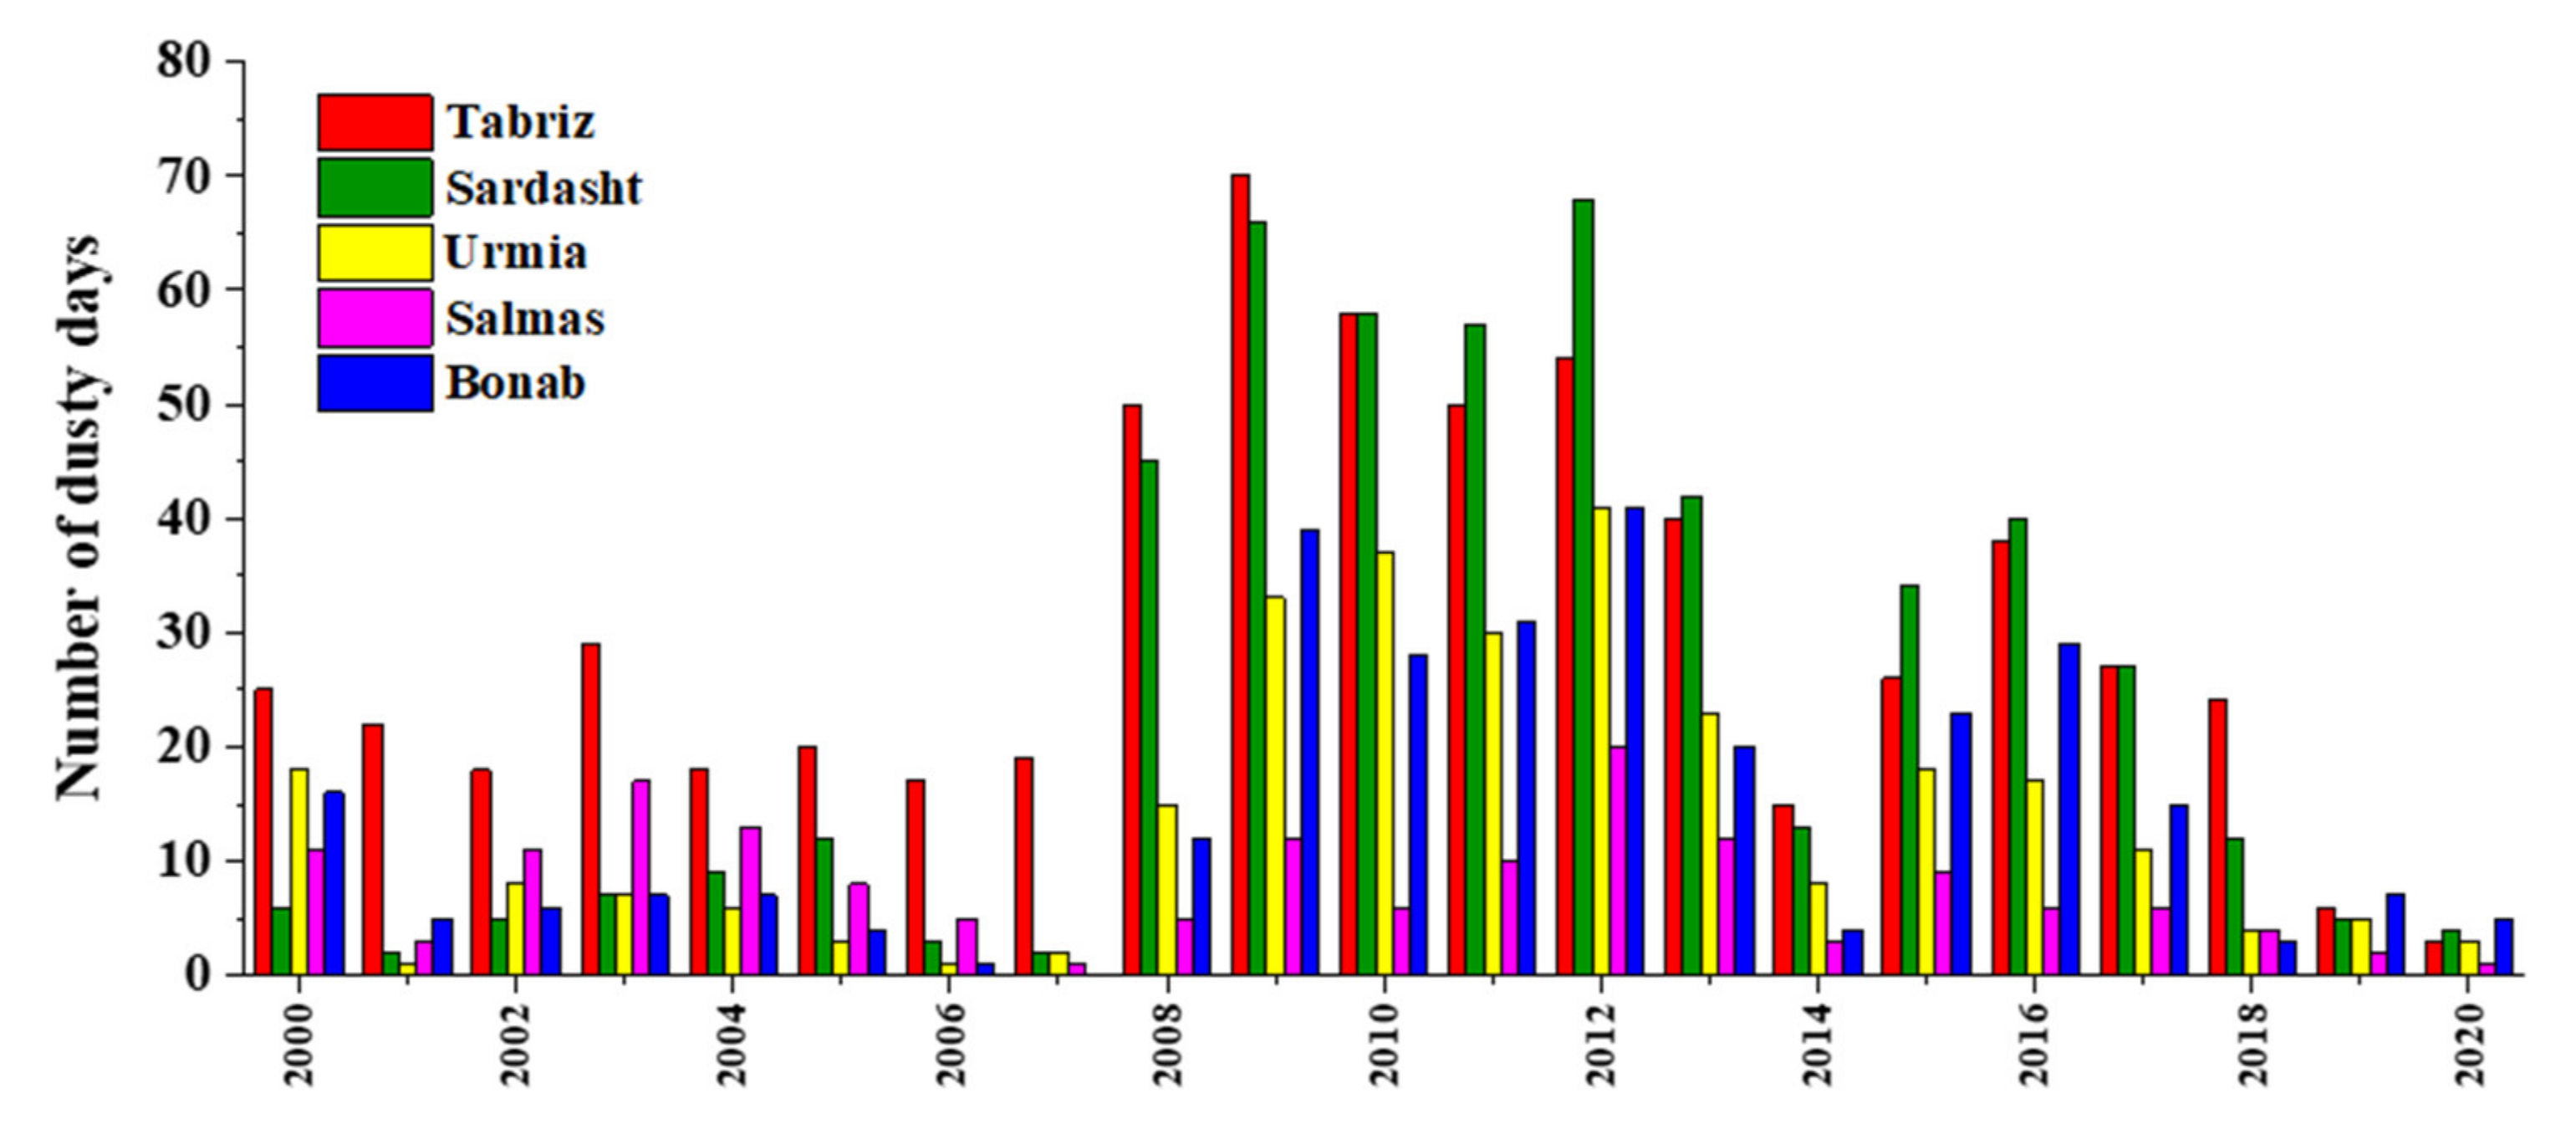
3.1. Evolution of Dust Events at Some Stations around the Urmia Lake

The monthly distribution of the total number of the dusty days at Urmia and Tabriz weather stations near Urmia Lake from 2000 to 2020 is presented in Figure 4a,b. The dusty days at the stations located in the center of East and West Azerbaijan in NW Iran were identified by WMO meteorological codes [64]. The majority of dusty days for both stations were connected with the 06 weather code (nonlocal dust) with most of the dusty days occurring in May, June, and July. The overall number of dusty days for all the dust codes was lower for November to February than in the remaining months throughout the study period under consideration.
The driving force for wind is the pressure gradient force. Local and regional winds are caused by thermal forcing (the temperature and density differences of air) and gravity, respectively. Due to the land use and topographic features of the study area, in the absence of large-scale pressure gradients or circulations accompanied by deep cumulus clouds, local winds are predominant in the area. Local winds have low speeds and prevail in the region most of the year, and, due to their low speed, it is not possible to create dust in these winds. Accordingly, the direction of winds with a speed equal to or greater than 5 m·s−1 is depicted in a wind rose diagram (Figure 4c,d). The wind roses of Urmia and Tabriz stations depict the frequency of occurrence of winds of more than 5 m·s−1 in each of the specified wind direction sectors and wind speed classes for the 2000–2020 period. The prevailing winds at the two stations were southwesterly. The frequency distribution of winds with a speed of less than 5 m·s−1 in Urmia and Tabriz was 96.75% and 90.25%, respectively. Although Urmia is 20 km away from the lake, Tabriz’s megacity is more affected by the Urmia Lake dust storms because of the prevailing wind direction [44].
The monthly number of dusty days at the Tabriz weather station was significantly higher than that at the Urmia weather station in the vast majority of months throughout the study period, especially 2009–2013 (see Figure 5a). The proportion of days with weather code 06 (“nonlocal dust”) for the Urmia weather station was 92%, almost 20% higher than at the Tabriz weather station (73%). At the same time, the monthly total number of dusty days with both codes, 06 and 07 (“local dust”), in 2000–2020 at the Tabriz weather station was 2.2 times higher than at the Urmia weather station. The high correlation coefficient between the time series, 0.84 (significant at p < 0.01), despite the relatively large distance (about 120 km) between the weather stations, as well as the dominance of the 06 weather code in the data from both weather stations, indicates that dusty days are associated with intrusions into the Urmia Lake region of large-scale dusty air masses that cover both weather stations with a short time interval.
Since southwestern winds dominate near the Urmia Lake [44,60] (Figure 4c,d), it can be assumed that the increased monthly number of dusty days at the Tabriz weather station is associated with a local source of dust between the stations, i.e., with the drying surface of the Urmia Lake. At the same time, the monthly visibilities at these weather stations differ slightly (see Figure 5b). This may indicate that, on average, the contribution of the Urmia Lake to the air dust content near the Tabriz weather station is close to the contribution of long-range aerosol transport to the air dust content. The relatively low correlation coefficient between the visibility at Urmia and the visibility at Tabriz weather stations, 0.41 (p < 0.01), may indicate significant variability in the contribution of the drying surface of the Urmia Lake to reduced visibility at the weather station of Tabriz.
Figure 6 depicts the total number of dusty days for all five weather stations near Urmia Lake from 2000 to 2020. The dust had its highest yearly frequency in the west and southwest of Iran from 2008 to 2013 [65,66]. This is also the time of a well-known drought in Iraq (Mesopotamia plains) and Syria [67], which resulted in a significant rise in the number of dust storms across Iraq, southwest Iran, Kuwait, and northeast Saudi Arabia [61,62]. Dust from Iraq and Syria also impacted NW Iran [44], but the primary cause of dust storms in this area was the desiccated lake bed of Urmia Lake [43]. In other studies [61,65], dust frequency was investigated in six stations around Urmia Lake from 2001 to 2016, and 2009–2012 was introduced as the dustiest period in the 17 year duration. This duration is a coincidence of the severe drought in Iraq and Syria [60]. A severe long drought was also reported in 2007 and 2008 in the Middle East [61], as well as for different parts of Iran [60]. Tabari et al. [67] investigated droughts in 35 years in NW Iran, and the greatest droughts happened in 1997–1998 and 2008–2009.

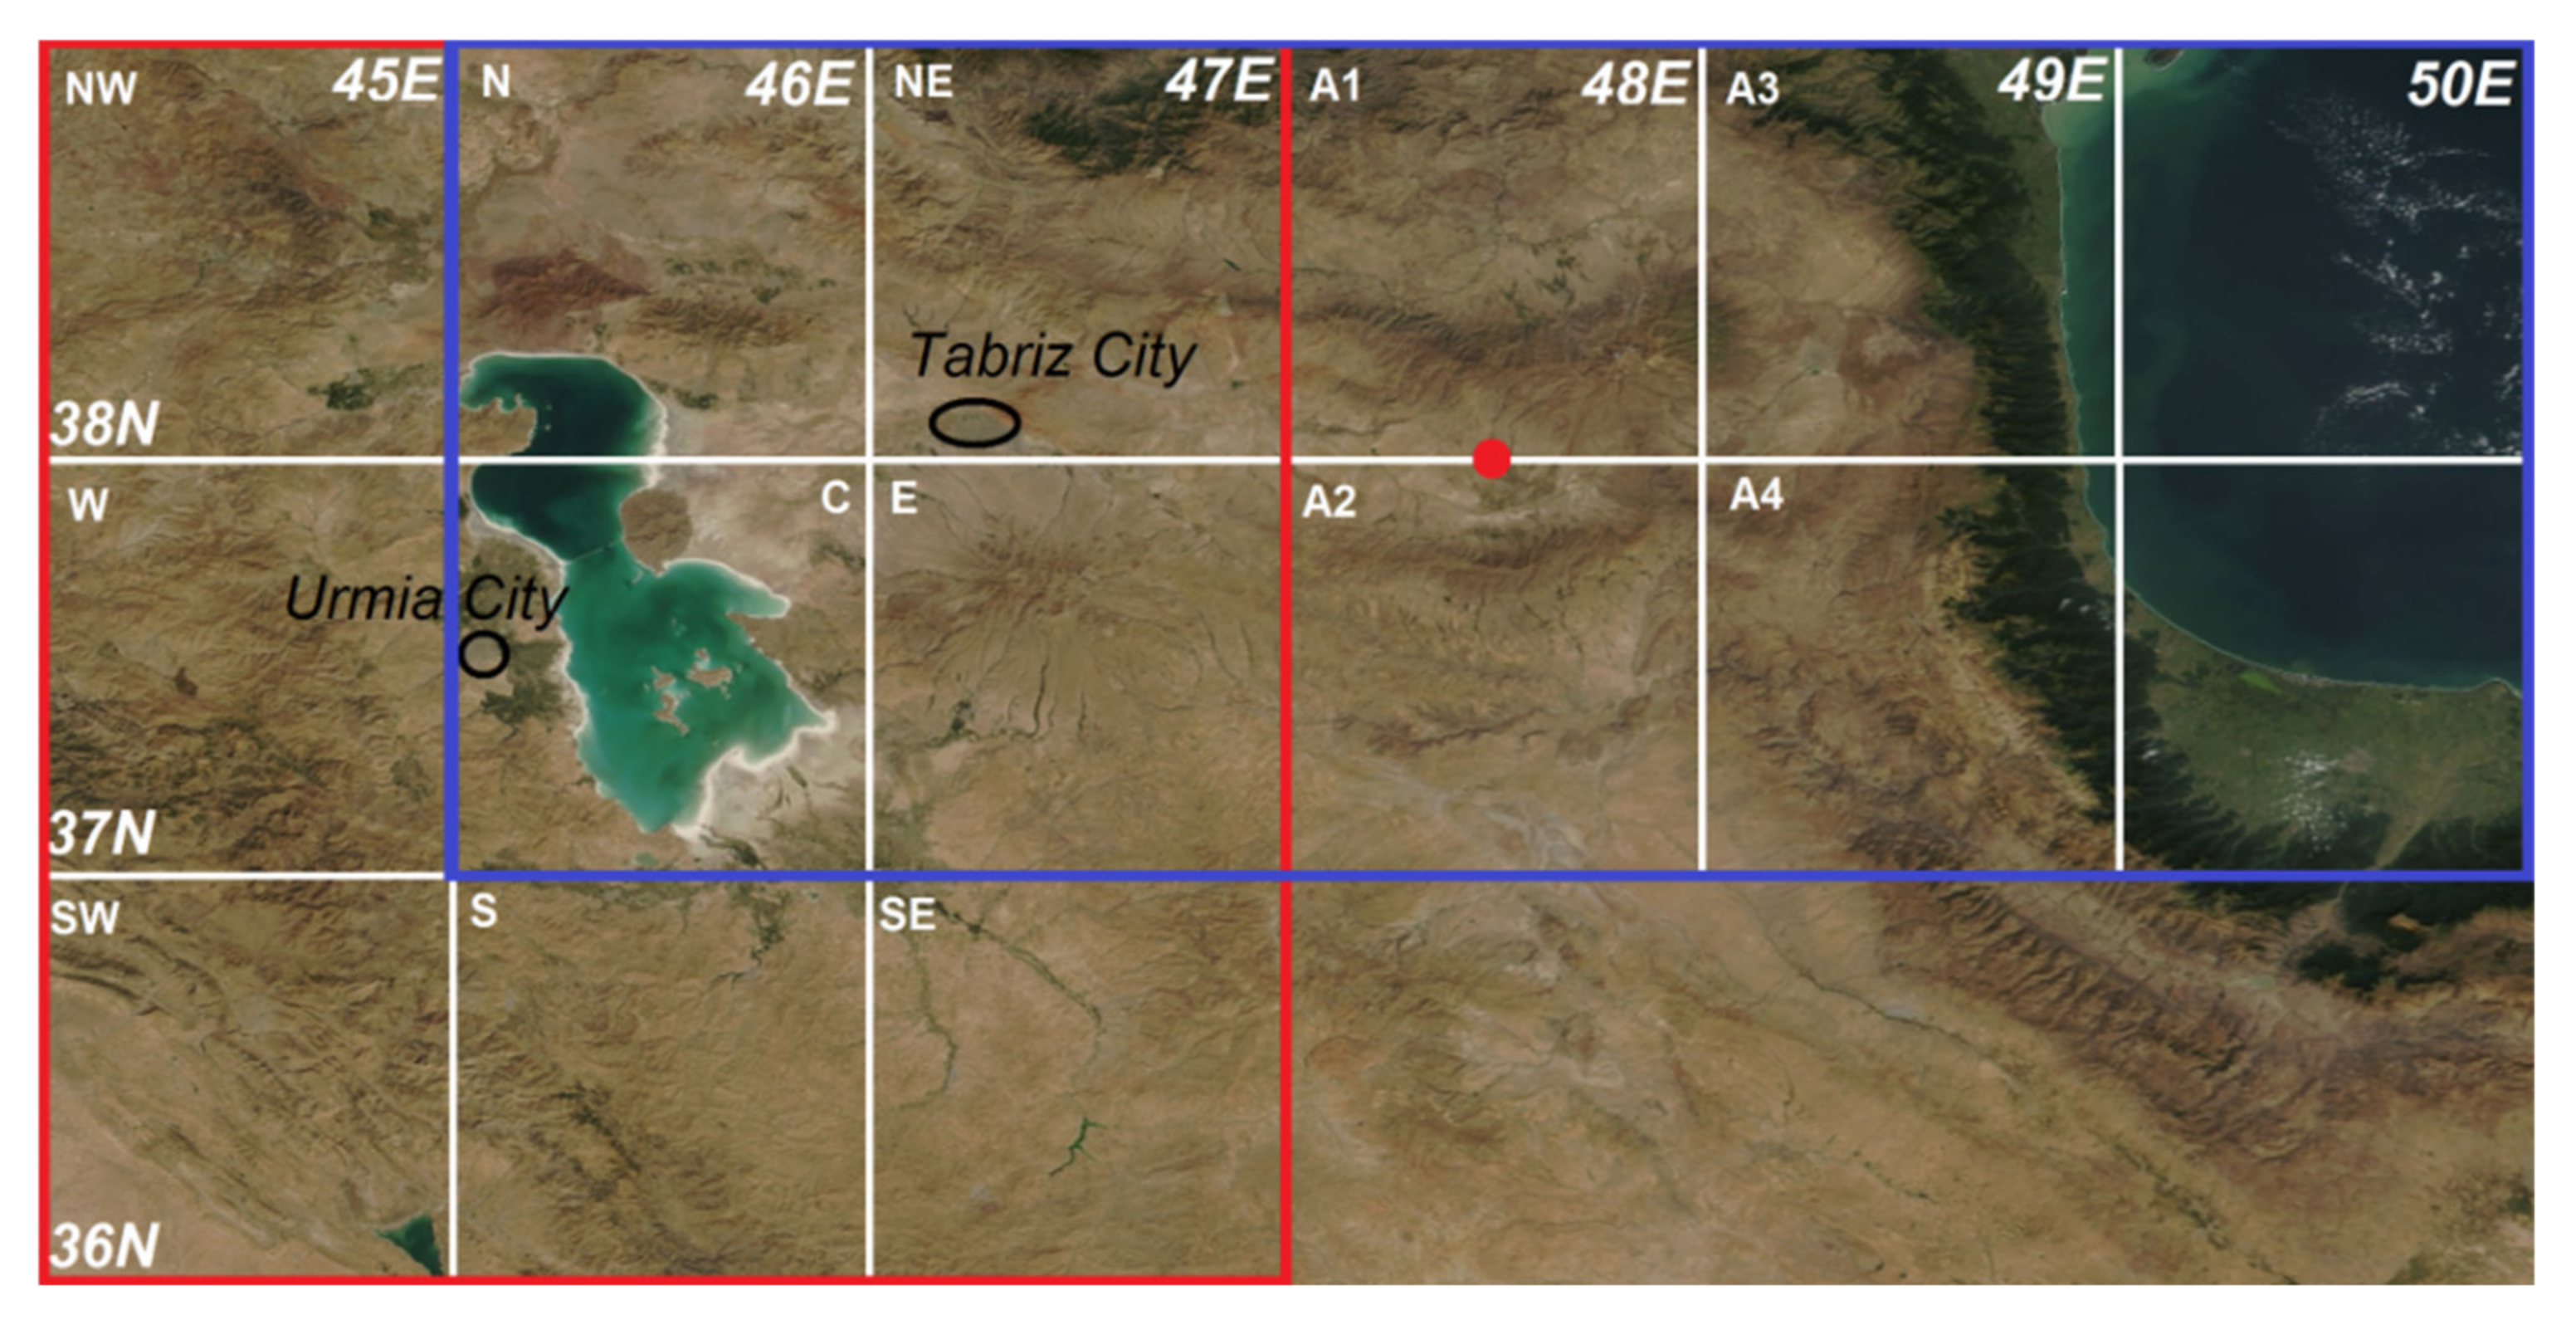
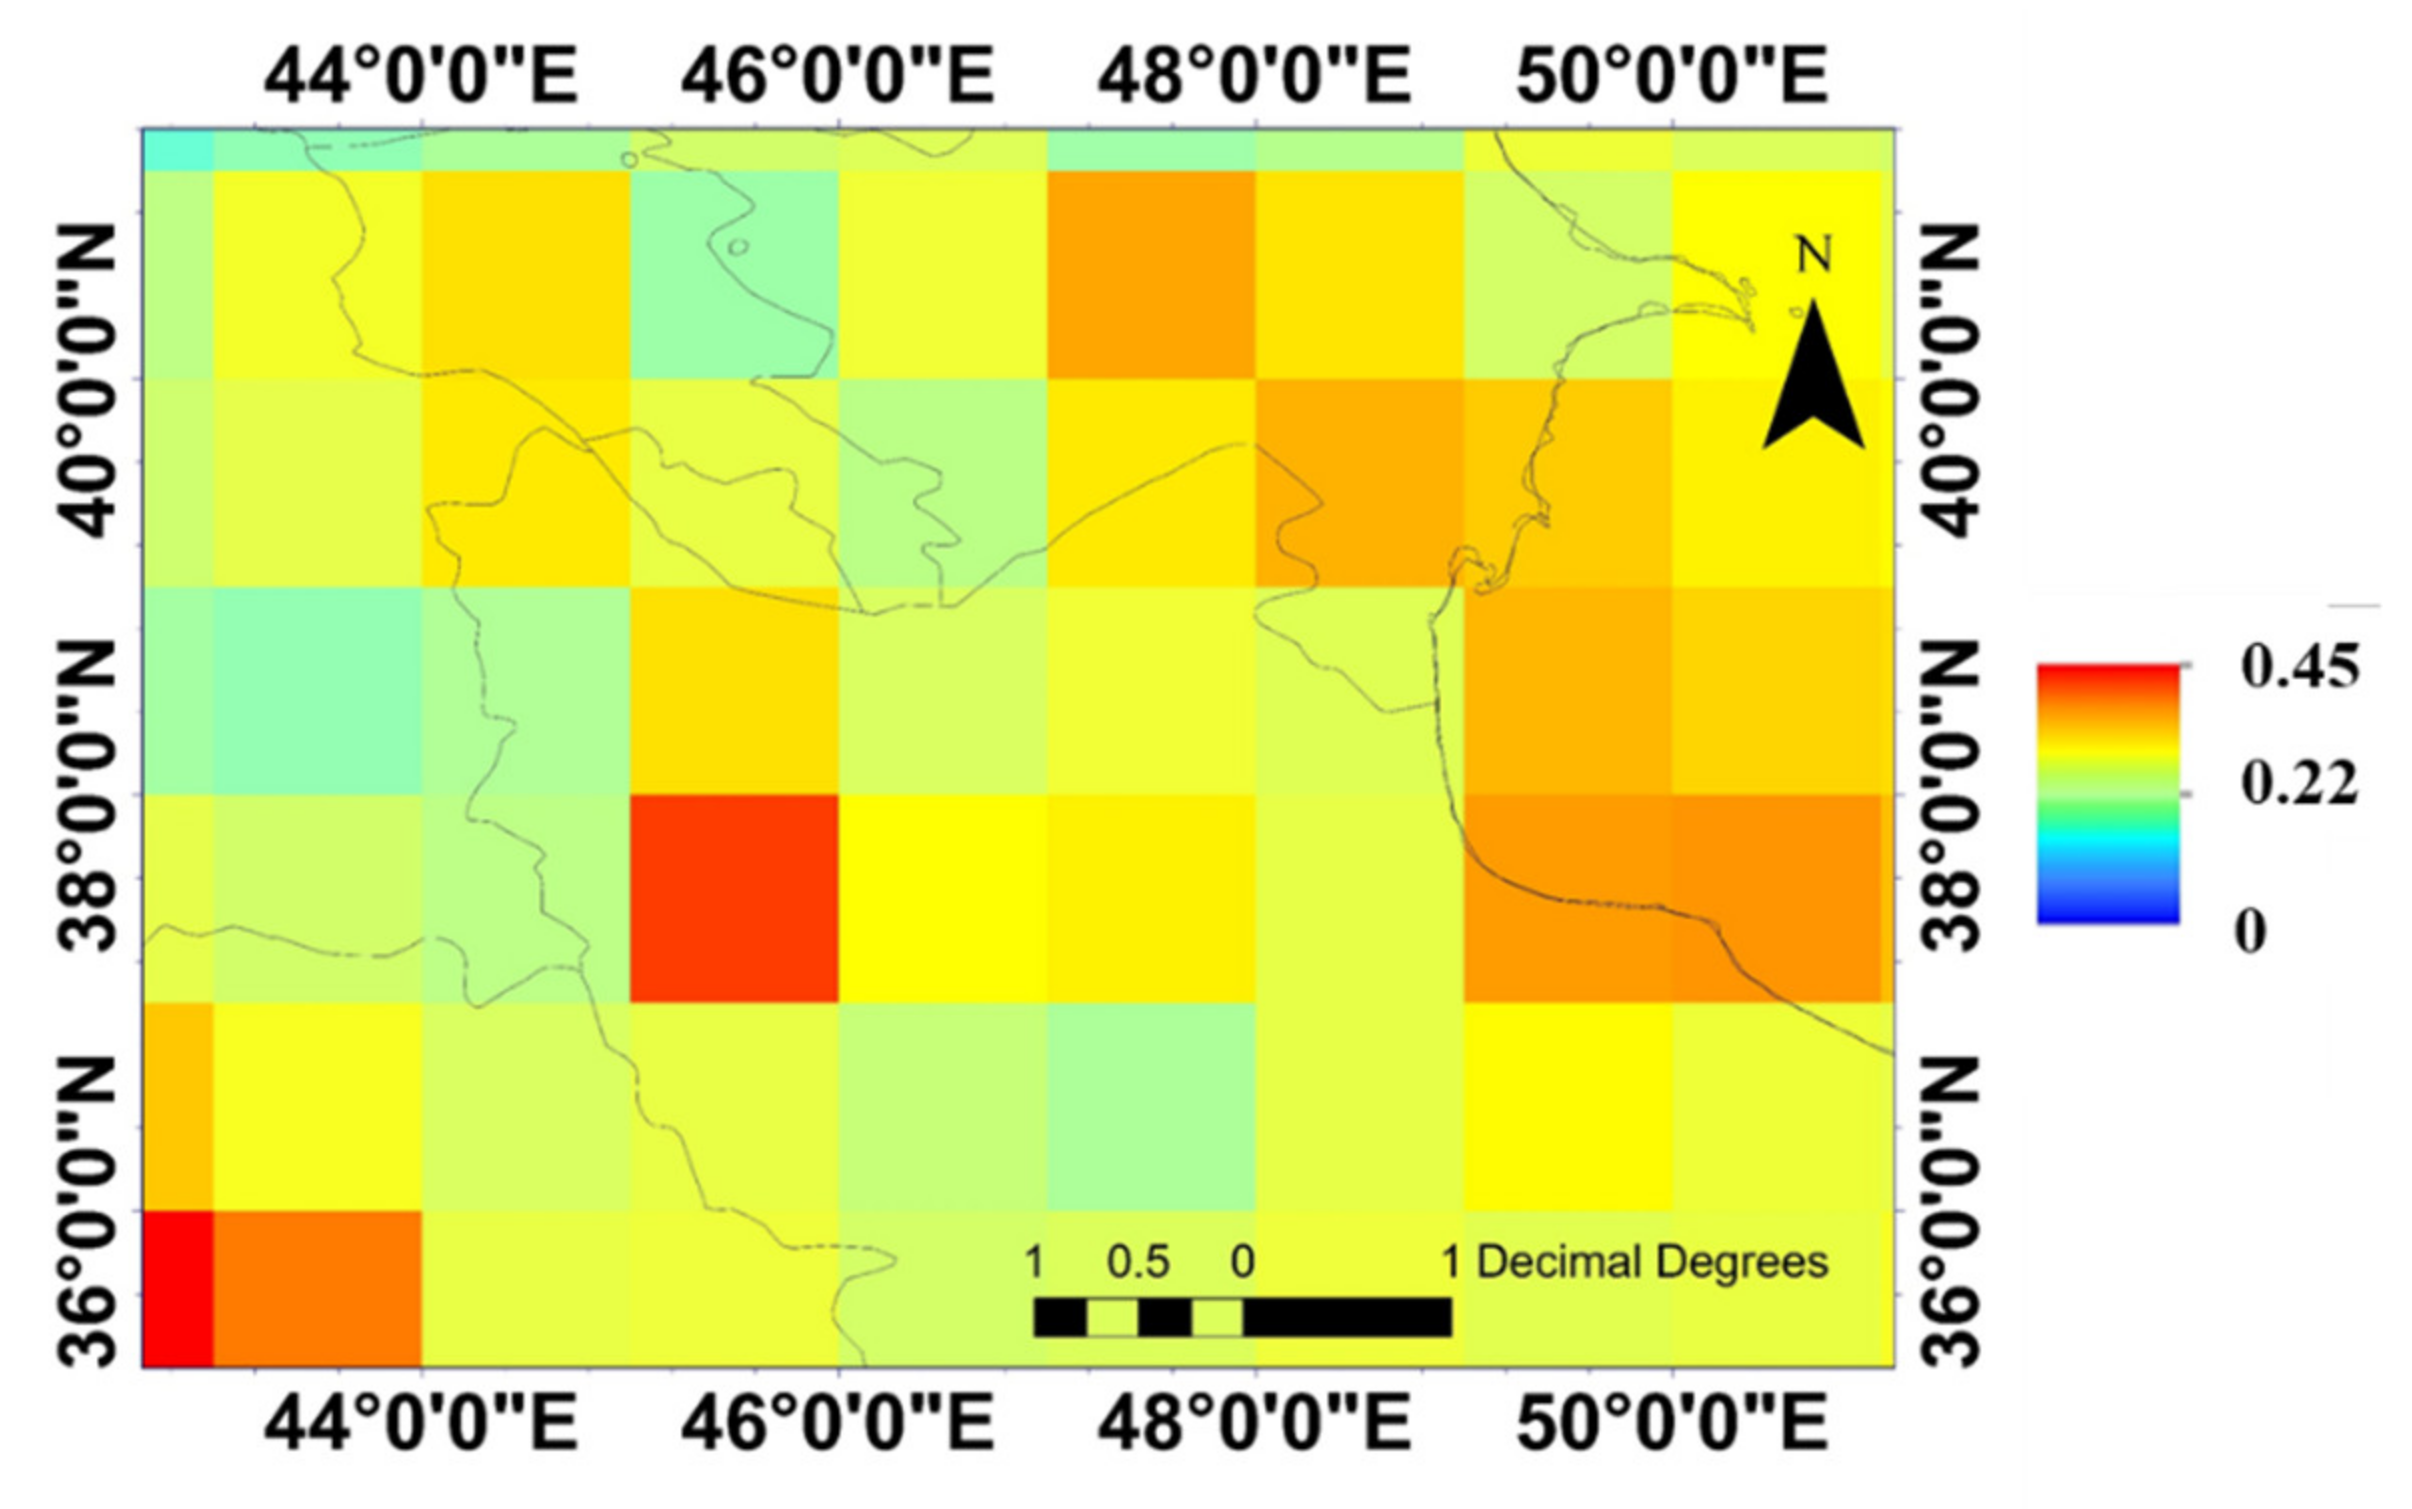
3.2. Spatial Distribution of MODIS Mean AOD from Aqua Satellite Data

Figure 7 shows the mean AOD 550 nm of MODIS/Aqua from 2000 to 2021. Furthermore, we used monthly data with a resolution of 1° × 1° (111 km × 87 km; latitude × longitude) during 2000–2021. The mean AOD over Lake Urmia was greater than 0.45 especially in the southern region, indicating that the increase in dust led to significant aerosol loading over the Urmia Lake. It is obvious that the saline dust storms mostly originated from the southern parts, due to its lower depth in comparison with the northern parts (see Figure 1). Although air pollution and water vapor affect aerosol optical depth (AOD is also high over the Caspian Sea), only the southern part of Urmia Lake had an AOD 550 nm above 0.4 in the 22 year duration, revealing the high concentration of dust in NW Iran.

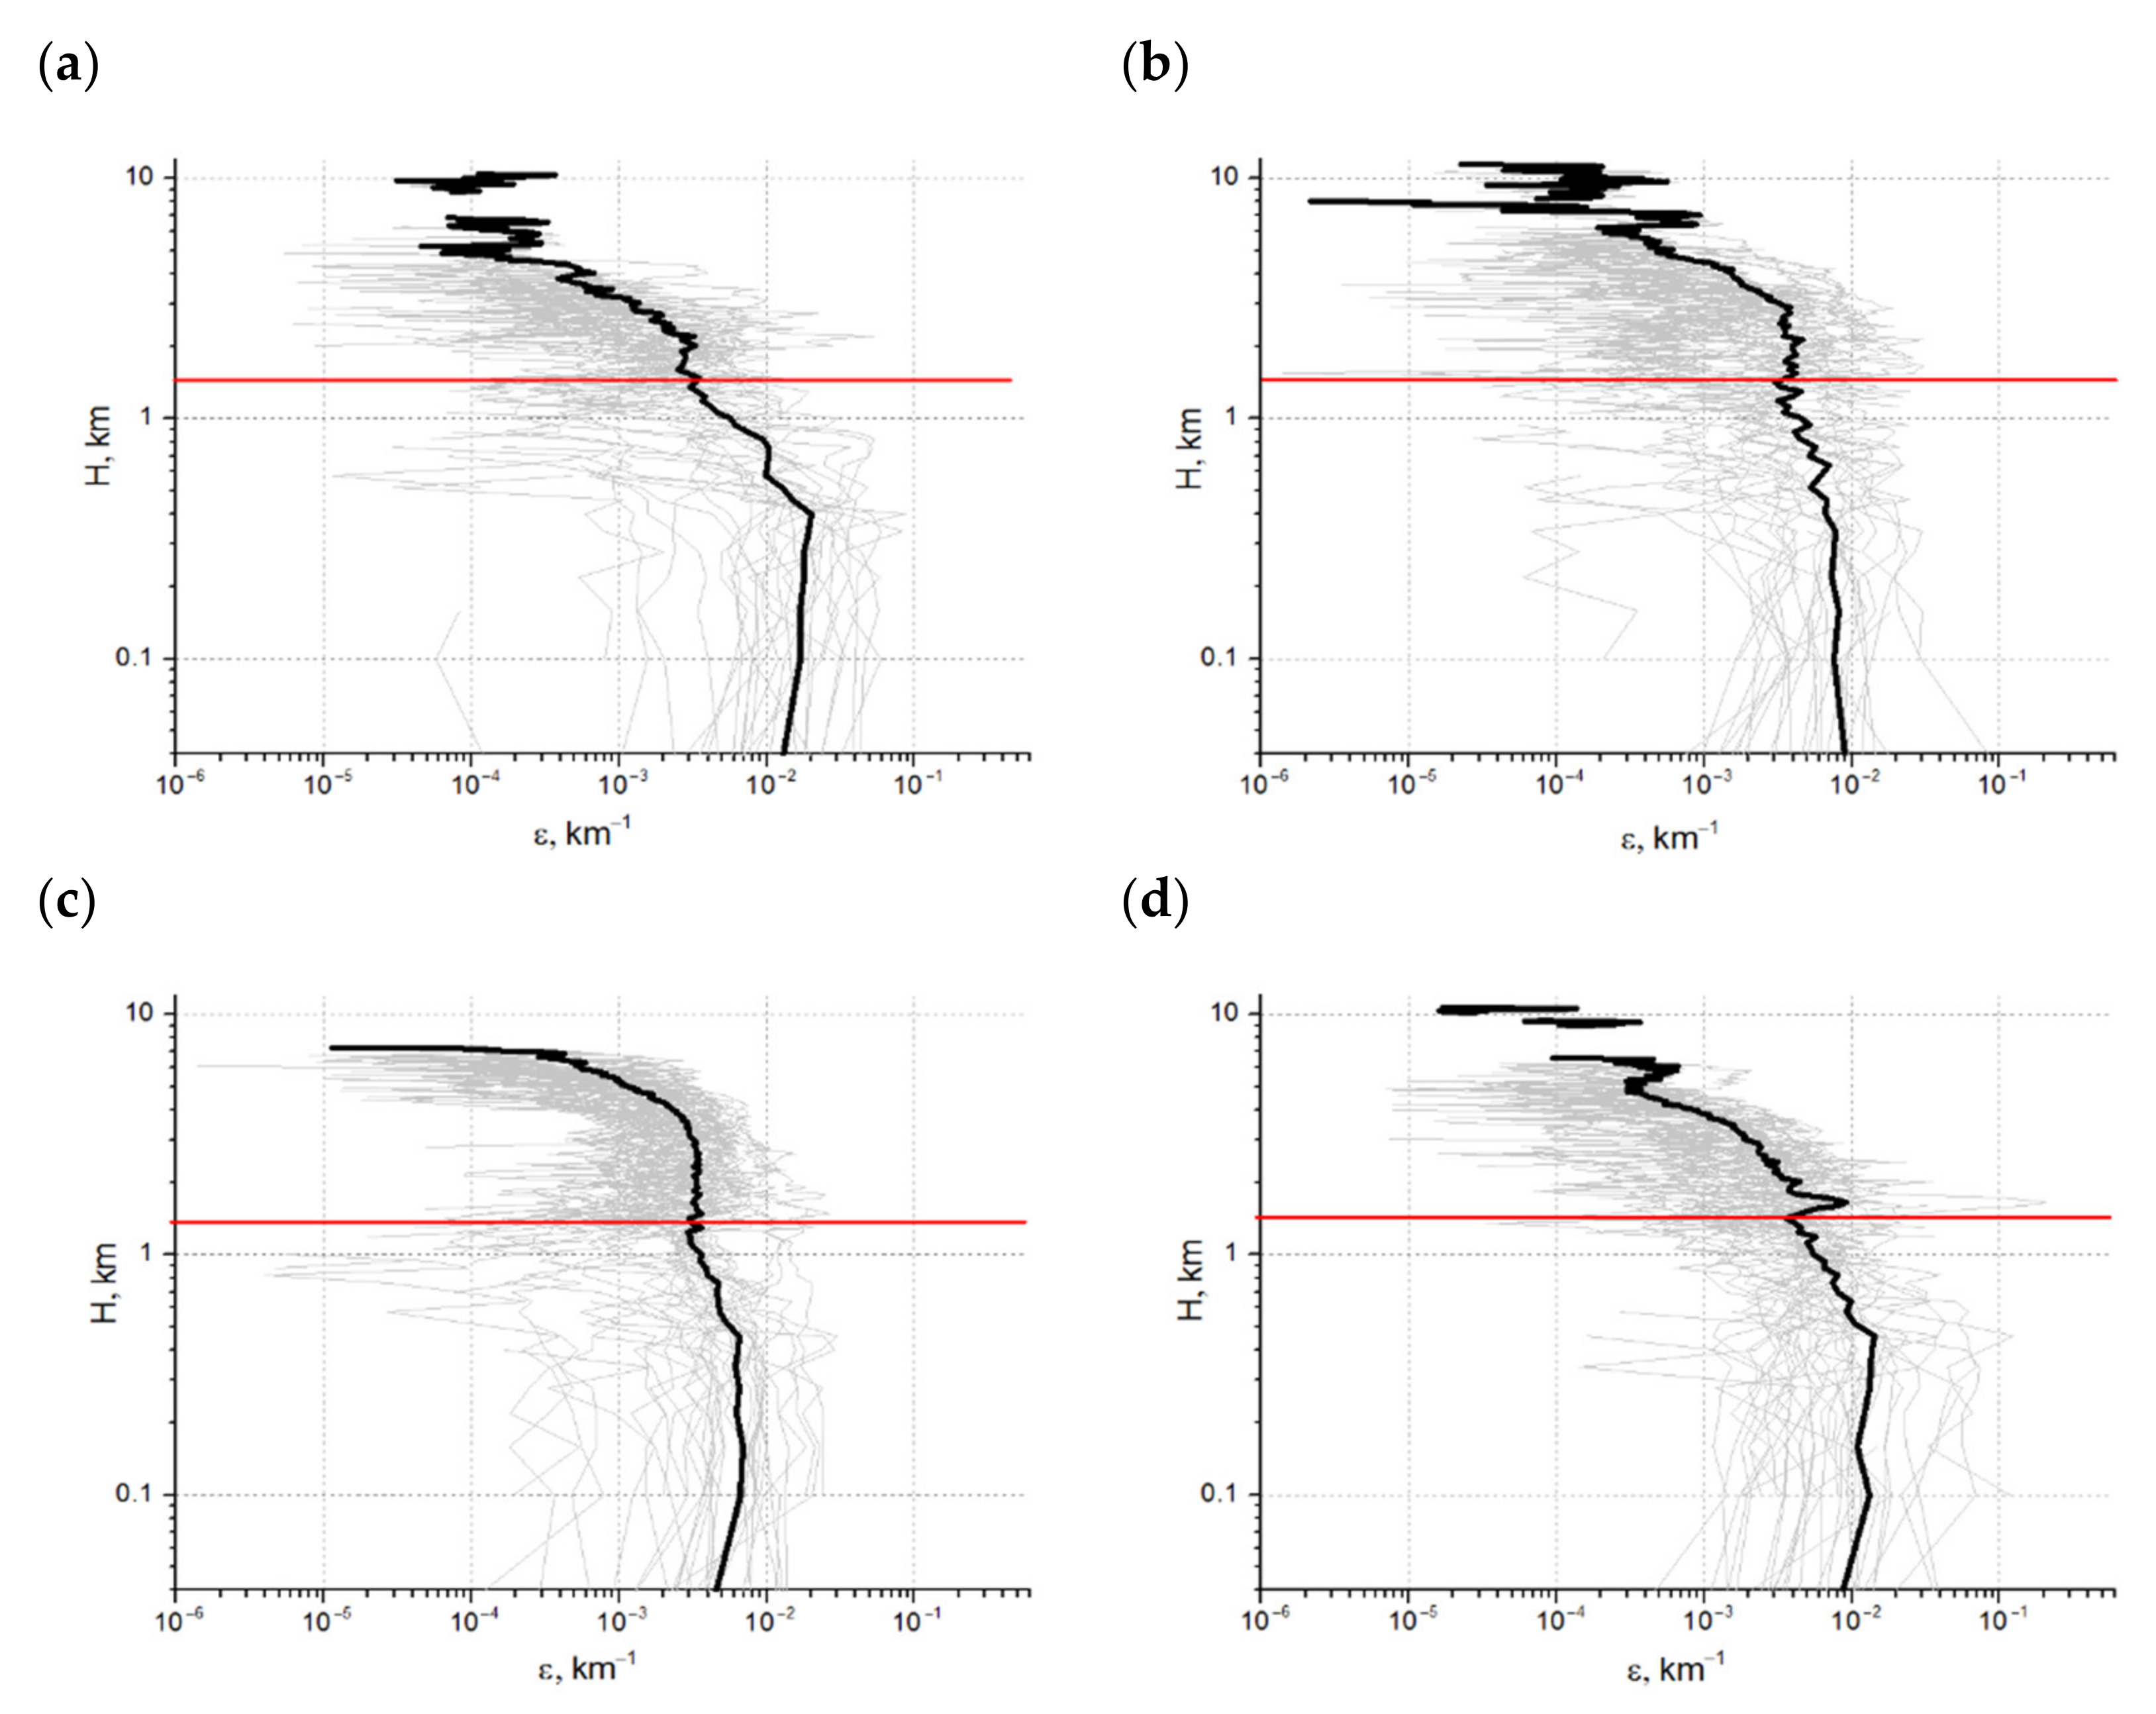
3.3. Tropospheric Aerosol Extinction Coefficient Profiles from CALIPSO Satellite Data

Figure 8a–d show the vertical tropospheric profiles of the total aerosol extinction coefficient, ε (km−1), according to LiDAR sounding data from the CALIPSO satellite in 2006–2021. Thin gray lines are average monthly profiles, while bold curves are average seasonal profiles for winter (December–January–February; Figure 8a), spring (March–April–May; Figure 8b), summer (June–July–August; Figure 8c), and autumn (September–October–November; Figure 8d) for the entire period of 2006–2021. Each average seasonal profile was obtained from 48 average monthly profiles obtained from about 6–7 daily profiles.
The red horizontal lines mark the average altitude (1.5 km a.s.l.) in the region; therefore, the extinction values of the total aerosol below this level were not taken into account in this work. Note that the sections of the profiles below 1.5 km a.s.l. belonged to the low-altitude marine and coastal areas of the cell 37–39°N, 45–50°E (see Figure 3). Since these low-altitude areas occupied about one-third of this cell, the profile sections below 1.5 km a.s.l. were obtained from about one-third (~16) of the monthly average profiles, in contrast to the profile sections above 1.5 km a.s.l., which were obtained from all 48 profiles. As can be seen from Figure 7, the largest contribution to the aerosol content above 1.5 km a.s.l. fell in the altitude range of 1.5–3 km a.s.l. (in winter), 1.5–4 km a.s.l. (in spring), 1.5–5 km a.s.l. (in summer), and 1.5–3 km a.s.l. (in autumn).

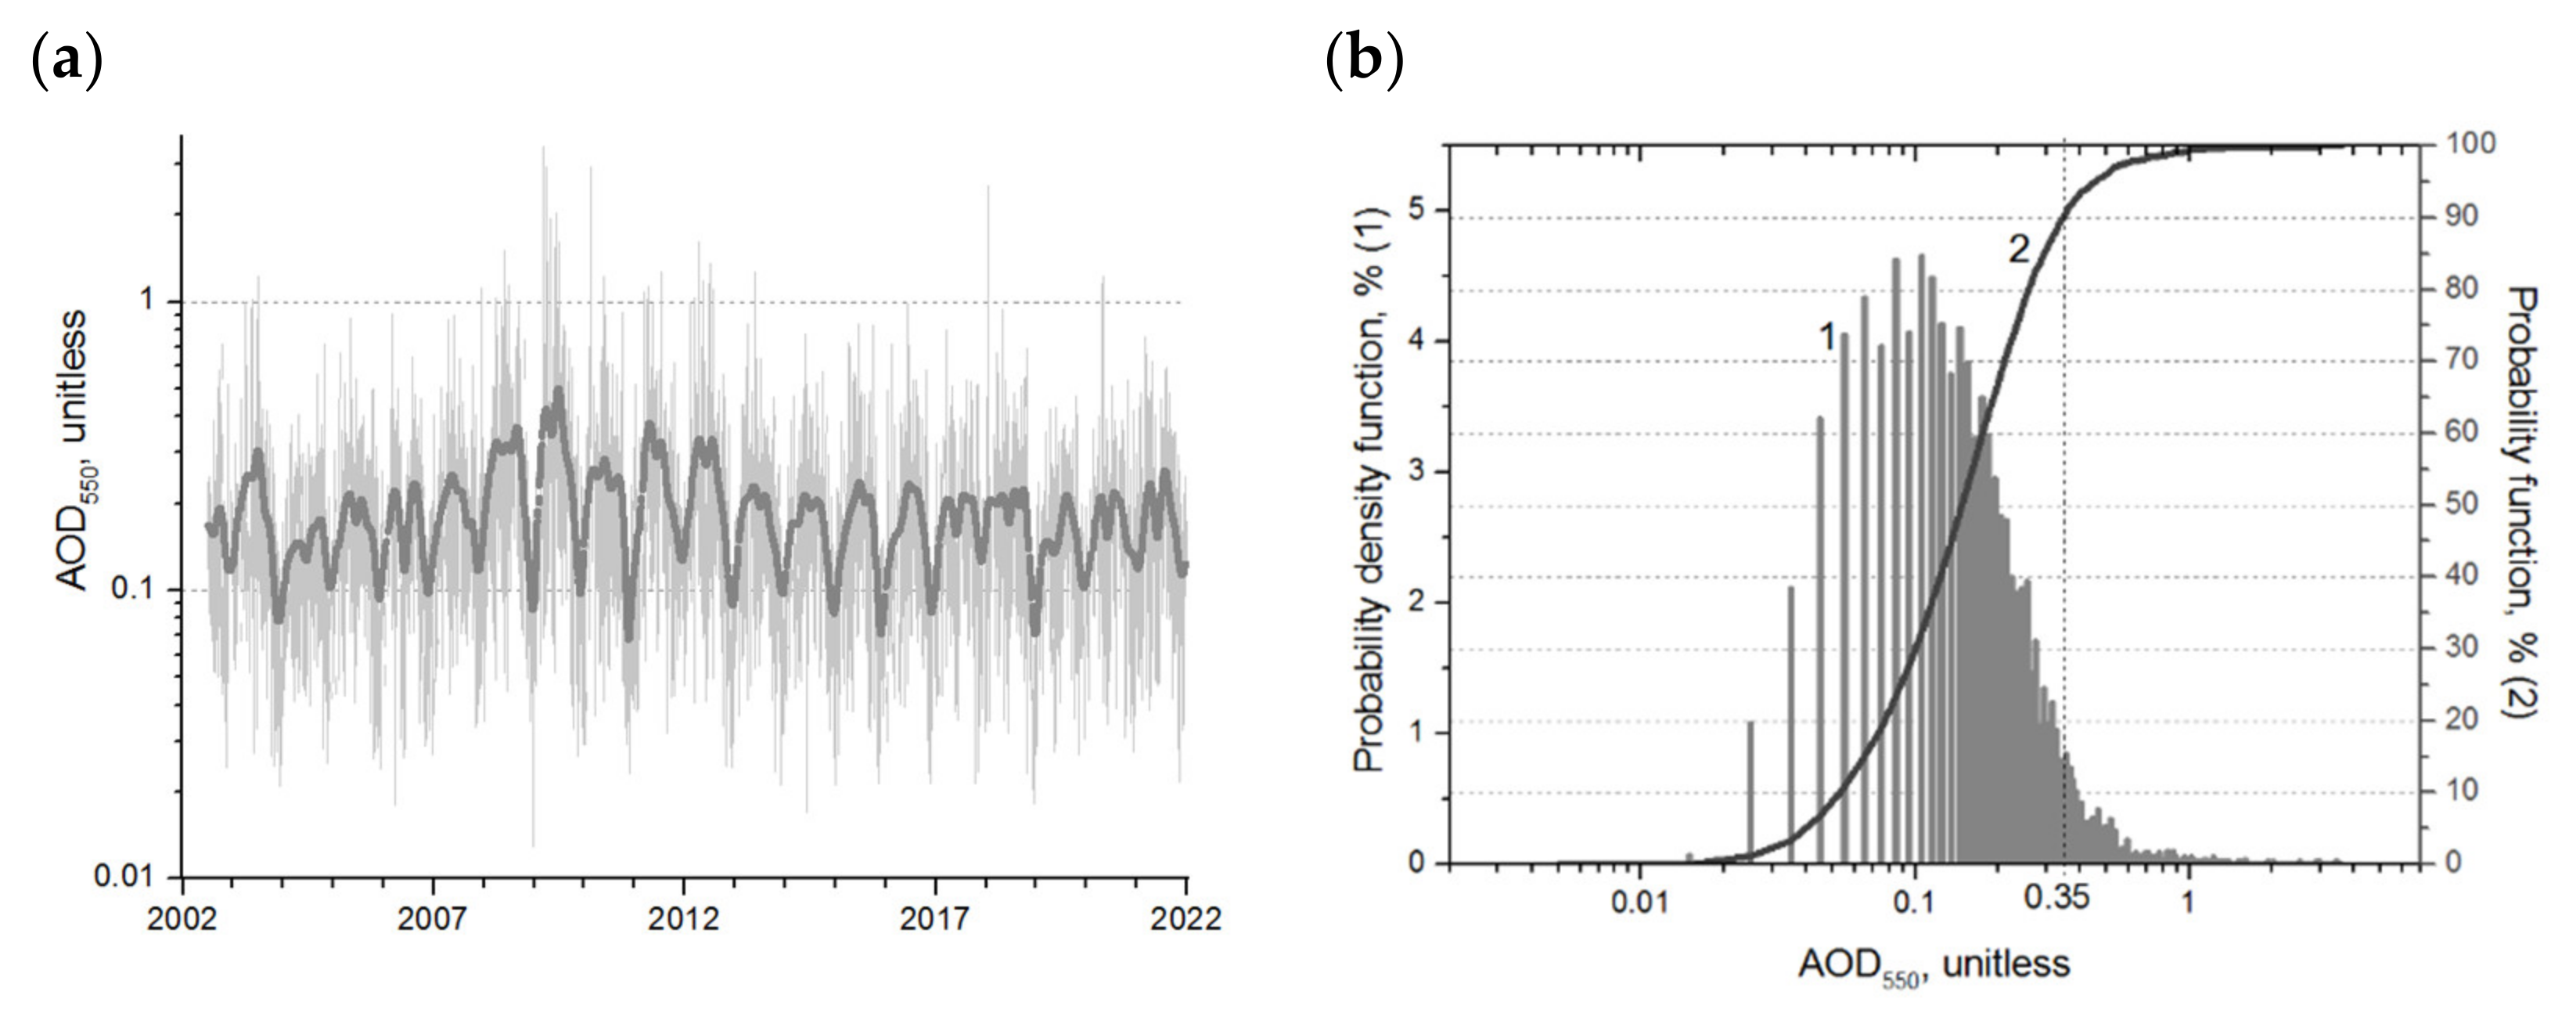
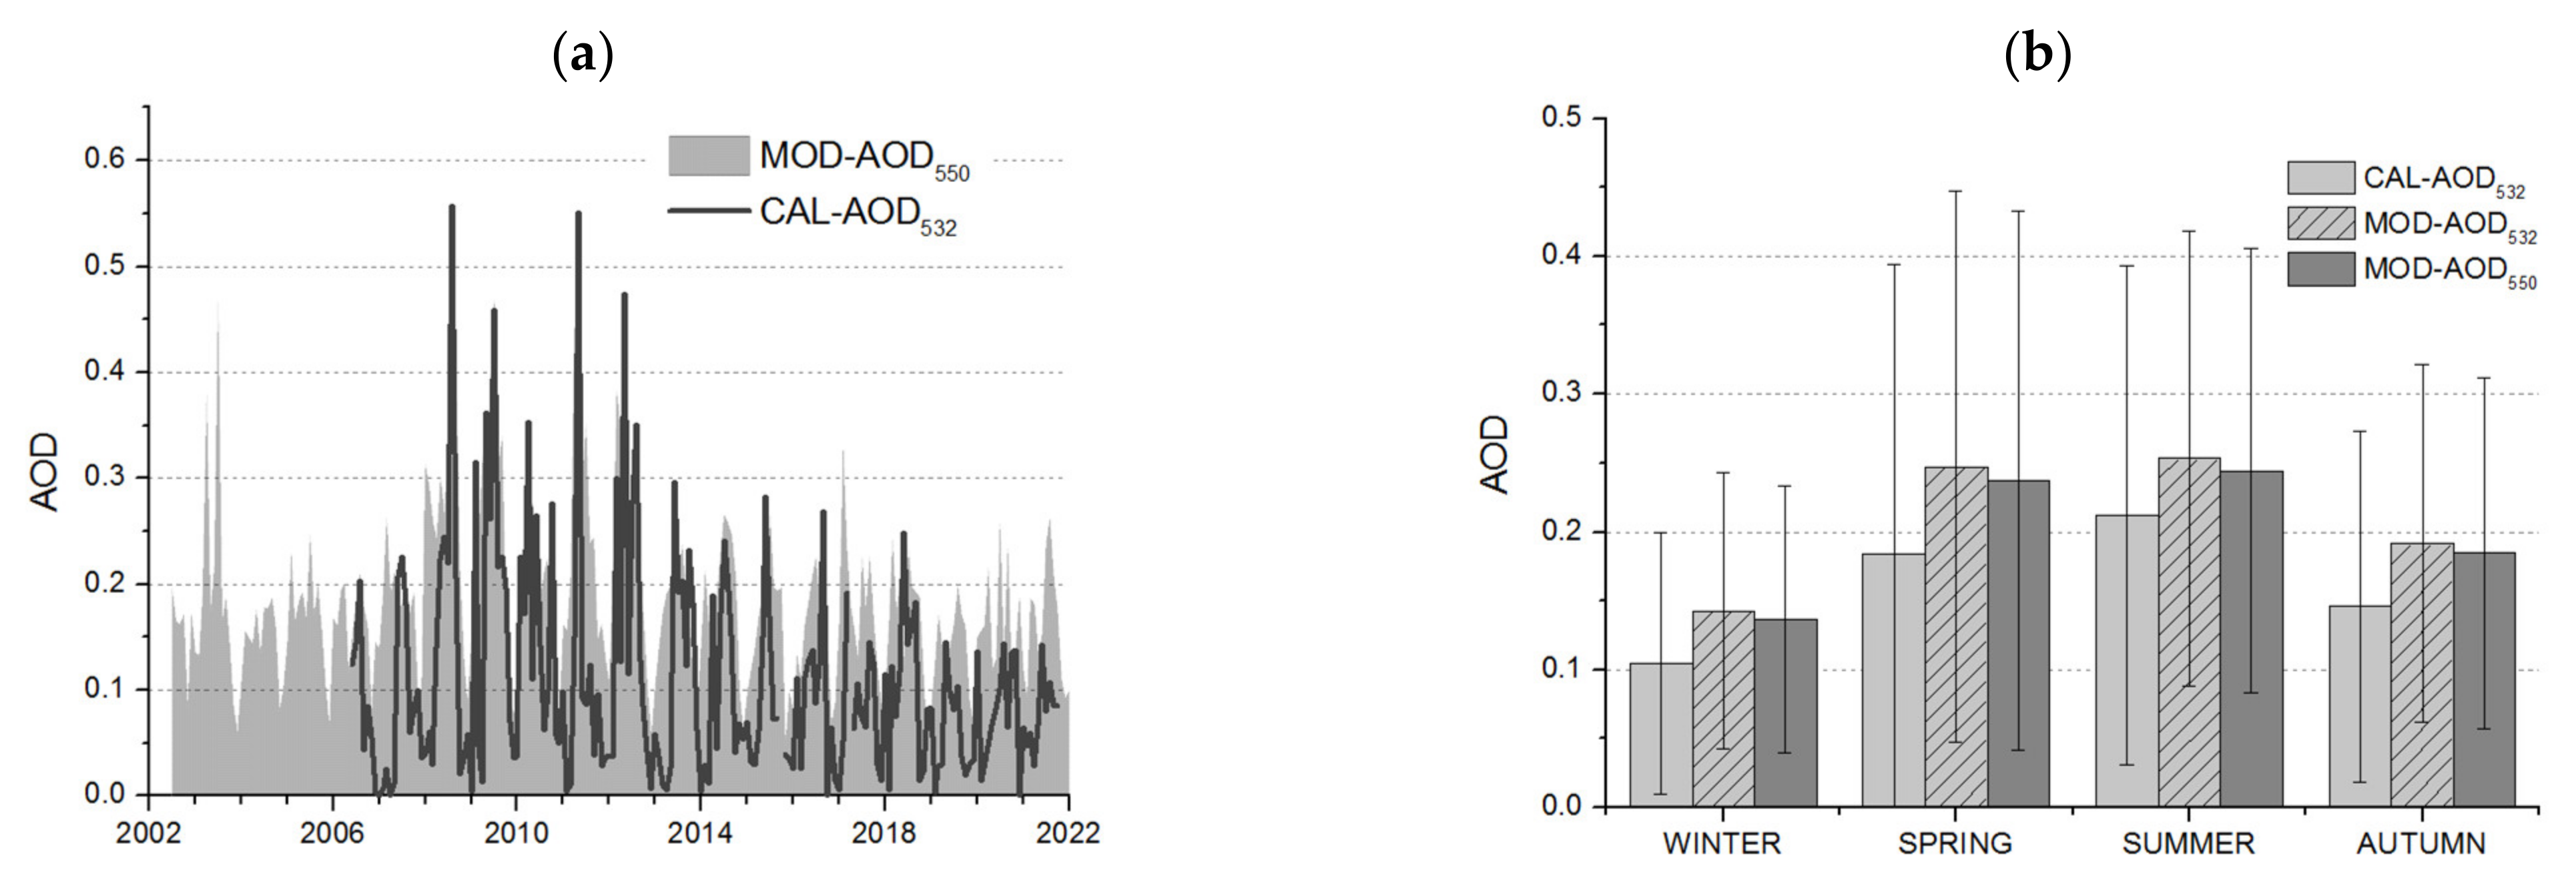
3.4. Variation of Aerosol Optical Depth in the Urmia Lake Region in 2000–2021

Figure 9a shows the Aqua MODIS Deep Blue daily AOD550 variations averaged across the seven cells near the Urmia Lake (see Figure 3). AOD550 is related to dust storms and has been used in many studies for investigating dust particles in the atmosphere during dust storms [68,69,70,71,72,73,74,75,76,77,78]. Figure 9a highlights the dry period 2008–2014 with increased AOD550. Such a dry duration was also seen in the other parts of the Middle East in 2009–2013 [79,80,81,82]. Regions with an AOD550 above the regional background value, 0.2, can be sources of dust emissions [83], but in regions with no dusty surfaces, high AOD550 values are due to the transport of dust emitted in other regions [84], possibly not very remote.
Figure 9b shows the probability density function and the probability function of AOD550 over the Urmia Lake region (average over the seven cells). The mean and median values of the AOD550 distribution were 0.15 and 0.17, respectively. The lower limit of the 10% highest AOD550 values, 0.35, is shown. Below, these 10% highest AOD550 values were considered as extreme AOD550 values. Seasonal AOD550 averages and lower limits for the 10% highest seasonal AOD550 are shown in Table 3.
The pairwise correlation coefficient between the series of daily AOD550 over the seven surrounding cells varied in the range of 0.48–0.87 (gray shaded in Table 4) with an average value of 0.7 (all significant). The pairwise correlation coefficients between the AOD550 series of additional cells A1–A4 ranged from 0.69 to 0.87 (red-shaded in Table 4) with a mean value of 0.78. The AOD550 variations were most closely related for adjacent cells, e.g., for E and SE (0.87) and for S and SW (0.82), but worse related for distant cells from each other. However, even for the most spatially distant cells, SW and A3, the correlation coefficient was not lower than 0.42. Pair correlation coefficients for the cells near the Urmia Lake and additional cells A1–A4 were in the range of 0.42–0.84 (green shaded in Table 4) with an average value of 0.61. When removing from the AOD550 series those related to the highest decile of the distribution density function, the correlation coefficient decreased by about 7–11%, i.e., the extreme AOD550 values agreed with the AOD550 series in the area with a length of 6–7° in longitude and 2–3° in latitude. When five senior deciles were removed, the correlation coefficients decreased by 30–40%. This may indicate that dust storms that increase AOD550 above the average affect the entire region simultaneously. Thus, the high correlation of cells belonging to the partially overlapping regions 46–50°N, 37–39°E (CALIOP lidar) and 36–39°N, 44–47°E (MODIS device) confirms the correctness of the comparison and conjugate analysis of Aqua and CALIPSO data related to the Urmia Lake region.
Thus, we can conclude that the AOD550 of the seven cells was determined by the contribution of aerosol from distant sources. As can be seen from Figure 5a and Figure 7a, there was some similarity between the curves of the monthly number of dusty days at the Urmia and Tabriz weather stations and the monthly AOD550 averaged over the seven cells. The correlation coefficient between the monthly AOD550 variations averaged over the seven cells and the frequency of the total monthly number of dusty days at Urmia and Tabriz weather stations was 0.64 and 0.59, respectively (all significant).

3.5. Comparison of AOD According to CALIPSO and Aqua Data

Figure 10a shows the average over six cells in the region 46–49°N, 37–39°E of the variation of the monthly mean AOD550 according to MODIS data (MOD-AOD550), as well as the variation of the mean monthly tropospheric AOD532 in the altitude range of 1.5–12 km a.s.l. (see above) in the area of 37–39°N, 45–50°E according to CALIPSO satellite data (CAL-AOD532). The correlation between the variations was 0.5 (p = 0.05); taking into account the difference in wavelengths, the AOD values were well matched in terms of level. It can be seen that in the period 2009–2014, AODs were better correlated than in 2015–2021 (correlation coefficients are 0.53 and 0.3, respectively at p < 0.05). Figure 10b shows CAL-AOD532 and MOD-AOD550 seasonal averages for 2006–2021, as well as MOD-AOD532 seasonal averages for 2006–2021 reconstructed from daily MOD-AOD550 and Aqua MODIS Ångström exponent data (see Section 2.2.3).
As can be seen from Figure 9b, the seasonal averages of CAL-AOD532 and MOD-AOD532 were in good agreement; the spread between them ranged from ~18% (summer) to ~28% (winter). In general, in the warm (spring–summer) season, CAL-AOD532 and MOD-AOD532 were better matched than in the cold (autumn–winter) season, which requires explanation.

4. Conclusions

Mineral dust has the largest fraction of atmospheric aerosols by mass, and it plays an important role in the Earth’s atmosphere systems [84]. Furthermore, dust particles affect atmospheric parameters such as radiation by absorbing and scattering shortwave and longwave radiations [83,84,85,86], cloud optical properties [86], and air temperature [87]. Land and atmospheric factors such as precipitation, wind direction, soil type, and vegetation cover directly cause rising dust particles and transport to other areas [64,88,89,90,91].
This study firstly analyzed the monthly and annual frequency of dusty days at some weather stations around Urmia Lake for 21 years (2000–2021). The proportion of days with weather code 06 (“nonlocal dust”) for the Urmia weather station was 92%, almost 20% higher than at the Tabriz weather station (73%), while the monthly total number of dusty days with codes 06 and 07 (“local dust”) in 2000–2020 at the Tabriz weather station was 2.2 times higher than at the Urmia weather station. The high correlation coefficient between the series, 0.84 (significant at p < 0.01), despite the significant distance (about 120 km) between the weather stations, as well as the dominance of the 06 weather code in the data from both weather stations, indicates that dusty days are associated with intrusions into the Urmia Lake region of large-scale dusty air masses that cover both weather stations with a short time interval. Since southwestern winds dominate near the Urmia Lake, it can be assumed that the increased frequency of the number of dusty days at the Tabriz weather station is associated with a local source of dust between the stations, i.e., with the drying surface of the Urmia Lake. A slight difference in the monthly visibilities at these weather stations may indicate that, on average, the contribution of the Urmia Lake to the air dust content near the Tabriz weather station is close to the contribution of long-range aerosol transport to the air dust content. The low correlation coefficient between the visibilities at Urmia and Tabriz weather stations, 0.41 (p < 0.01), may indicate significant variability in the contribution of the drying bottom of the Urmia Lake to reduced visibility at the weather station of Tabriz.
Analysis of monthly averaged profiles of tropospheric total aerosol extinction coefficient at 532 nm by CALIPSO satellite data in 2006–2021 showed that the largest contribution to the aerosol content above 1.5 km a.s.l. (mean altitude in the Urmia Lake region) fell in the altitude range of 1.5–3 km a.s.l. (in winter), 1.5–4 km a.s.l. (in spring), 1.5–5 km a.s.l. (in summer), and 1.5–3 km a.s.l. (in autumn).
Variations in the monthly average aerosol optical depth at a wavelength of 550 nm (AOD550) according to satellite sounding (Aqua MODIS) data for 1° × 1° cells surrounding the dusting surface of the Urmia Lake and an additional area of 37–39°N, 46–49°E were analyzed. It was seen that the daily AOD550 for the cells surrounding the Urmia Lake varied consistently throughout the study period. Pairwise correlation coefficients for the cells near the Urmia Lake and the cells in the additional area ranged from 0.42 to 0.84 with an average value of 0.61. When removing from the AOD550 series those related to the highest decile of the distribution function, the correlation coefficient decreased by about 7–11%, i.e., the extreme AOD550 values agreed with the AOD550 series in an area with a length of 6–7° in longitude and 2–3° in latitude. When five senior deciles were removed, the correlation coefficients decreased by 30–40%. This may indicate that dust storms that increase AOD550 above the average affect the entire region simultaneously. Thus, the high correlation of cells belonging to the partially overlapping regions 46–50°N, 37–39°E (CALIOP lidar) and 36–39°N, 44–47°E (MODIS device) confirmed the correctness of the comparison and conjugate analysis of Aqua and CALIPSO data related to the Urmia Lake region.
Variation of the monthly mean AOD550 according to MODIS data (MOD-AOD550) and the variation of the mean monthly tropospheric AOD532 in the altitude range of 1.5–12 km a.s.l. in the area of 37–39°N, 45–50°E according to CALIPSO satellite data (CAL-AOD532) varied with a correlation coefficient of 0.5 (significant at p = 0.05). Taking into account the difference in wavelengths, the AOD values were well matched in terms of level. In the period 2009–2014, the AODs were better correlated than in 2015–2021 (correlation coefficients of 0.53 and 0.3, respectively, at p < 0.05) due to the possibly larger dominance of distant dust sources in the driest period of 2009–2014 compared with 2015–2021. Seasonal averages of CAL-AOD532 and MOD-AOD532 (reconstructed using Ångström exponent data) were in good agreement; the spread between them ranged from 18% (summer) to 28% (winter). In general, in the warm (spring–summer) season, CAL-AOD532 and MOD-AOD532 were better matched than in the cold (autumn–winter) season, which requires explanation.

Author Contributions

Conceptualization, N.H.H., A.R.S.A. and K.S.; methodology, N.H.H. and K.S.; software, N.H.H., A.R.S.A. and K.S.; validation, A.R.S.A., C.O. and K.S.; formal analysis, N.H.H., A.R.S.A., C.O. and K.S.; resources, N.H.H., A.R.S.A., U.C.D. and K.S.; data curation, N.H.H.; writing—original draft preparation, A.R.S.A.; writing—review and editing, C.O., N.H.H., K.S. and U.C.D.; visualization, N.H.H., A.R.S.A. and K.S.; supervision, C.O. and U.C.D. All authors have read and agreed to the published version of the manuscript.

Funding

The analysis of aerosol optical depth time series for the regions of the Urmia Lake was funded by the Russian Foundation for Basic Research and the Iran National Science Foundation, grant number 20-55-56028. Publication founding acknowledgments: “Open Access funding provided by the Open Acess Publication Fund of Philipps-Universität Marburg with support of the Deutsche Forschungsgemeinschaft (DFG, German Research Foundation).

Data Availability Statement

MODIS AOD datasets are available online at the NASA Giovanni site (https://giovanni.gsfc.nasa.gov/giovanni (accessed on 28 June 2022)). CALIPSO AOD datasets are available online at the NASA Giovanni site (https://www-calipso.larc.nasa.gov (accessed on 24 June 2022)).

Acknowledgments

We are very thankful to NASA for the provision of MODIS AOD retrievals and actual color images. We are thankful for the reported wind direction and dust-related codes from the Iran Meteorological Organization.

Conflicts of Interest

The authors declare no conflict of interest.

References

  1. Tegen, I. Modeling the mineral dust aerosol cycle in the climate system. Quat. Sci. Rev. 2003, 22, 1821–1834. [Google Scholar] [CrossRef]
  2. Yang, B.; Bräuning, A.; Zhang, Z.; Dong, Z.; Esper, J. Dust storm frequency and its relation to climate changes in Northern China during the past 1000 years. Atmos. Environ. 2007, 41, 9288–9299. [Google Scholar] [CrossRef]
  3. An, L.; Che, H.; Xue, M.; Zhang, T.; Wang, H.; Wang, Y.; Zhou, C.; Zhao, H.; Gui, K.; Zheng, Y.; et al. Temporal and spatial variations in sand and dust storm events in East Asia from 2007 to 2016: Relationships with surface conditions and climate change. Sci. Total Environ. 2018, 633, 452–462. [Google Scholar] [CrossRef] [PubMed]
  4. Salehi, S.; Ardalan, A.; Ostadtaghizadeh, A.; Garmaroudi, G.; Zareiyan, A.; Rahimiforoushani, A. Conceptual definition and framework of climate change and dust storm adaptation: A qualitative study. J. Environ. Sci. Health Part A 2019, 17, 797–810. [Google Scholar] [CrossRef] [PubMed]
  5. Schepanski, K. Transport of mineral dust and ist impact on climate. Geosciences 2018, 8, 151. [Google Scholar] [CrossRef]
  6. Paytan, A.; Mackey, K.R.M.; Chen, Y.; Lima, I.D.; Doney, S.C.; Mahowald, N.; Labiosa, R.; Post, A.F. Toxicity of atmospheric aerosols on marine phytoplankton. Proc. Natl. Acad. Sci. USA 2009, 106, 4601–4605. [Google Scholar] [CrossRef] [PubMed]
  7. Bali, K.; Mishra, A.K.; Singh, S.; Chandra, S.; Lehahn, Y. Impact of dust storm on phytoplankton bloom over the Arabian Sea: A case study during March 2012. Environ. Sci. Poll. Res. 2019, 26, 11940–11950. [Google Scholar] [CrossRef] [PubMed]
  8. Gassó, S.; Grassian, V.H.; Miller, R.I. Interaction between mineral dust, climate, and ocean ecosystems. Elements 2010, 6, 247–252. [Google Scholar] [CrossRef]
  9. Kutuzov, S.; Mikhalenko, V.; Toropov, P.; Legrand, M.; Preunkert, S.; Ginot, P.; Shukurov, K.; Poliukhov, A. The Elbrus (Caucasus, Russia) ice core record-Part 2: History of desert dust deposition. Atmos. Chem. Phys. 2019, 19, 14133–14148. [Google Scholar] [CrossRef]
  10. Ghosh, T.; Pal, I. Dust storm and its environmental implications. J. Eng. Comput. Appl. Sci. 2014, 3, 30–37. [Google Scholar]
  11. Naji, H.; Taherpour, M. The effect of simulated dust storm on wood development and leaf stomata in Quercus brantii L. Desert 2019, 24, 43–49. [Google Scholar]
  12. Griffin, D.W.; Kellogg, C.A. Dust storms and their impact on ocean and human health: Dust in Earth’s atmosphere. EcoHealth 2004, 1, 284–295. [Google Scholar] [CrossRef]
  13. Hashizume, M.; Ueda, K.; Nishiwaki, Y.; Michikawa, T.; Onozuka, D. Health effects of Asian dust events: A review of the literature. Nihon Eiseigaku Zasshi. Jpn. J. Hygiene 2010, 65, 413–421. [Google Scholar] [CrossRef]
  14. Yu, H.L.; Chien, L.C.; Yang, C.H. Asian dust storm elevates children’s respiratory health risks: A spatiotemporal analysis of children’s clinic visits across Taipei (Taiwan). PLoS ONE 2012, 7, e41317. [Google Scholar] [CrossRef]
  15. Ardon-Dryer, K.; Mock, C.; Reyes, J.; Lahav, G. The effect of dust storm particles on single human lung cancer cells. Environ. Res. 2020, 181, 108891–108910. [Google Scholar] [CrossRef]
  16. Opp, C.; Groll, M.; Abbasi, H.; Foroushani, M.A. Causes and effects of sand and dust storms: What has past research taught us? A survey. J. Risk. Finan. Mang. 2021, 14, 326. [Google Scholar] [CrossRef]
  17. Li, J.; Garshick, E.; Huang, S.; Koutrakis, P. Impacts of El Niño-Southern Oscillation on surface dust levels across the world during 1982–2019. Sci. Total Environ. 2021, 769, 144566. [Google Scholar] [CrossRef]
  18. Labban, A.H.; Butt, M.J. Analysis of sand and dust storm events over Saudi Arabia in relation with meteorological parameters and ENSO. Arab. J. Geosci. 2021, 14, 22. [Google Scholar] [CrossRef]
  19. Okin, G.S.; Reheis, M.C. An ENSO predictor of dust emission in the southwestern United States. Geophys. Res. Lett. 2002, 29, 46–49. [Google Scholar] [CrossRef]
  20. Hara, Y.; Uno, I.; Wang, Z. Long-term variation of Asian dust and related climate factors. Atmos. Environ. 2006, 40, 6730–6740. [Google Scholar] [CrossRef]
  21. Engelstaedter, S.; Kohfeld, K.E.; Tegen, I.; Harrison, S.P. Controls of dust emissions by vegetation and topographic depressions: An evaluation using dust storm frequency data. Geophys. Res. Lett. 2003, 30, 1294–1297. [Google Scholar] [CrossRef]
  22. Kimura, R.; Bai, L.; Wang, J. Relationships among dust outbreaks, vegetation cover, and surface soil water content on the Loess Plateau of China, 1999–2000. Catena 2009, 77, 292–296. [Google Scholar] [CrossRef]
  23. Khusfi, Z.E.; Khosroshahi, M.; Roustaei, F.; Mirakbari, M. Spatial and seasonal variations of sand-dust events and their relation to atmospheric conditions and vegetation cover in semi-arid regions of central Iran. Geoderma 2020, 365, 114225. [Google Scholar] [CrossRef]
  24. Hamzeh, N.H.; Karami, S. Investigation of a Severe Dust Storm over the Aral Sea Area; MegaPrint Inc.: Holderness, NH, USA, 2017. [Google Scholar]
  25. Xu, X.; Levy, J.K.; Zhaohui, L.; Hong, C. An investigation of sand–dust storm events and land surface characteristics in China using NOAA NDVI data. Glob. Planet. Change 2006, 52, 182–196. [Google Scholar] [CrossRef]
  26. Boloorani, A.D.; Nabavi, S.O.; Azizi, R.; Bahrami, H.A. Characterization of dust storm sources in western Iran using a synthetic approach. In Advances in Meteorology, Climatology and Atmospheric Physics; Springer: Berlin/Heidelberg, Germany, 2013; pp. 415–420. [Google Scholar]
  27. Liu, X.; Yin, Z.Y.; Zhang, X.; Yang, X. Analyses of the spring dust storm frequency of northern China in relation to antecedent and concurrent wind, precipitation, vegetation, and soil moisture conditions. J. Geophys. Res. Atmos. 2004, 109, 16210–16226. [Google Scholar] [CrossRef]
  28. Farahat, A.; El-Askary, H.; Dogan, A.U. Aerosols size distribution characteristics and role of precipitation during dust storm formation over Saudi Arabia. Aerosol Air Qual. Res. 2016, 16, 2523–2534. [Google Scholar] [CrossRef]
  29. Dar, M.A.; Ahmed, R.; Latif, M.; Azam, M. Climatology of dust storm frequency and its association with temperature and precipitation patterns over Pakistan. Nat. Hazards 2022, 110, 655–677. [Google Scholar] [CrossRef]
  30. Opp, C.; Groll, M.; Aslanov, I.; Lotz, T.; Vereshagina, N. Aeolian dust deposition in the Southern Aral Sea region (Uzbekistan)—Ground-based monitoring results from the LUCA project. Quat. Int. 2016, 429, 86–99. [Google Scholar] [CrossRef]
  31. Goudie, A.S.; Middleton, N.J. Desert Dust in the Global System; Springer Science & Business Media: Berlin, Germany, 2006. [Google Scholar]
  32. Shao, Y.; Wyrwoll, K.-H.; Chappell, A.; Huang, J.; Lin, Z.H.; McTainsh, G.H.; Mikami, M.; Tanaka, T.Y.; Wang, X.; Yoon, S. Dust cyle: An emerging core theme in Earthsystem science. Aeo. Res. 2011, 2, 181–204. [Google Scholar] [CrossRef]
  33. Middleton, N.J. Desert dust hazards: A global review. Aeo. Res. 2017, 24, 53–63. [Google Scholar] [CrossRef]
  34. Micklin, P. The Aral Sea disaster. Annu. Rev. Earth Planet. Sci. 2007, 35, 47–72. [Google Scholar] [CrossRef]
  35. Opp, C.; Wagemann, J.; Banedjshafi, S.; Abbasi, H.R. Aral Sea Syndrome and Lake Urmia crisis. A Comparison of causes, effects and strategies for problem solutions. In Geoparks and Geotourism in Iran. Schriften zur Internationalen Entwicklungs-und Umweltforschung; Dittmann, A., Ed.; Zentrum für Internationale Entwicklungs-und Umweltforschung; Universität Gießen: Giessen, Germany, 2017; Volume 34, pp. 169–183. [Google Scholar]
  36. Issanova, G.; Abuduwaili, J.; Galayeva, O.; Semenov, O.; Bazarbayeva, T. Aeolian transportation of sand and dust in the Aral Sea region. Int. J. Environ. Sci. Technol. 2015, 12, 3213–3224. [Google Scholar] [CrossRef]
  37. Huang, X.; Oberhänsli, H.; von Suchodoletz, H.; Sorrel, P. Dust deposition in the Aral Sea: Implications for changes in atmospheric circulation in central Asia during the past 2000 years. Quat. Sci. Rev. 2011, 30, 3661–3674. [Google Scholar] [CrossRef]
  38. Karami, S.; Hamzeh, N.H.; Kaskaoutis, D.G.; Rashki, A.; Alam, K.; Ranjbar, A. Numerical simulations of dust storms originated from dried lakes in central and southwest Asia: The case of Aral Sea and Sistan Basin. Aeo. Res. 2021, 50, 100679. [Google Scholar] [CrossRef]
  39. Rashki, A.; Eriksson, P.G.; Rautenbach, C.D.W.; Kaskaoutis, D.G.; Grote, W.; Dykstra, J. Assessment of chemical and mineralogical characteristics of airborne dust in the Sistan region, Iran. Chemosphere 2013, 90, 227–236. [Google Scholar] [CrossRef] [PubMed]
  40. Miri, A.; Maleki, S.; Middleton, N. An investigation into climatic and terrestrial drivers of dust storms in the Sistan region of Iran in the early twenty-first century. Sci. Total Environ. 2021, 757, 143952. [Google Scholar] [CrossRef] [PubMed]
  41. Gholampour, A.; Nabizadeh, R.; Hassanvand, M.S.; Taghipour, H.; Nazmara, S.; Mahvi, A.H. Characterization of saline dust emission resulted from Urmia Lake drying. J. Environ. Sci. Health Eng. 2015, 13, 82. [Google Scholar] [CrossRef]
  42. Mardi, A.H.; Khaghani, A.; MacDonald, A.B.; Nguyen, P.; Karimi, N.; Heidary, P.; Karimi, N.; Saemian, P.; Sehatkashani, S.; Tajrishy, M.; et al. The Lake Urmia environmental disaster in Iran: A look at aerosol pollution. Sci. Total Environ. 2018, 633, 42–49. [Google Scholar] [CrossRef]
  43. Boroughani, M.; Hashemi, H.; Hosseini, S.H.; Pourhashemi, S.; Berndtsson, R. Desiccating Lake Urmia: A new dust source of regional importance. IEEE Geosci. Remote Sens. Lett. 2019, 17, 1483–1487. [Google Scholar] [CrossRef]
  44. Hamzeh, N.H.; Ranjbar, A.S.; Gee, M.O.; Habibi, M.; Schöner, W. Analyses of a Lake Dust Source in the Middle East through Models Performance. Remote Sens. 2022, 50, 100679. [Google Scholar] [CrossRef]
  45. Abuduwaili, J.; DongWei, L.I.U.; GuangYang, W.U. Saline dust storms and their ecological impacts in arid regions. J. Arid. Land 2010, 2, 144–150. [Google Scholar] [CrossRef]
  46. Liu, D.; Abuduwaili, J.; Lei, J.; Wu, G. Deposition rate and chemical composition of the aeolian dust from a bare saline playa, Ebinur Lake, Xinjiang, China. Water Air Soil Pollut. 2011, 218, 175–184. [Google Scholar] [CrossRef]
  47. Ghale, Y.A.G.; Altunkaynak, A.; Unal, A. Investigation anthropogenic impacts and climate factors on drying up of Urmia Lake using water budget and drought analysis. Water Resour. Manag. 2018, 32, 325–337. [Google Scholar] [CrossRef]
  48. Delju, A.H.; Ceylan, A.; Piguet, E.; Rebetez, M. Observed climate variability and change in Urmia Lake Basin, Iran. Theor. Appl. Clim. 2013, 111, 285–296. [Google Scholar] [CrossRef]
  49. Ahmady-Birgani, H.; Ravan, P.; Schlosser, J.S.; Cuevas-Robles, A.; AzadiAghdam, M.; Sorooshian, A. On the chemical nature of wet deposition over a major desiccated lake: Case study for Lake Urmia basin. Atmos. Res. 2020, 234, 104762–104774. [Google Scholar] [CrossRef]
  50. Hassanzadeh, E.; Zarghami, M.; Hassanzadeh, Y. Determining the main factors in declining the Urmia Lake level by using system dynamics modeling. Water Res. Manag. 2012, 26, 129–145. [Google Scholar] [CrossRef]
  51. Singer, A.R.I.E.H.; Zobeck, T.; Poberezsky, L.; Argaman, E. The PM10and PM2· 5 dust generation potential of soils/sediments in the Southern Aral Sea Basin, Uzbekistan. J. Arid Environ. 2003, 54, 705–728. [Google Scholar] [CrossRef]
  52. Indoitu, R.; Kozhoridze, G.; Batyrbaeva, M.; Vitkovskaya, I.; Orlovsky, N.; Blumberg, D.; Orlovsky, L. Dust emission and environmental changes in the dried bottom of the Aral Sea. Aeolian Res. 2015, 17, 101–115. [Google Scholar] [CrossRef]
  53. Kochkarova, S.; Mambetullaeva, S. Study of Successional Processes of Vegetation Cover on the Dried Seabed of the Aral Sea. J. Res. Lepid. 2020, 51, 764–768. [Google Scholar] [CrossRef]
  54. Dukhovny, V.A.; de Schutter, J. Water in Central Asia: Past, Present, Future; CRC Press: Boca Raton, FL, USA, 2011. [Google Scholar]
  55. Soudi, M.; Ahmadi, H.; Yasi, M.; Hamidi, S.A. Sustainable restoration of the Urmia Lake: History, threats, opportunities and challenges. In Eur. Water; 2017; 60, pp. 341–347. Available online: https://worldview.earthdata.nasa.gov (accessed on 8 July 2022).
  56. Gholampour, A.; Nabizadeh, R.; Naseri, S.; Yunesian, M.; Taghipour, H.; Rastkari, N.; Nazmara, S.; Faridi, S.; Mahvi, A.H. Exposure and health impacts of outdoor particulate matter in two urban and industrialized area of Tabriz, Iran. J. Environ. Health Sci. Eng. 2014, 12, 27. [Google Scholar] [CrossRef]
  57. Delfi, S.; Mosaferi, M.; Hassanvand, M.S.; Maleki, S. Investigation of aerosols pollution across the eastern basin of Urmia lake using satellite remote sensing data and HYSPLIT model. J. Environ. Sci. Health Sci. Eng. 2019, 17, 1107–1120. [Google Scholar] [CrossRef] [PubMed]
  58. Harati, H.; Kiadaliri, M.; Tavana, A.; Rahnavard, A.; Amirnezhad, R. Urmia Lake dust storms occurrences: Investigating the relationships with changes in water zone and land cover in the eastern part using remote sensing and GIS. Environ. Monit. Assess. 2021, 193, 70. [Google Scholar] [CrossRef] [PubMed]
  59. Habibi, M.; Babaeian, I.; Schöner, W. Changing Causes of Drought in the Urmia Lake Basin—Increasing Influence of Evaporation and Disappearing Snow Cover. Water 2021, 13, 3273. [Google Scholar] [CrossRef]
  60. Hamzeh, N.H.; Karami, S.; Opp, C.; Fattahi, E.; Jean-François, V. Spatial and temporal variability in dust storms in the Middle East, 2002–2018: Three case studies in July 2009. Arab. J. Geosci. 2021, 14, 538. [Google Scholar] [CrossRef]
  61. Karami, S.; Hamzeh, N.H.; Abadi, A.R.S.; Madhavan, B.L. Investigation of a severe frontal dust storm over the Persian Gulf in February 2020 by CAMS model. Arab. J. Geosci. 2021, 14, 2041. [Google Scholar] [CrossRef]
  62. Hamzeh, N.H.; Kaskaoutis, D.G.; Rashki, A.; Mohammadpour, K. Long-Term Variability of Dust Events in Southwestern Iran and Its Relationship with the Drought. Atmosphere 2021, 12, 1350. [Google Scholar] [CrossRef]
  63. Notaro, M.; Yu, Y.; Kalashnikova, O.V. Regime shift in Arabian dust activity, triggered by persistent Fertile Crescent drought. J. Geophys. Res. Atmos. 2015, 120, 10–229. [Google Scholar] [CrossRef]
  64. Available online: https://www-calipso.larc.nasa.gov (accessed on 24 June 2022).
  65. Ghasem, A.; Shamsipour, A.; Miri, M.; Safarrad, T. Synoptic and remote sensing analysis of dust events in southwestern Iran. Nat. Hazards 2012, 64, 1625–1638. [Google Scholar] [CrossRef]
  66. Barlow, M.; Zaitchik, B.; Paz, S.; Black, E.; Evans, J.; Hoell, A. A review of drought in the Middle East and southwest Asia. J. Clim. 2016, 29, 8547–8574. [Google Scholar] [CrossRef]
  67. Tabari, H.; Nikbakht, J.; Talaee, P.H. Hydrological drought assessment in Northwestern Iran based on streamflow drought index (SDI). Water Res. Manag. 2013, 27, 137–151. [Google Scholar] [CrossRef]
  68. Shukurov, K.A.; Shukurova, L.M. The fields of mean concentration in potential sources of ammonium sulphate, ammonium nitrate and natural silicates for the west of Moscow region. In Proceedings of the 23rd International Symposium on Atmospheric and Ocean Optics: Atmospheric Physics, Irkutsk, Russian, 3–7 July 2017; Volume 10466, p. 104663U. [Google Scholar] [CrossRef]
  69. Zachary, M.; Lun, Y.; Mwai, Z. Application of PSCF and CWT to Identify Potential Sources of Aerosol Optical Depth in ICIPE Mbita. Open Access Libr. J. 2018, 5, 1–12. [Google Scholar] [CrossRef]
  70. Dimitriou, K. The Dependence of PM Size Distribution from Meteorology and Local-Regional Contributions, in Valencia (Spain)–A CWT Model Approach. Aerosol Air Qual. Res. 2015, 15, 1979–1989. [Google Scholar] [CrossRef]
  71. Li, C.; Dai, Z.; Liu, X.; Wu, P. Transport Pathways and Potential Source Region Contributions of PM2.5 in Weifang: SeasonalVariations. Appl. Sci. 2020, 10, 2835. [Google Scholar] [CrossRef]
  72. Shukurov, K.A.; Shukurova, L.M. An influence of transboundary transport to aerosols of South of Russian Far East by data of AERONET Ussuriysk site, Russia. In Proceedings of the 24th International Symposium on Atmospheric and Ocean Optics: Atmospheric Physics, Tomsk, Russian, 2–5 July 2018; Volume 10833, p. 108337F. [Google Scholar] [CrossRef]
  73. Shukurov, K.A.; Shukurova, L.M. Potential sources of Southern Siberia aerosols by data of AERONET site in Tomsk, Russia. In Proceedings of the 23rd International Symposium on Atmospheric and Ocean Optics: Atmospheric Physics, Irkutsk, Russian, 3–7 July 2017; Volume 10466, p. 104663W. [Google Scholar] [CrossRef]
  74. Shukurov, K.A.; Chkhetiani, O.G. Probability of transport of air parcels from the arid lands in the Southern Russia to Moscow region. In Proceedings of the 23rd International Symposium on Atmospheric and Ocean Optics: Atmospheric Physics, Irkutsk, Russian, 3–7 July 2017; Volume 10466, p. 104663V. [Google Scholar] [CrossRef]
  75. Kaskaoutis, D.G.; Kambezidis, H.D.; Nastos, P.T.; Kosmopoulos, P.G. Study on an intense dust storm over Greece. Atmos. Environ. 2008, 42, 6884–6896. [Google Scholar] [CrossRef]
  76. Karami, S.; Hamzeh, N.H.; Alam, K.; Noori, F.; Abadi, A.R.S. Spatio-temporal and synoptic changes in dust at the three islands in the Persian Gulf region. J. Atmos. Sol. Terr. Phys. 2021, 214, 105539. [Google Scholar] [CrossRef]
  77. Hamzeh, N.H.; Karami, S.; Kaskaoutis, D.G.; Tegen, I.; Moradi, M.; Opp, C. Atmospheric dynamics and numerical simulations of six frontal dust storms in the Middle East region. Atmosphere 2021, 12, 125. [Google Scholar] [CrossRef]
  78. Zoljoodi, M.; Didevarasl, A.; Saadatabadi, A.R. Dust events in the western parts of Iran and the relationship with drought expansion over the dust-source areas in Iraq and Syria. Atmos. Clim. Sci. 2013, 3, 321–336. [Google Scholar] [CrossRef]
  79. Ginoux, P.; Garbuzov, D.; Hsu, N.C. Identification of anthropogenic and natural dust sources using moderate resolution imaging spectroradiometer (MODIS) deep blue level 2 data. J. Geophys. Res. 2010, 115, D05204. [Google Scholar] [CrossRef]
  80. Nobakht, M.; Shahgedanova, M.; White, K. New inventory of dust emission sources in Central Asia and northwestern China derived from MODIS imagery using dust enhancement technique. J. Geophys. Res. Atmos. 2021, 126, e2020JD033382. [Google Scholar] [CrossRef]
  81. Fiedler, S.; Schepanski, K.; Heinold, B.; Knippertz, P.; Tegen, I. Climatology of nocturnal low-level jets over North Africa and implications for modeling mineral dust emission. J. Geophys. Res. Atmos. 2013, 118, 6100–6121. [Google Scholar] [CrossRef]
  82. Caponi, L.; Formenti, P.; Massabó, D.; Di Biagio, C.; Cazaunau, M.; Pangui, E.; Chevaillier, S.; Landrot, G.; Andreae, M.O.; Kandler, K.; et al. Spectral-and size-resolved mass absorption efficiency of mineral dust aerosols in the shortwave spectrum: A simulation chamber study. J. Geophys. Res. Atmos. 2017, 17, 7175–7191. [Google Scholar] [CrossRef]
  83. Bangalath, H.K.; Stenchikov, G. Sensitivity of the Middle East–North African Tropical Rainbelt to Dust Shortwave Absorption: A High-Resolution AGCM Experiment. J. Clim. 2016, 29, 7103–7126. [Google Scholar] [CrossRef]
  84. Sicard, M.; Bertolín, S.; Mallet, M.; Dubuisson, P.; Comerón, A. Estimation of mineral dust long-wave radiative forcing: Sensitivity study to particle properties and application to real cases in the region of Barcelona. Atmos. Chem. Phys. 2014, 14, 9213–9231. [Google Scholar] [CrossRef]
  85. Haywood, J.M.; Allan, R.P.; Culverwell, I.; Slingo, T.; Milton, S.; Edwards, J.; Clerbaux, N. Can desert dust explain the outgoing longwave radiation anomaly over the Sahara during July 2003. J. Geophys. Res. Atmos. 2005, 110, D05105.1–D05105.14. [Google Scholar] [CrossRef]
  86. Yin, Y.; Wurzler, S.; Levin, Z.; Reisin, T.G. Interactions of mineral dust particles and clouds: Effects on precipitation and cloud optical properties. J. Geophys. Res. Atmos. 2002, 107, 10–19. [Google Scholar] [CrossRef]
  87. Ebrahimi-Khusfi, Z.; Mirakbari, M.; Khosroshahi, M. Vegetation response to changes in temperature, rainfall, and dust in arid environments. Environ. Monitor. Assess. 2020, 192, 691. [Google Scholar] [CrossRef]
  88. Soleimani Sardoo, F.; Hosein Hamzeh, N.; Karami, S.; Nateghi, S.; Hashemi Nezhad, M. Emission and transport of dust particles in Jazmourian basin (Case study: Dust storm 24 to 26 November 2016). J. Clim. Res. 2022, 1400, 41–54. [Google Scholar]
  89. Creamean, J.M.; Suski, K.J.; Rosenfeld, D.; Cazorla, A.; DeMott, P.J.; Sullivan, R.C.; White, A.B.; Ralph, F.M.; Minnis, P.; Comstock, J.M.; et al. Dust and biological aerosols from the Sahara and Asia influence precipitation in the western US. Science 2013, 339, 1572–1578. [Google Scholar] [CrossRef]
  90. Pi, H.; Sharratt, B.; Lei, J. Atmospheric dust events in central Asia: Relationship to wind, soil type, and land use. J. Geophys. Res. Atmos. 2017, 122, 6652–6671. [Google Scholar] [CrossRef]
  91. Farahmand, N.; Sadeghi, V. Estimating soil salinity in the dried lake bed of Urmia Lake using optical Sentinel-2 images and nonlinear regression models. J. Indian Soc. Remote Sens. 2020, 48, 675–687. [Google Scholar] [CrossRef]
Figure 1. Desiccation of the Urmia Lake in 2000–2020. Here and after, the similar satellite snapshots were provided courtesy of NASA EOSDIS Worldview at [56].
Remotesensing 14 03827 g001
Figure 2. (a). The study area with some synoptic weather stations and air pollution monitoring stations (Salmas and Urmia stations located to the west of the lake, Bonab and Tabriz located to the east of the lake, and Bokan and Sardasht located to the south of the lake) in Urmia Lake area in NW Iran. (b). View of Lake Urmia from the Kalantari Highway, dividing the lake into two parts (photo C. Opp 2011).
Remotesensing 14 03827 g002
Figure 3. Snapshot of the Urmia Lake region (September 2003). Cells of 1° × 1° size are shown, used for extracting data series of NASA Aqua MODIS aerosol optical depth at 550 nm and Ångström exponent at 412/470 nm in 2002–2021. The red square delineates the cells of the Urmia Lake region. The blue rectangle delineates the cell of 5° × 2° size of monthly CALIPSO aerosol extinction coefficient at 532 nm profile. The red dot is the nodal point of the cell’s monthly CALIPSO aerosol profiles.
Remotesensing 14 03827 g003
Figure 4. The total number of dusty days per month related to the 06, 07, and 09 weather codes and the wind roses at the weather stations of (a,c) Urmia City and (b,d) Tabriz City over the 21 years from 2000 to 2020. Here, Calms refer to winds with speeds less than 5 m·s−1.
Remotesensing 14 03827 g004
Figure 5. (a) The monthly number of dusty days at the weather stations Tabriz and Urmia in 2000–2020. (b) Monthly mean visibility at the weather stations Tabriz and Urmia in the dusty days in 2000–2020. Courtesy of Iran Meteorological Organization. Timestamps are related to January.
Remotesensing 14 03827 g005
Figure 6. The total annual number of dusty days at the weather stations Tabriz, Sardasht, Urmia, Salmas, and Bonab from 2000 to 2020. Courtesy of Iran Meteorological Organization.
Remotesensing 14 03827 g006
Figure 7. Spatial distribution of MODIS/Aqua mean AOD from 2000 to 2021.
Remotesensing 14 03827 g007
Figure 8. Monthly average (thin gray lines) vertical tropospheric aerosol extinction coefficient profiles according to CALIPSO satellite data in 2006–2021: (a) in winter (December–January–February); (b) in spring (March–April–May); (c) in summer (June–July–August); (d) in autumn (September–October–November). Bold black lines show the average seasonal profiles from 2006–2021. Mean surface elevation in the Urmia Lake region (of 1.5 km) is indicated with the red line.
Remotesensing 14 03827 g008
Figure 9. (a) Variations of Aqua MODIS daily (thin line) and monthly mean (bold line) aerosol optical depth at 550 nm (AOD550) over the Urmia Lake region (by the seven cells averaged) in 2002–2021. (b) Probability density function (histogram; 1) and probability function (bold line; 2) of AOD550 over Urmia Lake region (averaged over the seven cells) in 2002–2021. The number at the vertical dotted line is the lower limit of the 10% highest AOD550.
Remotesensing 14 03827 g009
Figure 10. (a) Variations in monthly AOD550 (shaded area) according to Aqua MODIS (MOD-AOD550) data in 2002–2021 and average monthly AOD532 (dark gray line) according to CALIPSO satellite (CAL-AOD532) data in 2006–2021. (b) Average seasonal values of CAL-AOD532 according to CALIPSO data (light gray) in 2006–2021, MOD-AOD550 according to Aqua MODIS data in 2002–2021 (dark gray), and reconstructed MOD-AOD532 according to MODIS AOD550 and Ångström exponent data in 2002–2021 (light gray patterned).
Remotesensing 14 03827 g010
Table 1. The dust-related present weather codes.
06Widespread dust in suspension, not raised by wind at or near the station at the time of observation
07Dust or sand raised by wind at or near the station at the time of observation
08Well-developed dust whirl(s) or sand whirl(s) seen at or near the station during the preceding hour or at the time of observation, but no dust storm or sandstorm
09Dust storm or sandstorm within sight at the time of observation, or the station during the preceding hour
30–32Slight or moderate sandstorms or dust storms
33–35Severe sandstorms or dust storms
Table 2. The two synoptic weather stations around Lake Urmia and the mean annual number of dust days during 1960–2021.
Synoptic StationLongitudeLatitudeElevationMean Number of Dust Days
Urmia45.0837.55132821.67
Tabriz46.2735.7136157.82
Table 3. Lower limits of the 10% highest seasonal AOD550 and seasonal average AOD550 (in brackets) across seven cells around the Urmia Lake.
WinterSpringSummerAutumnYear
NW0.29 (0.14)0.33 (0.18)0.31 (0.18)0.24 (0.13)0.29 (0.16)
W0.22 (0.11)0.39 (0.21)0.37 (0.20)0.26 (0.13)0.31 (0.16)
SW0.17 (0.10)0.42 (0.23)0.37 (0.22)0.29 (0.16)0.31 (0.18)
SS0.17 (0.10)0.39 (0.20)0.40 (0.23)0.31 (0.16)0.32 (0.17)
SE0.19 (0.10)0.32 (0.18)0.44 (0.22)0.32 (0.14)0.32 (0.16)
EE0.26 (0.13)0.46 (0.19)0.60 (0.26)0.40 (0.17)0.43 (0.16)
NE0.27 (0.14)0.44 (0.22)0.42 (0.23)0.34 (0.17)0.37 (0.19)
All0.22 (0.12)0.39 (0.20)0.42 (0.22)0.31 (0.15)0.34 (0.17)
Table 4. Pairwise correlation coefficients between variations Aqua MODIS daily aerosol optical depth at 550 nm (AOD550) over the seven cells of the Urmia Lake region in 2002–2021 (all statistically significant at p = 0.05). Correlation coefficients between AOD550 variations: over the cells in the Urmia Lake region only are colored with gray; over the cells in the Urmia Lake region and over additional cells east from the Urmia Lake region are colored with green; over the additional cells only are colored with red.
WNWSSEENEA2A1A4A3
SW0.750.540.820.630.590.480.500.460.460.42
W 0.770.800.750.750.650.610.520.520.47
NW 0.590.640.700.700.590.570.510.50
S 0.820.770.600.660.570.610.51
SE 0.870.680.830.660.710.60
E 0.810.840.720.700.63
NE 0.730.830.700.74
A2 0.730.810.69
A1 0.800.87
A4 0.79
Publisher’s Note: MDPI stays neutral with regard to jurisdictional claims in published maps and institutional affiliations.

