Article

Influence of Plasma Sheath’s Velocity Field on ISAR Imaging of Hypersonic Target

School of Aerospace Science and Technology, Xidian University, Xi’an 710071, China
*
Author to whom correspondence should be addressed.
Remote Sens. 2022, 14(15), 3799; https://doi.org/10.3390/rs14153799
Submission received: 17 June 2022 / Revised: 27 July 2022 / Accepted: 1 August 2022 / Published: 6 August 2022
(This article belongs to the Special Issue Radar High-Speed Target Detection, Tracking, Imaging and Recognition)

Abstract

:
Plasma sheath poses a serious challenge to inverse synthetic aperture radar (ISAR) imaging of hypersonic targets. This paper investigated the distribution characteristics of the electron density and velocity field in the plasma sheath surrounding the hypersonic target in various flight scenes. The incident depth and reflective surface of electromagnetic (EM) waves with X-band, Ku-band, and Ka-band can be determined based on the plasma frequency. We established the echo model coupled with the velocity field of the plasma sheath on the reflective surface and obtained one-dimensional range profiles and ISAR images of the hypersonic target in various flight scenes. The simulation results indicated that the non-uniform velocity field on the reflective surface induced displacement and diffusion in the one-dimensional range profile, resulting in ISAR image distortion. A changing flight scene and radar frequency can have an impact on imaging results. Peak Signal-to-Noise Ratio (PSNR) and Structural Similarity (SSIM) were utilized to assess the impact of plasma sheath on ISAR images. This study revealed the defocus mechanism of the ISAR image caused by the velocity field of the plasma sheath and provided a theoretical reference for the selection of radar frequency for hypersonic targets in various flight scenes.

1. Introduction

During flight, a hypersonic target experiences severe aerodynamic heating issues, which produce the plasma sheath that envelops its surface. The plasma sheath severely affects the hypersonic target’s communication and radar detection [1,2,3]. A plasma sheath can absorb and attenuate EM waves of a particular frequency, which is proportional to the plasma’s electron density. The EM waves cannot penetrate high-electron-density regions of the plasma sheath and are reflected at a certain depth [4]. As an EM loss medium, the plasma sheath will couple with incident EM waves, resulting in the attenuation of echo amplitude and a phase shift [5,6,7].
Recent studies on the EM scattering characteristics of plasma sheaths attracted considerable interest [8,9,10]. Most related studies focused on the reflection coefficients of plasma sheath, which lead to the pulse pressure mismatch of one-dimensional range profile [11,12]. Yang et al. [13] studied the relationship between the energy transfer efficiencies, the ray emission angles, and the EM wave frequencies. They found that the energy transfer efficiency of the radio waves improved with increased speed. Zhang et al. [14] studied the spatial dispersion effect in the warm plasma sheath. They found that the characteristics of field distributions in the warm plasma sheath were distinctly different from the cold plasma sheath when the resonance between EM waves and the plasmas occurred. Bian et al. [15] simulated a one-dimensional range profile and ISAR image of a hypersonic vehicle with a plasma sheath. They discovered that the plasma sheath’s absorption and attenuation of detected EM waves caused ISAR images to be fuzzy and distorted along the radial direction. Despite accomplishments in radar detection and ISAR imaging in the presence of plasma sheath, their research ignored the issue of the flow field properties of the plasma sheath of the hypersonic target. Zhang et al. [16] proposed a wideband radar scattering center model of a plasma-sheath-covered reentry target that considers the plasma sheath’s velocity. However, they did not conduct a comprehensive analysis based on this model, nor did they consider the effect of the plasma sheath’s velocity field.
The stop-and-go (SAG) echo model can introduce significant errors for hypersonic targets due to the effect of target motion within the pulse duration [17]. The moving-in-pulse-duration (MPD) model for hypersonic targets was presented by Xu et al. The performance of pulse compression under the SAG and MPD models was evaluated using simulations and theoretical analysis [18]. However, they only considered the movement of the hypersonic target and ignored the plasma sheath surrounding it.
In this study, we investigated the distribution characteristics of electron density and velocity field in plasma sheath under various flight scenes. We calculated the incident depth of EM waves with X-band, Ku-band, and Ka-band based on the plasma frequency to obtain the reflective surface. By establishing the echo model coupled with the plasma sheath’s velocity field, we simulated and analyzed the one-dimensional range profiles and ISAR images of the hypersonic target in various flight scenes, thereby revealing the influence mechanism of the plasma sheath’s velocity field. The image quality in various flight scenes was evaluated, and suggestions were made for selection of the optimal radar frequency for ISAR imaging of hypersonic targets.
This paper is organized as follows. The electron density and velocity field distribution of the plasma sheath are introduced in Section 2. In Section 3, the incident depth, obtained reflective surface, and its velocities in various scenes are evaluated. In Section 4, the echo model of a hypersonic target enveloped by plasma sheath is proposed, and displacement and diffusion are analyzed. Section 5 presents simulations of ISAR images in various flight scenes and suggests the optimal radar frequency for each scene. Conclusions are summarized in Section 6.

2. Distribution Characteristics of Plasma Sheath

The Radio Attenuation Measurement (RAM) program included a series of hypersonic experiments designed to investigate the issue of communication blackout [19,20]. Using reflectometers, the parameters of the plasma sheath on the surface of the aircraft at various altitudes and speeds were measured during the flight. They are the most comprehensive public data available. The flow-field plasma characteristics and the resulting attenuation of propagating electromagnetic waves were investigated experimentally and theoretically [21]. Currently, few experimental plasma parameter measurements are obtained during hypersonic flight, and the numerical simulation of computational fluid dynamics (CFD) using RAM program’s data [22] is the most popular method for analyzing the parameters of plasma sheath. In this study, the blunt cone served as a model for the hypersonic target, and its geometry parameters were the same as that of the target in the RAM program, which is depicted in Figure 1.
In the RAM program, the calculations were made for a reentry velocity range of 5 km/s to 12 km/s, together with the corresponding values of altitude and angle of attack [23]. To simulate greater flow field conditions of the flight process, we selected seven flight scenes by modifying the hypersonic target’s altitude, velocity, and attack angle, as shown in Table 1.

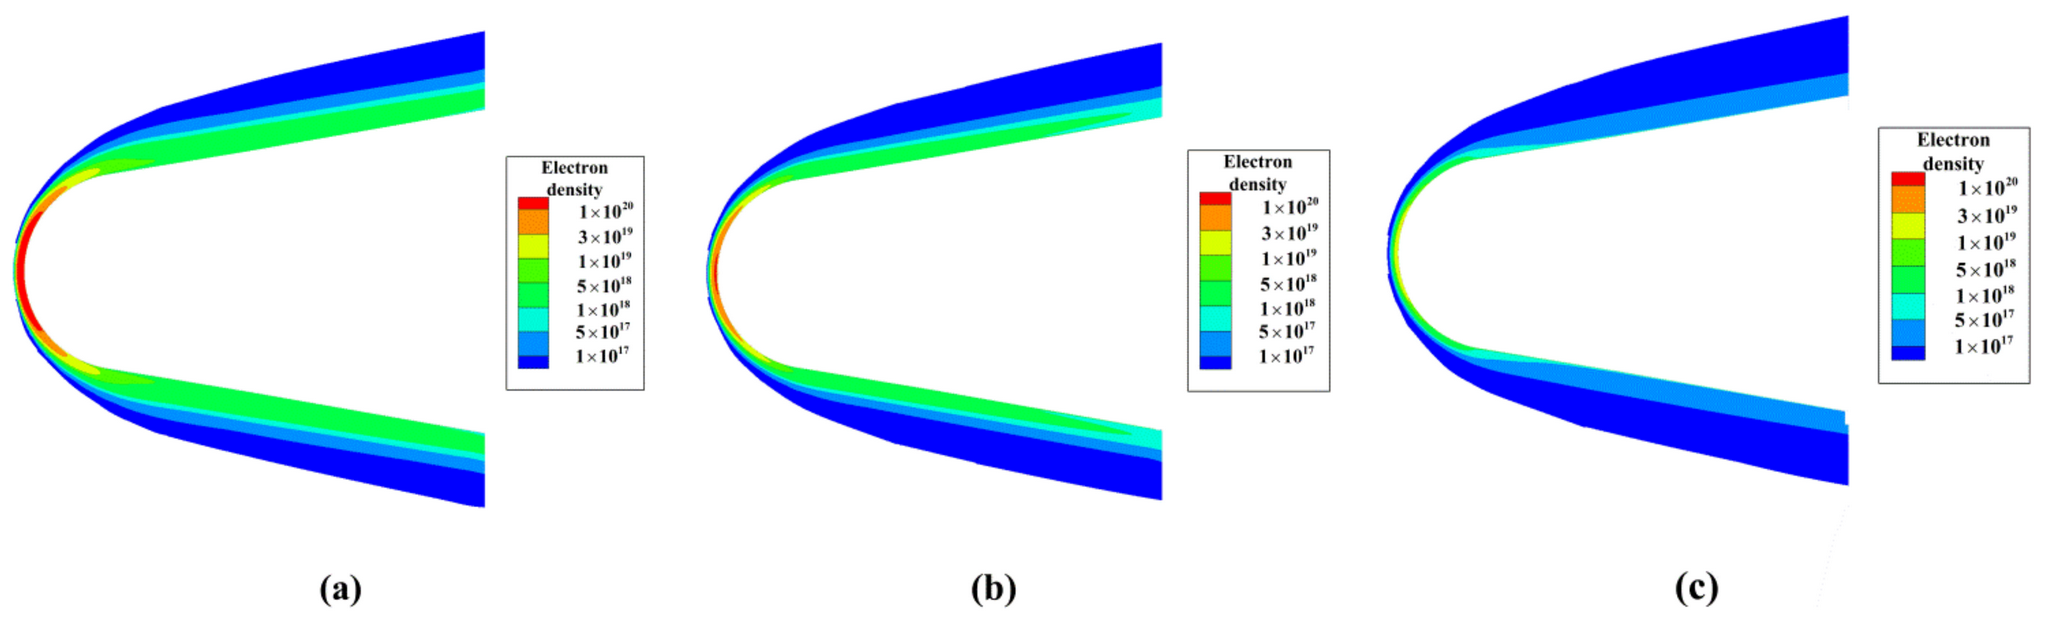
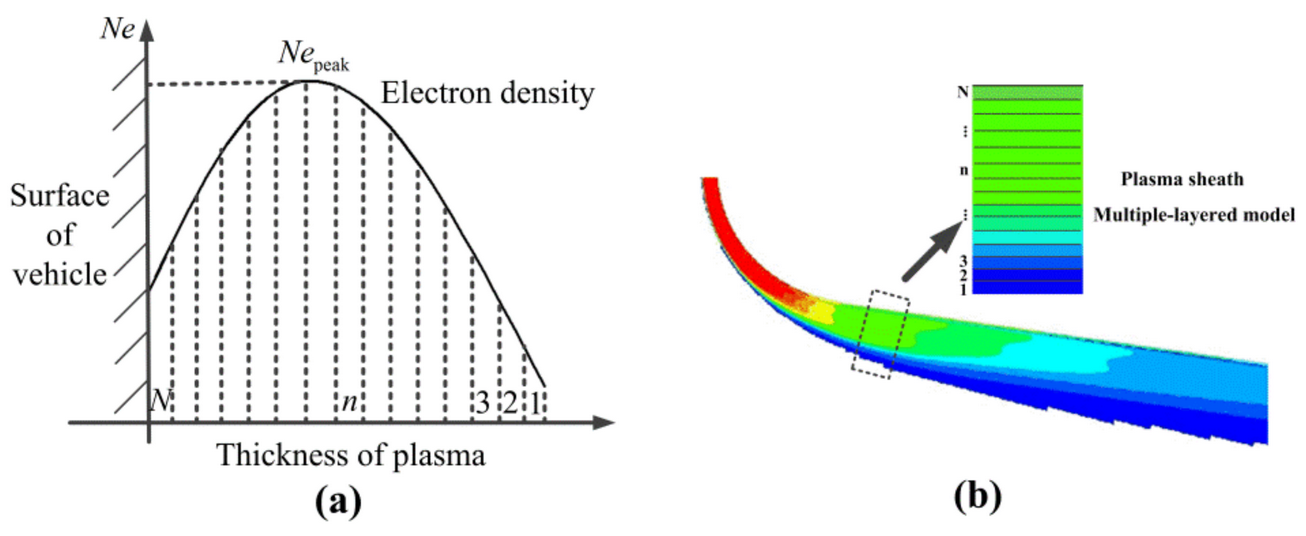
2.1. Electron Density of Plasma Sheath

Electron density indicates the number of free electrons per unit volume. It is the most important plasma parameter. According to the result of plasma diagnostics in the RAM program, the mean profiles of electron density along the vertical direction of the vehicle surface can be described as a bi-Gauss function [24]. Plasma is the fluid produced by shockwaves at the stagnation point of the hypersonic target. As the distance from the stagnation point increases, the electron density decreases. Plasma sheath radar-reflection characteristics are impacted by the plasma sheath’s nonuniform electron density. Therefore, it is necessary to analyze electron density distribution in various flight scenes.
Figure 2 depicts electron density distribution in scenes 1, 2, and 3. Compared to Figure 2a–c, as the altitude increases, the electron density of the plasma sheath enveloping the hypersonic target becomes higher. The plasma sheath’s thickness across the three scenes varied slightly. For each scene, along the surface of the reentry object, the closer to the stagnation point, the higher the electron density.
Figure 3 depicts the electron density distribution of the plasma sheath when the hypersonic target velocity is increased to Mach 20 and Mach 25 in scenes 4 and 5, with an altitude of 30 km. It can be observed that as velocity increases, the plasma sheath becomes significantly thicker and the electron density increases. For the spatial distribution, the stagnation point still has the highest electron density, and the tail is the lowest.
For the hypersonic target with a positive attack angle in scenes 6 and 7, the windward and leeward electron density states are shown to be distinct. As shown in Figure 4, the aerodynamic heating spot at the stagnation point moves from the center to the windward side. The change of attack angle alters the distribution of the plasma sheath and the thickness of electron density on the leeward side is significantly greater than that on the windward side.

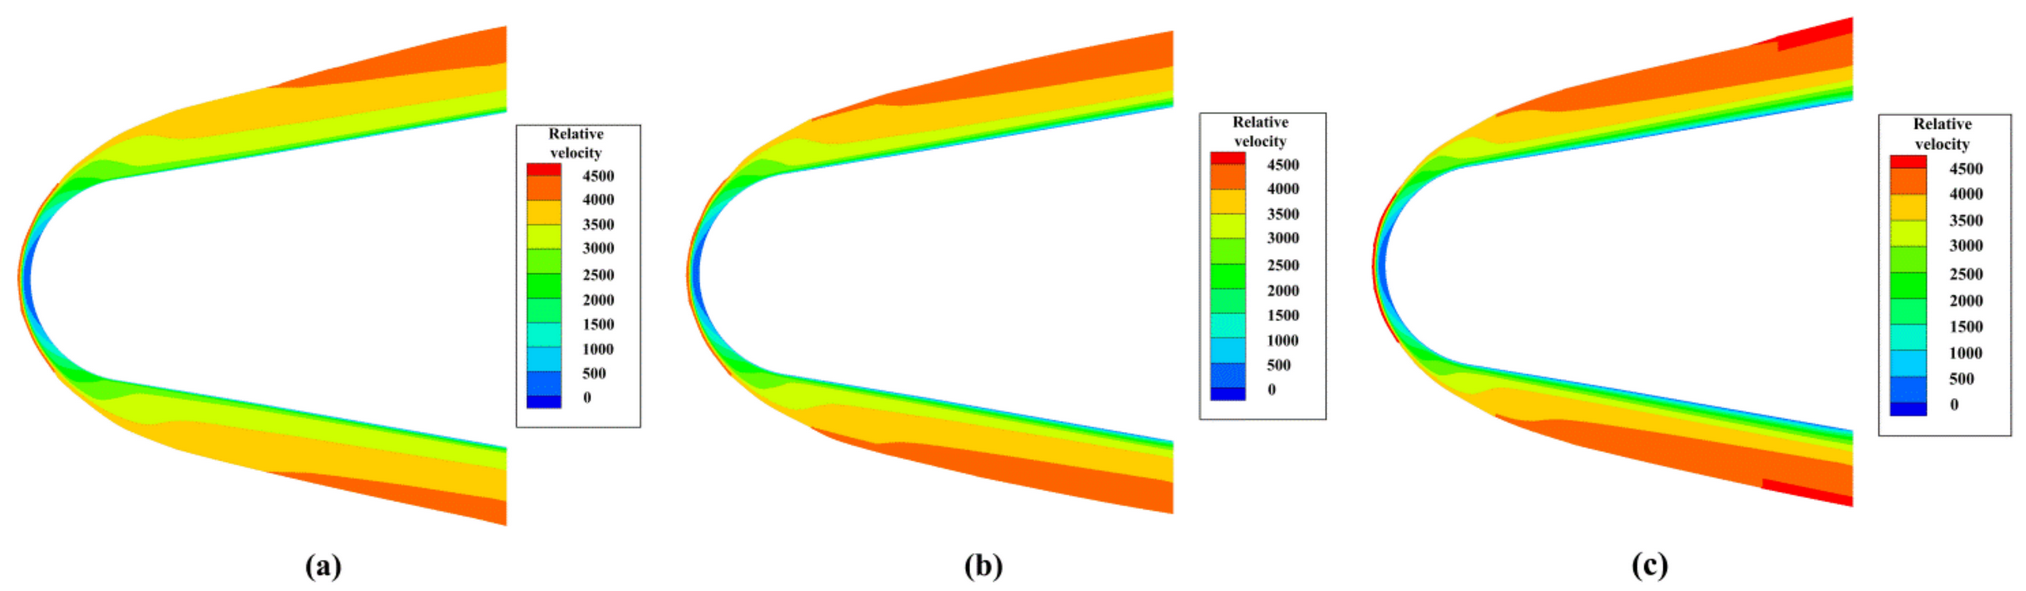
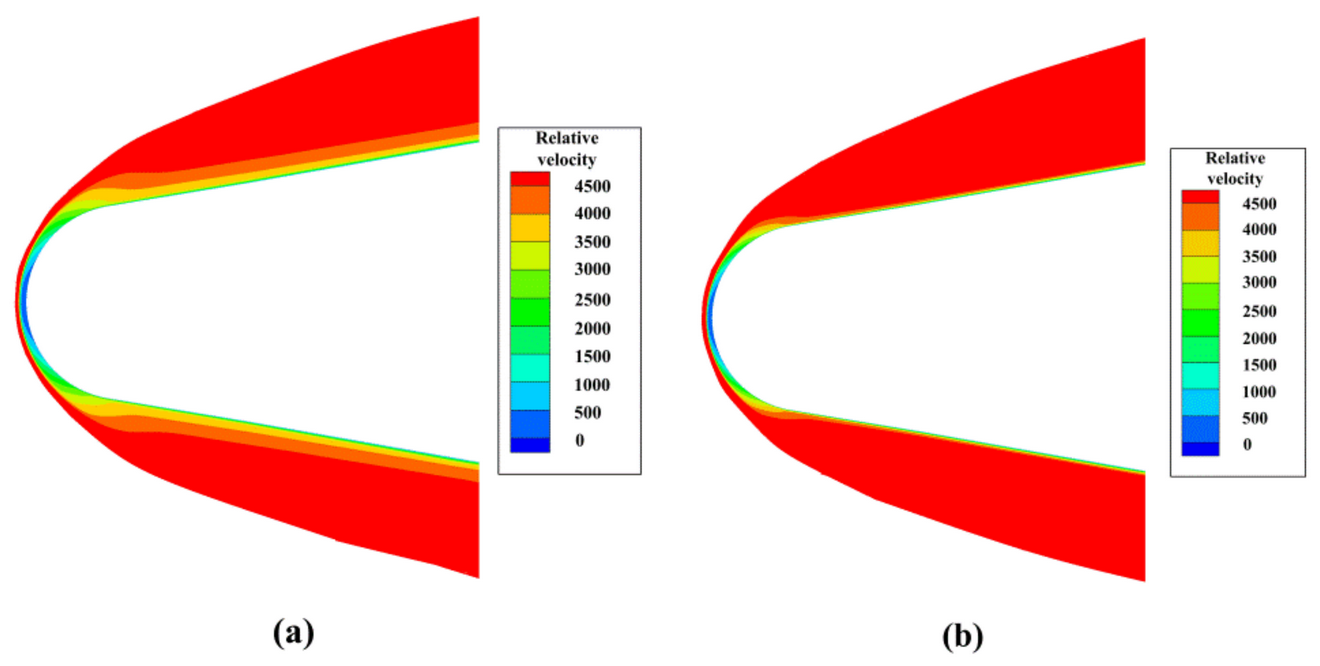
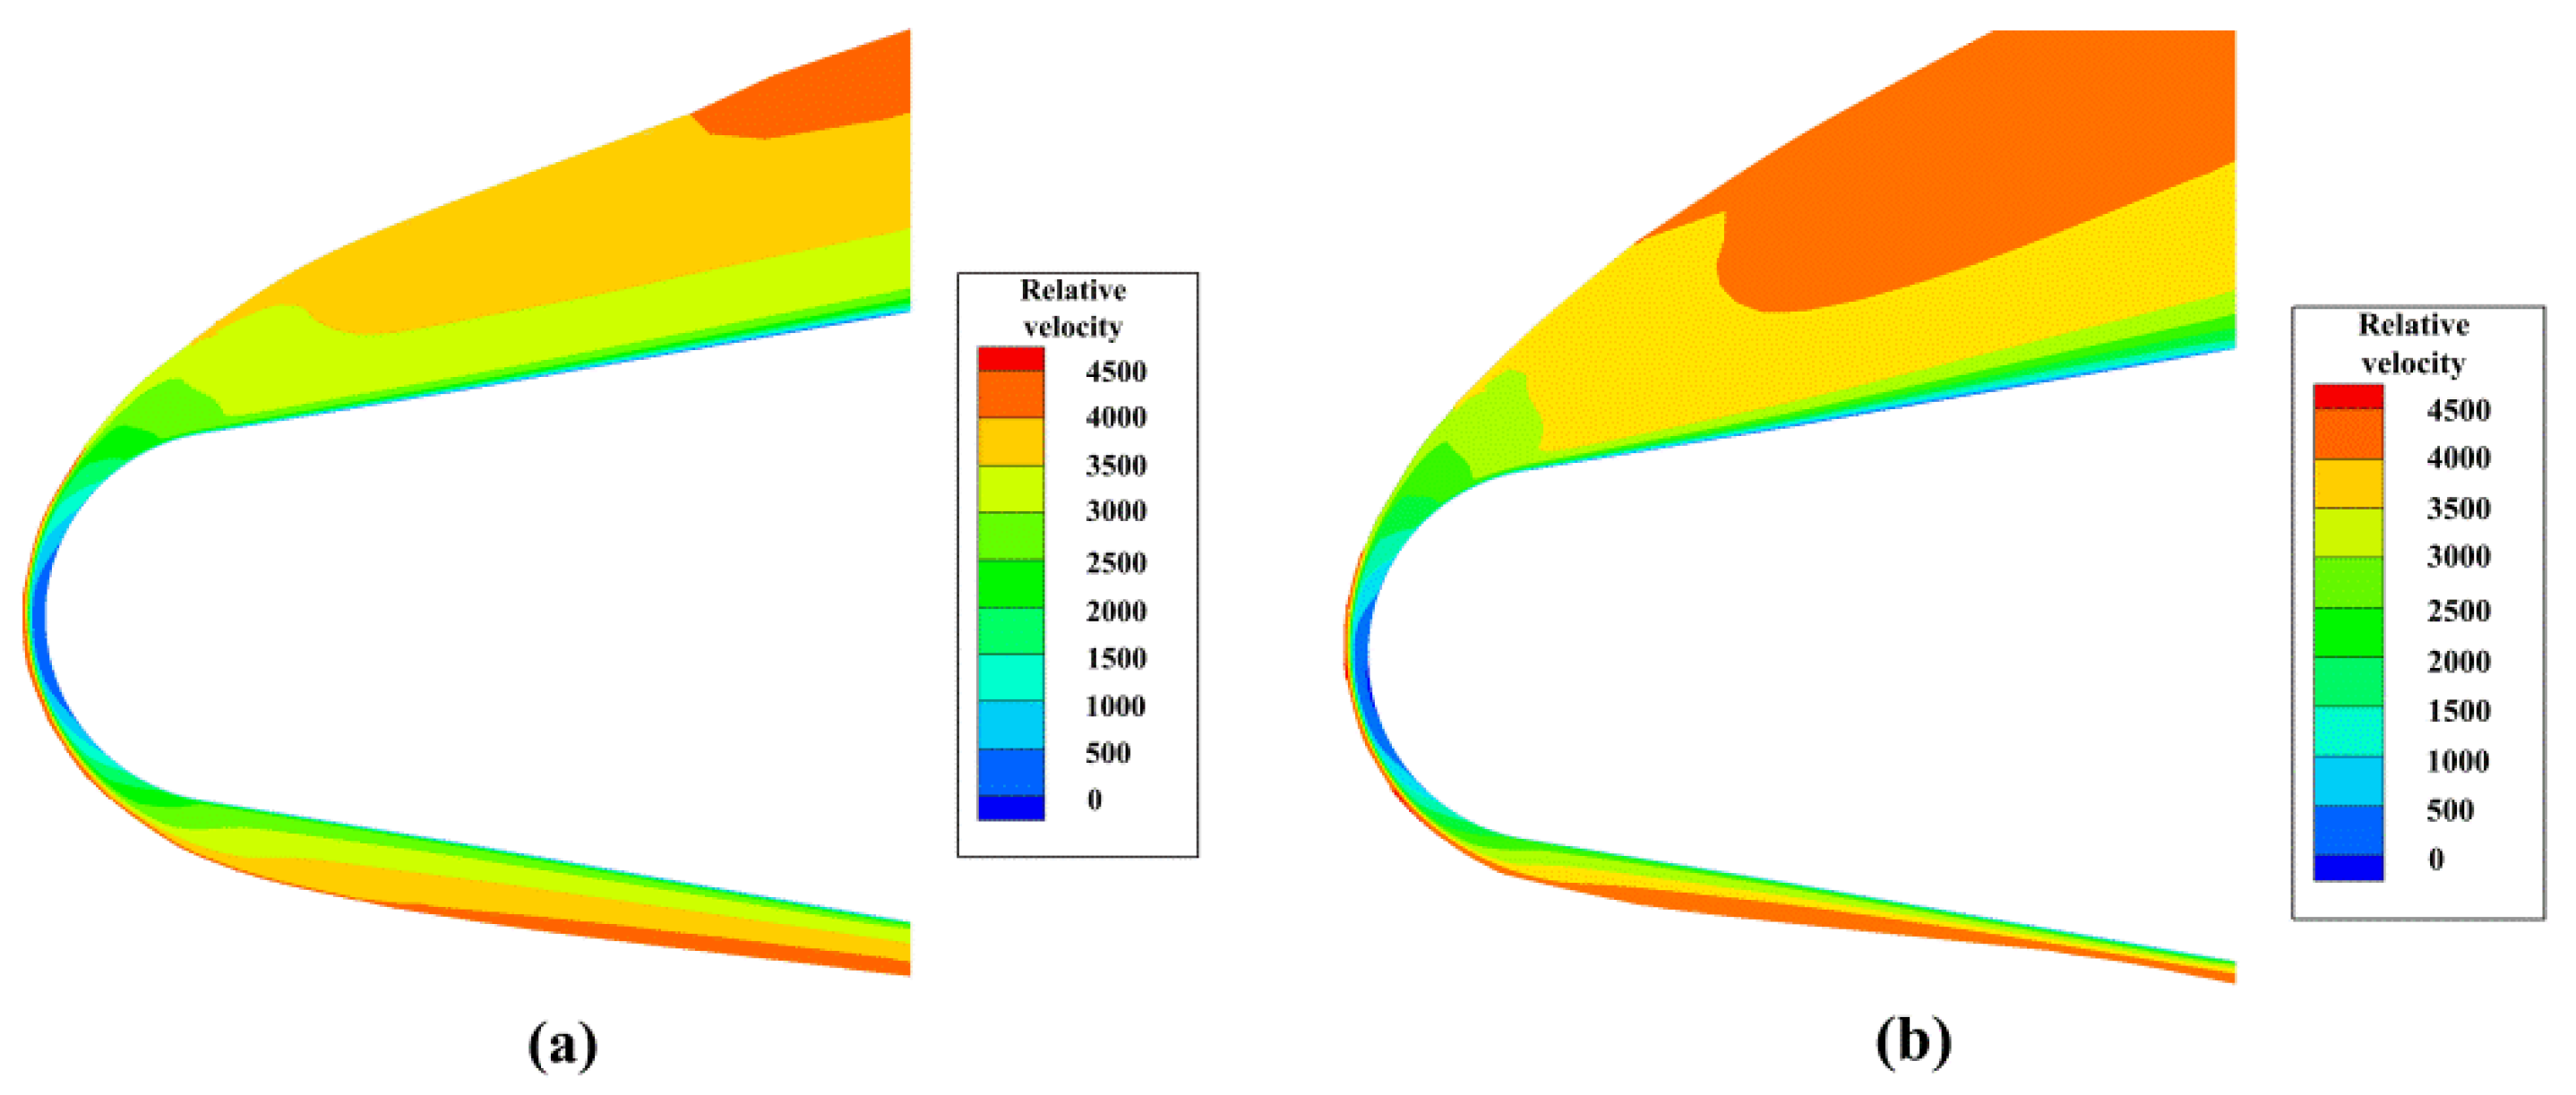
2.2. Velocity Field of the Plasma Sheath

The plasma sheath has a relative flow with the vehicle’s surface. The actual velocity of the plasma flow field coupling target forms the velocity field, whose formed peak velocity differs at different reference points, and the layered velocity value of the plasma sheath velocity field at the same reference point differs too [25].
Figure 5 depicts the lower relative velocity near the surface and the stagnation point. The point of stagnation has the highest velocity. As can be seen in Figure 5, the thickness of low-relative-velocity layers increases with the decrease in altitude.
According to Figure 6, the hypersonic target’s velocity in scenes 4 and 5 is Mach 20 and 25. Compared to scene 1, the plasma sheath’s thickness significantly increased. In contrast, as velocity increases, the thickness of the low-relative-velocity layers decreases.
As shown in Figure 7, as the attack angle increases for scenes 6 and 7, the plasma sheath becomes thinner on the windward side and thicker on the leeward side.

3. Reflection of EM Wave in Plasma Sheath

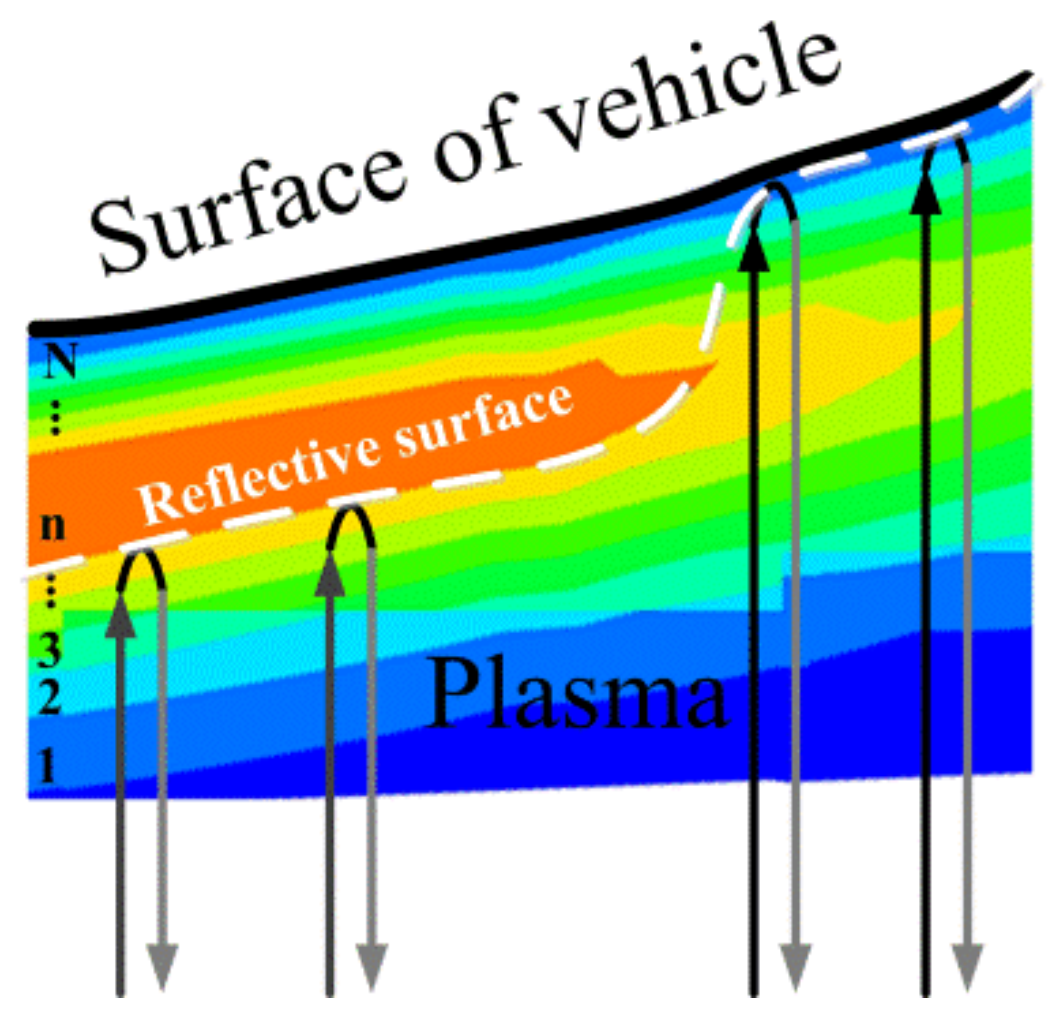
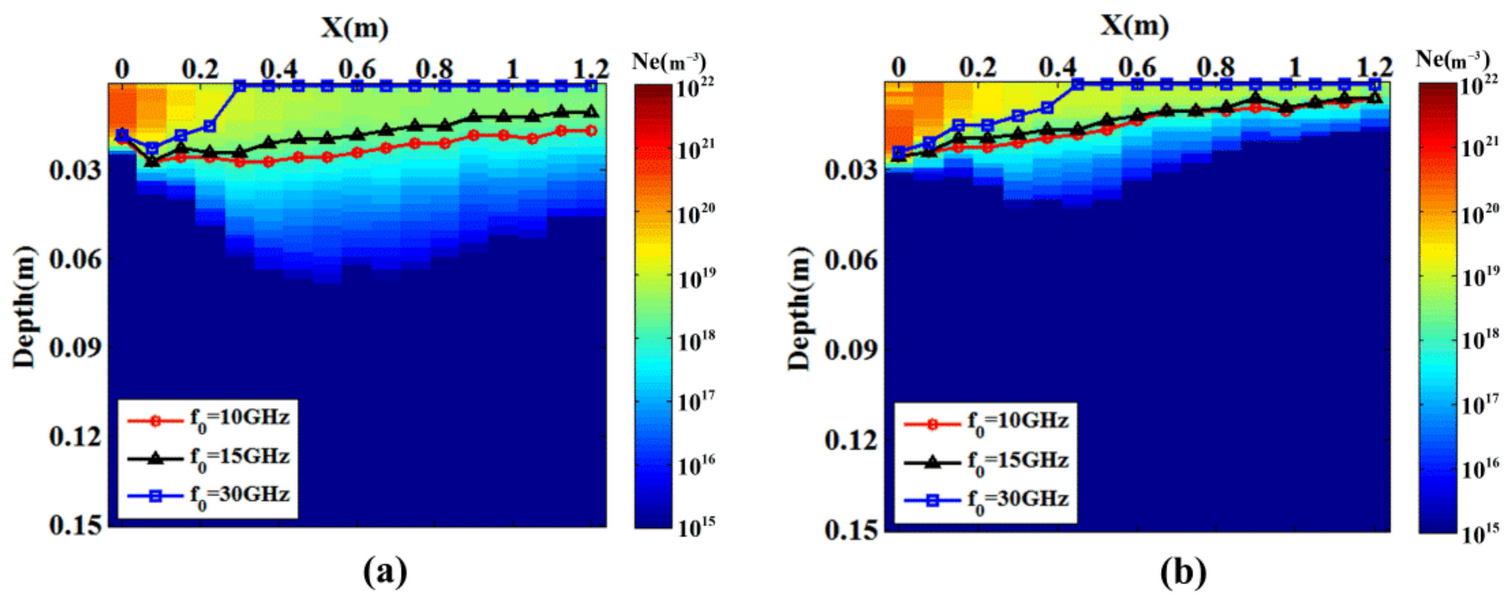
3.1. Reflective Surface in the Plasma Sheath

According to research conducted for the RAM program, the non-uniform plasma sheath can be stratified into a model of uniformly distributed plasma with multiple layers along the vertical direction of the vehicle surface [26]. Figure 8a depicts the bi-Gaussian distribution of the stratified plasma sheath’s electron density. Figure 8b is a schematic depiction of the plasma sheath with multiple layers at the local vehicle surface.
When the plasma is disturbed by the external EM wave, the charged particles in the plasma are displaced and then recover balance. Plasma frequency refers to this dynamic equilibrium frequency. When the frequency of an EM wave is below that of plasma, it cannot penetrate plasma [27]. In the layer of the multiple-layered plasma sheath where the plasma frequency is greater than the EM wave frequency, the EM wave becomes attenuated [16]. The n-th layer plasma frequency can be calculated as follows [28]
f p , n = 1 2 π e 2 N e ε 0 m e ,
where e is the unit charge, m e is the electron mass, ε 0 is the vacuum permittivity, N e is the electron density of the n-th layer plasma.
Figure 9 depicts the incident EM wave’s reflection in plasma. When the incident wave encounters a region with a higher plasma frequency, its propagation is halted, and it can be reflected at a particular depth within the plasma. In regions with a lower plasma frequency, the incident wave is able to pass through all plasma layers and can be reflected by the vehicle. These surfaces that reflect EM waves are referred to as the reflective surface, which is depicted by a white dashed line in Figure 9.
We simulated the reflective surfaces in the plasma sheath using X-band, Ku-band, and Ka-band EM frequencies, which were proportional to the incident depth. Taking into account the incident direction of the radar wave, the reflection of the windward side of the target was analyzed.
Figure 10 illustrates the plasma sheath and reflective surface in scenes 1, 2, and 3. At the stagnation point, the plasma frequency is high, and EM waves cannot penetrate and are instead reflected to a certain depth. When the frequency of EM waves increases in the middle and tail sections, they can travel to a deeper layer. The red, black, and blue lines, respectively, represent the reflective surface of X-band, Ku-band, and Ka-band EM waves. In scene 1, all regions of plasma reflect X-band EM waves. Ku-band EM waves can penetrate the tail section, and Ka-band waves can penetrate the middle section. In scenes 2 and 3, it is apparent that it is easier to penetrate the plasma at a higher the altitude. Meanwhile, the reflective surface is closer to the target’s surface as frequency increases.
Figure 11 shows the reflective surfaces for scenes 4 and 5. The greater the velocity, the thicker the plasma sheath, and the higher the plasma frequency. When the electromagnetic wave enters the plasma sheath, the outer layers of the plasma sheath cut it off and reflect it. All EM waves with three frequencies cannot penetrate the plasma sheath. The reflective surfaces are further from the surface of the target than in Figure 10.
When the attack angle increases, the plasma sheath’s thickness on the windward side decreases dramatically. As illustrated in Figure 12, the reflective surfaces in scenes 6 and 7 are closer to the surface of the target. The plasma sheath is permeable to Ka-band EM waves, while the other two frequencies are reflected.

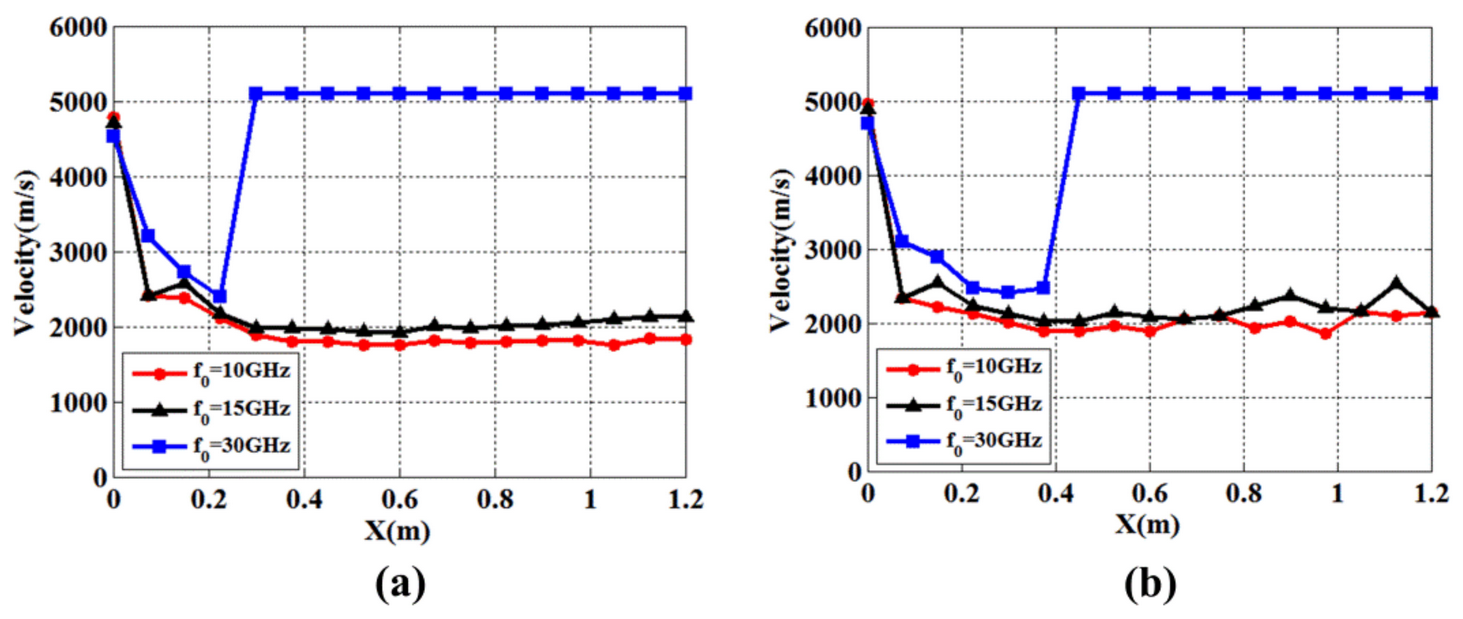
3.2. Velocities of the Reflective Surface

The reflective surface of EM waves contains plasma sheaths of varying depths. According to the distribution of the velocity field, different relative velocities exist at each position of the reflective surface. We can determine the velocities of the reflective surface in the plasma sheath in conjunction with the target’s velocity.
Figure 13 depicts the surface velocities in Scenes 1, 2, and 3 for the X-band, Ku-band, and Ka-band frequencies. The velocity of the stagnation point is comparable to that of the hypersonic target. EM waves penetrate regions with the same velocity as the target. When the altitude reaches 50 km, the velocities of the reflective surface equal those of the target.
Figure 14 illustrates the velocity of the reflective surface in scenes 4 and 5. EM waves cannot penetrate the plasma in the two scenes, and the velocities on the reflective surface are significantly lower than those of the target, except for the stagnation point.
When the attack angle increases, EM waves with a Ka-band can penetrate the plasma sheath. The stagnation point has a significant velocity. Figure 15 depicts the velocities of the reflective surface in scenes 6 and 7.
The velocities of the plasma sheath can be coupled with the echoes of the scattering points in the reflective surface when performing ISAR imaging on a hypersonic target. Therefore, it is necessary to analyze the effect of the velocity of the plasma sheath.

4. Influence of Plasma Sheath on One-Dimensional Range Profile

4.1. The Stop-and-Go Model

Typically, the stop-and-go model is utilized for targets without a plasma sheath. The reflection of the pulse occurs at a stationary point, and the movement in pulse duration is ignored. The radar echo for the linear frequency modulation (LFM) signal can be expressed as
s ( t r , t a ) = k = 1 K r e c t ( t r τ k T p ) exp ( j 2 π f 0 ( t r τ k ) ) exp ( j π μ ( t r τ k ) 2 ) ,
where K denotes the number of scattering points, T p represents the pulse width, f 0 denotes the carrier frequency, t r represents the time in pulse duration being referred to as fast-time, t a is the sampling time of the pulse being referred to as slow-time, and μ is the chirp rate and it is expressed as
μ = B T p ,
where B is the bandwidth, τ k is the echo delay of the k-th scattering point. For the stop-and-go model, echo delay is related to the slow-time, and τ k can be expressed as
τ k = 2 ( R 0 + v t a + r k ) c ,
where R 0 represents the initial radial distance between radar and reference center, v denotes the radial velocity of the hypersonic target, c represents the speed of light, r k denotes the radial distance of the reference center and the k-th scattering point.
Then, we obtain the one-dimensional range profile, which is expressed as x
x ( t r , t a ) = k = 1 K sin c ( μ T p ( t r τ k ) ) exp ( j 2 π τ k f 0 ) .

4.2. The Intra-Pulse Motion Model

The hypersonic velocity of the target is much greater than the speed of sound. The moving distance of the scattering point during the pulse duration must be taken into account, and the stop-and-go model is inapplicable. Due to the presence of plasma sheath, the scattering points on the reflective surface are dispersed. The moving speeds in pulse duration are not identical to the target’s velocity, but they are consistent with the analysis results presented in Section 3.2.
This paper primarily focused on the effect of the velocity field of the plasma sheath, ignoring the amplitude attenuation and phase shift caused by plasma. The radar echo in this instance can be rewritten as [29]
s ^ ( t r , t a ) = k = 1 K r e c t ( t r τ ¯ k T p ) exp ( j 2 π f 0 ( t r τ ¯ k ) ) exp ( j π μ ( t r τ ¯ k ) 2 ) ,
where τ ¯ k is the echo delay including intra-pulse motion, which is expressed as
τ ¯ k = τ k + 2 v ¯ k t r c ,
where v ¯ k represents the velocity of the k-th scattering point. In the penetrated regions, the value of v ¯ k is equal to the target’s velocity. Otherwise, it is the velocity of plasma.
Then, Equation (6) can be rewritten as
s ^ ( t r , t a ) = k = 1 K r e c t ( t r ( τ k + 2 v ¯ k t r c ) T p ) exp ( j 2 π f 0 ( t r ( τ k + 2 v ¯ k t r c ) ) ) exp ( j π μ ( t r ( τ k + 2 v ¯ k t r c ) ) 2 ) .
Suppose η k = 1 2 v ¯ k c , Equation (8) can be expressed as
s ^ ( t r , t a ) = k = 1 K r e c t ( η K t r τ k T p ) exp ( j 2 π f 0 ( η K t r τ k ) ) exp ( j π μ ( η K t r τ k ) 2 ) .
The matched filter function can be expressed as
H ( f r ) = rect ( f r μ T p ) exp ( j π f r 2 μ ) .
Then, by conducting pulse compression for Equation (9), we obtain the pulse compression result which is expressed as
y ¯ ( f r , t a ) = k = 1 K r e c t ( f r 2 v ¯ k f 0 c η k μ T p ) exp ( j 2 π τ k ( f r + f 0 ) ) exp ( j 2 π ( γ 1 + γ 2 + γ 3 ) ) ,
where γ 1 , γ 2 , and γ 3 are new phase terms. They can be calculated by the following Equations:
γ 1 = 2 v ¯ k f 0 c η k 2 μ f r
γ 2 = 1 2 ( 1 μ 1 η k 2 μ ) f r 2
γ 3 = 2 v ¯ k f 0 c η k τ k .
γ 1 represents the linear term of f r and γ 2 denotes the quadratic term of f r . The intra-pulse motion of the scattering points causes displacement and diffusion in a one-dimensional range profile.

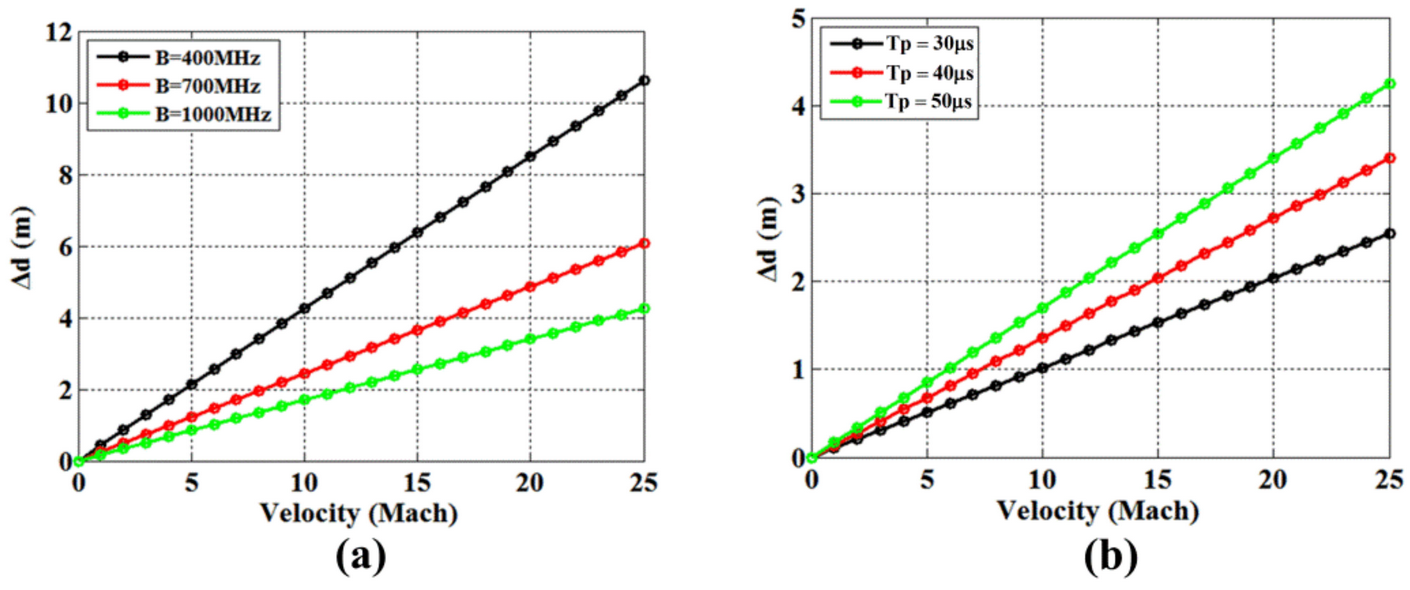
4.3. The Displacement and Diffusion in One-Dimensional Range Profile

By performing inverse Fourier transform on Equation (11), the one-dimensional range profile in the time domain can be expressed as
x ¯ ( t r , t a ) = 2 π ( 1 μ 1 η k 2 μ ) r e c t ( t r τ k 2 v ¯ k f 0 c η k 2 μ ( 1 μ 1 η k 2 μ ) η k μ T p ) exp ( j π ( t r τ k 2 v ¯ k f 0 c η k 2 μ ) 2 ( 1 μ 1 η k 2 μ ) ) exp ( j π 4 v ¯ k f 0 c η k τ k ) .
It can be seen from Equation (15) that the one-dimensional range profile of echo is no longer a sinc function, but a linear frequency modulation function. Comparing with Equation (5), displacement and diffusion occur in a one-dimensional range profile. According to Equation (15), we can obtain the displacement and diffusion by using the following expression
Δ d = 2 v ¯ k f 0 c η k 2 μ c 2 = v ¯ k f 0 T p c 2 ( c 2 v ¯ k ) 2 B ,
Δ w = ( 1 μ 1 η k 2 μ ) η k μ T p c 2 = 2 v ^ k 2 2 v ^ k c c 2 v ^ k T p .
Figure 16 illustrates the displacement and diffusion of the scattering point in a one-dimensional range profile for various radar parameters. In a one-dimensional range profile, the displacement of the scattering point is positively correlated with its velocity, the carrier frequency, and the pulse width, and negatively correlated with the bandwidth. The energy diffusion of the scattering point in a one-dimensional range profile is correlated with the velocity and pulse width of the scattering point.
An analysis of the one-dimensional range profiles of a hypersonic target at three radar frequencies in various scenes was conducted. Figure 17 illustrates the results of scenes 1, 2, and 3. As a point of reference, the green line represents the one-dimensional range profile of the blunt cone model without plasma sheath. The red, black, and blue lines represent the X-band, Ku-band, and Ka-band range profiles of the blunt cone model enveloping plasma sheath, respectively. The displacement of a one-dimensional range profile can be exacerbated by a rise in altitude and frequency. As shown in Figure 17a–c, the stagnation point has the greatest offset, and in some cases, it will be far from other scattering points. As the altitude increases, the diffusion phenomenon in the one-dimensional range profile diminishes, but the displacement problem is worse.
When flight speeds are increased to Mach 20 and Mach 25, similar one-dimensional range profiles are observed. The stagnation point is located on the far left, and the other scattering points have a small offset. As shown in Figure 18, one-dimensional range profiles are stretched and deformed.
With an attack angle, one-dimensional range profiles exhibit frequency-dependent changes. The stagnation point for X-band and Ku-band is separated from other scattering points. All scattering points for Ka-band are manifestly displaced, and there is no issue with stretching. Compared to Figure 19a,b, a larger attack angle makes a greater displacement in one-dimensional range profile.
The anomaly of a one-dimensional range profile will cause a change in the range dimension of the ISAR image, resulting in distortion and defocus of the ISAR image.

5. Simulation Analysis on ISAR Imaging

This section analyzes the simulation results for ISAR imaging of the hypersonic target in various flight scenarios. Figure 20 provides the ISAR image without plasma sheath consideration. Figure 21 depicts the ISAR image of the hypersonic target captured with X-band, Ku-band, and Ka-band radar, respectively, in scenes 1, 2, and 3. In scenes 1 and 2, the X-band radar was used to distinguish the stagnation point from other scattering points. When the radar frequency increased, the scattering points on the target’s middle and tail visibly move, even before the stagnation point. In scene 3, almost all scattering points have the same displacement, and the ISAR image structure changes slightly.
In scenes 4 and 5, the ISAR image distortions are comparable across radar frequencies. As shown in Figure 22, the image was divided into the following two parts: the stagnation point and other scattering points. When flight velocity increases, EM waves are unable to penetrate the plasma sheath, and the stagnation point’s velocity is significantly greater than that of other scattering points. Therefore, the displacement of the point of stagnation is the greatest.
When a hypersonic target has an attack angle, two ISAR image variations occur at distinct radar frequencies, which is shown in Figure 23. The stagnation point for X-band and Ku-band is to the left of other scattering points. For Ka-band, the middle and tail scattering points shift to the left and surround the stagnation point. At this time, the distortion of the ISAR image is more severe.
PSNR and SSIM were used to evaluate the results of ISAR imaging [30] to assess the effect of plasma sheath imposition. We analyzed the optimal frequency selection for the various scenes listed in Table 2 and Table 3. X-band provides the highest image quality in scenes 4, 5, 6, and 7, whereas Ka-band is optimal for scenes 1, 2, and 3. The ISAR imaging effect of a hypersonic target with a Ku-band radar is the worst in contrast. Meanwhile, we determined the standard deviation (SD) of imaging quality at various frequencies. The research indicates that X-band image quality is more consistent across all scenes, whereas Ka-band imaging quality is limited by the scene.

6. Conclusions

This paper investigated the distribution of electron density and velocity field in plasma sheath under various conditions. Taking into account the plasma frequency cut-off effect on incident EM waves, we calculated the reflective surface in every scene using three radar frequencies and obtained the reflective surface velocities. We deduced the echo model of a hypersonic target surrounded by a plasma sheath and analyzed the effect of the scattering point’s coupling velocity on the one-dimensional range profile. Based on the simulation and analysis of the ISAR images of a hypersonic target in three different scenes, we reached the following conclusions:
(1)
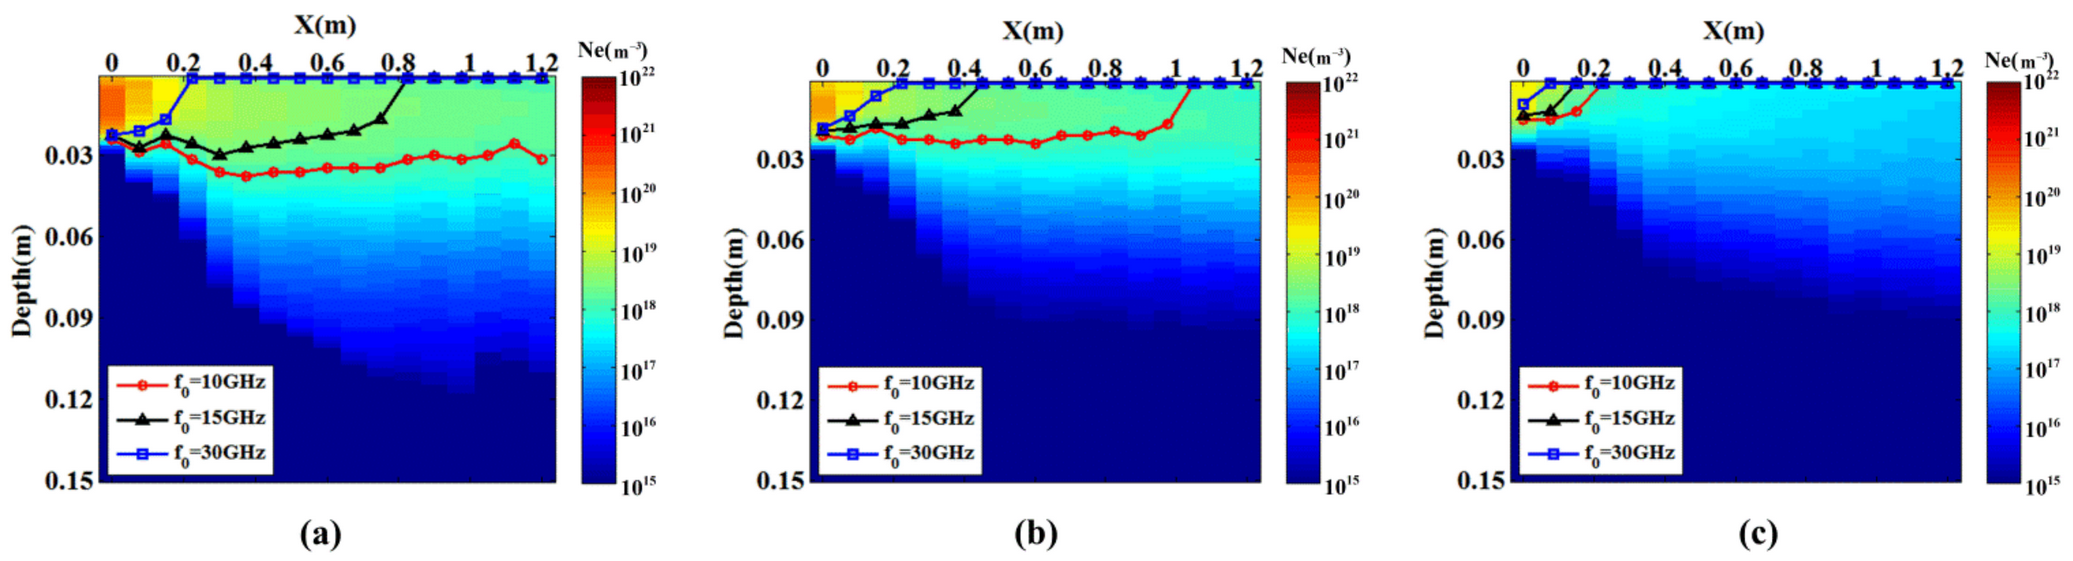
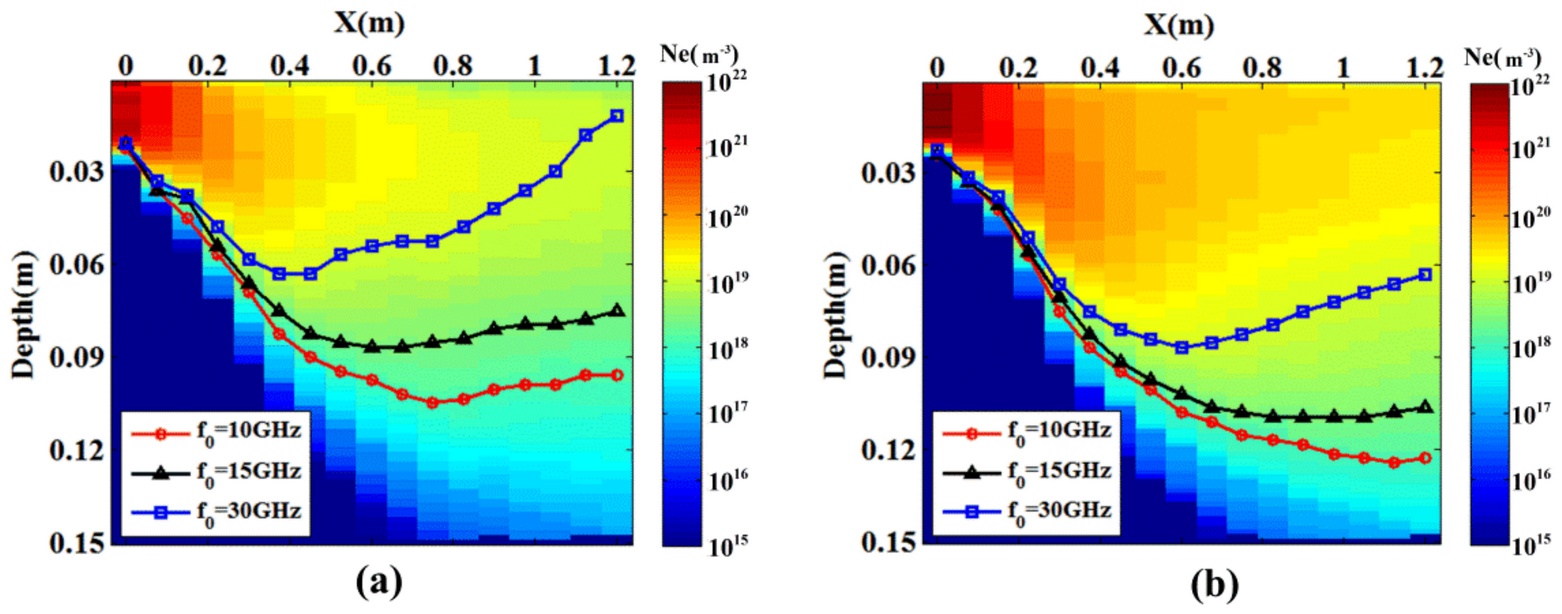
EM waves cannot penetrate plasma if the plasma frequency is greater than their own. For plasma sheaths of hypersonic targets with non-uniform electron density distribution, EM waves are reflected by plasma layers of varying depths to form an irregular reflective surface.
(2)
The incident depth depends on two frequencies, the frequency of incident EM waves and the plasma frequency determined by the electron density. Changes in flight scenes could alter the distribution of electron density, thus affecting the incident depth. Therefore, the flight scene and radar frequency selection both impact the distribution of reflective surfaces.
(3)
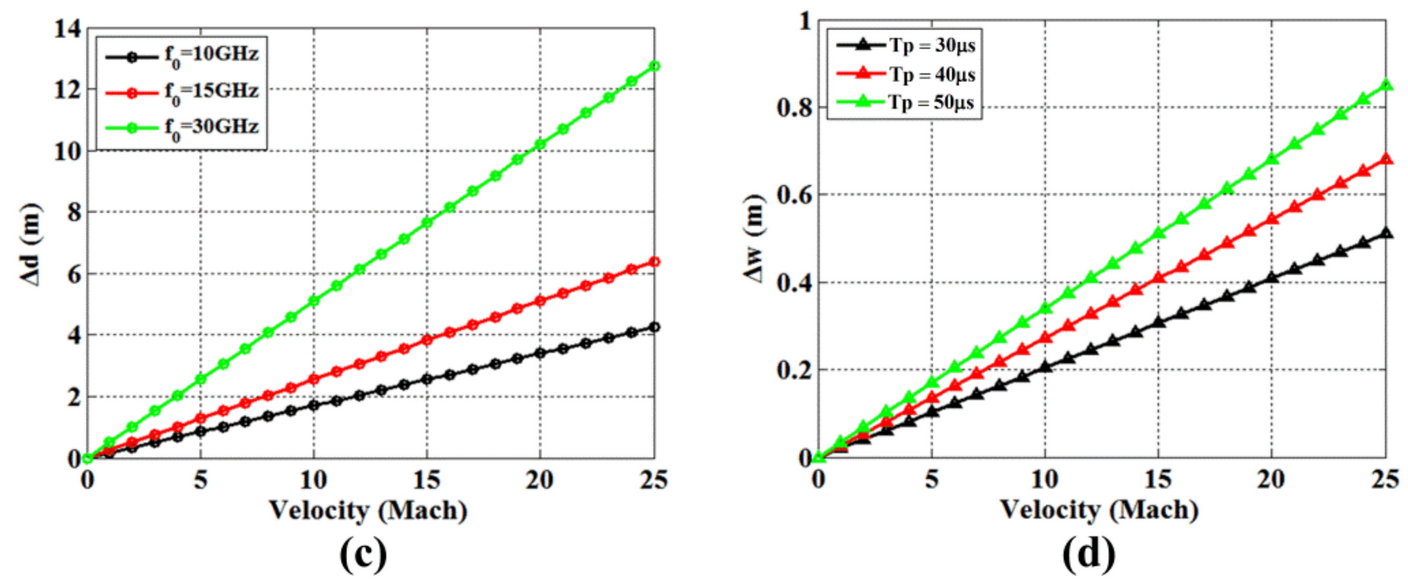
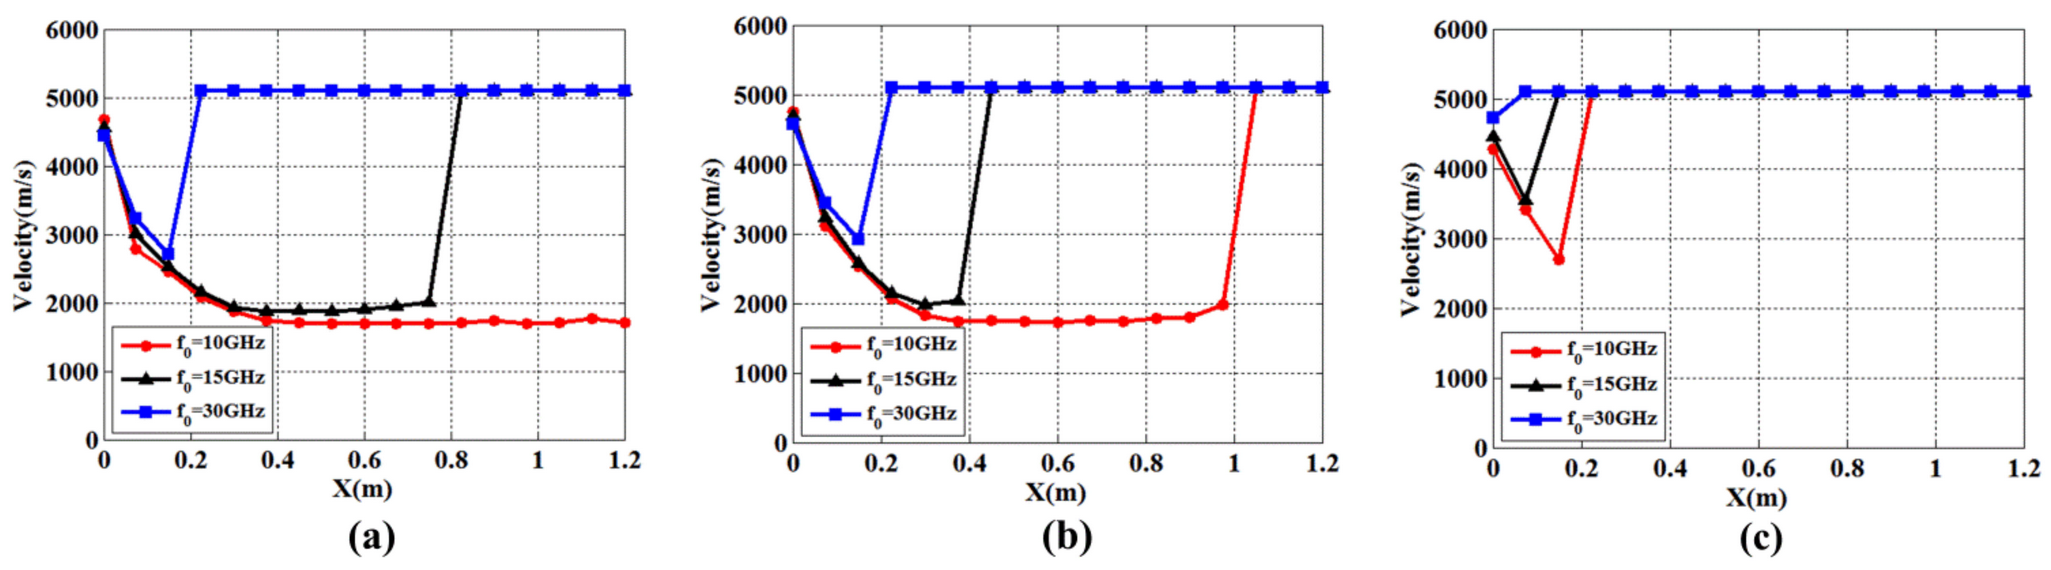
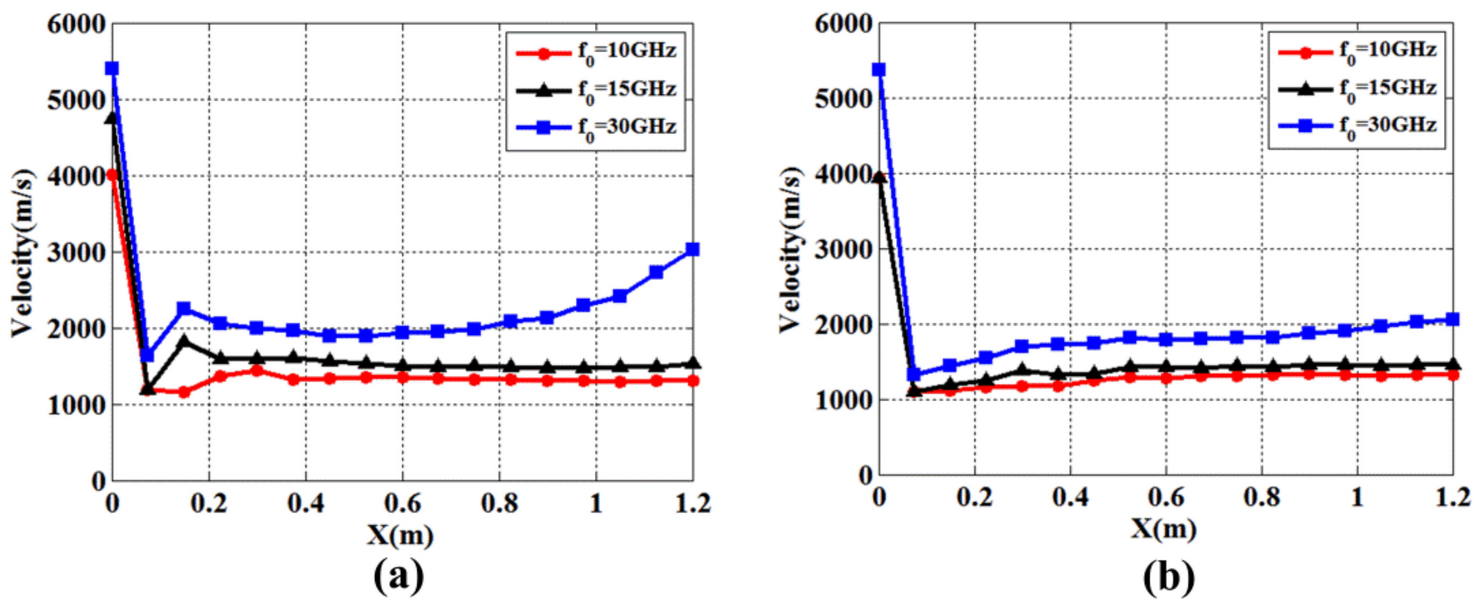
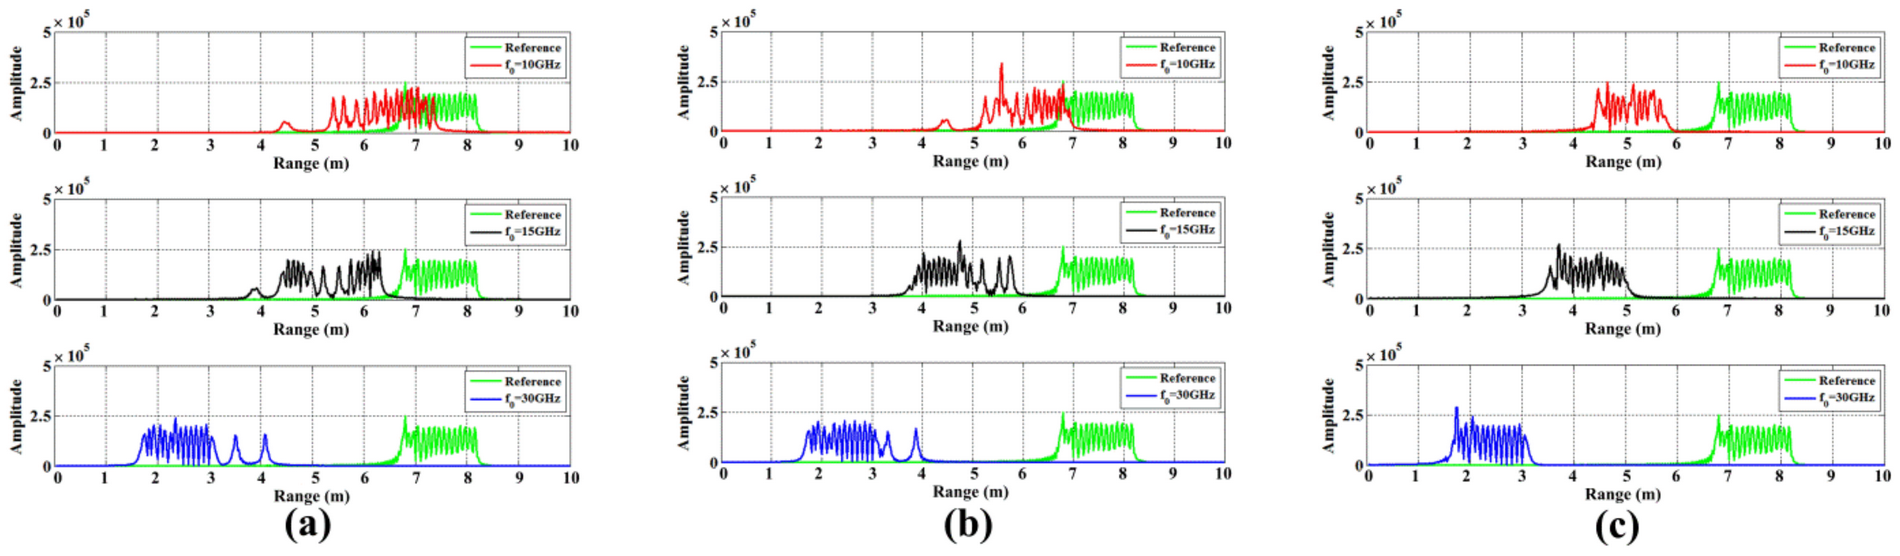
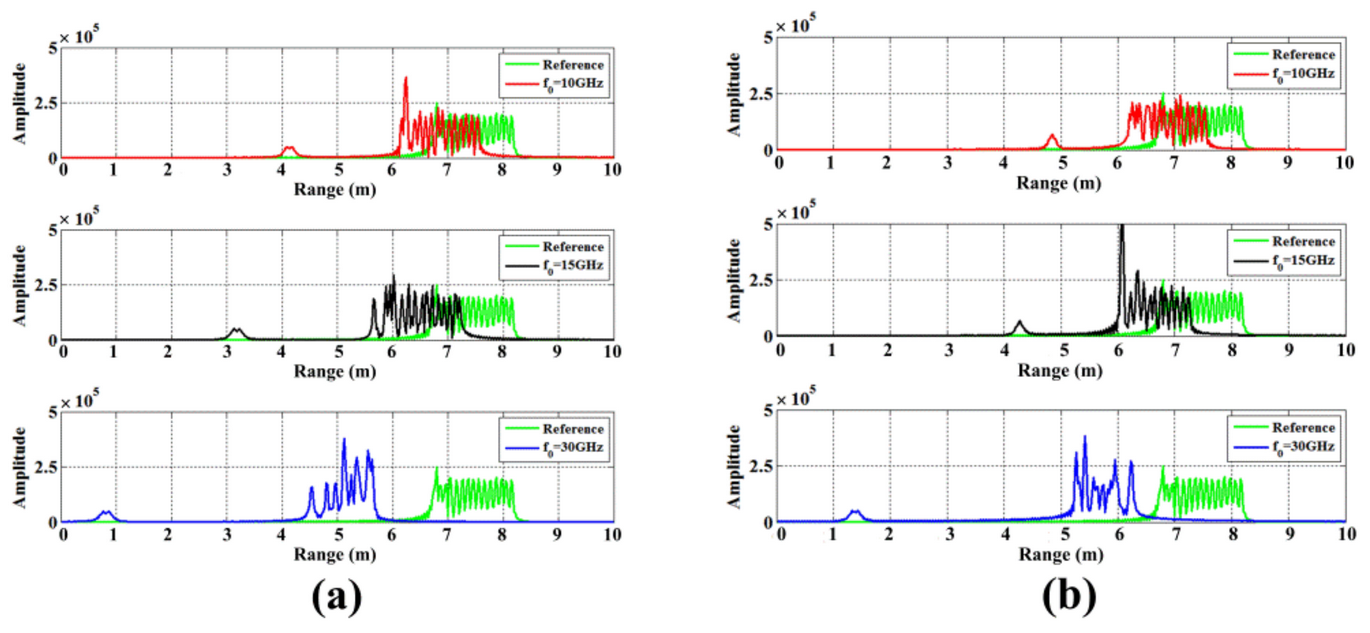
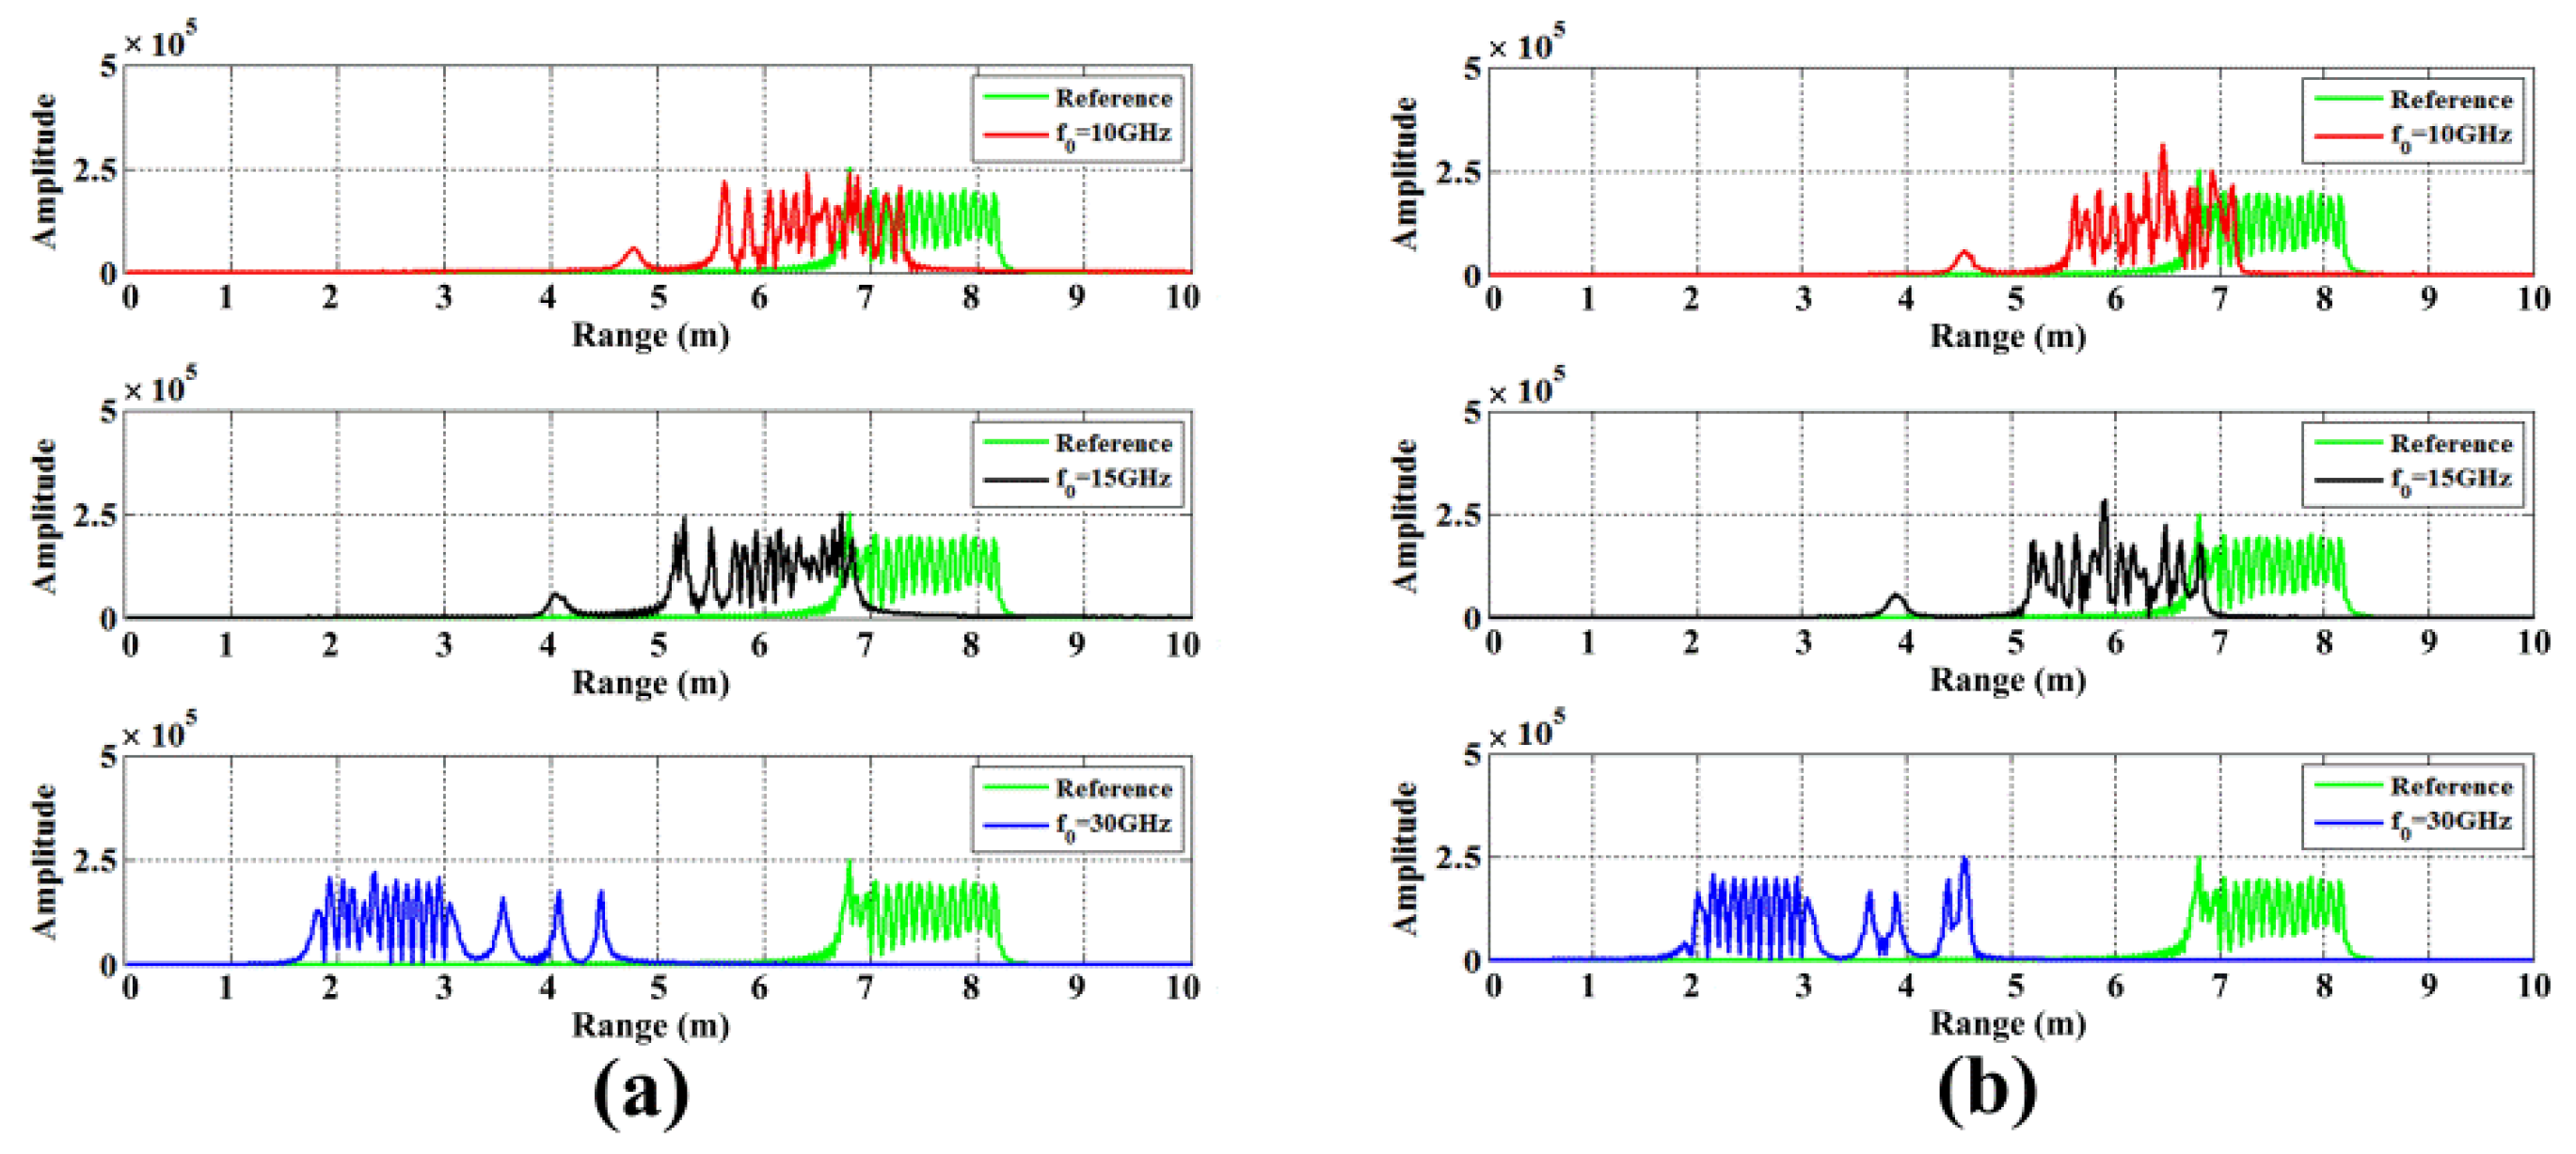
The velocity of the reflective surface is coupled to the radar echo, resulting in varying degrees of displacement and diffusion of the scattering points along with the one-dimensional range profile. Displacement and diffusion have a positive correlation with the coupled velocity and frequency of the EM wave.
(4)
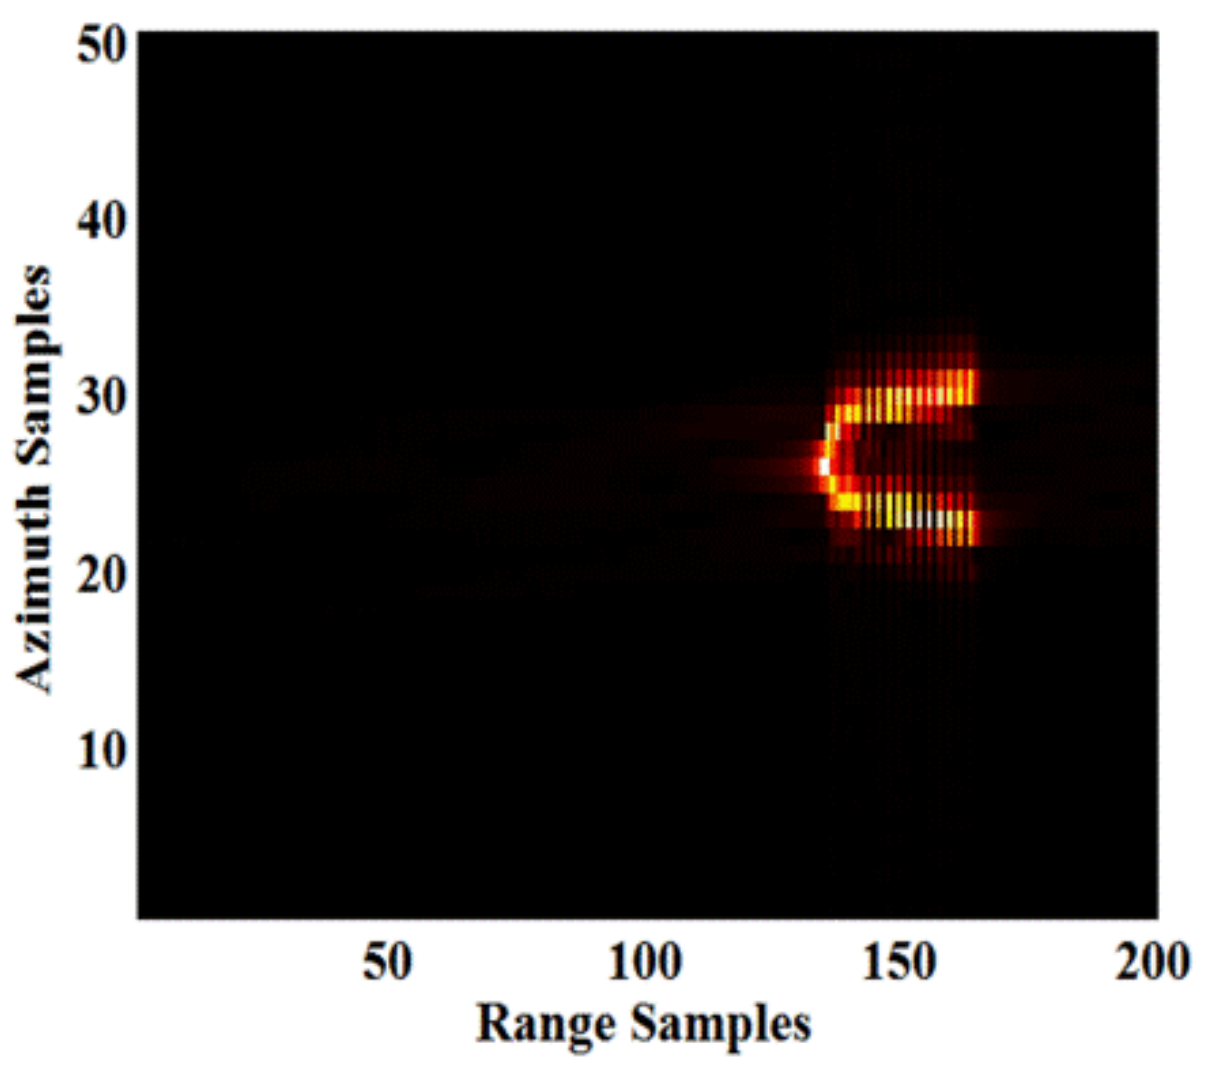
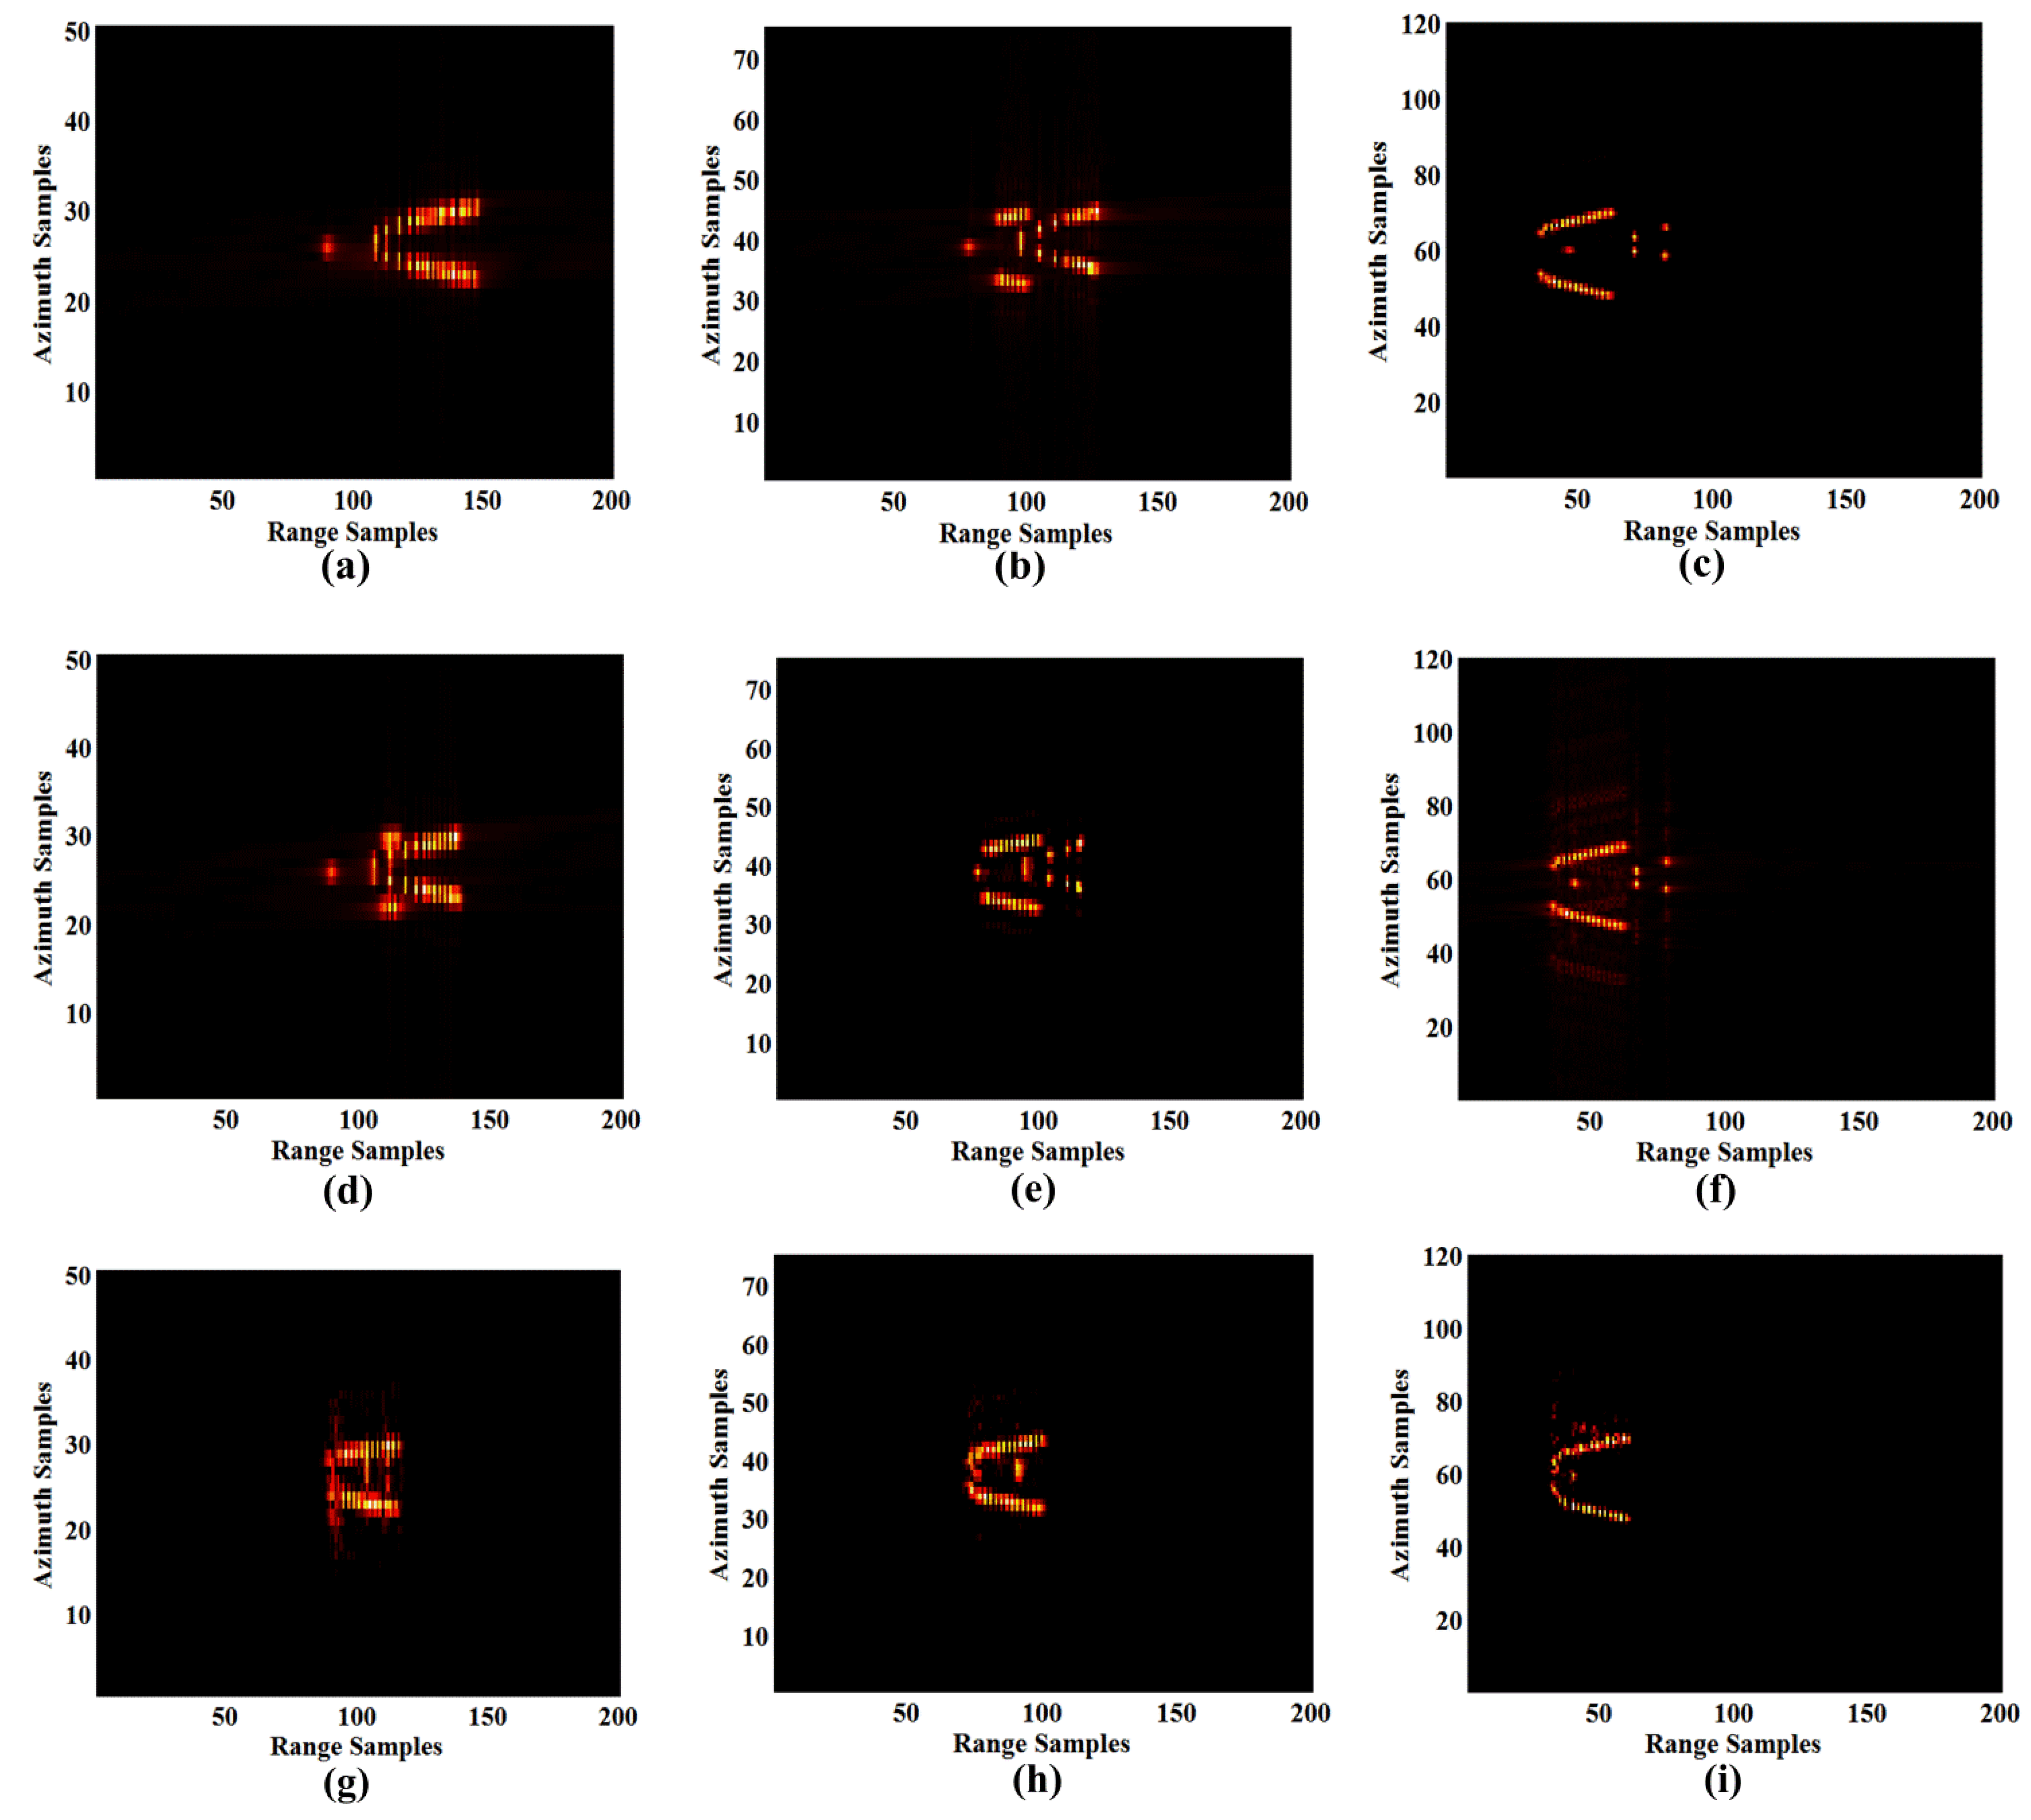
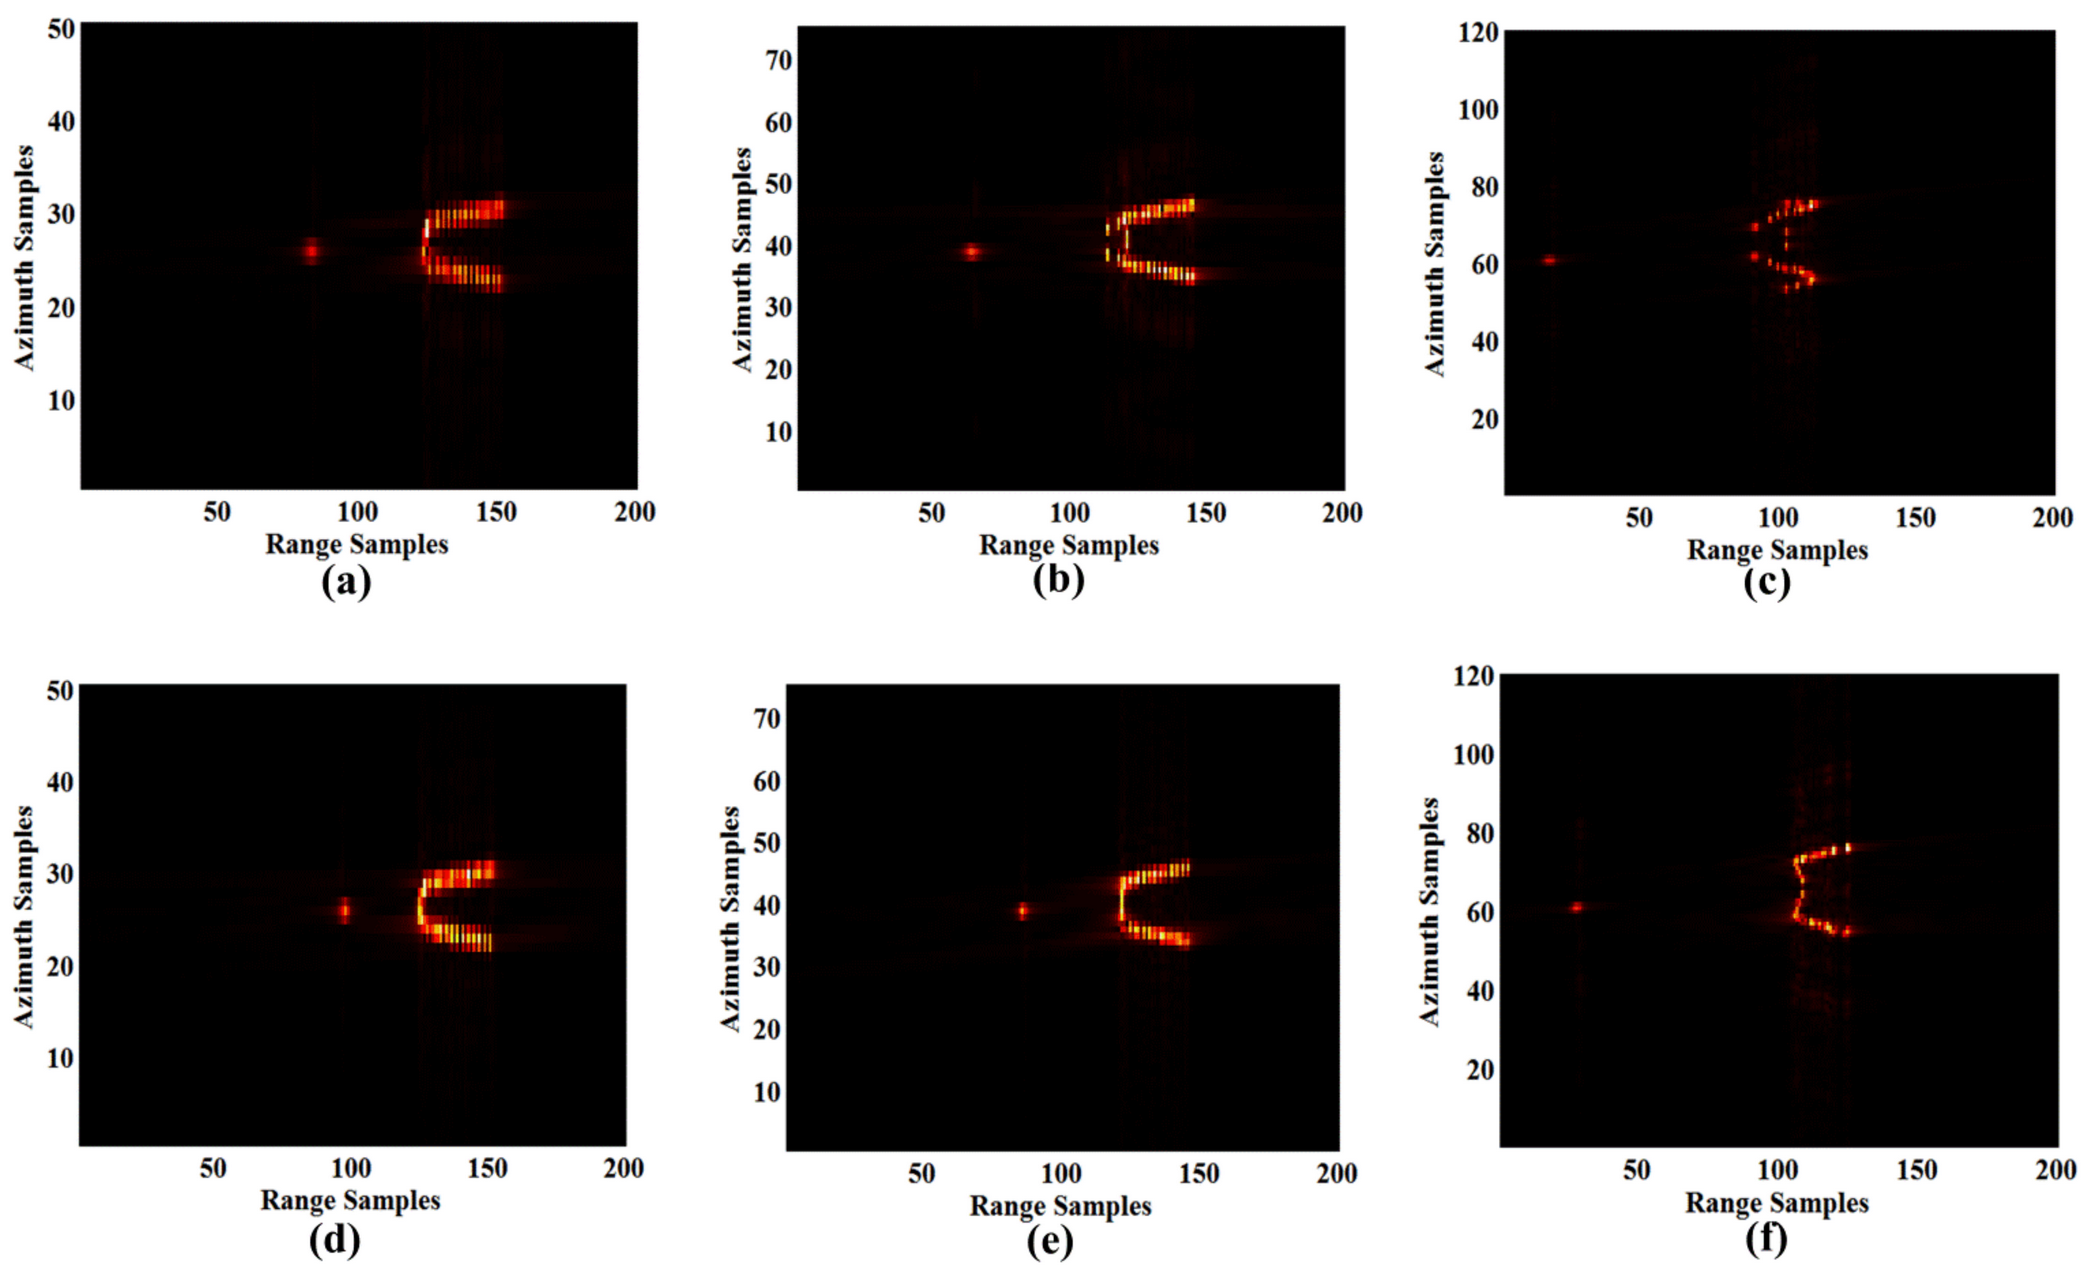
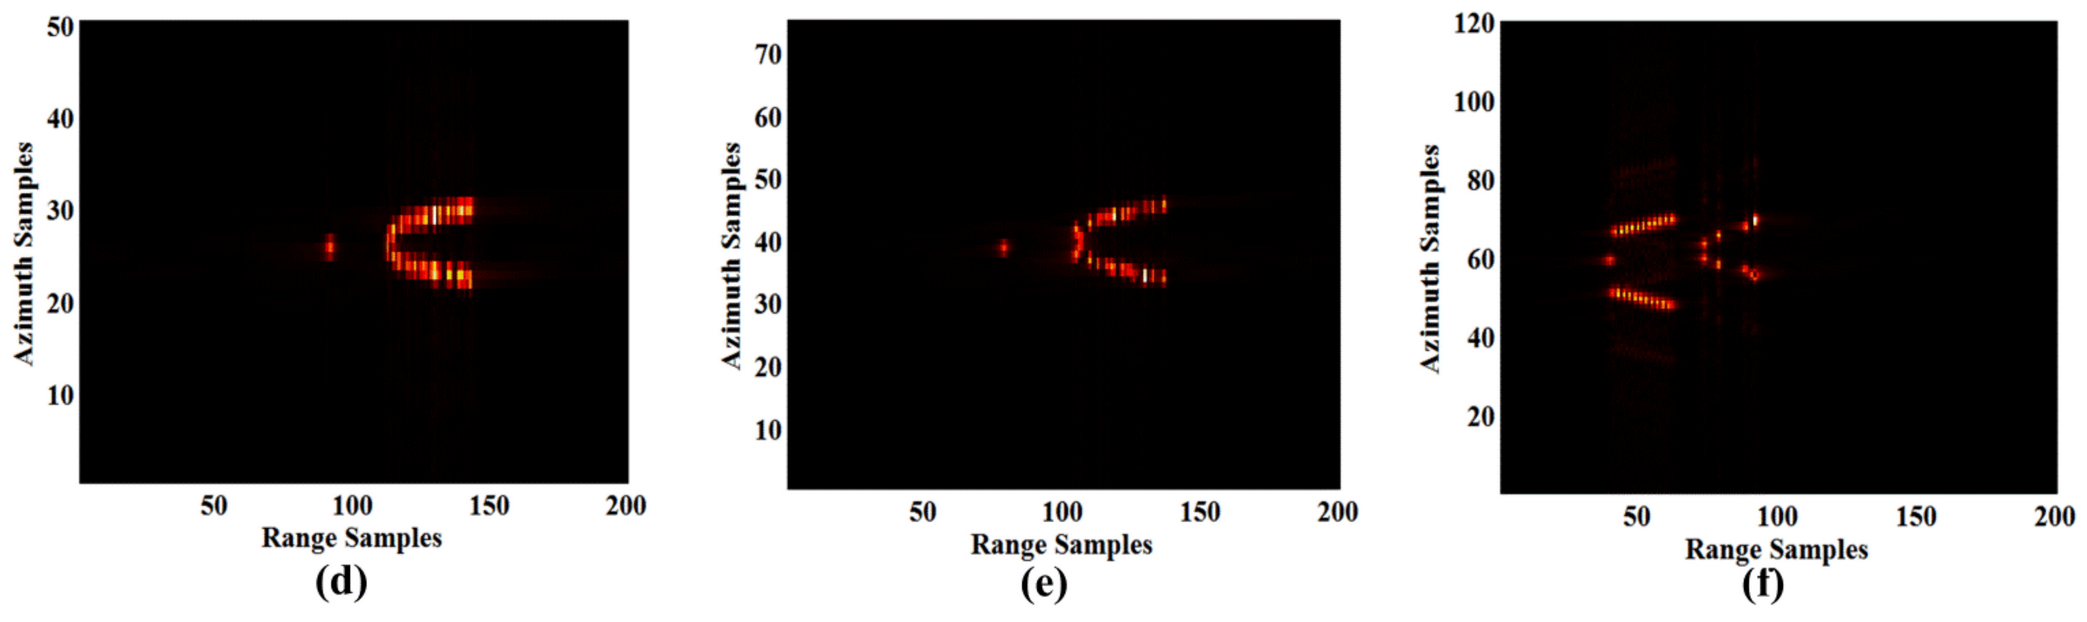
The velocity of the reflective surface stretches the range dimension of the ISAR image. The stagnation point and scattering points in EM-penetrated regions typically experience the greatest displacement.
(5)
The X-band radar provides the best imaging quality for scenes 4, 5, 6, and 7, whereas Ka-band is appropriate for scenes 1, 2, and 3. The ISAR image quality of the X-band radar is more stable in all scenes, whereas the imaging performance of the Ka-band radar is scene-dependent.
The influence of plasma sheath on ISAR images is multifaceted. This paper discussed the effect of the plasma sheath’s velocity field on the change in pulse duration. Future research will concentrate on other mechanisms, laying the theoretical foundation for the ISAR imaging of hypersonic targets and their applications in several fields.

Author Contributions

Data curation, Z.M.; Methodology, B.B.; Project administration, X.L.; Software, X.C.; Writing—original draft, Y.X.; Writing—review & editing, F.S. All authors have read and agreed to the published version of the manuscript.

Funding

This research was funded by National Natural Science Foundation of China, grant number 61871302, 61971330 and 61431010; Innovation Capability Support Program of Shannxi, grant number 2022TD-37 and 2022KJXX-37.

Data Availability Statement

Not applicable.

Conflicts of Interest

The authors declare no conflict of interest.

References

  1. Gupta, R.N.; Lee, K.P.; Moss, J.N.; Sutton, K. Viscous Shock-Layer Solutions with Coupled Radiation and Ablation for Earth Entry. J. Spacecr. Rocket. 1992, 29, 173–181. [Google Scholar] [CrossRef]
  2. Hodara, H. The Use of Magnetic Fields in the Elimination of the Re-Entry Radio Blackout. Proc. IRE 1961, 49, 1825–1830. [Google Scholar] [CrossRef]
  3. Boyd, I.D. Modeling of associative ionization reactions in hypersonic rarefied flows. Phys. Fluids 2007, 19, 3–14. [Google Scholar] [CrossRef] [Green Version]
  4. Chen, X.; Li, K.; Liu, Y.; Zhou, Y.; Li, X. Study of the Influence of Time-Varying Plasma Sheath on Radar Echo Signal. IEEE Trans. Plasma Sci. 2017, 45, 3166–3176. [Google Scholar] [CrossRef]
  5. Zhang, J.; Liu, Z. Electromagnetic Reflection from Conductive Plate Coated with Nonuniform Plasma. Int. J. Infrared Milli. Waves 2007, 28, 71–78. [Google Scholar] [CrossRef]
  6. Li, J.; Guo, L. Research on electromagnetic scattering characteristics of reentry vehicles and blackout forecast model. J. Electromagn. Waves Appl. 2012, 26, 1767–1778. [Google Scholar] [CrossRef]
  7. Bai, B.; Liu, Y.; Lin, X.; Li, X. Effects of a reentry plasma sheath on the beam pointing properties of an array antenna. AIP Adv. 2018, 8, 035023. [Google Scholar]
  8. Chen, X.; Shen, F.; Liu, Y.; Ai, W.; Li, X. Improved Scattering-Matrix Method and Its Application to Analysis of Electromagnetic Wave Reflected by Reentry Plasma Sheath. IEEE Trans. Plasma Sci. 2018, 46, 1755–1767. [Google Scholar] [CrossRef]
  9. Yuan, C.; Zhou, Z.; Sun, H. Reflection Properties of Electromagnetic Wave in a Bounded Plasma Slab. IEEE Trans. Plasma Sci. 2010, 38, 3348–3355. [Google Scholar] [CrossRef]
  10. Zhang, X.; Chen, X.; Liu, Y.; Li, X. Reflection and Absorption Analysis of Obliquely Incident Wave in Reentry Plasma Sheath. In Proceedings of the 2019 IEEE 4th International Conference on Signal and Image Processing (ICSIP), Wuxi, China, 19–21 July 2019; pp. 385–390. [Google Scholar]
  11. Bai, B.; Liu, Y.; Song, L.; Li, X.; Ding, Y.; Zhang, X. Passive Radar Jamming: A Novel Method Using Time-Varying Plasma. IEEE Access 2019, 7, 120082–120088. [Google Scholar] [CrossRef]
  12. Ding, Y.; Bai, B.; Gao, H.; Liu, Y.; Li, X.; Zhao, M. Method of Detecting a Target Enveloped by a Plasma Sheath Based on Doppler Frequency Compensation. IEEE Trans. Plasma Sci. 2020, 48, 4103–4111. [Google Scholar] [CrossRef]
  13. Yang, X.; Wei, B.; Yin, W. Analysis on the Characteristics of EM Waves Propagation in the Plasma Sheath Surrounding a Hypersonic Vehicle. IEEE Trans. Plasma Sci. 2017, 45, 2922–2928. [Google Scholar] [CrossRef]
  14. Zhang, J.; Liu, Y.; Li, X. The study of spatial dispersion effect on electromagnetic waves propagation in the warm non-uniform re-entry plasma sheath. Phys. Plasmas 2020, 27, 022104. [Google Scholar]
  15. Bian, Z.; Li, J.; Guo, L. ISAR Imaging Analysis of a Hypersonic Vehicle Covered with Plasma Sheath. IEEE Trans. Geosci. Remote Sens. 2021, 60, 2002413. [Google Scholar]
  16. Zhang, X.; Liu, Y.; Bai, B.; Li, X.; Shen, F.; Chen, X.; Zhao, L. Establishment of a Wideband Radar Scattering Center Model of a Plasma Sheath. IEEE Access 2019, 7, 140402–140410. [Google Scholar] [CrossRef]
  17. Zhang, Q.; Wu, J.; Yang, J.; Huang, Y.; Yang, H.; Yang, X. Non-Stop-and-Go Echo Model for Hypersonic-Vehicle-Borne Bistatic Forward-Looking Sar. In Proceedings of the IGARSS 2018—2018 IEEE International Geoscience and Remote Sensing Symposium, Valencia, Spain, 22–27 July 2018; pp. 545–548. [Google Scholar]
  18. Xu, X.; Liao, G. MPD model for radar echo signal of hypersonic targets. J. Eng. 2014, 8, 399–406. [Google Scholar]
  19. Farbar, E.; Boyd, I.D.; Kim, M.; Martin, A. Investigation of the Effects of Electron Translational Nonequilibrium on Numerical Predictions of Hypersonic Flow Fields. In Proceedings of the 42nd AIAA Thermophysics Conference, Honolulu, HI, USA, 27–30 June 2011; pp. 2011–3136. [Google Scholar]
  20. Lin, T.C.; Sproul, L.K. Influence of reentry turbulent plasma fluctuation on EM wave propagation. Comput. Fluids 2006, 35, 703–711. [Google Scholar] [CrossRef]
  21. Jones, W.; Cross, A.E. Electrostatic-Probe Measurements of Plasma Parameters for Two Reentry Flight Experiments at 25,000 Feet per Second; NASA Technical Note; National Aeronautics and Space Administration: Washington, DC, USA, 1972; NASA-TN-D-6617.
  22. Shao, C.; Tian, D.; Qian, K.; Chen, W. Numerical Simulation of Weakly Ionized Dynamic Plasma for Reentry Vehicles. J. Spacecr. Rocket. 2016, 53, 900–911. [Google Scholar] [CrossRef]
  23. Rybak, J.; Churchill, R.J. Progress in reentry communications. IEEE Trans. Aerosp. Electron. Syst. 1971, AES-7, 879–894. [Google Scholar] [CrossRef]
  24. Bai, B.; Li, X.; Liu, Y.; Xu, J.; Shi, L.; Xie, K. Effects of Reentry Plasma Sheath on the Polarization Properties of Obliquely Incident EM Waves. IEEE Trans. Plasma Sci. 2014, 42, 3365–3372. [Google Scholar] [CrossRef]
  25. Ding, Y.; Bai, B.; Gao, H. An Analysis of Radar Detection on a Plasma Sheath Covered Reentry Target. IEEE Trans. Aerosp. Electron. Syst. 2021, 57, 4255–4268. [Google Scholar] [CrossRef]
  26. Yao, B.; Li, X.; Shi, L.; Liu, Y.; Bai, B. A layered fluctuation model of electron density in plasma sheath and instability effect on electromagnetic wave at Ka band. Aerosp. Sci. Technol. 2018, 78, 480–487. [Google Scholar] [CrossRef]
  27. Chen, X.; Shen, F.; Liu, Y.; Ai, W.; Li, X. Study of plasma-based stable and ultra-wideband electromagnetic wave absorption for stealth application. Plasma Sci. Technol. 2018, 20, 065503. [Google Scholar] [CrossRef] [Green Version]
  28. Kalluri, D.K.; Goteti, V.R.; Sessler, A.M. WKB solution for wave propagation in a time-varying magnetoplasma medium: Longitudinal propagation. IEEE Trans. Plasma Sci. 1993, 21, 70–76. [Google Scholar] [CrossRef]
  29. Bao, Z.; Xing, M.D.; Wang, T. Radar Imaging Technology; Publishing House of Electronics Industry: Beijing, China, 2005; pp. 26–30. [Google Scholar]
  30. Horé, A.; Ziou, D. Image quality metrics: PSNR vs. SSIM. In Proceedings of the 2010 20th International Conference on Pattern Recognition, Istanbul, Turkey, 23–26 August 2010; pp. 2366–2369. [Google Scholar]
Figure 1. Geometry parameters of the blunt cone.
Remotesensing 14 03799 g001
Figure 2. The electron density distribution in scenes 1, 2, and 3. (a) Altitude is 30 km. (b) Altitude is 40 km. (c) Altitude is 50 km.
Remotesensing 14 03799 g002
Figure 3. The electron density distribution in scenes 4 and 5. (a) Velocity is Mach 20. (b) Velocity is Mach 25.
Remotesensing 14 03799 g003
Figure 4. The electron density distribution in scenes 6 and 7. (a) Attack angle is 10°. (b) Attack angle is 20°.
Remotesensing 14 03799 g004
Figure 5. The velocity field distribution in scenes 1, 2, and 3. (a) Altitude is 30 km. (b) Altitude is 40 km. (c) Altitude is 50 km.
Remotesensing 14 03799 g005
Figure 6. The velocity field distribution in scenes 4 and 5. (a) Velocity is Mach 20. (b) Velocity is Mach 25.
Remotesensing 14 03799 g006
Figure 7. The velocity field distribution in scenes 6 and 7. (a) Attack angle is 10°. (b) Attack angle is 20°.
Remotesensing 14 03799 g007
Figure 8. Schematic diagram of the electron density and the multiple-layered plasma sheath. (a) The bi-Gaussian distribution of the stratified plasma sheath’s electron density. (b) Schematic depiction of the plasma sheath with multiple layers at the local vehicle surface.
Remotesensing 14 03799 g008
Figure 9. Reflective surface of EM wave in plasma.
Remotesensing 14 03799 g009
Figure 10. The reflective surface of plasma sheath for scenes 1, 2, and 3. (a) Altitude is 30 km. (b) Altitude is 40 km. (c) Altitude is 50 km.
Remotesensing 14 03799 g010
Figure 11. The reflective surface of plasma sheath for scenes 4 and 5. (a) Velocity is Mach 20. (b) Velocity is Mach 25.
Remotesensing 14 03799 g011
Figure 12. The reflective surface of plasma sheath for scenes 6 and 7. (a) Attack angle is 10°. (b) Attack angle is 20°.
Remotesensing 14 03799 g012
Figure 13. The velocities on the reflective surface of plasma sheath in scenes 1, 2, and 3. (a) Altitude is 30 km. (b) Altitude is 40 km. (c) Altitude is 50 km.
Remotesensing 14 03799 g013
Figure 14. The velocities on the reflective surface of plasma sheath in scenes 4 and 5. (a) Velocity is Mach 20. (b) Velocity is Mach 25.
Remotesensing 14 03799 g014
Figure 15. The velocities on the reflective surface of plasma sheath in scenes 6 and 7. (a) Attack angle is 10°. (b) Attack angle is 20°.
Remotesensing 14 03799 g015
Figure 16. The displacement and diffusion of the scattering point in a one-dimensional range profile with different radar parameters. (a) The displacement when f 0 = 10   GHz and T p = 50   μ s . (b) The displacement when f 0 = 10   GHz and B = 1   GHz . (c) The displacement when T p = 50   μ s and B = 1   GHz . (d) The diffusion with different pulse widths.
Remotesensing 14 03799 g016aRemotesensing 14 03799 g016b
Figure 17. One-dimensional range profiles of the hypersonic target in scenes 1, 2, and 3. (a) Altitude is 30 km. (b) Altitude is 40 km. (c) Altitude is 50 km.
Remotesensing 14 03799 g017
Figure 18. One-dimensional range profiles of the hypersonic target in scenes 4 and 5. (a) Velocity is Mach 20. (b) Velocity is Mach 25.
Remotesensing 14 03799 g018
Figure 19. One dimensional range profiles of the hypersonic target in scenes 6 and 7. (a) Attack angle is 10°. (b) Attack angle is 20°.
Remotesensing 14 03799 g019
Figure 20. ISAR image of the hypersonic target without considering the plasma sheath.
Remotesensing 14 03799 g020
Figure 21. ISAR image of the hypersonic target in scenes 1, 2, and 3 using X-band, Ku-band, and Ka-band radar. (a) X-band in scene 1. (b) Ku-band in scene 1. (c) Ka-band in scene 1. (d) X-band in scene 2. (e) Ku-band in scene 2. (f) Ka-band in scene 2. (g) X-band in scene 3. (h) Ku-band in scene 3. (i) Ka-band in scene 3.
Remotesensing 14 03799 g021
Figure 22. ISAR image of the hypersonic target in scenes 4 and 5 using X-band, Ku-band, and Ka-band radar. (a) X-band in scene 4. (b) Ku-band in scene 4. (c) Ka-band in scene 4. (d) X-band in scene 5. (e) Ku-band in scene 5. (f) Ka-band in scene 5.
Remotesensing 14 03799 g022
Figure 23. ISAR image of the hypersonic target in scenes 6 and 7 using X-band, Ku-band, and Ka-band radar. (a) X-band in scene 6. (b) Ku-band in scene 6. (c) Ka-band in scene 6. (d) X-band in scene 7. (e) Ku-band in scene 7. (f) Ka-band in scene 7.
Remotesensing 14 03799 g023aRemotesensing 14 03799 g023b
Table 1. Flight scenes of the hypersonic target.
SceneAltitudeVelocityAttack Angle
130 kmMach 15
240 kmMach 15
350 kmMach 15
430 kmMach 20
530 kmMach 25
630 kmMach 1510°
730 kmMach 1520°
Table 2. PSNR evaluation results of ISAR image.
SceneX-BandKu-BandKa-Band
126.85 dB25.77 dB28.12 dB
226.43 dB26.48 dB28.86 dB
325.62 dB26.60 dB28.43 dB
428.61 dB25.35 dB24.85 dB
528.80 dB26.52 dB24.49 dB
627.37 dB25.89 dB25.23 dB
727.53 dB26.34 dB25.78 dB
SD1.14 dB0.47 dB1.86 dB
Table 3. SSIM evaluation results of ISAR image.
SceneX-BandKu-BandKa-Band
10.6830.4350.711
20.6580.5260.718
30.5850.5530.714
40.7770.3980.285
50.8280.4980.298
60.7160.4820.489
70.7210.5010.487
SD0.0790.0530.191
Publisher’s Note: MDPI stays neutral with regard to jurisdictional claims in published maps and institutional affiliations.

