Article

Constructing High-Resolution (10 km) Daily Diffuse Solar Radiation Dataset across China during 1982–2020 through Ensemble Model

1
Hunan Key Laboratory of Remote Sensing of Ecological Environment in Dongting Lake Area, School of Geography and Information Engineering, China University of Geosciences, Wuhan 430074, China
2
Key Laboratory of Regional Ecology and Environmental Change, School of Geography and Information Engineering, China University of Geosciences, Wuhan 430074, China
*
Author to whom correspondence should be addressed.
Remote Sens. 2022, 14(15), 3695; https://doi.org/10.3390/rs14153695
Submission received: 8 June 2022 / Revised: 18 July 2022 / Accepted: 27 July 2022 / Published: 2 August 2022
(This article belongs to the Special Issue Artificial Intelligence in Remote Sensing of Atmospheric Environment)

Abstract

:
Diffuse solar radiation is an essential component of surface solar radiation that contributes to carbon sequestration, photovoltaic power generation, and renewable energy production in terrestrial ecosystems. We constructed a 39-year (1982–2020) daily diffuse solar radiation dataset (CHSSDR), using ERA5 and MERRA_2 reanalysis data, with a spatial resolution of 10 km through a developed ensemble model (generalized additive models, GAM). The validation results, with ground-based measurements, showed that GAM had a high and stable performance with the correlation coefficient (R), root-mean-square error (RMSE), and mean absolute error (MAE) for the sample-based cross-validations of 0.88, 19.54 Wm−2, and 14.87 Wm−2, respectively. CHSSDR had the highest consistency with ground-based measurements among the four diffuse solar radiation products (CERES, ERA5, JiEA, and CHSSDR), with the least deviation (MAE = 15.06 Wm−2 and RMSE = 20.22 Wm−2) and highest R value (0.87). The diffuse solar radiation values in China range from 59.13 to 104.65 Wm−2, with a multi-year average value of 79.39 Wm−2 from 1982 to 2020. Generally, low latitude and low altitude regions have larger diffuse solar radiation than high latitude and high altitude regions, and eastern China has less diffuse solar radiation than western China. This dataset would be valuable for analyzing regional climate change, photovoltaic applications, and solar energy resources. The dataset is freely available from figshare.

Graphical Abstract

1. Introduction

Diffuse solar radiation, as an important ingredient of surface solar radiation, is highly sensitive to solar elevation angle, aerosols, cloud, water vapor, surface conditions, and so on [1,2]. Previous studies revealed that diffuse solar radiation contributes to the ecosystem’s carbon uptake and regional radiation usage by increasing the canopy light use efficiency [3,4,5]. When the proportion of diffuse solar radiation to solar radiation increases, it improves the photosynthetic efficiency of plants to increase productivity [2,6]. Additionally, diffuse solar radiation is a necessary input for simulating the productivity of terrestrial ecosystems, such as the forest biomass, assimilation, allocation, and respiration (FöBAAR) model [7]. In addition, the distribution and intensity of diffuse solar radiation are necessary for both the location selection of solar photovoltaic power and further estimation of power generation [8].
Ground-based observation sites can provide stable and accurate measurements of diffuse solar radiation, but the observation equipment is usually expensive to construct and maintain. At present, only 17 of the Chinese 119 ground-based observation stations can provide diffuse solar radiation observations, and these stations have different starting times, thus making it difficult to capture the distribution of diffuse solar radiation in detail. In contrast, satellite remote sensing provides a unique perspective [9] and has been demonstrated to be a reliable method for monitoring geographical and temporal fluctuations in diffuse solar radiation at global and regional scales [10]. The Heliosat model [11,12], cloud index methods [13], Meteonom database [14], and EU-PVGIS [14] are now the most commonly used approaches for retrieving diffuse solar radiation from satellite remote sensing. However, the satellite data quality is vulnerable to spurious variations, due to satellite variations, sensor calibration, and undetected low clouds. Using atmospheric and surface products of satellite remote sensing or their observed radiant brightness signals to retrieve diffuse solar radiation can be achieved independently of landmark circumstances [15], thus enabling the capture of large-scale simultaneous and continuous diffuse solar radiation data [16], for example, multi-functional transport satellites (MTSAT) [17,18,19], moderate-resolution imaging spectro-radiometer (MODIS) [18,20], meteosat [21,22,23], advanced very high-resolution radiometer (AVHRR) [24], landsat [25], Himawari-8 [26], etc.
Numerous algorithms have been proposed to derive diffuse solar radiation from satellite products using ancillary data (e.g., atmospheric parameters and reanalysis data). The empirical statistical models [27,28,29] assume that diffuse solar radiation and meteorological variables such as sunshine duration, temperature, precipitation, and relative humidity have a mathematical relationship. For example, Sabzpooshani and Mohammadi [30] examined the applicability of 16 empirical models in Iran, thus concluding that the sunshine duration was more essential than the clear-sky index in predicting diffuse solar radiation. Zhou et al. [31] found that adding precipitation as the input parameters of the diffuse solar radiation model could significantly enhance prediction accuracy. The physical models [32,33] relate diffuse solar radiation to various atmospheric processes using radiative transfer theory, which can be separated into broadband and spectral models. Leckner [34] developed a spectral model for estimating diffuse solar radiation, considering the major spectral transmittances of solar radiation in the atmosphere, such as Rayleigh scattering, ozone absorption, absorption by uniformly gases, aerosol extinction, and water vapor absorption. Gueymard [35,36] proposed the REST2 model, which was based on the SMARTS spectral model. Results showed that REST2 performed well in predicting solar radiation. Machine learning (ML) [37,38,39], as a subset of artificial intelligence, can automatically learn and handle nonlinear and complex problems, thus showing superior performance [40,41]. Recently, various ML algorithms have been used to estimate diffuse solar radiation for improving prediction accuracy, such as artificial neural network (ANN) [15,18,37], deep learning [17,38,42], gradient boosting decision tree (GBDT) [15,24], eXtreme gradient boosting (XGB) [43,44], random forest (RF) [45,46], support vector machine (SVM) (named SVR when used for regression) [23,45,47], adaptive network-based fuzzy inference system (ANFIS) [48,49], etc. For example, Jiang et al. [17] combined convolutional neural network (CNN) and multi-layer perceptron (MLP) to estimate diffuse solar radiation using MTSAT data, with an R value of 0.89. Shamshirband et al. [47] developed an SVM-wavelet transform (WT) model for predicting daily diffuse solar radiation by coupling the SVM with the WT. The results revealed that the SVM-WT outperformed SVM, ANN, and third-order empirical models, with an R value of 0.963. Ouarda et al. [22] employed generalized additive models (GAM) to assess the diffuse, and global solar components in the United Arab Emirates using Meteosat data. Results showed that GAM outperformed the ANN-based model and the bagging ensemble.
On this foundation, numerous diffuse solar radiation datasets/products have been proposed for further studies. For example, Sanchez-Lorenzo et al. [50] developed a new dataset of surface solar radiation records (including diffuse solar radiation) and analyzed the characteristics of the radiation from 1985 to 2010 in Spain. Jiang et al. [17] constructed a 12-year (2007–2018) hourly diffuse solar radiation dataset, with a spatial resolution of 5 km, via a deep learning algorithm. These dataset’s time series, however, are too short to satisfy the needs of climate change study. In addition, SARAH-E, PV-GIS, ERA5, Solcast, and CERES all supply diffuse solar radiation data at different scales. However, these diffuse solar radiation products are subject to large uncertainties, with root-mean-square error (RMSE) of the instantaneous inversions under all-weather conditions ranging from 60 to 140 Wm−2, depending on the local cloudiness [51,52,53]. Meanwhile, the application of multi-source products in studying “solar brightening/dimming” and changes in regional climate characteristics over long time series may be hampered by the occurrence of poor spatial and temporal continuity in these products. Recently, there is a growing interest in constructing surface solar radiation datasets, but the research to generate a diffuse solar radiation dataset with long time series, high-resolution, and spatio-temporal continuity in China has yet to be completed.
The primary objective of this study is to construct a high-resolution (10 km) gridded and gapless diffuse solar radiation dataset (CHSSDR) for China spanning 39 years (1982–2020), using ERA5 and MERRA_2 reanalysis data through a developed ensemble model aimed at helping the solar industry’s development in China. Meanwhile, we compared the diffuse solar radiation dataset generated in this study with the existing diffuse solar radiation products using ground-based observations for validation. Finally, the spatial and temporal variation characteristics of diffuse solar radiation were examined, based on the CHSSDR dataset in China. Section 2 summarizes the data sets used, processing methods, and ML models. Section 3 presents the validation and comparison results. Section 4 summarizes this study. This dataset would be valuable for investigating the geographical characteristics and temporal cycles of solar radiation, as well as radiation-related applications, such as climate change and solar energy consumption.

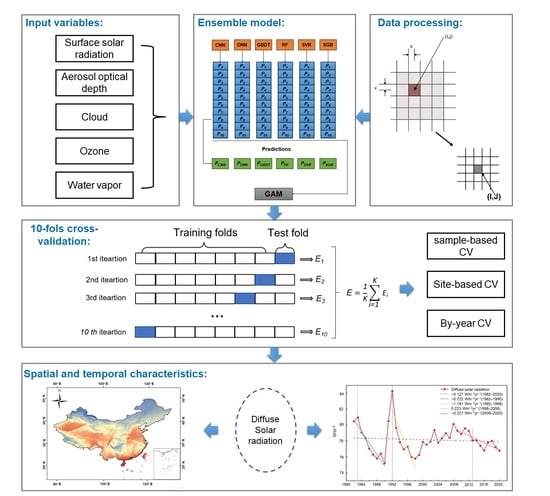
2. Materials and Methods

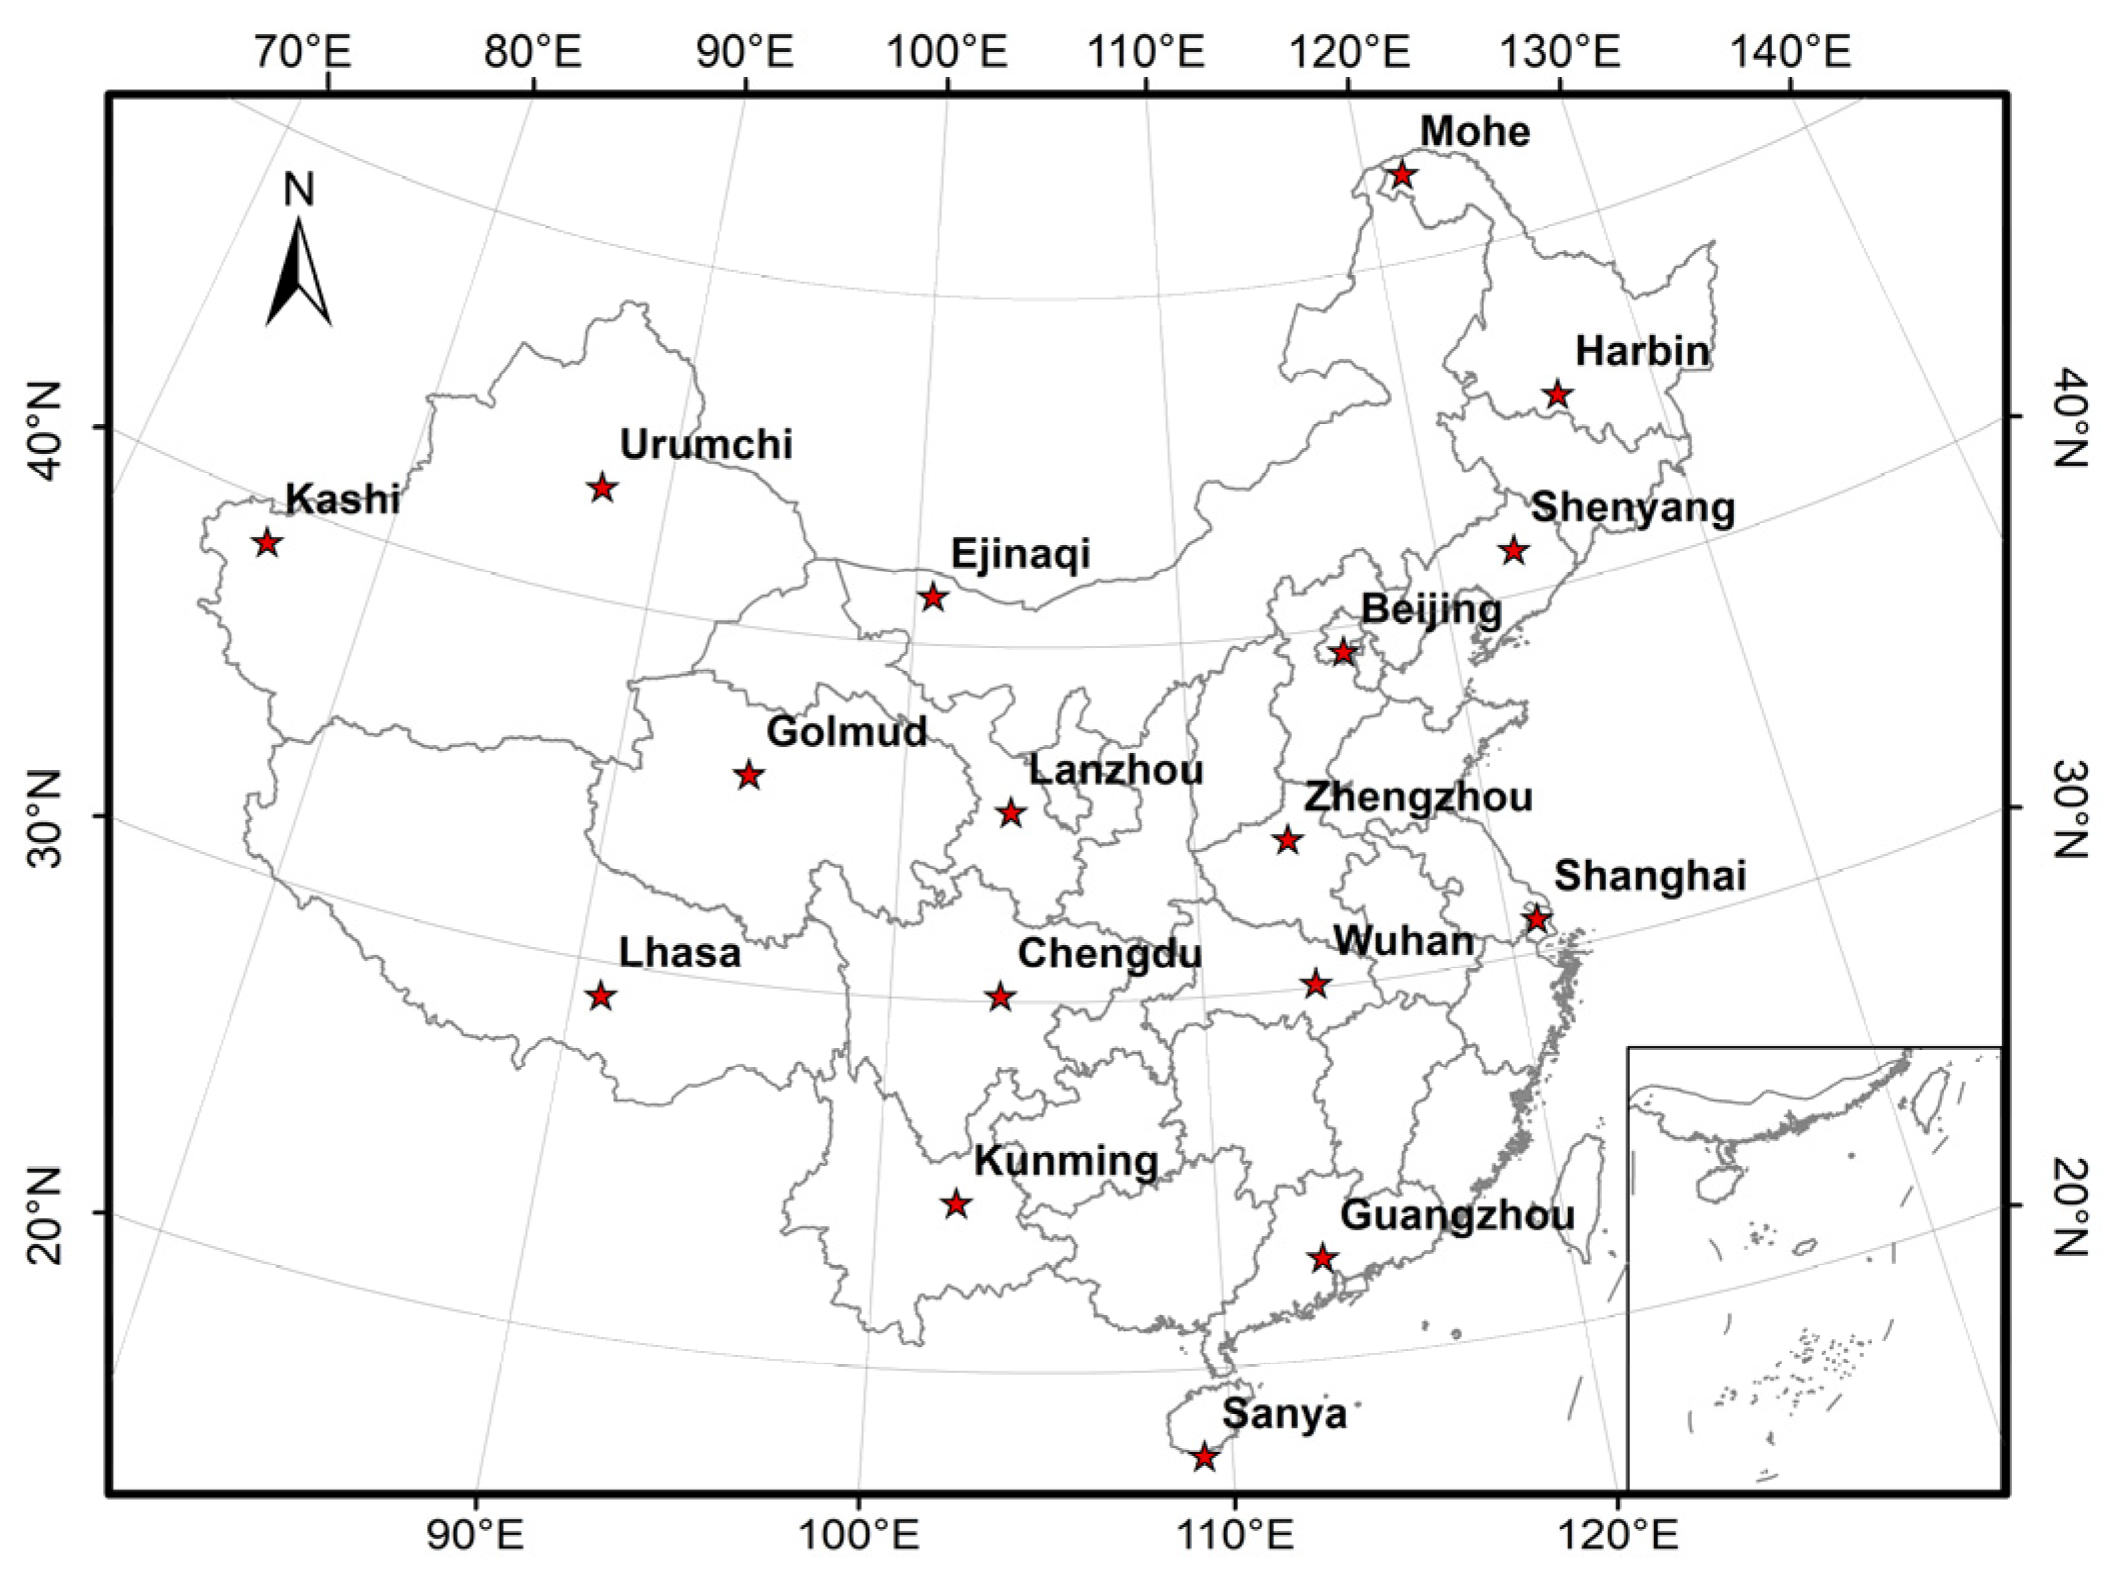
2.1. Study Region and Data

2.1.1. Ground-Level Daily Diffuse Solar Radiation Measurements

The ground diffuse solar radiation measurements used in this study were collected from 17 stations owned and maintained by the China Meteorological Administration (CMA). The records from 2011 to 2015 were utilized to train and validate the model. The main quality control principles were as follows: daily diffuse solar radiation should not exceed the daily total solar radiation, and their ratio should be larger than 0, and less than 1; daily total solar radiation should be less than extraterrestrial radiation in the same geographic location. Figure 1 shows the spatial distribution of all related stations [2].

2.1.2. Reanalysis Data

ERA5 meteorological data, proposed by the European Centre for Medium-Range Weather Forecasts, is a reanalysis data suitable for assimilation of historical data spanning the last 40–70 years. At a resolution of 0.25° × 0.25° on a regular latitude/longitude grid, ERA5-single datasets deliver a wide variety of global atmospheric, ocean wave, and surface parameter estimates at frequencies up to 1 h [54]. With a spatial resolution of 0.1° × 0.1° and temporal coverage of 1950-present, the ERA5-land dataset has a better resolution than the ERA5-single.
Additionally, we selected the MERRA_2 products, provided by the Global Modeling and Assimilation Office (GMAO) in NASA, as input parameters. The MERRA_2 dataset has good spatial and temporal continuity with a temporal range (1980–present) across China [55]. Detailed information about the input variables from MERRA_2, ERA5-single, and ERA5-land datasets used in this study are shown in Table 1.

2.1.3. Existing Diffuse Solar Radiation Products

Three commonly used diffuse solar radiation products were chosen for comparison and analysis with CHSSDR. (1) The synoptic fluxes and clouds (SYN1deg) is a Clouds and the Earth’s Radiant Energy System (CERES) level 3 product that is based on satellite-derived data on the Earth’s radiation revenue and expenditure [56]. CERES-SYN1deg (referred to as CERES) offers information on atmospheric, surface, cloud, and aerosol fluxes. The surface shortwave diffuse flux of the CERES-SYN1deg level 3 product was chosen as one of the diffuse products. (2) Two variables in the ERA5-single dataset, i.e., surface solar radiation downwards and total sky direct solar radiation at the surface, were subtracted to obtain the diffuse solar radiation values as one of the diffuse products [57]. (3) JiEA is a radiation dataset developed by Jiang et al. [17] using MTSAT data and deep learning algorithm. The daily average diffuse solar radiation data of JiEA was used as one of the diffuse products for subsequent comparison. Table 2 illustrates the specific information for the four diffuse solar radiation products.

2.2. Methodology

2.2.1. Data Processing

Due to the varying temporal and spatial resolution of distinct reanalysis data, all input variables were resampled using cubic convolution interpolation to a spatial resolution of 0.1° × 0.1° and temporal resolution of daily. We validated that each input variable was available across China after filling in the missing values and interpolation. For model training, validation, and evaluation, we created a five-year sample dataset based on matching latitude, longitude, and input variables using observation data from 2011 to 2015.

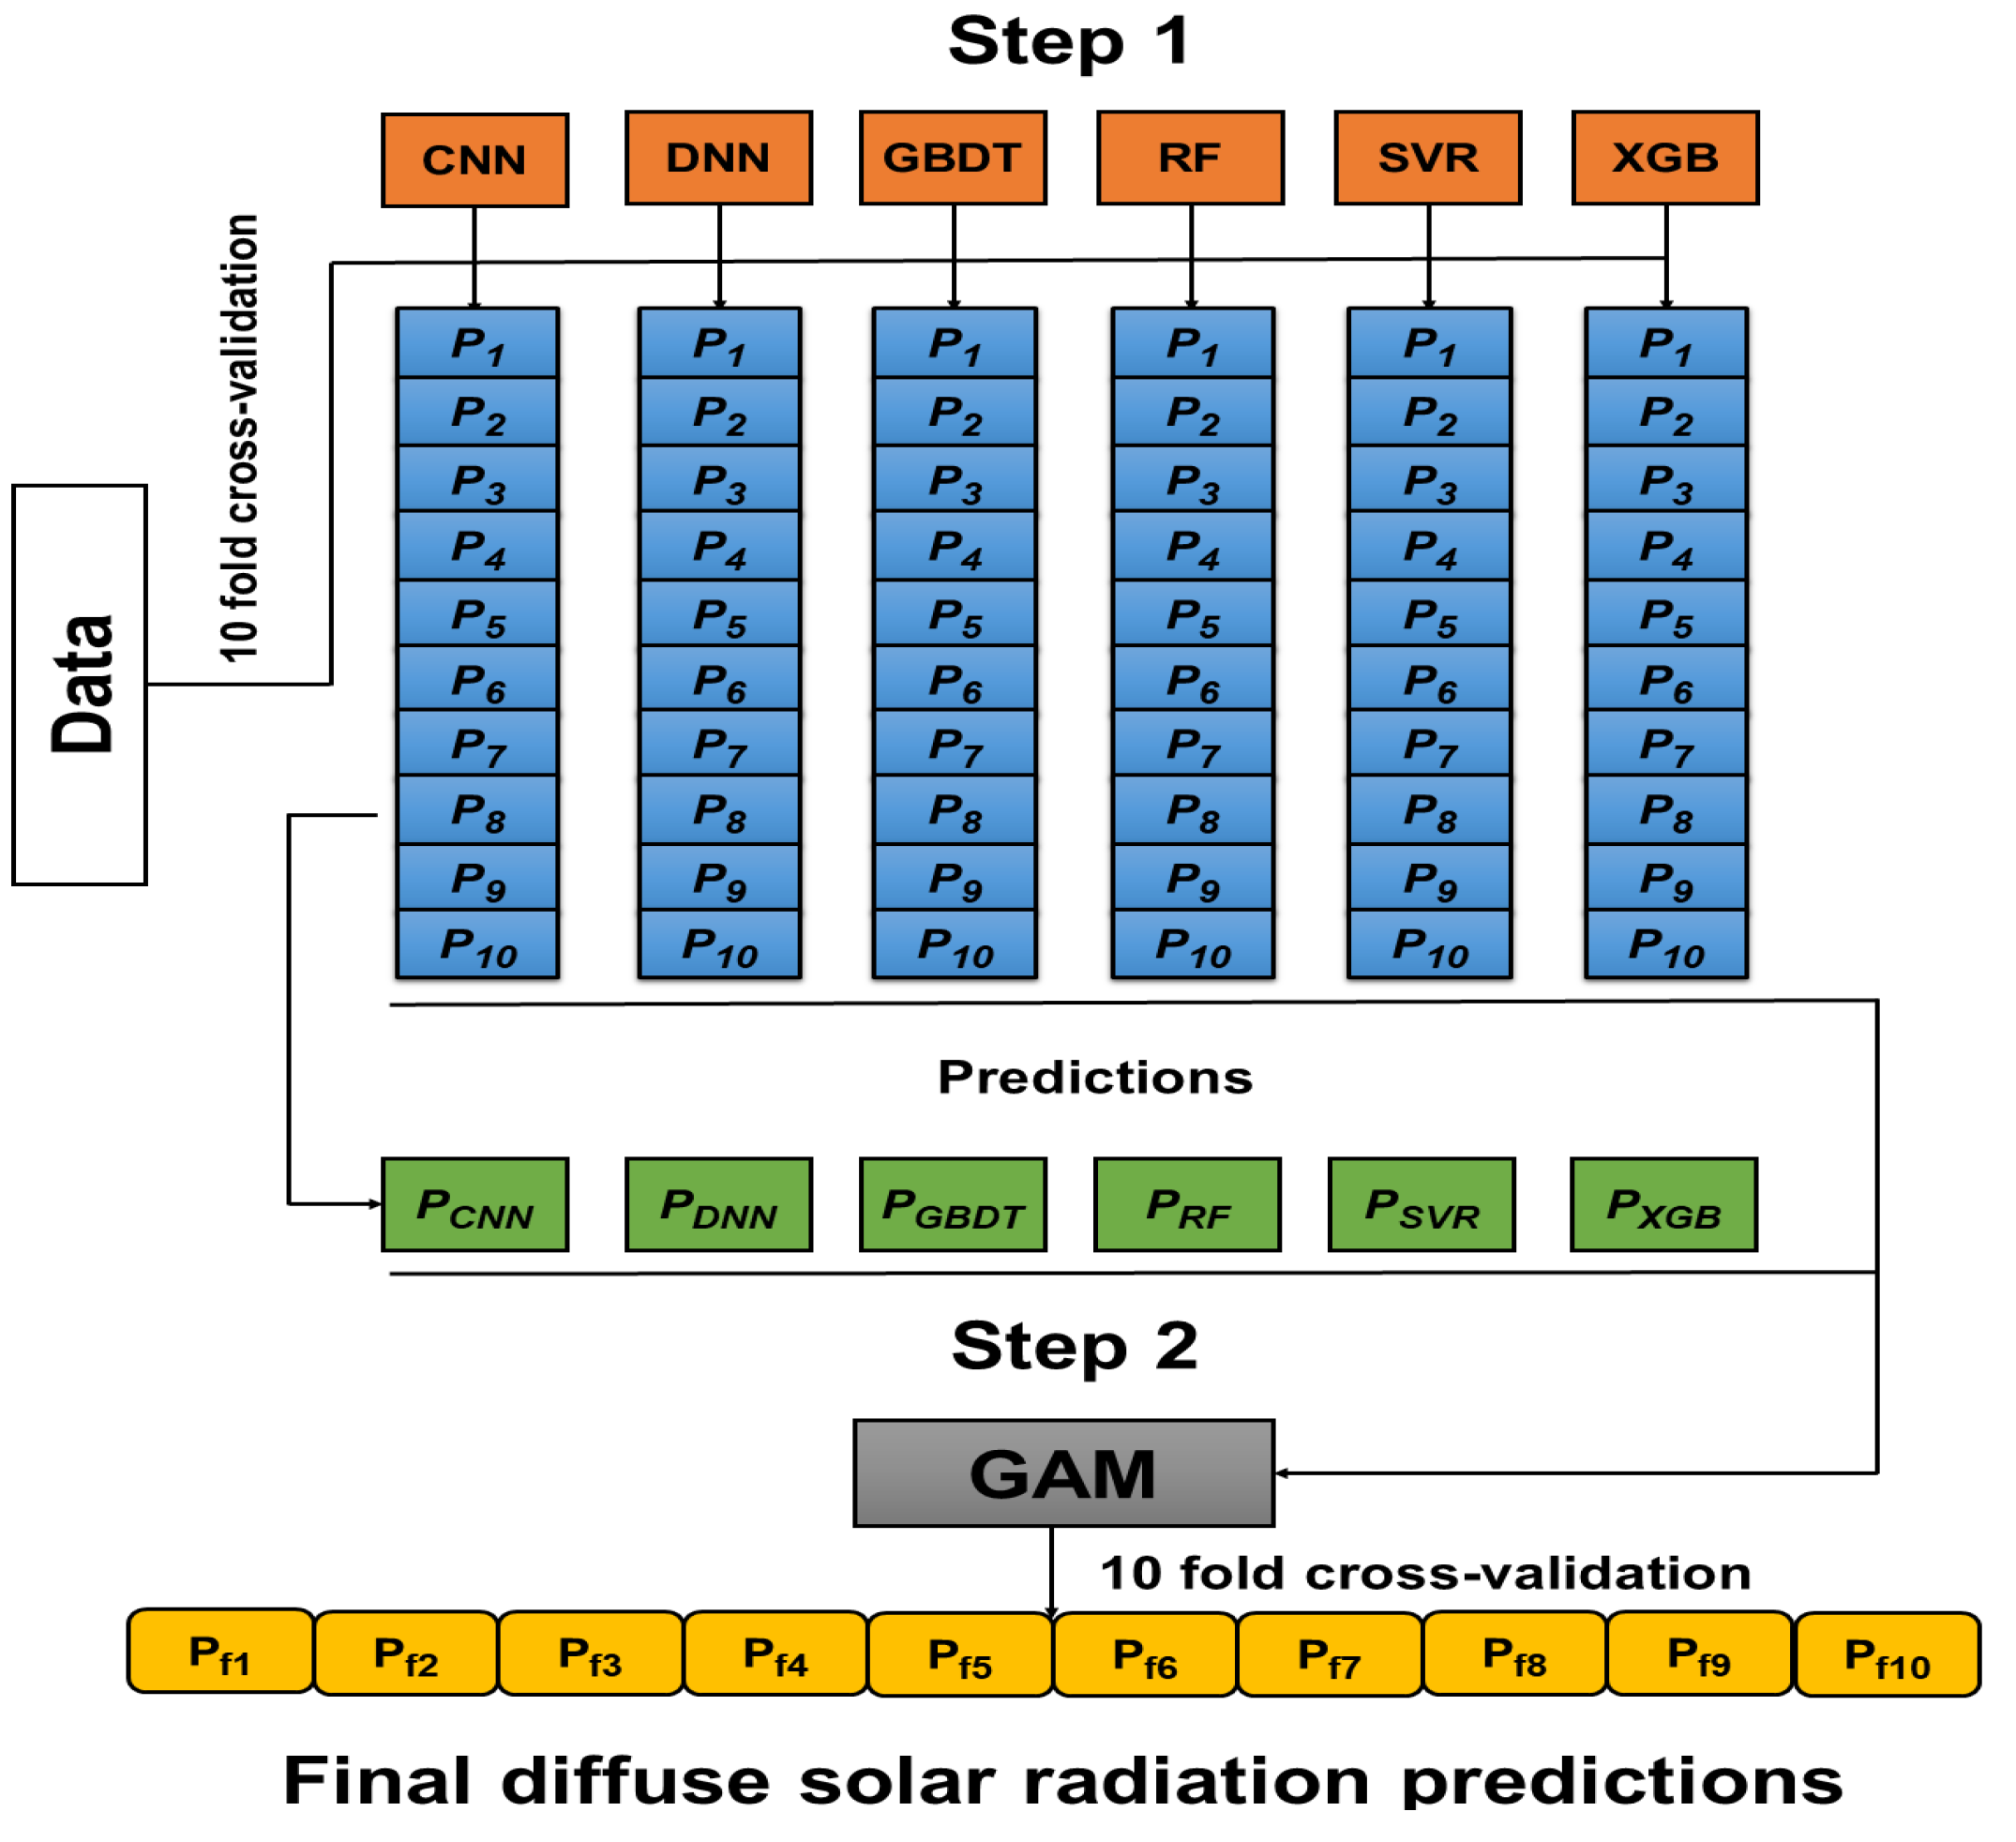
2.2.2. Base Learners and Ensemble Model

Deep Learning

Deep learning utilizes a sequence of nonlinear layers to extract or transform features, analyze patterns, and classify images [58]. Convolutional neural networks (CNN) [59] can hierarchically extract powerful low- and high-level characteristics. Convolutional, nonlinear, and pooling layers make up a standard CNN. Each layer’s input and output are feature maps, which are collections of arrays [19]. Deep neural networks (DNN) is a kind of artificial network composed of many neurons with strong universality. The extensive connection between neurons can simulate the structure and function of the nervous system. A standard DNN typically consists of the input layer, hidden layer, dropout layer, and output layer.

Boosting Algorithm

Boosting algorithm pays more attention to the error samples in the previous model. The GBDT method employs the negative gradient of the loss function as the residual approximation in the boosting tree algorithm and gradually reduces the residual to minimize the loss function [60]. In comparison to GBDT, extreme gradient boosting (XGB) implements greater decision tree integration [61]. XGB successively generates numerous trees and bases all subsequent trees on the residuals of the prior tree, hence increasing the overall forecast. Furthermore, to limit the risk of over-fitting, XGB employs a more normalized model form.

Others

Random forest (RF) is advantageous in manipulating complex nonlinear relationships. Using bootstrapped samples randomly selected from the training data with replacement, the RF creates a preset number of simple decision trees. The best among a sample of predictors randomly chosen at that node was used to split each node of the decision tree [62]. Apart from the above five models, support vector regression (SVR) was also applied. The SVR estimates regression based on a series of kernel functions, which can transform the low-dimensional input data into high-dimensional feature space, in order to maximize the distance between points and surface [63].

Generalized Additive Models

Generalized additive models (GAM) establish the nonlinear relationship between a response variable and series of explanatory variables through smooth functions [22,64]. The additive structure of GAM makes it easy to interpret how each explanatory variable affects Y [65]. GAM can be expressed by:
g [ E ( Y | X ) ] = α + j = 1 r f j ( X j )
where g is the link function, and f j are smooth functions of X j . Y is a random variable called response variable, and X is a matrix whose columns are a set of r explanatory variables X model .
X model can be expressed by:
X model = f ( AOD ,   BLH ,   FA ,   HCC ,   LCC ,   MCC ,   SP ,   SSRD ,   SSRDC , T 2 m ,   TCC , TCCIW ,   TCCLW ,   TCO ,   TCW ,   TISR ,   TP )
where f ( ) represents the base ML learners used to estimate diffuse solar radiation in this study: CNN, DNN, GBDT, RF, SVR, and XGB.
A smooth function f j can be represented linear combination of basis functions.
f j ( X j ) = i = 1 q j θ ji b ji ( x j )
where b ji ( x j ) is the i th basis function of the j th explanatory variable evaluated at x j , q j   is the number of basis functions for the j th explanatory variable, and θ ji are unknown parameters [22]. In this study, the generalized cross-validation score (GCV) was selected to minimize the smooth function f j , which is based on the leave-one-out method. This method ends up being less computationally expensive [66].
GAM is used for the ensemble stage, which is appropriate for scenarios where complex, nonlinear, and possibly interacting relationships need to be predicted. This method allows for greater flexibility in the weights assigned to each model as they fluctuate in space, as well as applying higher weights to a model that performs better in specific locations.

2.2.3. Model Development

Here, 3-h AOD data from the MERRA-2 dataset, TISR, SSRDC, BLH, TCO, LCC, MCC, HCC, TCCIW, TCCLW, TCC, and TCW from the ERA5-single dataset, and TP, SSRD, SSRD, T2m, and SP from the ERA5-land dataset were used as input variables to develop the ML model for estimating diffuse solar radiation with a 0.1° × 0.1° spatial resolution. The six base learners were tuned using GridSerachCV to find the optimum performance over the complete sample set based on the R metric, which was used to adjust different parameters.
All six ML models attempted to model the complex relationship between the input and dependent variable with different approaches. The ensemble model (GAM) aimed to generate an improved diffuse solar radiation estimation, compared to the estimations from each base ML learner (CNN\DNN\GBDT\RF\SVR\XGB). The GAM used the cross-validated diffuse solar radiation estimations from six base ML models as predictors, in order to achieve the final diffuse solar radiation predictions. The cross-validated estimations were used, as opposed to estimations in the testing data, because they better approximated the predictive performance of the models in locations without data. Then we tuned the hyperparameters for GAM using GridSearchCV. After multi-perspective cross-validation (CV) of the GAM, we constructed a daily diffuse solar radiation dataset for the Chinese region, a specific integration process, as shown in the following Figure 2.
The 10-fold CV approach is commonly used to verify the model’s robustness and overfitting problems. The dataset is randomly divided into 10 subsets, each with ~10% of the dataset. That is, 9 subsets are used to train the model, while the remaining subset is used for validation. This process is repeated for each subset held out in turn. In this study, we applied three 10-fold CV approaches, such as sample-based CV, site-based CV, and by-year CV, to evaluate the estimation performance of the base ML and ensemble models. The sample-based CV was used to evaluate the overall performance of the models. The site-based and by-year CV assessed how the model performs in areas without monitoring sites and years without monitoring data, thus allowing for predictions to be made using the model developed over other regions and years. The correlation coefficient (R), root-mean-square error (RMSE), mean bias error (MBE), and mean absolute error (MAE) were used to quantitatively evaluate the model performance.

3. Results

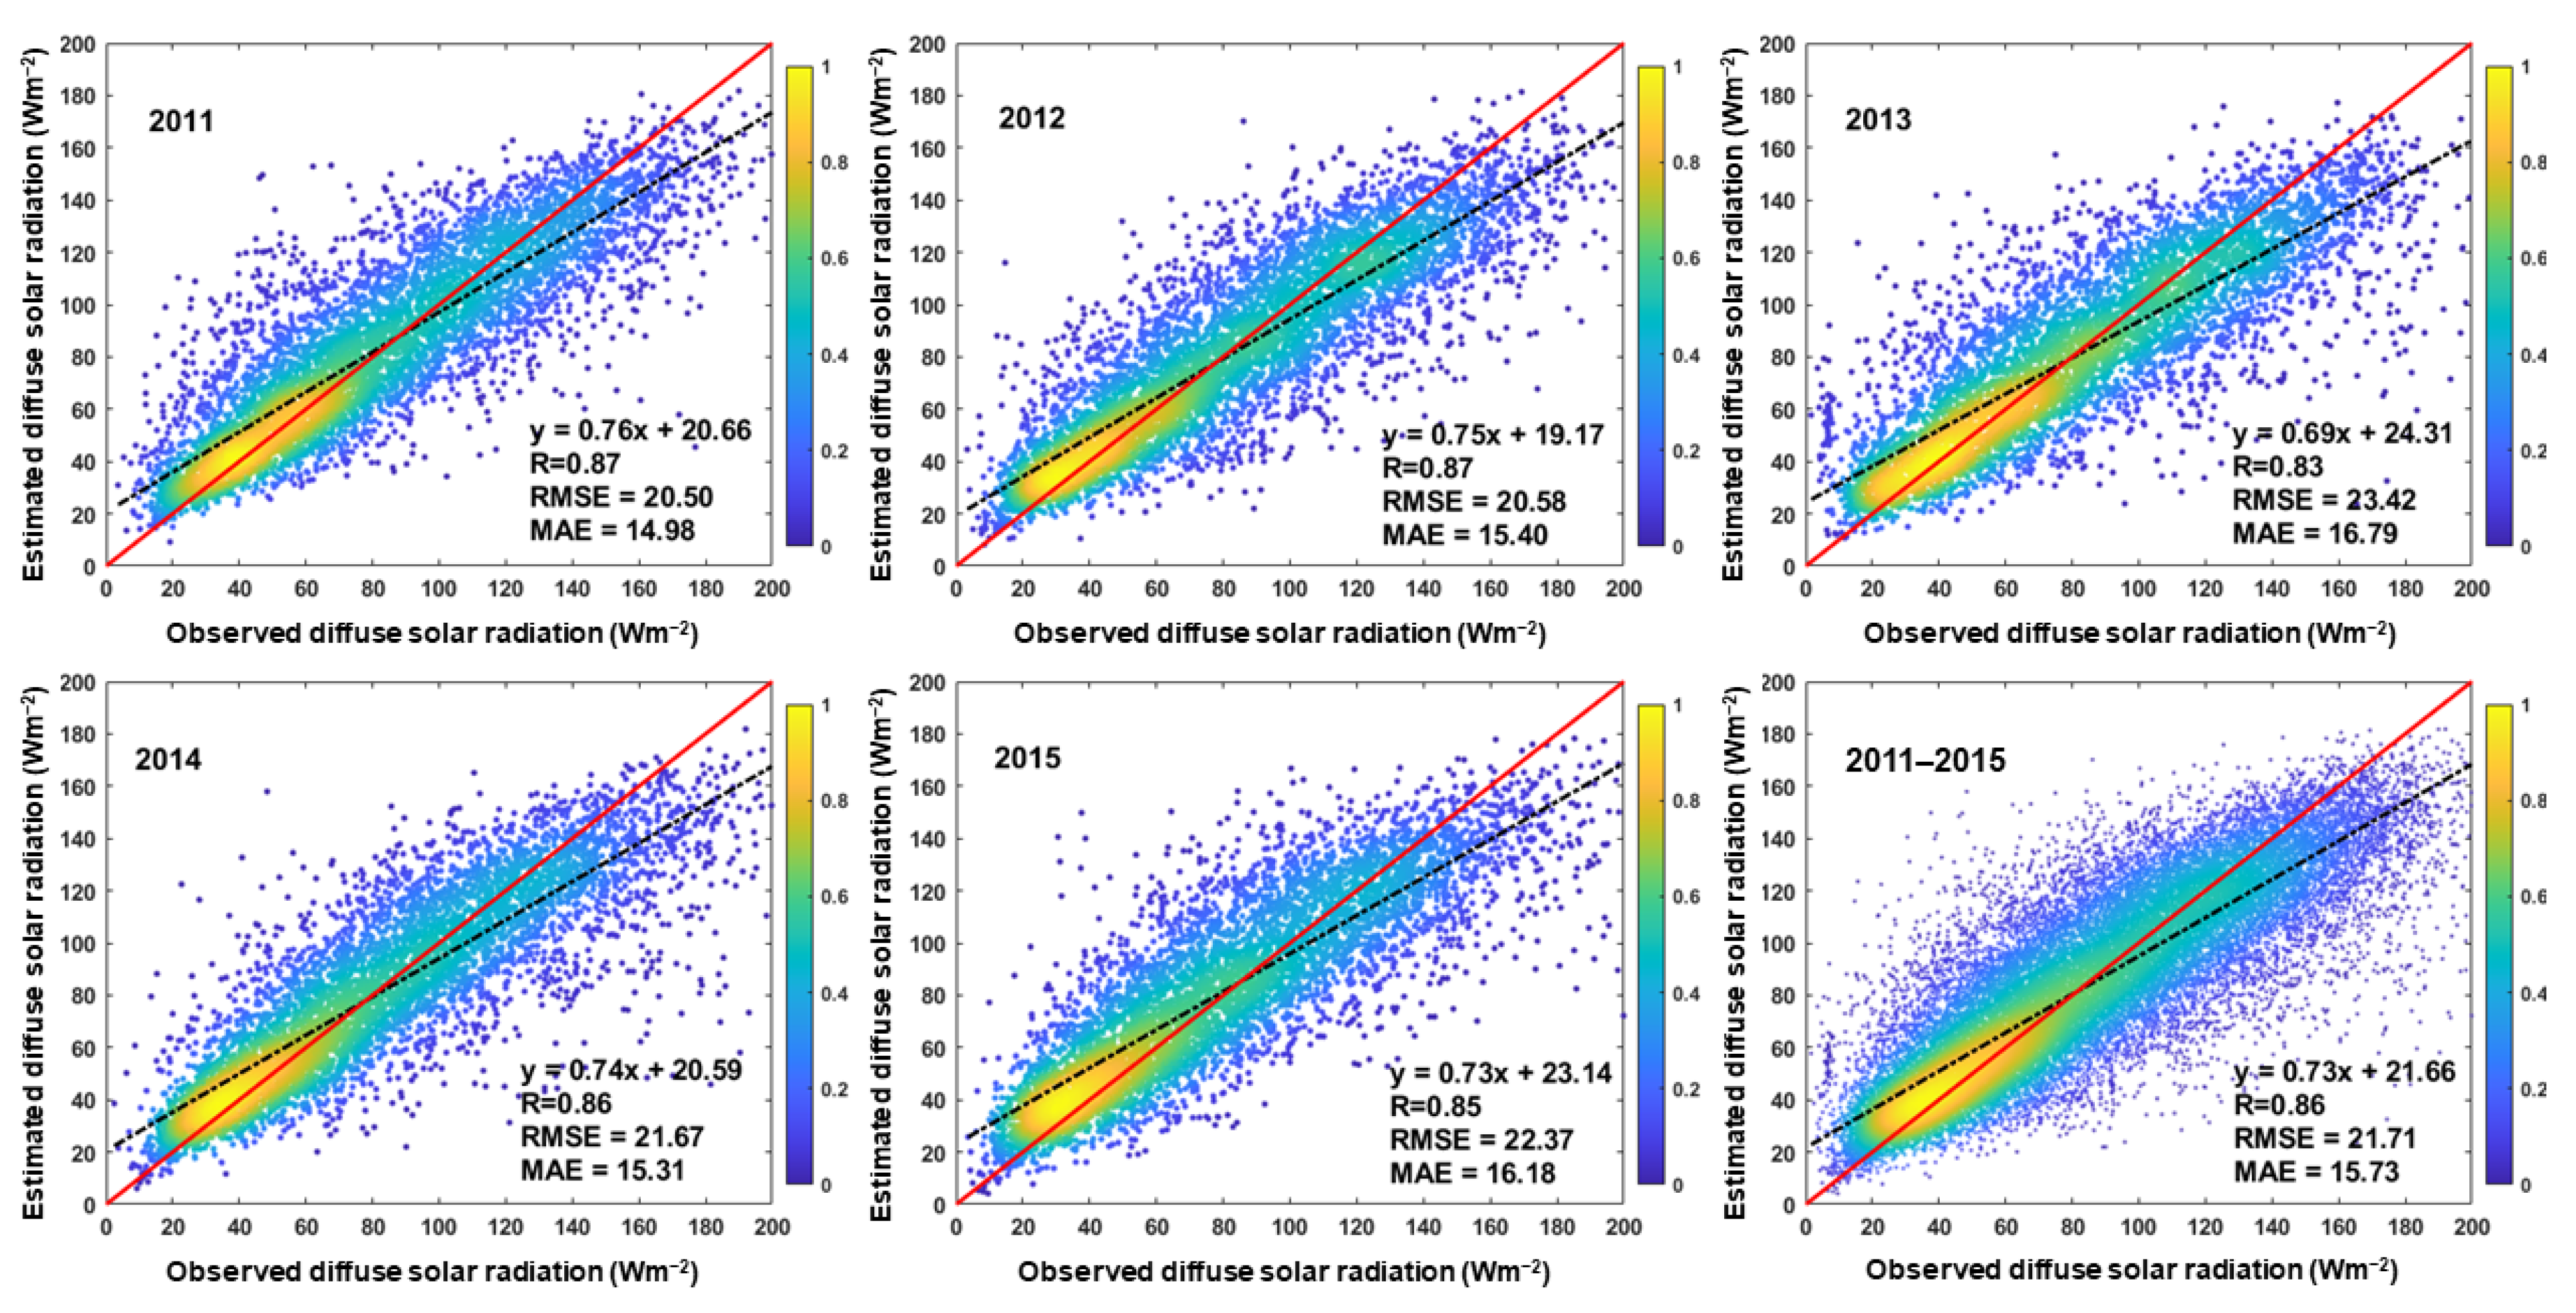
3.1. Evaluation of the Model Performance

Figure 3 presents the density scatterplots between the observed and estimated diffuse solar radiation using the GAM and the six base ML models. Overall, the ML models perform well, with R values ranging from 0.77 to 0.88, RMSE values ranging from 19.54 to 26.32 Wm−2, and MAE values ranging from 14.87 to 20.64 Wm−2. The sample-based CV R values are in the order of GAM (0.88) > RF (0.87) = XGB (0.87) = GBDT (0.87) > SVR (0.86) > DNN (0.84) > CNN (0.77). The RMSE and MAE values presented opposite trends, suggesting that GAM outperforms the six individual models in diffuse solar radiation prediction (RMSE = 19.54 Wm−2 and MAE = 14.87 Wm−2). Of the three ML algorithms, the model performance of the boosting algorithm (GBDT and XGB) and others (RF and SVR) were quite close and better than deep learning (CNN and DNN). The overall model performance from GAM outperforms any single algorithm. It is worth noting that all models have some low-value overestimation and high-value underestimation, but GAM has improved on this issue. While the R value from GAM, compared to the single ML models, is not large overall, it affects the linearity of the association between the predictor variables and diffuse solar radiation.
Table 3 depicts the CV results for GAM at different CMA stations. In the site-based CV, the dataset was randomly split, according to the monitoring sites, and each subset contains different monitoring stations. The site-based CV R (0.84) is slightly lower than the sample-based CV R (0.88), whereas the RMSE and MAE values (21.60 and 15.74 Wm−2 for the site-based CV) are significantly higher than the sample-based CV result. The higher R values are in most eastern and northern areas of China. R varies from 0.65 to 0.92, with a mean and a standard deviation of 0.84 and 0.06, respectively, and ∼76% of the stations have R greater than 0.80. The RMSE at each station ranges from 17.71 to 26.06 Wm−2, with a mean and a standard deviation of 21.60 and 2.63 Wm−2, respectively. About 53% of the stations have RMSE values smaller than 22 Wm−2. A total of ∼29% of the stations have MAE values bigger than 17 Wm−2, with values ranging from 12.83 to 18.81 Wm−2. The mean and standard deviation of MAE for all stations were 15.74 and 1.94 Wm−2, respectively.
The dataset was randomly split according to the monitoring years in the by-year CV, using the same processes as the sited-based CV. The scatterplot of by-year CV, based on GAM, is shown in Figure 4, with the best estimation performance in 2012 and worst in 2013. The by-year CV R (0.86) is slightly lower than the sample-based CV R (0.88), whereas the RMSE and MAE values (21.71 and 15.73 Wm−2 for the by-year CV) are significantly higher than the sample-based CV result. R varies from 0.83 to 0.87, with a mean and standard deviation of 0.86 and 0.02, respectively, and ∼80% of the years have R greater than 0.85. The RMSE at each year ranges from 20.50 to 23.42 Wm−2, with a mean and standard deviation of 21.71 and 1.24 Wm−2, respectively. About 60% of the stations have RMSE values smaller than 22 Wm−2. A total of ∼40% of the years have MAE values higher than 16 Wm−2, with values ranging from 14.98 to 16.79 Wm−2. The mean and standard deviation of MAE for all years are 15.73 to 0.74 Wm−2, respectively. Overall, the GAM estimates diffuse solar radiation well. Both the site-based and by-year CV approaches illustrate satisfactory predictive capability, with no apparent overfitting, implying the reliability of GAM in predicting diffuse solar radiation spatial and temporal variability.

3.2. Comparison with Other Diffuse Solar Radiation Products

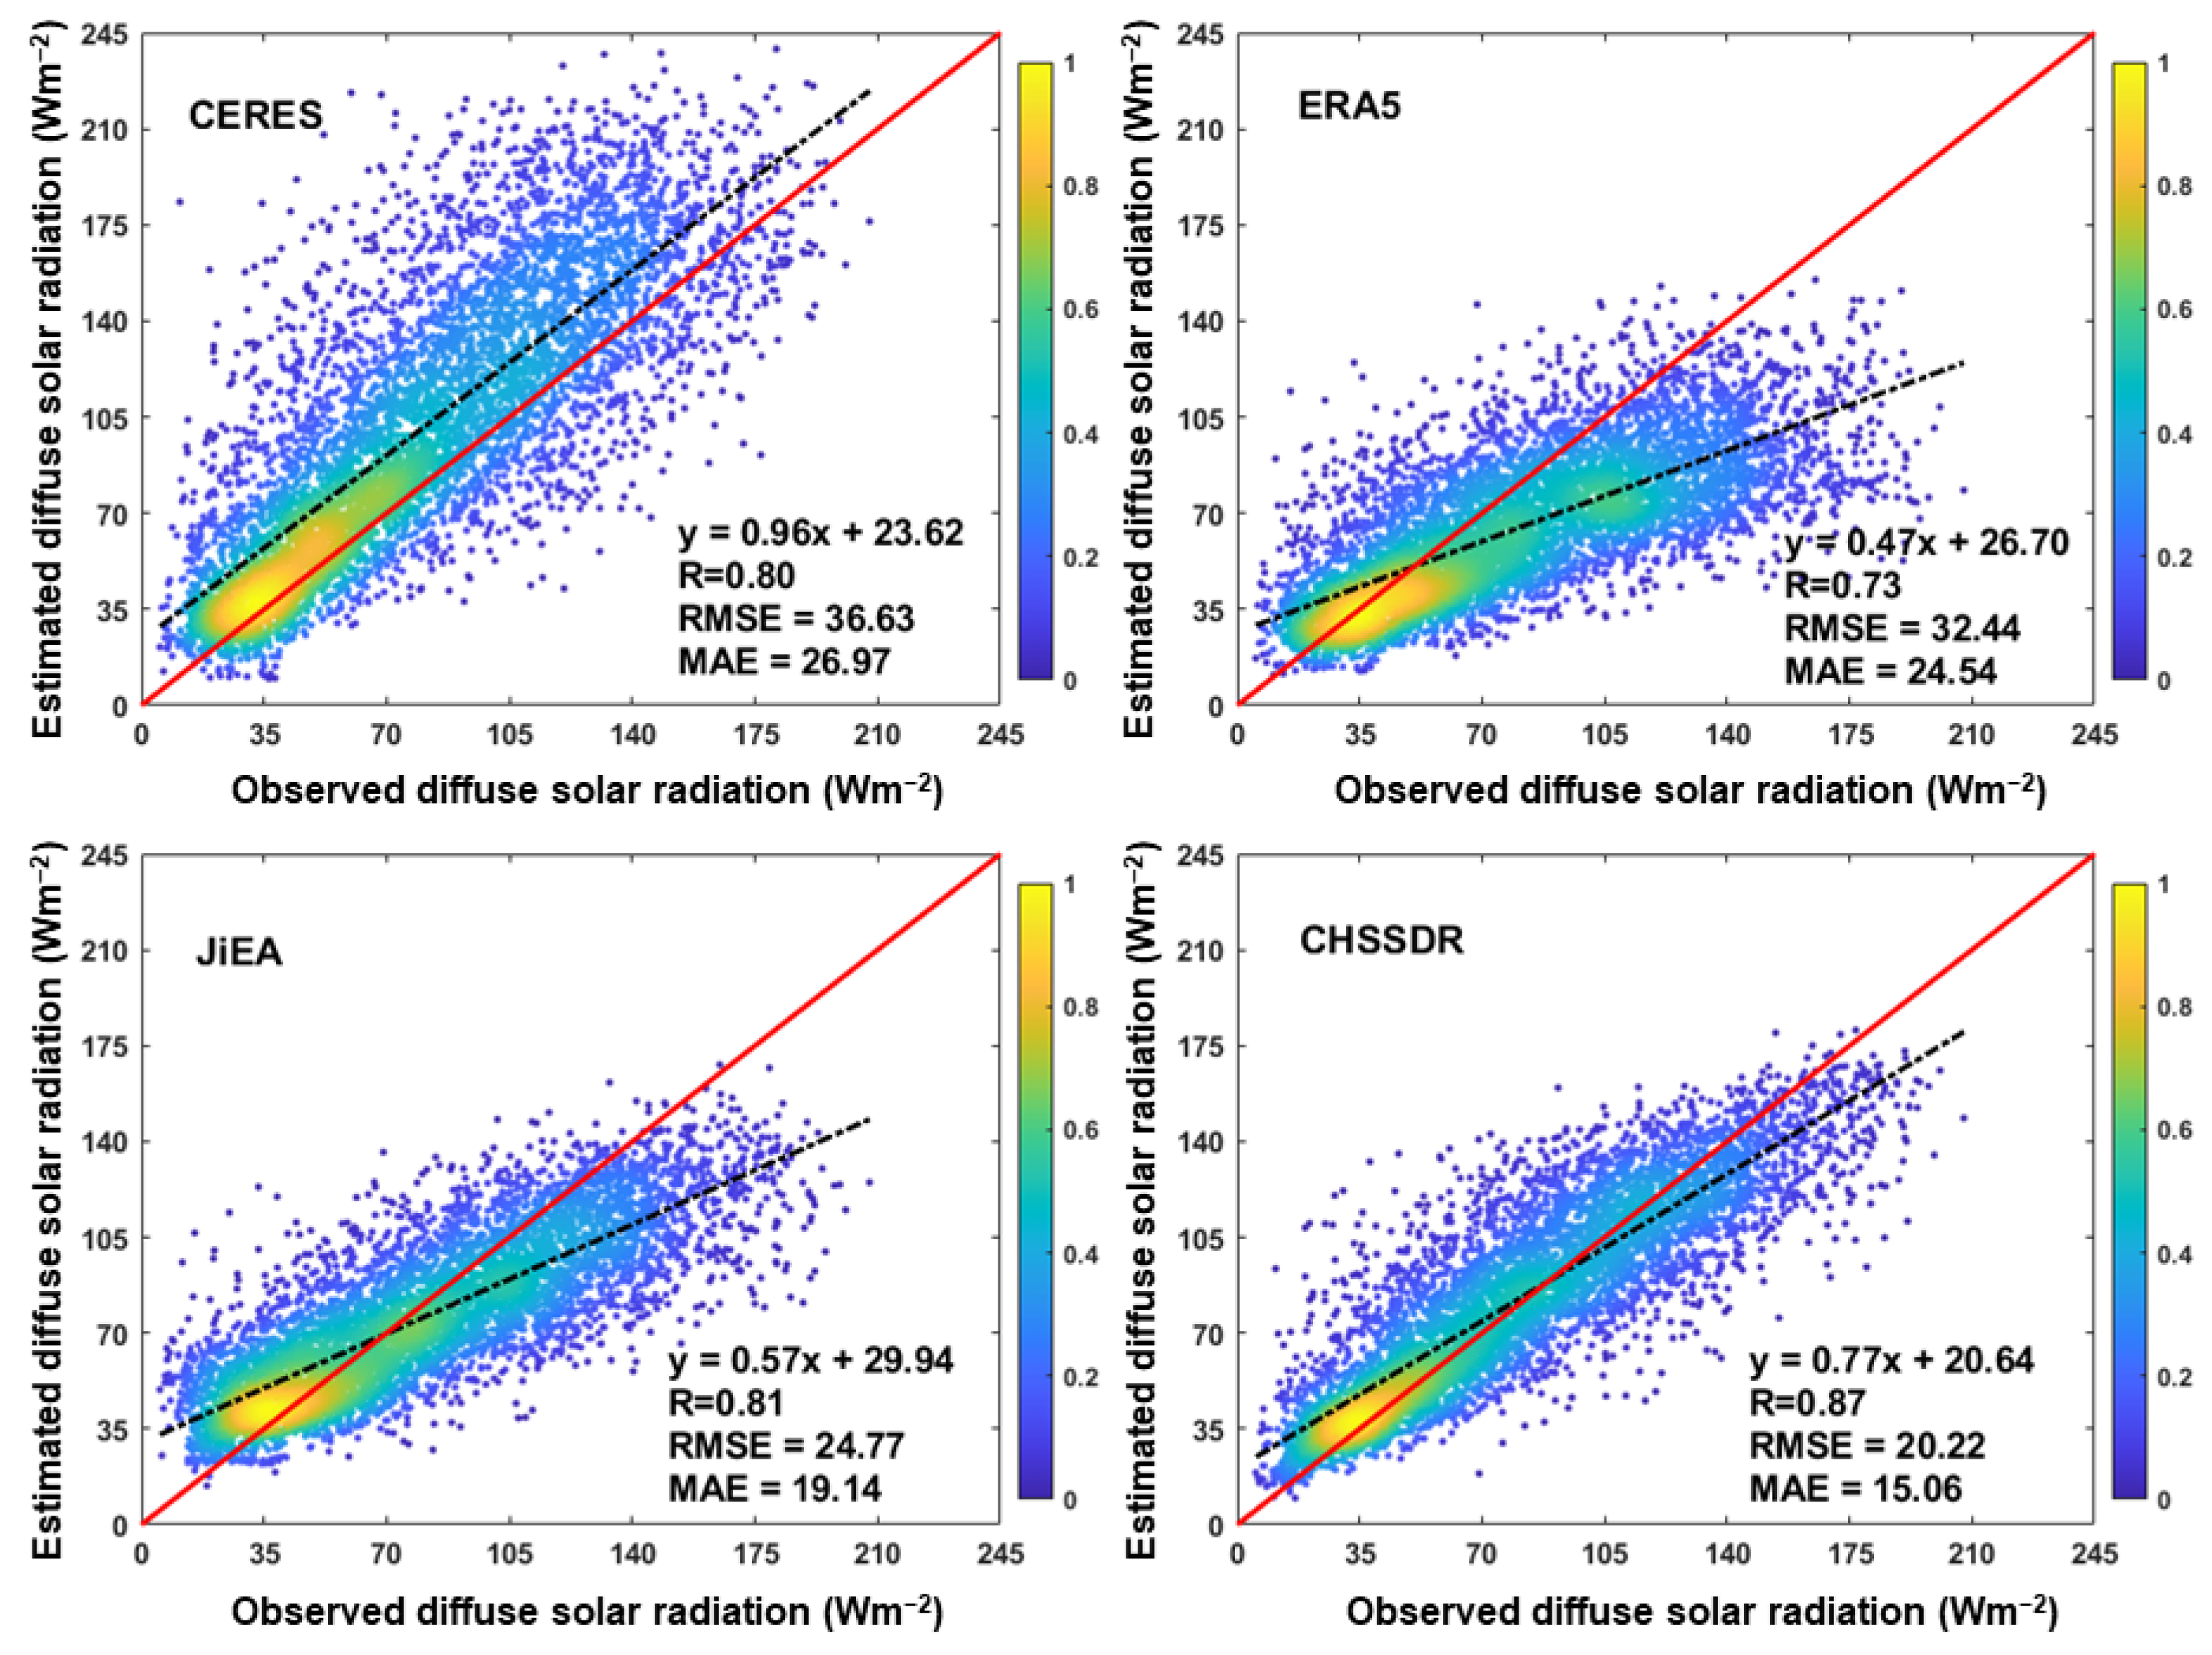
3.2.1. Validation between Diffuse Solar Radiation Products and Ground Observation Data

Figure 5 presents density scatterplots between the daily diffuse solar radiation values of four diffuse solar radiation products, including CERES, ERA5, JiEA, and CHSSDR, and ground-based observation data at 17 CMA stations in 2010. The R values for validation results are in the order of the CHSSDR (0.87) > JiEA (0.81) > CERES (0.80) > ERA5 (0.73). With the least deviation (MAE = 15.06 Wm−2 and RMSE = 20.22 Wm−2), CHSSDR has the highest consistency with the observation data. JiEA and CERES have MAE values of 19.14 Wm−2 and 26.97 Wm−2, respectively, as well as RMSE values of 24.77 Wm−2 and 36.63 Wm−2. ERA5 diffuse solar radiation data has the lowest correlation with observation data, with an MAE value of 24.54 Wm−2 and RMSE value of 32.44 Wm−2. It is suggesting that the CHSSDR outperforms the three individual products in correlation with observed diffuse solar radiation. The red solid line in Figure 5 is the 1:1 line, and the black dashed line is the best-fit line from linear regression. As illustrated in the figure, all four diffuse solar radiation products suffer from the common problem, in that the lower diffuse solar radiation values are overestimated. This phenomenon is quite clear in the ERA5 and JiEA products, whilst CERES shows an overall overestimation. Higher diffuse solar radiation values are underestimated in ERA5, JiEA, and CHSSDR, and this is particularly noticeable in ERA5 and JiEA products. The ERA5 diffuse solar radiation value demonstrates a significant underestimation, and this analysis agrees with the findings of Jiang et al. [57]. CHSSDR products contain fewer errors and more concentrated scattering points, despite CHSSDR’s slight overestimation of low values and underestimating of high values.
To effectively evaluate the four diffuse solar radiation products, we chose the daily average of ground-based observations and diffuse solar radiation products for each day of 2010 to verify and compare the mean bias. As illustrated in Figure 6a, the median bias and standard deviation of CERES are all greater than 0. Figure 6b contrasts with Figure 6a, showing that ERA5 performs the worst, with all median bias and standard deviations less than 0. The CERES is overestimated, while the ERA5 is significantly underestimated, when compared to the observation data. For each day of 2010, JiEA outperforms CERES and ERA5, as shown in Figure 6c. In the summer, the JiEA diffuse solar radiation dataset deviates even more from the observation data. Figure 6d compares the results of CHSSDR to observation data. In terms of accuracy within each time node, CHSSDR surpasses CERES, ERA5, and JiEA. CHSSDR’s median bias and standard deviation both fluctuate, by a minor magnitude, above and below zero.

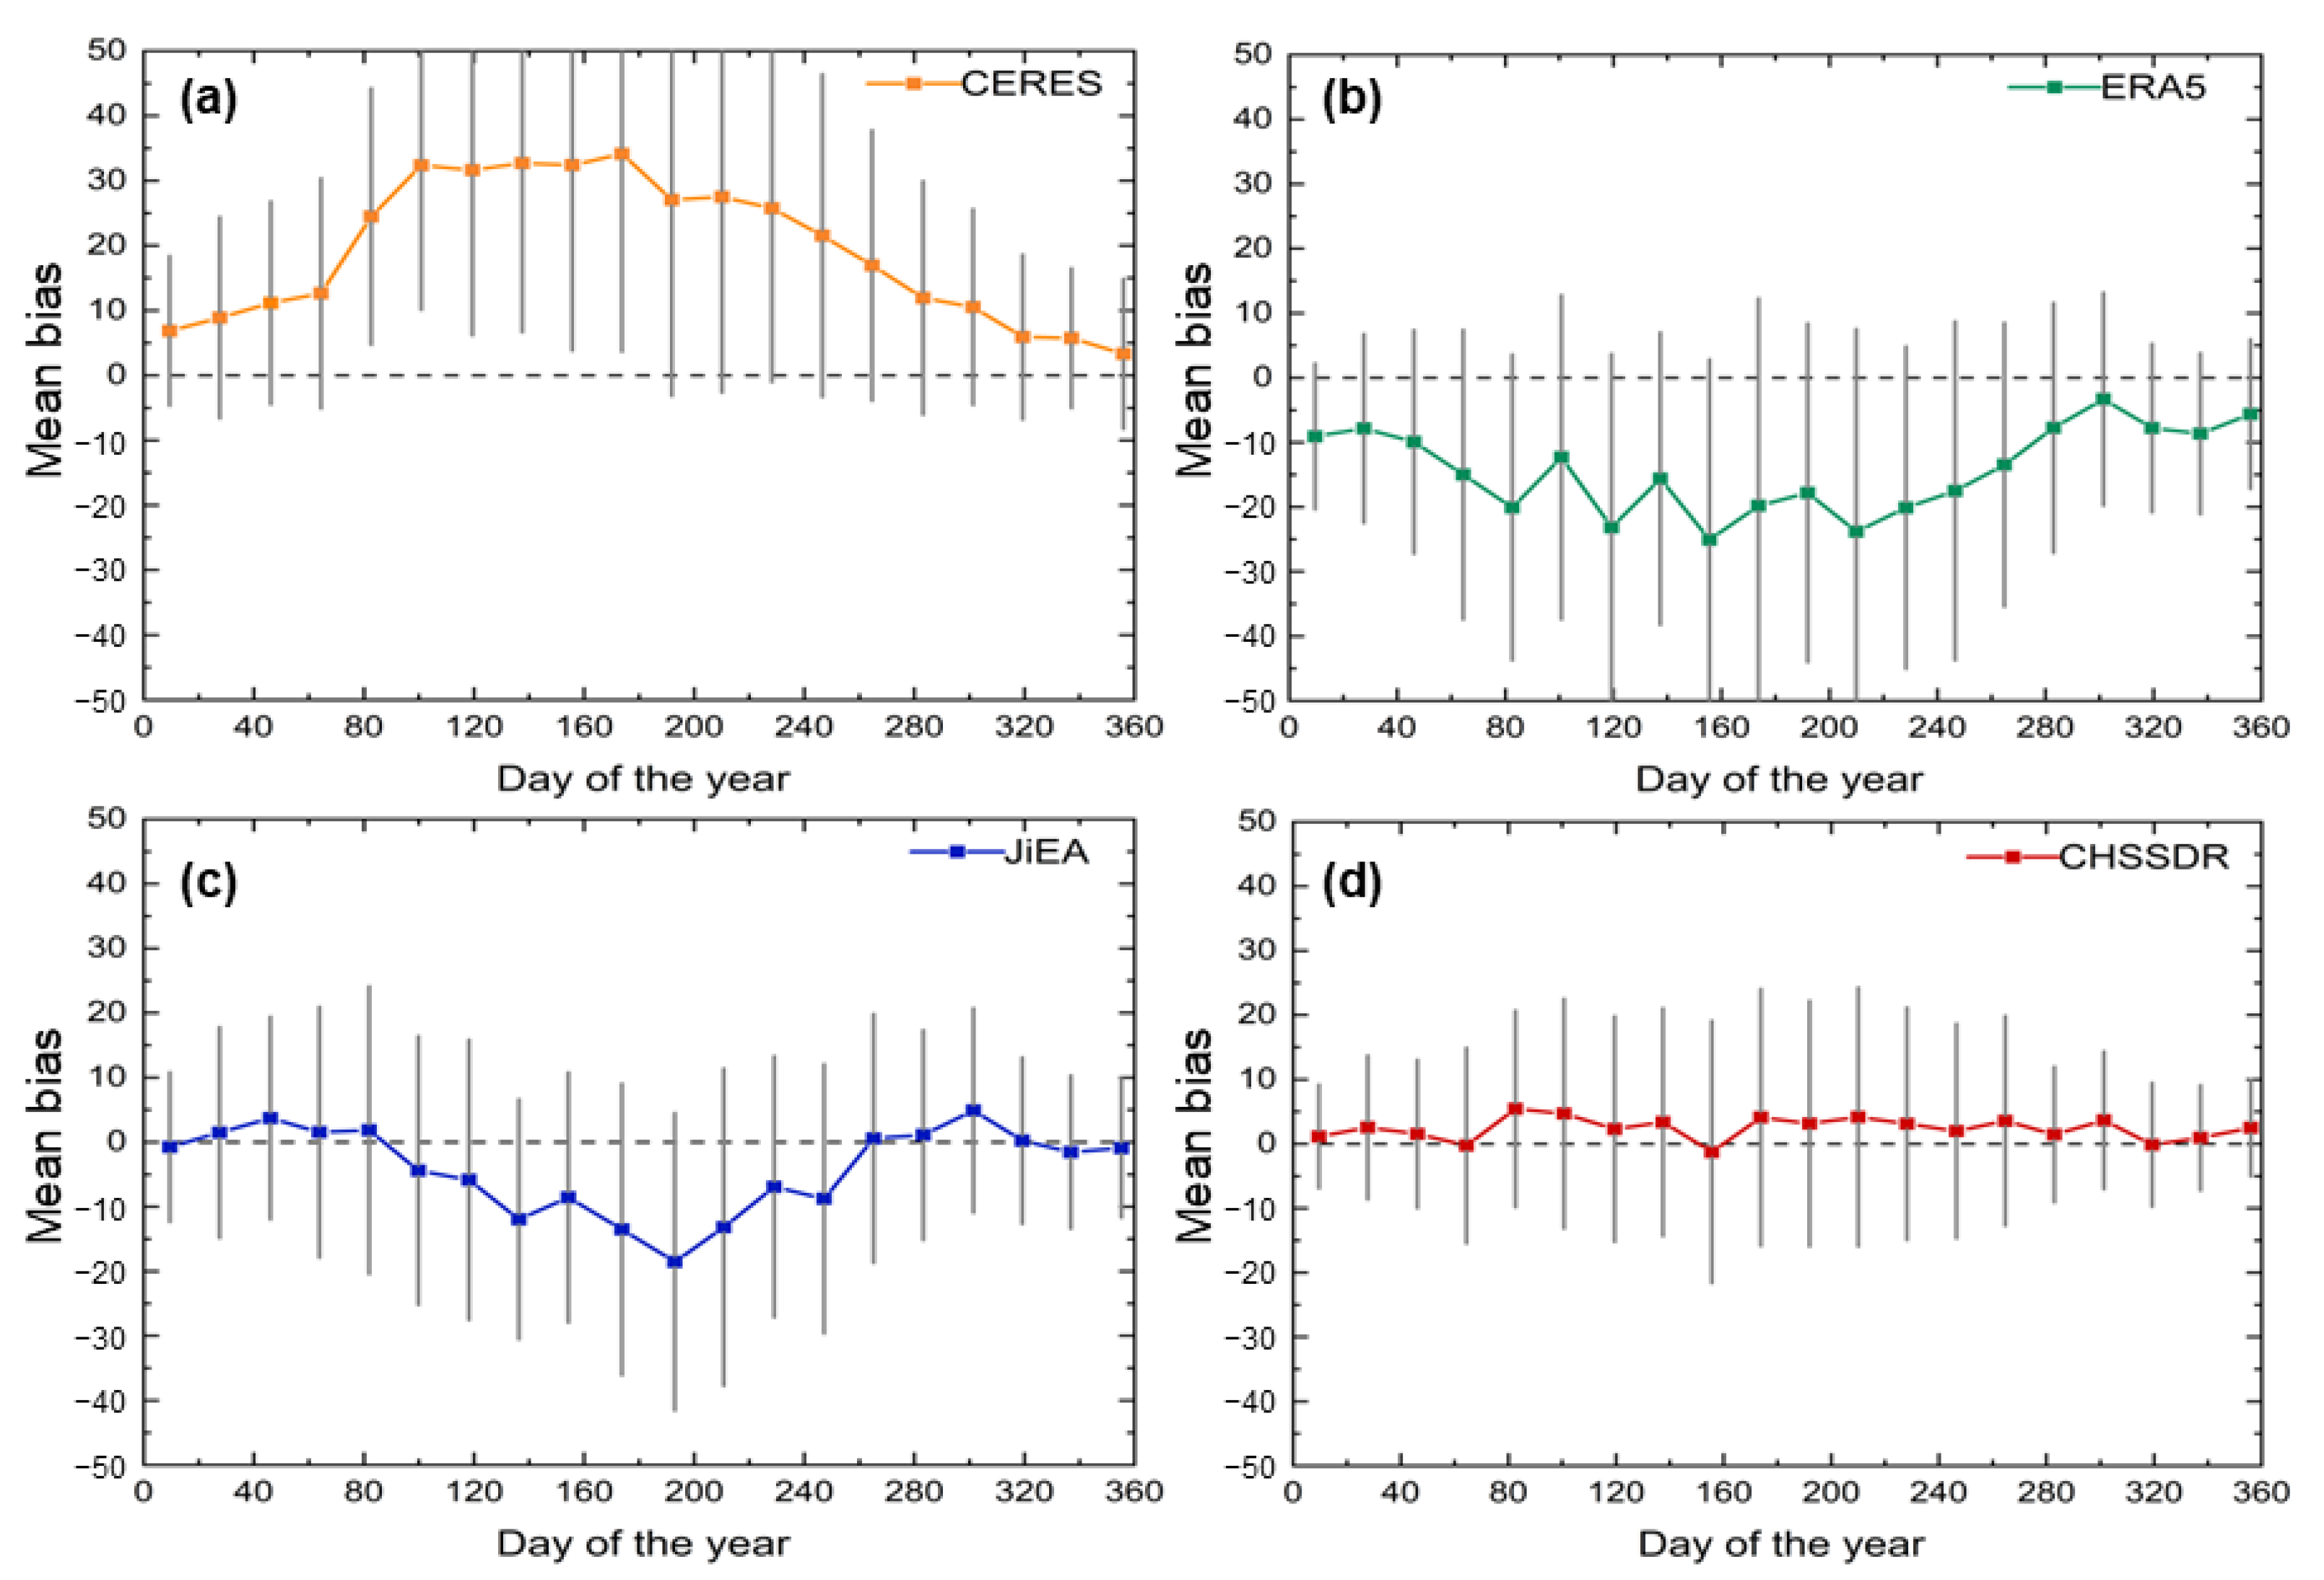
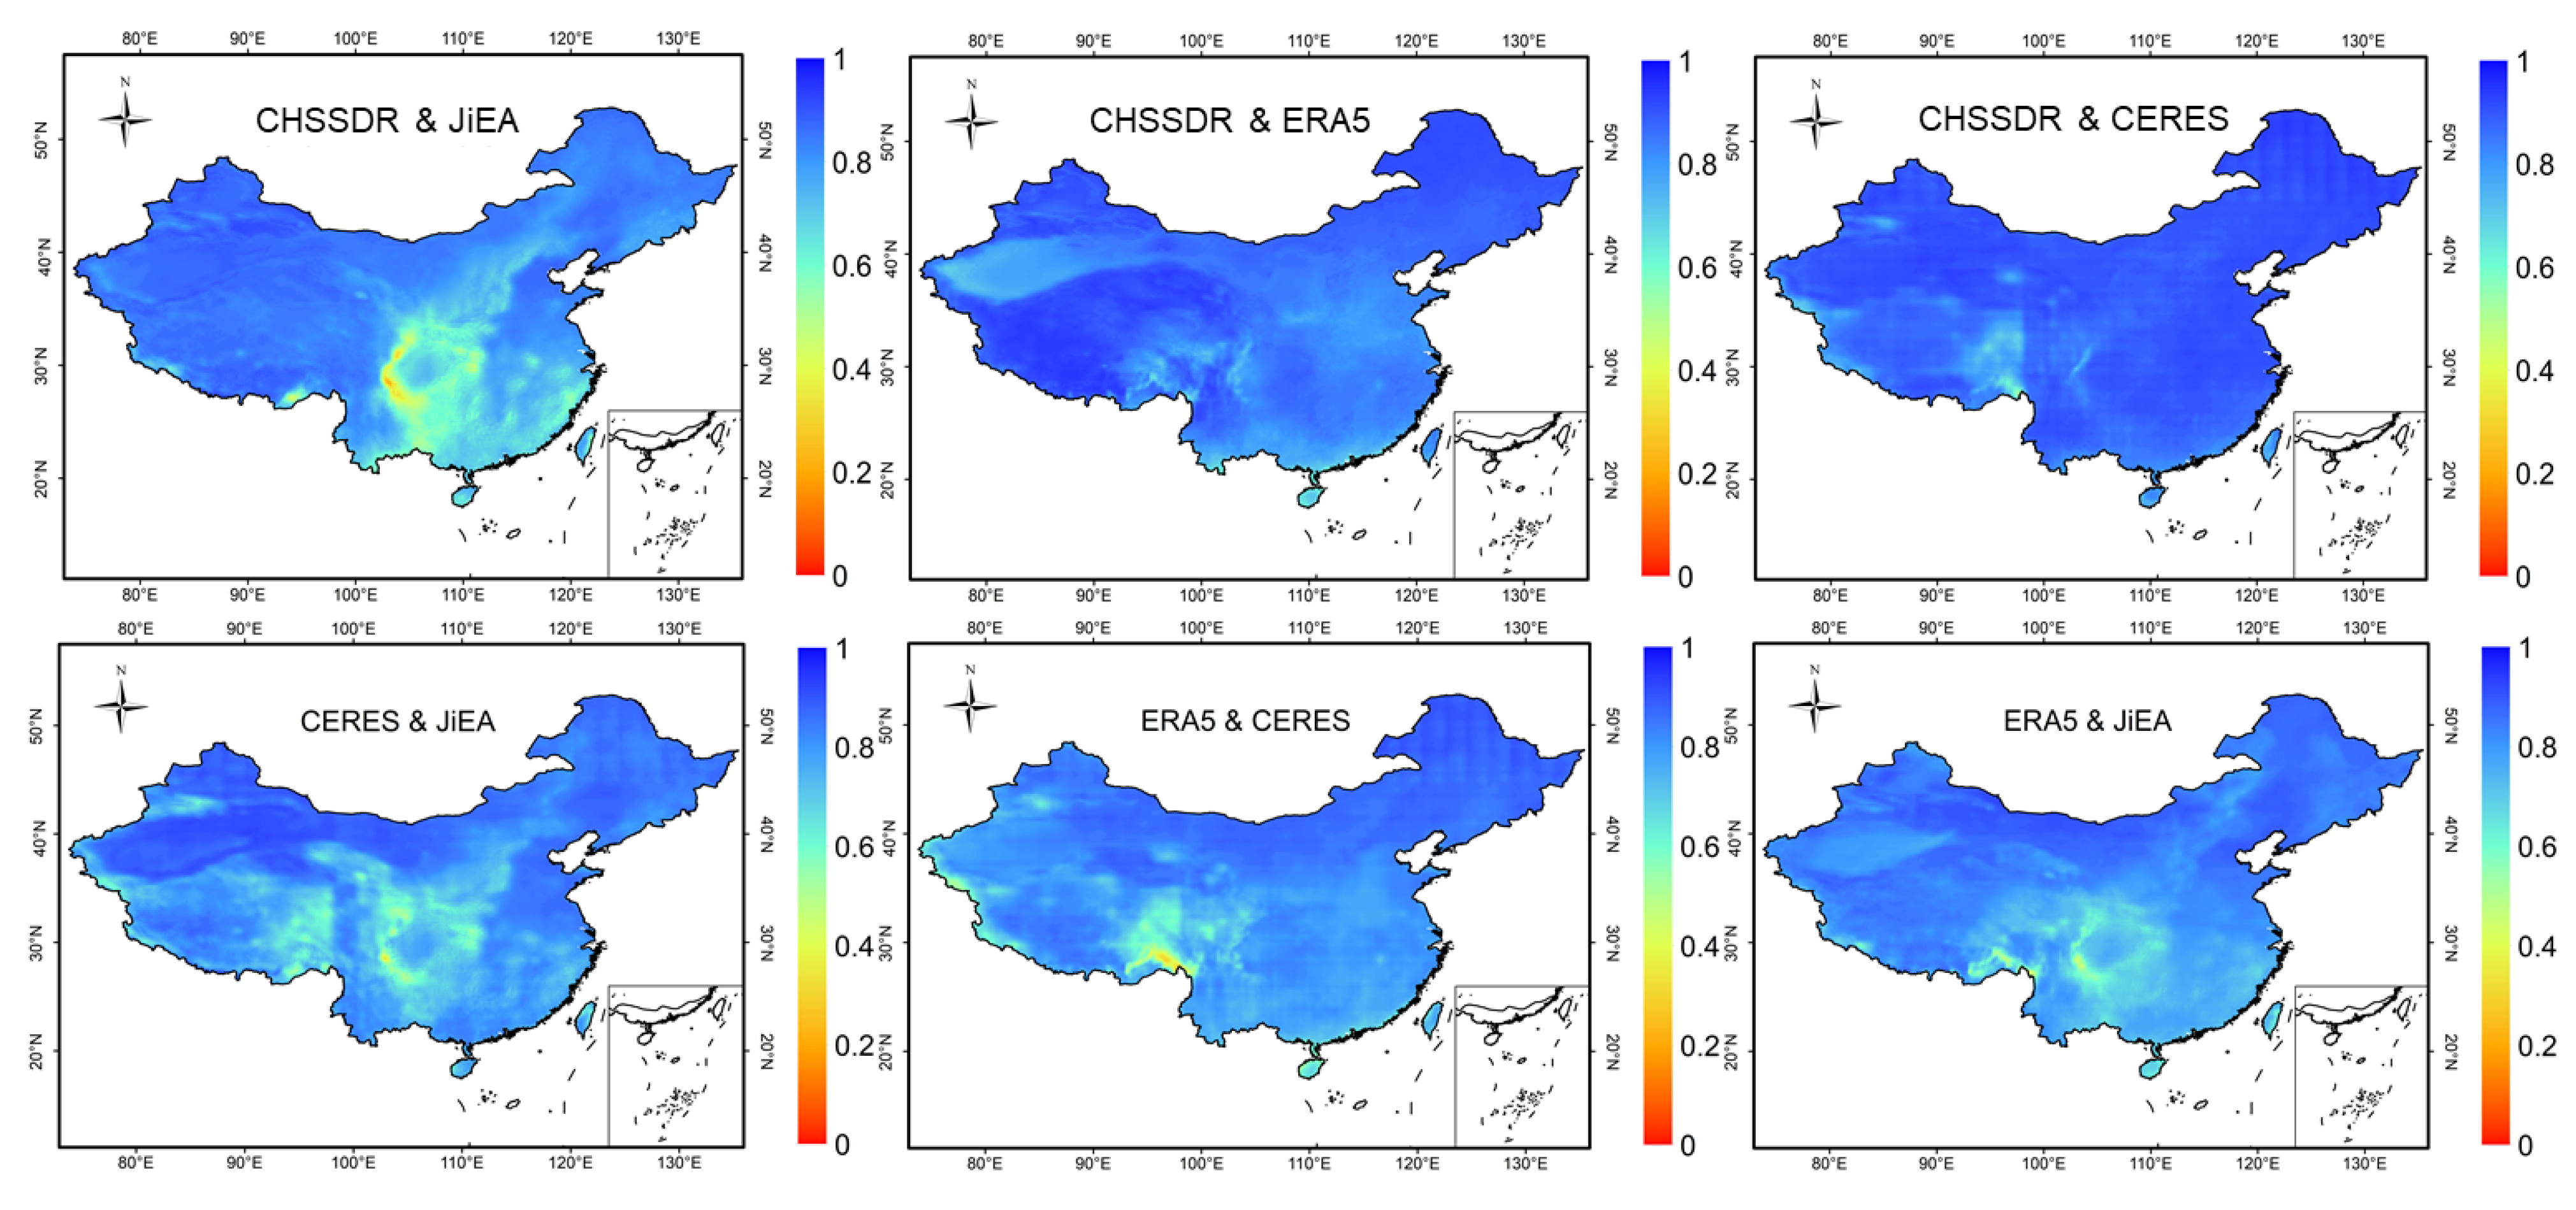
3.2.2. Intercomparison Analysis of Multiple Diffused Radiation Products

Figure 7 depicts the spatial distribution of the CV R values of four diffuse solar radiation products. The R values among JiEA, ERA5, and CERES products are generally higher in Northeast, Northwest, Inner Mongolia, and North China than in Middle and Lower Yangtze River, South China, Sichuan-Chongqing, and the surrounding areas. The gap in accuracy is due to southeastern proximity to the ocean, plenty of water, and frequent cloud and rain activities, all of which result in inferior quality diffuse radiation products. For example, in Northeast China, the R values of ERA5&CERES, ERA5&JiEA, and CERES&JiEA are 0.87, 0.85, and 0.85, respectively, whereas the R values in South China are 0.76, 0.74, and 0.77, respectively. In Northeast, Northwest, Inner Mongolia, and North China, the correlation coefficients R values between CHSSDR&JiEA, CHSSDR&ERA5, and CHSSDR&CERES are generally higher. In the Middle and Lower Yangtze River, South China, Sichuan-Chongqing, and the surrounding areas, the correlation coefficient R values of CHSSDR&JiEA are lower than those of CHSSDR&ERA5 and CHSSDR&CERES, with R values of 0.75, 0.68, and 0.60, respectively. In the Southeast, these four products are poorly correlated, which is linked with high cloud activity and overall cloudiness throughout the year.

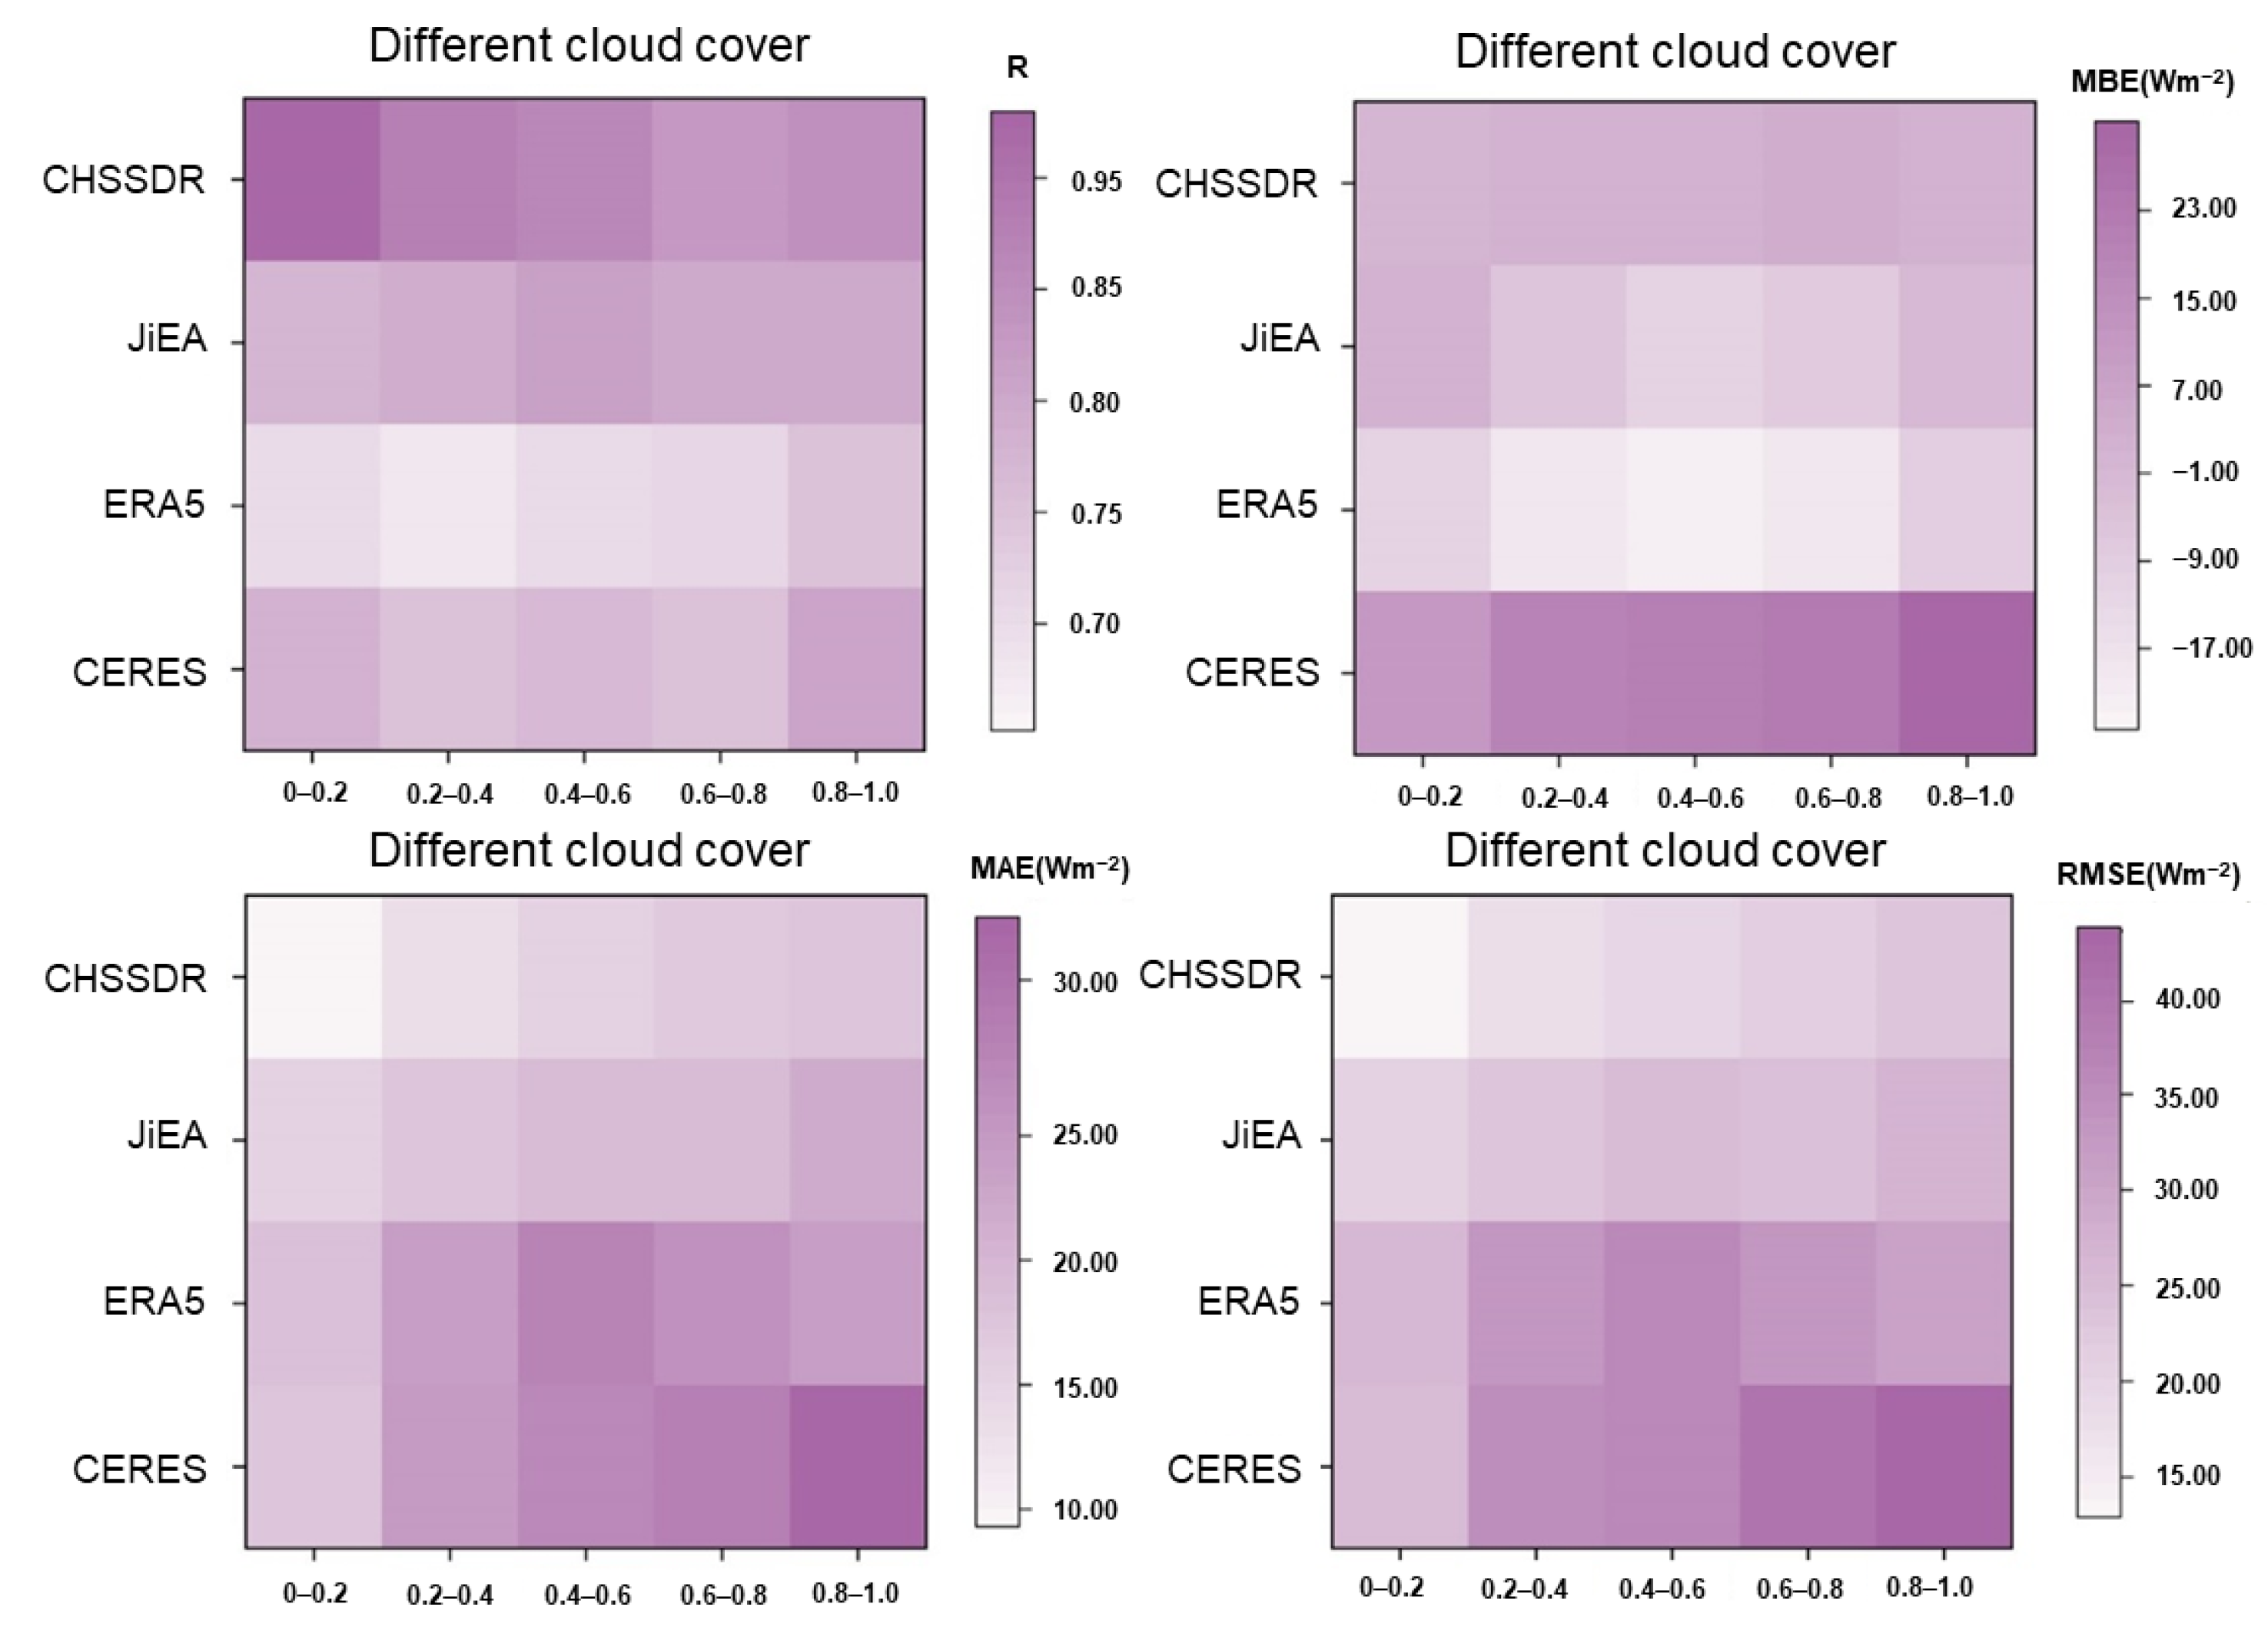
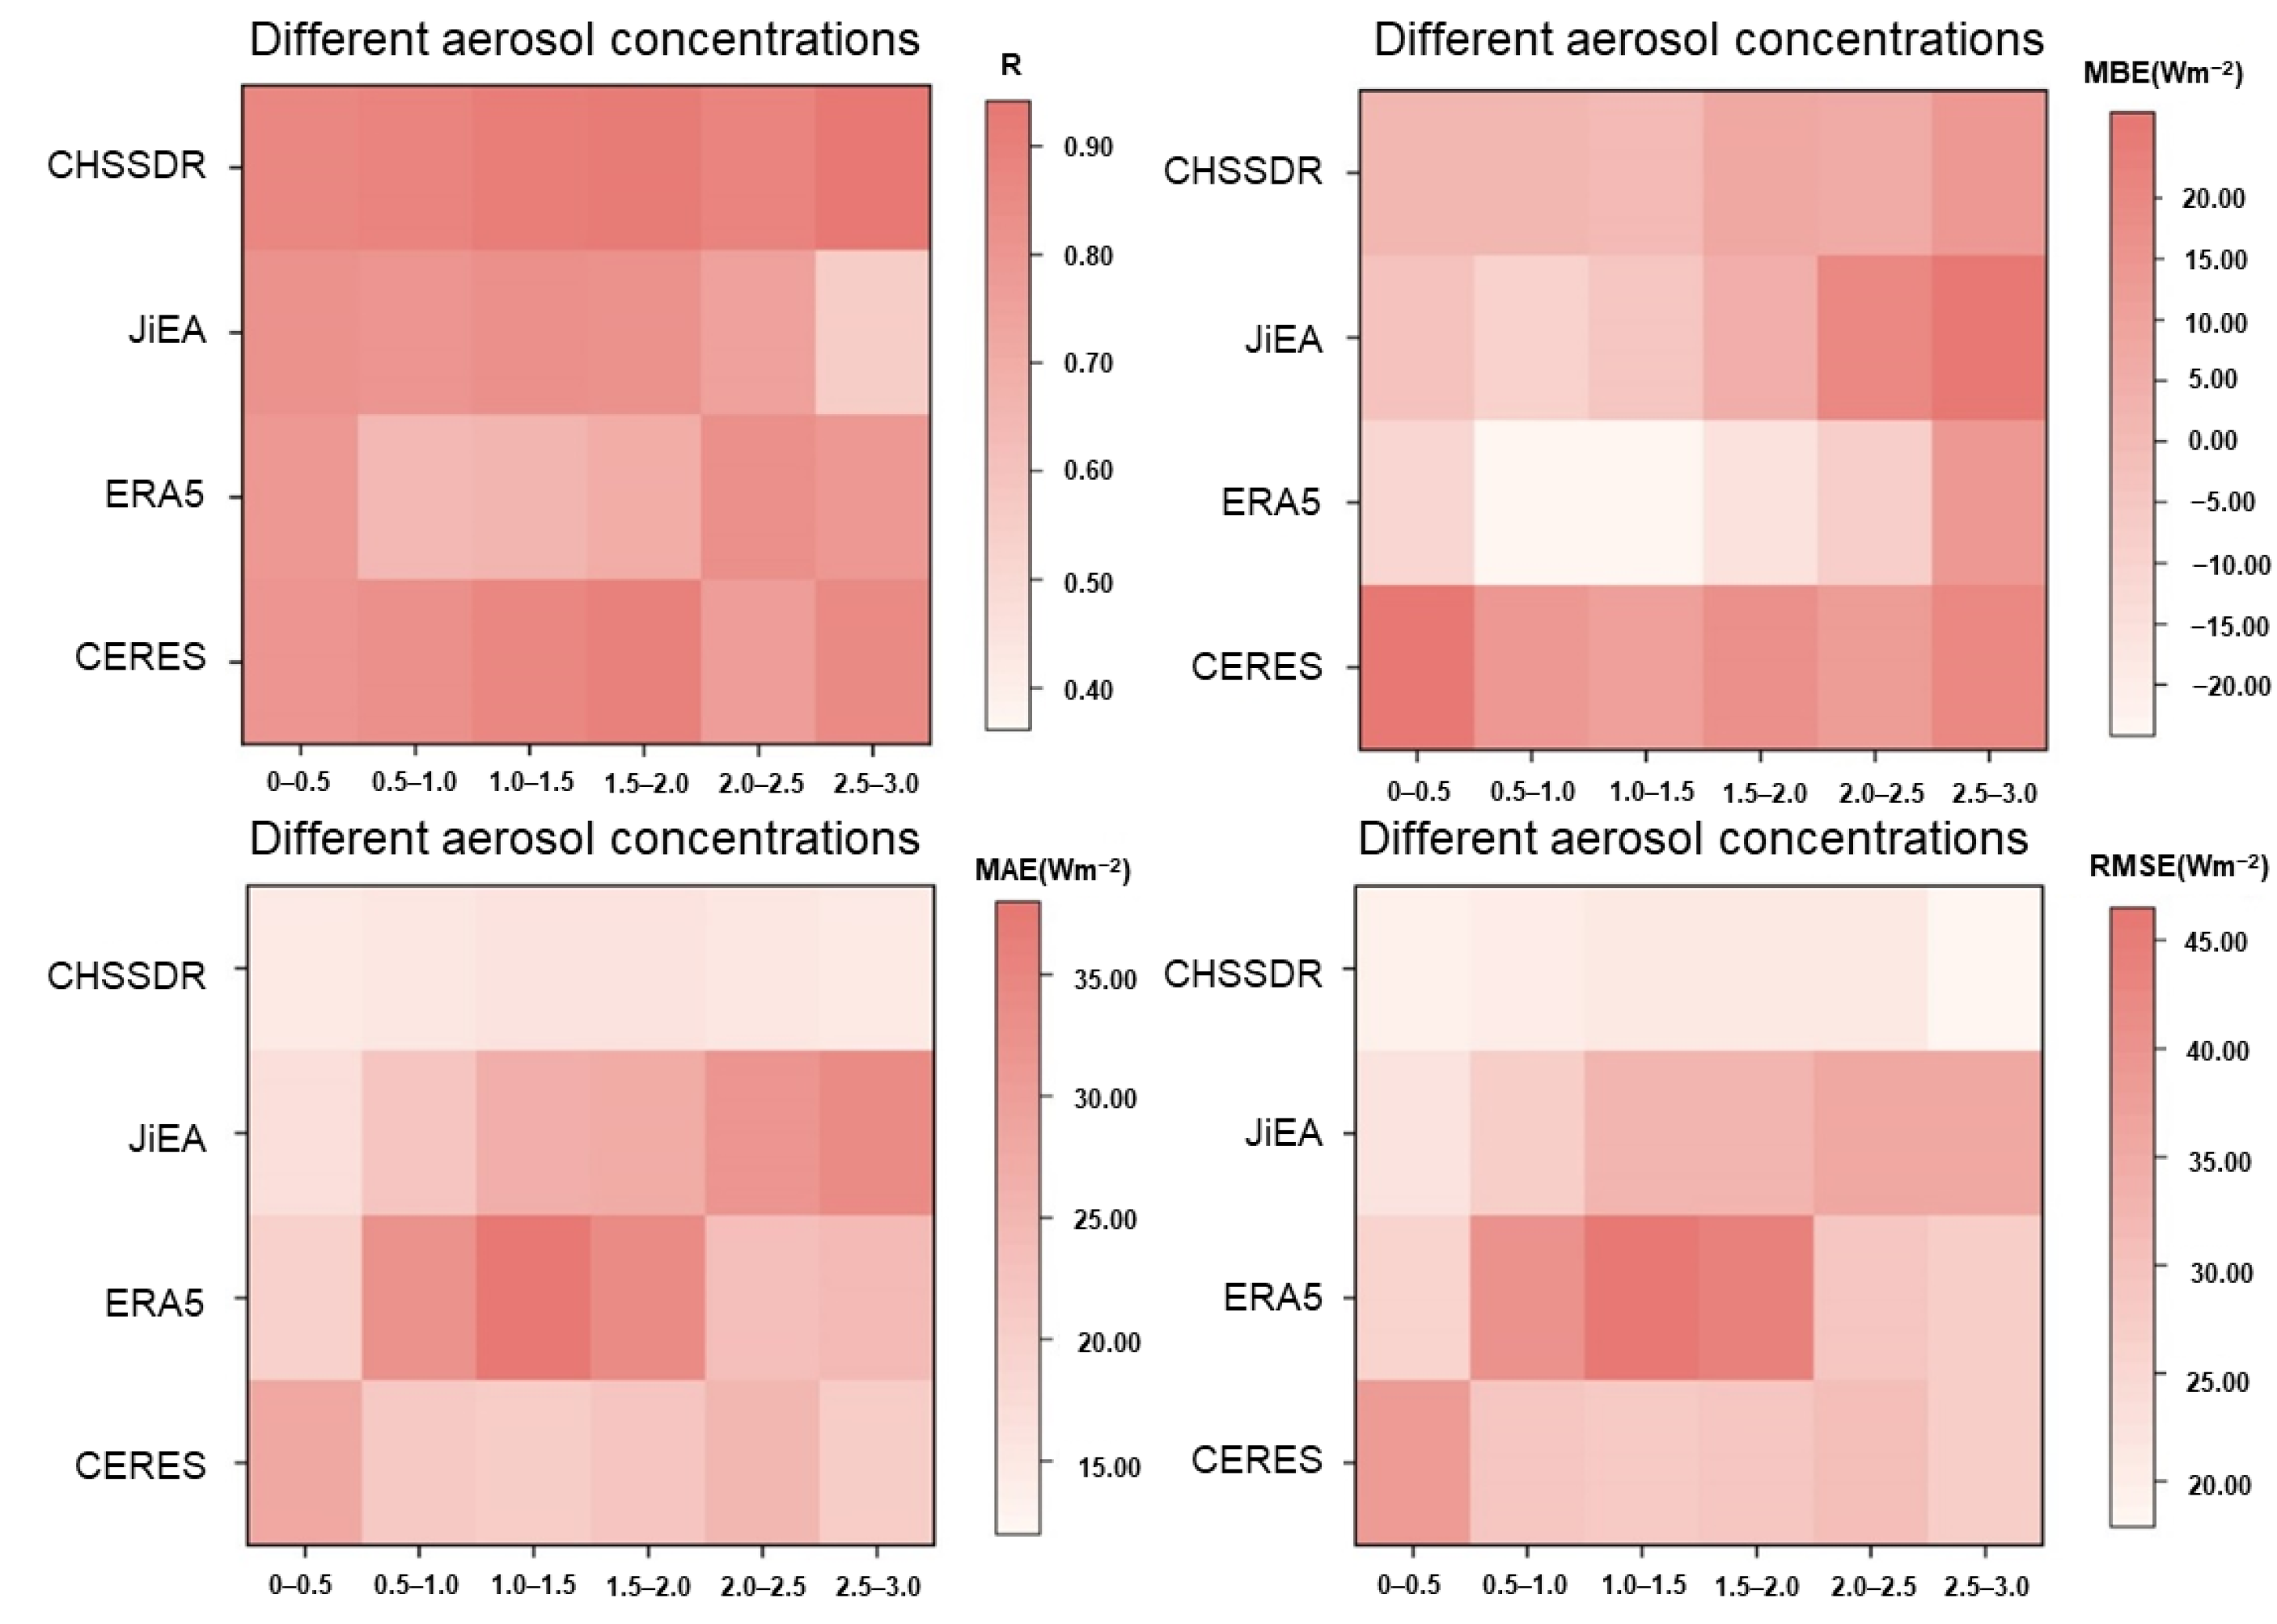
3.2.3. Error Comparison under the Different Conditions

The accuracy of four diffuse solar radiation products under different cloud cover conditions is compared, with the variation of each validation index presented in Figure 8. Total cloud cover data were derived from the ERA5-single dataset and separated into five intervals, based on maximum and minimum values: 0~0.2, 0.2~0.4, 0.4~0.6, 0.6~0.8, and 0.8~1.0. The R value of each diffuse solar radiation product varies with the amount of cloud. The R values in the range 0~0.2 are in the order of the CHSSDR (0.91) > CERES (0.78) > JiEA (0.77) > ERA5 (0.70). The R values are in the order of the CHSSDR (0.85) > CERES (0.81) > JiEA (0.80) > ERA5 (0.75), in the range 0.8~1.0. As such, the higher the cloud cover, the lower the accuracy of the diffuse solar radiation products. The MBE values of CERES are all positive and rise with increasing cloud cover, thus resulting in larger overestimation (MBEmax = 30.83 Wm−2). All the MBE values in ERA5 are negative, indicating significant underestimation (MBEmin = −22.65 Wm−2). The MBE value of JiEA is positive only in the interval 0~0.2 and then becomes negative as the cloud cover increases. The MBE values of CHSSDR are all positive, with the highest MBE value of 3.29 Wm−2 in the five intervals. The CERES has the highest deviation under different cloud cover conditions, with MAEmax = 30.83 Wm−2 and RMSEmax = 40.05 Wm−2. CHSSDR has the least deviation, with MAEmax = 17.91 Wm−2 and RMSEmax = 17.91 Wm−2. Overall, CHSSDR has the highest R value and lowest deviation among the four diffuse solar radiation products.
In addition, we also compared the accuracy of four diffuse solar radiation products under different aerosol concentrations conditions, with the variation of each validation index presented in Figure 9. Aerosol optical depth data were derived from the MERRA-2 dataset and separated into six intervals, based on maximum and minimum values: 0~0.5, 0.5~1.0, 1.0~1.5, 1.5~2.0, 2.0~2.5, and 2.5~3.0. The R values in the range 0~0.5 are in the order of the CHSSDR (0.86) > JiEA (0.82) > CERES (0.80) > ERA5 (0.78). The R values are in the order of the CHSSDR (0.94) > CERES (0.85) > ERA5 (0.79) > JiEA (0.55), in the range 2.5~3.0. One obvious phenomenon is that the R value of JiEA falls dramatically with increasing aerosol concentration. Aerosol has a complex chemical makeup; because of the atmospheric environment, it is prone to secondary chemical changes, which can affect product accuracy [67]. The MBE values of CERES are all positive, indicating large overestimation (MBEmax = 30.83 Wm−2). ERA5 still reveals significant underestimation (MBEmin = −23.06 Wm−2). The highest MBE values of CHSSDR and JiEA are 13.84 and 22.03 Wm−2. The ERA5 has the highest deviation under different aerosol concentrations, with MAEmax = 36.48 Wm−2 and RMSEmax = 46.44 Wm−2. CHSSDR has the least deviation, with MAEmax =16.01 Wm−2 and RMSEmax =21.51 Wm−2. For a variety of aerosol concentration conditions, the deviations (MAE and RMSE) of all four diffuse solar radiation products rise with increasing aerosol concentration. In general, CHSSDR has the highest R value and lowest deviation among the four diffuse solar radiation products.

3.3. Spatial and Temporal Distribution of Diffuse Solar Radiation

3.3.1. Dataset Availability

The 39-year (1982–2020) daily diffuse solar radiation dataset (CHSSDR) constructed in this study has been uploaded to figshare; users can link to specific data entities for each year through https://doi.org/10.6084/m9.figshare.19352036.v1. Each data file is named “DIF data xxxx,”, with xxxx signifying the year. The latitude and longitude ranges for CHSSDR are 73.45°W, 53.55°N, 134.55°E, 17.95°S, with 356 × 611 ranks in Wm−2. The filename suffix.nc denotes that the data was saved in NetCDF format; users can visit http://www.unidata.ucar.edu/software/netcdf (last access: 25 July 2022) for additional information regarding NetCDF.

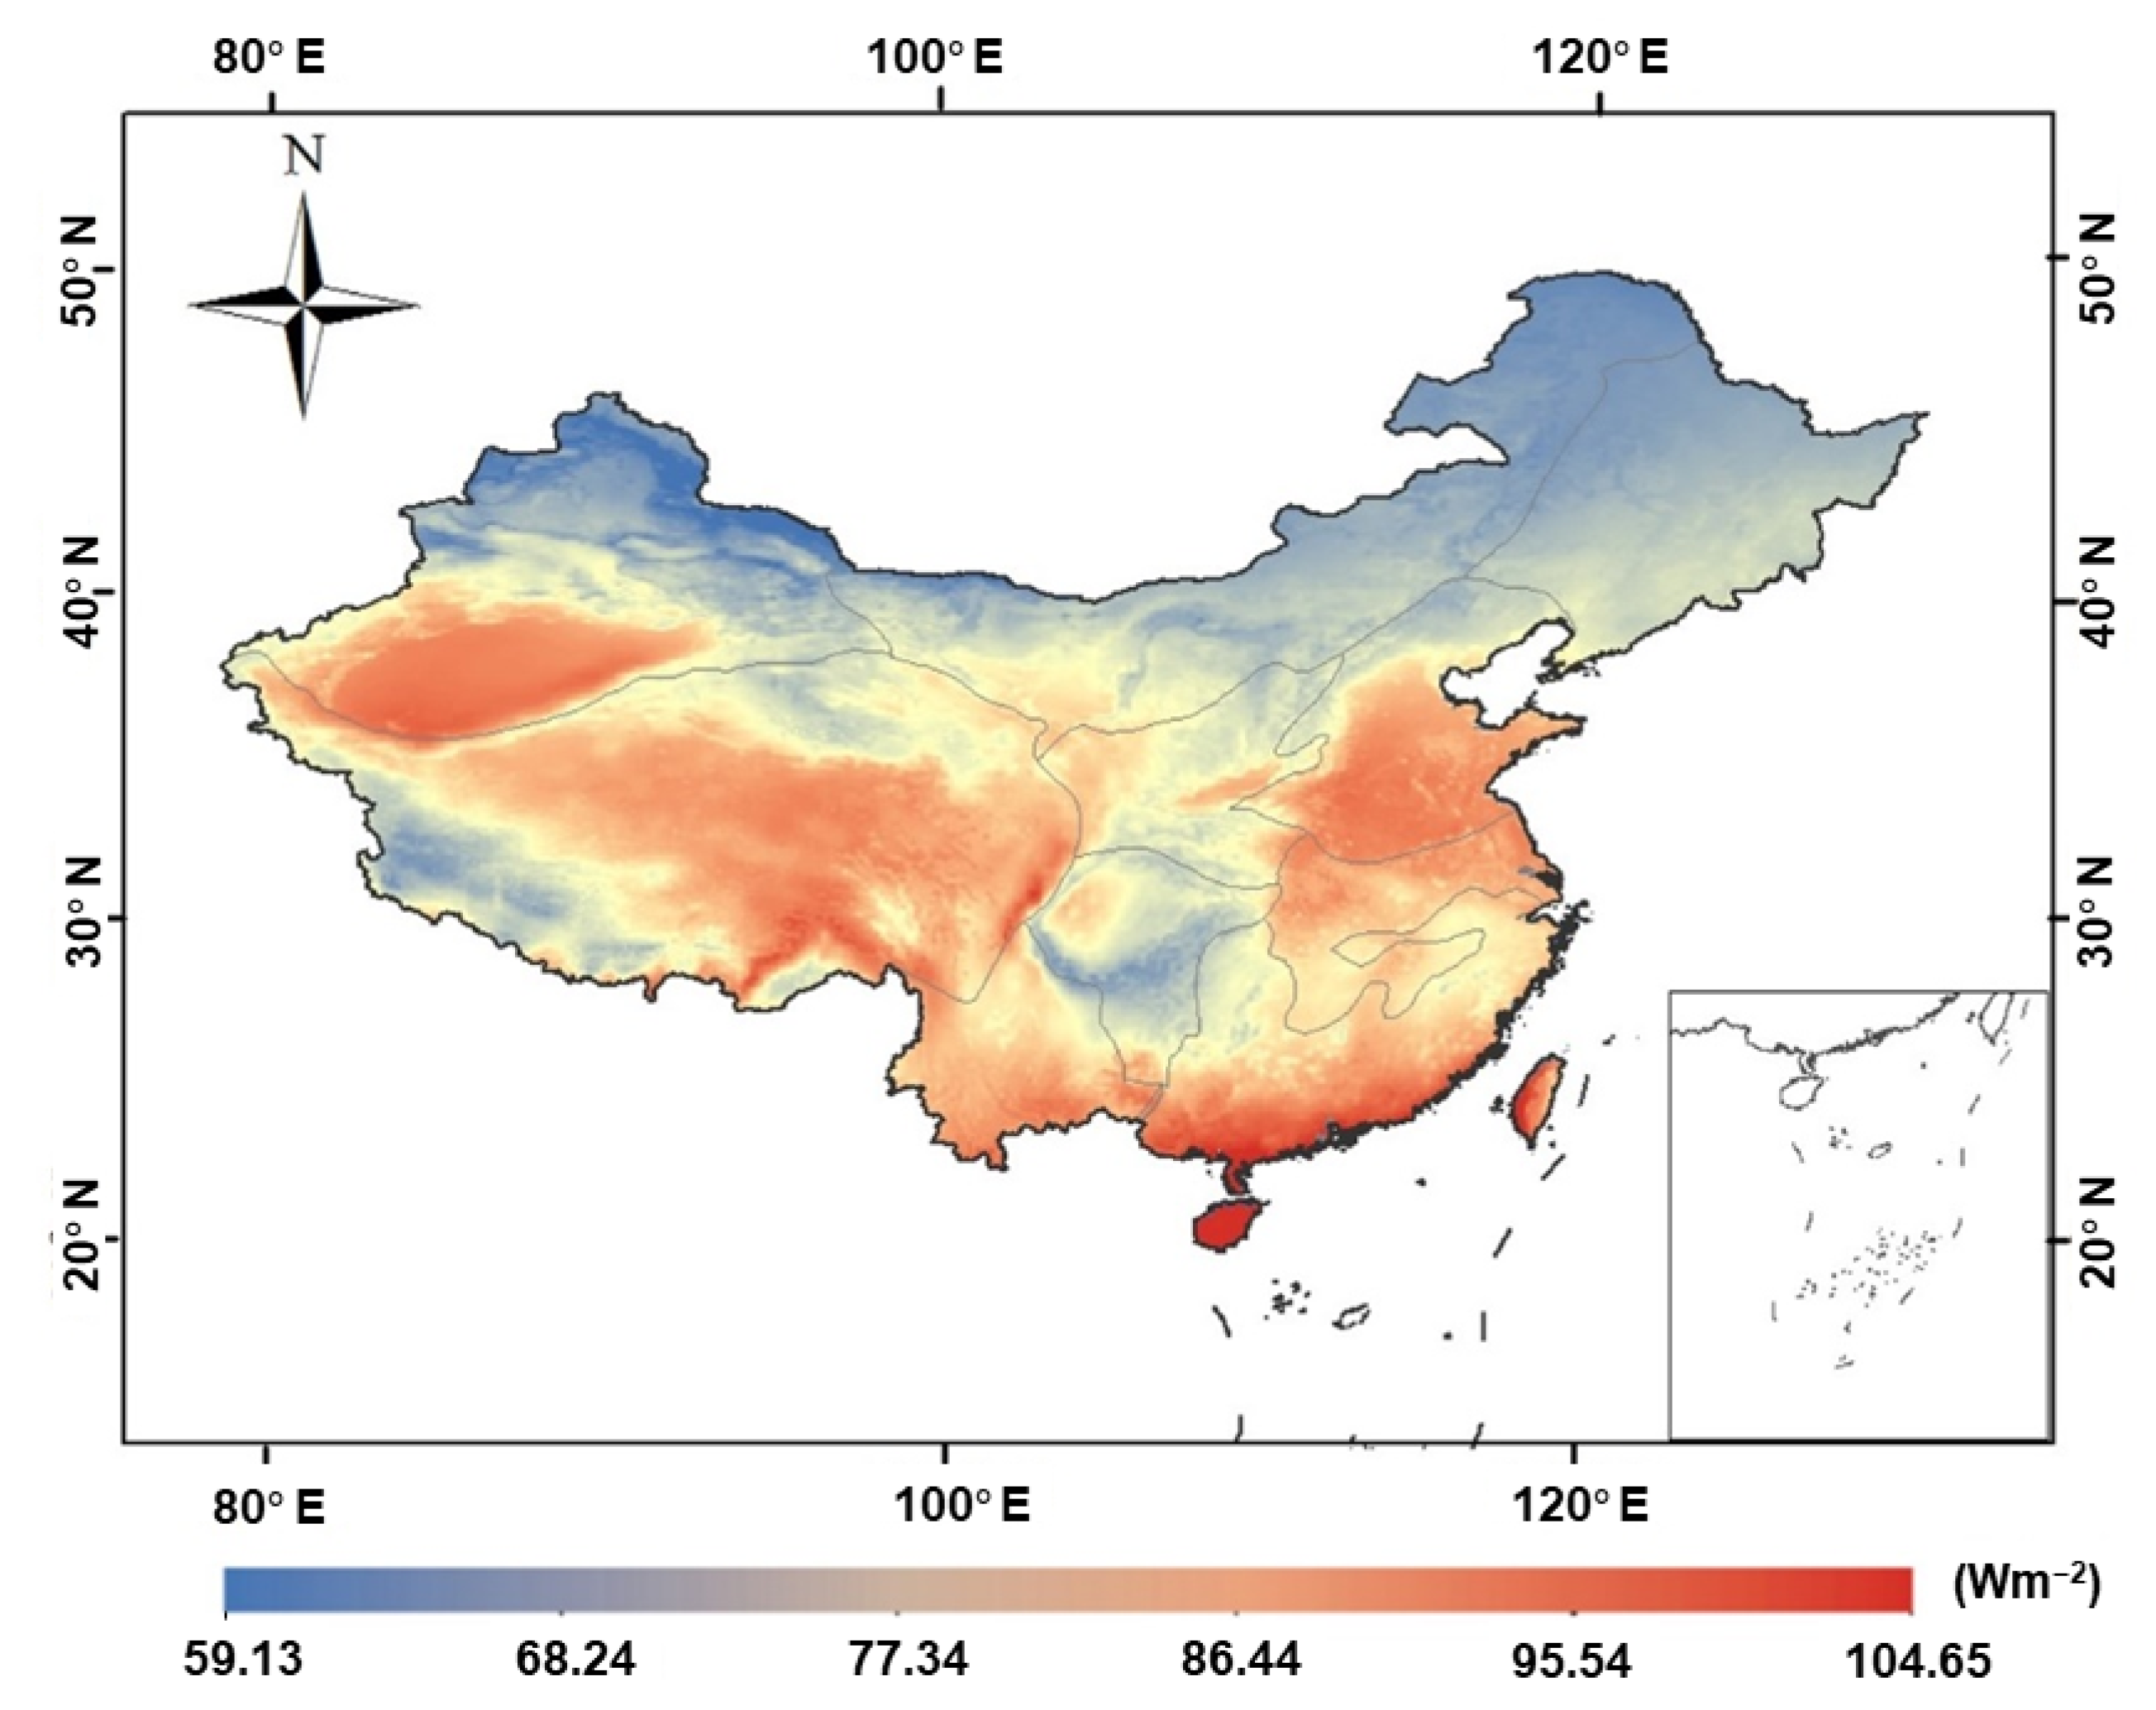
3.3.2. Annual Average Spatial Distribution of Diffuse Solar Radiation

Figure 10 shows the spatial distribution of multi-year average diffuse solar radiation in China from 1982 to 2020. The diffuse solar radiation values range from 59.13 to 104.65 Wm−2, with a 39-year average value of 79.39 Wm−2. Generally, low latitude and low altitude regions have larger diffuse solar radiation than high latitude and high altitude regions, and eastern China had less diffuse solar radiation than western China. The highest value of diffuse solar radiation is located in South China, with an average value of 85.16 Wm−2. The higher value of diffuse solar radiation around the Qinghai-Tibet Plateau, with an average value of 82.02 Wm−2, owing to the high altitude of the Qinghai-Tibet Plateau region and weak scattering effect of air molecules. Due to the presence of sand and dust particles with enhanced scattering effects, the diffuse solar radiation values in the northwest are relatively high, with an average value of 77.04 Wm−2. The average value of diffuse solar radiation in the Sichuan-Chongqing and surrounding areas is 75.97 Wm−2. The diffuse solar radiation values in the Sichuan basin are higher than in the surrounding areas because the topographical features of the enclosed basin cause an accumulation of pollutants and water vapor in the air, as well as a reduction in atmospheric transparency, which increases solar radiation absorption and scattering.

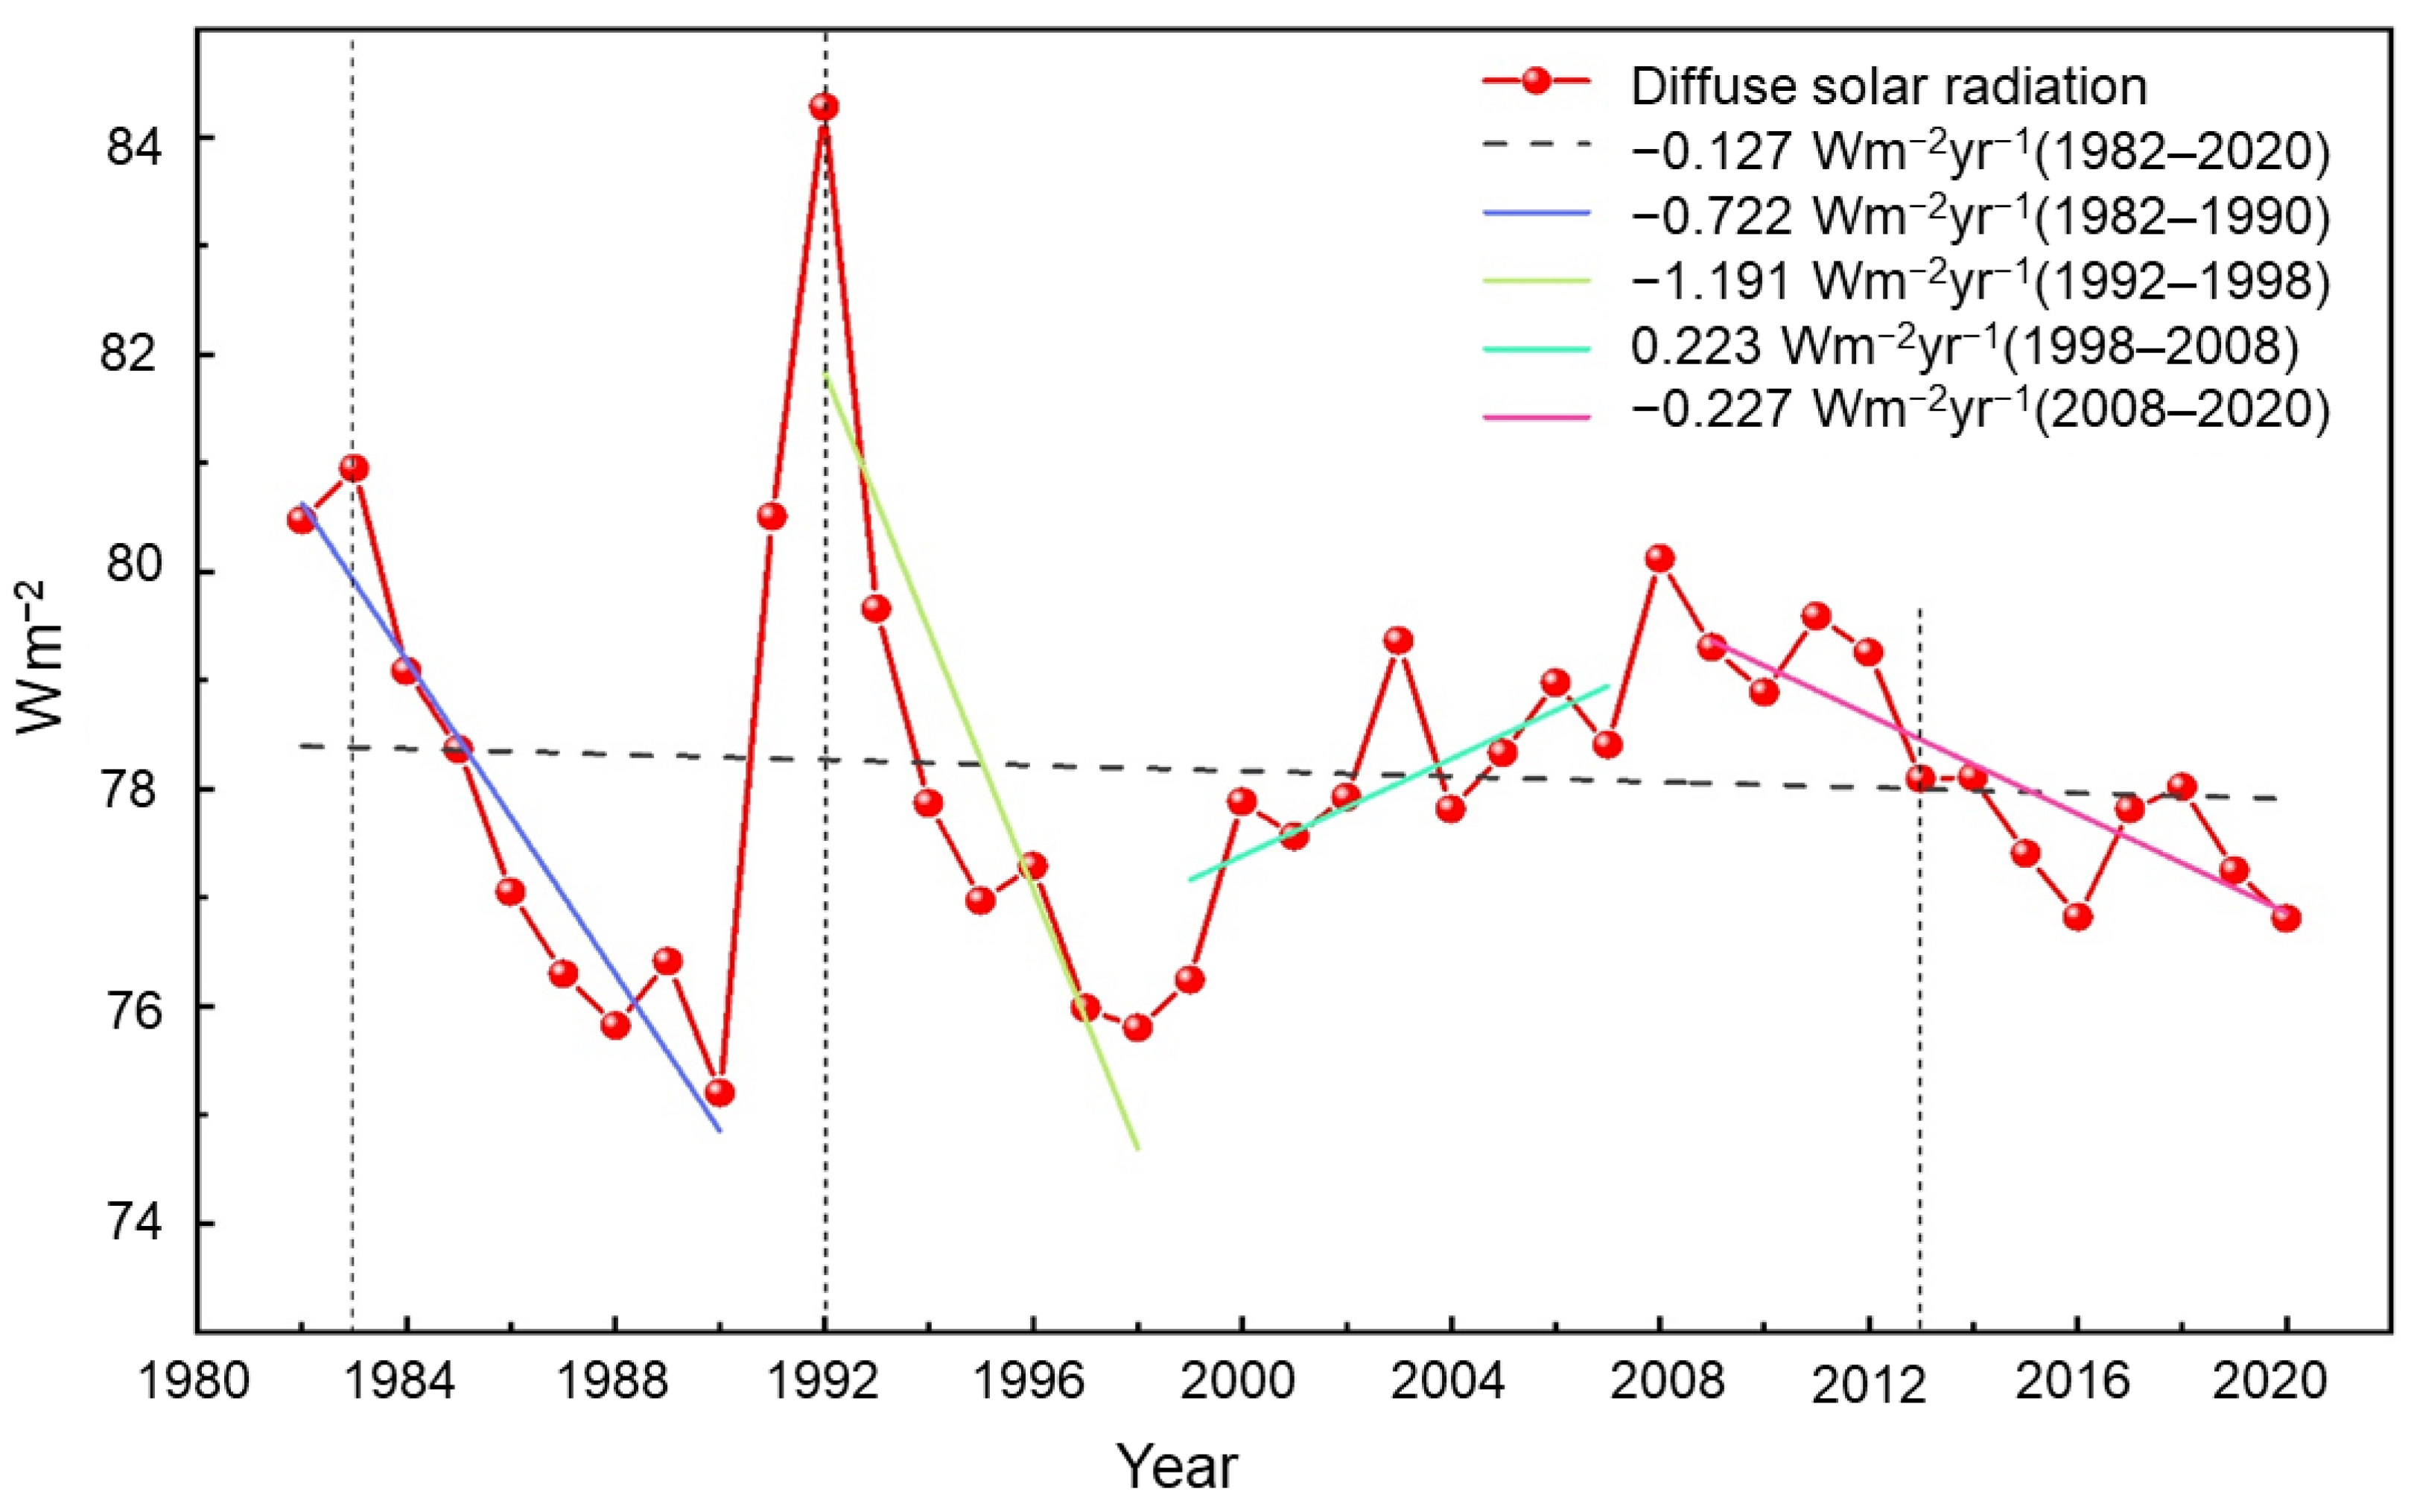
3.3.3. Interannual Variation Trend of Diffuse Solar Radiation

The interannual variation trend of diffuse solar radiation in China from 1982 to 2020 is shown in Figure 11. In general, diffuse solar radiation shows a slight decrease tendency (−0.127 Wm−2yr−1), with annual average values ranging from 75.80 to 84.28 Wm−2. From 1982 to 1990, diffuse solar radiation decreases with a trend of −0.722 Wm−2yr−1; from 1992 to 1998, the decreasing trend increases significantly (−1.191 Wm−2yr−1); from 1998 to 2008, diffuse solar radiation has a slightly increasing trend (0.223 Wm−2yr−1); and from 2008 to 2020, diffuse solar radiation decreases with a trend of −0.227 Wm−2yr−1. Since 1980, the global solar radiation has changed from a decreasing to increasing trend (also known as “global brightening”), but this change has only occurred locally (in Europe and the United States), and the “brightening” trend is not visible in areas such as China and India, which is consistent with the decreasing trend calculated in this study for 1982–1990. By evaluating the trend of solar radiation from 1961 to 2000, several studies concluded that solar radiation across China showed a declining tendency [68], which also proves the decreasing trend of diffuse solar radiation from 1982 to 1990 from the side. In 1982, a high value of diffuse solar radiation (80.95 Wm−2) occurred in China, which was caused by the eruption of Mexico’s El Chichón volcano [69]. Additionally, in 1992, another peak of diffuse solar radiation (84.28 Wm−2) appearred, due to the eruption of the Pinatubo volcano in the Philippine Islands in 1991 [70]. Large volumes of smoke and ash were released into the atmosphere during volcanic eruptions, thus resulting in a substantial increase in aerosol particle concentrations. After 2000, diffuse solar radiation gradually increased in China, owing to rapidly growing sulfur emissions in Asia, exceeding those in Western countries [71]. However, the increasing trend did not last and turned into a decreasing trend in 2008, which was linked to the country’s promotion of energy conservation and emission reduction efforts [72].

4. Conclusions

In this study, we used the ensemble model (GAM), which integrated six base learners, such as CNN, GBDT, RF, SVR, XGB, and DNN, to construct a 39-year (1982–2020) daily surface diffuse solar radiation dataset (CHSSDR) across China. Predictor variables were derived from ERA5 and MERRA_2 reanalysis data. The GAM showed satisfactory performance with sample-based, site-based, and by-year CV R values of 0.88, 0.84, and 0.86, respectively. After model training, the model produced daily diffuse solar radiation predictions at 10 km × 10 km grid cells.
The validation results between the four diffuse solar radiation products (CERES, ERA5, JiEA, and CHSSDR) and ground-based measurements revealed that CERES showed an overall overestimation, while ERA5 demonstrated a significant underestimation. CHSSDR had the highest consistency, with observations with an R value of 0.87, MAE value of 15.06 Wm−2, and RMSE value of 20.22 Wm−2. The accuracy of diffuse solar radiation products was influenced by clouds and aerosols. Increases in the cloud and aerosol concentrations within a given range of values would result in the overestimation of CERES and CHSSDR, as well as a more significant underestimating of ERA5, and change JiEA from overestimation to the underestimation of diffuse solar radiation. The diffuse solar radiation values in China ranged from 59.13 to 104.65 Wm−2, with a multi-year average value of 79.39 Wm−2 from 1982 to 2020. South China, Yunnan, adjacent areas, the Middle and Lower Yangtze River, North China, the Qinghai-Tibet Plateau, and the Sichuan Basin are the higher-value areas of diffuse solar radiation distribution, while the Northeast Plain and Inner Mongolia have lower values. The interannual variation trend of diffuse solar radiation in China from 1982 to 2020 showed a slight decrease tendency (−0.127 Wm−2yr−1), with annual average values ranging from 75.80 Wm−2 to 84.28 Wm−2.
We have preliminarily constructed a diffuse solar radiation dataset for a long time series in China, but we cannot expand the dataset to a longer period, due to a lack of AOD data. In the future, we will further seek solutions to data deficits by applying the ensemble model (GAM) to generate global diffuse solar radiation datasets for a more thorough spatial and temporal investigation of diffuse solar radiation. In addition, this study did not compare the gain in accuracy and computational cost with other GAM-based methods. These works will be further carried out in the future.

Author Contributions

J.W., H.F. and W.Q. designed the research; J.W. and H.F. performed the experiments and analyzed the data; J.W. wrote the manuscript; W.Q., L.W., Y.S., X.S. and Y.Z. revised the manuscript. All authors have read and agreed to the published version of the manuscript.

Funding

This work was financially supported by the National Natural Science Foundation of China (No. 42001016) and Special Fund for Basic Scientific Research of Central Colleges, China University of Geosciences, Wuhan (No. 111-162301182738).

Data Availability Statement

The ERA5-land (https://cds.climate.copernicus.eu/cdsapp#!/dataset/reanalysis-era5-land?tab=overview, last access: 25 July 2022), ERA5-single (https://cds.climate.copernicus.eu/cdsapp#!/dataset/reanalysis-era5-single-levels?tab=overview, last access: 25 July 2022), and MERRA_2 (https://disc.gsfc.nasa.gov/datasets?page=1&subject=Aerosols&project=MERRA-2, last access: 25 July 2022) data used in this study are freely available.

Acknowledgments

The authors gratefully acknowledge NASA and ECMWF for their effort in making the data available.

Conflicts of Interest

The authors declare no conflict of interest.

References

  1. Zhu, T.; Li, J.; He, L.; Wu, D.; Tong, X.; Mu, Q.; Yu, Q. The improvement and comparison of diffuse radiation models in different climatic zones of China. Atmos. Res. 2021, 254, 105505. [Google Scholar] [CrossRef]
  2. Wang, L.; Lu, Y.; Zou, L.; Feng, L.; Wei, J.; Qin, W.; Niu, Z. Prediction of diffuse solar radiation based on multiple variables in China. Renew. Sustain. Energy Rev. 2019, 103, 151–216. [Google Scholar] [CrossRef]
  3. Alton, P.B.; North, P.R.; Los, S.O. The impact of diffuse sunlight on canopy light-use efficiency, gross photosynthetic product and net ecosystem exchange in three forest biomes. Global Change Biol. 2007, 13, 776–787. [Google Scholar] [CrossRef]
  4. Kanniah, K.D.; Beringer, J.; North, P.; Hutley, L. Control of atmospheric particles on diffuse radiation and terrestrial plant productivity: A review. Prog. Phys. Geog. 2012, 36, 209–237. [Google Scholar] [CrossRef]
  5. Mercado, L.M.; Bellouin, N.; Sitch, S.; Boucher, O.; Huntingford, C.; Wild, M.; Cox, P.M. Impact of changes in diffuse radiation on the global land carbon sink. Nature 2009, 458, 1014–1017. [Google Scholar] [CrossRef] [Green Version]
  6. Misson, L.; Lunden, M.; McKay, M.; Goldstein, A.H. Atmospheric aerosol light scattering and surface wetness influence the diurnal pattern of net ecosystem exchange in a semi-arid ponderosa pine plantation. Agr. Forest Meteorol. 2005, 129, 69–83. [Google Scholar] [CrossRef]
  7. Lee, M.S.; Hollinger, D.Y.; Keenan, T.F.; Ouimette, A.P.; Ollinger, S.V.; Richardson, A.D. Model-based analysis of the impact of diffuse radiation on CO2 exchange in a temperate deciduous forest. Agr. Forest Meteorol. 2018, 249, 377–389. [Google Scholar] [CrossRef] [Green Version]
  8. Prăvălie, R.; Patriche, C.; Bandoc, G. Spatial assessment of solar energy potential at global scale. A geographical approach. J. Clean. Prod. 2019, 209, 692–721. [Google Scholar] [CrossRef]
  9. Kim, C.K.; Kim, H.; Kang, Y.; Yun, C.; Kim, B.; Kim, J.Y. Solar Resource Potentials and Annual Capacity Factor Based on the Korean Solar Irradiance Datasets Derived by the Satellite Imagery from 1996 to 2019. Remote Sens. 2021, 13, 3422. [Google Scholar] [CrossRef]
  10. Sanchez-Lorenzo, A.; Enriquez-Alonso, A.; Wild, M.; Trentmann, J.; Vicente-Serrano, S.M.; Sanchez-Romero, A.; Posselt, R.; Hakuba, M.Z. Trends in downward surface solar radiation from satellites and ground observations over Europe during 1983–2010. Remote Sens. Environ. 2017, 189, 108–117. [Google Scholar] [CrossRef] [Green Version]
  11. Cano, D.; Monget, J.; Albuisson, M.; Guillard, H.; Regas, N.; Wald, L. A method for the determination of the global solar radiation from meteorological satellite data. Sol. Energy 1986, 37, 31–39. [Google Scholar] [CrossRef] [Green Version]
  12. Beyer, H.G.; Costanzo, C.; Heinemann, D. Modifications of the Heliosat procedure for irradiance estimates from satellite images. Sol. Energy 1996, 56, 207–212. [Google Scholar] [CrossRef]
  13. Laguarda, A.; Giacosa, G.; Alonso-Suárez, R.; Abal, G. Performance of the site-adapted CAMS database and locally adjusted cloud index models for estimating global solar horizontal irradiation over the Pampa Húmeda. Sol. Energy 2020, 199, 295–307. [Google Scholar] [CrossRef]
  14. Rusen, S.E.; Konuralp, A. Quality control of diffuse solar radiation component with satellite-based estimation methods. Renew. Energy 2020, 145, 1772–1779. [Google Scholar] [CrossRef]
  15. Oh, M.; Kim, C.K.; Kim, B.; Yun, C.; Kim, J.; Kang, Y.; Kim, H. Analysis of minute-scale variability for enhanced separation of direct and diffuse solar irradiance components using machine learning algorithms. Energy 2022, 241, 122921. [Google Scholar] [CrossRef]
  16. Qin, J.; Tang, W.; Yang, K.; Lu, N.; Niu, X.; Liang, S. An efficient physically based parameterization to derive surface solar irradiance based on satellite atmospheric products. J. Geophys. Res. Atmos. 2015, 120, 4975–4988. [Google Scholar] [CrossRef]
  17. Jiang, H.; Lu, N.; Qin, J.; Yao, L. Hourly 5-km surface total and diffuse solar radiation in China, 2007–2018. Sci. Data 2020, 7, 1–12. [Google Scholar] [CrossRef]
  18. Tang, W.; Qin, J.; Yang, K.; Liu, S.; Lu, N.; Niu, X. Retrieving high-resolution surface solar radiation with cloud parameters derived by combining MODIS and MTSAT data. Atmos. Chem. Phys. 2016, 16, 2543–2557. [Google Scholar] [CrossRef] [Green Version]
  19. Jiang, H.; Lu, N.; Qin, J.; Tang, W.; Yao, L. A deep learning algorithm to estimate hourly global solar radiation from geostationary satellite data. Renew. Sustain. Energy Rev. 2019, 114, 109327. [Google Scholar] [CrossRef]
  20. Tang, W.; Yang, K.; Qin, J.; Li, X.; Niu, X. A 16-year dataset (2000–2015) of high-resolution (3 h, 10 km) global surface solar radiation. Earth Syst. Sci. Data 2019, 11, 1905–1915. [Google Scholar] [CrossRef] [Green Version]
  21. Şenkal, O.; Kuleli, T. Estimation of solar radiation over Turkey using artificial neural network and satellite data. Appl. Energ. 2009, 86, 1222–1228. [Google Scholar] [CrossRef]
  22. Ouarda, T.B.M.J.; Charron, C.; Marpu, P.R.; Chebana, F. The Generalized Additive Model for the Assessment of the Direct, Diffuse, and Global Solar Irradiances Using SEVIRI Images, With Application to the UAE. IEEE J. Stars. 2016, 9, 1553–1566. [Google Scholar] [CrossRef] [Green Version]
  23. Cornejo-Bueno, L.; Casanova-Mateo, C.; Sanz-Justo, J.; Salcedo-Sanz, S. Machine learning regressors for solar radiation estimation from satellite data. Sol. Energy. 2019, 183, 768–775. [Google Scholar] [CrossRef]
  24. Yang, L.; Zhang, X.; Liang, S.; Yao, Y.; Jia, K.; Jia, A. Estimating surface downward shortwave radiation over china based on the gradient boosting decision tree method. Remote Sens. 2018, 10, 185. [Google Scholar] [CrossRef] [Green Version]
  25. Wang, Y.; Jiang, B.; Liang, S.; Wang, D.; He, T.; Wang, Q.; Zhao, X.; Xu, J. Surface Shortwave net radiation estimation from Landsat TM/ETM+ data using four machine learning algorithms. Remote Sens. 2019, 11, 2847. [Google Scholar] [CrossRef] [Green Version]
  26. Letu, H.; Yang, K.; Nakajima, T.Y.; Ishimoto, H.; Nagao, T.M.; Riedi, J.; Baran, A.J.; Ma, R.; Wang, T.; Shang, H. High-resolution retrieval of cloud microphysical properties and surface solar radiation using Himawari-8/AHI next-generation geostationary satellite. Remote Sens. Environ. 2020, 239, 111583. [Google Scholar] [CrossRef]
  27. Jamil, B.; Akhtar, N. Comparative analysis of diffuse solar radiation models based on sky-clearness index and sunshine period for humid-subtropical climatic region of India: A case study. Renew. Sustain. Energy Rev. 2017, 78, 329–355. [Google Scholar] [CrossRef]
  28. Jamil, B.; Akhtar, N. Comparison of empirical models to estimate monthly mean diffuse solar radiation from measured data: Case study for humid-subtropical climatic region of India. Renew. Sustain. Energy Rev. 2017, 77, 1326–1342. [Google Scholar] [CrossRef]
  29. Mubiru, J.; Banda, E. Performance of empirical correlations for predicting monthly mean daily diffuse solar radiation values at Kampala, Uganda. Theor. Appl. Climatol. 2007, 88, 127–131. [Google Scholar] [CrossRef]
  30. Sabzpooshani, M.; Mohammadi, K. Establishing new empirical models for predicting monthly mean horizontal diffuse solar radiation in city of Isfahan, Iran. Energy 2014, 69, 571–577. [Google Scholar] [CrossRef]
  31. Zhou, Y.; Wang, D.; Liu, Y.; Liu, J. Diffuse solar radiation models for different climate zones in China: Model evaluation and general model development. Energ. Convers. Manage. 2019, 185, 518–536. [Google Scholar] [CrossRef]
  32. Gueymard, C.A. Parameterized transmittance model for direct beam and circumsolar spectral irradiance. Sol. Energy 2001, 71, 325–346. [Google Scholar] [CrossRef]
  33. Lemos, L.F.; Starke, A.R.; Boland, J.; Cardemil, J.M.; Machado, R.D.; Colle, S. Assessment of solar radiation components in Brazil using the BRL model. Renew. Energy 2017, 108, 569–580. [Google Scholar] [CrossRef]
  34. Iqbal, M. An Introduction to Solar Radiation; Elsevier: Amsterdam, The Netherlands, 2012. [Google Scholar]
  35. Gueymard, C.A. REST2: High-performance solar radiation model for cloudless-sky irradiance, illuminance, and photosynthetically active radiation–Validation with a benchmark dataset. Sol. Energy 2008, 82, 272–285. [Google Scholar] [CrossRef]
  36. Gueymard, C. A two-band model for the calculation of clear sky solar irradiance, illuminance, and photosynthetically active radiation at the earth’s surface. Sol. Energy 1989, 43, 253–265. [Google Scholar] [CrossRef]
  37. Rehman, S.; Mohandes, M. Estimation of diffuse fraction of global solar radiation using artificial neural networks. Energy Sources Part A 2009, 31, 974–984. [Google Scholar] [CrossRef]
  38. Feng, Y.; Cui, N.; Zhang, Q.; Zhao, L.; Gong, D. Comparison of artificial intelligence and empirical models for estimation of daily diffuse solar radiation in North China Plain. Int. J. Hydrogen Energ. 2017, 42, 14418–14428. [Google Scholar] [CrossRef]
  39. Mellit, A.; Eleuch, H.; Benghanem, M.; Elaoun, C.; Pavan, A.M. An adaptive model for predicting of global, direct and diffuse hourly solar irradiance. Energ. Convers. Manage. 2010, 51, 771–782. [Google Scholar] [CrossRef]
  40. Schulz, K.; Hänsch, R.; Sörgel, U. Machine learning methods for remote sensing applications: An overview. Earth Resour. Environ. Remote. Sens./GIS Appl. IX 2018, 10790, 1079002. [Google Scholar]
  41. Letu, H.; Shi, J.; Li, M.; Wang, T.; Shang, H.; Lei, Y.; Ji, D.; Wen, J.; Yang, K.; Chen, L. A review of the estimation of downward surface shortwave radiation based on satellite data: Methods, progress and problems. Sci. China Earth Sci. 2020, 63, 774–789. [Google Scholar] [CrossRef]
  42. Bamisile, O.; Oluwasanmi, A.; Ejiyi, C.; Yimen, N.; Obiora, S.; Huang, Q. Comparison of machine learning and deep learning algorithms for hourly global/diffuse solar radiation predictions. Int. J. Energ. Res. 2021, 46, 10052–10073. [Google Scholar] [CrossRef]
  43. Aler, R.; Galván, I.M.; Ruiz-Arias, J.A.; Gueymard, C.A. Improving the separation of direct and diffuse solar radiation components using machine learning by gradient boosting. Sol. Energy 2017, 150, 558–569. [Google Scholar] [CrossRef]
  44. Fan, J.; Wang, X.; Zhang, F.; Ma, X.; Wu, L. Predicting daily diffuse horizontal solar radiation in various climatic regions of China using support vector machine and tree-based soft computing models with local and extrinsic climatic data. J. Clean. Prod. 2020, 248, 119264. [Google Scholar] [CrossRef]
  45. Jia, D.; Yang, L.; Lv, T.; Liu, W.; Gao, X.; Zhou, J. Evaluation of machine learning models for predicting daily global and diffuse solar radiation under different weather/pollution conditions. Renew. Energy 2022, 187, 896–906. [Google Scholar] [CrossRef]
  46. Benali, L.; Notton, G.; Fouilloy, A.; Voyant, C.; Dizene, R. Solar radiation forecasting using artificial neural network and random forest methods: Application to normal beam, horizontal diffuse and global components. Renew. Energy 2019, 132, 871–884. [Google Scholar] [CrossRef]
  47. Shamshirband, S.; Mohammadi, K.; Khorasanizadeh, H.; Yee, P.L.; Lee, M.; Petković, D.; Zalnezhad, E. Estimating the diffuse solar radiation using a coupled support vector machine–wavelet transform model. Renew. Sustain. Energy Rev. 2016, 56, 428–435. [Google Scholar] [CrossRef]
  48. Jović, S.; Aničić, O.; Marsenić, M.; Nedić, B. Solar radiation analyzing by neuro-fuzzy approach. Energ. Build. 2016, 129, 261–263. [Google Scholar] [CrossRef]
  49. Landeras, G.; López, J.J.; Kisi, O.; Shiri, J. Comparison of Gene Expression Programming with neuro-fuzzy and neural network computing techniques in estimating daily incoming solar radiation in the Basque Country (Northern Spain). Energy Convers. Manage. 2012, 62, 1–13. [Google Scholar] [CrossRef]
  50. Sanchez-Lorenzo, A.; Calbó, J.; Wild, M. Global and diffuse solar radiation in Spain: Building a homogeneous dataset and assessing their trends. Global Planet. Change 2013, 100, 343–352. [Google Scholar] [CrossRef]
  51. Yang, D.; Bright, J.M. Worldwide validation of 8 satellite-derived and reanalysis solar radiation products: A preliminary evaluation and overall metrics for hourly data over 27 years. Sol. Energy 2020, 210, 3–19. [Google Scholar] [CrossRef]
  52. Huang, G.; Li, Z.; Li, X.; Liang, S.; Yang, K.; Wang, D.; Zhang, Y. Estimating surface solar irradiance from satellites: Past, present, and future perspectives. Remote Sens. Environ. 2019, 233, 111371. [Google Scholar] [CrossRef]
  53. Jiang, H.; Yang, Y.; Wang, H.; Bai, Y.; Bai, Y. Surface Diffuse Solar Radiation Determined by Reanalysis and Satellite over East Asia: Evaluation and Comparison. Remote Sens. 2020, 12, 1387. [Google Scholar] [CrossRef]
  54. Hersbach, H.; Bell, B.; Berrisford, P.; Hirahara, S.; Horányi, A.; Muñoz Sabater, J.; Nicolas, J.; Peubey, C.; Radu, R.; Schepers, D.; et al. The ERA5 global reanalysis. Q. J. Roy. Meteor. Soc. 2020, 146, 1999–2049. [Google Scholar] [CrossRef]
  55. Qin, W.; Wang, L.; Wei, J.; Hu, B.; Liang, X. A novel efficient broadband model to derive daily surface solar Ultraviolet radiation (0.280–0.400 μm). Sci. Total Environ. 2020, 735, 139513. [Google Scholar] [CrossRef] [PubMed]
  56. Wielicki, B.A.; Barkstrom, B.R.; Harrison, E.F.; III, R.B.L.; Smith, G.L. Clouds and the Earth’s Radiant Energy System (CERES): An Earth Observing System Experiment. Bull. Am. Meteorol. Soc. 1996, 77, 853–868. [Google Scholar] [CrossRef] [Green Version]
  57. Jiang, H.; Yang, Y.; Bai, Y.; Wang, H. Evaluation of the Total, Direct, and Diffuse Solar Radiations from the ERA5 Reanalysis Data in China. IEEE Geosci. Remote S. 2020, 17, 47–51. [Google Scholar] [CrossRef]
  58. LeCun, Y.; Bengio, Y.; Hinton, G. Deep learning. Nature 2015, 521, 436–444. [Google Scholar] [CrossRef]
  59. LeCun, Y.; Boser, B.; Denker, J.; Henderson, D.; Howard, R.; Hubbard, W.; Jackel, L. Handwritten digit recognition with a back-propagation network. Adv. Neural Inf. Process. Syst. 1989, 2, 396–404. [Google Scholar]
  60. Cui, L.; Wang, S. Mapping the daily nitrous acid (HONO) concentrations across China during 2006–2017 through ensemble machine-learning algorithm. Sci. Total Environ. 2021, 785, 147325. [Google Scholar] [CrossRef]
  61. Chen, T.; He, T.; Benesty, M.; Khotilovich, V.; Tang, Y.; Cho, H.; Chen, K. Xgboost: Extreme gradient boosting. R Package Version 0.4-2. 2015, 1, 1–4. [Google Scholar]
  62. Breiman, L. Random forests. Mach. Learn. 2001, 45, 5–32. [Google Scholar] [CrossRef] [Green Version]
  63. Fan, J.; Wu, L.; Zhang, F.; Cai, H.; Zeng, W.; Wang, X.; Zou, H. Empirical and machine learning models for predicting daily global solar radiation from sunshine duration: A review and case study in China. Renew. Sustain. Energy Rev. 2019, 100, 186–212. [Google Scholar] [CrossRef]
  64. Di, Q.; Amini, H.; Shi, L.; Kloog, I.; Silvern, R.; Kelly, J.; Sabath, M.B.; Choirat, C.; Koutrakis, P.; Lyapustin, A.; et al. An ensemble-based model of PM2.5 concentration across the contiguous United States with high spatiotemporal resolution. Environ. Int. 2019, 130, 104909. [Google Scholar] [CrossRef] [PubMed]
  65. Hastie, T.; Tibshirani, R. Generalized additive models: Some applications. J. Am. Stat. Assoc. 1987, 82, 371–386. [Google Scholar] [CrossRef]
  66. Lukas, M.A.; de Hoog, F.R.; Anderssen, R.S. Efficient algorithms for robust generalized cross-validation spline smoothing. J. Comput. Appl. Math. 2010, 235, 102–107. [Google Scholar] [CrossRef] [Green Version]
  67. Zheng, M.; Cass, G.R.; Schauer, J.J.; Edgerton, E.S. Source Apportionment of PM2.5 in the Southeastern United States Using Solvent-Extractable Organic Compounds as Tracers. Environ. Sci. Technol. 2002, 36, 2361–2371. [Google Scholar] [CrossRef]
  68. Che, H.Z.; Shi, G.Y.; Zhang, X.Y.; Arimoto, R.; Zhao, J.Q.; Xu, L.; Wang, B.; Chen, Z.H. Analysis of 40 years of solar radiation data from China, 1961–2000. Geophys. Res. Lett. 2005, 32, L06803. [Google Scholar] [CrossRef]
  69. Hay, J.E.; Darby, R. El Chichón–influence on aerosol optical depth and direct, diffuse and total solar irradiances at Vancouver, BC. Atmos. Ocean. 1984, 22, 354–368. [Google Scholar] [CrossRef]
  70. Nagel, D.; Herber, A.; Thomason, L.W.; Leiterer, U. Vertical distribution of the spectral aerosol optical depth in the Arctic from 1993 to 1996. J. Geophys. Res. Atmos. 1998, 103, 1857–1870. [Google Scholar] [CrossRef]
  71. Streets, D.G.; Yan, F.; Chin, M.; Diehl, T.; Mahowald, N.; Schultz, M.; Wild, M.; Wu, Y.; Yu, C. Anthropogenic and natural contributions to regional trends in aerosol optical depth, 1980–2006. J. Geophys. Res. Atmos. 2009, 114, D00D18. [Google Scholar] [CrossRef]
  72. He, Q.; Zhang, M.; Huang, B. Spatio-temporal variation and impact factors analysis of satellite-based aerosol optical depth over China from 2002 to 2015. Atmos. Environ. 2016, 129, 79–90. [Google Scholar] [CrossRef]
Figure 1. Distribution of 17 CMA diffuse solar radiation stations used in this study.
Remotesensing 14 03695 g001
Figure 2. Flowchart of ensemble model construction process.
Remotesensing 14 03695 g002
Figure 3. Density scatterplots of sample-based cross-validation results for six base ML models and an ensemble model. The red solid line is the 1:1 line. The black dashed line is the best-fit line from linear regression.
Remotesensing 14 03695 g003
Figure 4. Density scatterplots of by-year cross-validation for ensemble model (GAM) across China.
Remotesensing 14 03695 g004
Figure 5. Density scatterplots for different diffuse solar radiation products and ground-based observation data.
Remotesensing 14 03695 g005
Figure 6. Comparison of mean bias for different diffuse solar radiation products: (a) CERES, (b) ERA5, (c) JIEA, and (d) CHSSDR.
Remotesensing 14 03695 g006
Figure 7. Spatial distribution of cross-validated correlations of surface diffuse solar radiation products.
Remotesensing 14 03695 g007
Figure 8. Validation of surface diffuse solar radiation products under different cloud fraction conditions.
Remotesensing 14 03695 g008
Figure 9. Validation under different aerosol concentrations conditions among surface diffuse solar radiation products.
Remotesensing 14 03695 g009
Figure 10. Validation of surface diffuse solar radiation products under different aerosol concentrations conditions.
Remotesensing 14 03695 g010
Figure 11. Interannual variation trend of diffuse solar radiation in China, 1982–2020.
Remotesensing 14 03695 g011
Table 1. Basic information of input variables from three reanalysis data: MERRA_2, ERA5-single, and ERA5-land.
DatasetParameters Used in This StudySpatial ResolutionTemporal Resolution
ERA5-single TOA incident solar radiation (TISR), surface solar radiation downward clear sky (SSRDC), boundary layer height (BLH), total column ozone (TCO), low cloud cover (LCC), high cloud cover (HCC), medium cloud cover (MCC), total column cloud ice water (TCCIW), total column cloud liquid water (TCCLW), total cloud cover (TCW), total column water (TCW)0.25° × 0.25°Hourly
ERA5-land 2m Temperature (T2m), forecast albedo (FA), total precipitation (TP), surface solar radiation downwards (SSRD), surface pressure (SP)0.1° × 0.1°Hourly
MERRA-2 Aerosol optical depth (AOD)0.625° × 0.5°Hourly
Table 2. Details of surface diffuse solar radiation products used in this study. CHSSDR is the surface diffuse solar radiation dataset constructed in this study.
ProductsParametersSpatial ResolutionTemporal Resolution
CERES-SYN1degSurface shortwave diffuse flux1° × 1°Daily
JiEADiffuse solar radiation0.05° × 0.05°Daily
ERA5Surface solar radiation downwards, total sky direct solar radiation at surface0.25° × 0.25°Hourly
CHSSDRDiffuse solar radiation0.1° × 0.1°Daily
Table 3. Cross-validation for ensemble model (GAM) at different stations.
StationsRRMSE (Wm−2)MAE (Wm−2)
Sanya0.6524.1118.81
Guangzhou0.8419.7715.17
Kunming0.8023.2416.71
Lhasa0.8326.0618.55
Wuhan0.8723.0917.01
Chengdu0.8422.9717.91
Shanghai0.8918.5113.90
Zhengzhou0.9218.5013.73
Lanzhou0.8321.1715.46
Golmud0.8721.4016.18
Kashi0.8420.4915.25
Beijing0.9118.0413.03
Shenyang0.8424.2016.08
Ejinaqi0.7725.1318.37
Urumchi0.7919.5314.79
Harbin0.9017.7112.83
Mohe0.8523.2113.86
Overall0.8421.6015.74
Publisher’s Note: MDPI stays neutral with regard to jurisdictional claims in published maps and institutional affiliations.

