Article

Investigating Suppression of Cloud Return with a Novel Optical Configuration of a Doppler Lidar

Department of Wind Energy, Technical University of Denmark, Frederiksborgvej 399, 4000 Roskilde, Denmark
*
Author to whom correspondence should be addressed.
Remote Sens. 2022, 14(15), 3576; https://doi.org/10.3390/rs14153576
Submission received: 16 June 2022 / Revised: 21 July 2022 / Accepted: 22 July 2022 / Published: 26 July 2022
(This article belongs to the Section Atmospheric Remote Sensing)

Abstract

:
The full-width at half-maximum or probe length of the Lorentzian weighting function of continuous-wave Doppler lidars increases quadratically with the focus distance, which results in a deterioration in the spatial resolution of measurements. What is worse, a Doppler lidar is susceptible to moving objects that are far away from the intended measurement point. Therefore, we suggest a novel configuration to mitigate these problems by deploying two co-planar quarter-wave plates with orthogonal fast axes in the conventional continuous-wave lidar system, without any change to the other optical or electronic components. If the vertically polarized laser beam that we emit goes out and its backscattered beam returns back through the same quarter-wave plate, the returned beam will become horizontally polarized. The horizontally polarized backscattered beam cannot beat with the vertically polarized local oscillator to generate a Doppler signal. However, the polarization of the returned beam will remain unchanged if the emitted beam travels out through one plate and returns through the other. In this way, the influence of a moving backscattering particle far away from the focus point can be reduced. Both theoretical and experimental results show that, in a proper configuration, the probe length of the continuous-wave lidar can be reduced by 10 % , compared with that of the conventional lidar. In addition, the fat tails of the Lorentzian weighting function can be suppressed by up to 80 % to reduce the return from a cloud, albeit with a large reduction (perhaps 90 % ) in the signal power. This investigation provides a potential method to increase the spatial resolution of Doppler wind lidars and suppress the low-hanging cloud return.

1. Introduction

Continuous-wave (cw) wind lidar has wide applications in the fields of aviation safety, atmospheric dynamics research, and wind power control and meteorology [1,2,3,4,5]. Wind lidar has the potential to improve the performance of wind turbines compared with the traditional in situ reference instruments, through prevision of the wind field by remote sensing [6]. However, the spatial resolution of the cw lidar deteriorates when the measurement distance increases compared with the corresponding volumes associated with in situ mast mounted anemometers [7], which hampers the capacity to detect the incoming turbulence. It is, therefore, important for the application of cw lidars to identify cheap and simple ways to limit the measurement volume. Here, we investigate a novel configuration of the conventional Doppler lidar system in which two co-planar quarter-wave plates are placed between the fiber end and the focusing lens. We then investigate experimentally and theoretically how it improves the spatial resolution and suppresses cloud return.
Today, there are several producers of commercial cw Doppler lidar. ZXLidar (formerly Zephir Ltd., a spin-off from QinetiQ) [8] has been producing cw Doppler lidars for wind profiling or turbine control for more than a decade [9]. Windar Photonics produces two- or four-beam nacelle-mounted lidars for wind turbine control to maximize power production [10]. In 2003, QinetiQ made the first measurement campaign with a cw coherent Doppler lidar based on telecommunication components. Since then, several generations have been released, and now the lidars can be precisely focused up to a height of 200 m to reconstruct 3D wind vectors from the conical scanning at different altitudes. Currently, cw lidars are widely applied in wind energy for wind field retrieval [11,12,13], power performance assessment [14,15], wake characterization and modelling [16,17,18], controls and loads [19,20,21], and complex flows [22,23,24] to increase overall annual energy production and reduce shutdown of turbines, which demonstrates that lidars are playing an increasingly important role in wind energy, both in academia and industry.
Despite the compact structure, good stability, and low cost of cw lidars, they also have some drawbacks. First, the effective measurement volume of cw lidars varies as the 4th power of the measurement distance and the probe length, which is usually quantified by the full-width at half-maximum (FWHM) length of the weighting function of cw lidars, increases quadratically with the measurement distance [25]. If the cw lidar is installed on a large wind turbine in order to characterize the wind speed fluctuations 2 D or 3 D upstream of the rotor (D is the diameter of the turbine rotor, which can be greater than 200 m), the probe length will be substantial, limiting the capacity to observe the fluctuations.
In addition, the measured line-of-sight (LOS) velocity by cw lidars is a weighted average of all the velocities along the propagation direction of the laser beam, and it is characterized by a Lorentzian weighting function times the backscatter cross-section (which may vary with distance) [12]. This means that the sensitivity of the weighting function decays away from the focus point, but only as d 2 (d is the distance from the focus point) [26]. If the backscatter far from the focus point is sufficiently strong, its backscattered signal will be detected. For example, in relatively clean air with low-hanging clouds, a conically profiling lidar may measure the speed of the clouds rather than the speed of the air at the focus point, which will cause bias when estimating the wind speed.
Generally, having an increased spatial resolution and more compact measurement volume is advantageous for many applications of large, modern wind turbines. Several solutions have been suggested. A bistatic solution with one emitting and one receiving telescope has been realized by [27]. Even though it is possible as demonstrated by [28], it is difficult to change the focus in a bistatic system because the two beams have to intersect at the focus point. Furthermore, it has a reduced signal-to-noise ratio and a complicated setup. Another method has been demonstrated by [29], whereby the phase of the laser is modulated pseudo-randomly, which means that the authors could compact the measurement volume by almost any amount. This was a very flexible solution, but it requires complicated programming and extra active optical components.
In contrast to the aforementioned complicated methods, we suggest a simple solution to place passive optical components between the fiber end and the focusing lens of the telescope to retrofit cw lidar systems without changing any other components or the analysis software. The optical components are two co-planar quarter-wave plates, and the optical axes (or fast axes) of these two plates are orthogonal to each other. Each plate is oriented 45 to the polarization direction of the emitted laser beam. The cw lidar system employs in-phase/quadrature-phase (IQ) detection technology [30], which mixes the received signal with a local oscillator (LO) signal [31] to down-convert the optical signals into an intermediate frequency (IF) [32] for further analysis.
We report about the experiment where we used different targets (hard targets and diffuse smoke) to backscatter the emitted laser beam. We found that hard targets change the polarization of the returned light, leading to almost the same probe length as that of the conventional system. Therefore, we used smoke particles with a similar diameter as ambient atmospheric aerosols to obtain stronger backscattered signals, which is convenient for data analysis.
The experimental results are also compared with the theoretical results. Both show that in a proper layout, placing an opaque strip in the center of the two quarter-wave plates effectively suppresses strong backscatter away from the focus point, which would make lidars less susceptible to moving objects, such as low-hanging clouds far from the intended focus point, and would improve the spatial resolution.
However, the disadvantage of this configuration is that the emitted laser loses a significant amount of power. Without the strip in the center, the plates result in essentially no improvement in the spatial resolution of cw lidars and limited suppression of the fat tails of the weighting function due to the overlapping of two half Gaussian beams in the center. An alternative modification that would solve this issue could be to apply a prism or special fiber end to split the emitted Gaussian beam into two beams and maintain almost the same power [33,34,35]. The implementation of this modification together with the co-planar quarter-wave plates means that the classical Lorentzian weighting function could be compacted and its fat tails could also be effectively suppressed without losing too much laser power.

2. Novel Design with Two Quarter-Wave Plates

A conventional cw lidar works as follows: light is emitted from an optical fiber end, the polarization of which is predetermined (vertically polarized in our case), and then focused by a telescope at a specific distance far away. The light is backscattered by the aerosols in the air and maintains the same polarization direction to the same telescope, which collects the light. Some of the backscattered light will enter the optical fiber end, as shown in Figure 1. Because we use IQ coherent detection, the received light is split in two beams, as one beam is phase shifted by 90 and the other is mixed with small portions of the outgoing light. As a result, the beat frequency of the complex signal obtained by combining the two signals will give the Doppler shift, including its sign, without shifting the frequency of the local oscillator.
For the aerosols around the focus, almost all the light scattered back to the telescope will enter the fiber end. However, for the aerosols away from the focus, their backscattered light will form a disk when it crosses the plane of the fiber end, known as the circle of confusion, and only a fraction of the light will enter the fiber. The further away from the focus, the larger the disk is and the smaller the fraction of backscattered signal that will be used to beat with the local oscillator.
The suggested method is to place two quarter-wave plates side by side between the fiber end and the focusing lens of the telescope, as shown in Figure 2. In principle, it would be better to place the quarter-wave plates right after the lens because there the beams would be more orthogonal to the plates, reducing the risk of imperfect retardation. However, that would require larger and more expensive plates.
The fast axis of each plate is 45 relative to the vertical direction, but oriented differently in the two halves, as illustrated in Figure 2a. Therefore, the fast axes of these two plates are perpendicular to each other. We name this layout “opposite polarization”, whereas “equal polarization” is when the fast axes of the two plates are in the same direction. The dimensions of each plate are approximately 20 mm × 10 mm × 0.5 mm, and they are produced by FOCtek Photonics Inc, Fuzhou, China.
When the incident light is linearly polarized and passes through a quarter-wave plate once, it only becomes circularly polarized if the orientation angle between the polarization direction of the incident light and the optical axis of the plate is 45 or 135 . This circularly polarized light will become horizontally polarized after it is backscattered by the aerosols without changing its polarization and passes through the same quarter-wave plate again, as shown in Figure 3. Horizontally polarized light will not beat with the local oscillator and, therefore, it becomes “invisible” or useless, which is the key feature of this design.
Figure 4 illustrates the principle of these two co-planar quarter-wave plates. The polarized light is emitted from the fiber end, passes through the plates and the lens, and is focused at the focus point, which is the same as the conventional lidar system (the black rays). As previously noted, only light that passes through different quarter-wave plates can beat with the local oscillator, leading to a theoretical reduction in the power of the signal of 50%. For an aerosol that is off the focus and off the optical axis, the scattered light (the red rays) that passes back through the lens will not focus at the fiber end. As seen from the black rays emanating from the fiber end, only rays that go through the + 45 plate will hit the red aerosol and only if its scattered (red) rays returning back through the same plate ( + 45 plate) can hit the fiber end. However, because the emitted and scattered rays pass through the same plate twice, they cannot beat with the local oscillator. Therefore, the signal from the out-of-focus aerosols will be reduced, and the effective focus will be more compact. However, this ray-tracing explanation does, of course, have some limitations, as it does not describe phenomena requiring wave theory (involving the phase of the wave). In the next section, we quantify the analysis using solutions to the wave equation.

3. Hermite–Gaussian Modes

3.1. Half Gaussian Function

With the quarter-wave plates placed in the lidar system, half of the perfectly focusing Gaussian beam will be blocked by the plate, for example, the emitting beam will be the left half of the Gaussian beam, and the receiving beam will be the right half at the telescope, or vice versa. It is assumed that the telescope is far from the focus point in the negative z direction. Most importantly, only the beam that passes through one plate and returns back through the other will keep the same polarization and beat with the local oscillator. We now use Hermite–Gaussian [36] modes, which are known solutions to (or a good approximation to) the wave equation, to calculate how this beam evolves along its propagation direction, before and after the focus point. These modes are numerated by two integers l and m, and the electrical field of a higher-order Gaussian mode, which is expressed in phasor or complex notation, is
E l , m ( x , y , z ) = E 0 w 0 w ( z ) · H l 2 x w ( z ) · H m 2 y w ( z ) × exp x 2 + y 2 w ( z ) 2 · exp i k ( x 2 + y 2 ) 2 R ( z ) · exp ( i ψ l m ( z ) ) · exp ( i k z )
where z is the axial distance from the focus, z R is the Rayleigh length, k is the wave number, i is the imaginary unit, H l and H m are Hermite polynomials, and E 0 is the leading factor, which is different from the electric field amplitude at the origin ( x 2 + y 2 = 0 , z = 0 ). The spot size parameter w ( z ) is the radius of the beam at axial position z for the conventional cw lidar without the wave plates [36], which is
w ( z ) = w 0 1 + z z R 2
where w 0 is the waist radius and R ( z ) is the radius of curvature of the wave fronts, defined by
1 R ( z ) = z z 2 + z R 2
and the Gouy phase is
ψ l m ( z ) = ( l + m + 1 ) arctan ( z / z R ) .
Now we define the Hermite function related with the nth-order Hermite polynomial, as illustrated in Figure 5, as
h n ( x ) = e x 2 2 · H n ( x ) π 4 2 n n ! .
We expand the half Gaussian function beam in Equation (1) in Hermite–Gaussian modes, which forms an orthonormal basis in L 2 ( R ) [37], so
h m ( x ) · h n ( x ) d x = δ m n
where δ m n is the Kronecker delta symbol:
δ m n = 0 , if m n 1 , if m = n .
A half Gaussian function can be expressed as the Heaviside function
Θ ( x ) = 0 , if x < 0 1 2 , for x = 0 1 , otherwise
multiplied by the Hermite function h 0 . Using the orthonormality of the Hermite functions, a half Gaussian function can be written as
G 1 / 2 ( x ) Θ ( x ) · h 0 ( x ) = n = 0 a n · h n ( x )
where G 1 / 2 ( x ) stands for the half Gaussian function with a range of x , and the first coefficient a 0 = 1 2 because
a 0 = G 1 / 2 ( x ) · h 0 ( x ) d x = Θ ( x ) · h 0 ( x ) · h 0 ( x ) d x = 1 2 h 0 ( x ) 2 d x .
Therefore, for the other coefficients a n with n 1 , we can rewrite Equation (9) as
G 1 / 2 ( x ) 1 2 h 0 ( x ) = n = 1 a n · h n ( x ) .
The left part of Equation (11) is an odd function. Again, using the orthonormality (only when m=n in Equation (12)) of the Hermite functions, we get the coefficients of the right part of Equation (11)
G 1 / 2 ( x ) 1 2 h 0 ( x ) · h n ( x ) d x = m = 1 a m · h m ( x ) · h n ( x ) d x = a n .
Except for a 0 , only the odd coefficients are non-zero, since for even n, h n is symmetric, and
G 1 / 2 1 2 h 0 = 1 2 π 1 / 4 e x 2 2 , for x > 0 0 , for x = 0 1 2 π 1 / 4 e x 2 2 , for x < 0
is anti-symmetric. Any odd coefficient a 2 m + 1 for m N 0 can be written as
a 2 m + 1 = 0 h 0 ( x ) h 2 m + 1 ( x ) d x = 1 π 2 2 m + 1 ( 2 m + 1 ) ! 0 e x 2 H 2 m + 1 ( x ) d x .
Using Equation (5) and according to Equation (22.13.15) in [38], the integral in the right-hand side is simply H 2 m ( 0 ) , which is equal to ( 1 ) m ( 2 m ) ! / m ! according to Equation (22.4.8) in [38]. Therefore,
a 2 m + 1 = ( 1 ) m ( 2 m ) ! π 2 2 m + 1 ( 2 m + 1 ) ! m ! = ( 1 ) m π 3 / 4 1 2 m + 1 Γ m + 3 2 Γ ( m + 1 )
where we have used properties of the factorial and Gamma functions to reduce the expression. A more convenient formula for the numerical calculation is the recurrence relation
a 2 m + 1 = m 1 2 m ( m + 1 2 ) a 2 m 1 w i t h a 1 = 1 2 π .
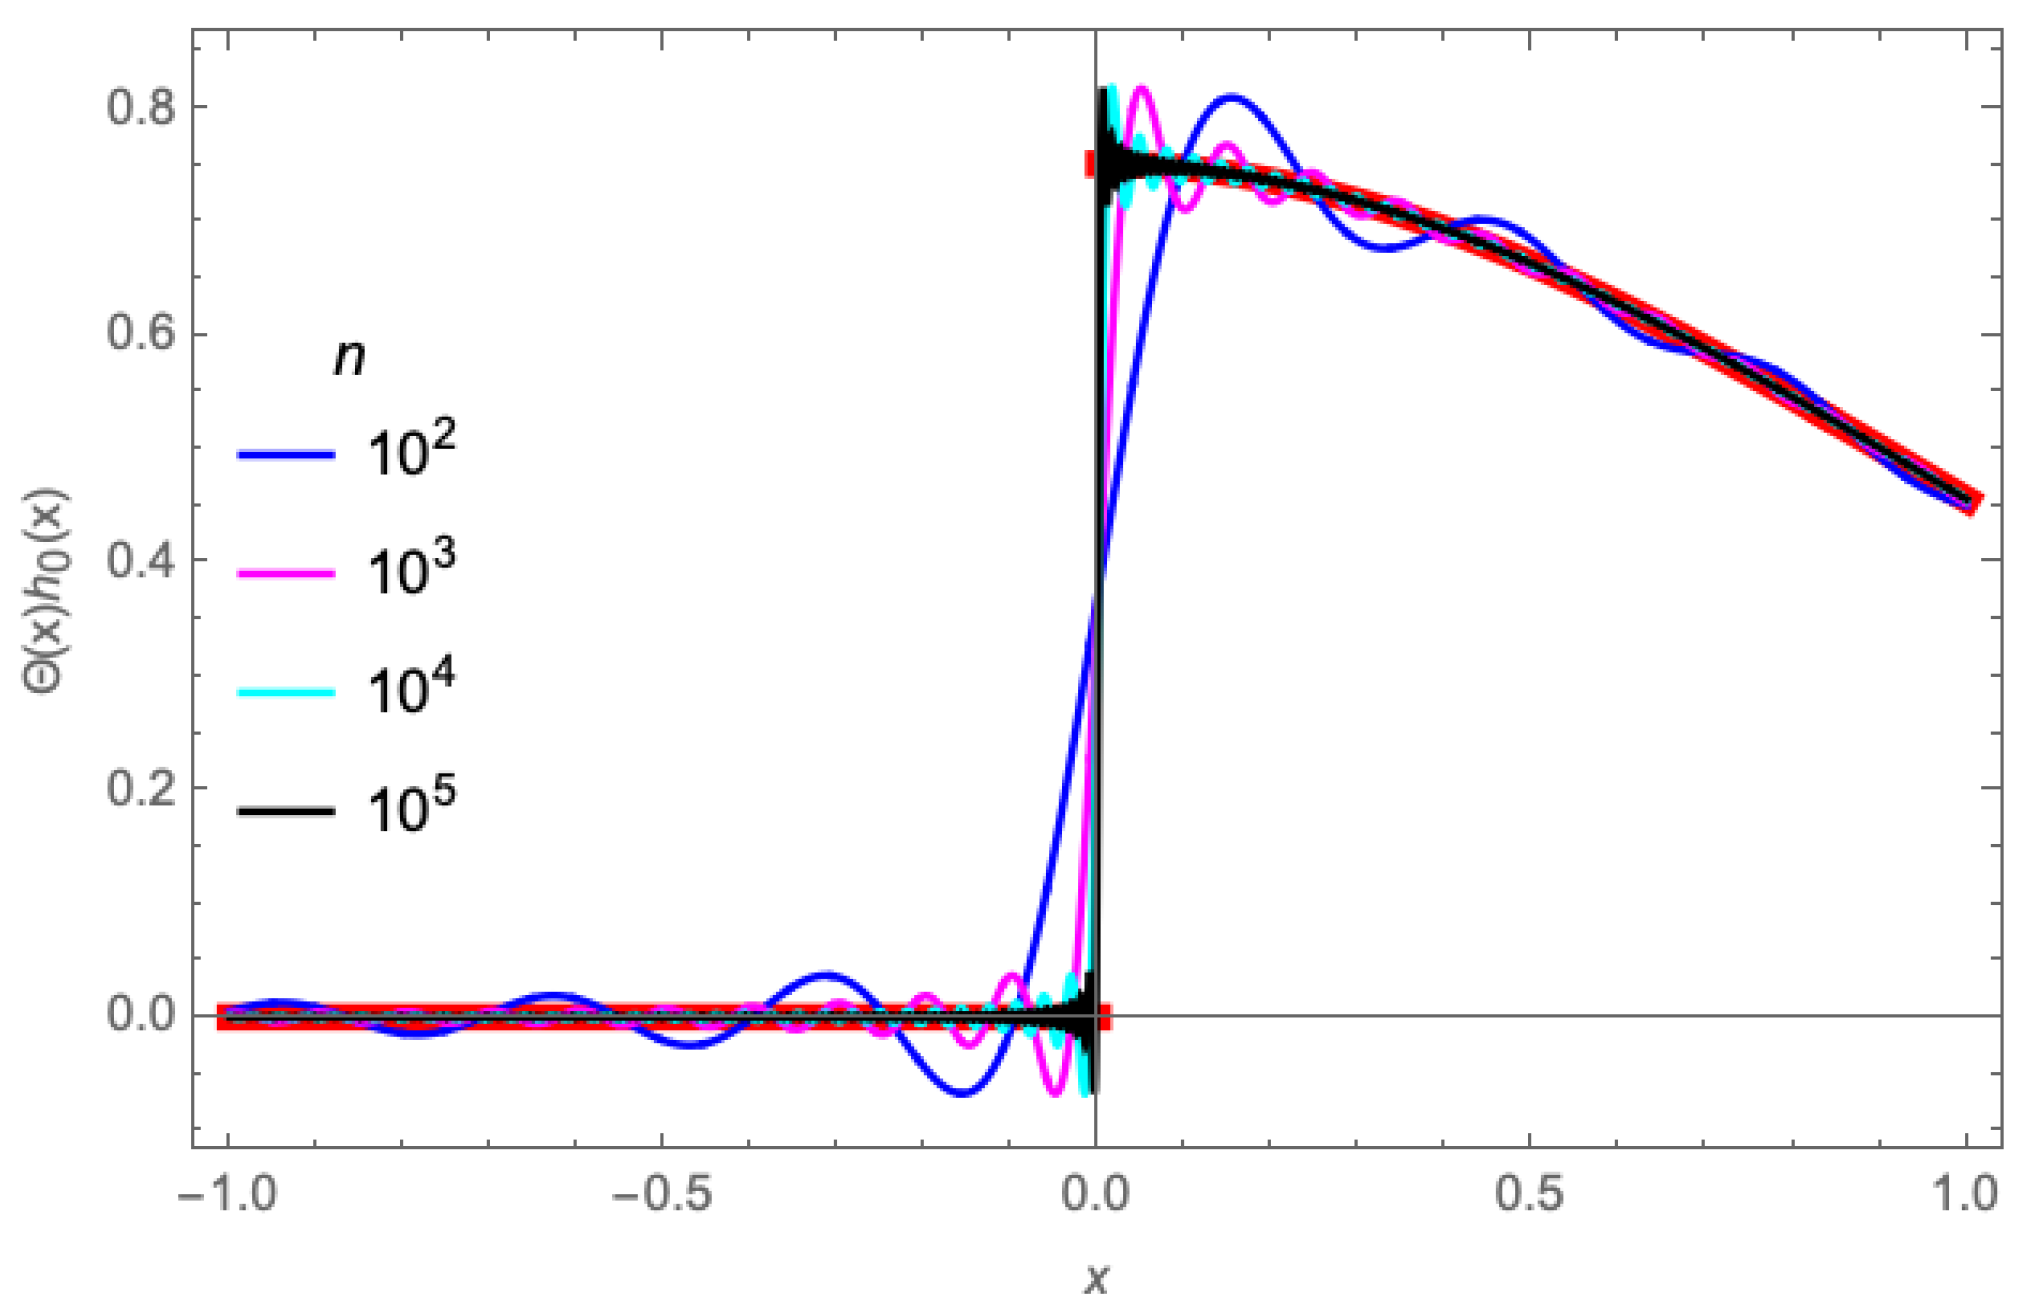
Having evaluated the coefficients of Equation (9), we also need to evaluate the Hermite functions. The recursive method introduced by [39] is applied here. The convergence of the half Gaussian function series is shown in Figure 6, where the nth partial sum of the Hermite series has large oscillations near the jump known as the Gibbs phenomenon.
The intensity of a normal Gaussian beam is proportional to the absolute square of the electrical field of the radiation and is given by
I ( r , z ) = | E ( r , z ) | 2 2 η = I 0 · w 0 w ( z ) 2 exp 2 r 2 w ( z ) 2 = I 0 1 1 + ( z / z R ) 2 · exp 2 r 2 w 0 2 ( 1 + ( z / z R ) 2 )
where r is the distance from the beam center line, defined by r 2 = x 2 + y 2 , and I 0 is the intensity at the center of the beam waist w 0 . The received radiation at a distance z from the focus point is
I e · I r d x d y
where I e is the intensity of the emitted beam and I r is that of the received beam. In the case of a normal telescope with the normal Gaussian beam, I e = I r = I , so the weighting function ϕ is
ϕ ( z ) = 0 I 2 ( r , z ) d A = 0 I 2 ( r , z ) d ( π r 2 ) = 0 I 2 ( r , z ) 2 π r d r .
Equation (19) will lead to the classical Lorentzian profile in Equation (20), which is well known for its fat tails away from the peak, resulting in measurement errors if there are moving disturbances away from the focus point.
ϕ ( z ) = π 4 I 0 2 w 0 2 1 1 + ( z / z R ) 2
However, with quarter-wave plates, the horizontal profile of the electrical field close to the lens is a half Gaussian beam, and the receiving beam is the mirror image of that. Equation (18) is still applicable for calculating the weighting function of the half Gaussian function beam. The received radiation at the telescope is considered to be zero because it is far from the focus.
ϕ ( z = ) G 1 / 2 2 ( x ) G 1 / 2 2 ( x ) d x = 0
where G 1 / 2 ( x ) may stand for the electrical field of the emitted beam from the left plate and G 1 / 2 ( x ) is that of the received beam returning back through the right plate. Using Equation (1), we can find a solution for the propagation of the half Gaussian function beam by calculating the Hermite polynomials and the Gouy phase. We notice that m = 0 in our case, as the co-planar quarter-wave plates will not affect the propagation in the y direction and, therefore, Equation (1) can be rewritten as
E l , 0 ( x , y , z ) = ( π · 2 l l ! ) 1 / 2 · E 0 · w 0 w ( z ) · h l 2 x w ( z ) · h 0 2 y w ( z ) × exp i k ( x 2 + y 2 ) 2 R ( z ) · exp ( i ψ l 0 ( z ) ) · exp ( i k z ) .
We are only concerned with the term h l and the Gouy phase exp ( i ψ l 0 ( z ) ) , which vary with l, as the coefficient ( π · 2 l l ! ) 1 / 2 has no influence on the solutions of the wave equation for an electromagnetic field. Furthermore, the other terms left in Equation (22) will be constant values when calculating the intensity I by Equation (17). Consequently, the total electrical field is
E ( x , y , z ) = l = 0 E l , 0 ( x , y , z ) .
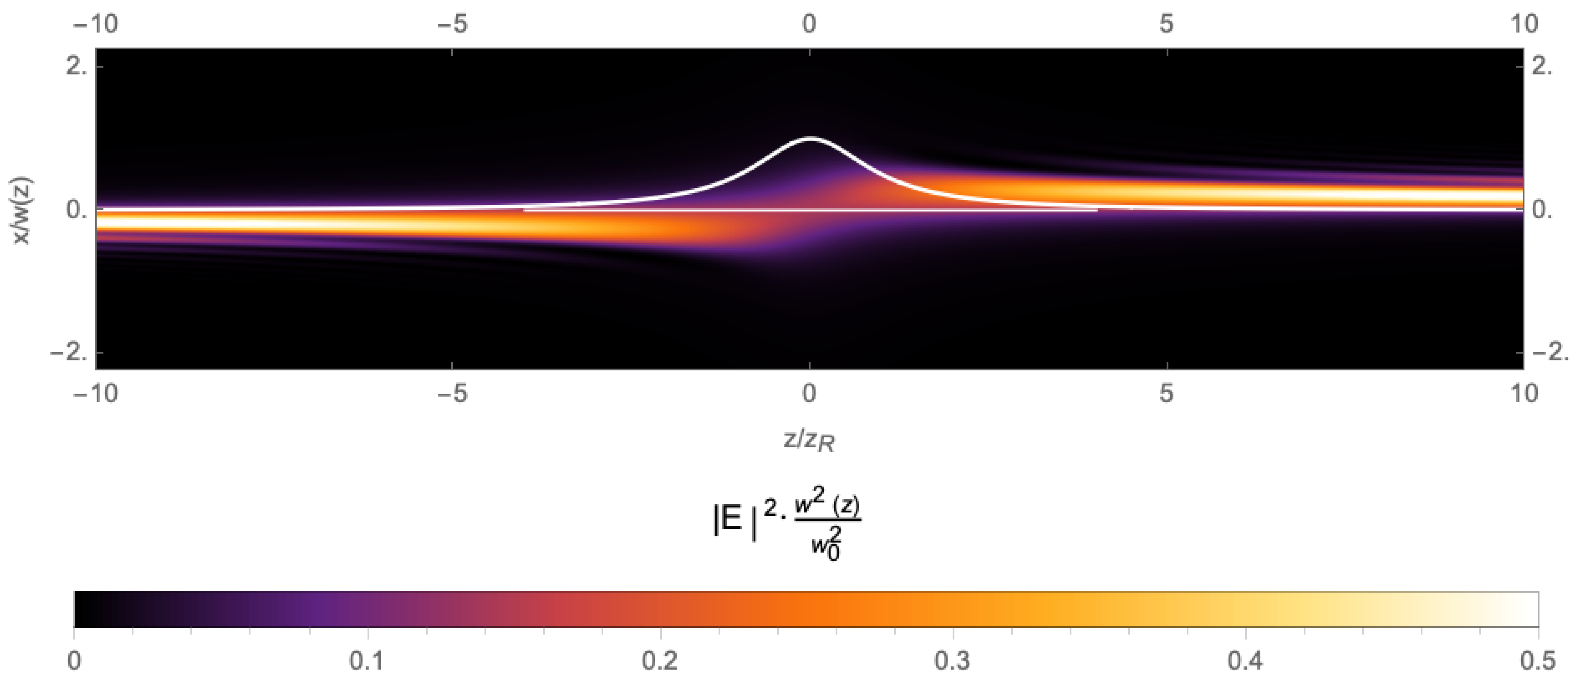
Based on Equation (22) and Equation (23), we calculate the normalized and scaled weighting function profile of the half Gaussian function beam, as depicted in Figure 7. Here, the horizontal axis z is normalized by the Rayleigh length z R , the vertical axis x is normalized by the beam waist w ( z ) at each horizontal position, and the electric field E is normalized by w ( z ) w 0 ( z ) . Clearly, the half Gaussian function beam will evolve from one side Gaussian to its mirror image as it propagates. The FWHM of the weighting function cannot be reduced sharply due to the overlapping of the left and right half Gaussian function beams in the center, which supports the experimental results described further in Section 4.

3.2. Truncated Gaussian Beam

Because the overlapping of the two half Gaussian function beams near the focus will result in a deterioration in the performance of the quarter-wave plates, we extend the results of the previous section to cover a situation in which the emitted laser beam is partly blocked in the center by an opaque strip with some width. This can effectively reduce the overlapping but at the cost of considerably reducing the backscattered power, as most of the laser energy, both the emitted and the backscattered, is concentrated at the center. In this case, the truncated Gaussian beam needs to be expanded at an arbitrary position into Hermite functions. Therefore, we use coefficient b n and the Heaviside function Θ ( x α ) in this expansion:
Θ ( x α ) h 0 ( x ) = n = 0 b n h n ( x )
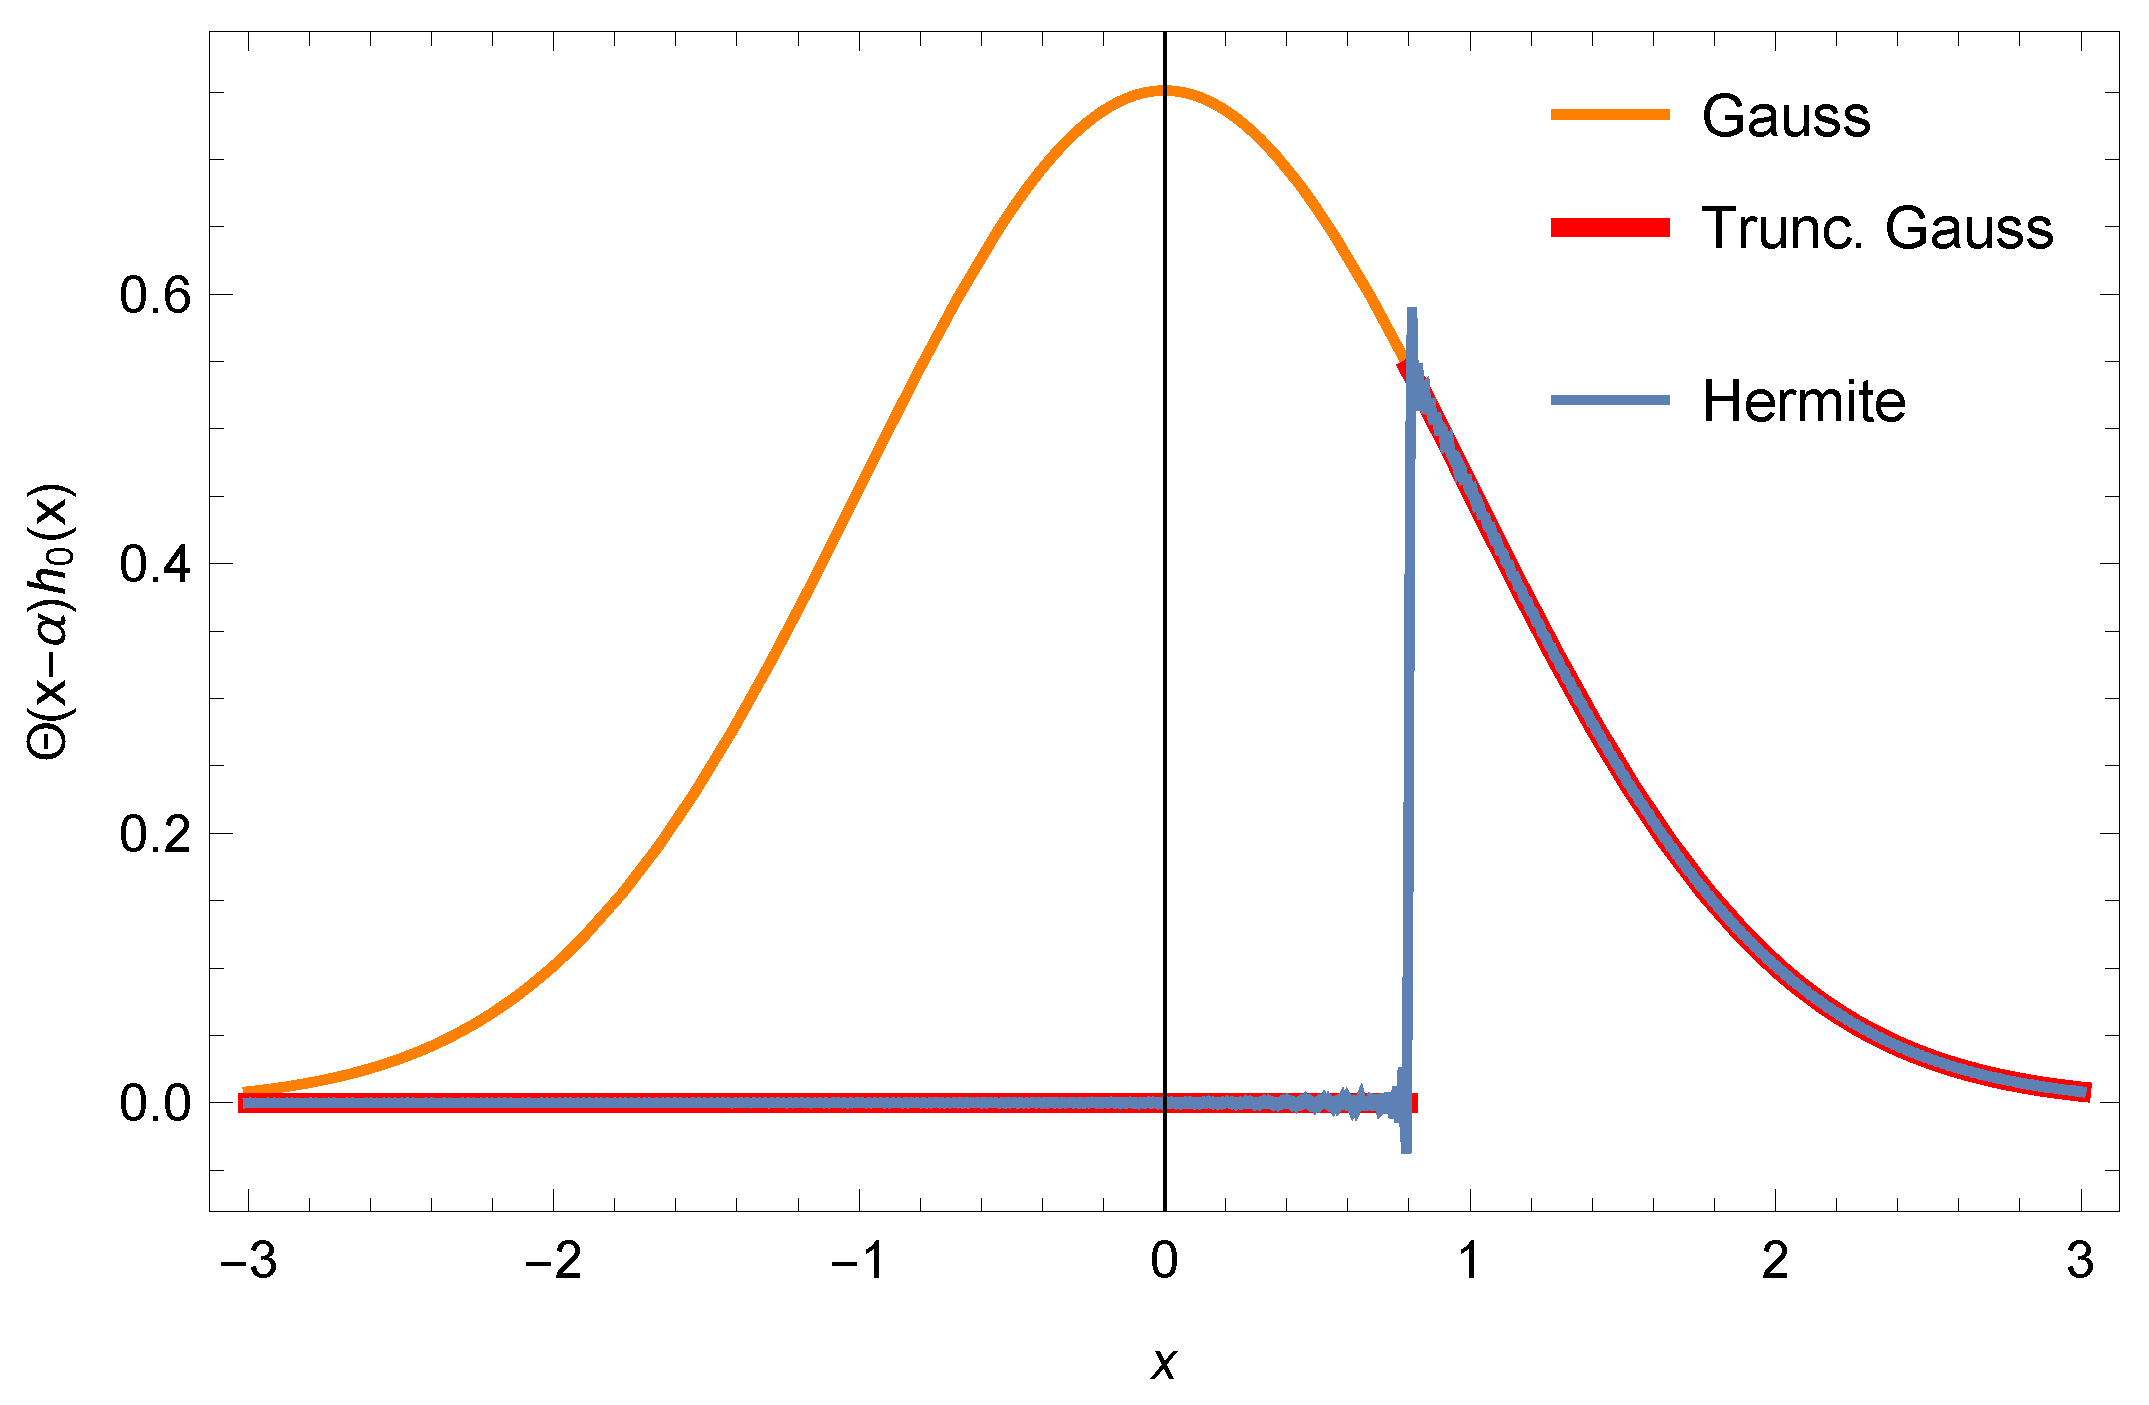
where α stands for the ratio of the blocked width over the effective diameter of the beam at the position where the two quarter-wave plates are placed. An example with α = 0.8 is shown in Figure 8.
Multiplying Equation (24) by h n ( x ) and integrating both sides gives b n . Due to the orthogonality of the Hermite function, b n is simply expressed by the following formula:
b n = α h 0 ( x ) h n ( x ) d x
where h 0 ( x ) = π 1 4 · e 1 2 x 2 . Inserting Equation (5) into Equation (25) gives
b n = 1 π 1 / 2 1 2 n n ! α e x 2 · H n ( x ) d x
where b 0 = 1 2 1 erf ( α ) . For the following terms b n ( n 1 ), we use the relation
α e x 2 H n ( x ) d x = e α 2 H n 1 ( α ) ,
which is derived by partial integration and a recurrence relation for the Hermite polynomials.
H n + 1 ( x ) = 2 x · H n ( x ) d H n ( x ) d x .
Using the relation Equation (27) and the definition Equation (5) again gives
b n = π 1 4 ( 2 n ) 1 2 e α 2 2 h n 1 ( α ) .
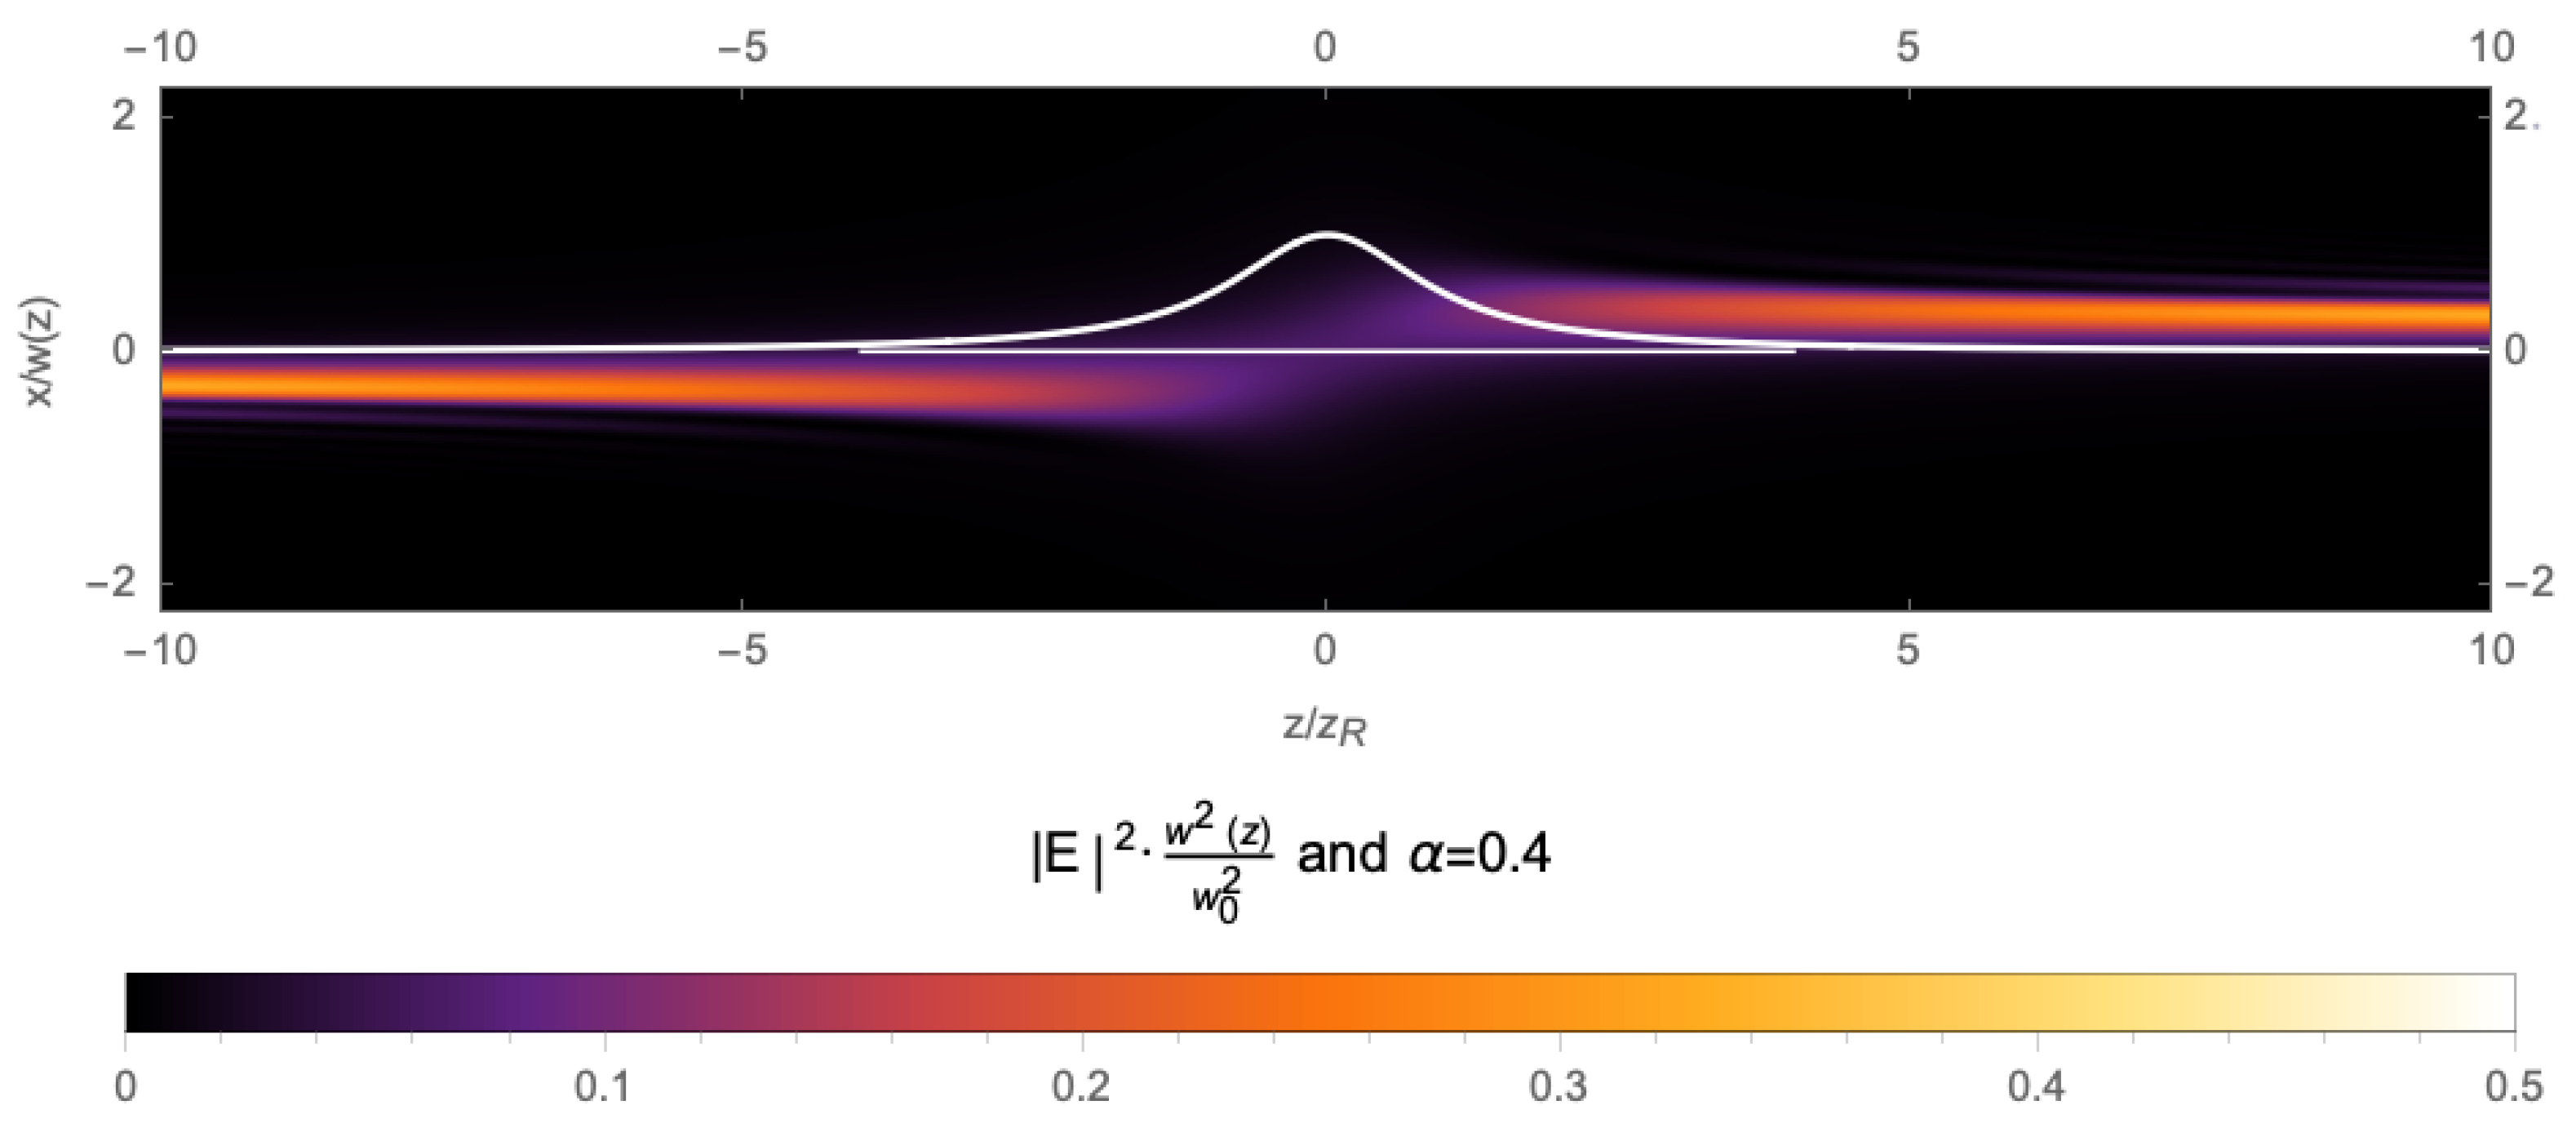
The formulas for calculating the electrical field and the received radiation of the truncated Gaussian beam are the same as Equations (22) and (23), except for the expression of h n ( x ) . The “normalized” weighting function profile is shown in Figure 9 using the same scaling method.
Compared with Figure 7, the overlapping of the left and the right truncated Gaussian at the center line away from the focus in Figure 9 is effectively suppressed, resulting in a reduction in the FWHM of the weighting function and the suppression of cloud return. However, the power of the laser beam in Figure 9 is much lower than that of the half Gaussian function, as expected and explained above.
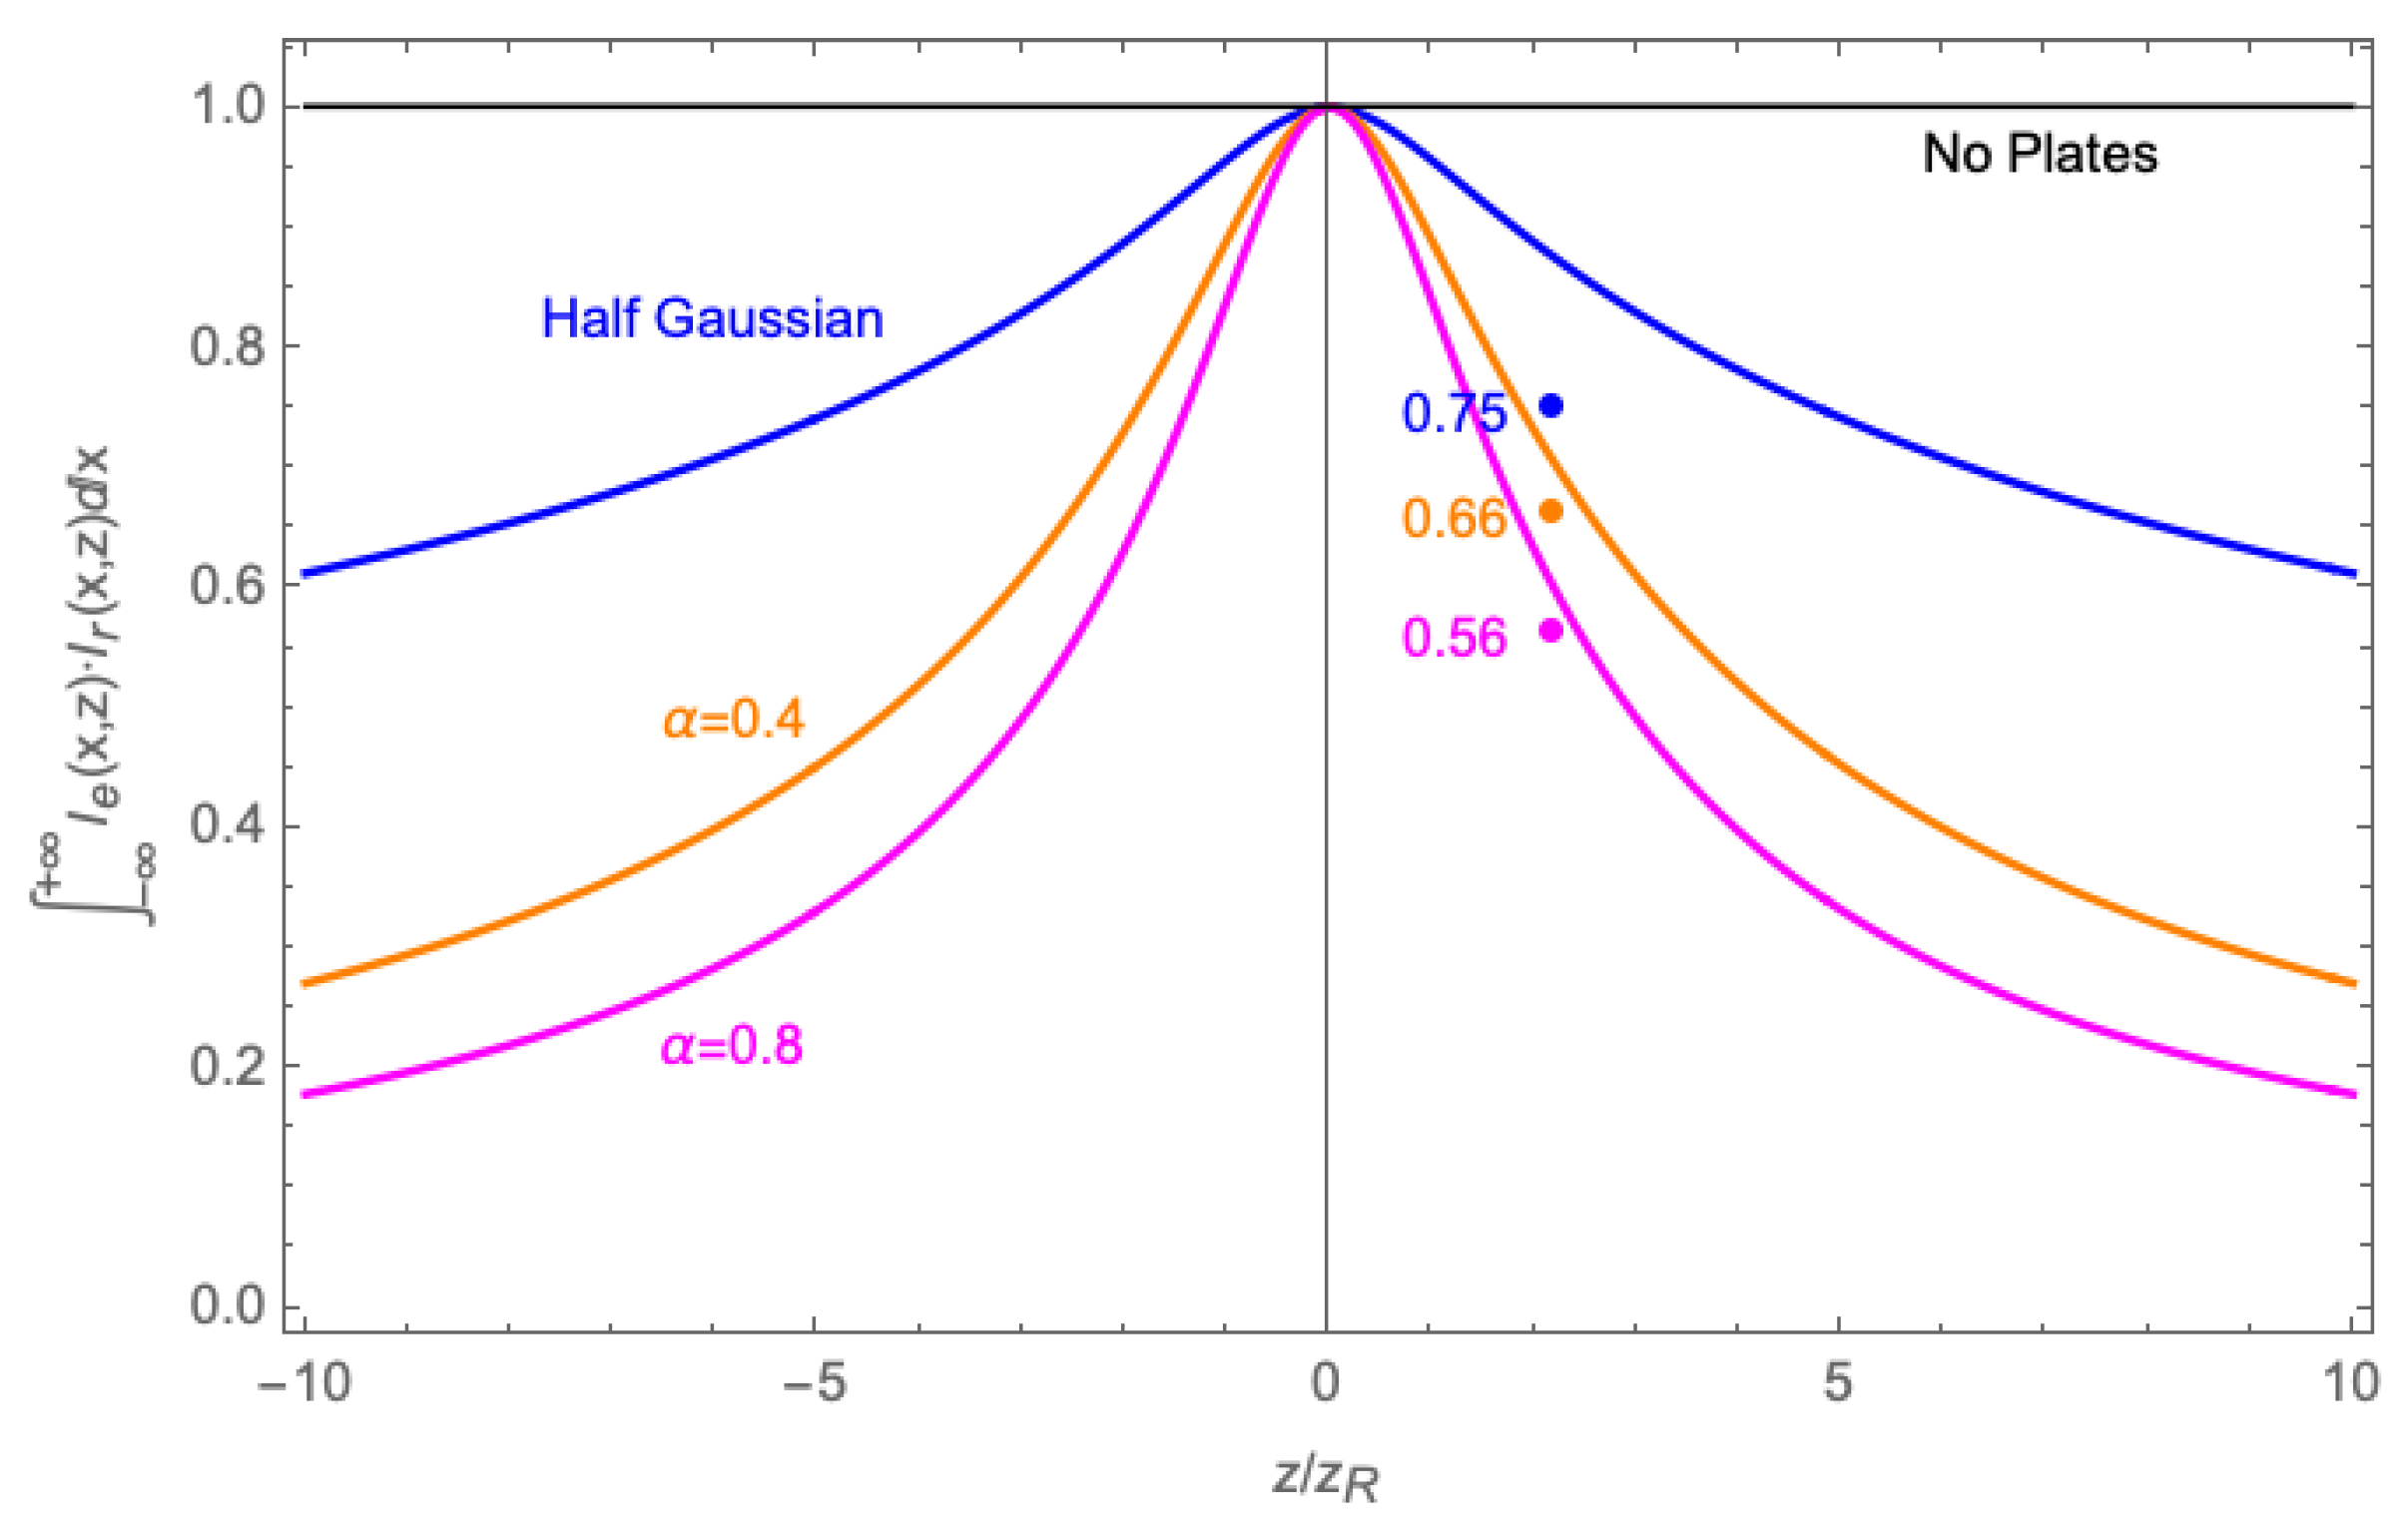
From the theoretical plot of the normalized weighting function of the half and truncated Gaussians shown in Figure 10, it is easy to reach the same conclusion as that discussed above. Here, the weighting function profiles are normalized by that of the conventional cw lidar case (where l = 0 in Equation (22)), the black horizontal line in Figure 10. With the co-planar quarter-wave plates blocked by an opaque strip in the center, the fat tails of the Lorentzian weighting function of the full Gaussian beam can be suppressed, and the probe length is also reduced. For the conventional cw lidar, the FWHM of the weighting function is 2 z R , and those of the half and the truncated ( α = 0.4 ) Gaussian beams are 1.92 z R and 1.8 z R , reduced by 4 % and 10 % , respectively. In this way, the disturbances away from the focus will have smaller weights when the line-of-sight velocity is measured.
We also conduct an experiment to simulate the effective suppression of the cloud return in the laboratory. The idea is that we focus the laser beam at two points, one is the intended focus position where we want to obtain the wind speed at about 34.62 m away from the telescope with the corresponding Rayleigh length z R = 1.84 m, and the other is about 38.59 m away that corresponds to a strong backscatter, as, for example, a cloud, located at z / z R = 2.15 . This setup is intended to simulate a very common case that the focus distance is 200 m corresponding to a Rayleigh length z R = 61.48 m, and a low-hanging cloud is at a distance of 332.6 m in practice, i.e., at 2.15 · z R behind the intended measurement point.
In this way, the distance in the laboratory from the intended wind speed measurement location and the cloud is the same as in the realistic example above in terms of number of Rayleigh lengths between the two points. The ratios of the integrated power spectral density of spectra obtained at the focus position and the cloud base position with quarter-wave plates with or without strips are normalized by that of the conventional cw lidar case (the black curve). The experimental results are shown as the three dots in Figure 10.
For the two truncated Gaussians (the orange curve α = 0.4 and the pink curve α = 0.8 ), the experimental results match very well with the theoretical results. At position z / z R = 2.15 , which means the focus distance is 200 m away and the low-hanging cloud is 332.6 m away as noted above, the normalized weighting function value is reduced by 34 % for α = 0.4 and 44 % for α = 0.8 as the weighting value of the conventional cw lidar is 1, indicating that the cloud return can be suppressed in our design. It is also worth noting that, at position z / z R = 10 , the fat tails of the weighting function can be suppressed by up to 70 % for α = 0.4 and 80 % for α = 0.8 , which is also possible in practice, for example, the focus distance is 200 m corresponding to a Rayleigh length z R = 61.48 m and the cloud is about 800 m away. In Figure 10, the experimental results of the two truncated Gaussians are slightly lower than that of the theoretical curves, possibly because of the reflection of the plates.
However, with quarter-wave plates only (the half Gaussian case), there are some deviations between the theoretical ( 0.87 ) and the experimental ( 0.75 ) results at position z / z R = 2.15 , which could be caused by imperfect matching of the two quarter-wave plates, as there is a small gap between the two quarter-wave plates, and some laser power will leak out because of this gap. In addition, the edge of the plates will also cause the reflection of the emitted laser during the measurement.
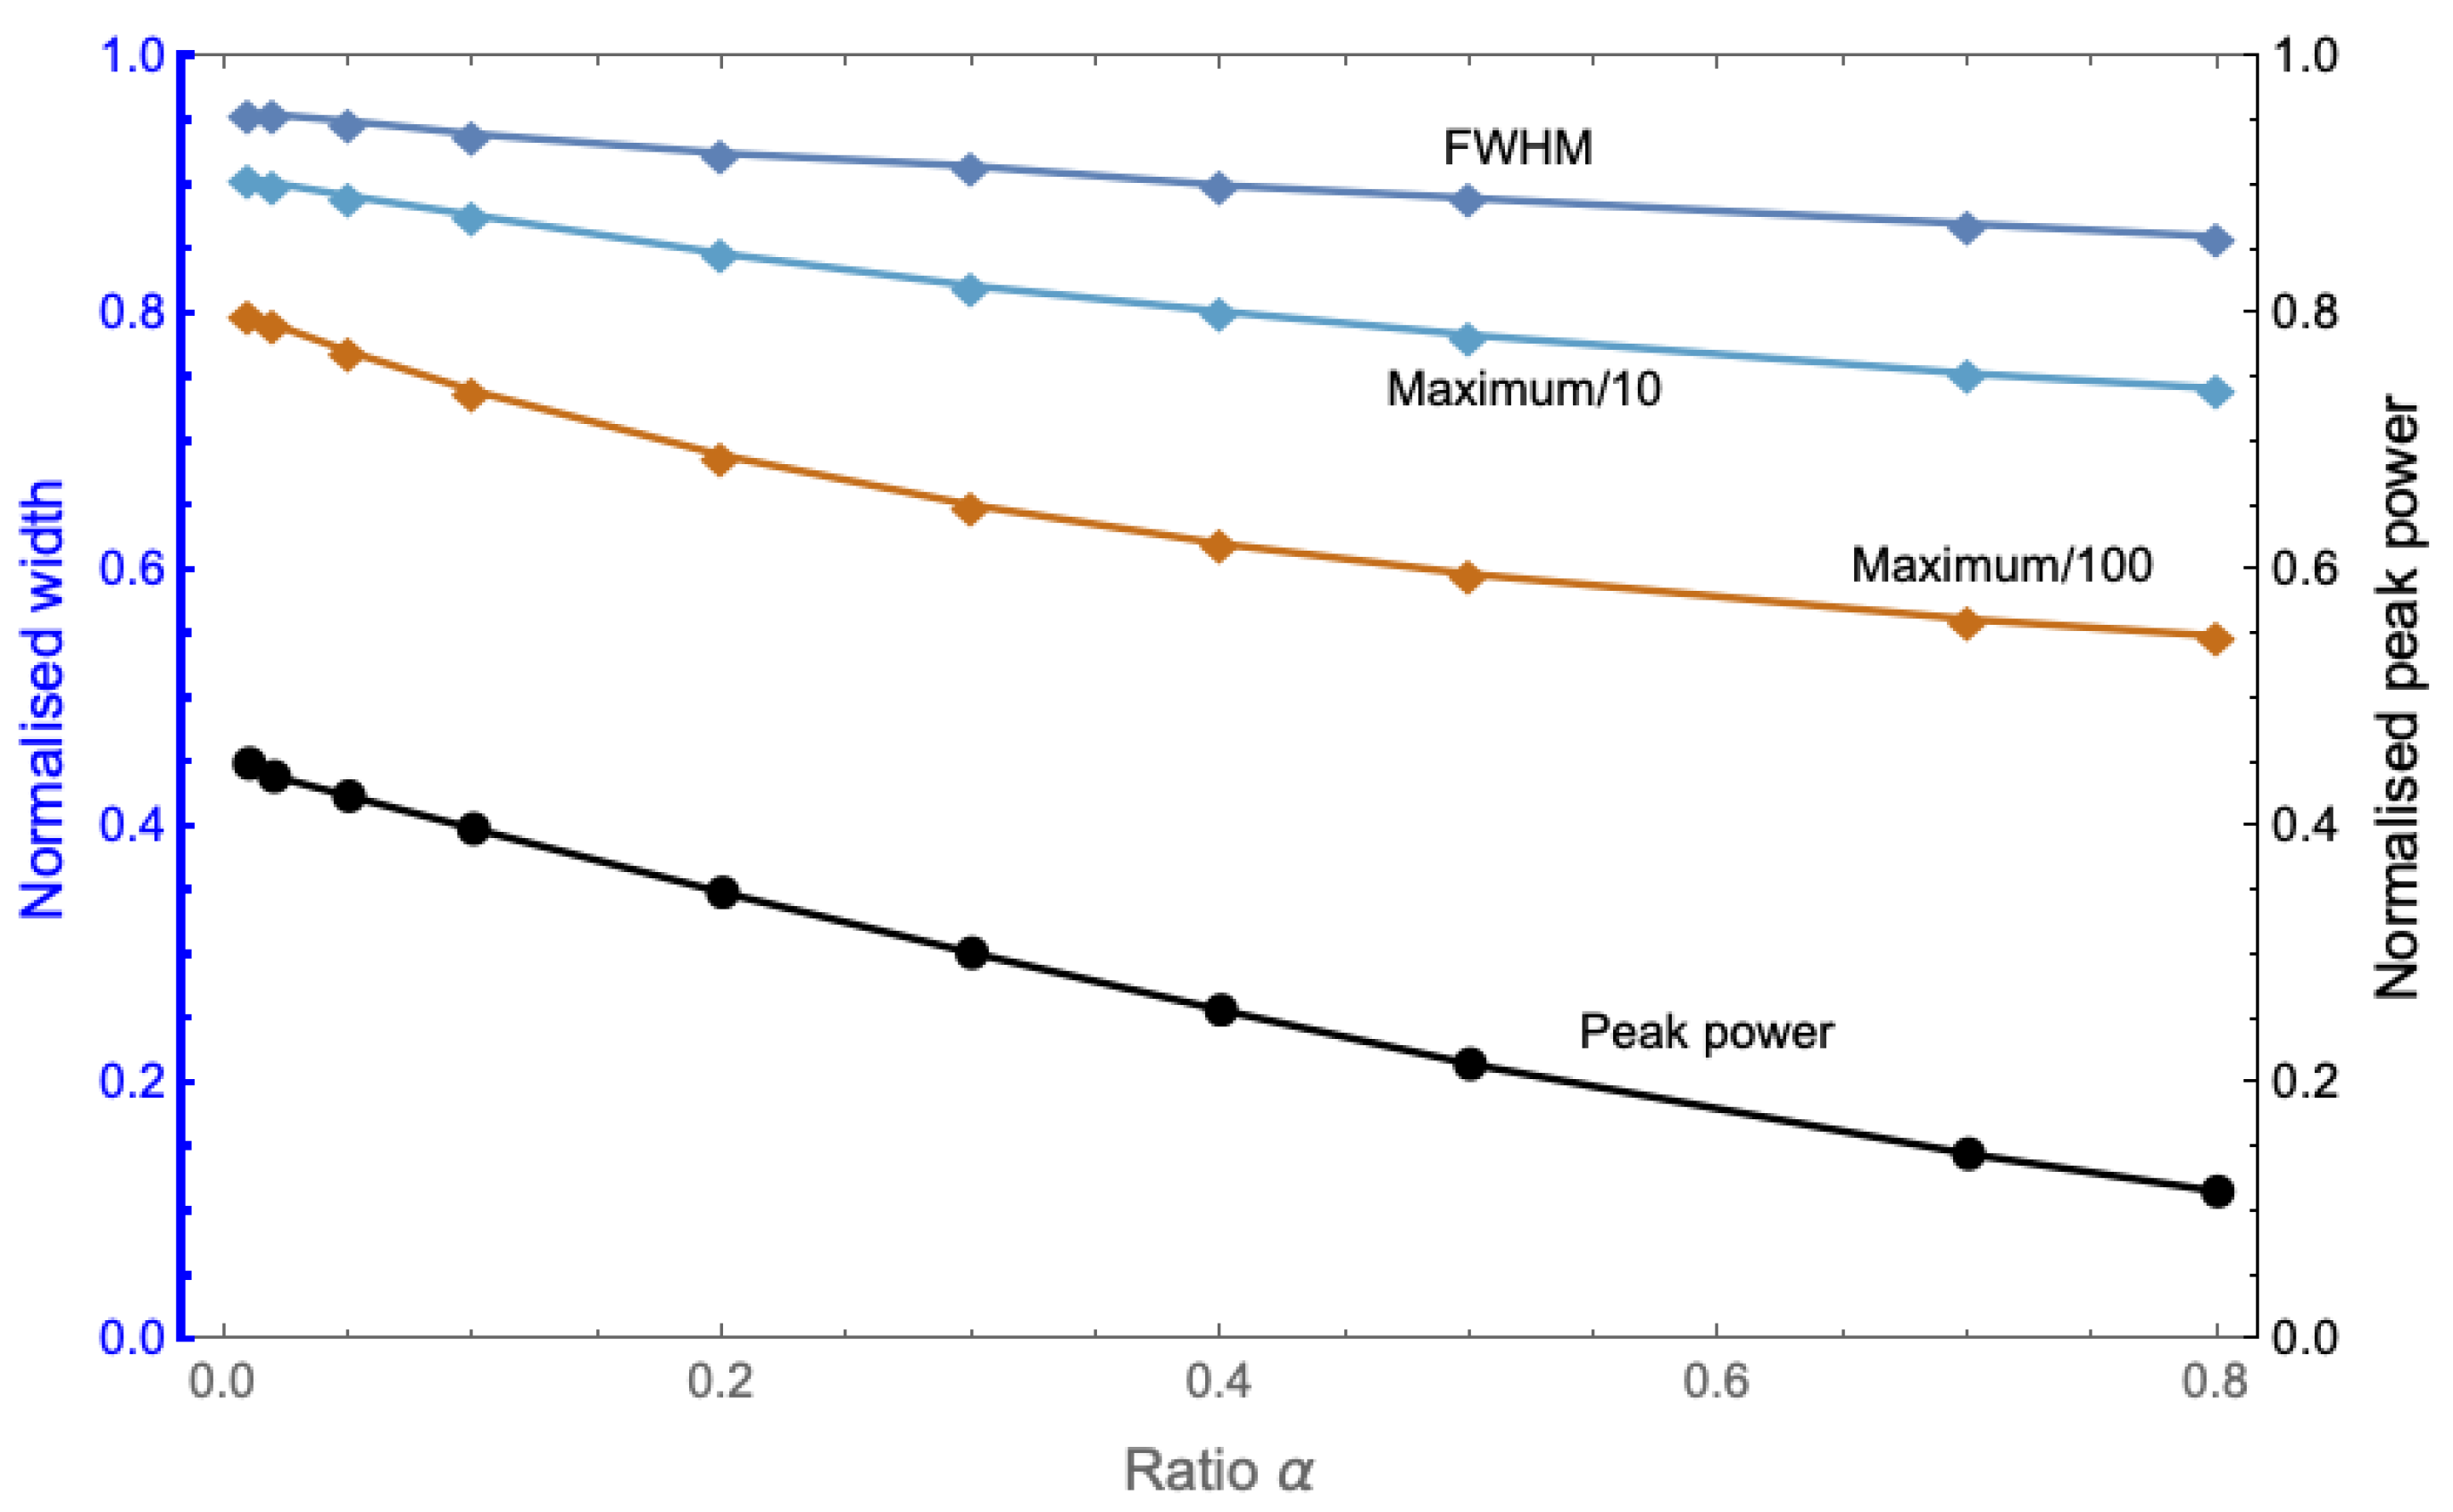
For the truncated Gaussian, the intensity of the backscattered laser beam, as well as FWHM, and full width at 0.1 and 0.01 of the maximum power spectral density of the weighting function as a function of α are presented in Figure 11. From the figure, it is clear that the increment in the blocked area at the center of the co-planar quarter-wave plates results in a sharp reduction in the weighting function away from the focus point. It is worth noting that the suppression of full width at 0.01 (the brown curve) is much more effective than that of the FWHM because the brown curve has a steeper slope.

4. Experiment and Results

Figure 12 provides an illustration of the system for the novel optical architecture, including a cw lidar with IQ technology as well as two quarter-wave plates placed between the fiber end and the focusing lens, a diffuse smoke generation system, the camera used to spot check the focus, and the post-processing system to conduct fast Fourier transform of the Doppler signal. The fiber end of this cw lidar can be moved back and forth, and it is powered by a motor that is controlled by the computer. The target, which is a narrow (≈0.1 m) jet of smoke, is produced by the smoke generator and the blower, and it is 34.44 m away from the telescope in a fixed position. In other words, by changing the positions of the fiber end, we can focus the beam at different points, at or away from the target. The effective radius of the telescope is about 18 mm, the probe length at twice of the Rayleigh length z R is 3.65 m, and the beam waist is 0.95 mm when the beam is focused at 34.44 m in the distance. In our experiment, we mainly conducted the measurements where the target was 34.44 m away from the telescope.
Detailed information about the smoke generator can be found on the official website [40]. One distinct feature of this smoke generator is that it can produce a smooth stream of smoke for 15 to 20 minutes on a full battery, which allows us to measure the backscattered signal and many different focus positions for a sufficient duration. The diameter of the smoke particles is greater than the wavelength of the laser beam, leading to Mie scattering. The smoke particles will be sucked in at the inlet of the blower, driven by an impeller at a constant rotational speed, and emitted from the nozzle. Diffuse particles were chosen because the hard targets, such as a running belt or a spinning wheel, will change the polarization of the scattered light, as we found in the first iteration of this experiment.
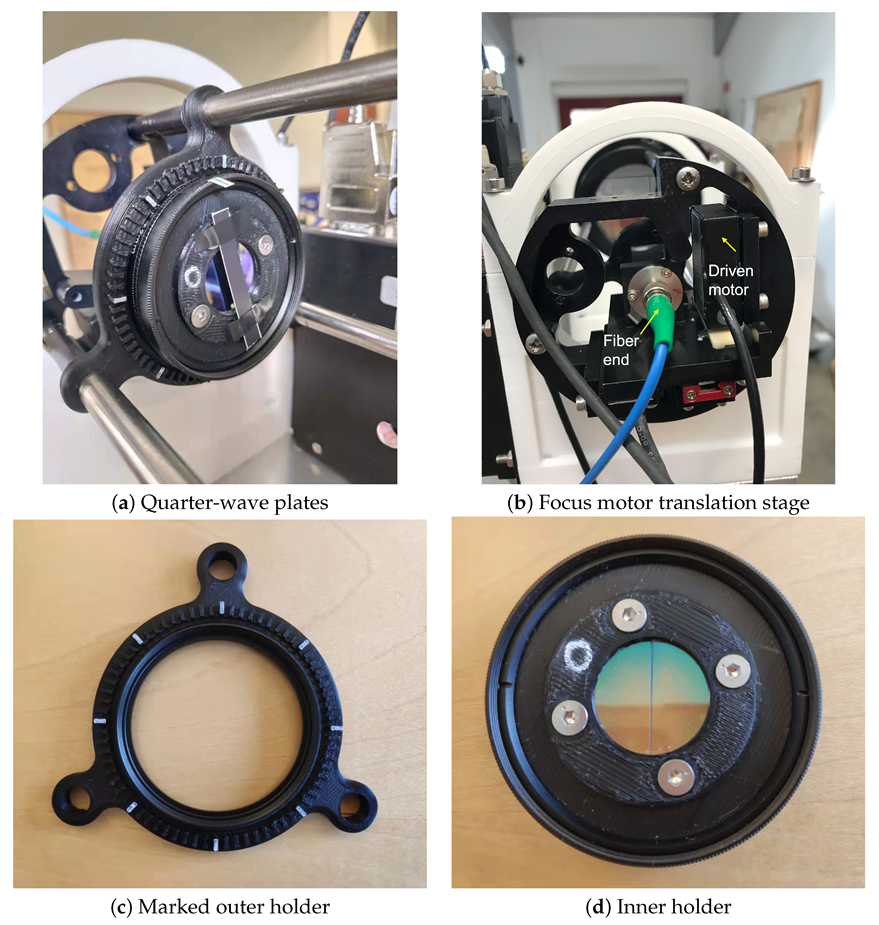
The holders of the quarter-wave plates are 3D printed and mounted on three robust rods, as depicted in Figure 13. The inner holder, which has two plates fixed in the slot, can be rotated and expediently removed from the outer holder. In this way, we can easily adjust the orientation angle between the optical axes of the plates and the polarization direction of the emitted laser beam without moving any other components or changing their relative positions. The hole in the inner holder is designed to be round in order to guarantee that the area that the laser beam passes through the plates is always the same when the quarter-wave plates are rotated if the optical axis of the plates is not well aligned with the polarization direction of the emitted beam.
Because the target is stationary and the focus point moves back and forth around the target, the weighting function is no longer a classical Lorentzian profile, which is expressed as
ϕ ( d ) = β π z R z R 2 + ( d r ) 2
where β is the coefficient of the backscatter, d is the fixed distance from the telescope to the target, and r stands for the measured distances, corresponding to all the movements of the fiber end. For example, the step size of each movement was set to 0.01 mm. In total, there will be 160 points for the movement of the fiber end. Equation (31) can be applied to convert the fiber end positions to real measurement distances from the lidar system to the focus.
1 f = 1 a + a 0 + 1 r
where f = 200 mm is the focal length, a is all the positions of the fiber end, and a 0 is an offset of the focus stage relative to the true focal point. Once Equations (30) and (31) are combined, it is possible to derive the new and asymmetric weighting function (Figure 14b) for the movable fiber end case. The relationship between the Rayleigh length z R and the measured distances r is z R ( r ) = λ · r 2 π · A 0 2 , and A 0 is the effective radius of the telescope. Equation (32) fits very well with the experimental data, as shown in (Figure 15b,d).
ϕ ( r ) = β π z R ( r ) z R 2 ( r ) + ( d r ) 2
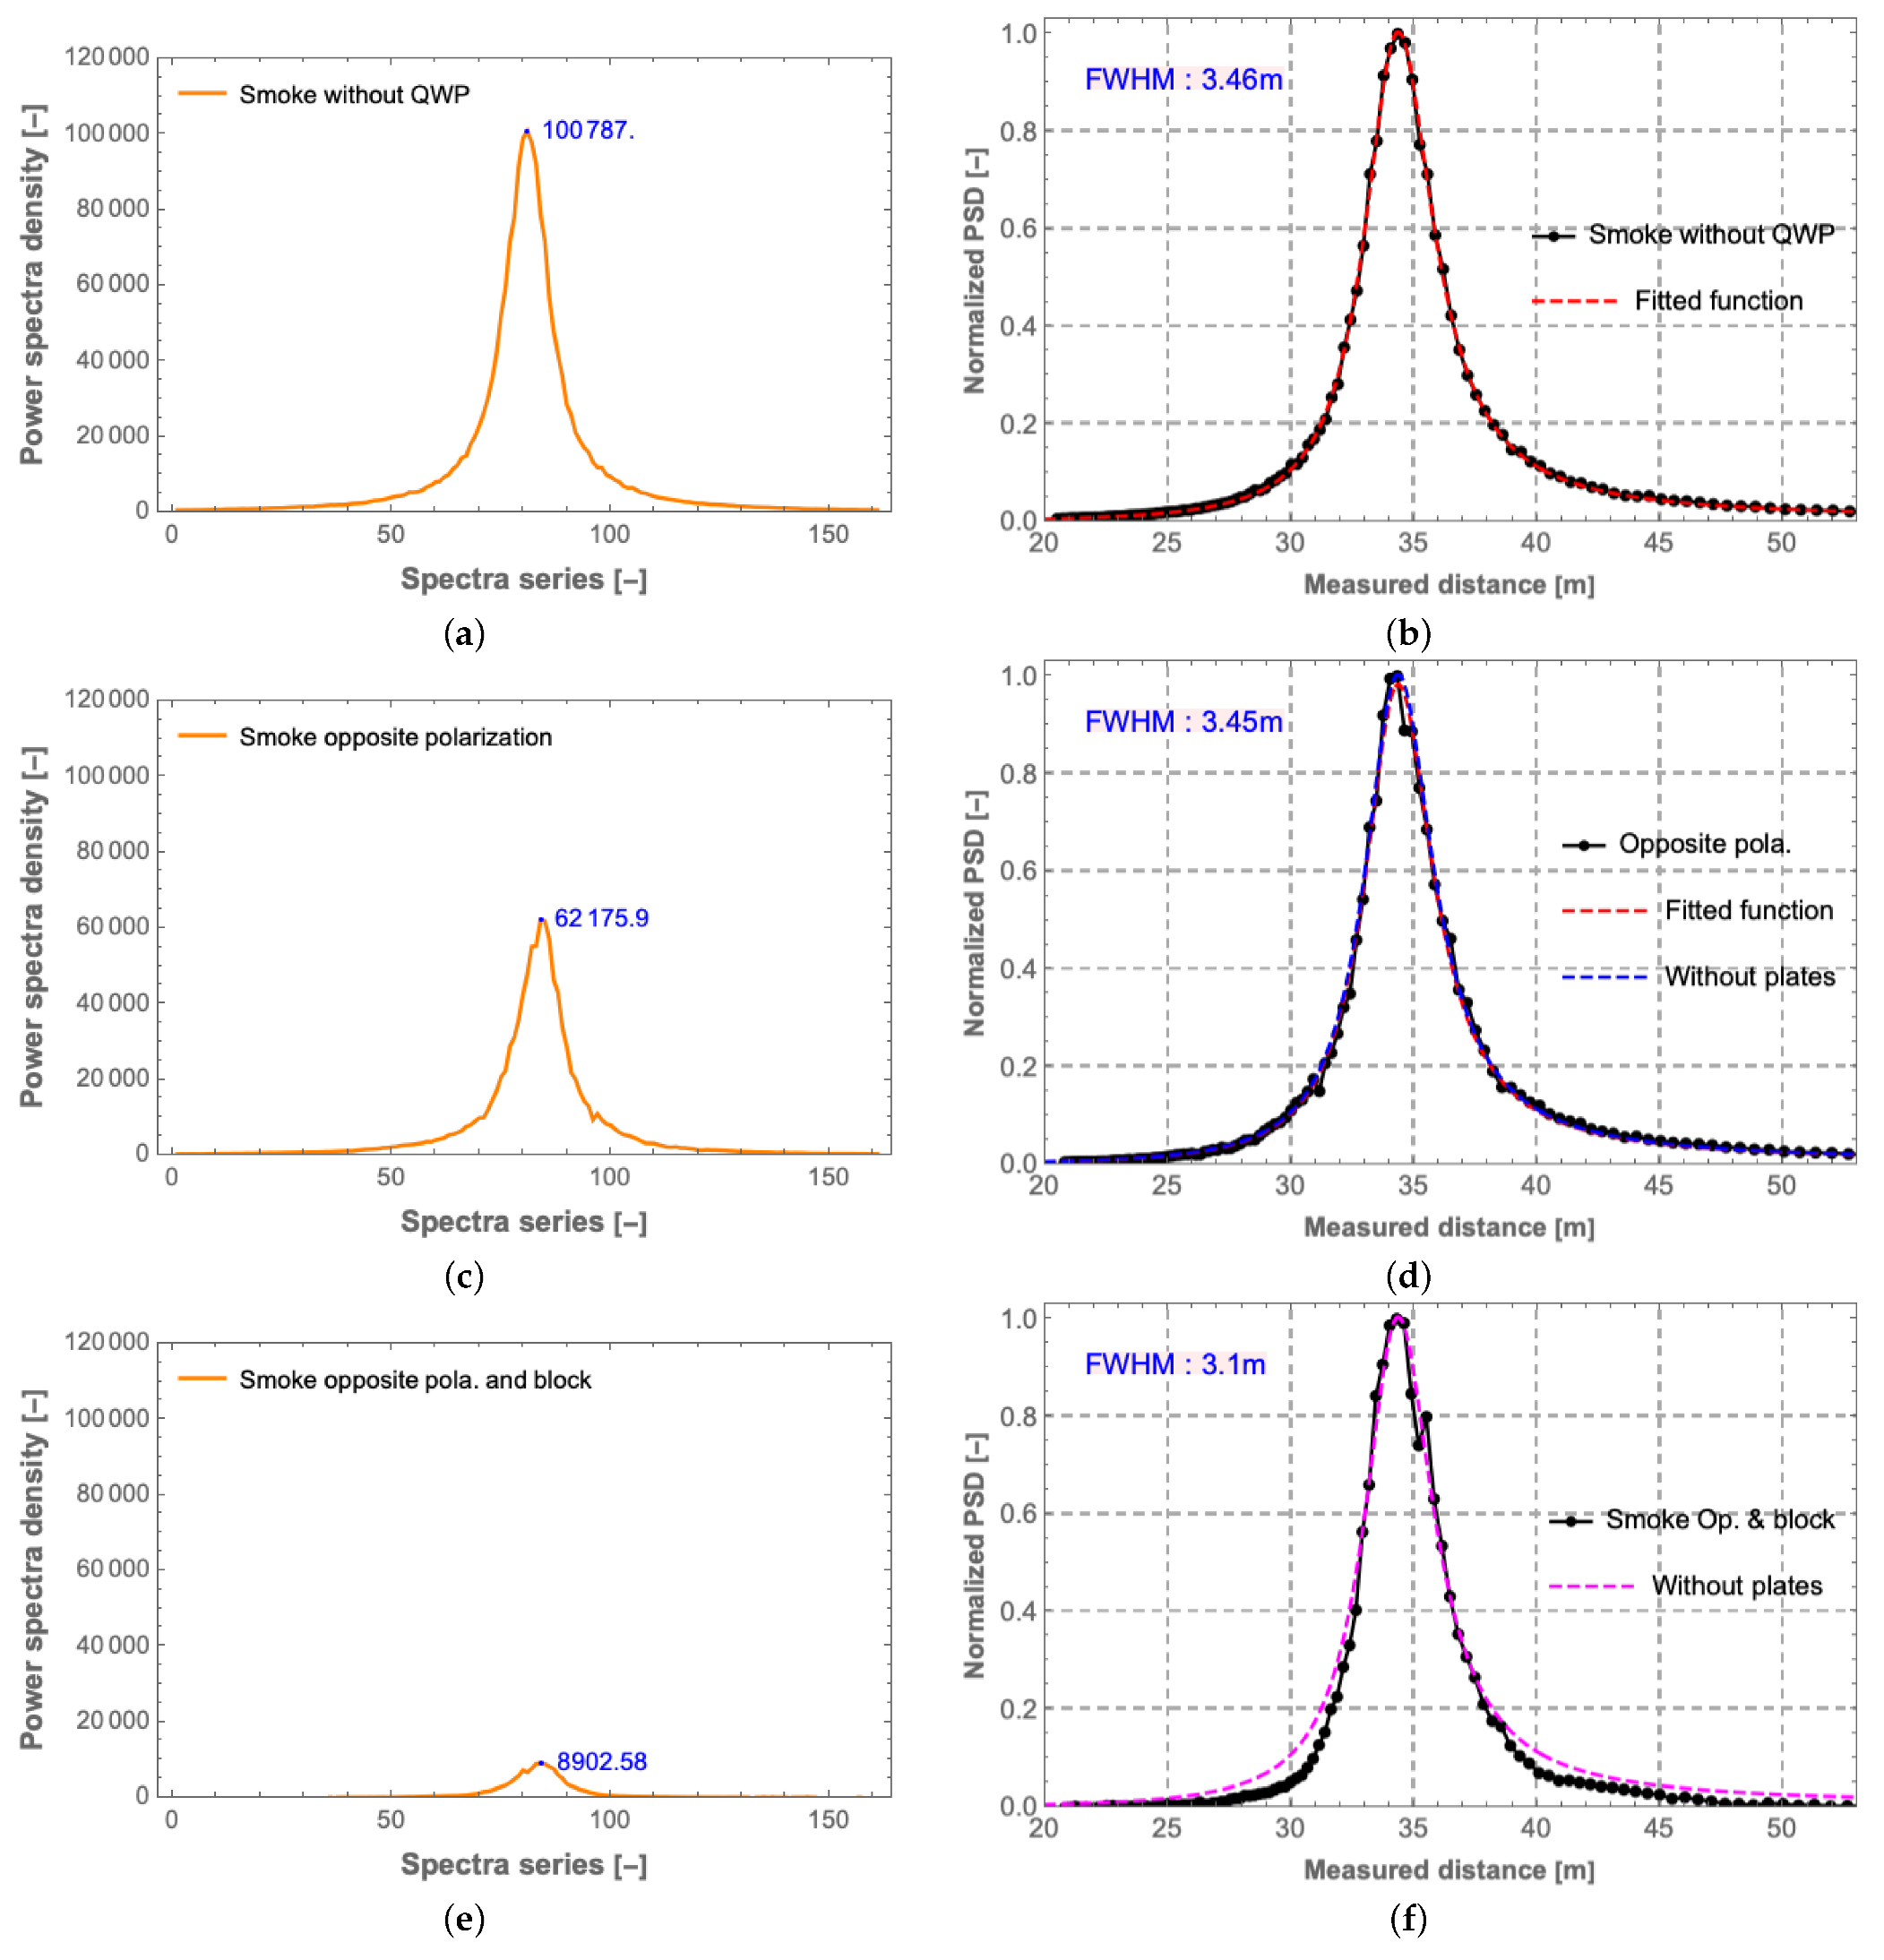
In the following part, we discuss the results from the lab experiments. Only the following three cases are considered: the conventional cw lidar system, the novel lidar system with co-planar quarter-wave plates (the optical axes of these two plates are perpendicular to each other, named as opposite polarization), and the modified novel lidar system with quarter-wave plates together with a 4 mm wide opaque card strip in the center ( α = 0.4 ). The measured asymmetric weighting functions and power spectral density of these three cases are depicted in Figure 15.
With quarter-wave plates placed in the lidar system, the power of the laser light received by the fiber end is theoretically less than half of that of the conventional lidar, which is due to the reflection from the plates and some leakage. Clearly, the max power spectral density in Figure 15c is less than the max value in Figure 15a, but greater than half, which is inconsistent with the theory. The reasons for this may be the temperature, the humidity, and the condition of the smoke generator. If it is very humid and the smoke generator is fully charged for the measurement of Figure 15c, there will be more particles in the measurement volume, which will scatter more emitted photons back. If the plates are blocked by an opaque strip to avoid the overlapping of the left and right half Gaussian function beams, only a small portion of the generated laser is transmitted out, and the power spectral density will be much lower than in the normal case, as shown in Figure 15e.
The shape of the weighting function of only placing two quarter-wave plates case is almost the same as that of the conventional cw lidar case in Figure 15b,d. This supports the conclusion obtained in Section 3.1 in that the overlapping of two half Gaussian function beams impairs the performance of the quarter-wave plates.
However, this problem can be solved by placing an opaque strip (4 mm wide) in the center of the two plates, resulting in the effective reduction of the probe length and the sharp suppression of the fat tails of the weighting function of the conventional cw lidar, although it results in a considerable reduction in the laser power detected. The experimental results show that the probe length is reduced by 10.4 % from 3.46 m of the conventional cw lidar case to 3.1 m, and the fat tails are obviously suppressed, as clearly indicated in Figure 15f, in which the solid black line represents the weighting function of blocking in the plates center case, and the dashed pink line represents that of the conventional cw lidar case.
In addition, it is interesting to compare the “normalized” weighting functions between the experiment data and the theoretical analysis for the half and the truncated Gaussian, as depicted in Figure 16. The experimental result matches well with the theory for quarter-wave plates with an opaque strip in the center case, which suppresses the fat tails away from the focus considerably in Figure 16b. However, if only two quarter-wave plates are placed in the system, the normalized weighting function is almost the same as it is for the conventional lidar system in Figure 16a, and the spatial resolution cannot be improved very much. Both the experimental and theoretical results indicate this conclusion, as discussed above.

5. Conclusions

By introducing a promising optical configuration to the conventional cw lidar system, i.e., placing two quarter-wave plates with an opaque strip in the center of the plates between the fiber end and the focusing lens of the telescope, the measurement volume of the conventional cw lidar can be effectively reduced by 10 % as the FWHM is reduced from 3.46 m to 3.1 m, when we focus the laser beam about 34.44 m away. However, these co-planar quarter-wave plates and the opaque strip will significantly reduce the power of the emitted beam, which reduces the power detected by 90 % .
We also find that, with the above configuration, the fat tails of the weighting function are effectively suppressed, up to, theoretically, 70 % with a 4 mm-wide opaque strip and more than 80 % with an 8 mm-wide opaque strip at position z / z R = 10 . To verify the suppression effect, we conduct a laboratory experiment to simulate the return of the low-hanging cloud, as in practice the focus distance is 200 m corresponding to a Rayleigh length z R = 61.48 m, and a low-hanging cloud is 332.6 m away. Most notable is that the fat tails of the weighting function are suppressed about 30 % with a 4 mm-wide opaque strip and 40 % with an 8 mm-wide opaque strip both theoretically and experimentally. Thus, the spatial resolution will be improved, and cw lidars will be less susceptible to moving objects far from the intended measurement point, such as low-hanging clouds.
Without the strip in the center, the quarter-wave plates result in essentially no improvement in the spatial resolution of the cw lidars, as the FWHM is 3.45 m and that of the conventional cw lidar is 3.46 m because of the overlapping effect of the emitted beam and the returned beam at the center line. In addition, the weighting function curve overlaps with that of the conventional cw lidar, indicating that the fat tails cannot be suppressed with only quarter-wave plates.
However, this issue could potentially be solved by an alternative modification by applying a prism or special fiber end to split the emitted laser beam into two beams with almost the same power. Therefore, with such a modification together with co-planar quarter-wave plates, the measurement volume could be compacted, and the fat tails of the weighting function could also be effectively suppressed without losing too much laser power.

Author Contributions

Conceptualization, J.M. and M.S.; methodology, project management, and experiment conduction, L.J., J.M. and M.S.; data analysis, L.J., J.M. and M.S.; writing—original draft preparation, L.J. and J.M.; writing—review and editing, L.J., J.M. and M.S. All authors have read and agreed to the published version of the manuscript.

Funding

This research is mainly funded by the LIKE (LIdar Knowledge Europe) project. The LIKE project (H2020-MSCA-ITN-2019, Grant number 858358) is funded by the European Union.

Institutional Review Board Statement

Not applicable.

Informed Consent Statement

Not applicable.

Data Availability Statement

Data underlying the results presented in this paper can be obtained from the authors upon reasonable request.

Acknowledgments

The authors would like to thank our colleague Nikolas Angelou for Figure 14 and helpful discussions and also Peter John Rodrigo of DTU Photonics for helpful comments to the manuscript. Furthermore, the authors would also like to thank Anders Tegtmeier Pedersen and Claus Brian Munk Pedersen from Technical University of Denmark for their helpful support during the lab experiment, the 3D printing, and fruitful discussions.

Conflicts of Interest

The authors declare no conflict of interest.

Abbreviations

The following abbreviations are used in this manuscript:
cwContinuous-Wave
FWHMthe Full-Width at Half-Maximum
LOSLine-of-Sight
IQIn-phase/Quadrature-phase
LOLocal Oscillator
IFIntermediate Frequency

References

  1. Köpp, F.; Rahm, S.; Smalikho, I.; Dolfi, A.; Cariou, J.P.; Harris, M.; Young, R.I. Comparison of wake-vortex parameters measured by pulsed and continuous-wave lidars. J. Aircr. 2005, 42, 916–923. [Google Scholar] [CrossRef]
  2. Spuler, S.M.; Richter, D.; Spowart, M.P.; Rieken, K. Optical fiber-based laser remote sensor for airborne measurement of wind velocity and turbulence. Appl. Opt. 2011, 50, 842–851. [Google Scholar] [CrossRef] [PubMed]
  3. Rodrigo, P.J.; Iversen, T.F.; Hu, Q.; Pedersen, C. Diode laser lidar wind velocity sensor using a liquid-crystal retarder for non-mechanical beam-steering. Opt. Express 2014, 22, 26674–26679. [Google Scholar] [CrossRef] [PubMed] [Green Version]
  4. Simley, E.; Pao, L.Y. A longitudinal spatial coherence model for wind evolution based on large-eddy simulation. In Proceedings of the 2015 American Control Conference (ACC), Chicago, IL, USA, 1–3 July 2015; pp. 3708–3714. [Google Scholar]
  5. Wei, T.; Xia, H.; Yue, B.; Wu, Y.; Liu, Q. Remote sensing of raindrop size distribution using the coherent Doppler lidar. Opt. Express 2021, 29, 17246–17257. [Google Scholar] [CrossRef] [PubMed]
  6. Abari, C.F.; Pedersen, A.T.; Dellwik, E.; Mann, J. Performance evaluation of an all-fiber image-reject homodyne coherent Doppler wind lidar. Atmos. Meas. Tech. 2015, 8, 4145–4153. [Google Scholar] [CrossRef] [Green Version]
  7. Sathe, A.; Mann, J. A review of turbulence measurements using ground-based wind lidars. Atmos. Meas. Tech. 2013, 6, 3147–3167. [Google Scholar] [CrossRef] [Green Version]
  8. ZX Lidars. The History of ZX Wind LIDARS. Available online: https://www.zxlidars.com/wind-lidar-history/ (accessed on 15 June 2022).
  9. Harris, M.; Bryce, D.J.; Coffey, A.S.; Smith, D.A.; Birkemeyer, J.; Knopf, U. Advance measurement of gusts by laser anemometry. J. Wind. Eng. Ind. Aerodyn. 2007, 95, 1637–1647. [Google Scholar] [CrossRef]
  10. Held, D.P.; Mann, J. Lidar estimation of rotor-effective wind speed–an experimental comparison. Wind. Energy Sci. 2019, 4, 421–438. [Google Scholar] [CrossRef] [Green Version]
  11. Howard, A.Q., Jr.; Naini, T. Four Methods for LIDAR Retrieval of Microscale Wind Fields. Remote Sens. 2012, 4, 2329–2355. [Google Scholar] [CrossRef] [Green Version]
  12. Held, D.P.; Mann, J. Comparison of methods to derive radial wind speed from a continuous-wave coherent lidar Doppler spectrum. Atmos. Meas. Tech. 2018, 11, 6339–6350. [Google Scholar] [CrossRef] [Green Version]
  13. Liu, Z.; Barlow, J.F.; Chan, P.W.; Fung, J.C.H.; Li, Y.; Ren, C.; Mak, H.W.L.; Ng, E. A review of progress and applications of pulsed Doppler wind LiDARs. Remotesensing 2019, 11, 2522. [Google Scholar] [CrossRef] [Green Version]
  14. Kawabata, H.; Kikushima, Y.; Kogaki, T. Wind Profile and Power Performance Measurements Using a Nine-beam Nacelle Lidar. Am. J. Mech. Eng. 2018, 6, 75–82. [Google Scholar] [CrossRef]
  15. Shin, D.; Ko, K. Application of the nacelle transfer function by a nacelle-mounted light detection and ranging system to wind turbine power performance measurement. Energies 2019, 12, 1087. [Google Scholar] [CrossRef] [Green Version]
  16. Bingöl, F.; Mann, J.; Larsen, G.C. Light detection and ranging measurements of wake dynamics part I: One-dimensional scanning. Wind. Energy Int. J. Prog. Appl. Wind. Power Convers. Technol. 2010, 13, 51–61. [Google Scholar] [CrossRef]
  17. Trujillo, J.J.; Bingöl, F.; Larsen, G.C.; Mann, J.; Kühn, M. Light detection and ranging measurements of wake dynamics. Part II: Two-dimensional scanning. Wind Energy 2011, 14, 61–75. [Google Scholar] [CrossRef]
  18. Annoni, J.; Fleming, P.; Scholbrock, A.; Roadman, J.; Dana, S.; Adcock, C.; Porte-Agel, F.; Raach, S.; Haizmann, F.; Schlipf, D. Analysis of control-oriented wake modeling tools using lidar field results. Wind Energy Sci. 2018, 3, 819–831. [Google Scholar] [CrossRef] [Green Version]
  19. Scholbrock, A.; Fleming, P.; Schlipf, D.; Wright, A.; Johnson, K.; Wang, N. Lidar-enhanced wind turbine control: Past, present, and future. In Proceedings of the 2016 American Control Conference (ACC), Boston, MA, USA, 6–8 July 2016; pp. 1399–1406. [Google Scholar]
  20. Dimitrov, N.; Borraccino, A.; Peña, A.; Natarajan, A.; Mann, J. Wind turbine load validation using lidar-based wind retrievals. Wind Energy 2019, 22, 1512–1533. [Google Scholar] [CrossRef]
  21. Conti, D.; Pettas, V.; Dimitrov, N.; Peña, A. Wind turbine load validation in wakes using wind field reconstruction techniques and nacelle lidar wind retrievals. Wind Energy Sci. 2021, 6, 841–866. [Google Scholar] [CrossRef]
  22. Peña, A.; Mann, J.; Dimitrov, N. Turbulence characterization from a forward-looking nacelle lidar. Wind Energy Sci. 2017, 2, 133–152. [Google Scholar] [CrossRef] [Green Version]
  23. Vasiljević, N.; L.M. Palma, J.M.; Angelou, N.; Carlos Matos, J.; Menke, R.; Lea, G.; Mann, J.; Courtney, M.; Frölen Ribeiro, L.; M.G.C. Gomes, V.M. Perdigão 2015: Methodology for atmospheric multi-Doppler lidar experiments. Atmos. Meas. Tech. 2017, 10, 3463–3483. [Google Scholar] [CrossRef] [Green Version]
  24. Hofsäß, M.; Clifton, A.; Cheng, P.W. Reducing the uncertainty of Lidar measurements in complex terrain using a linear model approach. Remote Sens. 2018, 10, 1465. [Google Scholar] [CrossRef] [Green Version]
  25. Peña, A.; Hasager, C.; Badger, M.; Barthelmie, R.; Bingöl, F.; Cariou, J.P.; Emeis, S.; Frandsen, S.; Harris, M.; Karagali, I.; et al. Remote Sensing for Wind Energy; Number 0084(EN) in DTU Wind Energy E; DTU Wind Energy: Roskilde, Denmark, 2015. [Google Scholar]
  26. Mikkelsen, T. On mean wind and turbulence profile measurements from ground-based wind lidars: Limitations in time and space resolution with continuous wave and pulsed lidar systems. In Proceedings of the European Wind Energy Conference and Exhibition, Marseille, France, 16–19 March 2009; Volume 6, pp. 4123–4132. [Google Scholar]
  27. Harris, M.; Constant, G.; Ward, C. Continuous-wave bistatic laser Doppler wind sensor. Appl. Opt. 2001, 40, 1501–1506. [Google Scholar] [CrossRef]
  28. Mauder, M.; Eggert, M.; Gutsmuths, C.; Oertel, S.; Wilhelm, P.; Voelksch, I.; Wanner, L.; Tambke, J.; Bogoev, I. Comparison of turbulence measurements by a CSAT3B sonic anemometer and a high-resolution bistatic Doppler lidar. Atmos. Meas. Tech. 2020, 13, 969–983. [Google Scholar] [CrossRef] [Green Version]
  29. Brinkmeyer, E.; Waterholter, T. Continuous wave synthetic low-coherence wind sensing Lidar: Motionless measurement system with subsequent numerical range scanning. Opt. Express 2013, 21, 1872–1897. [Google Scholar] [CrossRef]
  30. Abari, C.F.; Pedersen, A.T.; Mann, J. An all-fiber image-reject homodyne coherent Doppler wind lidar. Opt. Express 2014, 22, 25880–25894. [Google Scholar] [CrossRef] [Green Version]
  31. DeLange, O. Optical heterodyne detection. IEEE Spectr. 1968, 5, 77–85. [Google Scholar] [CrossRef]
  32. Jacobs, S. Optical heterodyne (coherent) detection. Am. J. Phys. 1988, 56, 235–245. [Google Scholar] [CrossRef]
  33. Castagner, J.L.; Jones, A.R. A double Gaussian beam method for the determination of particle size, direction and velocity. Part. Part. Syst. Charact. Meas. Descr. Part. Prop. Behav. Powders Other Disperse Syst. 2004, 21, 5–14. [Google Scholar] [CrossRef]
  34. Volpp, J.; Laskin, A.; Laskin, V.; Ostrun, A. Refractive multi-focus optics for material processing. Int. Congr. Appl. Lasers Electro-Opt. 2016, 2016, 1402. [Google Scholar] [CrossRef]
  35. WedgedFiberEnd. Micro-Lensed Optical Fibers by WTTechnology. Available online: https://www.wttechnology.com/lensed%20fibers_v5.pdf (accessed on 15 June 2022).
  36. Saleh, B.E.; Teich, M.C. Fundamentals of Photonics; John Wiley & Sons: Hoboken, NJ, USA, 2019. [Google Scholar]
  37. Szeg, G. Orthogonal Polynomials; American Mathematical Society: Providence, RI, USA, 1939; Volume 23. [Google Scholar]
  38. Abramowitz, M.; Stegun, I.A. Handbook of Mathematical Functions; Dover Publications: Mineola, NY, USA, 1972. [Google Scholar]
  39. Bunck, B.F. A fast algorithm for evaluation of normalized Hermite functions. BIT Numer. Math. 2009, 49, 281–295. [Google Scholar] [CrossRef]
  40. Cleanroom Management International. Smooth Smoke Generator. Available online: https://www.cmitest.com/produits/smoke-generator-air-trace/ (accessed on 15 June 2022).
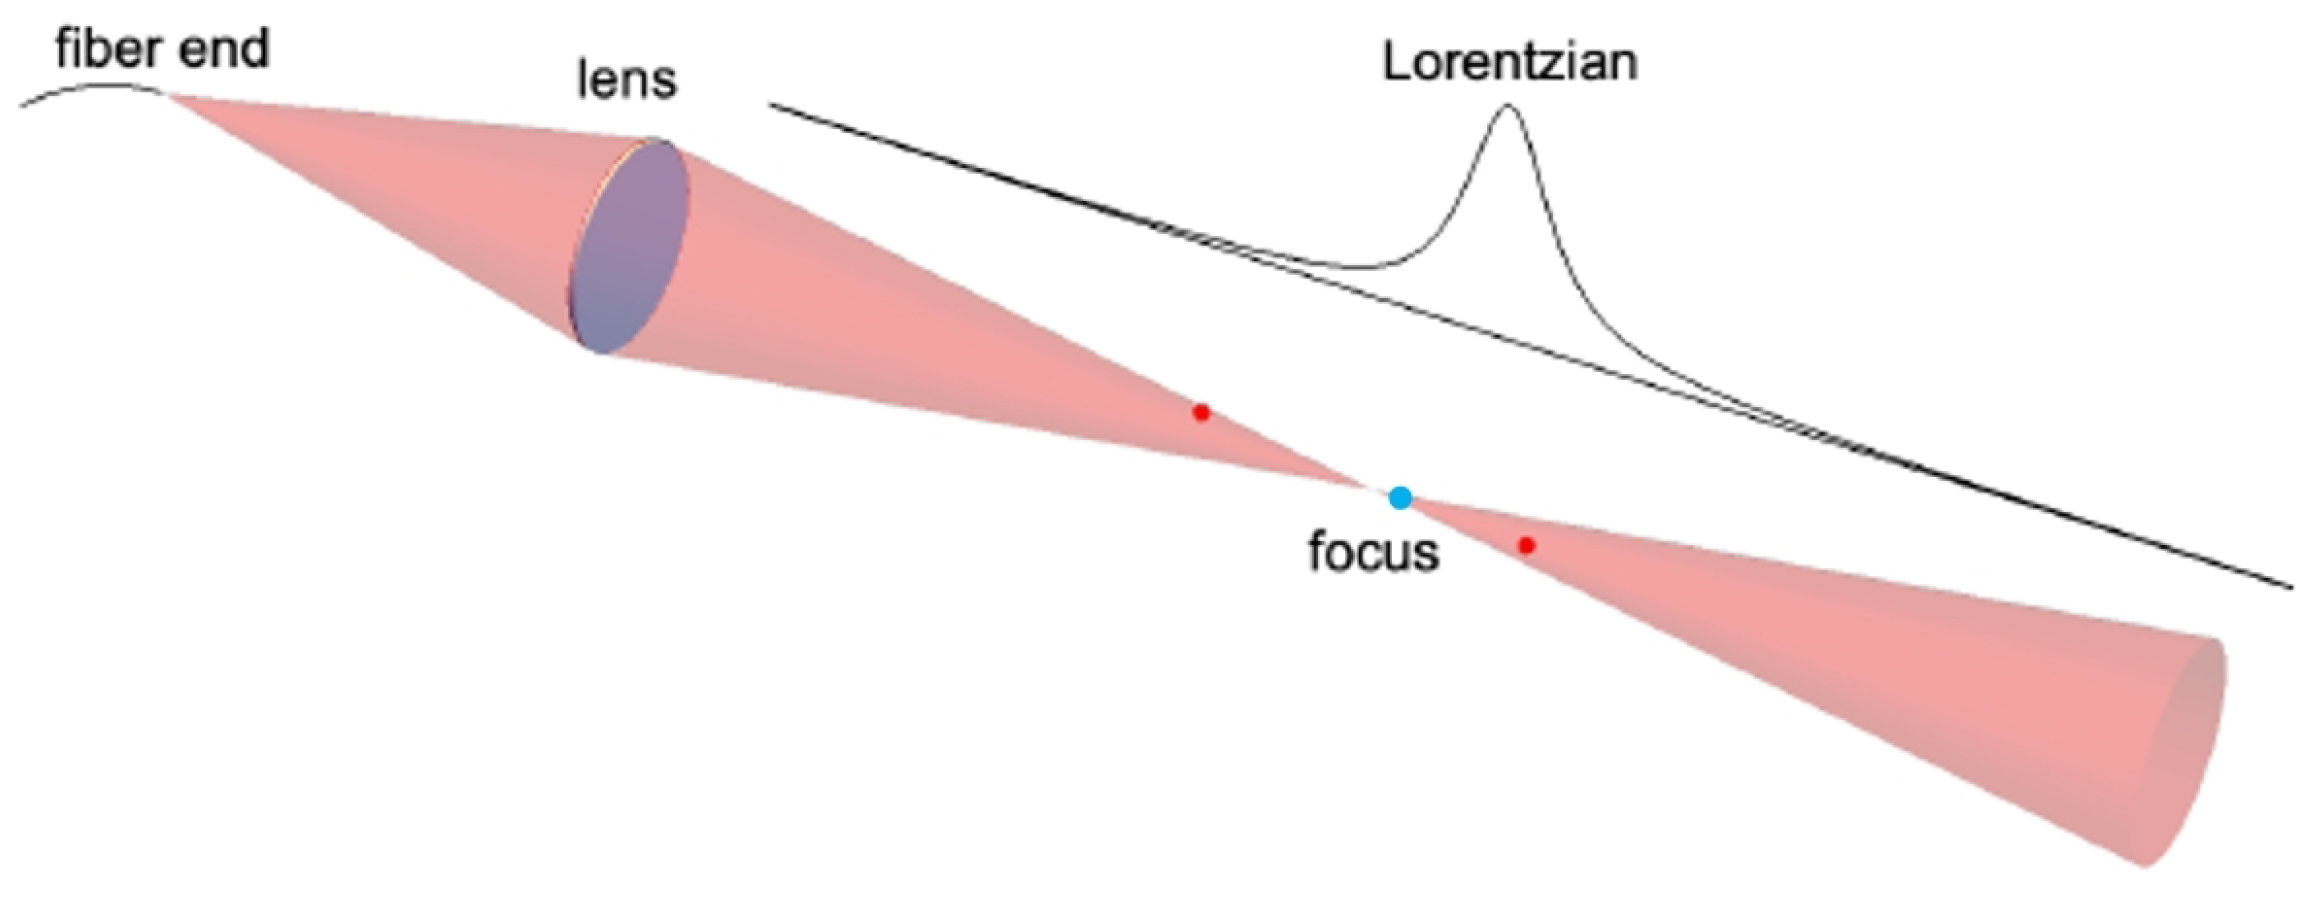
Figure 1. Principle of conventional cw lidar.
Remotesensing 14 03576 g001
Figure 2. Lidar telescope with quarter-wave plates inserted. (a) The plate consists of two halves, each with the fast axis 45 relative to vertical. (b) The plates are placed between the fiber end and the focusing lens, 50 mm away from the optical fiber end.
Remotesensing 14 03576 g002
Figure 3. Principle of the quarter-wave plate.
Remotesensing 14 03576 g003
Figure 4. Illustration of how the quarter-wave plates can reduce the measurement volume using ray tracing. The rightmost black point indicates the aerosol is at the focus, and the rightmost red is an aerosol that is off the focus and off the central axis.
Remotesensing 14 03576 g004
Figure 5. Examples of several nth-order Hermite functions: n = 0 (blue, solid), n = 1 (pink, dashed), n = 2 (brown, dotted), n = 3 (green, dashed), n = 4 (orange, dot-dashed), n = 5 (purple, solid).
Remotesensing 14 03576 g005
Figure 6. Convergence of the series to the half Gaussian function shown in red behind the approximating curves: 10 2 (blue), 10 3 (pink), 10 4 (cyan) to 10 5 (black) terms are included.
Remotesensing 14 03576 g006
Figure 7. “Normalized” weighting function profile of the half Gaussian function beam. Because of the normalization of x with w ( z ) , it is hard to see that the beam is actually focused at z = 0 .
Remotesensing 14 03576 g007
Figure 8. Truncated Gaussian (the red solid line) and the approximating Hermite expansion (the blue solid line) using 50.000 terms in Equation (24) with α = 0.8 as an example.
Remotesensing 14 03576 g008
Figure 9. “Normalized” weighting function profile of truncated Gaussian beam at y = 0 and with α = 0.4 . Because of the normalization of x with w ( z ) , it is hard to see that the beam is actually focused at z = 0 .
Remotesensing 14 03576 g009
Figure 10. Comparison of the normalized weighting function between the half Gaussian function (the blue curve) and two truncated Gaussian functions α = 0.4 (the orange curve) and α = 0.8 (the pink curve), first normalized by a normal Lorentzian weighting function (so the normal weighting function becomes a horizontal line; black line) of a conventional cw lidar case and then scaled by the maximum value of each curve. The three dots are the experimental results for the half Gaussian function (the blue dot) and two truncated Gaussian functions (the orange and pink dots).
Remotesensing 14 03576 g010
Figure 11. The peak power or intensity (black line), normalized width at 0.5 , 0.1 , and 0.01 of maximum power spectral density (blue, light blue, and brown lines) of the truncated Gaussian as a function of ratio α = W i d t h s t r i p D i a m e t e r b e a m . When α =0, the theoretical intensity is 0.5 , half of that of conventional cw lidars. Due to the limited number of terms included in the Hermite function and the integral range, the calculated intensity only approaches 0.5 .
Remotesensing 14 03576 g011
Figure 12. Schematic of the experiment setup with quarter-wave plates placed.
Remotesensing 14 03576 g012
Figure 13. System components in the laboratory environment. (a) Quarter-wave plates with an opaque strip placed in the center in a cw lidar system. (b) The fiber end is driven by a motor. (c) Marked angles on outer holder to show the relative orientation angle between the fiber end and the plates. (d) Inner holder of two plates with the optical axes perpendicular to each other.
Remotesensing 14 03576 g013
Figure 14. Weighting function of cw lidars. (a) The fiber end is fixed. (b) The fiber end is movable, and the distance from the target to the telescope is fixed.
Remotesensing 14 03576 g014
Figure 15. Power spectral density (left column) and weighting function profile (right column) of the conventional cw lidar case (a,b), orthogonal optical axes of quarter-wave plates case (c,d), and plates with a 4 mm wide opaque card strip in the center as α = 0.4 (e,f).
Remotesensing 14 03576 g015
Figure 16. Comparison of normalized weighting function profiles between experiment and theory of two cases. (a) Only placing two quarter-wave plates in the system. (b) Placing two quarter-wave plates with an opaque strip in the system.
Remotesensing 14 03576 g016
Publisher’s Note: MDPI stays neutral with regard to jurisdictional claims in published maps and institutional affiliations.