Article

A Robust Dual-Platform GMTI Method against Nonuniform Clutter

School of Electronic Science, National University of Defense Technology, Changsha 410073, China
*
Author to whom correspondence should be addressed.
Remote Sens. 2022, 14(15), 3558; https://doi.org/10.3390/rs14153558
Submission received: 1 June 2022 / Revised: 4 July 2022 / Accepted: 20 July 2022 / Published: 25 July 2022

Abstract

:
The ground moving-target indication (GMTI) technique can detect civil and military moving targets, which means that this technique has received much attention. Strong clutter background suppression is one of the critical problems in this application. However, the detection performance in heterogeneous environment can be degraded due to the inaccurate estimation of the clutter covariance matrix (CCM). In this paper, we propose a robust GMTI method using a spaceborne dual-platform synthetic aperture radar (SAR) system, which can obtain highly accurate CCM in nonuniform clutter. Firstly, the accurate CCM is estimated based on the SAR image obtained by the former platform. Then, space–time adaptive processing (STAP) is carried out using the obtained the CCM. Finally, the detection threshold is set according to the estimated CCM and detection is executed accurately. Compared with the traditional CCM estimation method in STAP using the clutter nearby the cell under test, this method directly estimates the CCM using the clutter of the cell under test, which can avoid CCM estimation mistakes in heterogeneous clutter environment. The clutter can be whitened and depressed more effectively. Additionally, with the accurate threshold acquired from the CCM, the detection probability can be effectively improved under a certain false-alarm criterion. Based on simulation data, GMTI experiments in a heterogeneous environment such as clutter with strong pollution, junction zone of hot and cold clutter, and clutter with nonuniform power are carried out; the results show that the moving targets can be effectively detected with the proposed method.

Graphical Abstract

1. Introduction

Ground moving-target indication (GMTI) is of great significance in both civil and military fields. Due to its promising prospect in target indication, GMTI has gradually become an important task in radar systems, which has drawn increasing attention from many countries [1,2,3,4].
GMTI techniques are often used by a moving platform to detect the target of interest in the background. The echoes of the moving target are covered by a strong background clutter. Therefore, clutter suppression is a critical and challenging problem in GMTI data processing [5,6]. Commonly, clutter suppression can be performed by a displaced-phase-center antenna (DPCA) [1,7], along-track interferometry (ATI) [8,9,10], and space–time adaptive processing (STAP) [11,12]. STAP takes advantage of the space–time differences between clutter and ground moving target (GMT) echoes to realize clutter suppression, which is regarded as the optimum processing method and obtains the best performance. STAP needs to obtain the clutter covariance matrix (CCM) of the cell under test (CUT). However, CCM cannot be directly estimated by the CUT echoes because they are polluted by GMT echoes. Instead, CCM is estimated by the training samples nearby the CUT. This method requires that the training samples are independent and identically distributed (IID) with the CUT, which leads to STAP performance degradation in clutter suppression. Time–space adaptive processing (STAP) is a space–time filter design method aiming at the space–time coupling of ground clutter, which can greatly reduce the minimum detectable velocity (MDV) of the target and improve GMTI performance [7,8]. Brennan deduced the space–time two-dimensional adaptive optimal processor structure, namely the optimal STAP, according to the maximum likelihood ratio theory. The research results showed that STAP could effectively compensate the platform motion effect of airborne radar and obtain ideal clutter suppression capability. The core problem of optimal STAP is to accurately estimate the CCM of the cell under test (CUT). However, in the actual working environment, a complex ground scene clutter with alternating hot and cold clutter, strong interference targets as well as other factors often lead to uneven clutter distribution. At this time, the pollution of nonuniform samples and the reduction of available uniform samples make the clutter covariance matrix (CCM) estimated by the maximum likelihood method mismatch with the clutter statistical characteristics of the the cell under test (CUT), which leads to the serious deterioration of the STAP performance.
In view of the above problems, domestic and foreign scholars have put forward corresponding solutions from different perspectives. According to the low-rank characteristics of clutter, the reduced-rank STAP algorithm estimates the clutter subspace based on the feature space classification analysis method, which alleviates the performance loss caused by insufficient samples in a heterogeneous environment [13,14,15]. Based on this idea, two methods were proposed: the direct data domain least-squares (D3-LS) STAP method [16] and the maximum likelihood estimation detector (MLED) method [17,18,19]. Unfortunately, the benefits of these methods are generated by reducing the degree of freedom (DOF) in the system, which leads to performance degradation. Recently, many new methods have also been proposed. A CRM STAP method for BiSAR-GMTI nonstationary clutter suppression was proposed in [20]. In [21], a new intrinsic cyclic characteristic of CCM was found. After that, the knowledge-assisted STAP algorithm provides an alternative solution to reduce the required samples using prior knowledge [22]. In order to obtain accurate clutter information for the CCM estimation, an auxiliary channel selection method based on prior knowledge was proposed. The auxiliary channel was selected along the clutter ridge of the first-order sea clutter, and its distribution could be determined by the system parameters and used as prior knowledge. Unfortunately, it is not easy to acquire accurate knowledge. Recently, the correlation of matrix information geometry method for radar signal processing has become a focus and been proved [23,24]. These methods make use of the nonlinear geometry of the matrix manifold and show advantages in terms of signal processing. In [25], a manifold-based clutter suppression method with limited samples was proposed. Ref. [26] mentions a new SAR-GMTIm algorithm in the framework of compressed sensing (CS), which is able to obtain high-resolution SAR images with a high focus response and precise localization. In [27,28], a novel MTI scheme, which consists of DPCA detection, clustering and ATI discrimination, is also noted to reduce the probability of false alarms and improve the detection performance. However, although these methods suppress clutter in several ways, such as reducing the number of samples, reducing dimensionality, and selecting uniform samples, they have not fundamentally solved the problem.
In this paper, we propose a robust GMTI method using a spaceborne dual-platform synthetic aperture radar system. The former platform and the latter platform have the same subastral point tracks, which guarantee consistent scattering between the echoes from the former platform and the echoes from the latter platform. Therefore, the accurate CCM can be directly estimated from the echoes of the GMT zone based on the SAR image obtained by the former platform. Based on this fact, a new GMTI processing method is presented. Firstly, due to the errors in observation geometry between the two SAR images, there is a certain offset and distortion between the images, so it is necessary to register the images of the former and latter platforms. Following image registration, the next step is to calculate the CCM. In this paper, the calculation of the CCM is based on the echo from the CUT, which originated from the registered auxiliary image. To improve echo generation speeds, we used the fast echo simulation method based on range profile inverse transforming. After obtaining the accurate CCM, the detection threshold was set according to the estimated CCM and detection was executed accurately. Compared with the traditional CCM estimation method in STAP, using the nearby clutter cell instead of the CUT, this method can avoid CCM estimation mistakes in a nonuniform clutter environment. The clutter can be whitened and depressed more effectively. With the accurate threshold acquired from the CCM, the detection probability can be effectively improved under certain false-alarm criterion. The novelties and contributions of this paper are summarized as follows.
i
Directly calculate CCM with the range cell echoes at the location of the moving target that originated from the forward SAR images.
ii
By estimating CCM more accurately, the target detection threshold will also be more accurate, making the detection results more reliable.
This paper is organized as follows. Section 2 describes the dual-platform GMTI method against nonuniform clutter. In this section, the problem of STAP processing as well as existing problems in heterogeneous environments are also analyzed. Section 3 presents the simulation results, which prove the effectiveness of the proposed method. Discussions about the disadvantages of the proposed method and future research can be found in Section 4. Section 5 is the conclusion.
Notation: Constants are denoted with nonbold, lower-case symbols; vectors and matrices are denoted by bold lower-case letters and bold upper-case letters, respectively. C represents the complex field. The conjugation of a complex number is denoted by [ · ] * . The transpose, conjugate transpose, and inverse of a matrix are denoted by the superscripts [ · ] T , [ · ] H , and [ · ] 1 , respectively. The Kronecker product of two matrices is represented by ⊗. The expectation operator is denoted by E [ · ] . The absolute value of a scalar or the determinant of a square matrix is denoted by | · | .

2. The Dual-Platform GMTI Method against Nonuniform Environment

Firstly, this section briefly sets out the basic formulation of the problem, and then analyzes and quantifies the influence of the heterogeneous environment in STAP. Finally, the high-accuracy clutter covariance matrix estimation, based on a dual-platform SAR system, is explored.

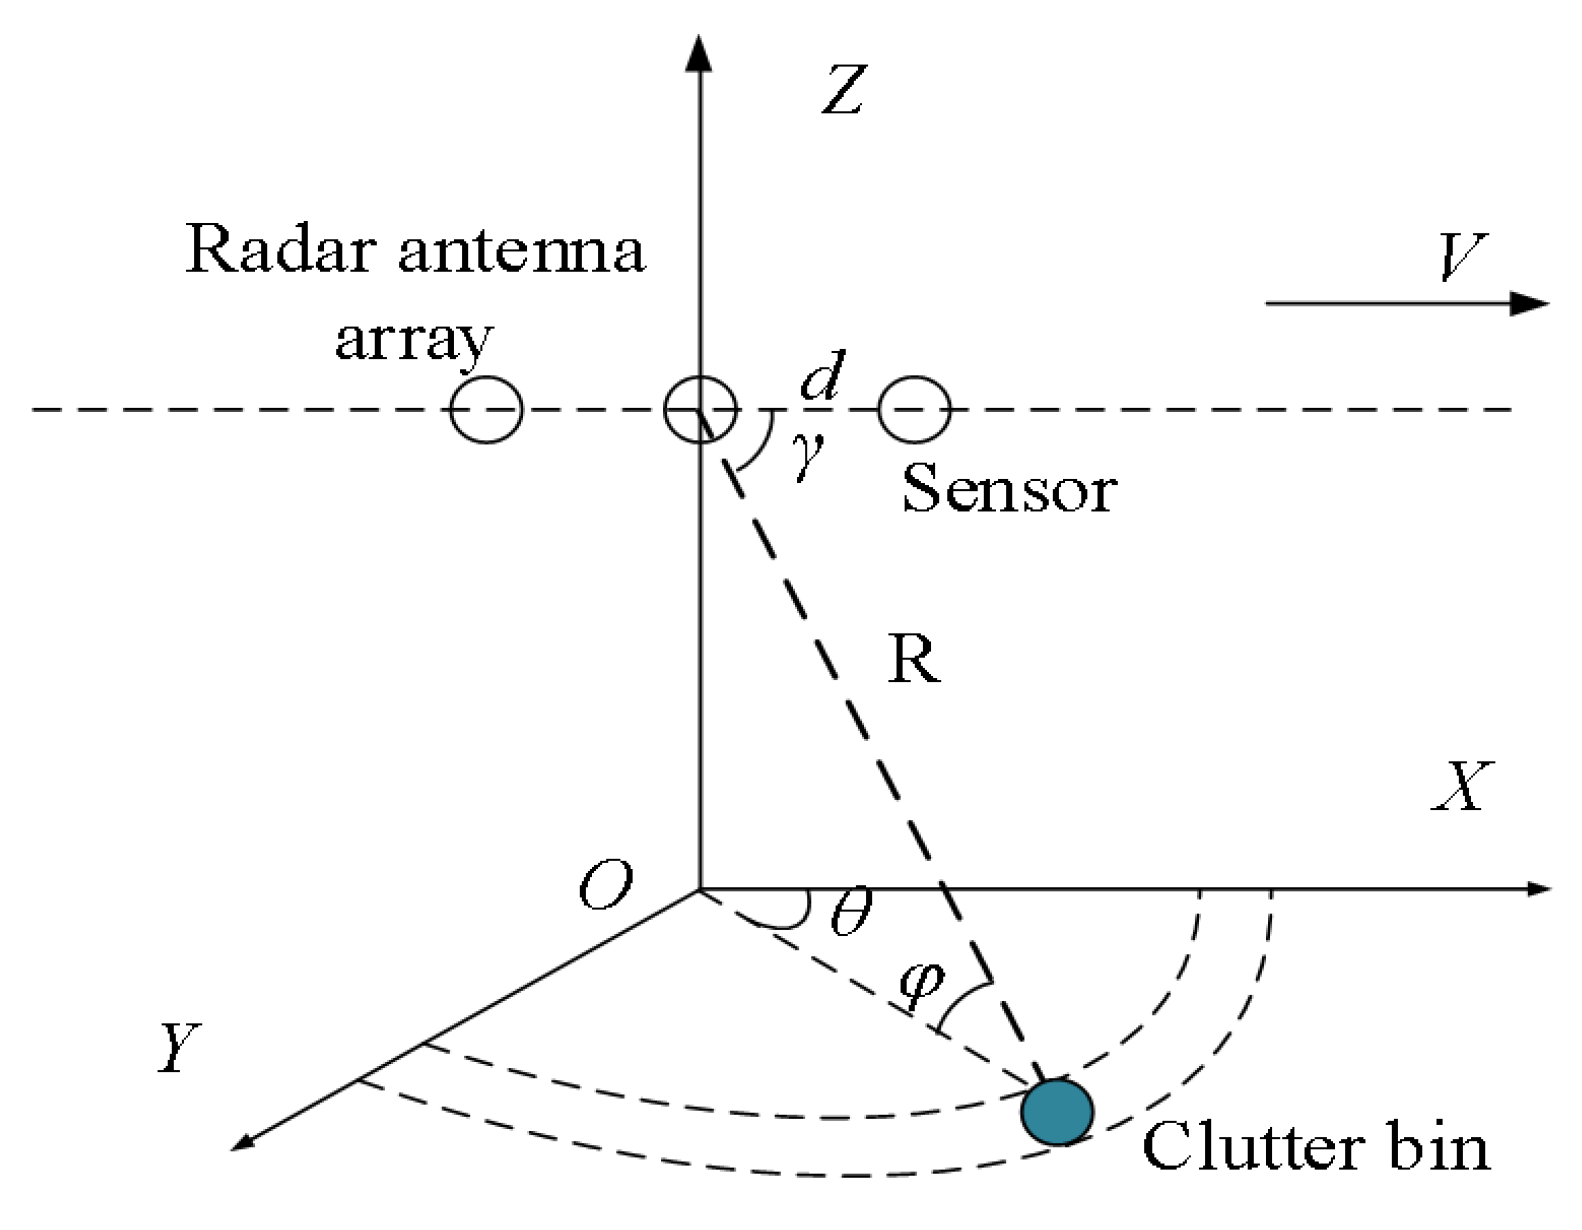
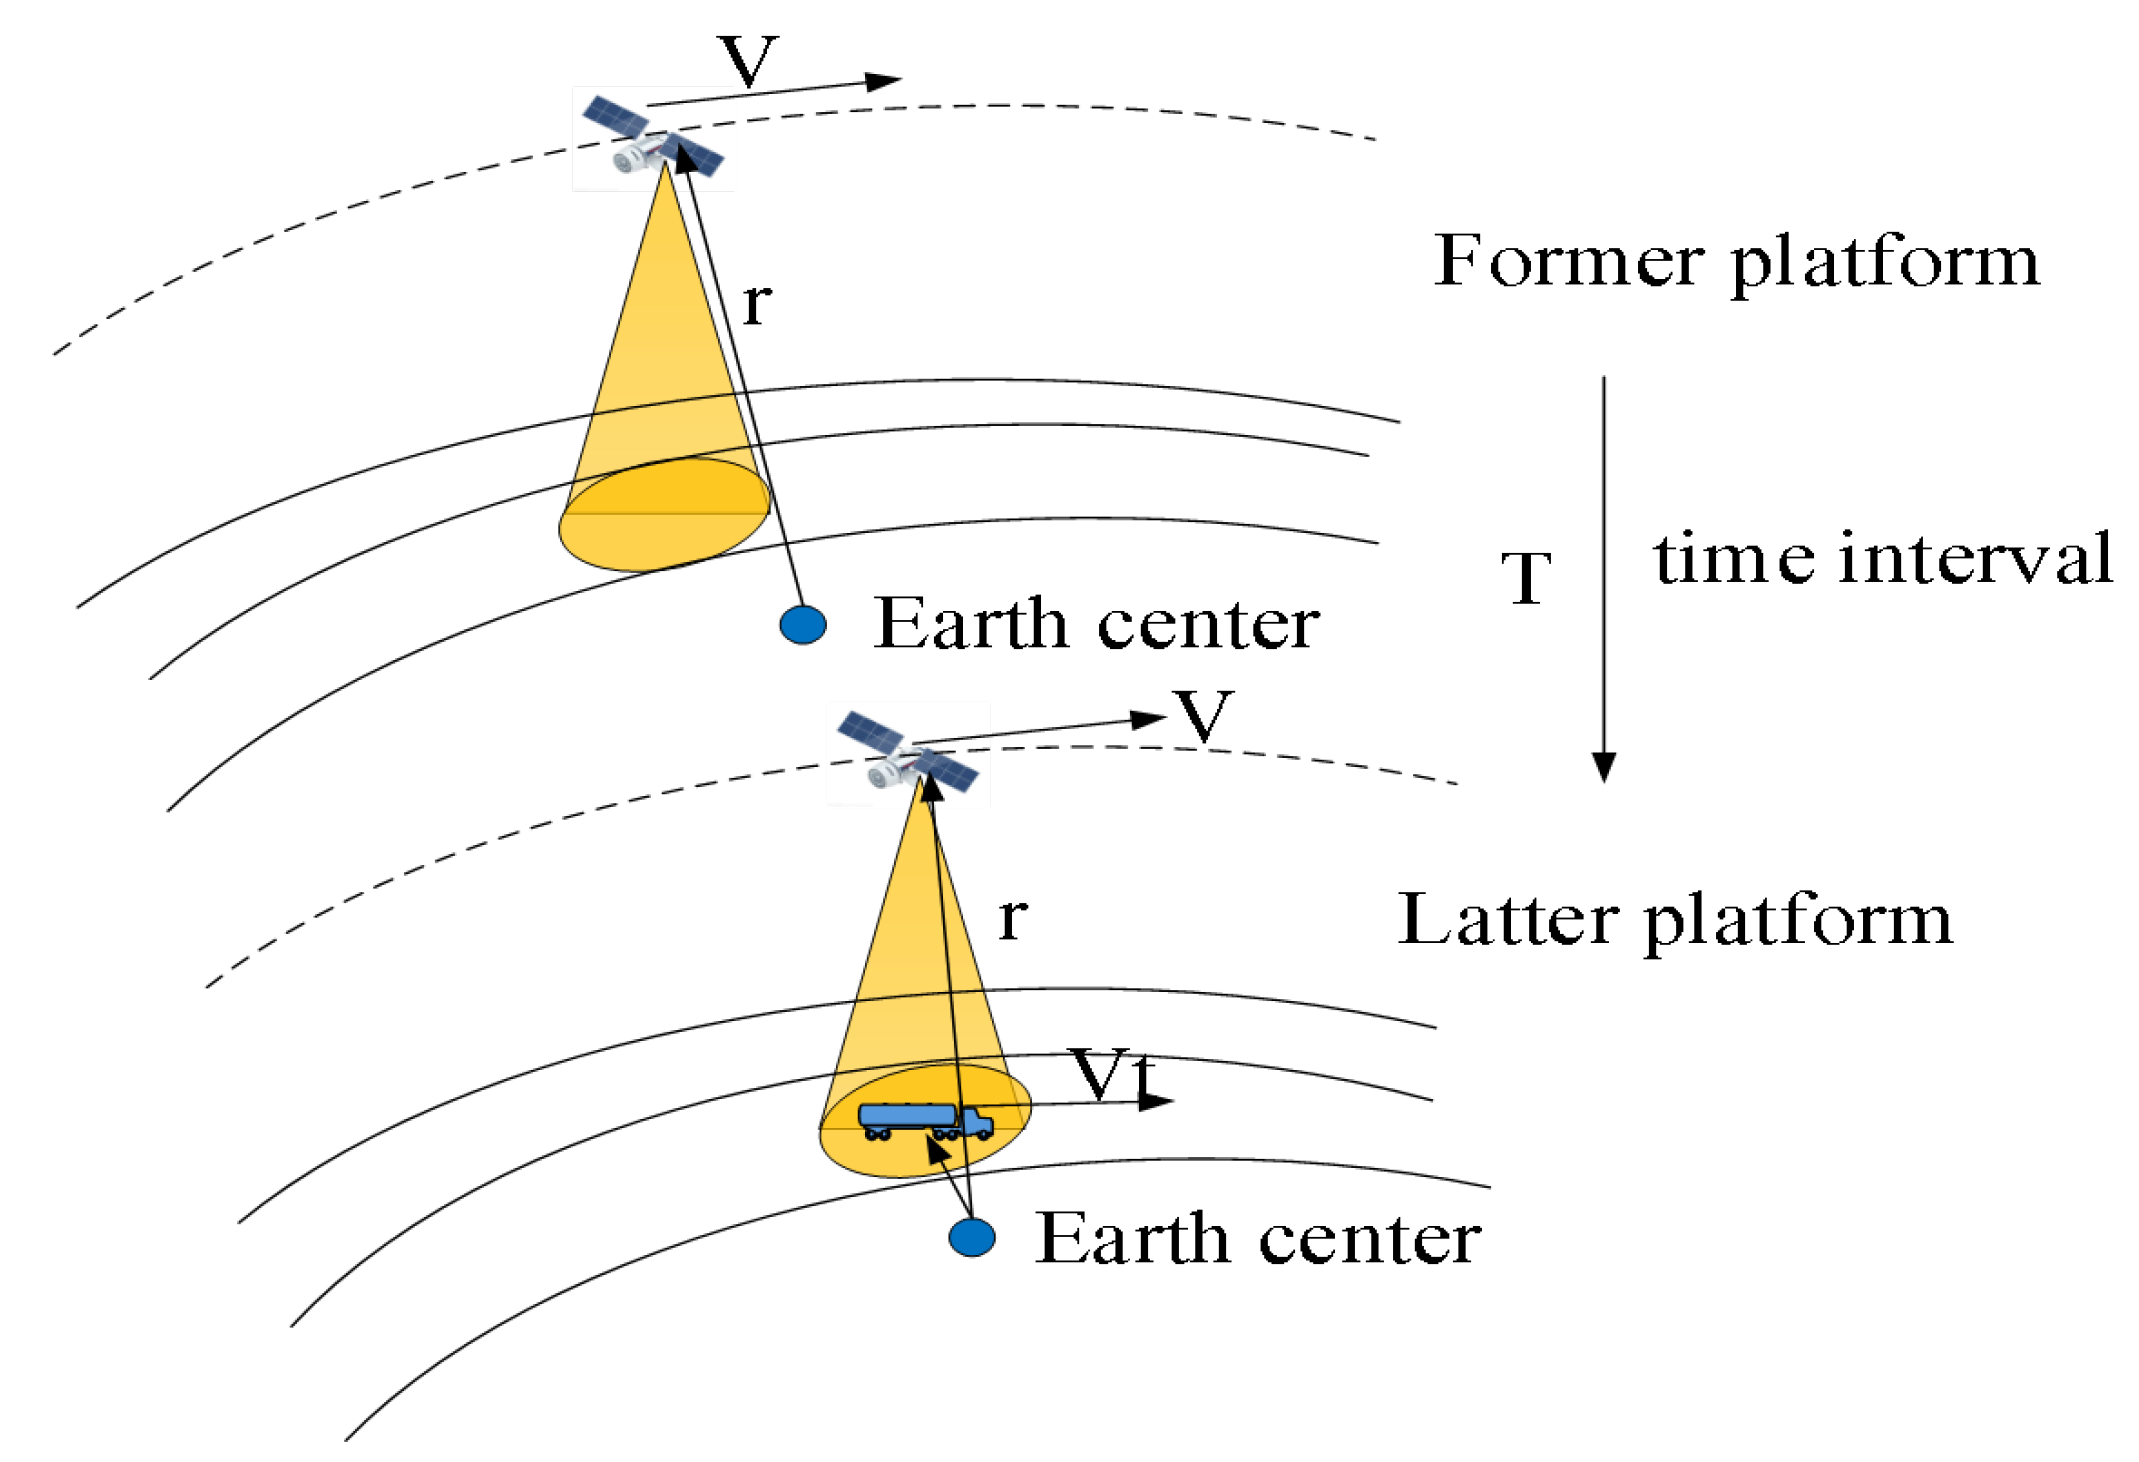
2.1. Problem Formulation

Assuming that a uniform linear array is composed of N array elements, the number of coherent pulses in the time domain is K, the platform moves along the axis direction of the array, the speed is V, the interval of the array element is d, the azimuth angle and pitch angle from the clutter block to the antenna phase center are θ and φ , respectively, the wavelength of the electromagnetic wave emitted by the radar is λ , and the first array element is used as the phase reference center. The earth observation geometry is shown in Figure 1.
The spatial steering vector of the array, denoted by s s ( w s ) C N × 1 , is calculated as
s s ( w s ) = 1 e j w s ( θ , φ ) e j ( N 1 ) w s ( θ , φ ) T ,
where w s ( θ , φ ) = 2 π d cos θ cos φ / λ is the spatial angular frequency of the target. The temporal steering vector, denoted by s t ( w t ) C K × 1 , is similarly defined as follows:
s t w t = 1 e j w t ( θ , φ ) e j ( K 1 ) w t ( θ , φ ) T ,
where w t ( θ , φ ) = 2 π f d / f r is the time-domain angular frequency of the target, f d is the Doppler frequency of the target, and f r is the pulse repetition frequency. The space–time sampling signal of the unit amplitude point target clutter is expressed as a vector, and the space–time two-dimensional steering vector s C N K × 1 is defined as
s = s s s t .
Assuming that the number of independent clutter blocks in a range gate is N c and the range ambiguity number is N r , the clutter sampling signal of a space–time snapshot, denoted by x c C K N × 1 , is expressed as follows:
x c = i = 1 N r k = 1 N c α i k s i k .
The clutter covariance matrix, denoted by R c C K N × K N , can be expressed as
R c = E x c x c H .
The weight vector of the space–time two-dimensional optimal processor, denoted by w o p t C K N × 1 , can be obtained by the following formula:
w o p t = μ R 1 s .

2.2. Analysis of the Influence of Heterogeneous Environment in STAP

The CCM is estimated using the clutter cell near the CUT in STAP, which requires that the training samples have the same statistical characteristics as the CUT when estimating the CCM. When the training samples used to estimate the CUT contain high levels of pollution, hot clutter, and nonuniform power, the CCM estimation will contain errors [29,30,31,32,33]. The three nonuniformities mentioned above are explained and discussed in the following.

2.2.1. Strong Pollution

The strong pollution phenomenon happens under two conditions. The first one is that moving targets (including ships, cars, etc.) reside in the background used to obtain the CCM. The second one is that jam exists in the background used to obtain the CCM. These two phenomena make the STAP filter form an unexpected null at the position where the moving targets or the jam are located. Once the target to be detected is close to the null in the STAP filter, the target is canceled, and its detection performance is reduced. The target’s influence CCM estimation can be expressed as:
R ^ = R + 1 N s i = 1 N j σ i 2 s i s i H ,
where R represents the CCM without pollution, N s is the number of training samples, σ i 2 is the energy of the ith pollution, and s i is the space–time steering vector of the ith pollution.
Strong pollution will prevent the CUT and training samples zones from satisfying the IID condition. The loss of the signal-to-clutter-plus-noise ratio (SCNR) improvement factor due to the pollution target is shown as follows:
L o s s I T = ( s H R ^ I T 1 s ) 2 s H R ^ I T 1 R R ^ I T 1 s · 1 s H R 1 s ,
where R ^ I T is the CCM containing strong pollution.

2.2.2. Hot Clutter

Due to the design of the radar system and for environmental reasons, many factors may lead to fluctuations between small pulses of clutter echo in practice. The dynamics of scanning antennas and any pulse-to-pulse instability in radar system components will produce fluctuations. The natural variations in clutter reflectivity may occur in land clutter, or in ocean clutter due to the action of wind or the movement of sea waves. Any wave source will cause the Doppler spectrum of a single clutter echo to widen. The fluctuation between pulses caused by any of these sources is called intrinsic clutter motion (ICM). The existence of ICM requires a wider clutter gap, or more adaptive degrees of freedom, to effectively be eliminated [34].
The space–time covariance matrix of the kth clutter patch for a single clutter patch including ICM denoted by R k , k = 1 , 2 , , N c is then given by
R k = ξ k ( Γ k * b k b k H ) a k a k H ,
where ξ k is the clutter CNR and Γ k is the covariance matrix of the fluctions for the kth patch, defined by
Γ k = E { α k α k H } = T o e p l i t z ( γ c ( 0 ) ; ; γ c ( K 1 ) .
Superposition is invoked to yield the result when many independent clutter sources are present:
R c = k = 1 N c ξ k ( Γ k * b k b k H ) a k a k H .
Adding 37 micromoving targets with a random velocity between 0 and 1 m/s (the motion direction is also random) will increase the heterogeneity of clutter, which was used to simulate the hot clutter. Figure 2 shows the clutter ridge without hot clutter and the clutter ridge with disturbance, respectively. It can be clearly seen that the hot clutter widens the clutter ridge. Generally, moving targets exist in the cold clutter area, so if the training sample contains hot clutter, this will affect the estimation of CCM, thus affecting the detection performance.

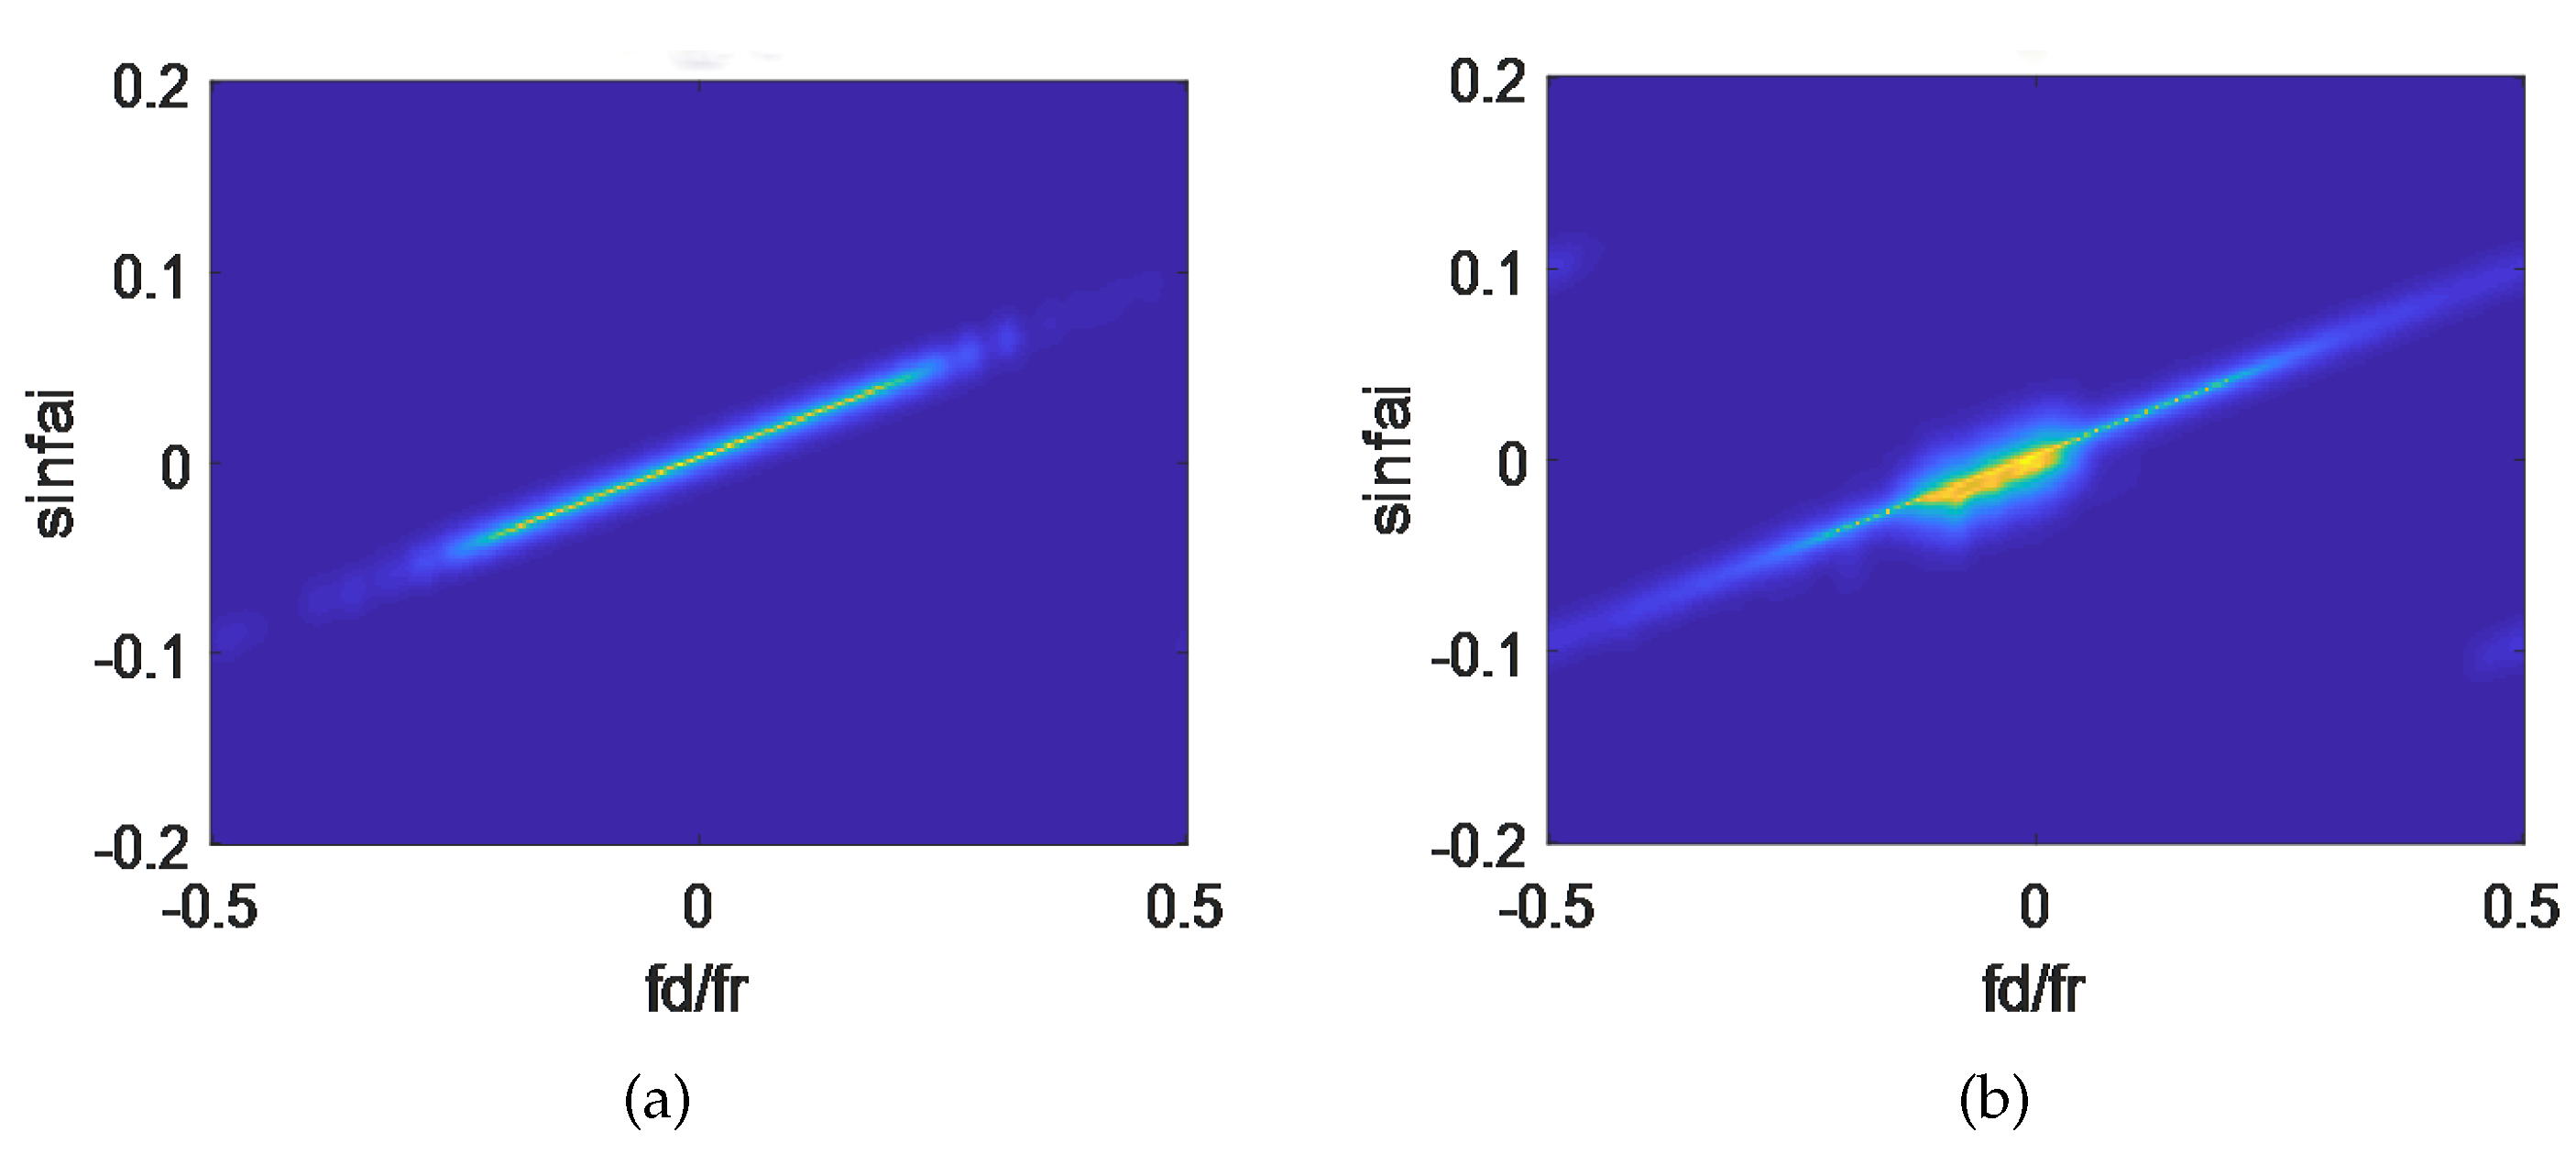
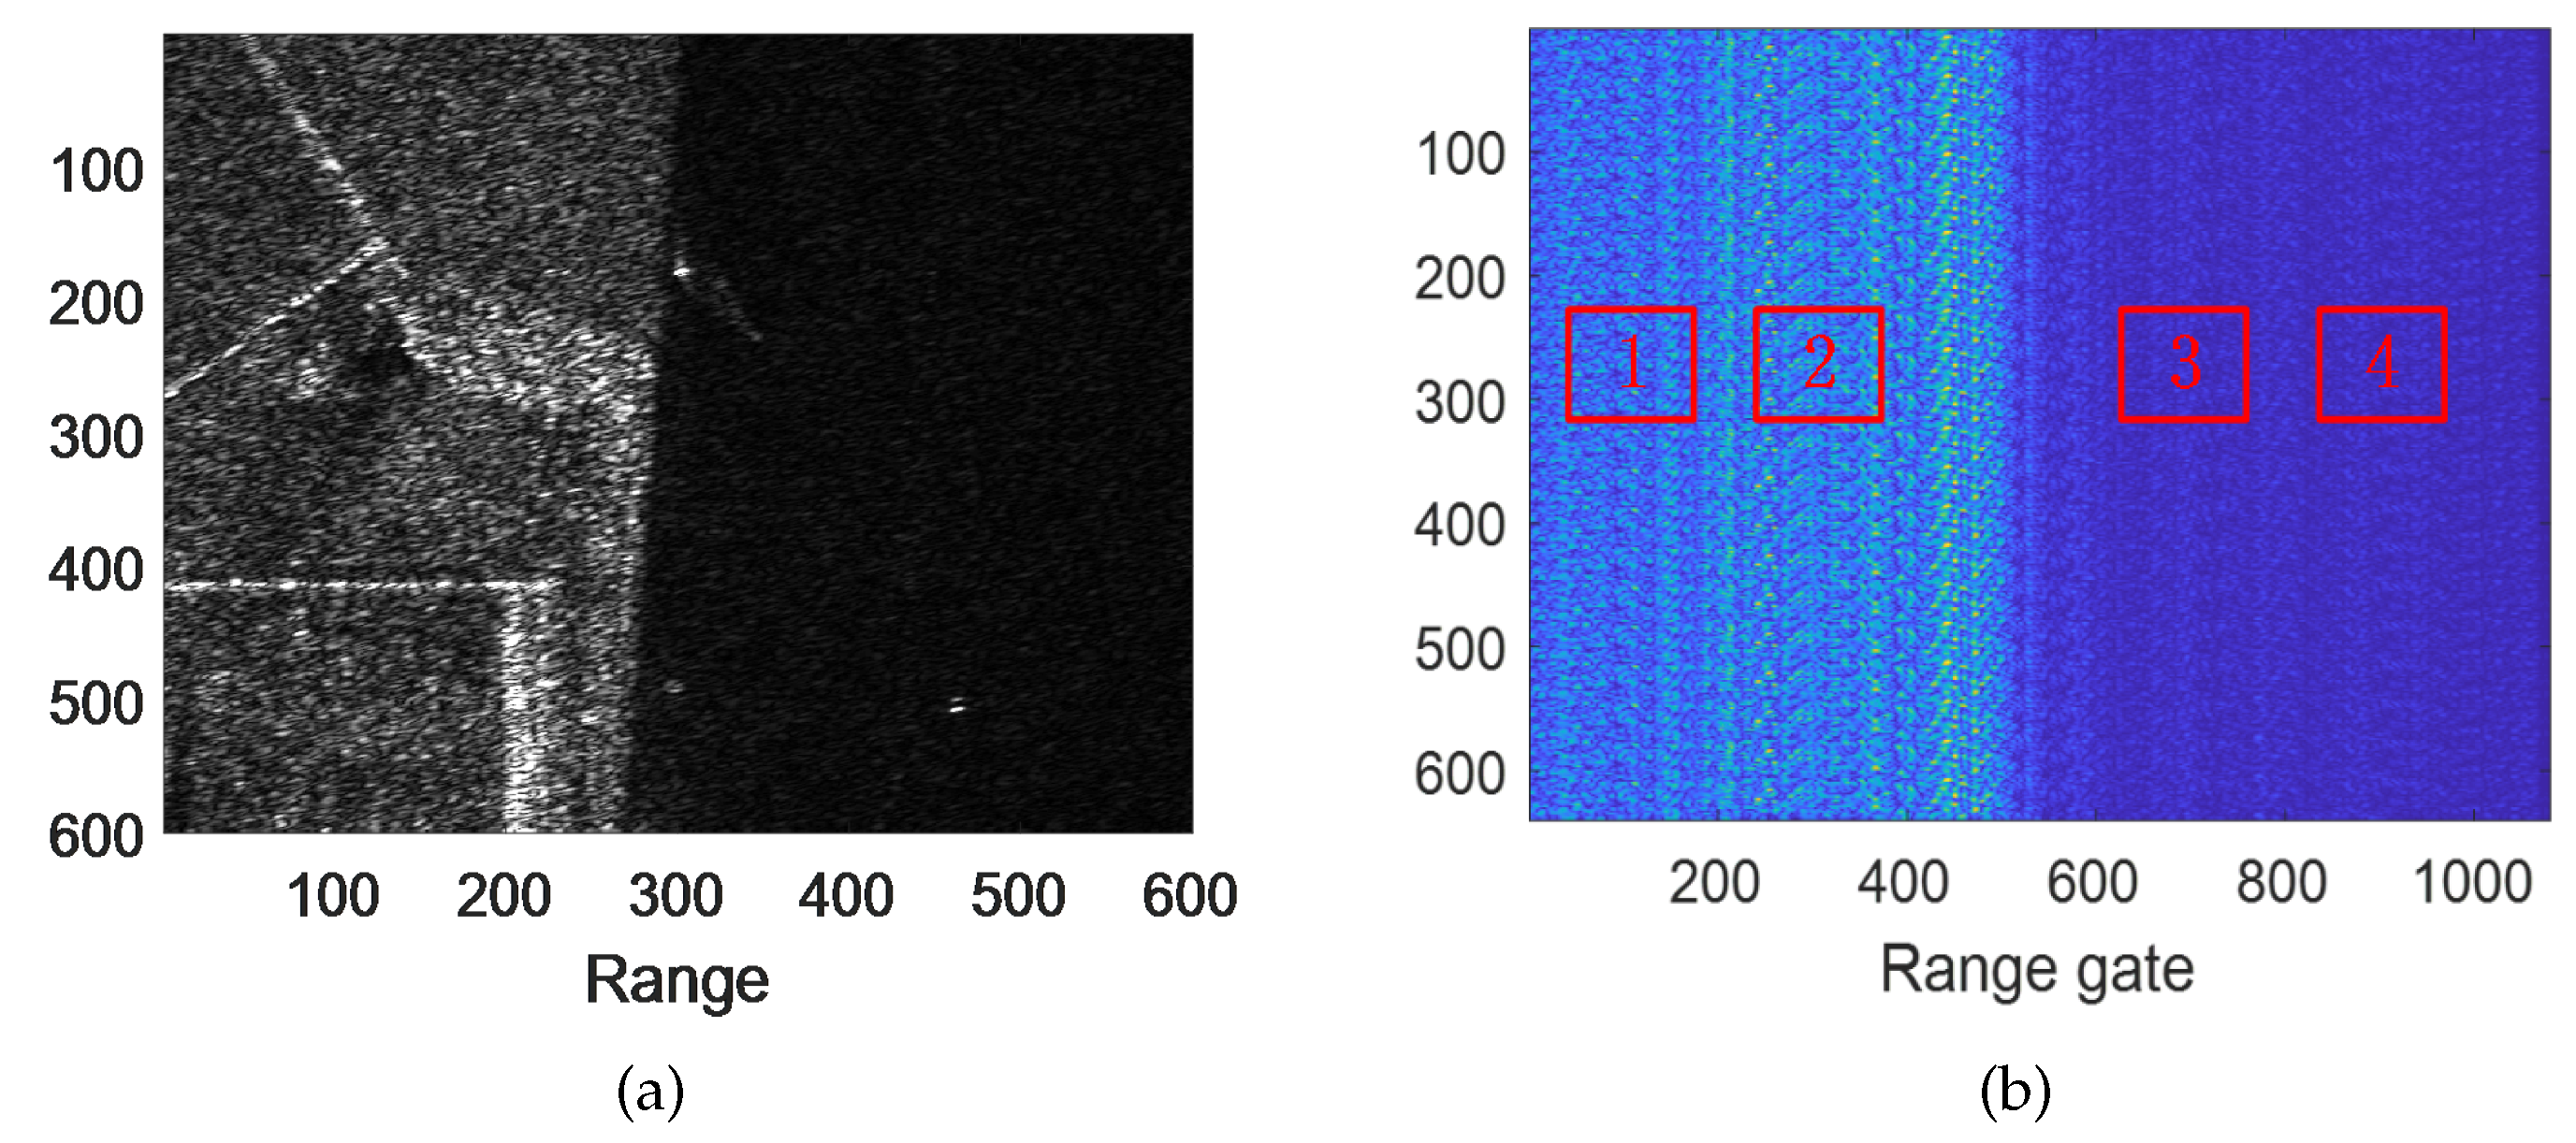
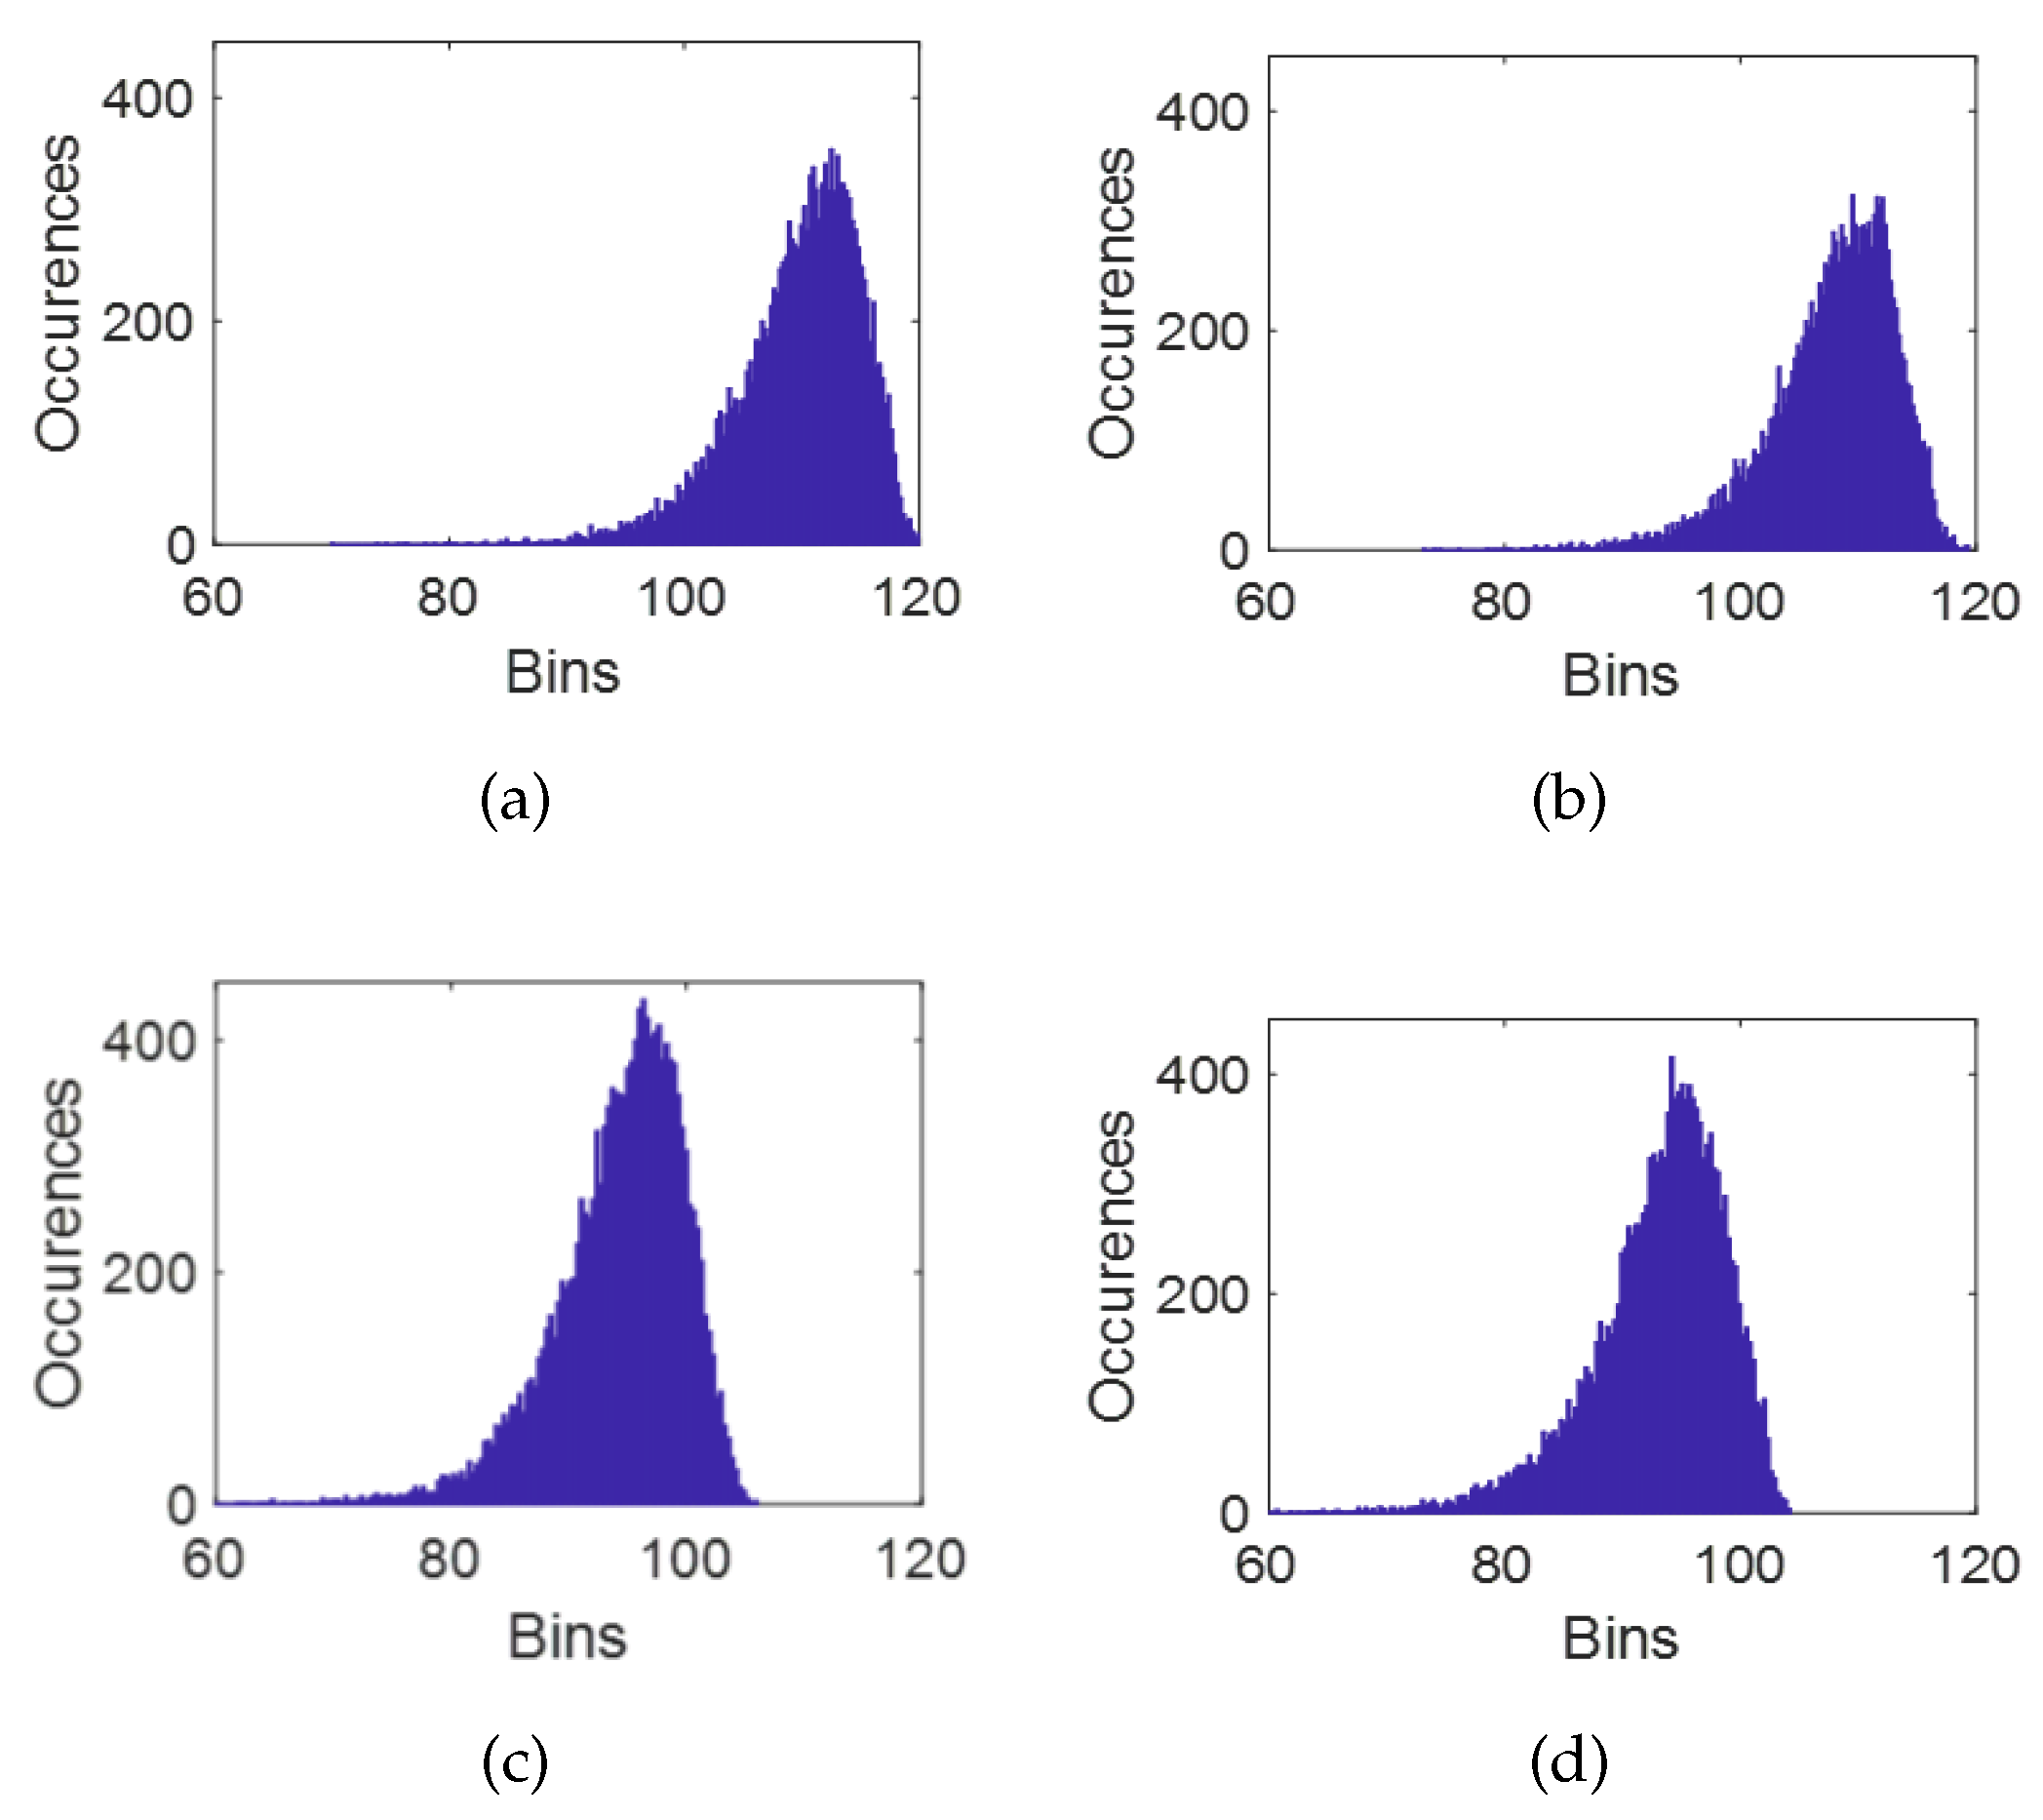
2.2.3. Power Nonuniformity

Figure 3a shows the background of the land–water junction, with the land on the left and the water on the right. The simulated echo is shown in Figure 3b. We investigated the statistical characteristics of the power nonuniformity. Two areas were selected in the water area and the land area, respectively, the histogram of the obtained statistical characteristics is shown in Figure 4, and the specific statistical analysis is shown in Table 1. It can be seen that there are great differences in the statistical characteristics of the nonuniform environment, especially in the mean value, due to the nonuniform power. When the target is at the land–water junction with nonuniform power, it is assumed that the target is in the water area, close to the land. When the sample estimation method is used to estimate CCM, the land training samples are selected, which will lead to an inaccurate detection threshold, thus affecting the detection performance.

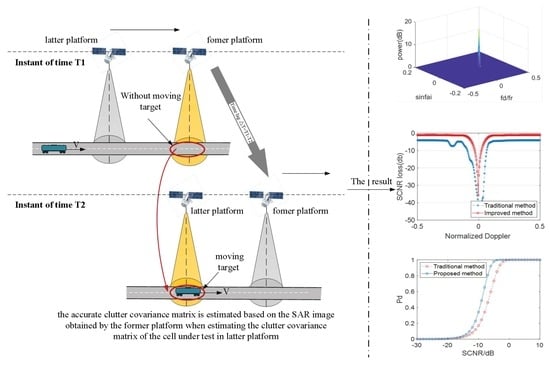
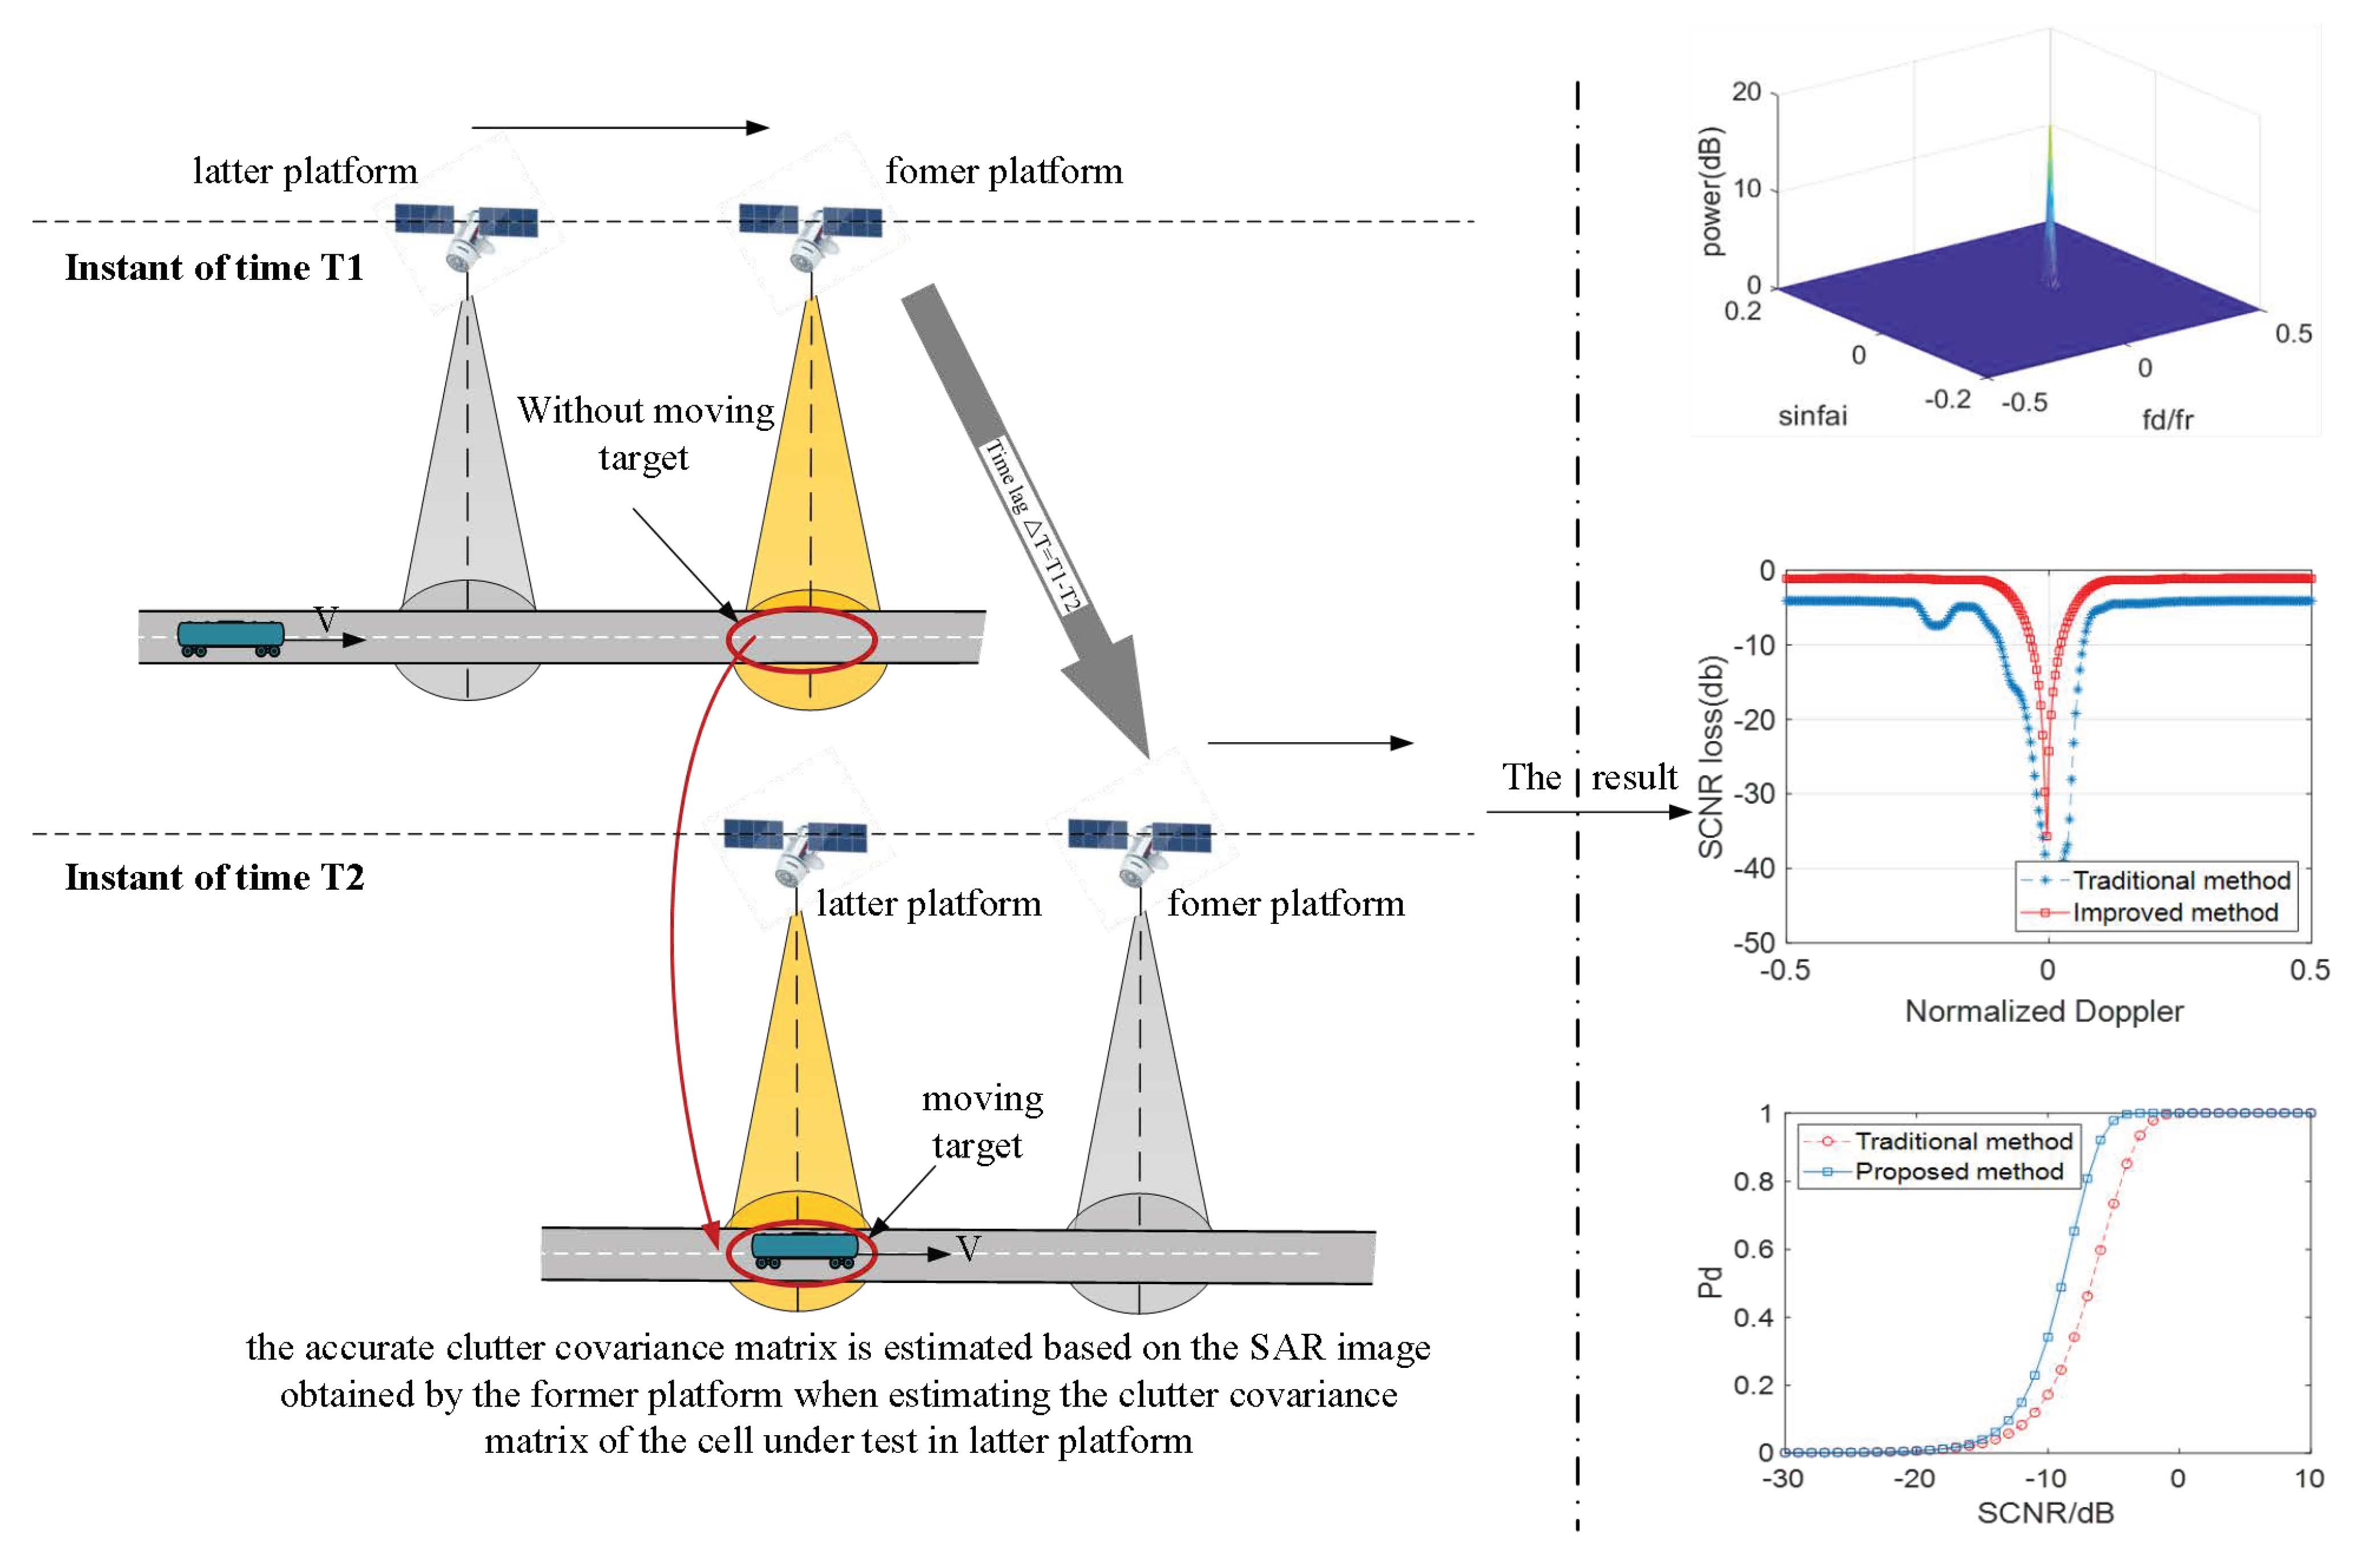
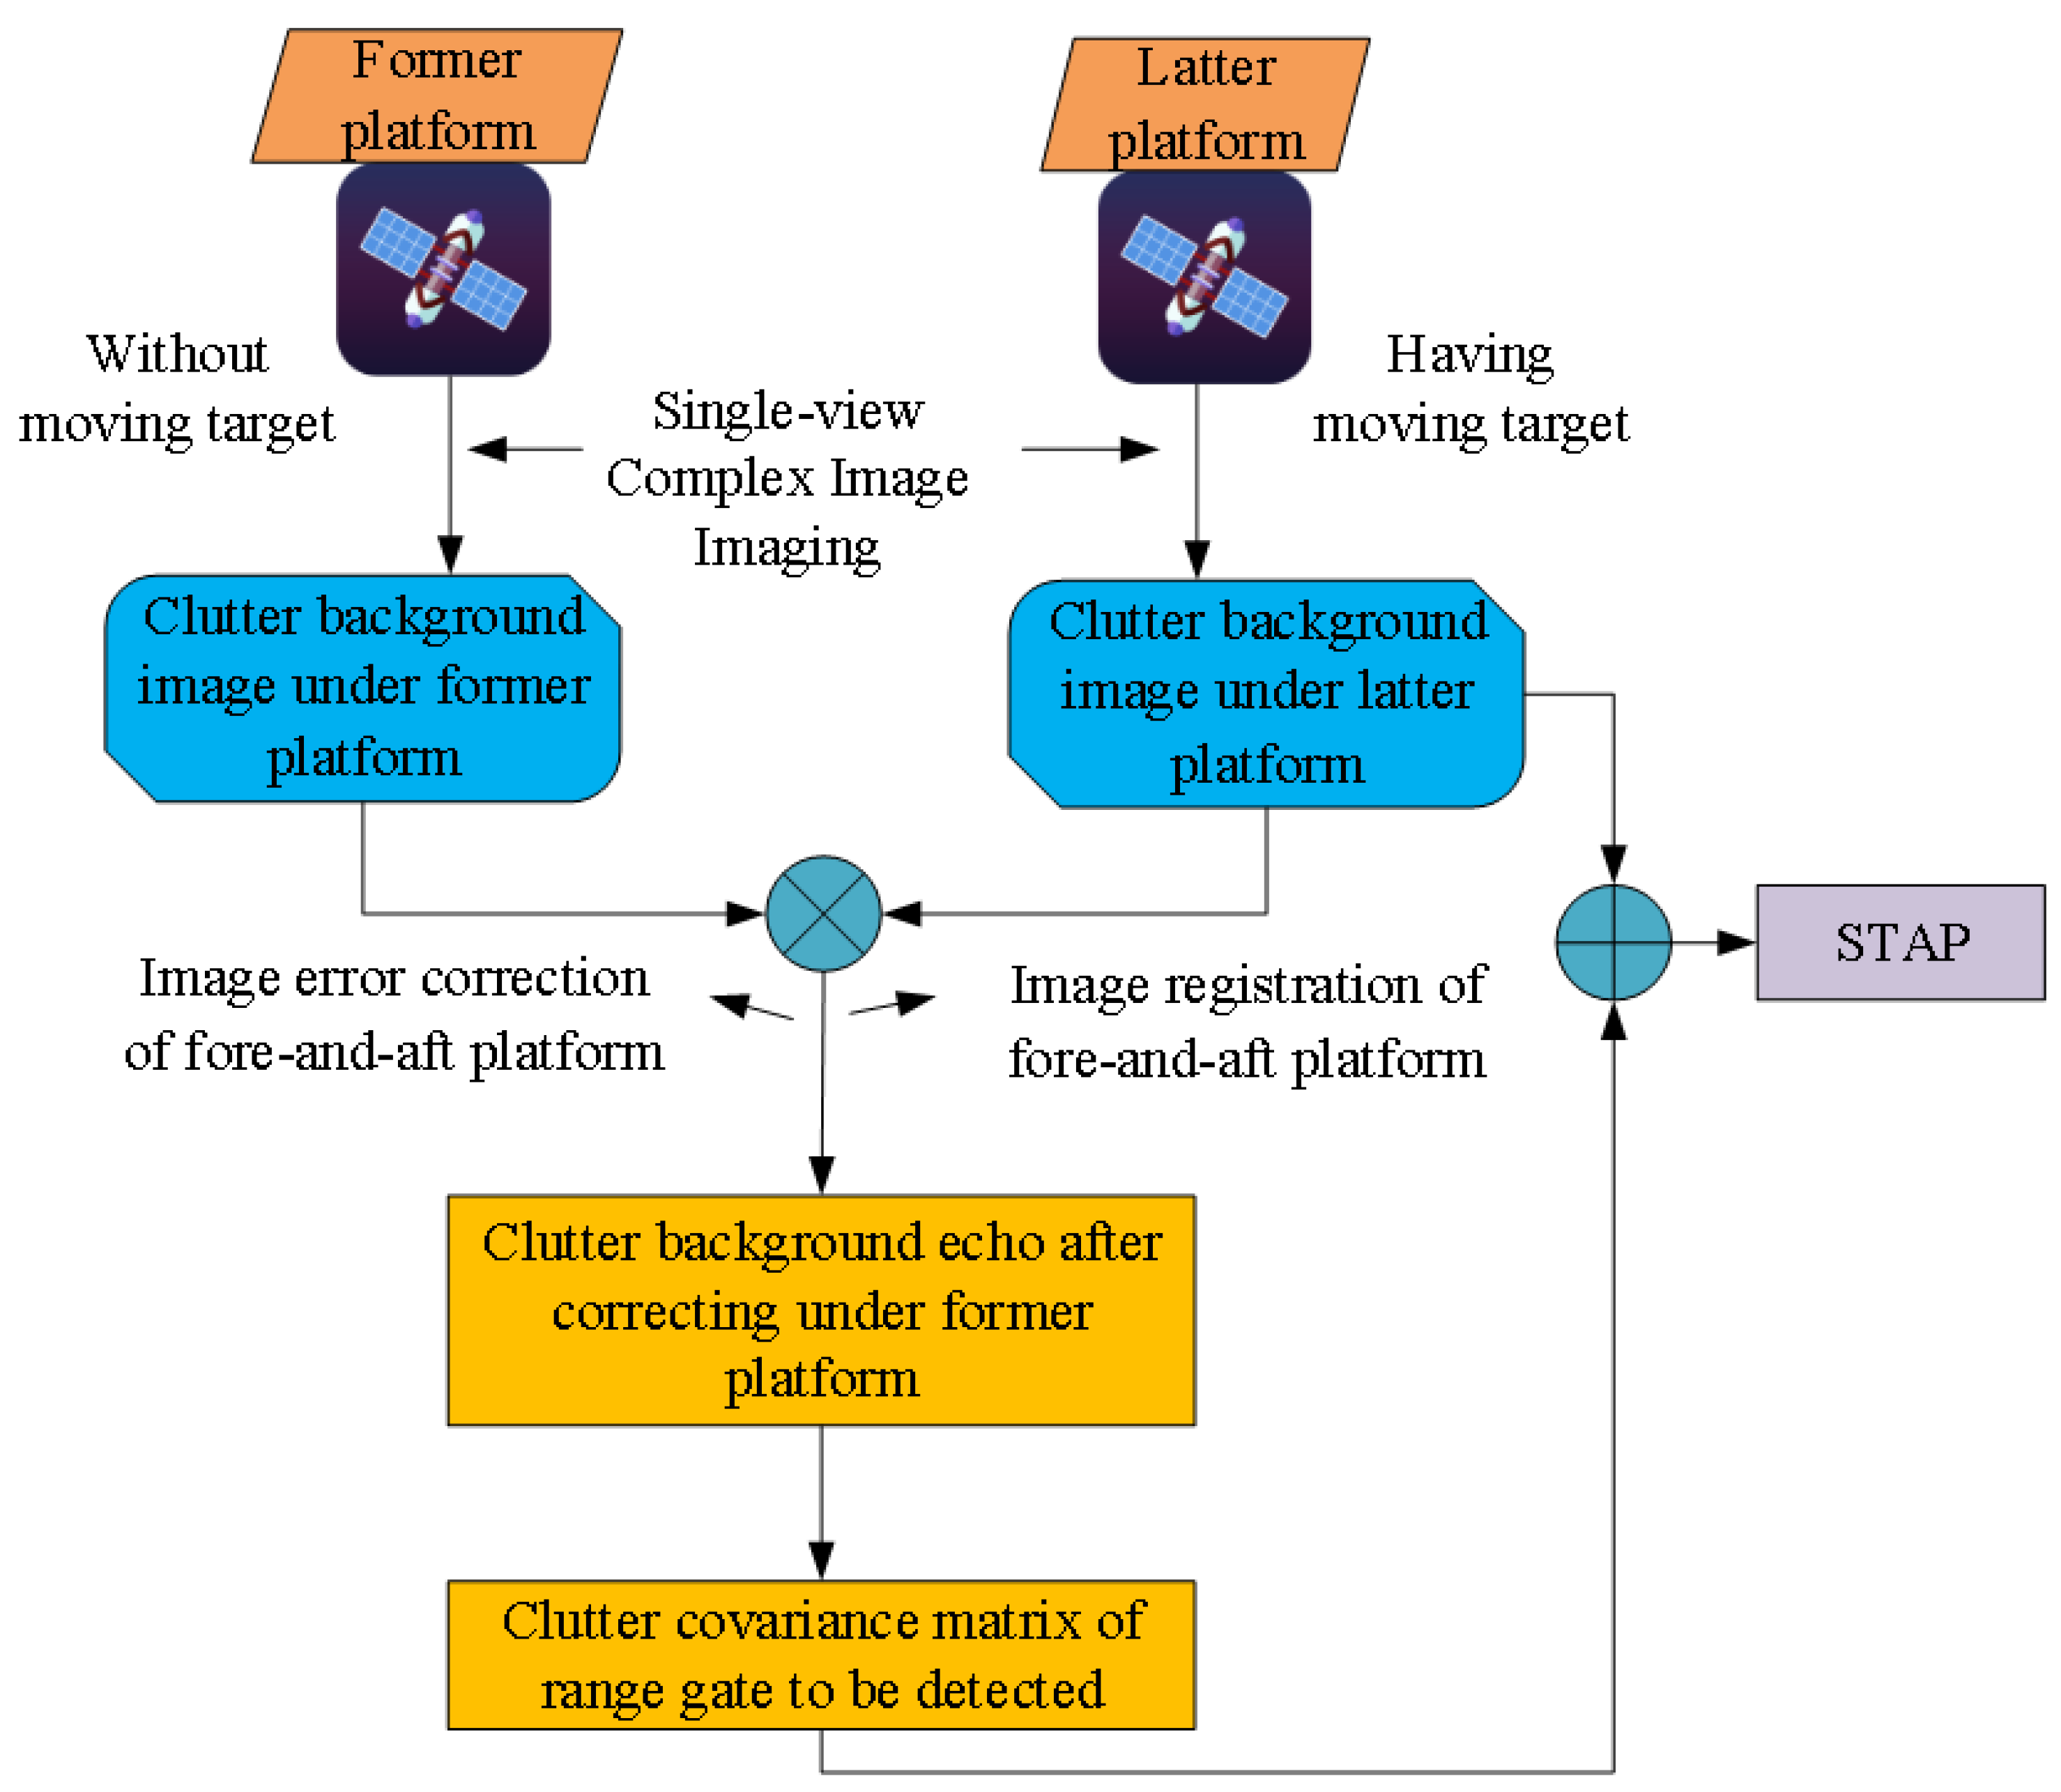
2.3. High-Precision Clutter Covariance Matrix Estimation Based on Dual-Platform SAR System

Traditional CCM estimation is effective for the uniform clutter area, which requires the clutter outside the clutter protection zone and the area to be detected to have IID characteristics. However, the moving targets of interest are mostly located in cities, ports, highways, airports, and other man-made areas. These areas are mostly heterogeneous clutter areas, and the clutter characteristics inside and outside the protected areas are quite different. In STAP, if the clutter characteristics of the area to be detected are replaced by the clutter characteristics of dozens of range units, the GMTI result will be degraded. In this paper, the clutter characteristics are calculated by the clutter obtained by the former platform, which has the same subastral point tracks as the latter platform. This guarantees scattering consistency between the echoes from the former platform and echoes from the latter platform. As the target does not reside in the area to be detected during the former platform observation, it is not necessary to set a protected area. Instead of using the clutter cell near the CUT, the CCM can be directly calculated by the echo of the CUT. The observation geometry is shown in Figure 5. A GMTI processing flowchart with a dual platform is shown in Figure 6. In the following subsections, the processing blocks in Figure 6 are depicted.

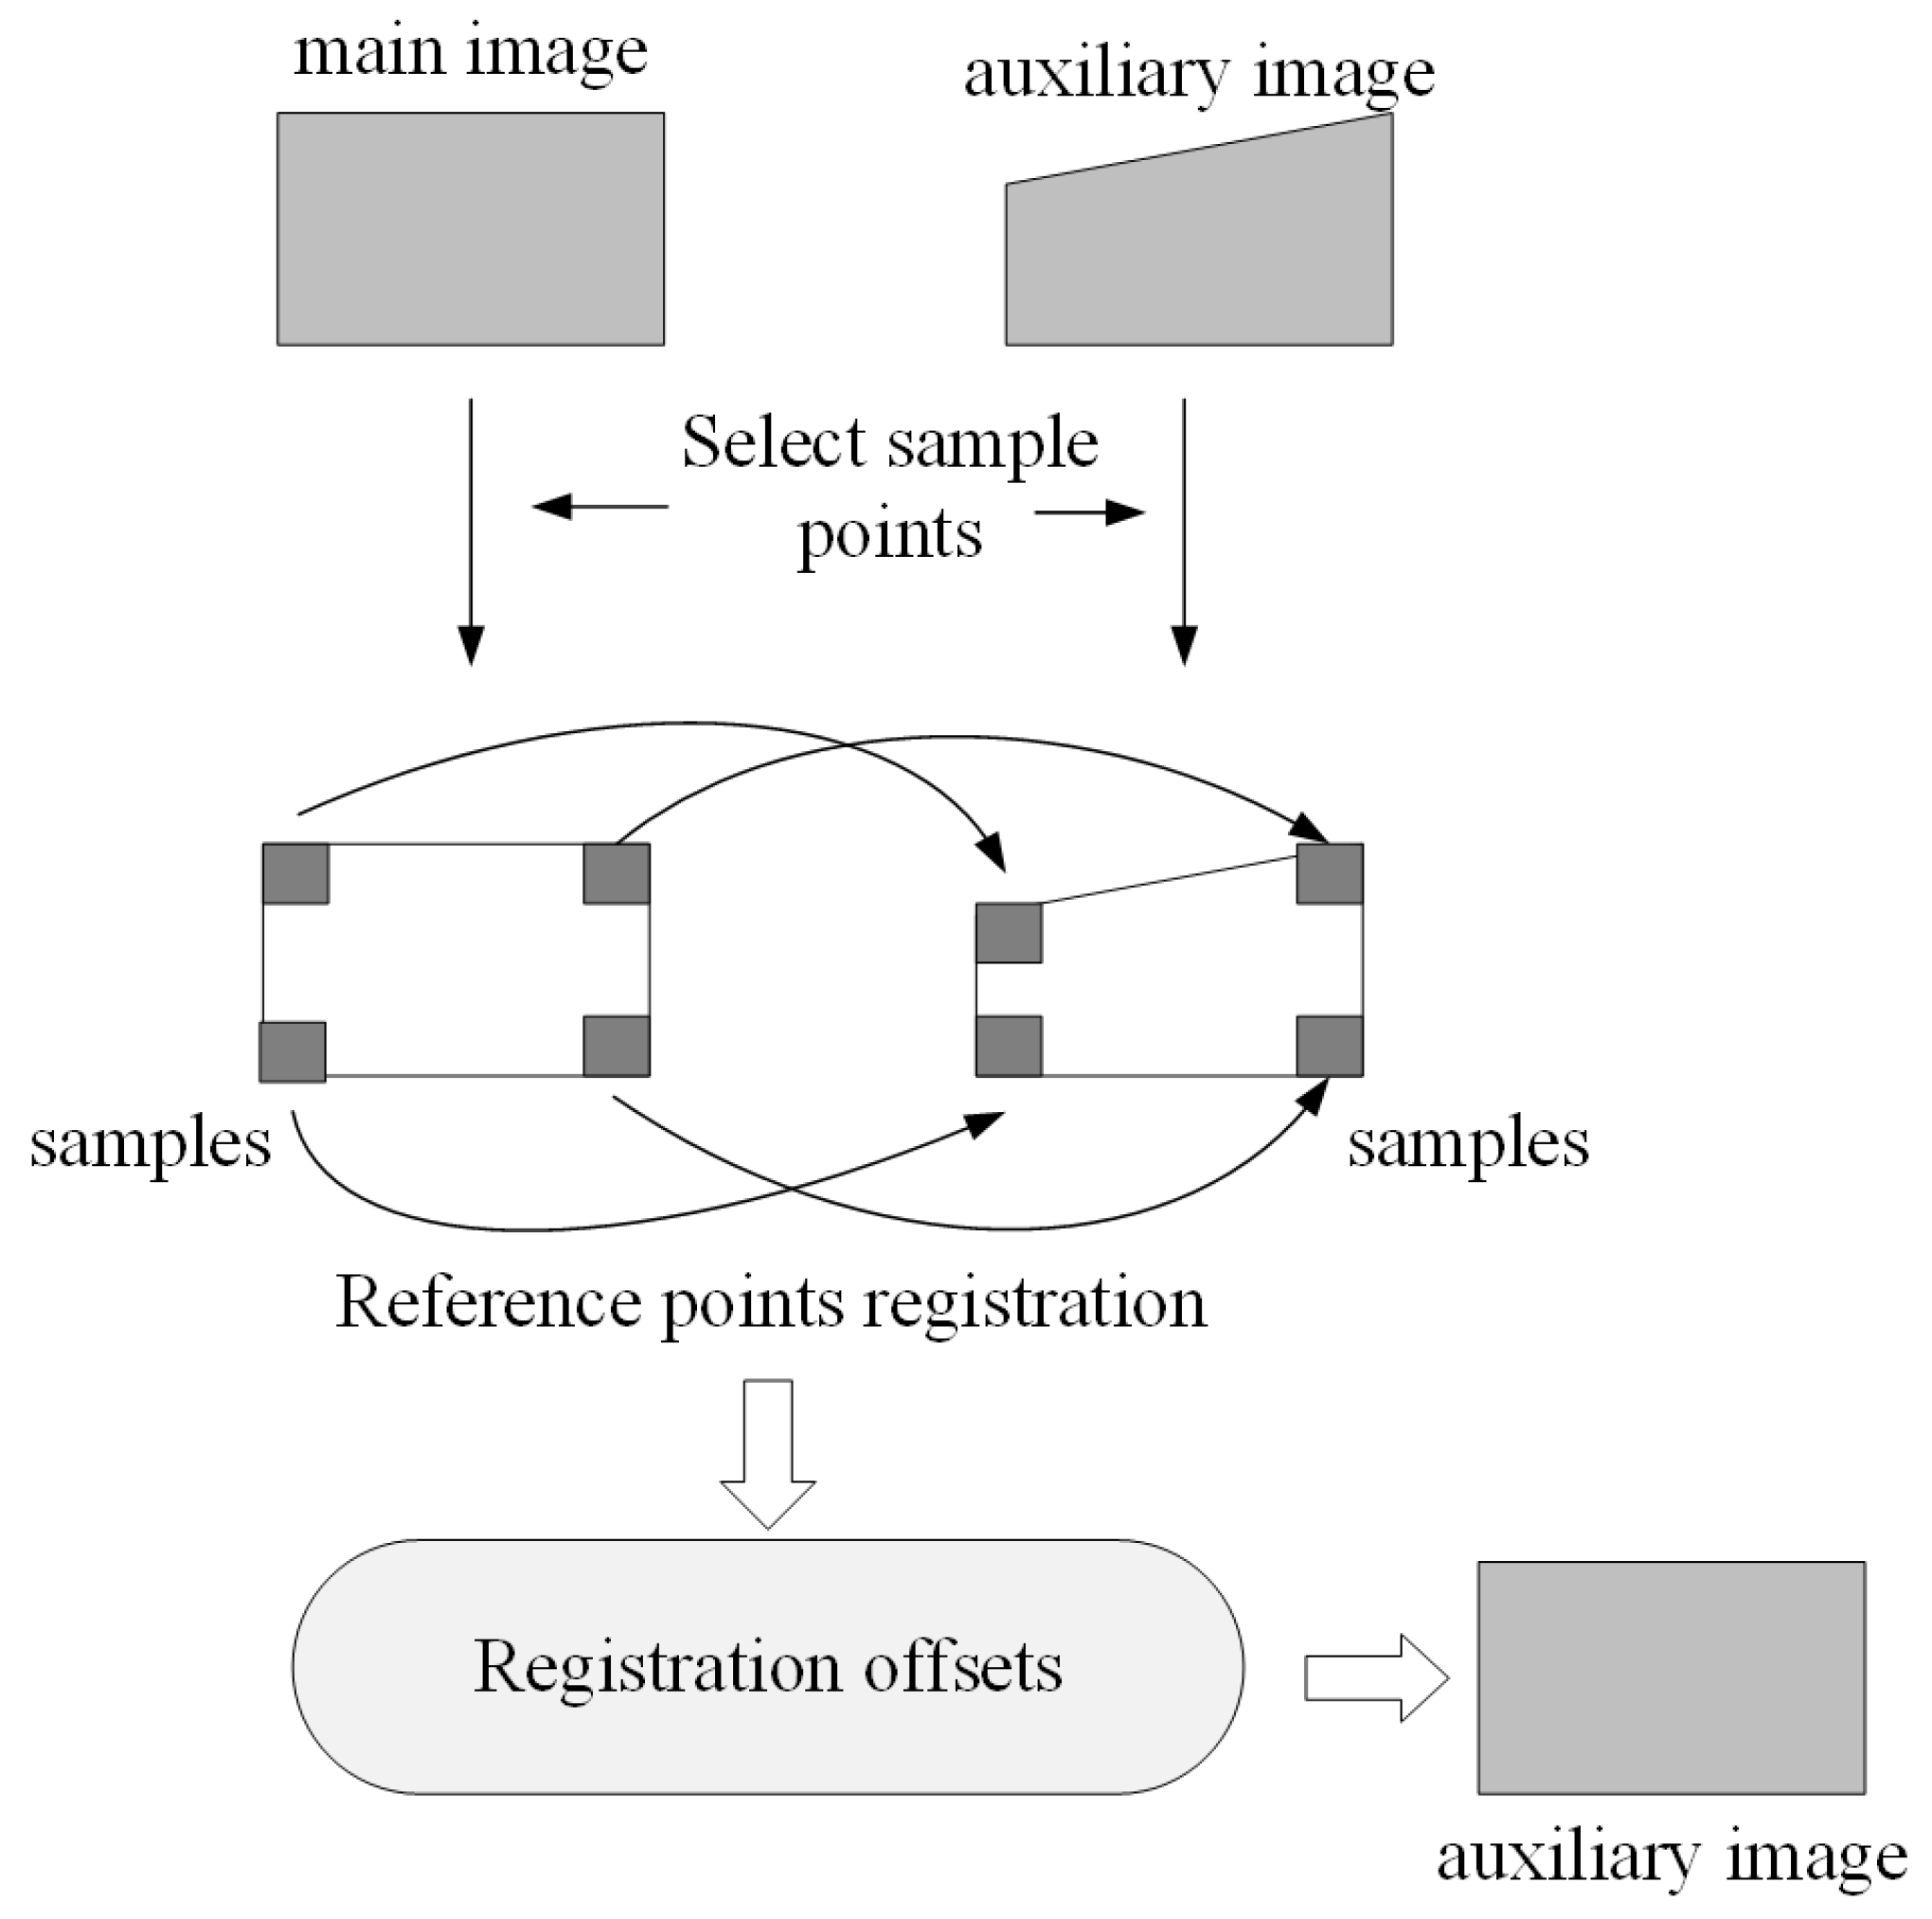
2.3.1. Image Registration of Former and Latter Platforms

In our proposed STAP method using the dual-platform system, we need to accurately obtain the former platform image corresponding to the area where the latter platform target is located. Due to the errors in observation geometry between the two SAR images, there is a certain offset and distortion between the images, so it is necessary to register the images in the former and latter platforms.
After obtaining the single-view complex images, the same name points in two or more images are often not on the same grid points, so it is necessary to register the images so that they are on the same range cell. The basic flowchart is shown in Figure 7.
To achieve image registration, a candidate image block in the auxiliary SAR image and a reference image block in the main SAR image are selected. Due to the computational burden, the registration can be based on some control point pairs in the main and auxiliary images. The registration principle is that the evaluation criterion will reach its maximum value when the candidate image block shifts with a certain offset. This offset can be regarded as the image position difference between the matching window and search window. The registration method adopted here is the correlation method, which uses the coherence coefficient as the evaluation criterion. By calculating the coherence coefficient under different offsets, the offset can be found, which corresponds to the maximum coherence coefficient position. The calculation of the coherence coefficient is expressed as [35]:
γ ^ = m = 0 M 1 n = 0 N 1 S 1 ( m , n ) S 2 * ( m , n ) exp [ j φ ( m , n ) ] m = 0 M 1 n = 0 N 1 S 1 ( m , n ) 2 m = 0 M 1 n = 0 N 1 S 2 ( m , n ) 2 ,
where m = 0 , 1 , , M 1 and n = 0 , 1 , , N 1 are the size of the main image, S is the image amplitude, and ϕ ( m , n ) is the image phase. To avoid calculating the phase, the following frequency-independent coherence coefficient estimator can be used to calculate the coherence coefficient [36]:
ρ ^ = m = 0 M 1 n = 0 N 1 S 1 ( m , n ) 2 S 2 ( m , n ) 2 m = 0 M 1 n = 0 N 1 S 1 ( m , n ) 4 m = 0 M 1 n = 0 N 1 S 2 ( m , n ) 4 ,
γ ^ = 2 ρ ^ 1 ρ ^ > 1 / 2 0 ρ ^ < 1 / 2 .
The correlation registration is divided into two steps: pixel registration and subpixel registration. Pixel registration moves the main image by a whole pixel to obtain the pixel-level position offset and moves the main image by a subpixel size near the pixel-level registration position to obtain the subpixel-level position offset. When the subpixel registration is aligned, the data corresponding to the auxiliary image do not fall on the grid points; therefore, interpolation is needed. In order to complete the whole image registration, it is necessary to obtain the registration offset of other pixels by using the registration offset that corresponds to the control points, which can be obtained using the second-order polynomial:
u = a 0 + a 1 m + a 2 n + a 3 m 2 + a 4 n 2 + a 5 m n v = b 0 + b 1 m + b 2 n + b 3 m 2 + b 4 n 2 + b 5 m n .
a 0 a 5 and b 0 b 5 are the fitting parameters, which need to be calculated by the least square method according to the control point offset. ( m , n ) is the pixel coordinate in the main image, and ( u , v ) is the offset corresponding to the registration position offset between the main and auxiliary images.

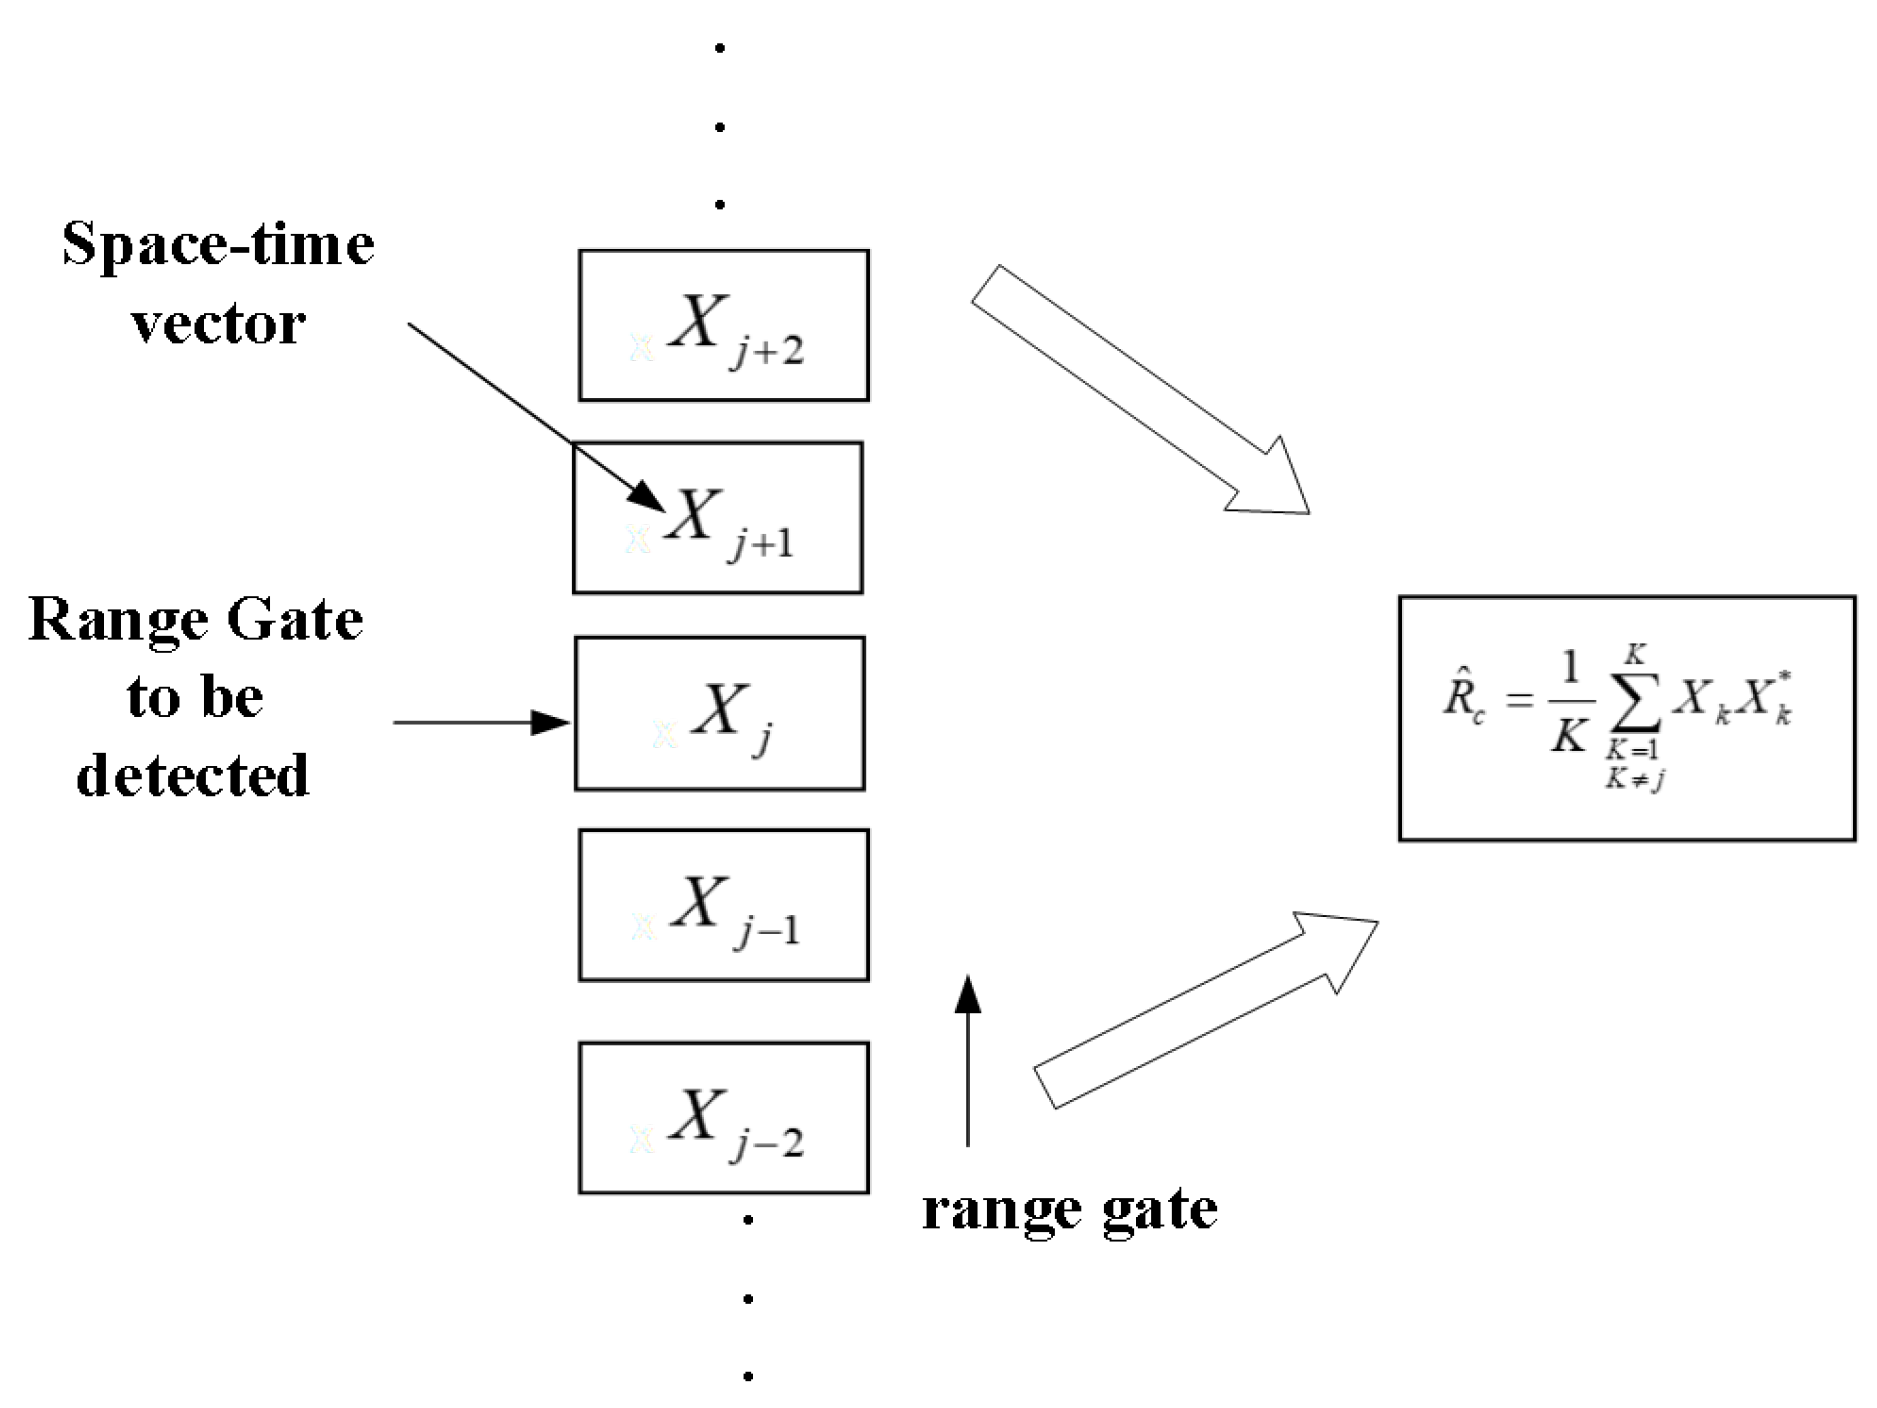
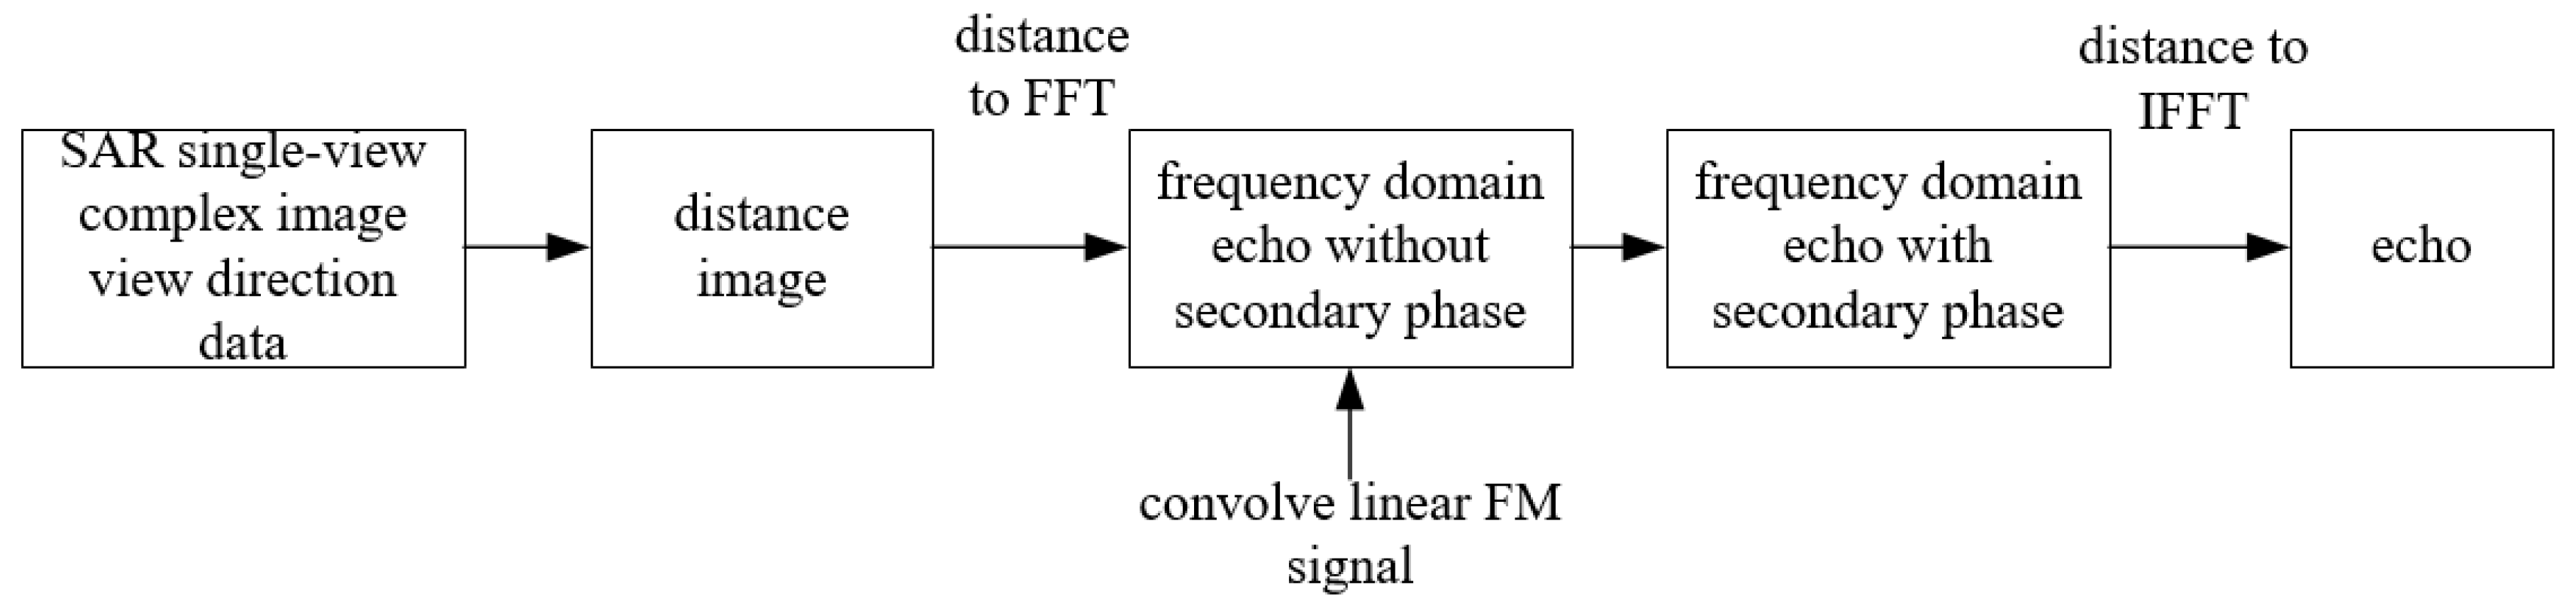
2.3.2. Calculation of Clutter Covariance Matrix Based on Echo

Following image registration, the next step is to calculate the CCM. The calculation principle of the CCM of the range gate to be measured is shown in Figure 8.
Generally, the CCM is calculated based on the space–time steering vectors of clutter blocks:
R c = E { x c x c } = E { ( i = 1 N c γ ˜ i v i ) ( i = 1 N c γ ˜ i v i ) } = i = 1 N c i = 1 N c E { γ ˜ i γ ˜ j * } v i v j = i = 1 N c G i v i v i .
γ ˜ i is the complex random vector of the ith clutter block considering the amplitude and phase, N c is the total number of clutter blocks in the equidistant loop, and G i is a positive constant, which is proportional to the gains in the transmitting antenna in the θ i direction.
In this paper, the calculation of the CCM is based on the echo from the CUT, based on the registered auxiliary image. Firstly, background clutter generation should be accomplished at the signal level. Due to the nearly lossless transformation between SAR image and echo, a signal-level simulation can be realized through the inverse process of imaging. To reduce the measurements in data processing, the inverse filtering process can be realized using the inverse process of the CS algorithm, or by the fast convolution algorithm in the frequency domain. SAR image is a single-view complex image. The general method is to treat it as a stationary scene with point-by-point simulation, a very time-consuming process. To improve the echo generation speed, we used the fast echo simulation method based on the range profile inverse transforming in this article. This method can accelerate the echo simulation speed compared with the conventional point-by-point simulation method, which has considerable advantages for large scenes. The flow of echo simulation based on the range profile of inverse transforming is shown in Figure 9.
In Figure 3a,b, the single-view complex image and its simulated echo are shown, respectively. In this paper, when calculating the covariance matrix, the echo data of the clutter area used to estimate CCM are directly used to form a matrix, and the covariance of the complex matrix is calculated, which is then used for subsequent STAP processing and to set the detection threshold.

2.3.3. Setting the Detection Threshold

Setting the detection threshold is a traditional problem in target detection, whose key problem is the distribution characteristics of the clutter. If the scene is nonuniform, the detection threshold will be seriously affected because of the inaccurate estimation of the covariance matrix. For example, the covariance outside the protected area is much lower than the clutter covariance of the area in which the target is located (this often happens in roads between cities), and the threshold will consequently be set much lower, which leads to a high false-alarm rate in target detection. In our proposed method, the clutter characteristics of the clutter area corresponding to the target’s position in the SAR image are calculated, and then the threshold is set more reasonably, which can effectively achieve an accurate balance between false-negative, false-positive, and detection probabilities.
The following are the two assumptions when the radar uses the STAP method to detect moving targets after STAP weighting processing:
H 0 : Y = w H n H 1 : Y = w H s + w H n = α w H v + w H n .
During detection, when the power exceeds the detection threshold, the target exists; otherwise, it is considered there is no moving target. The target power is p t = w H v t 2 , the noise and clutter power is p u = w H R u w , and the optimal output is S C N R = σ 2 ξ t v t H R u 1 v t . If the detector input is the STAP weighted output normalized by the output noise power [37,38], the detection formula is
r m n = w H v t 2 v t H R u 1 v t = v t H R n 1 v t 2 v t H R u 1 v t > < H 0 H 1 T m n .
The detection threshold is several times the average power of the input clutter. When the steering vector and covariance matrix are known in advance, the false-alarm probability and detection probability can be obtained as follows [39,40]:
P F A = P r { r m n > T m n H 0 } = T m n p ( r m n H 0 ) d r m n = T m n e r m n d r m n = e T m n ,
P D = P r { r m n > T m n H 1 } = T m n p ( r m n H 1 ) d r m n = T m n e r m n ρ m n I 0 ( 2 r m n ρ m n ) d r m n ,
where ρ m n is the generalized output signal-to-clutter-plus-noise ratio of the detector, and ρ m n = v H R u 1 v . I 0 ( * ) is the first kind of zero-order modified Bessel function.

3. Results and Analysis

To verify the effectiveness of the proposed algorithm in this paper, we conducted some experiments in this section to compare the performance between the traditional STAP method and the proposed STAP method based on a dual-platform radar system. Three heterogeneous environments with strong pollution, hot clutter, and nonuniform power were used in the experiment.
The down sight angle was 55°. For convenience, we assumed that the radar just operated in the zero-squint side-look imaging mode. The background was a scene with a size of about 800 × 800 m2. The number of array elements was 20, and the interval was 0.12 m. The number of pulses in a CPI was 32. The pulse repetition frequency was 654. The experimental parameters are shown in Table 2.
The clutter background without a moving target simulated the forward track image, and the mixed echo was obtained by adding a moving target with a velocity of v y = 10 m/s to the pure clutter background, which simulated the latter platform image.
In this paper, the superiority of the proposed method was analyzed for three cases: clutter with strong pollution, junction between hot and cold clutter, and clutter with nonuniform power. Of course, the proposed method is applicable in most heterogeneous environments, not only in these three cases.

3.1. Application in Strong Pollution Environment

In the simulation of background clutter, a strong target existed in the range cell near the CUT. The echo obtained by simulation is shown in Figure 10a. We can see the echoes of the moving target that was to be detected and the jamming target after range compression, the moving target to be detected at a 336 range gate, and the strong jamming target added at a 567 range gate. The Capon spectrum is shown in Figure 10b. In the Capon spectrum of the space–time two-dimensional plane, we can see that the background clutter forms the clutter ridge, while the moving target and pollution target are far from the clutter ridge.
After leaving 20 range gates on the left and right of the moving target at 336 as protection range gates, 300 cell echoes were taken to estimate CCM, and the results are shown in Figure 11. Figure 11a shows that there was strong pollution in the training sample used to estimate the CCM. If we use the traditional method to estimate the CCM, i.e., using the training sample containing strong pollution, no null is formed at the clutter ridge and the clutter is not well suppressed. Figure 11b shows the result after passing the detector, which could not detect the moving target with certainty. Using the echo obtained in Figure 3b, the 320–350 range gates were used to estimate CCM. The results obtained by STAP are shown in Figure 12. Comparing the results of the two processing methods, it can be seen that the filter formed by the traditional STAP method does not form a notch at the ridge of the clutter, the clutter is not suppressed, and the moving target cannot be detected. However, the method proposed in this paper shows a clear notch at the clutter ridge and a clear directional pattern for the moving target. Therefore, the moving target can be detected clearly and accurately after the detector output, which shows that the method proposed in this paper can have an obvious clutter suppression effect in an heterogeneous environment where the training samples contain strong pollution, and the moving-target detection effect is quite good.

3.2. Application in Junction Zone of Hot and Cold Clutter

As the influence of the internal clutter movement is much smaller than that of targets with strong pollution in the training sample, several STAP performance indicators, such as output SCNR loss (relative to the output SCNR of the optimal processor), SCNR improvement factor, and minimum detectable velocity (MDV), were used for comparison.
Figure 13a shows the output SCNR loss curves of the traditional method and the proposed method. It can be seen that the SCNR loss of the proposed method is between zero and one, and the SCNR loss of the proposed method is 3.4 dB less than that of the traditional method, meaning that this method can obtain a better detection performance. Another way to measure the performance of the STAP algorithm is the SCNR gain relative to a single array element and a single pulse. The SCNR improvement factor is usually large and increases as the pollution grows stronger. Figure 13b shows the SCNR improvement factors obtained by the two methods. It can be seen from the figure that the improvement factor of the traditional method is more than 10 dB higher than that of the proposed method.
The MDV is defined as the velocity closest to the main lobe clutter velocity at which an acceptable SCNR loss can be achieved. The acceptable SCNR performance is defined as the SCNR loss, at that time, where the acceptable performance is at least 50% of the maximum detection range. Here, we used the reference threshold to calculate the minimum detectable speed. The SCNR loss diagrams obtained by the traditional method and the proposed method are shown in Figure 13c,d. Let f L ( x ) and f U ( x ) be the Doppler frequencies below and above the main-lobe clutter Doppler at which an acceptable SCNR loss is achieved. We defined the minimum detectable Doppler f min as follows:
f min ( x ) = 1 2 f U ( x ) f L ( x ) ,
which is equal to one-half of the width of the main-lobe clutter notch. The minimum detectable velocity was then defined as
MDV ( x ) = λ 2 f min .
The minimum detectable velocity that was calculated was 2.3759 and 2.0693, respectively. It can be seen that the proposed method reduces the minimum detectable velocity by 0.3 m/s.

3.3. Application in Nonuniform Power Environment

In this section, the ANMF detector structure was adopted to investigate the influence of different CCM estimation methods on the detection performance. The detection flowchart is shown in Figure 14.
The simulated echoes of the background without moving target are shown in Figure 15a. A moving target is located in the water area at the junction between land and water. The simulation result is shown in Figure 15b, and the moving target is compressed at the 567 range gate. In the traditional method, we selected 400–550 range gates in Figure 15b as the training sample to estimate the CCM and determined the detection threshold. In our proposed method, the 500–600 range gates of the simulated echo in Figure 15a were selected to calculate the CCM, and the corresponding detection threshold was obtained. The results are shown in Figure 16. The output results of the detector are shown in Figure 17. Although moving targets can be detected in a single target, the comparison in Figure 16 shows that the detection threshold obtained by the traditional method is lower than that of our proposed method, so false alarms may occur when detecting multiple targets.
Then, we examined the situation of two targets, with velocities of 10 m/s and 20 m/s, respectively. If the CCM estimation is inaccurate, and the detection threshold setting is also inaccurate, the side lobes of other moving targets may be regarded as false targets. As shown in Figure 18, the detection results obtained by the two methods show that there were false alarms because the detection threshold was too low. We further investigated the detection of multiple targets as follows. Seven targets were set, and the total Capon spectrum of the clutter and targets is shown in Figure 19. In the space–time two-dimensional domain, the position of the clutter ridge on the diagonal can be seen, while the other seven targets are scattered in the domain. Two methods were used to estimate the CCM, so as to set the threshold. The detection results are shown in Figure 20. From the two pictures, we can see that our proposed method detected six moving targets, which is relatively more accurate than the traditional method. This also shows the effectiveness of the method proposed in this paper.
Finally, we analyzed the detection probability of the two methods under different SCNR conditions. Using the false alarm probability of P F A = 10 2 , the detection probability curves of the two methods can be obtained, as shown in Figure 21. It can be seen that the detection probability of the proposed method is higher, which also proves the effectiveness of the proposed method.

4. Discussions

In this paper, we presented a high-accuracy CCM estimation method using a dual-platform radar system, which estimated the CCM directly using the CUT clutter. Therefore, this method can improve the GMTI performance. However, if the moving target itself is in a hot-clutter environment, the clutter characteristics in the region will change at different times, and our proposed method may not achieve good results under this condition. Therefore, our proposed method is mainly applied to the cold clutter region or the conditions with a small ICM where the clutter characteristics change only slightly. In the future, we will use the experimental data acquired with the German TerraSAR-X/TanDEM-X radar satellite formation to further verify the proposed method.

5. Conclusions

The traditional CCM estimation is based on the training samples near the CUT. In heterogeneous environments, such as clutter with strong pollution, junction zone between hot and cold clutter, and clutter with nonuniform power, the training samples are nonuniform, which degrades the detection performance of moving targets. In this paper, a high-precision CCM estimation method based on a dual-platform radar system was proposed, which can directly calculate the CCM of the CUT using the former platform SAR images without moving targets in the same area, instead of using training samples for the estimation. The experimental results based on simulation data proved the effectiveness of this method.

Author Contributions

Conceptualization, M.Z. and G.J.; methodology, M.Z.; software, M.Z., Z.H. and L.L.; validation, M.Z., G.J. and L.L.; formal analysis, M.Z.; investigation, M.Z.; resources, M.Z., G.J. and Z.H.; writing—original draft preparation, M.Z.; writing—review and editing, M.Z., G.J., L.L. and Z.H.; visualization, M.Z.; supervision, L.L.; project administration, G.J.; funding acquisition, G.J. All authors have read and agreed to the published version of the manuscript.

Funding

This research was funded by the National Natural Science Foundation of China under grant no. 62101568.

Conflicts of Interest

The authors declare no conflict of interest.

References

  1. Zhang, Z.; Yu, W.; Zheng, M.; Zhao, L.; Zhou, Z.X. Phase Mismatch Calibration for Dual-Channel Sliding Spotlight SAR-GMTI. Remote Sens. 2022, 14, 617. [Google Scholar] [CrossRef]
  2. Han, J.; Cao, Y.; Wu, W.; Wang, Y.; Yeo, T.-S.; Liu, S.; Wang, F. Robust GMTI Scheme for Highly Squinted Hypersonic Vehicle-Borne Multichannel SAR in Dive Mode. Remote Sens. 2021, 13, 4431. [Google Scholar] [CrossRef]
  3. Kim, S.-W.; Won, J.-S. Acceleration Compensation for Estimation of Along-Track Velocity of Ground Moving Target from Single-Channel SAR SLC Data. Remote Sens. 2020, 12, 1609. [Google Scholar] [CrossRef]
  4. Shen, W.; Lin, Y.; Yu, L.; Xue, F.; Hong, W. Single Channel Circular SAR Moving Target Detection Based on Logarithm Background Subtraction Algorithm. Remote Sens. 2018, 10, 742. [Google Scholar] [CrossRef] [Green Version]
  5. Gracheva, V.; Ender, J. Multichannel analysis and suppression of sea clutter for airborne microwave radar systems. IEEE Trans. Geosci. Remote Sens. 2016, 54, 2385–2399. [Google Scholar] [CrossRef]
  6. Guo, Y.; Liao, G.; Li, J.; Gu, T. A clutter suppression method based on NSS-RPCA in heterogeneous environments for SAR-GMTI. IEEE Trans. Geosci. Remote Sens. 2020, 58, 5880–5891. [Google Scholar] [CrossRef]
  7. Wang, Y.; Chen, J.; Liu, W.; Li, C.; Yang, W. A Moving Target Velocity Estimation Method Based on the MC-MASA SAR Mode. Remote Sens. 2021, 13, 1632. [Google Scholar] [CrossRef]
  8. Yi, N.; He, Y.; Liu, B. Improved Method to Suppress Azimuth Ambiguity for Current Velocity Measurement in Coastal Waters Based on ATI-SAR Systems. Remote Sens. 2020, 12, 3288. [Google Scholar] [CrossRef]
  9. Yan, H.; Hou, Q.; Jin, G.; Xu, X.; Zhang, G.; Zhu, D. Velocity Estimation of Ocean Surface Currents in along-Track InSAR System Based on Conditional Generative Adversarial Networks. Remote Sens. 2021, 13, 4088. [Google Scholar] [CrossRef]
  10. Yang, J.; Yuan, X.; Han, B.; Zhao, L.; Sun, J.; Shang, M.; Wang, X.; Ding, C. Phase Imbalance Analysis of GF-3 Along-Track InSAR Data for Ocean Current Measurement. Remote Sens. 2021, 13, 269. [Google Scholar] [CrossRef]
  11. Cui, C.; Dong, X.; Chen, Z.; Hu, C.; Tian, W. A Long-Time Coherent Integration STAP for GEO Spaceborne-Airborne Bistatic SAR. Remote Sens. 2022, 14, 593. [Google Scholar] [CrossRef]
  12. Li, H.; Liao, G.; Xu, J.; Zeng, C.; He, X.; Gao, P. Multi-Resolution STAP for Enhanced Ultra-Low-Altitude Target Detection. Remote Sens. 2021, 13, 4212. [Google Scholar] [CrossRef]
  13. Bidon, S.; Besson, O.; Tourneret, Y. A bayesian approach to adaptive detection in nonhomogeneous environments. IEEE Trans. Signal Process. 2008, 56, 205–217. [Google Scholar] [CrossRef] [Green Version]
  14. Tong, Y.; Tong, W.; Jian, W. Improving EFA-STAP performance using persymmetric covariance matrix estimation. IEEE Trans. Aerosp. Electron. Syst. 2015, 51, 925–936. [Google Scholar] [CrossRef]
  15. Rui, F.; de Lamare, R.C. Reduced-rank STAP algorithms using joint iterative optimization of filers. IEEE Trans. Aerosp. Electron. Syst. 2011, 47, 1668–1684. [Google Scholar]
  16. Sarkar, T.K.; Wang, H.; Park, S.; Adve, R.; Koh, J.; Kim, K.; Zhang, Y.; Wicks, M.C.; Brown, R.D. A deterministic least-squares approach to space-time adaptive processing (STAP). IEEE Trans. Antennas Propagat. 2001, 49, 91–103. [Google Scholar] [CrossRef] [Green Version]
  17. Aboutanios, E.; Mulgrew, B. A STAP algorithm for radar target detection in heterogeneous environments. In Proceedings of the IEEE/SP 13th Workshop on Statistical Signal Processing, Bordeaux, France, 7–20 July 2005; pp. 966–971. [Google Scholar]
  18. Degurse, J.F.; Savy, L.; Marcos, S. Reduced-rank STAP for target detection in heterogeneous environments. IEEE Trans. Aerosp. Electron. Syst. 2014, 50, 1153–1162. [Google Scholar] [CrossRef]
  19. Degurse, J.F.; Savy, L.; Marcos, S.; Molinie, J.P. Deterministic aided STAP for target detection in heterogeneous situations. Int. J. Antennas Propagat. 2013, 2013, 826935. [Google Scholar] [CrossRef] [Green Version]
  20. Li, Z.; Ye, H.; Liu, Z.; Sun, Z.; An, H.; Wu, J.; Yang, J. Bistatic SAR Clutter-Ridge Matched STAP Method for Nonstationary Clutter Suppression. IEEE Trans. Geosci. Remote. Sens. 2021, 60, 1–14. [Google Scholar] [CrossRef]
  21. Hu, J.; Li, J.; Li, H.; Li, K.; Liang, J. A Novel Covariance Matrix Estimation via Cyclic Characteristic for STAP. IEEE Geosci. Remote. Sens. Lett. 2020, 11, 1871–1875. [Google Scholar] [CrossRef]
  22. Wang, P.; Wang, Z.; Li, H.; Himed, B. Knowledge-aided parametric adaptive matched filter with automatic combining for covariance estimation. IEEE Trans. Signal Process. 2014, 62, 4713–4722. [Google Scholar] [CrossRef]
  23. Hua, X.; Ono, Y.; Peng, L.; Cheng, Y.; Wang, H. Target detection within nonhomogeneous clutter via total bregman divergencebased matrix information geometry detectors. IEEE Trans. Signal Process. 2021, 69, 4326–4340. [Google Scholar] [CrossRef]
  24. Arnaudon, M.; Barbaresco, F.; Yang, L. Riemannian medians and means with applications to radar signal processing. IEEE J. Sel. Top. Signal Process. 2013, 7, 595–604. [Google Scholar] [CrossRef]
  25. Chen, X.; Cheng, Y.; Wu, H.; Wang, H. Heterogeneous Clutter Suppression for Airborne Radar STAP Based on Matrix Manifolds. Remote Sens. 2021, 13, 3195. [Google Scholar] [CrossRef]
  26. Kang, M.S.; Kim, K.T. Ground Moving Target Imaging Based on Compressive Sensing Framework With Single-Channel SAR. IEEE Sens. J. 2020, 20, 1238–1250. [Google Scholar] [CrossRef]
  27. Lee, M.-J.; Kang, M.-S.; Ryu, B.-H.; Lee, S.-J. Improved moving target detector using sequential combination of DPCA and ATI. J. Eng. 2019, 11, 7834–7837. [Google Scholar] [CrossRef]
  28. Lee, M.-J.; Lee, S.-J.; Ryu, B.-H.; Lim, B.-G.; Kim, K.-T. Reduction of False Alarm Rate in SAR-MTI Based on Weighted Kurtosis. IEEE Trans. Geosci. Remote Sens. 2020, 99, 1–14. [Google Scholar] [CrossRef]
  29. Brennan, L.E.; Reed, L.S. Theory of Adaptive Radar. IEEE Trans. Aerosp. Electron. Syst. 2007, 9, 237–252. [Google Scholar] [CrossRef]
  30. Brennan, L.; Mallett, J.; Reed, I. Adaptive arrays in airborne MTI radar. IRE Trans. Antennas Propag. 1976, 24, 607–615. [Google Scholar] [CrossRef]
  31. Klemm, R. Principles of Space-Time Adaptive Processing; Institute of Electical Engineering: London, UK, 2006. [Google Scholar]
  32. Guerci, J.R. Space-Time Adaptive Processing for Radar; Artech House: New York, NY, USA, 2003. [Google Scholar]
  33. Peckham, C.D. Reduced-rank STAP performance analysis. IEEE Trans. Aerosp. Electron. Syst. 2000, 36, 664–676. [Google Scholar] [CrossRef]
  34. Yang, Z.; Qin, Y.; de Lamare, R.C.; Wang, H.; Li, X. Sparsity-Based Direct Data Domain Space-Time Adaptive Processing with Intrinsic Clutter Motion. Circuits Syst. Signal Process. 2017, 36, 219–246. [Google Scholar] [CrossRef]
  35. Touzi, R.; Lopes, A.; Bruniquel, J.; Vachon, P.W. Coherence Estimation For Sar Imagery. IEEE Trans. Geosci. Remote. Sens. 1999, 37, 135–149. [Google Scholar] [CrossRef] [Green Version]
  36. Guarnieri, A.M.; Prati, C. SAR Interferometry: A “Quick and Dirty” Coherence Estimator for Data Browsing. IEEE Trans. Geosci. Remote Sens. 1997, 35, 660–669. [Google Scholar] [CrossRef] [Green Version]
  37. Liu, X.; Xu, S.; Tang, S. CFAR Strategy Formulation and Evaluation Based on Fox’s H-function in Positive Alpha-Stable Sea Clutter. Remote Sens. 2020, 12, 1273. [Google Scholar] [CrossRef] [Green Version]
  38. Yang, B.; Zhang, H. A CFAR Algorithm Based on Monte Carlo Method for Millimeter-Wave Radar Road Traffic Target Detection. Remote Sens. 2022, 14, 1779. [Google Scholar] [CrossRef]
  39. Duan, C.; Li, Y.; Wang, W.; Li, J. LEO-Based Satellite Constellation for Moving Target Detection. Remote Sens. 2022, 14, 403. [Google Scholar] [CrossRef]
  40. Reed, I.S.; Gau, Y.L.; Truong, K.T. CFAR detection and estimation for STAP radar. IEEE Trans. Aerosp. Electron. Syst. 1998, 34, 722–735. [Google Scholar] [CrossRef]
Figure 1. The earth observation geometry of an airborne radar system.
Remotesensing 14 03558 g001
Figure 2. Clutter ridge (a) the clutter ridge without hot clutter (b) the clutter ridge with hot clutter.
Remotesensing 14 03558 g002
Figure 3. Background: (a) the background image, (b) the echo of background.
Remotesensing 14 03558 g003
Figure 4. Statistical characteristics of different areas: (a) area 1, (b) area 2, (c) area 3, (d) area 4.
Remotesensing 14 03558 g004
Figure 5. The geometric scene of forward and backward track.
Remotesensing 14 03558 g005
Figure 6. The simplified flowchart of the proposed GMTI method.
Remotesensing 14 03558 g006
Figure 7. Image registration diagram.
Remotesensing 14 03558 g007
Figure 8. Clutter covariance matrix estimation.
Remotesensing 14 03558 g008
Figure 9. The flowchart from image to echo.
Remotesensing 14 03558 g009
Figure 10. Simulated echo after adding a strong jamming target: (a) echo after adding a strong jamming target, (b) the Capon after adding a strong jamming target.
Remotesensing 14 03558 g010
Figure 11. STAP results of traditional method: (a) two-dimensional frequency response plane diagram, (b) the output result after detection.
Remotesensing 14 03558 g011
Figure 12. STAP results of proposed method: (a) two-dimensional frequency response plane diagram, (b) the output result after detection.
Remotesensing 14 03558 g012
Figure 13. STAP performance indexes. (a) Output SCNR Loss Diagram. (b) SCNR improvement factor. (c) MVD calculation of traditional method (d) MVD calculation of proposed method.
Remotesensing 14 03558 g013
Figure 14. The detection flowchart.
Remotesensing 14 03558 g014
Figure 15. (a) The echo of background; (b) the echo of the moving target and background.
Remotesensing 14 03558 g015
Figure 16. The results after detection, when there is a target: (a) traditional method; (b) proposed method.
Remotesensing 14 03558 g016
Figure 17. The output result by detector.
Remotesensing 14 03558 g017
Figure 18. The results after detection, when there are two targets: (a) traditional method; (b) proposed method.
Remotesensing 14 03558 g018
Figure 19. The Capon of several targets.
Remotesensing 14 03558 g019
Figure 20. The results after detection, when there are multiple targets: (a) traditional method, (b) proposed method.
Remotesensing 14 03558 g020
Figure 21. Graph of SCNR and detection probability.
Remotesensing 14 03558 g021
Table 1. The statistical properties.
StatisticArea1Area2Area3Area4
Mean value1081099493
Variance30303234
Skewness coefficient<0(−1.125)<0(−1.116)<0(−1.158)<0(−1.194)
Kurtosis coefficient2.0562.2182.6532.652
Table 2. Simulation Parameters.
Simulation ParametersValue
Platform frequency5e9
Bandwidth200e6
PRF654
Number of pulses in one CPI32
Elements20
Interval between elements0.12
Scene800 × 800
Publisher’s Note: MDPI stays neutral with regard to jurisdictional claims in published maps and institutional affiliations.

