
Remote-Sensing-Based Assessment of the Ecological Restoration Degree and Restoration Potential of Ecosystems in the Upper Yellow River over the Past 20 Years

 ,
, 
 ,
,
Abstract
:1. Introduction
2. Materials and Methods
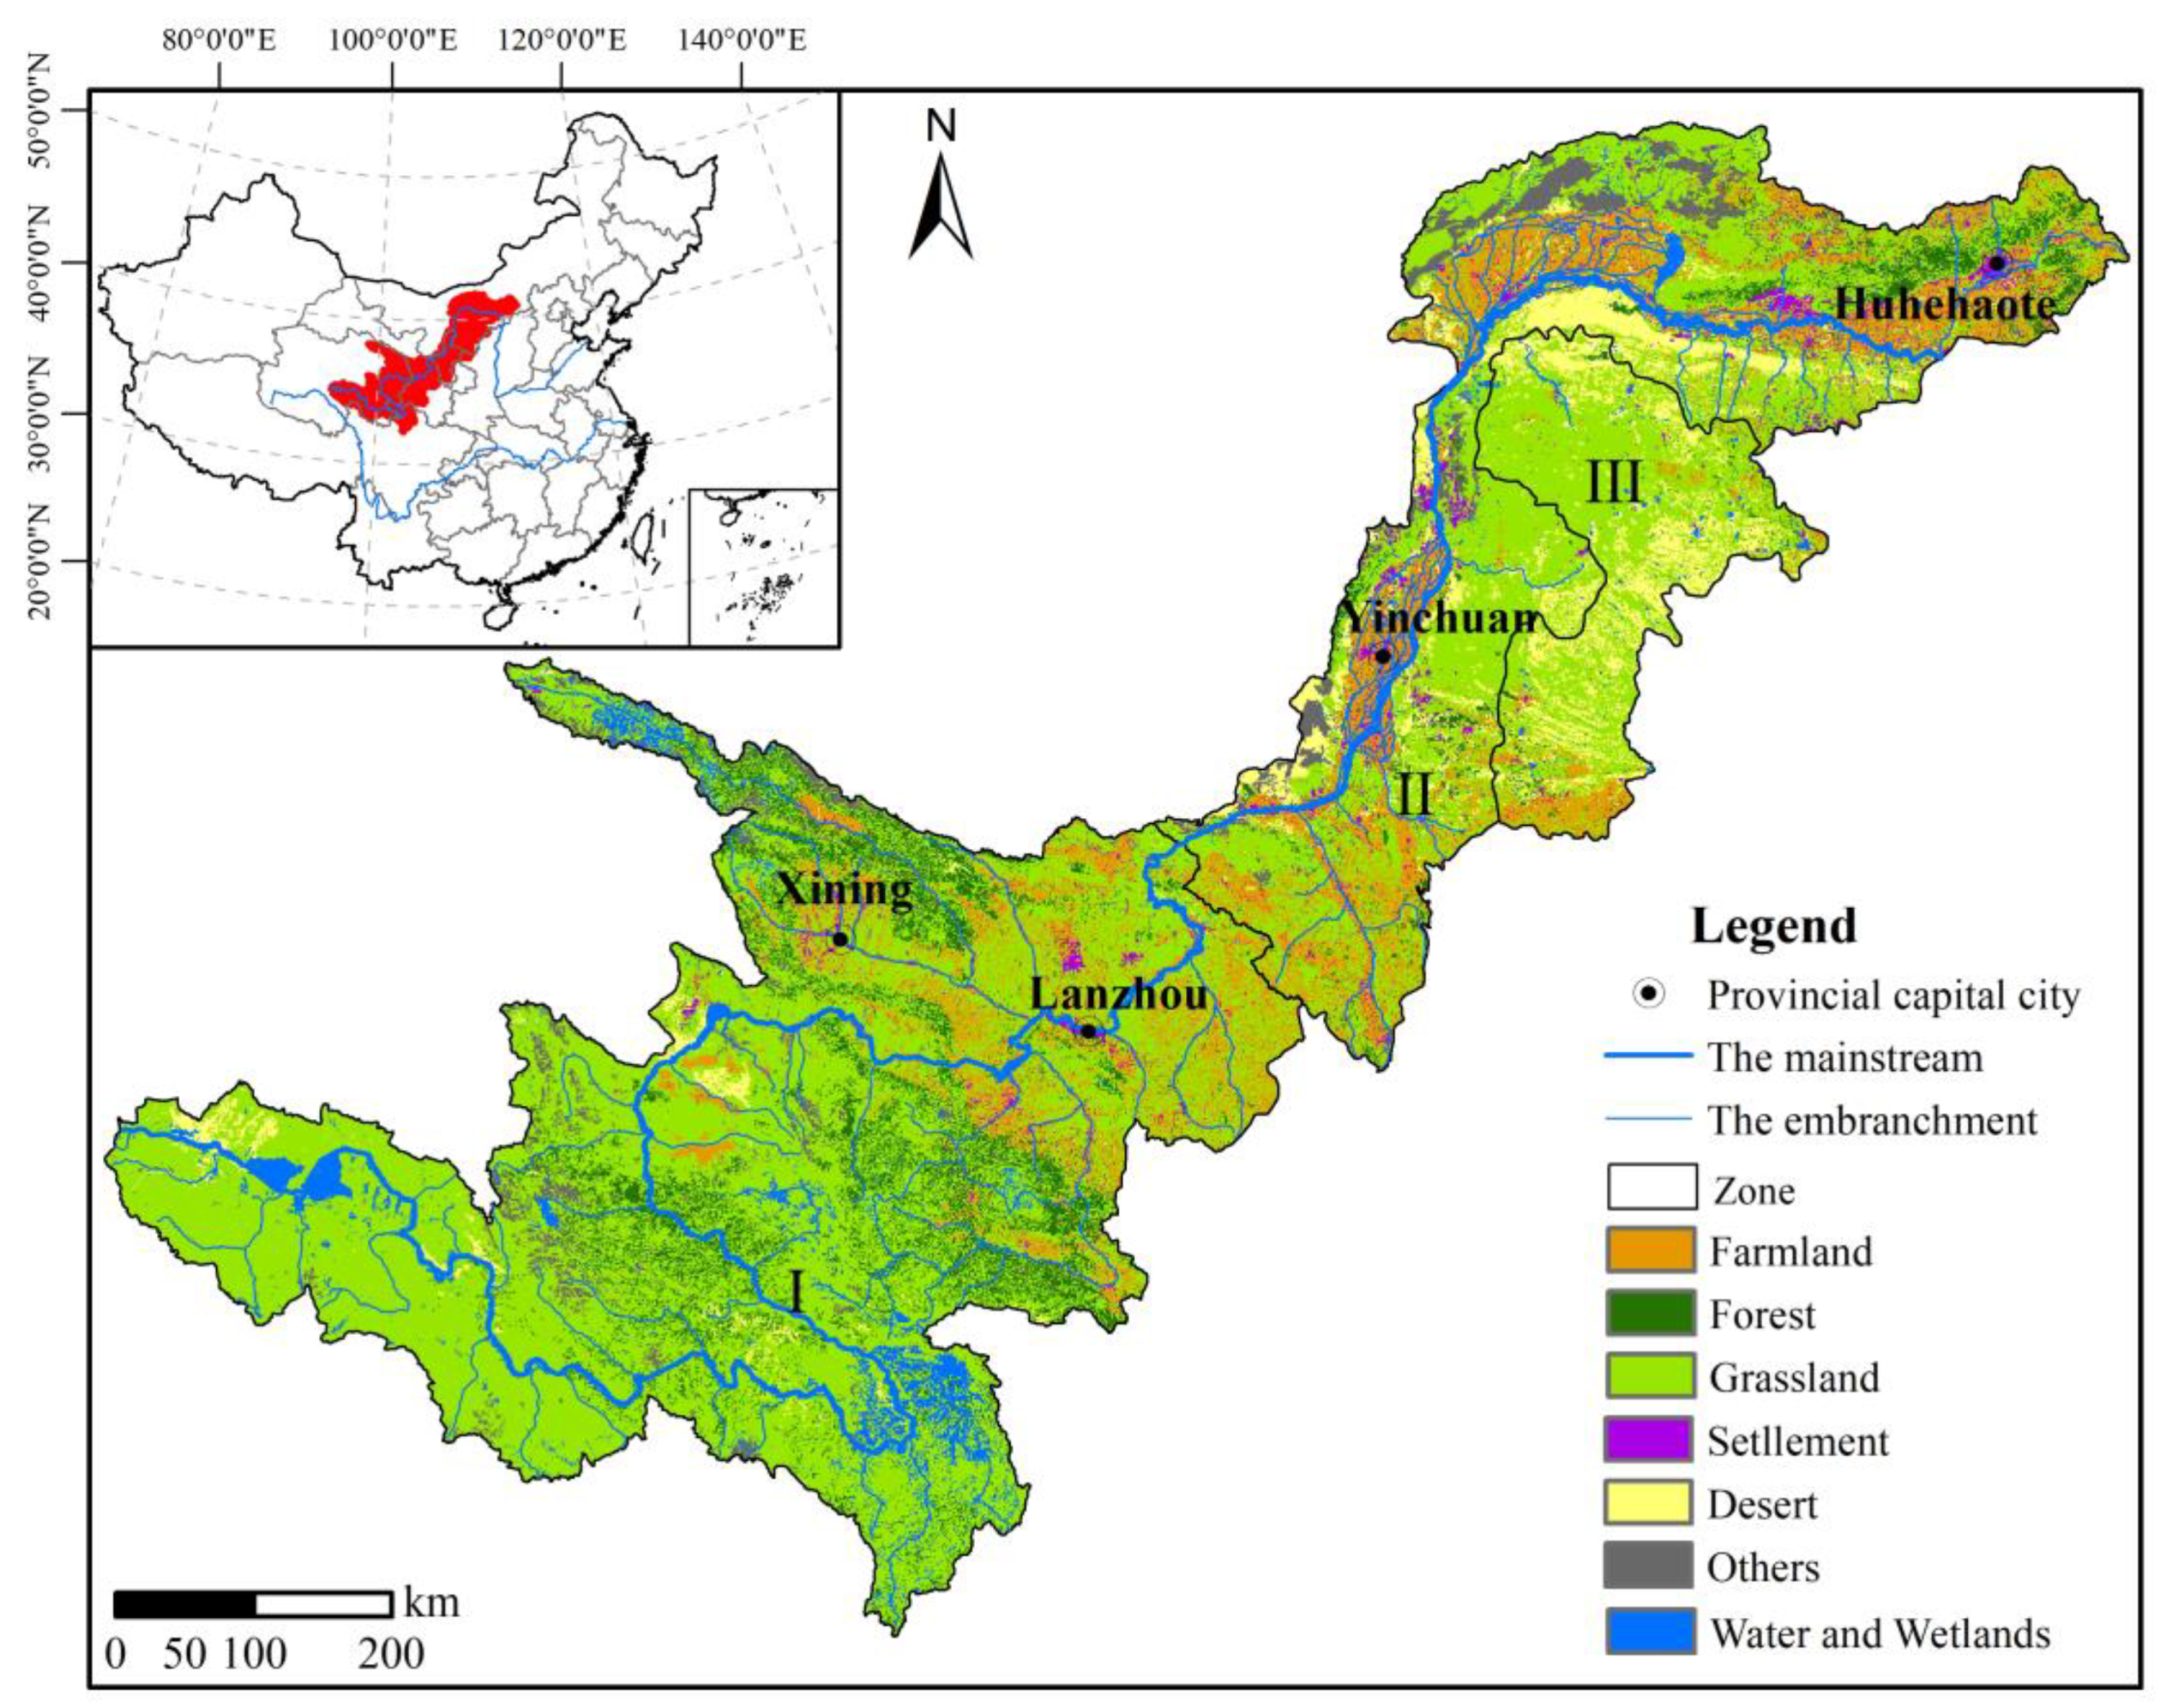
2.1. Study Area
2.2. Acquisition and Validation of Remote Sensing Index Parameter Data
2.2.1. Acquisition and Verification of the Ecosystem Macrostructure Data
2.2.2. Acquisition and Validation of the Ecosystem Quality Data
2.2.3. Estimation and Validation of the Ecosystem Service Data
- (1)
- Water Retention
- (2)
- Soil Retention
- (3)
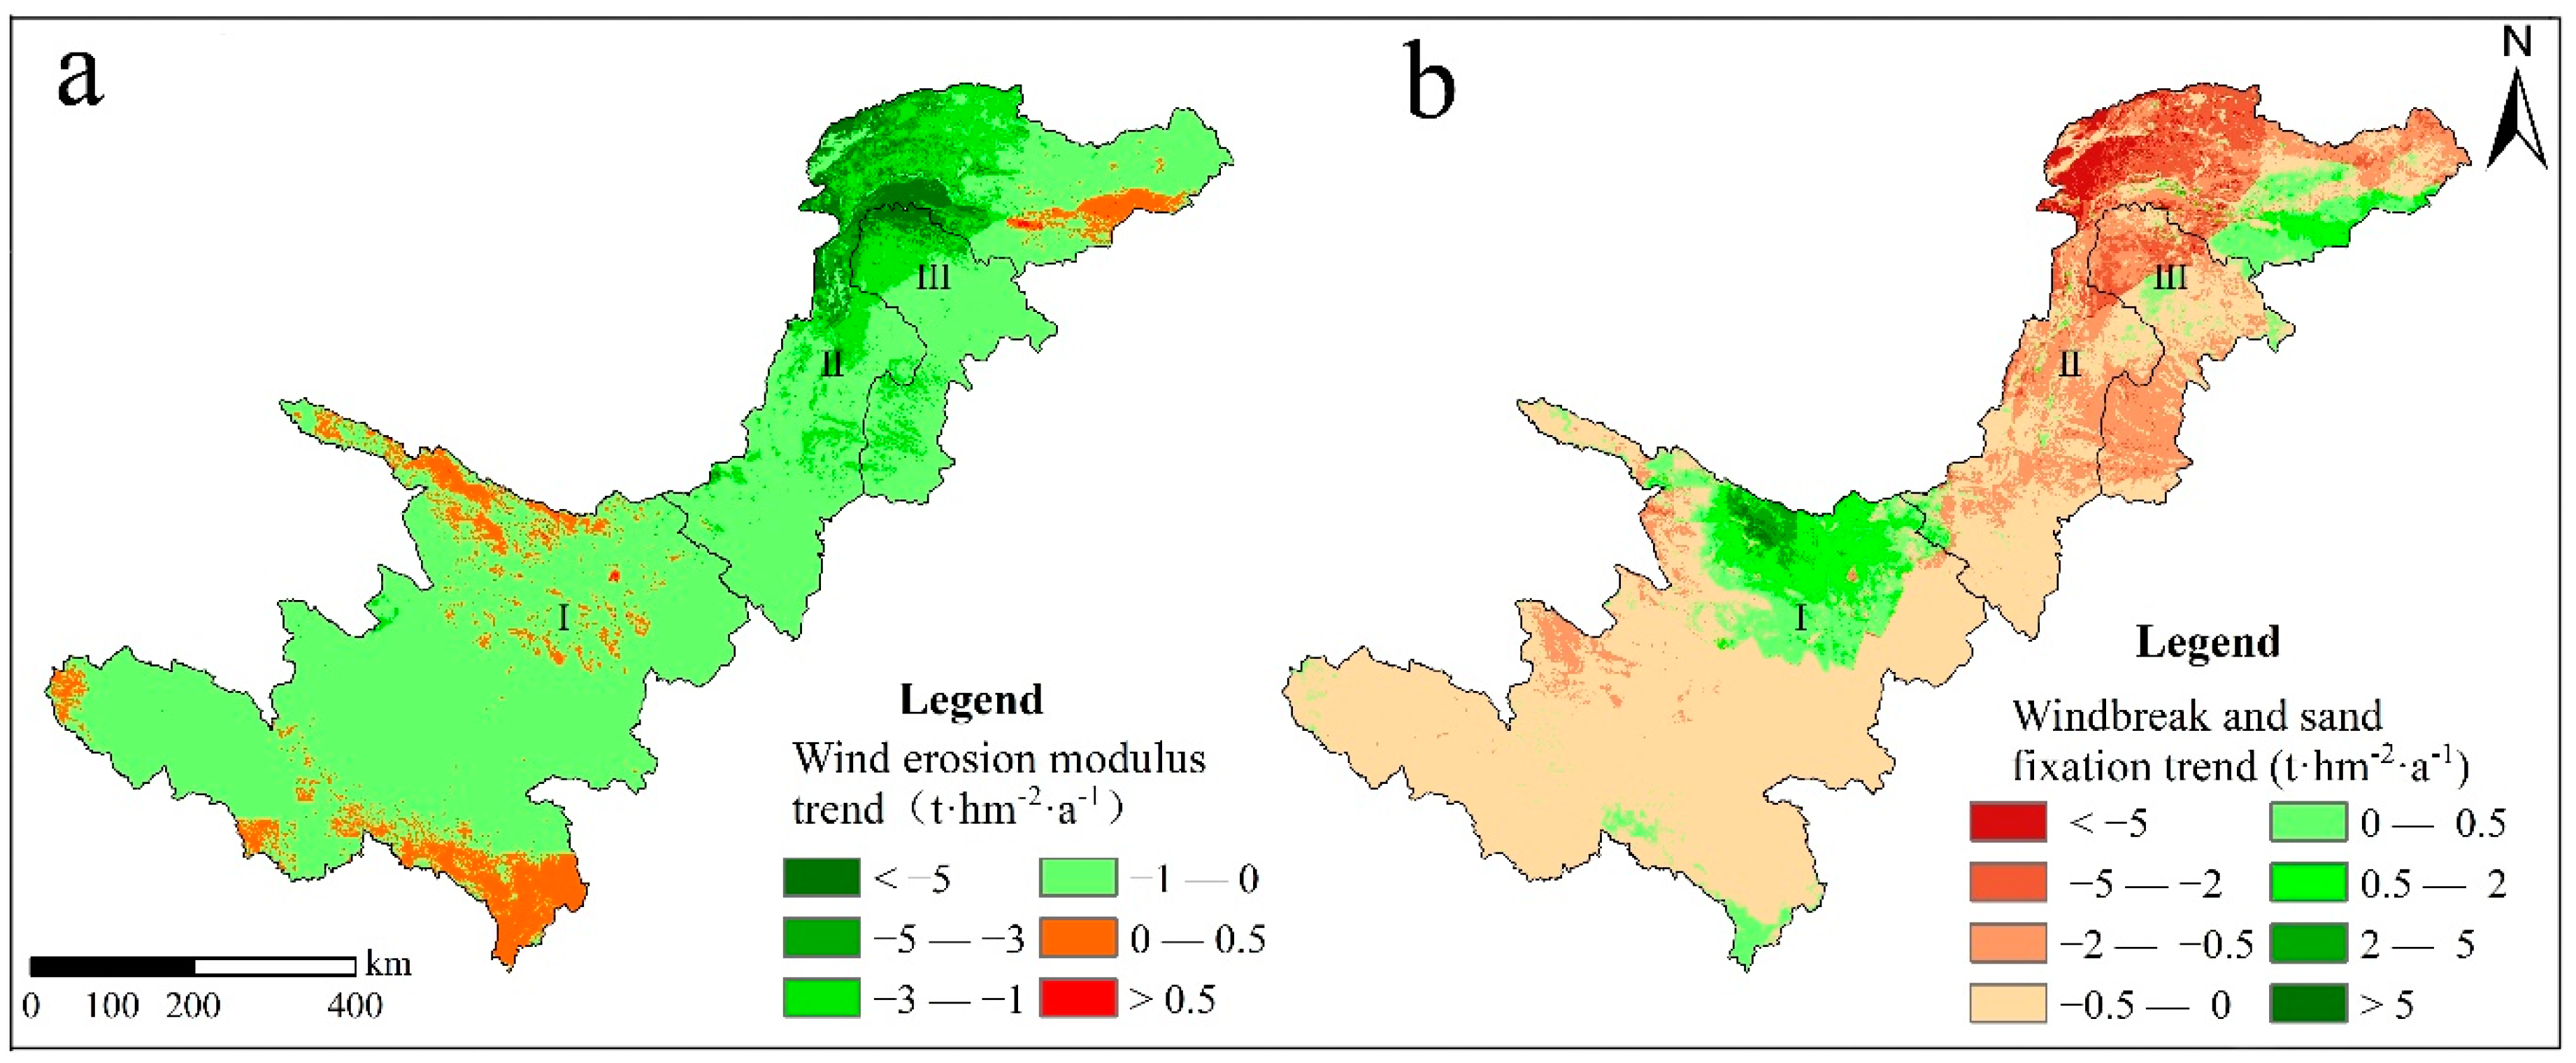
- Windbreak and Sand Fixation
2.3. Assessment Methods of the Ecological Restoration Degree and Restoration Potential
2.3.1. Assessment Method of the Restoration Tendency and Ecological Restoration Degree
2.3.2. Assessment Method of the Restoration Potential
2.4. Methods for Determining the Contributions of Climate Factors and Human Activities to Ecosystem Changes
3. Results and Analysis
3.1. Temporal and Spatial Ecosystem Changes
3.1.1. Analysis of Ecosystem Macrostructure Changes
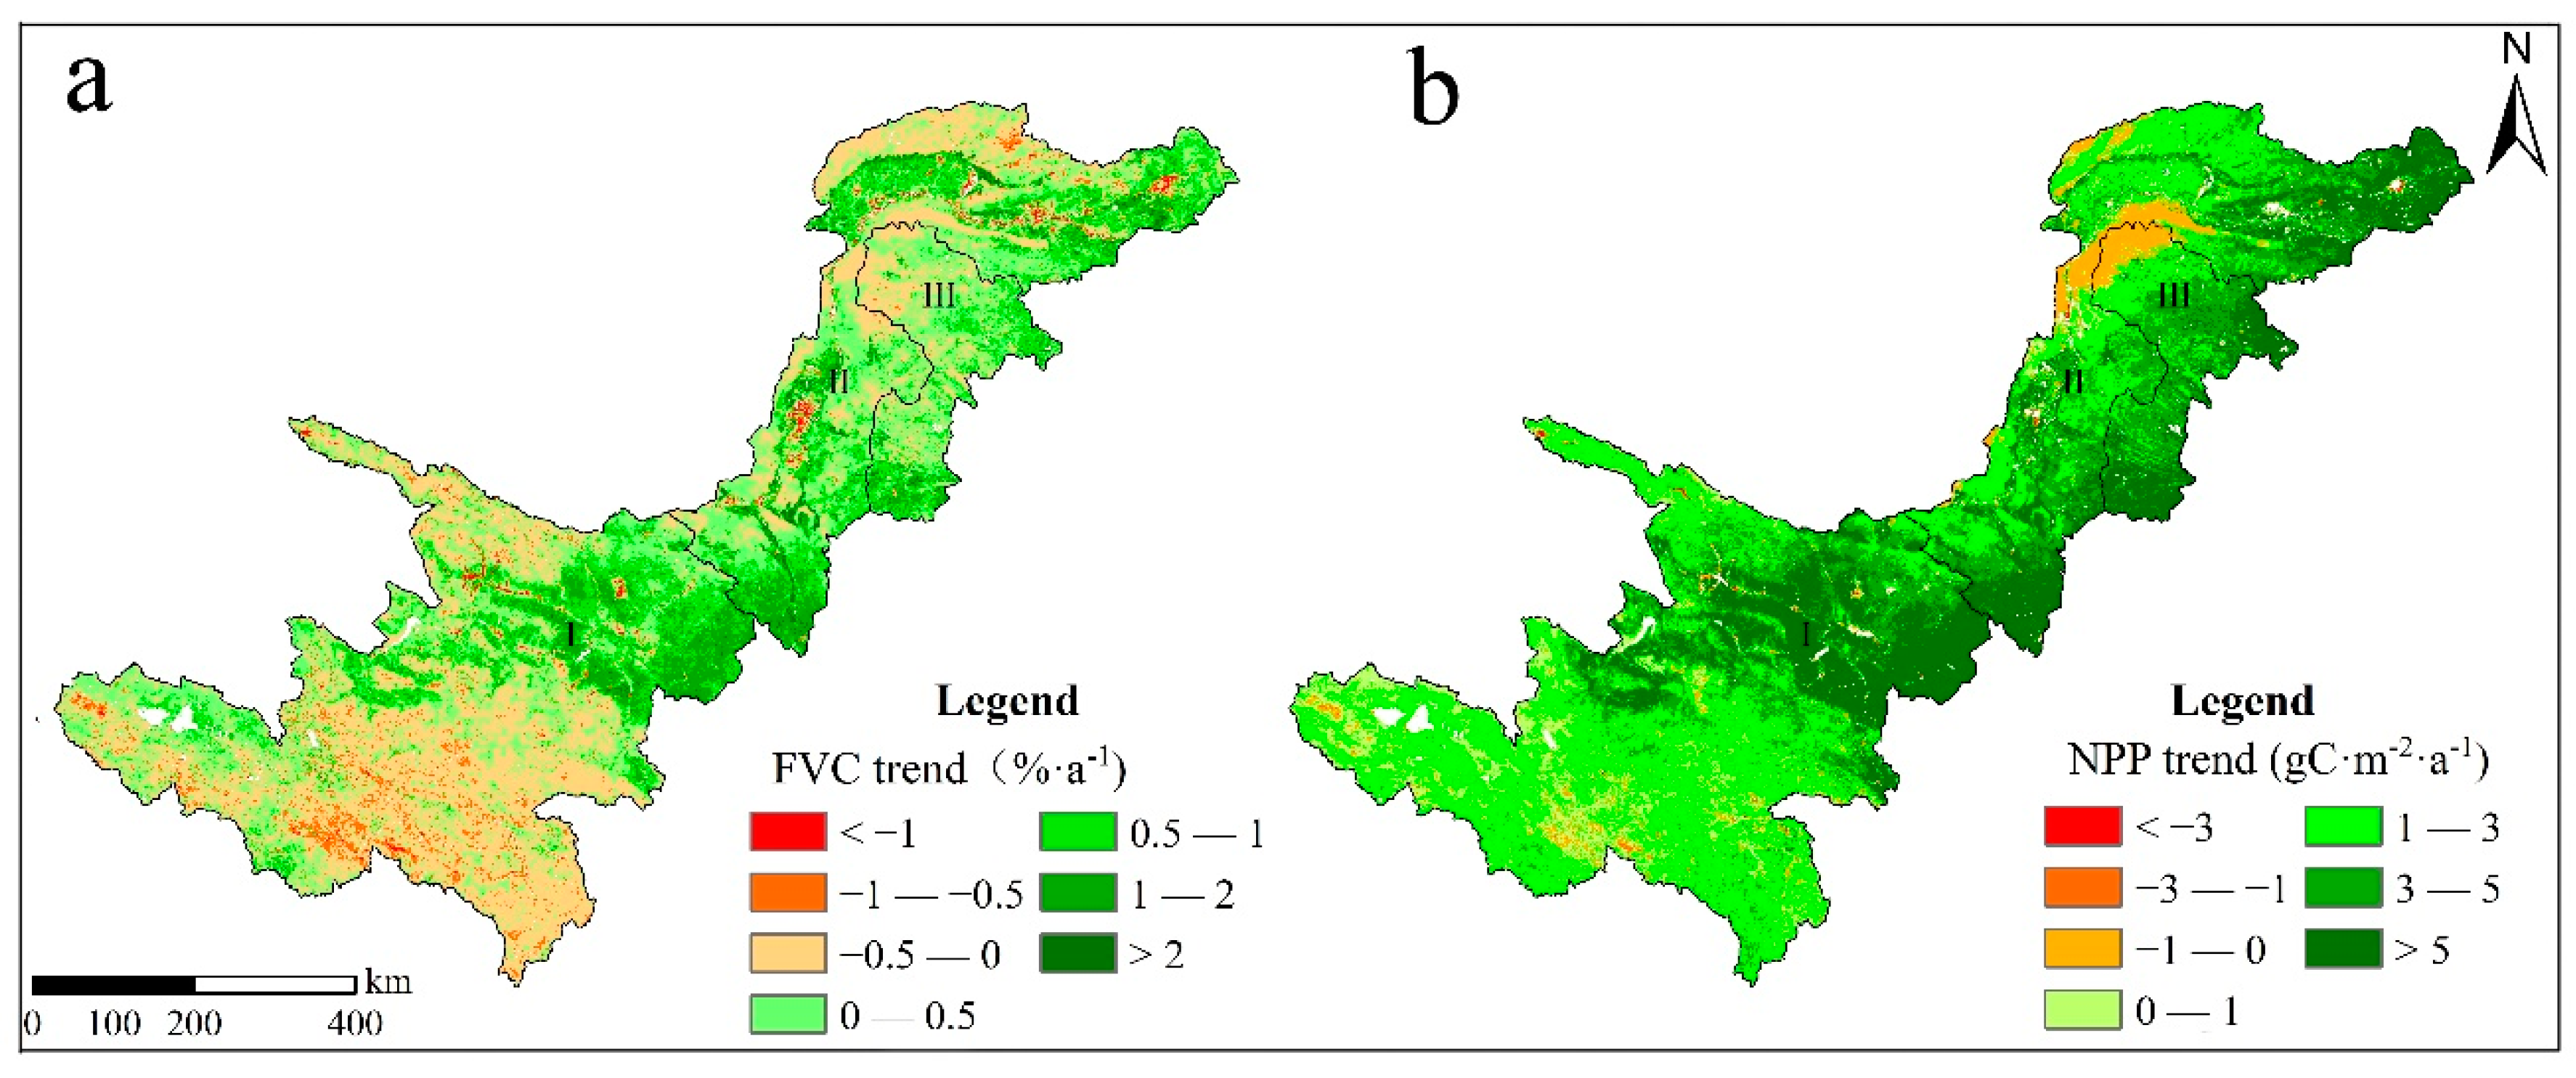
3.1.2. Temporal and Spatial Changes in Ecosystem Quality
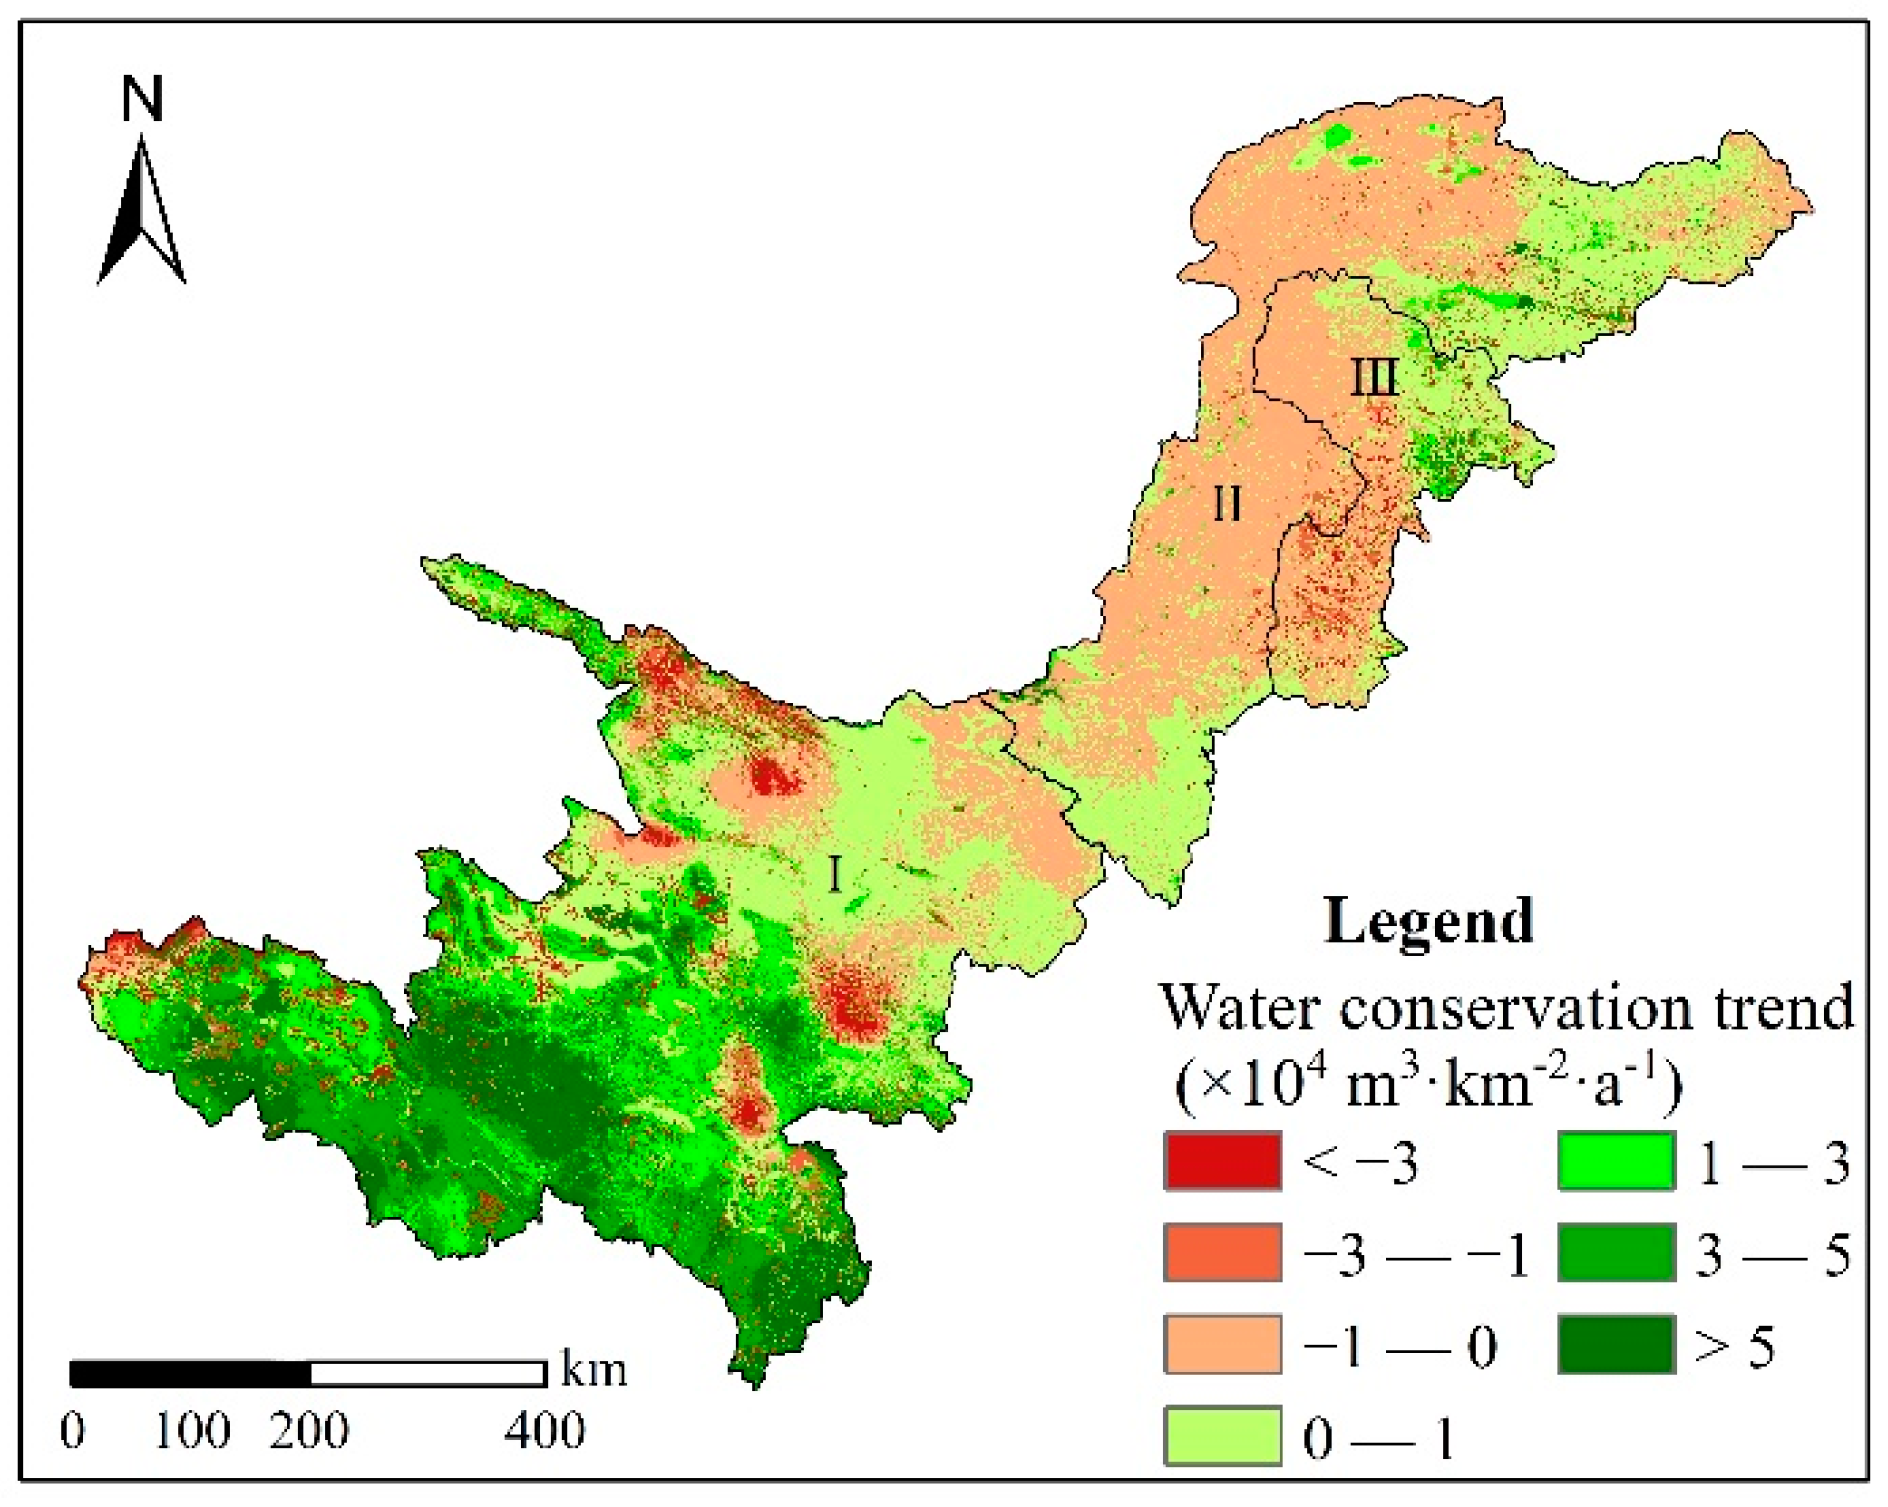
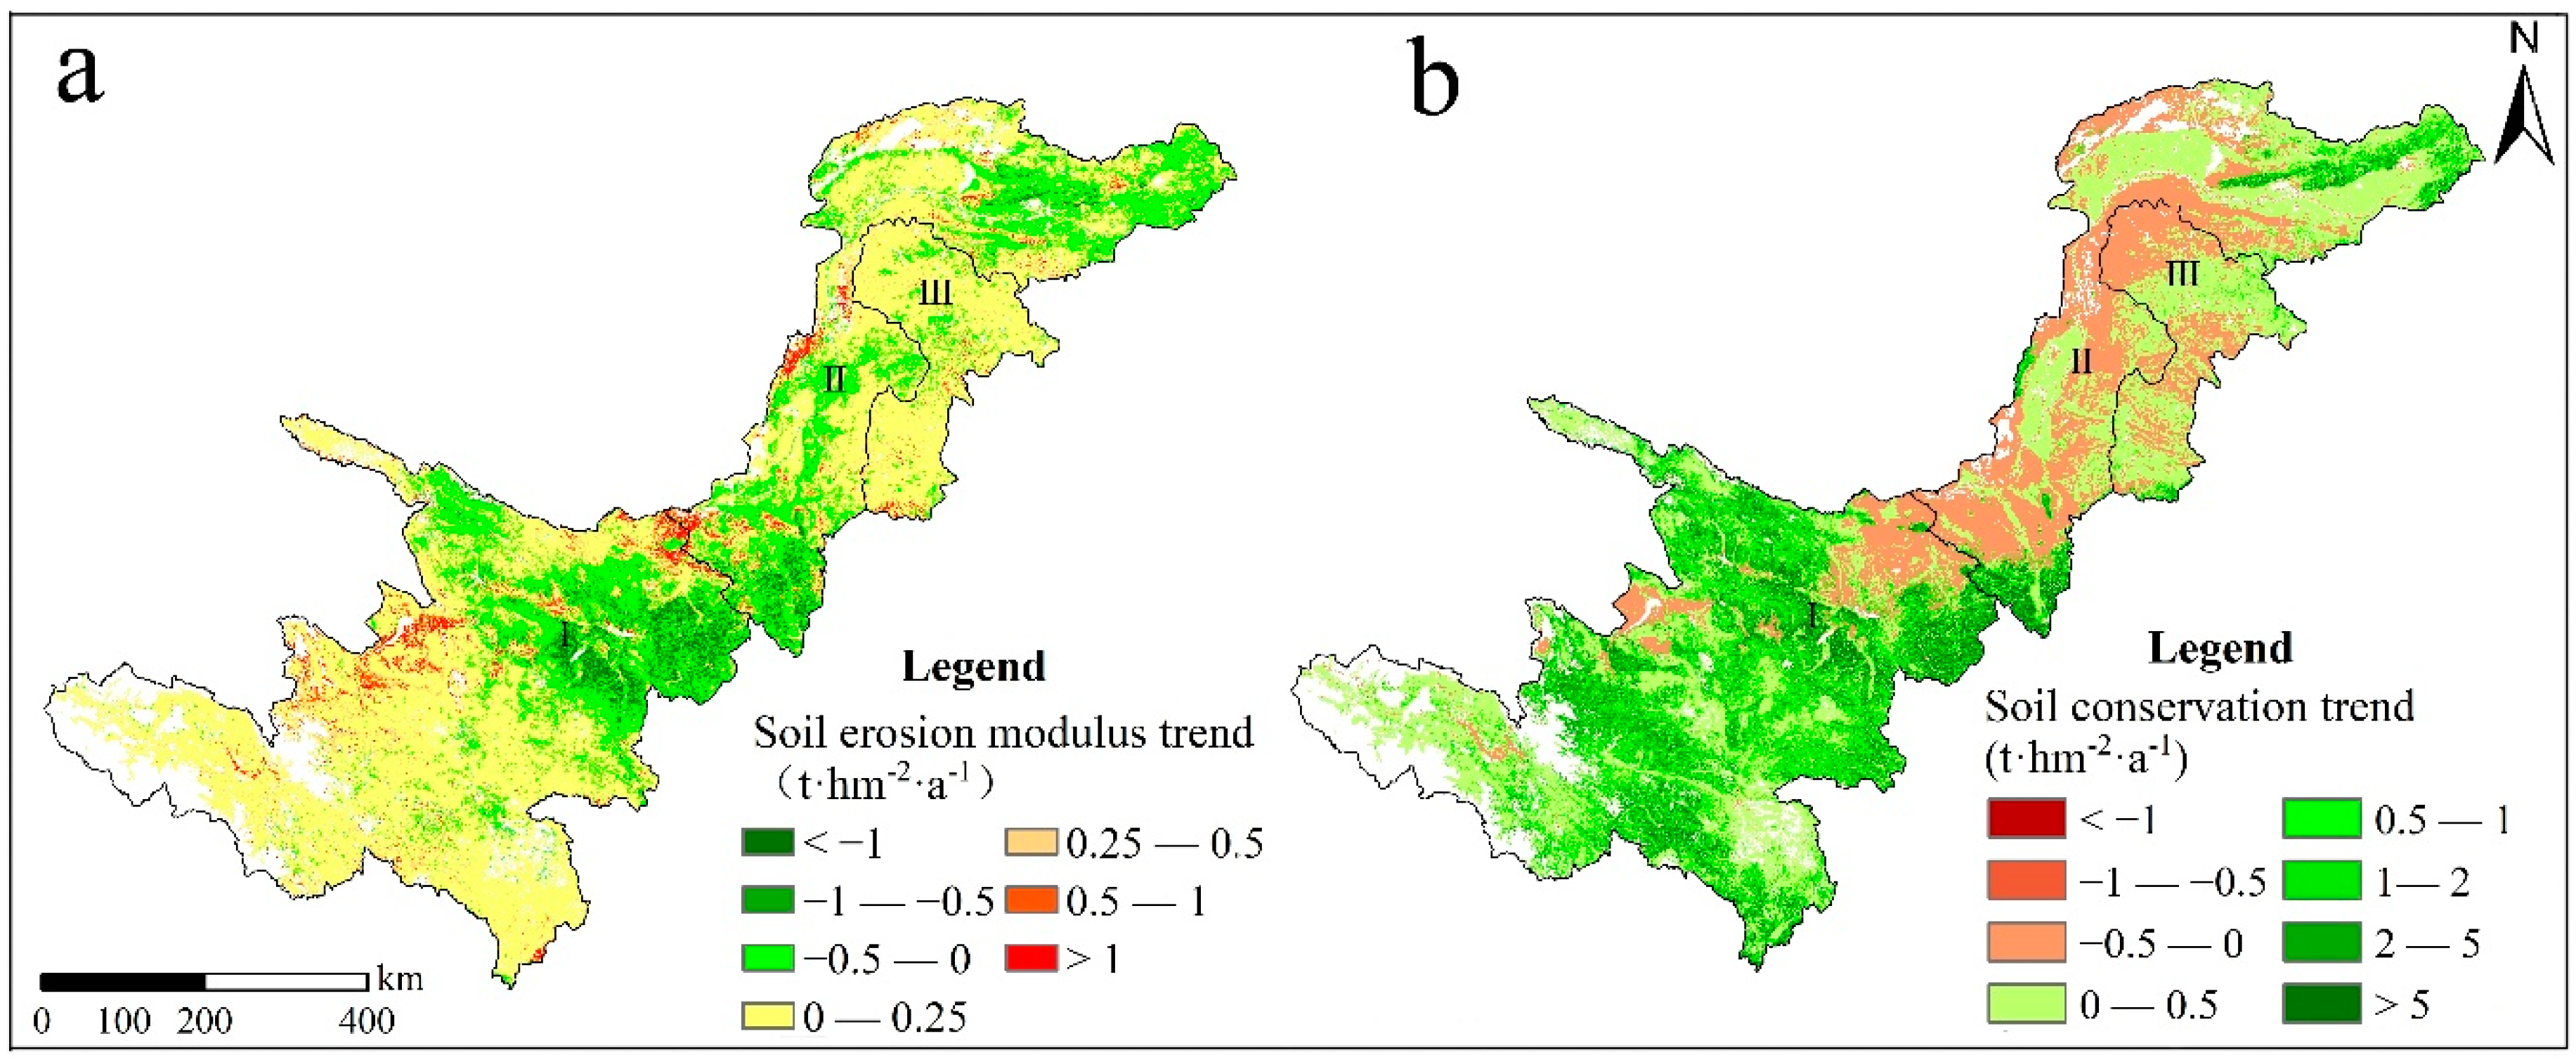
3.1.3. Temporal and Spatial Changes in Ecosystem Services
3.2. Restoration Tendency and Degree of Ecological Restoration in the Upper Yellow River Region
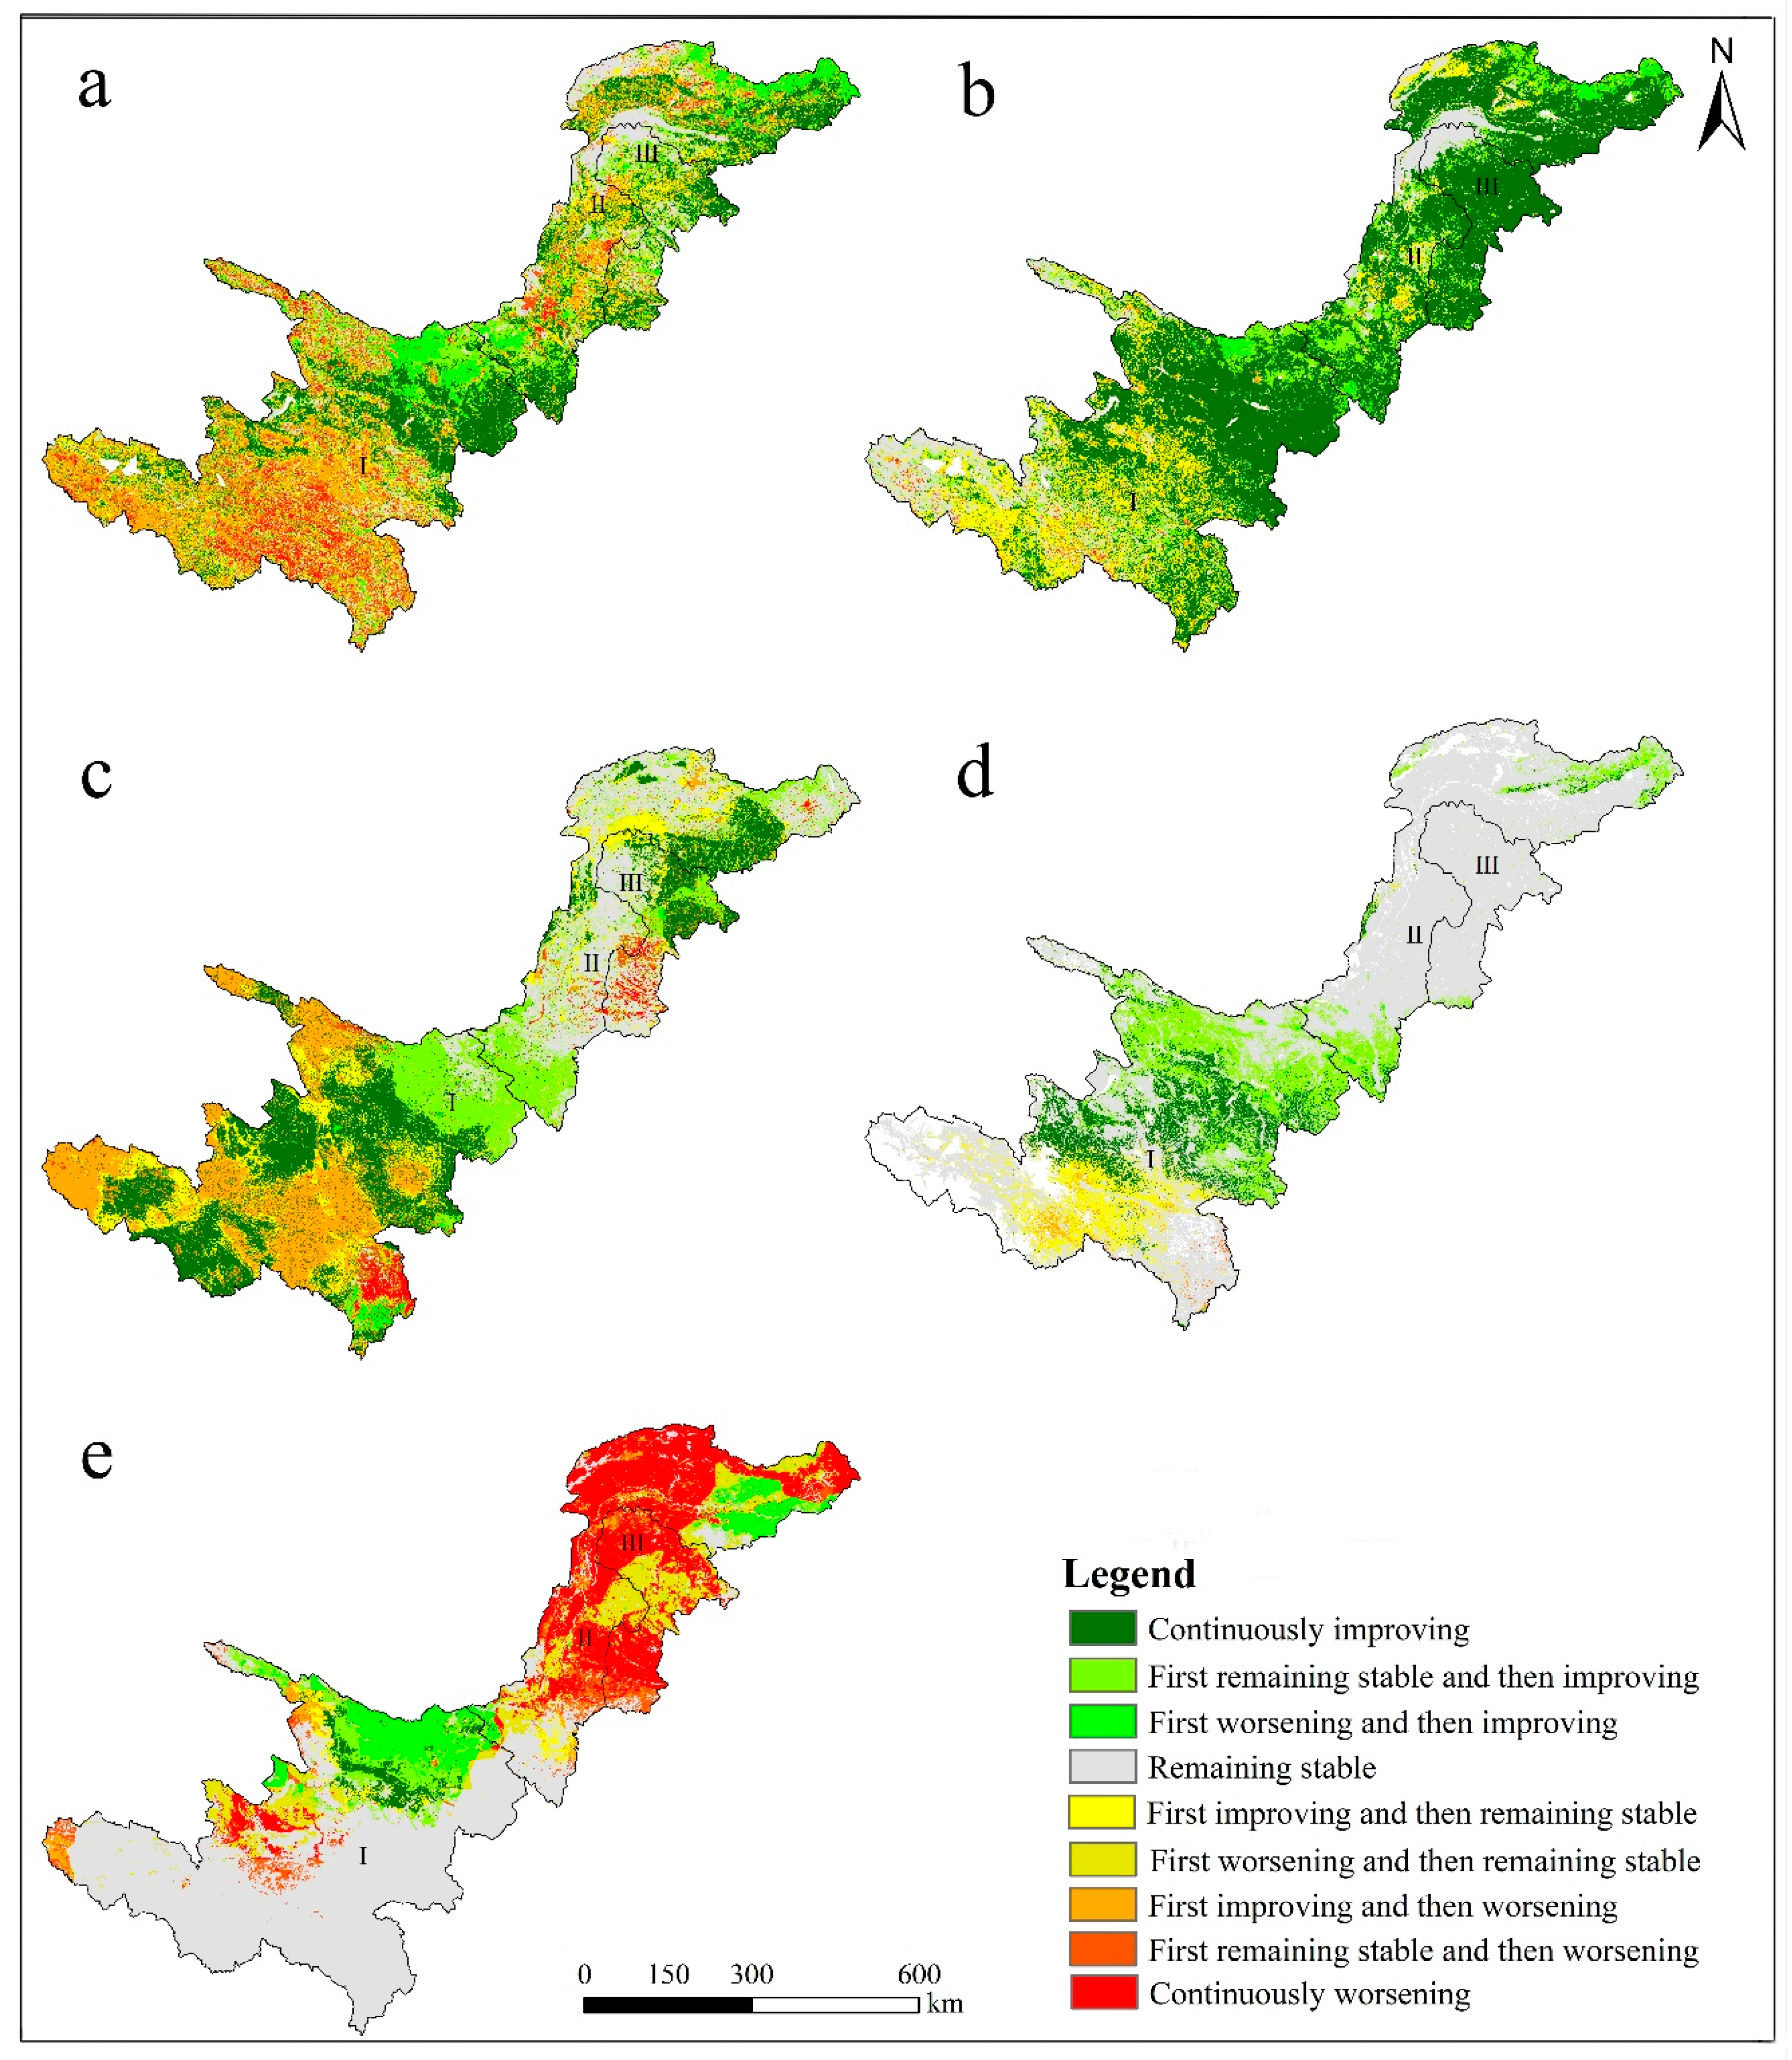
3.2.1. Restoration Tendency and Spatial Ecosystem Differences
- (1)
- Ecosystem Quality
- (2)
- Ecosystem Services
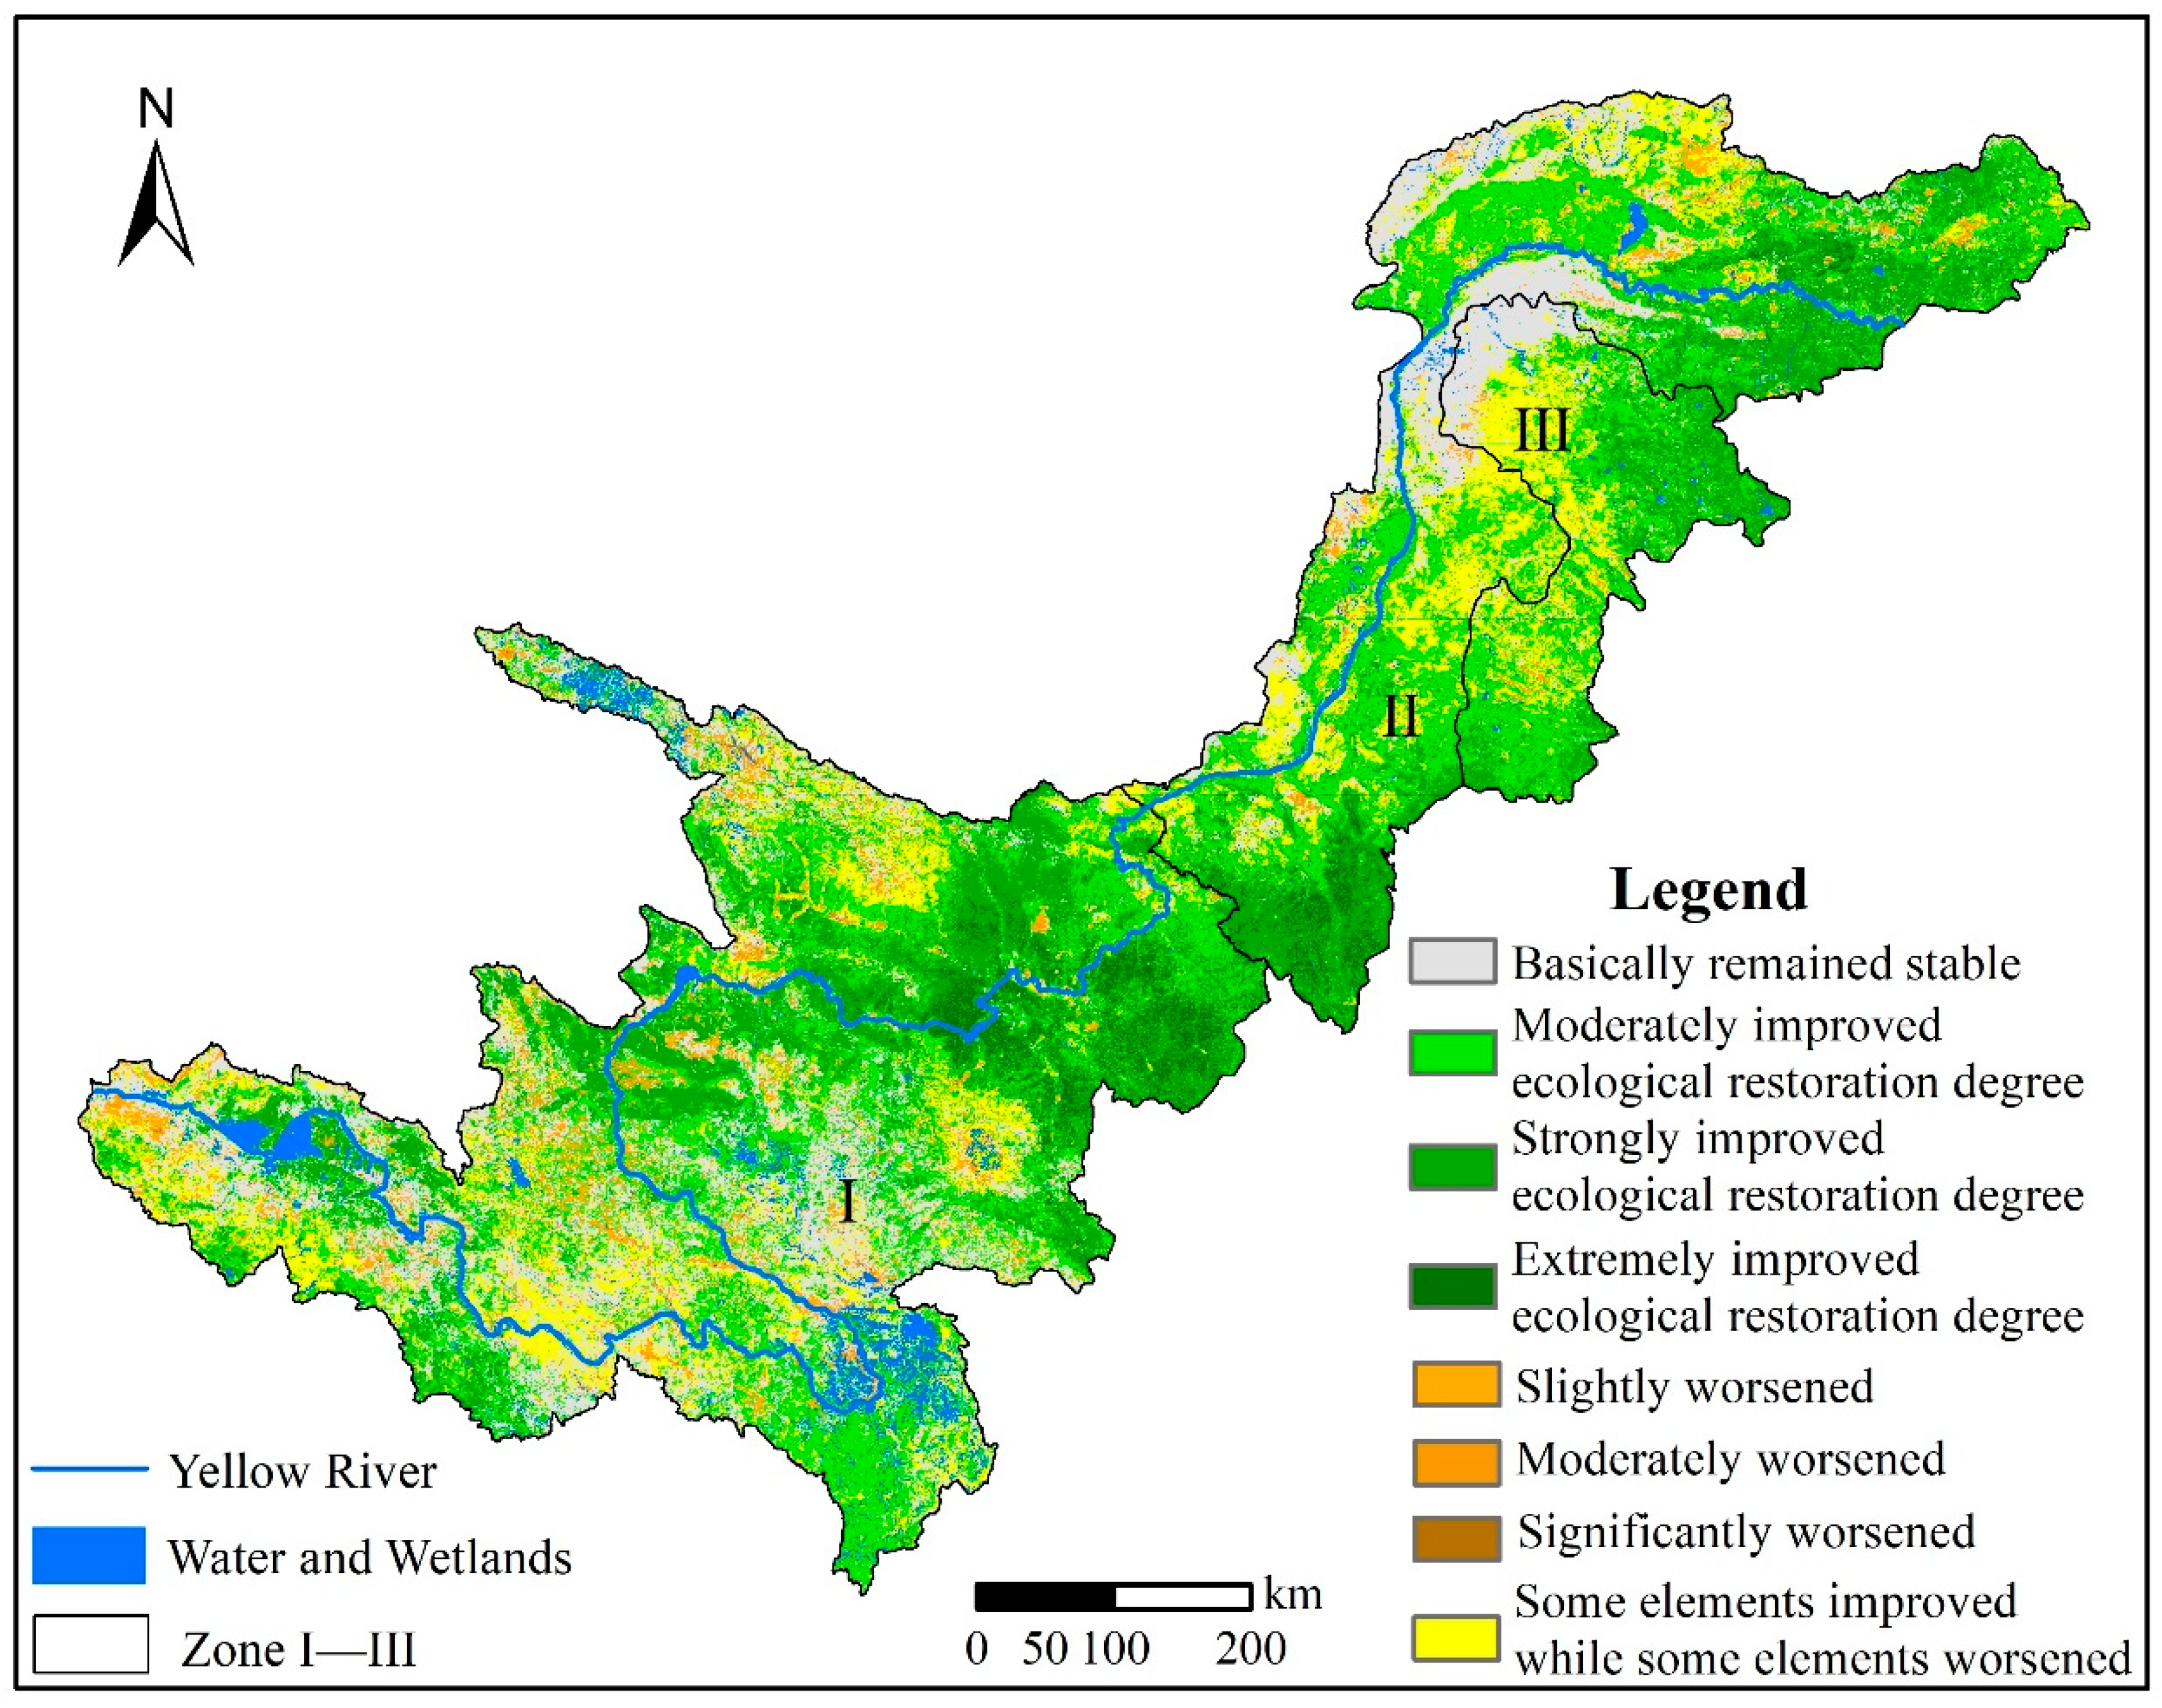
3.2.2. Spatial Differences in the Ecosystem Restoration Degree
3.3. Contributions of Climate Factors and Human Activities to Ecosystem Quality and Service Changes
3.4. Ecological Restoration Potential of the Main Ecosystem Types in the Study Area
4. Discussion
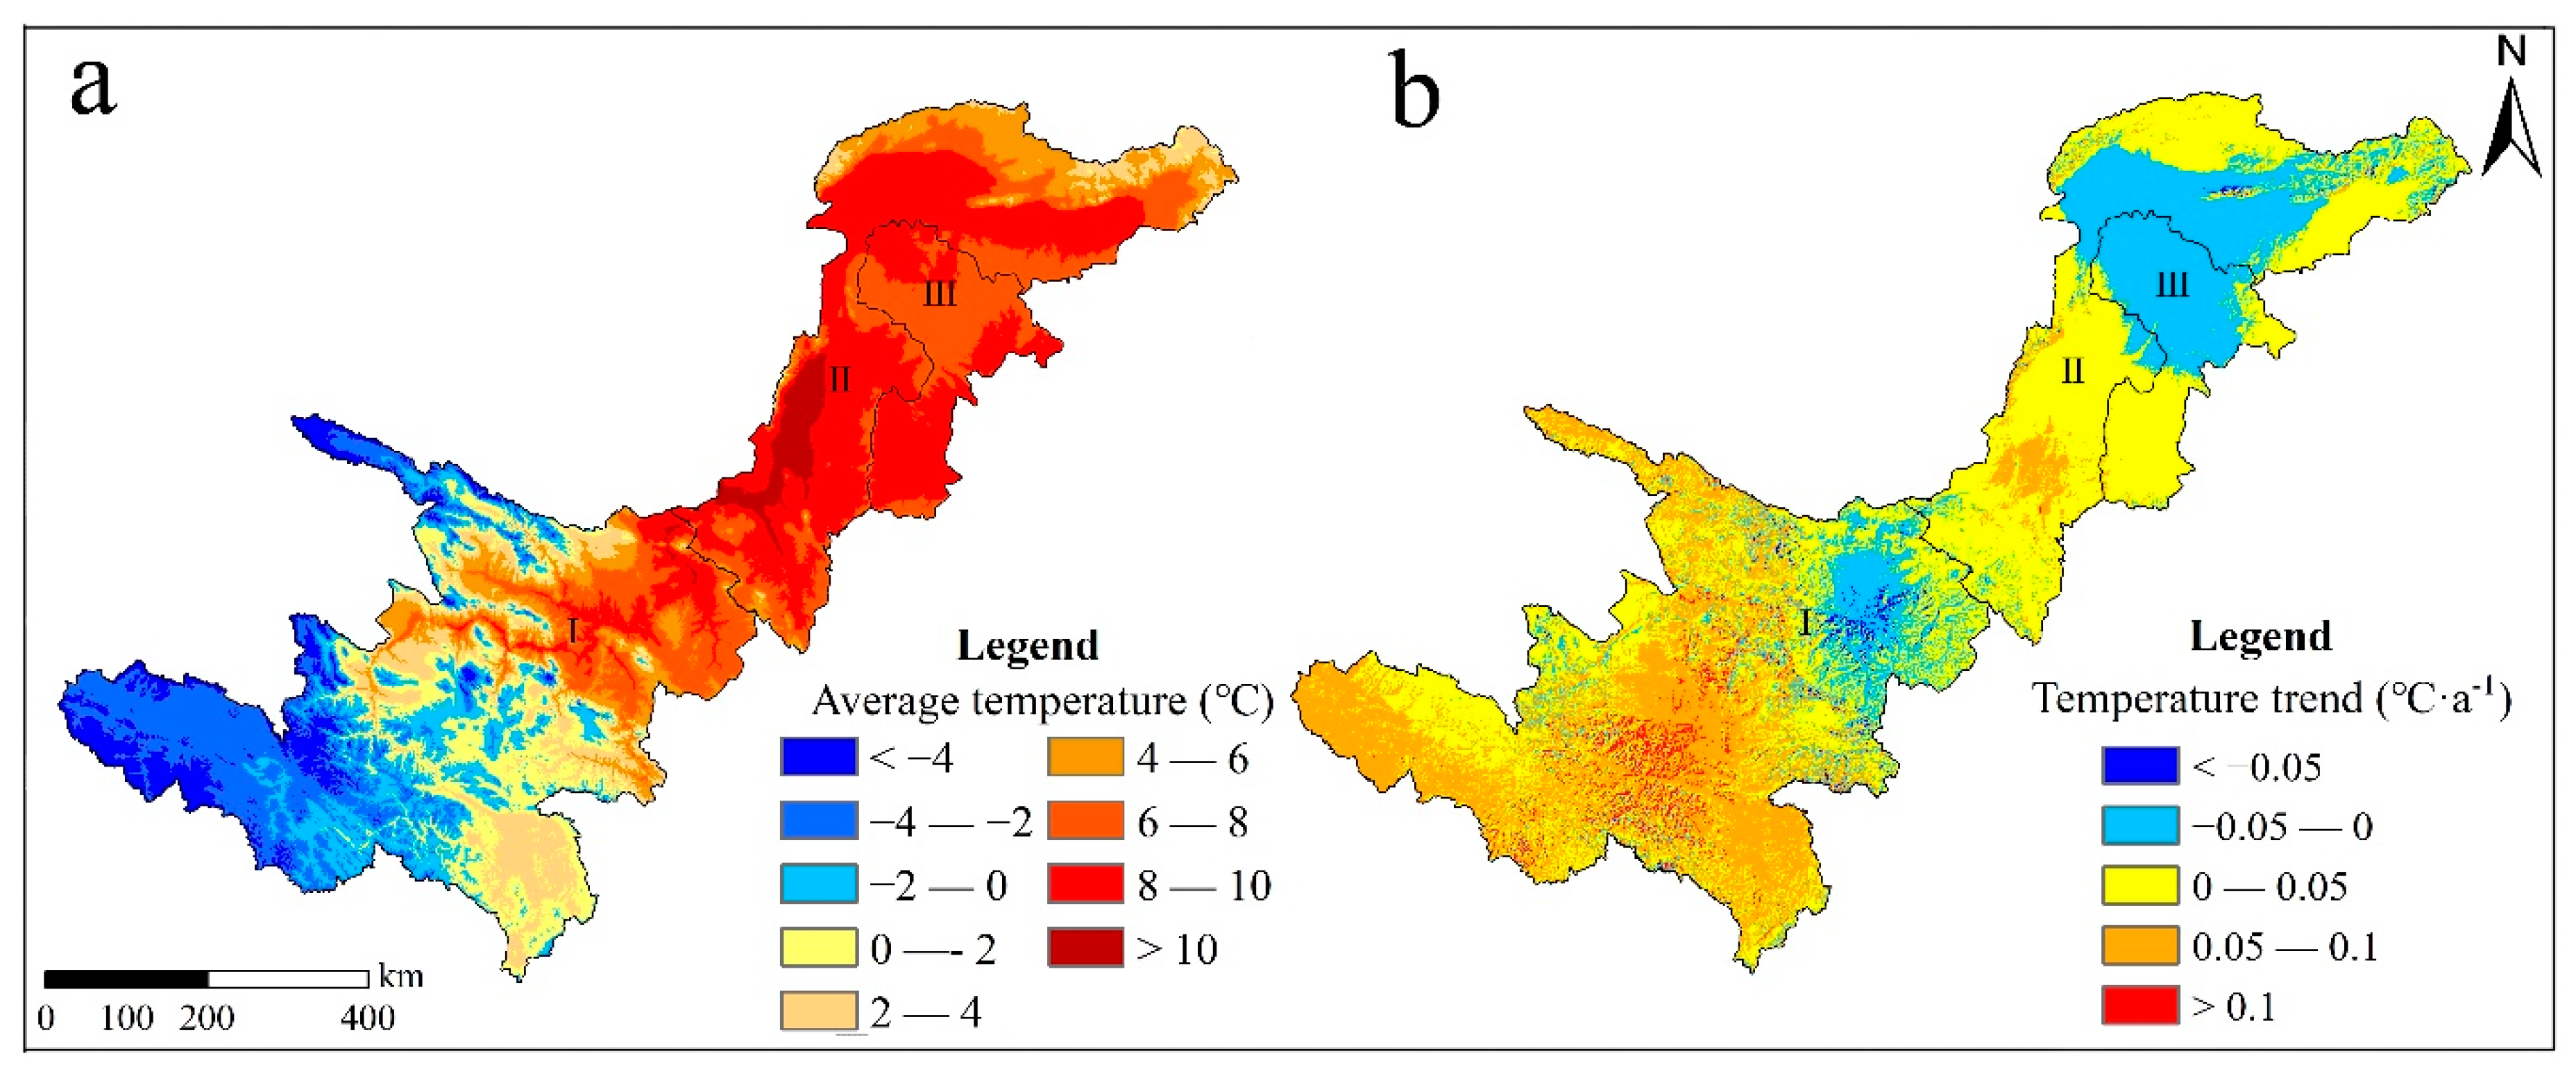
4.1. Impacts of the Climate Pattern on Ecological Restoration
4.2. Impacts of Human Activities on Ecological Restoration
4.3. Analysis of the Causes of Water Retention Changes
5. Conclusions
- (1)
- From 2000 to 2018, the areas of settlement, forest and water and wetland ecosystems increased by 2661.6 km2, 1246.1 km2 and 1136.2 km2, respectively, while the areas of grassland, farmland and desert ecosystems decreased by 2568.4 km2, 1254.5 km2 and 885.8 km2, respectively.
- (2)
- The ecosystem quality and ecosystem services in the Upper Yellow River region generally remained stable or improved from 2000 to 2019, though these factors exhibited deterioration in some regions. From 2000 to 2019, the change rates of FVC and NPP were 0.25%·a−1 and 3.22 gC·m−1·a−1, respectively. The water retention services showed an increasing trend with a change rate of 105.46 m3·hm−2·a−1. The soil retention service remained stable and improved, and the change rate of soil retention rate was 0.78 t·hm−2·a−1. The windbreak and sand fixation ecosystem service showed a downward trend, and the change rate of the wind erosion modulus was −0.58 t·hm−2·a−1.
- (3)
- From 2000 to 2010 and from 2010 to 2019, the ecosystem quality and ecosystem services in the Upper Yellow River region remained stable and continuously improved. From 2000 to 2019, the areas in which moderate, relatively high and extremely high ecological restoration degrees were identified in the Upper Yellow River region accounted for 32.9%, 21.0% and 2.8% of the study region, respectively. The areas with relatively high and extremely high ecological restoration degrees were mainly distributed in the gully region on the Loess Plateau in Zone I and Zone II as well as on the eastern Hetao Plain in Zone II.
- (4)
- From 2000 to 2019, climate factors contributed 81.6% of the calculated change in NPP and 77.6% of the derived change in the soil erosion modulus. Human activities contributed 18.4% and 22.4% to the NPP and soil erosion modulus changes, respectively.
- (5)
- The restoration potential index of the FVC in the Upper Yellow River region was 22.7%. The difference between the actual FVC value and that derived under ideal zonal climax ecological background values was 13.9% in the forest, grassland and desert ecosystems; among these ecosystems, the difference obtained for forest ecosystems was 12.7%, and the corresponding restoration potential index was 14.4%. The difference between the real and ideal FVC values in the grassland ecosystems was 14.3%, and the corresponding restoration potential index was 23.0%.
Author Contributions
Funding
Data Availability Statement
Conflicts of Interest
References
- Wu, D.D.; Cai, Y.L. Evaluation of ecological restoration effects in China: A review. Prog. Geogr. 2009, 28, 622–628. [Google Scholar]
- Laughlin, D.C. Applying trait-based models to achieve functional targets for theory-driven ecological restoration. Ecol. Lett. 2014, 17, 771–784. [Google Scholar] [CrossRef] [PubMed] [Green Version]
- Millennium Ecosystem Assessment. Ecosystems and Human Well-Being; Island Press: Washington, DC, USA, 2003. [Google Scholar]
- Heinz, H.J. The State of the Nation’s Ecosystems 2008: Measuring the Lands, Waters, and Living Resources of the United States; China Environmental Science Press: Beijing, China, 2013. [Google Scholar]
- Watson, B.; Steve, A. UK National Ecosystem Assessment: Synthesis of the Key Findings; Information Press: Oxford, UK, 2011. [Google Scholar]
- Yu, X.B. Ecological degradation and policy implication for ecological restoration in China. Resour. Sci. 2002, 24, 72–76. [Google Scholar]
- Zong, J.Q.; Bai, S.Y.; Feng, C.Y.; Pu, Y. Spatiotemporal variation characteristics of ecological status in China based on continuous time series NDVI data. Res. Soil Water Conserv. 2021, 28, 132–138. [Google Scholar]
- Xue, X.Y.; Wang, X.Y.; Duan, H.M.; Xie, Y.W. Tempoal and spatial of NPP and its causes in the agricultural pastoral ecotone of northern China. Res. Soil Water Conserv. 2021, 28, 190–197. [Google Scholar]
- Dutta, D.; Das, P.K.; Paul, S.; Sharma, J.R.; Dadhwal, V.K. Assessment of ecological disturbance in the mangrove forest of Sundarbans caused by cyclones using MODIS time-series data (2001–2011). Nat. Hazards 2015, 79, 775–790. [Google Scholar] [CrossRef]
- Xu, H.Q. A remote sensing index for assessment of regional ecological changes. China Environ. Sci. 2013, 33, 889–897. [Google Scholar]
- Yellow River Conservancy Commission of the Ministry of Water Resources. Yellow River Water Resources Bulletin; Yellow River Conservancy Commission of the Ministry of Water Resources: Zhengzhou, China, 2020. [Google Scholar]
- Chang, J.X.; Wei, J.; Wang, Y.M.; Yuan, M.; Guo, J.C. Precipitation and runoff variations in the Yellow River Basin of China. J. Hydroinformatics 2017, 19, 138–155. [Google Scholar] [CrossRef]
- Kong, D.X.; Miao, C.Y.; Wu, J.W.; Duan, Q.Y. Impact assessment of climate change and human activities on net runoff in the Yellow River Basin from 1951 to 2012. Ecol. Eng. 2016, 91, 566–573. [Google Scholar] [CrossRef]
- Chen, Y.; Wu, L.Z.; Liu, F.G.; Shen, Y.J. Changes of stream flow and precipitation in the Upper Stream of Yellow River during the past 60 years. Arid. Land Geogr. 2022, 1–15. Available online: https://kns.cnki.net/kcms/detail/65.1103.X.20220127.1139.001.html (accessed on 28 January 2022).
- Shao, Q.Q.; Fan, J.W.; Liu, J.; Huang, L.; Cao, W.; Xu, X.L.; Ge, J.S.; Wu, D.; Li, Z.Q.; Gong, G.L.; et al. Assessment on the effects of the first-stage ecological conservation and restoration project in Three-River region. Acta Geogr. Sin. 2016, 71, 3–20. [Google Scholar]
- Wu, D.; Cao, W.; Huang, L.; Huhe, T.L. Ecological effects assessment of the Natural Forest Protection Project. J. Yangtze River Sci. Res. Inst. 2022, 1–9. Available online: https://kns.cnki.net/kcms/detail/42.1171.TV.20220113.1033.004.html (accessed on 13 January 2022).
- Huang, L.; Zhu, P.; Cao, W. The impacts of the Grain for Green Project on the trade-off and synergy relationships among multiple ecosystem services in China. Acta Ecol. Sin. 2021, 41, 1178–1188. [Google Scholar]
- Zhang, H.Y.; Fan, J.W.; Shao, Q.Q. Land use/land cover change in the grassland restoration program areas in China, 2000–2010. Prog. Geogr. 2015, 34, 840–853. [Google Scholar]
- Li, Q.Q.; Cao, Y.P.; Miao, S.L. Spatio-temporal variation in vegetation coverage and its response to climate factors in the Yellow River Basin, China. Acta Ecol. Sin. 2022, 42, 1–14. Available online: https://kns.cnki.net/kcms/detail/11.2031.Q.20220110.1104.032.html (accessed on 10 January 2022).
- Huang, J.P.; Zhang, G.L.; Yu, H.P.; Wang, S.S.; Guan, X.D.; Ren, Y. Characteristics of climate change in the Yellow River basin during recent 40 years. J. Hydraul. Eng. 2020, 51, 1048–1058. [Google Scholar]
- Han, C.L.; Shen, Y.J.; Wu, L.Z.; Guo, Y.; Chen, X.L. Spatial and temporal variation characteristics of cultivated land in the upper Yellow River from 2002 to 2018 based on time series MODIS. Chin. J. Eco-Agric. 2021, 29, 1940–1951. [Google Scholar]
- Yang, Z.K.; Tian, J.; Li, W.Y.; Su, W.R.; Guo, R.Y.; Liu, W.J. Spatio-temporal pattern and evolution trend of ecological environment quality in the Yellow River Basin. Acta Ecol. Sin. 2021, 41, 7627–7636. [Google Scholar]
- Mou, X.J.; Zhang, X.; Wang, X.H.; Wang, J.N.; Rao, S.; Huang, J.; Rao, H.X. Ecological Change Assessment and Protection Strategy in the Yellow River Basin. Strateg. Study CAE 2022, 24, 113–121. [Google Scholar] [CrossRef]
- Wang, T.; Gao, F.; Wang, B.; Wang, P.L.; Wang, Q.H.; Song, H.L.; Yin, C.H. Status and suggestions on ecological protection and restoration of Qilian Mountains. J. Glaciol. Geocryol. 2017, 39, 229–234. [Google Scholar]
- Pang, B.L.; Cui, L.J.; Ma, M.Y.; Li, W. Evaluation of Ecosystem Services Valuation of Alpine Wetlands in Zoigê Plateau. Wetl. Sci. 2014, 12, 273–278. [Google Scholar]
- Liu, G.B.; Shangguan, Z.P.; Yao, W.Y.; Yang, Q.K.; Zhao, M.J.; Dang, X.H.; Guo, M.H.; Wang, G.L.; Wang, B. Ecological Effects of soil retention in Loess Plateau. Bull. Chin. Acad. Sci. 2017, 32, 11–19. [Google Scholar]
- Zhang, Y.W. Analysis of hydrological regime change and ecological runoff over Lanzhou of Yellow River in recent 60 years. Shanxi Water Resour. 2021, 11, 72–73, 77. [Google Scholar]
- Shao, Q.Q.; Liu, S.C.; Ning, J.; Liu, G.B.; Yan, F.; Zhang, X.Y.; Niu, L.N.; Huang, H.B.; Fan, J.W.; Liu, J.Y. Remote sensing assessment of ecological benefits of ecosystems after the implementation of national key ecological projects in China in the past 20 years. Acta Geogr. Sin. 2022; in the review. [Google Scholar]
- Liu, J.Y.; Kuang, W.H.; Zhang, Z.X.; Xu, X.L.; Qin, Y.W.; Ning, J.; Zhou, W.C.; Zhang, S.W.; Li, R.D.; Yan, C.Z.; et al. Spatiotemporal characteristics, patterns and causes of land use changes in China since the late 1980s. Acta Geogr. Sin. 2014, 69, 3–14. [Google Scholar] [CrossRef]
- Xu, X.L.; Liu, J.Y.; Zhang, S.W.; Li, R.D.; Yan, C.Z.; Wu, S.X. China’s Multi-Period Land Use Land Cover Remote Sensing Monitoring Dataset (CNLUCC). Data Registration and Publishing System of the Resource and Environmental Science Data Center of the Chinese Academy of Sciences. 2018. Available online: http://www.resdc.cn/DOI/doi.aspx?DOIid=54 (accessed on 20 April 2022).
- Liu, J.Y.; Shao, Q.Q.; Yu, X.B.; Huang, H.Q. Integrated Monitoring and Assessment of Terrestrial Ecosystems in China; The Science Press: Beijing, China, 2016. [Google Scholar]
- Fan, J.W.; Zhong, H.P.; Harris, W.; Yu, G.R.; Wang, S.Q.; Hu, Z.M.; Yue, Y.Z. Carbon storage in the grasslands of China based on field measurements of above- and below-ground biomass. Clim. Change 2008, 86, 375–396. [Google Scholar] [CrossRef]
- Liu, G.B.; Shao, Q.Q.; Fan, J.W.; Ning, J.; Rong, K.; Huang, H.B.; Liu, S.C.; Zhang, X.Y.; Niu, L.N.; Liu, J.Y. Change Trend and Restoration Potential of Vegetation Net Primary 2 Productivity in China over the Past 20 Years. Remote Sens. 2022, 14, 1634. [Google Scholar] [CrossRef]
- Shao, Q.Q.; Fan, J.W. Monitoring and Evaluating the Ecological Benefits of Ecological Protection and Construction Projects in Three-River; Science Press: Beijing, China, 2018. [Google Scholar]
- Peng, S.Z.; Ding, Y.X.; Liu, W.Z.; Li, Z. 1 km monthly temperature and precipitation dataset for China from 1901 to 2017. Earth Syst. Sci. Data 2019, 11, 1931–1946. [Google Scholar] [CrossRef] [Green Version]
- Peng, S.Z.; Ding, Y.X.; Wen, Z.M.; Chen, Y.M.; Cao, Y.; Ren, J.Y. Spatiotemporal change and trend analysis of potential evapotranspiration over the Loess Plateau of China during 2011–2100. Agric. For. Meteorol. 2017, 233, 183–194. [Google Scholar] [CrossRef] [Green Version]
- Zhou, W.Z.; Liu, G.H.; Pan, J.J. Soil available water capacity and it is empirical and statistical models. J. Arid. Land Resour. Environ. 2003, 17, 88–95. [Google Scholar]
- Wischmeier, W.H.; Smith, D.D. Predicting Rainfall Erosion Losses: A guide to Conservation Planning; U.S. Department of Agriculture: Washington, DC, USA, 1978.
- Williams, J.R. The erosion-productivity impact calculator (EPIC) model: A case history. Philos. Trans. Biol. Sci. 1990, 329, 421–428. [Google Scholar]
- Zhang, K.L.; Shu, A.P.; Xu, X.L.; Yang, Q.K.; Yu, B. Soil erodibility and its estimation for agricultural soils in China. J. Arid. Environ. 2008, 72, 1002–1011. [Google Scholar] [CrossRef]
- McCool, D.K.; Brown, L.C.; Foster, G.R.; Mutchler, C.K.; Meyer, L.D. Revised slope steepness factor for the Universal Soil Loss Equation. Trans. ASAE 1987, 30, 1387–1396. [Google Scholar] [CrossRef]
- Liu, B.Y.; Nearing, M.A.; Risse, L.M. Slope gradient effects on soil loss for steep slopes. Trans. ASAE 1994, 37, 1835–1840. [Google Scholar] [CrossRef]
- Fryrear, D.F.; Bilbro, J.D.; Saleh, A.; Schomberg, H.; Stout, J.E.; Zobeck, T.M. RWEQ: Improved wind erosion technology. J. Soil Water Conserv. 2000, 55, 183–189. [Google Scholar]
- Cheng, H.; Zou, X.Y.; Zhang, C.L. A study on the relationship between friction wind velocity and mean wind velocity. Res. Soil Water Conserv. 2007, 14, 133–138. [Google Scholar]
- Zheng, D. Study on Eco-Geographical Regional System in China; The Commercial Press: Beijing, China, 2008. [Google Scholar]
- Evans, J.; Roland, G. Discrimination between climate and human-induced dryland degradation. J. Arid. Environ. 2004, 57, 535–554. [Google Scholar] [CrossRef]
- Gao, S.Y.; Zhang, C.L.; Zou, X.Y.; Wu, Y.Q.; Shi, S.; Li, H.D. Benefits of Beijing-Tianjin Sand Source Control Engineering; The Science Press: Beijing, China, 2008. [Google Scholar]
- Wu, L.Z.; Bai, T.; Li, Q.; Jin, W.T.; Huang, Q. Research on potential of water and sediment regulation of cascade reservoir group in upper reaches of Yellow river. J. Water Resour. Water Eng. 2016, 27, 130–133. [Google Scholar]
- Jin, W.T.; Wang, Y.M.; Bai, T.; Shi, J.T. Analysis of joint regulation of water and sediment and reasonable storage of cascade reservoirs of upper Yellow River. Hydro-Sci. Eng. 2018, 6, 19–29. [Google Scholar]
- Zhang, L.; Huang, J.P.; Liang, J.N.; Yu, H.P.; Guan, X.D.; Ma, J.Z.; Shen, Y.Y.; Deng, J.M.; Huang, N.; Meng, X.M.; et al. Impact of climate change on the Yellow River Basin and response. Sci. Technol. Rev. 2020, 38, 42–51. [Google Scholar]
- Tian, S.M.; Han, B.; Liang, S.; Wang, W.W.; Cao, Y.T. Discussion on water retention capacity in the source area of the Yellow River. Hydro-Sci. Eng. 2022, 1, 19–27. [Google Scholar]
- Three-River Source National Park; Qinghai Meteorological Bureau. Ecological Meteorological Bulletin of Three-River Source National Park in 2019. Available online: http://www.gov.cn/xinwen/2020-04/29/content_5507276.htm (accessed on 20 April 2022).
- Qiu, Y.S.; Ma, C.C.; Jiang, T.J. Study on Urban Ecological Restoration Planning of Gully Region on Loess Plateau—A Case Study of Qingyang City in Gansu Province; China Architecture & Building Press: Beijing, China, 2018; pp. 951–958. [Google Scholar]
- Zhang, G.Q.; Chai, Y.Y.; Zhao, H.F. Actural conditions of soil and water erosion, ecology and contral measure in the drainage area of Huangshui River. J. Northwest For. Univ. 2007, 22, 70–72. [Google Scholar]


| Category | Index | |
|---|---|---|
| First-Level | Second-Level | |
| Ecosystem macrostructure | Area of ecosystem | Classified area of ecosystem |
| Rate of change | ||
| Ecosystem quality | Net primary productivity (NPP) | NPP |
| Fractional vegetation cover (FVC) | FVC | |
| Ecosystem services | Water retention | Water retention |
| Soil retention | Soil erosion modulus | |
| soil retention | ||
| Windbreak and sand fixation | Wind erosion modulus | |
| Windbreak and sand fixation | ||
| Judgement Basis | Judgement Result | |
|---|---|---|
| 2000–2010 | 2010–2019 | Overall Restoration Tendency from 2000 to 2019 |
| Improved | Improved | Continuously improved |
| Improved | Worsened | Continuously worsened |
| Remained stable | Remained stable | Continuously remained stable |
| Improved | Worsened | First improved and then worsened |
| Improved | Remained stable | First improved and then remained stable |
| Worsened | Improved | First worsened and then improved |
| Worsened | Remained stable | First worsened and then remained stable |
| Remained stable | Improved | First remained stable and then improved |
| Remained stable | Worsened | First remained stable and then worsened |
| Ecological Restoration Degree | Judgement Condition 1 |
|---|---|
| Basically remained stable | Si ≥ 3 |
| Slightly worsened | Si < 3 and Wi = 2 |
| Moderately worsened | Si < 3 and Wi = 3 |
| Significantly worsened | Si < 3 and Wi ≥ 4 |
| Extremely improved ecological restoration degree | Bi ≥ 4 |
| Strongly improved ecological restoration degree | Bi = 3 |
| Moderately improved ecological restoration degree | Si < 3 and Wi < 2 and Bi = 2 |
| Some elements improved while some elements worsened | Si < 3 and Wi < 2 and Bi = 1 |
| Ecosystem Service | 2000–2010 | 2010–2019 | 2000–2019 | |
|---|---|---|---|---|
| Water retention | Water retention per unit area (m3·hm−2·a−1) | 786.82 | 869.47 | 825.76 |
| Total amount of water conserved (×108 m3·a−1) | 336.79 | 372.16 | 353.45 | |
| Soil retention | Soil erosion modulus per unit area (t·hm−2·a−1) | 9.69 | 9.93 | 9.85 |
| Total soil erosion modulus amount (×108 t·a−1) | 3.65 | 3.75 | 3.71 | |
| Soil retention per unit area (t·hm−2·a−1) | 19.18 | 27.13 | 22.81 | |
| Total amount of soil conserved (×108 t·a−1) | 7.23 | 10.23 | 8.6 | |
| Windbreak and sand fixation | Wind erosion modulus per unit area (t·hm−2·a−1) | 9.28 | 4.89 | 6.99 |
| Total wind erosion modulus amount (×108 t·a−1) | 3.97 | 2.09 | 2.99 | |
| Windbreak and sand fixation per unit area (·hm−2·a−1) | 21.6 | 17.05 | 19.04 | |
| Total windbreak and sand fixation amount (×108 t·a−1) | 9.25 | 7.3 | 8.15 | |
| Restoration Tendency | FVC Area Ratio (%) | NPP Area Ratio (%) | Water Retention Area Ratio (%) | Soil Retention Area Ratio (%) | Windbreak and Sand Fixation Area Ratio (%) |
|---|---|---|---|---|---|
| Continuously improving | 25.3 | 55.1 | 28.0 | 10.4 | 2.2 |
| Continuously worsening | 3.7 | 0.1 | 2.4 | 0 | 20.9 |
| Remaining stable | 13.2 | 13.1 | 20.1 | 66.4 | 47.0 |
| First improving and then worsening | 15.2 | 1.7 | 17.6 | 0.89 | 2.0 |
| First improving and then remaining stable | 12.1 | 16.3 | 13.3 | 6.2 | 1.6 |
| First worsening and then improving | 6.4 | 1.2 | 1.4 | 0.3 | 6.7 |
| First worsening and then remaining stable | 3.8 | 0.3 | 0.7 | 0 | 10.7 |
| First remaining stable and then improving | 11.6 | 11.5 | 15.3 | 15.8 | 4.8 |
| First remaining stable and then worsening | 8.8 | 0.7 | 1.2 | 0.1 | 4.2 |
| Ecological Restoration Degree Change | Area Ratio of Zone I (%) | Area Ratio of Zone II (%) | Area Ratio of Zone III (%) |
|---|---|---|---|
| Basically remained stable | 24.5 | 16.9 | 16.0 |
| Slightly worsened | 6.3 | 3.4 | 1.6 |
| Moderately worsened | 0.8 | 0.3 | 0.1 |
| Significantly worsened | 0 | 0 | 0 |
| Extremely improved ecological restoration degree | 3.4 | 2.6 | 0.2 |
| Strongly improved ecological restoration degree | 20.3 | 21.9 | 22.5 |
| Moderately improved ecological restoration degree | 30.8 | 35.4 | 36.4 |
| Some elements improved while some elements worsened | 13.9 | 19.5 | 23.1 |
| Zone | Changes in NPP | Changes in the Soil Erosion Modulus | ||
|---|---|---|---|---|
| Human Activities (%) | Climate Factors (%) | Human Activities (%) | Climate Factors (%) | |
| Upper Yellow River | 18.4 | 81.6 | 22.4 | 77.6 |
| Zone I | 14.6 | 85.4 | 22.8 | 77.2 |
| Zone II | 23.7 | 76.3 | 24.0 | 76.0 |
| Zone III | 24.5 | 75.5 | 16.2 | 83.8 |
Publisher’s Note: MDPI stays neutral with regard to jurisdictional claims in published maps and institutional affiliations. |
© 2022 by the authors. Licensee MDPI, Basel, Switzerland. This article is an open access article distributed under the terms and conditions of the Creative Commons Attribution (CC BY) license (https://creativecommons.org/licenses/by/4.0/).
Share and Cite
Liu, S.; Shao, Q.; Ning, J.; Niu, L.; Zhang, X.; Liu, G.; Huang, H. Remote-Sensing-Based Assessment of the Ecological Restoration Degree and Restoration Potential of Ecosystems in the Upper Yellow River over the Past 20 Years. Remote Sens. 2022, 14, 3550. https://doi.org/10.3390/rs14153550
Liu S, Shao Q, Ning J, Niu L, Zhang X, Liu G, Huang H. Remote-Sensing-Based Assessment of the Ecological Restoration Degree and Restoration Potential of Ecosystems in the Upper Yellow River over the Past 20 Years. Remote Sensing. 2022; 14(15):3550. https://doi.org/10.3390/rs14153550
Chicago/Turabian StyleLiu, Shuchao, Quanqin Shao, Jia Ning, Linan Niu, Xiongyi Zhang, Guobo Liu, and Haibo Huang. 2022. "Remote-Sensing-Based Assessment of the Ecological Restoration Degree and Restoration Potential of Ecosystems in the Upper Yellow River over the Past 20 Years" Remote Sensing 14, no. 15: 3550. https://doi.org/10.3390/rs14153550
APA StyleLiu, S., Shao, Q., Ning, J., Niu, L., Zhang, X., Liu, G., & Huang, H. (2022). Remote-Sensing-Based Assessment of the Ecological Restoration Degree and Restoration Potential of Ecosystems in the Upper Yellow River over the Past 20 Years. Remote Sensing, 14(15), 3550. https://doi.org/10.3390/rs14153550