Article

Modeling Spatiotemporal Patterns of Land Use/Land Cover Change in Central Malawi Using a Neural Network Model

1
Department of Geography, The University of Alabama, Tuscaloosa, AL 35405, USA
2
Department of Geography, Environment, and Spatial Sciences, Michigan State University, East Lansing, MI 48824, USA
3
Center for Global Change and Earth Observations, Michigan State University, East Lansing, MI 48823, USA
4
Department of Plant, Soil and Microbial Sciences, Michigan State University, East Lansing, MI 48824, USA
5
International Maize and Wheat Improvement Center (CIMMYT), Carretera México-Veracruz Km. 45, El Batán, Texcoco C.P. 56237, Mexico
*
Author to whom correspondence should be addressed.
Remote Sens. 2022, 14(14), 3477; https://doi.org/10.3390/rs14143477
Submission received: 17 May 2022 / Revised: 29 June 2022 / Accepted: 14 July 2022 / Published: 20 July 2022

Abstract

:
We examine Land Use Land Cover Change (LULCC) in the Dedza and Ntcheu districts of Central Malawi and model anthropogenic and environmental drivers. We present an integrative approach to understanding heterogenous landscape interactions and short- to long-term shocks and how they inform future land management and policy in Malawi. Landsat 30-m satellite imagery for 2001, 2009, and 2019 was used to identify and quantify LULCC outcomes based on eight input classes: agriculture, built-up areas, barren, water, wetlands, forest-mixed vegetation, shrub-woodland, and other. A Multilayer Perceptron (MLP) neural network was developed to examine land-cover transitions based on the drivers; elevation, slope, soil texture, population density and distance from roads and rivers. Agriculture is projected to dominate the landscape by 2050. Dedza has a higher probability of future land conversion to agriculture (0.45 to 0.70) than Ntcheu (0.30 to 0.45). These findings suggest that future land management initiatives should focus on spatiotemporal patterns in land cover and develop multidimensional policies that promote land conservation in the local context.

1. Introduction

Global ecosystem services are finite resources stressed by global environmental change with pressures from both natural processes and human activities [1]. According to the United Nations World Population Report, nearly 55% of the world population lives in urban areas, while a significant percentage (90%) of Sub-Saharan Africans (SSA) live in rural areas [2]. Most of Africa’s population is dependent on the land for subsistence farming, small human settlements, and raw materials from forests [3]. Malawi’s 9.4 million hectares (ha) of land exemplifies these concerns and national environmental resources face increasing pressures [4]. In Malawi, 61.4% of all land is in agricultural production [5] accounting for over 38% of Malawi’s Gross Domestic Product (GDP) and providing livelihoods for 85% of Malawi’s population, which is largely smallholder farmers [1].
More than 1.6 million smallholder farmers in Malawi grow maize as the primary crop, cultivating an average of 0.4 hectares of land [1]. Regular droughts, as well as limited availability of input resources for soil amendments exacerbated by over-cultivation of soils, threaten crop yields [6,7,8,9]. Moreover, the high demand for forest products and lack of energy alternatives to firewood and charcoal have contributed to deforestation, and forest and land degradation [10]. Land-tenure insecurity also remains a challenge along with the slow implementation of land reforms [11].
The government of Malawi has applied short- and long-term localized-national strategies (labeled the Malawi Growth and Development Strategy (MGDS)) to advance agricultural development aimed at food and nutrition security, as well as improving economic growth and infrastructure development [12,13]. Recently, the Malawi government launched the Vision 2063 plan, the end of which corresponds to 100 years of self-governance in Malawi. Vision 2063 commits to addressing the interconnected challenges through improved governance in land tenure systems and sustainable land management, emphasizing the role of public–private partnerships and transformations through investments in community engagement [12,13].
Land cover and land use are inherently coupled. To capture these related systems, indicators of anthropogenic changes are often quantified in the form of land use land cover (LULC) change trajectories using remote sensing imagery as well as models of driving factors and predicted land-cover changes [14,15,16,17]. Methodological advances enable the integration of imagery and underlying drivers. For example, Markov Chains embedded within diverse statistical models are good predictors of the probability of land cover change [18,19,20]. Advanced computation, such as Cellular Automata-Markov chain spatial modeling, predicts changes using a set of replicable rules, and are robust approaches when applied together more so than individually [21,22,23].
Previous studies that have utilized robust statistical techniques and algorithms in land use retrieval include the use of the support vector machine (SVM) algorithm to identify non-linear relationships in land use/land cover change for rural to urban transition in Hyderabad, Pakistan [24]; the use of integrated approaches, including landscape fragmentation, machine learning algorithm and fuzzy logic model to determine built-up expansion probability in English Bazar Block, West Bengal, India [25]; as well as the use of multiple classifiers (SVM, Maximum Likelihood (ML) and Random Forest (RF) with multi-modal imageries (Sentinel-1 and Sentinel-2) to understand unique spatial landscape features such as natural resource distribution, human settlements and cultural landscapes in the Sahel region of Niamey, Niger [26].
Recently, studies using Multilayer Perceptron (MLP), a neural networking model together with Markov Chain (MC) to model spatiotemporal land-cover change based on driving factors such as socio-environmental variables across landscapes have emerged. One study used an MLP-MC predictive model to analyze dynamic rural landscapes with complex environmental gradients across the Eastern Mediterranean region in Turkey, and the results showed human-induced land conversion as well as positive trends of afforestation [27]. Other studies using predictive models show rapid urban expansion of Jodhpur and Patna in India, respectively [28,29]. Neural networks have been used to show land cover transitions caused by deforestation [30], as well as to model intense urbanization around major historical sites such as the Great Pyramids in Cairo, Egypt to assist decision-makers in sustainable development planning [16].
In Malawi, past studies used LULCC scenario-based analyses to assess the impacts of human activities including management strategies and practices, on forest cover [31,32,33]. Other studies examined spatiotemporal land-cover change in Malawi’s river catchment areas [34,35] or forest-cover change and modeling of carbon emissions crucial for developing national forest monitoring systems and improving REDD+ project design and implementation [36]. Two studies modeled Malawi’s streamflow and sediment transfer in water catchment areas using MLP neural networks [37,38], and recently, [39] developed a CA-Markov Chain model for land-cover changes and predictions for 2025 and 2035 to show an increase in agricultural lands while reporting decreases in other land covers.
Our study attempts to quantify, simulate, and predict spatiotemporal dynamics across two heterogenous landscapes to understand anthropogenic and environmental processes embedding short- and long-term drivers that affect future land management and policy planning in Malawi. We focus on two rural districts in Central Malawi that are similar in many social-environmental aspects but present quite differently. The objectives are: (1) to determine land use and land cover (LULC) change for two districts in central Malawi using three-time epochs (2001, 2009, and 2019), (2) to determine the main drivers of LULC changes in both districts between 2001 and 2019 and (3) to use the observed drivers to simulate and predict future land use and cover scenario for 2050. The outcome from this study gives quantifiable spatial-temporal information that can inform short-medium term policies at the district level to promote sustainable landscape management aligned with Malawi’s Vision 2063.

2. Materials and Methods

2.1. Description of Study Area

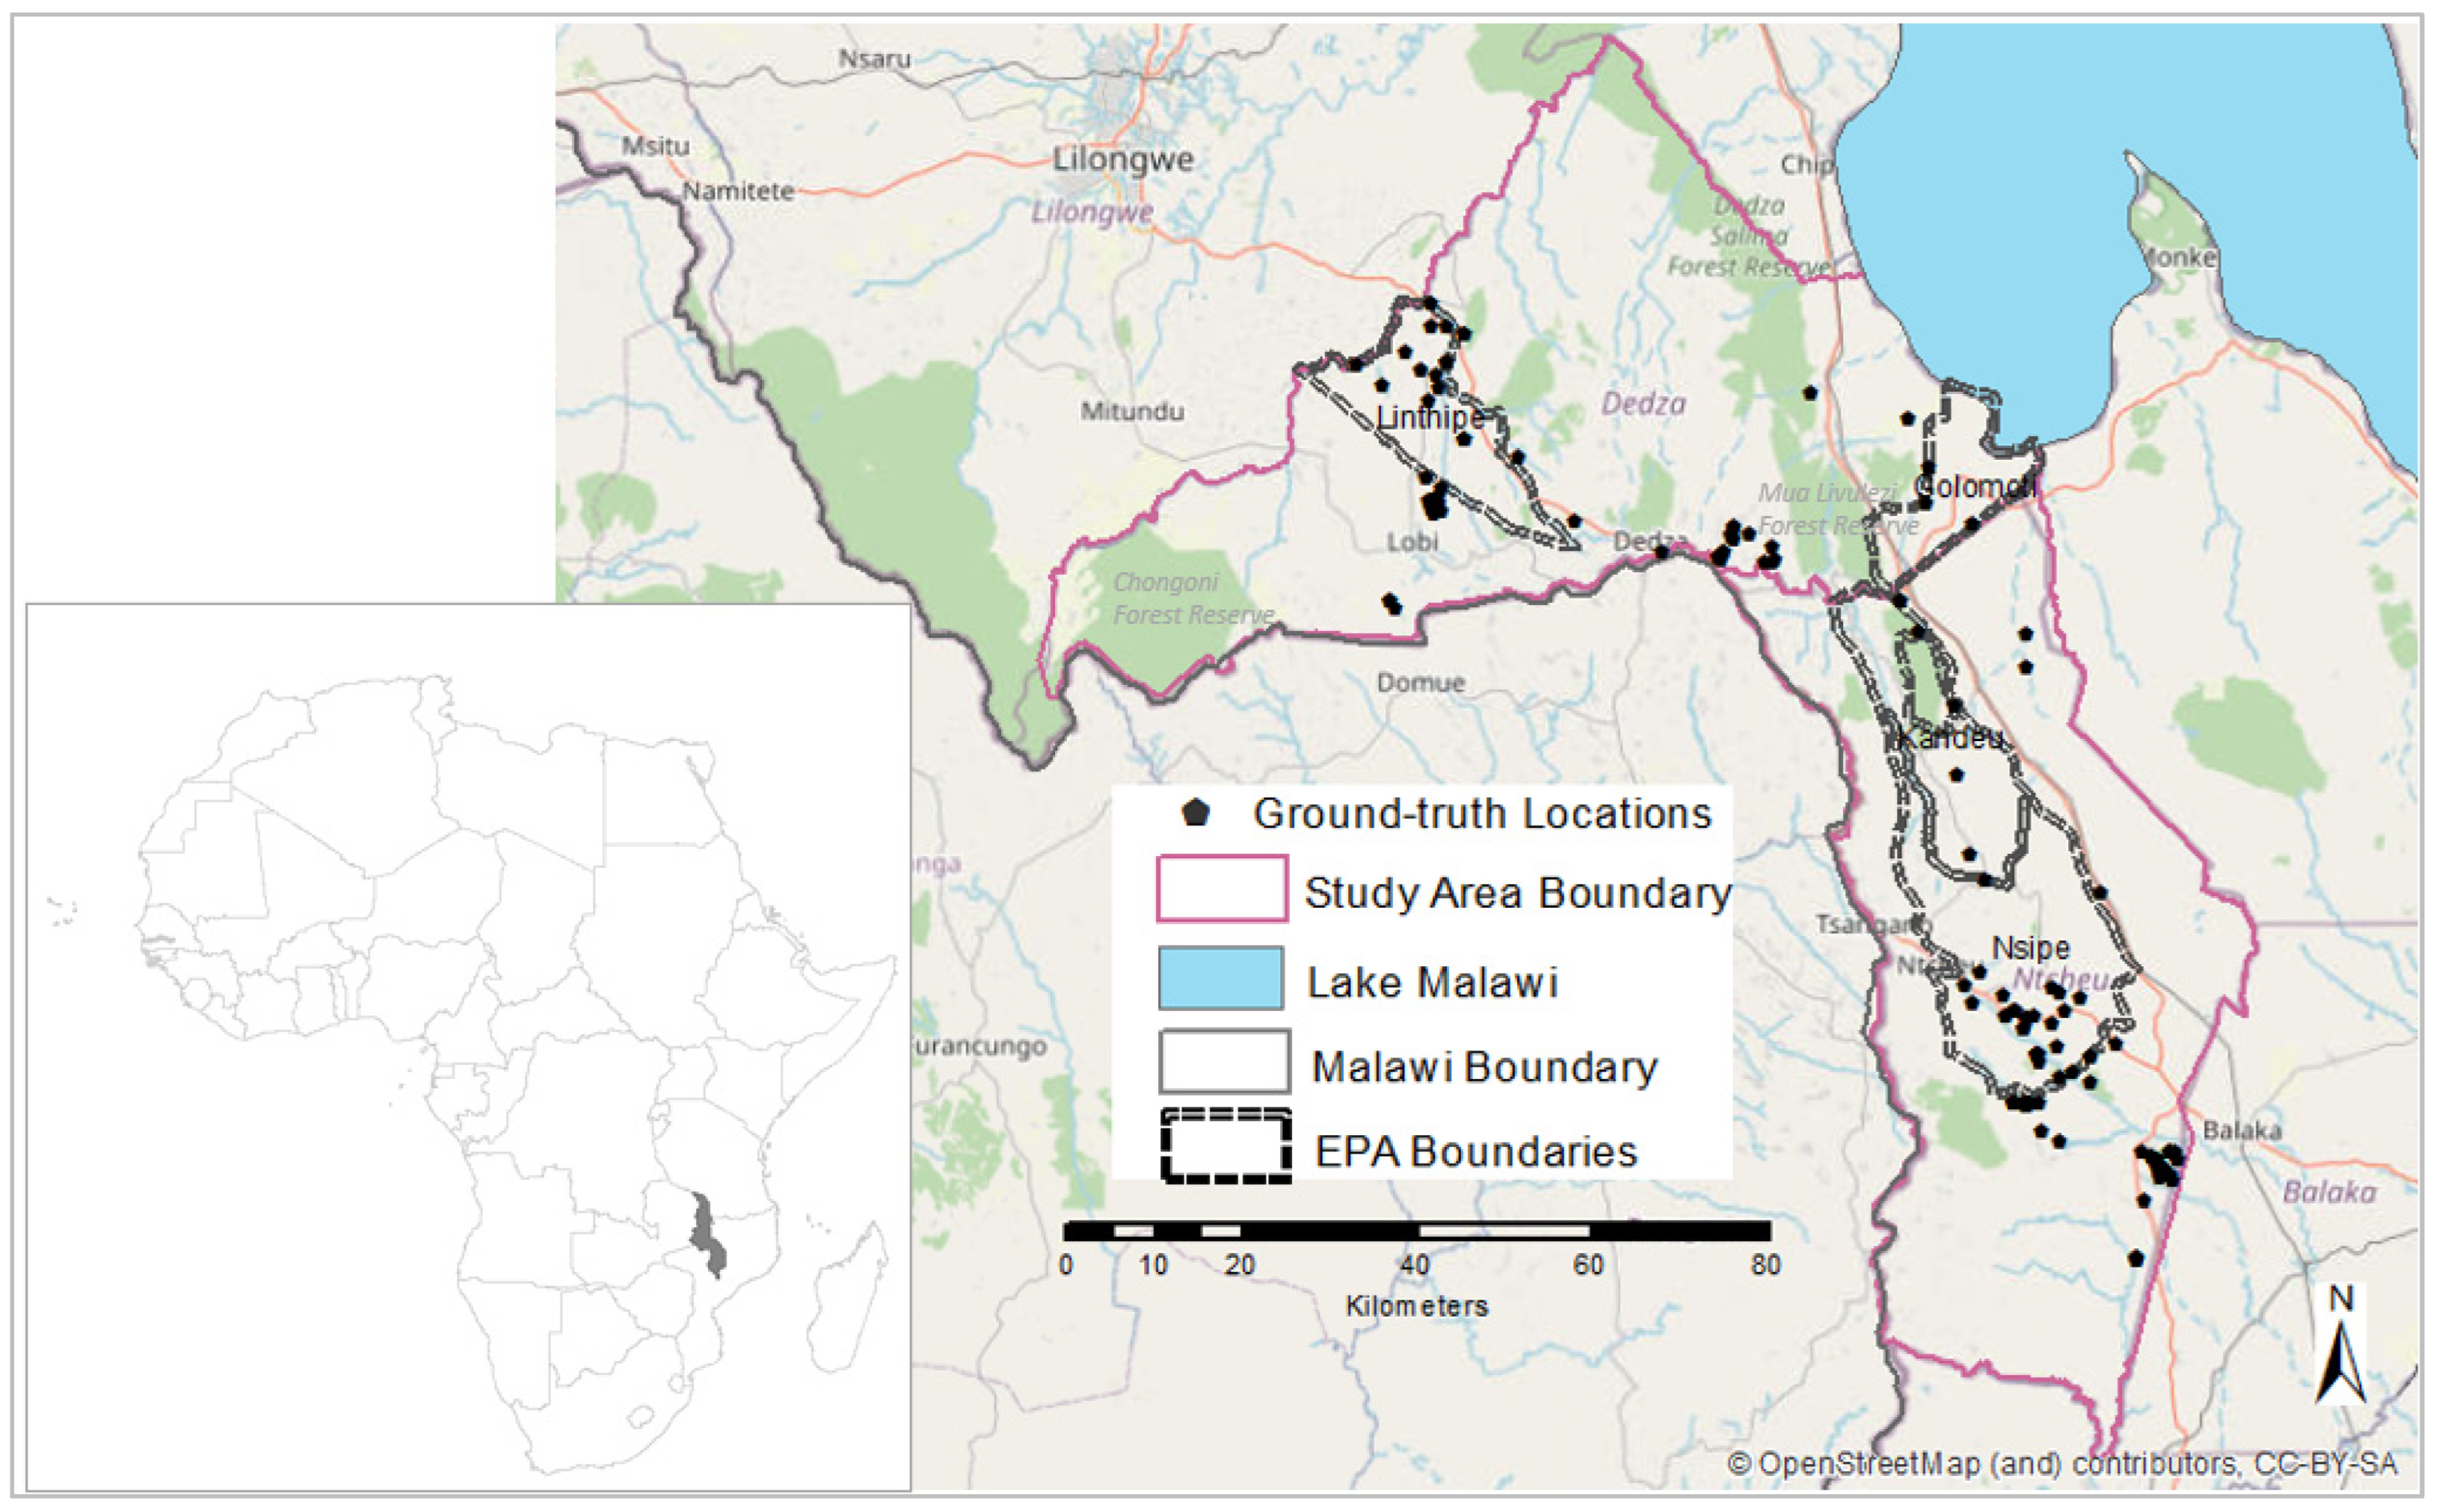
The Dedza and Ntcheu districts are in Central Malawi and adjacent; however simultaneous socio-environmental factors impact their land-cover change trajectories differently justifying the choice of the two districts for this study (see Figure 1).
The Dedza district is larger in area, population size and density, is more mountainous and has a larger share of forest cover, protected forests (reserves in the west, center, and eastern side), and agricultural land use (nearly half of total area); whereas Ntcheu has a more heterogeneous landscape, larger mean farm sizes, and a population that grew faster than Dedza, and had a different set of major project interventions.
Additionally, the two districts were chosen because they were also part of an agriculture research project funded under the Feed the Future initiative of the United States Agency for International Development (USAID) to improve food productivity in maize-mixed farming systems. The primary goal of this project, the Africa Research in Sustainable Intensification for the Next Generation (Africa RISING), was to improve food productivity in maize-mixed farming systems. This project had built a research infrastructure, local knowledge, and data and information that helped to contextualize our study and was a factor in the choice of study districts. Further, although the two districts were similar in an aggregate sense, the four study site communities (Linthipe and Golomoti in Dedza, and Kandeu and Nsipe, in Ntcheu district) were selected under the (Africa RISING) project to maximize both intra- and cross-district variability.
The Dedza district is located approximately 50 miles southeast of Malawi’s capital city, Lilongwe. Population statistics from the Malawi National Statistical Office (NSO) show that in 2019 the population of Dedza, a district of 3754 square kilometers (km2) in area, was approximately 840,000, indicating a density of 221 persons per km2. The region has experienced high annual population growth of 2.8% from 2008 to 2018 [40] partially attributed to an influx of refugees from Mozambique beginning in the mid-1980s, some of whom remained [41].
Dedza comprises smallholder farmers practicing cereal–legume systems consisting mostly of maize, common bean, cassava, millet, rice, sorghum, and tubers (sweet potatoes, Irish potatoes) [40]. Some farmers keep goats, pigs, and poultry [42]. Dedza has a relatively high elevation ranging from 500 m to 1600 m, a mean annual temperature of 18 °C, and mean annual precipitation of 896 mm [40].
The Ntcheu district has a lower population of 660,000, and although its population grew faster than Dedza’s (3.1% annually between 2008 and 2018), its population density was lower at 203 persons per km2 on a smaller land area of 3251 km2 [40]. The district is like Dedza but has a greater variety of integrated crop–livestock systems [42]. Many families also depend on the land for cultivation, livestock grazing, firewood collection and charcoal production. Ntcheu’s elevation range is like Dedza’s, 550 m to 1500 m. The mean temperature and precipitation are like Dedza’s.
Both districts have moderately developed trading centers and a few paved roads (routes M1, M5, M10) connecting each district to the capital city of Lilongwe; however, most farming communities are located in more rural settings. Locally, farmers own or rent one or multiple fields that on average range from 0.58 to 0.91 hectares; however, Ntcheu’s farm sizes are larger than in Dedza (Malawi, National Statistical Office) [40]. Ntcheu has greater landscape heterogeneity with two distinct terrain types; upland areas are mostly located in the west and are mostly covered in natural and mixed vegetation cover while the terrain on the eastern side, is dominated by the Shire River valley that contains fertile alluvial soils [43]. While poverty-count statistics are high for both districts, Ntcheu has a lower share of the population that is poor—56.8% versus 61.7% for Dedza [39].

2.2. Datasets

Remotely sensed Landsat satellite images between 15 August and 1 October (dry season) were collected for each of the three sample years and used to quantify Land Use and Land Cover (LULC) change. The imagery consisted of 2019 Landsat 8 Operational Land Imager (OLI), and 2009 and 2001 Landsat Thermal Infrared Sensor (TIRS) sensor Surface Reflectance Tier 1 images, both produced by the United States Geological Survey (USGS) but sourced through the Google Earth Engine [44] (see Table 1).
The Landsat imagery products were already atmospherically corrected and radiometrically calibrated. Cloud-free imagery was derived by masking cloud pixels by using the Landsat cloud quality metadata. Each image collection (15 August to 1 October) was composited, and the median values were applied to each stacked collection, resulting in 3 groups of 3 monthly composite surface reflectance images for 2001, 2009 and 2019. The administrative boundaries for the Dedza and Ntcheu districts were obtained from the Food and Agriculture Organization of the United Nations (FAO-UN), Global Administrative Unit Layer (GAUL), a second-level administrative units’ dataset.
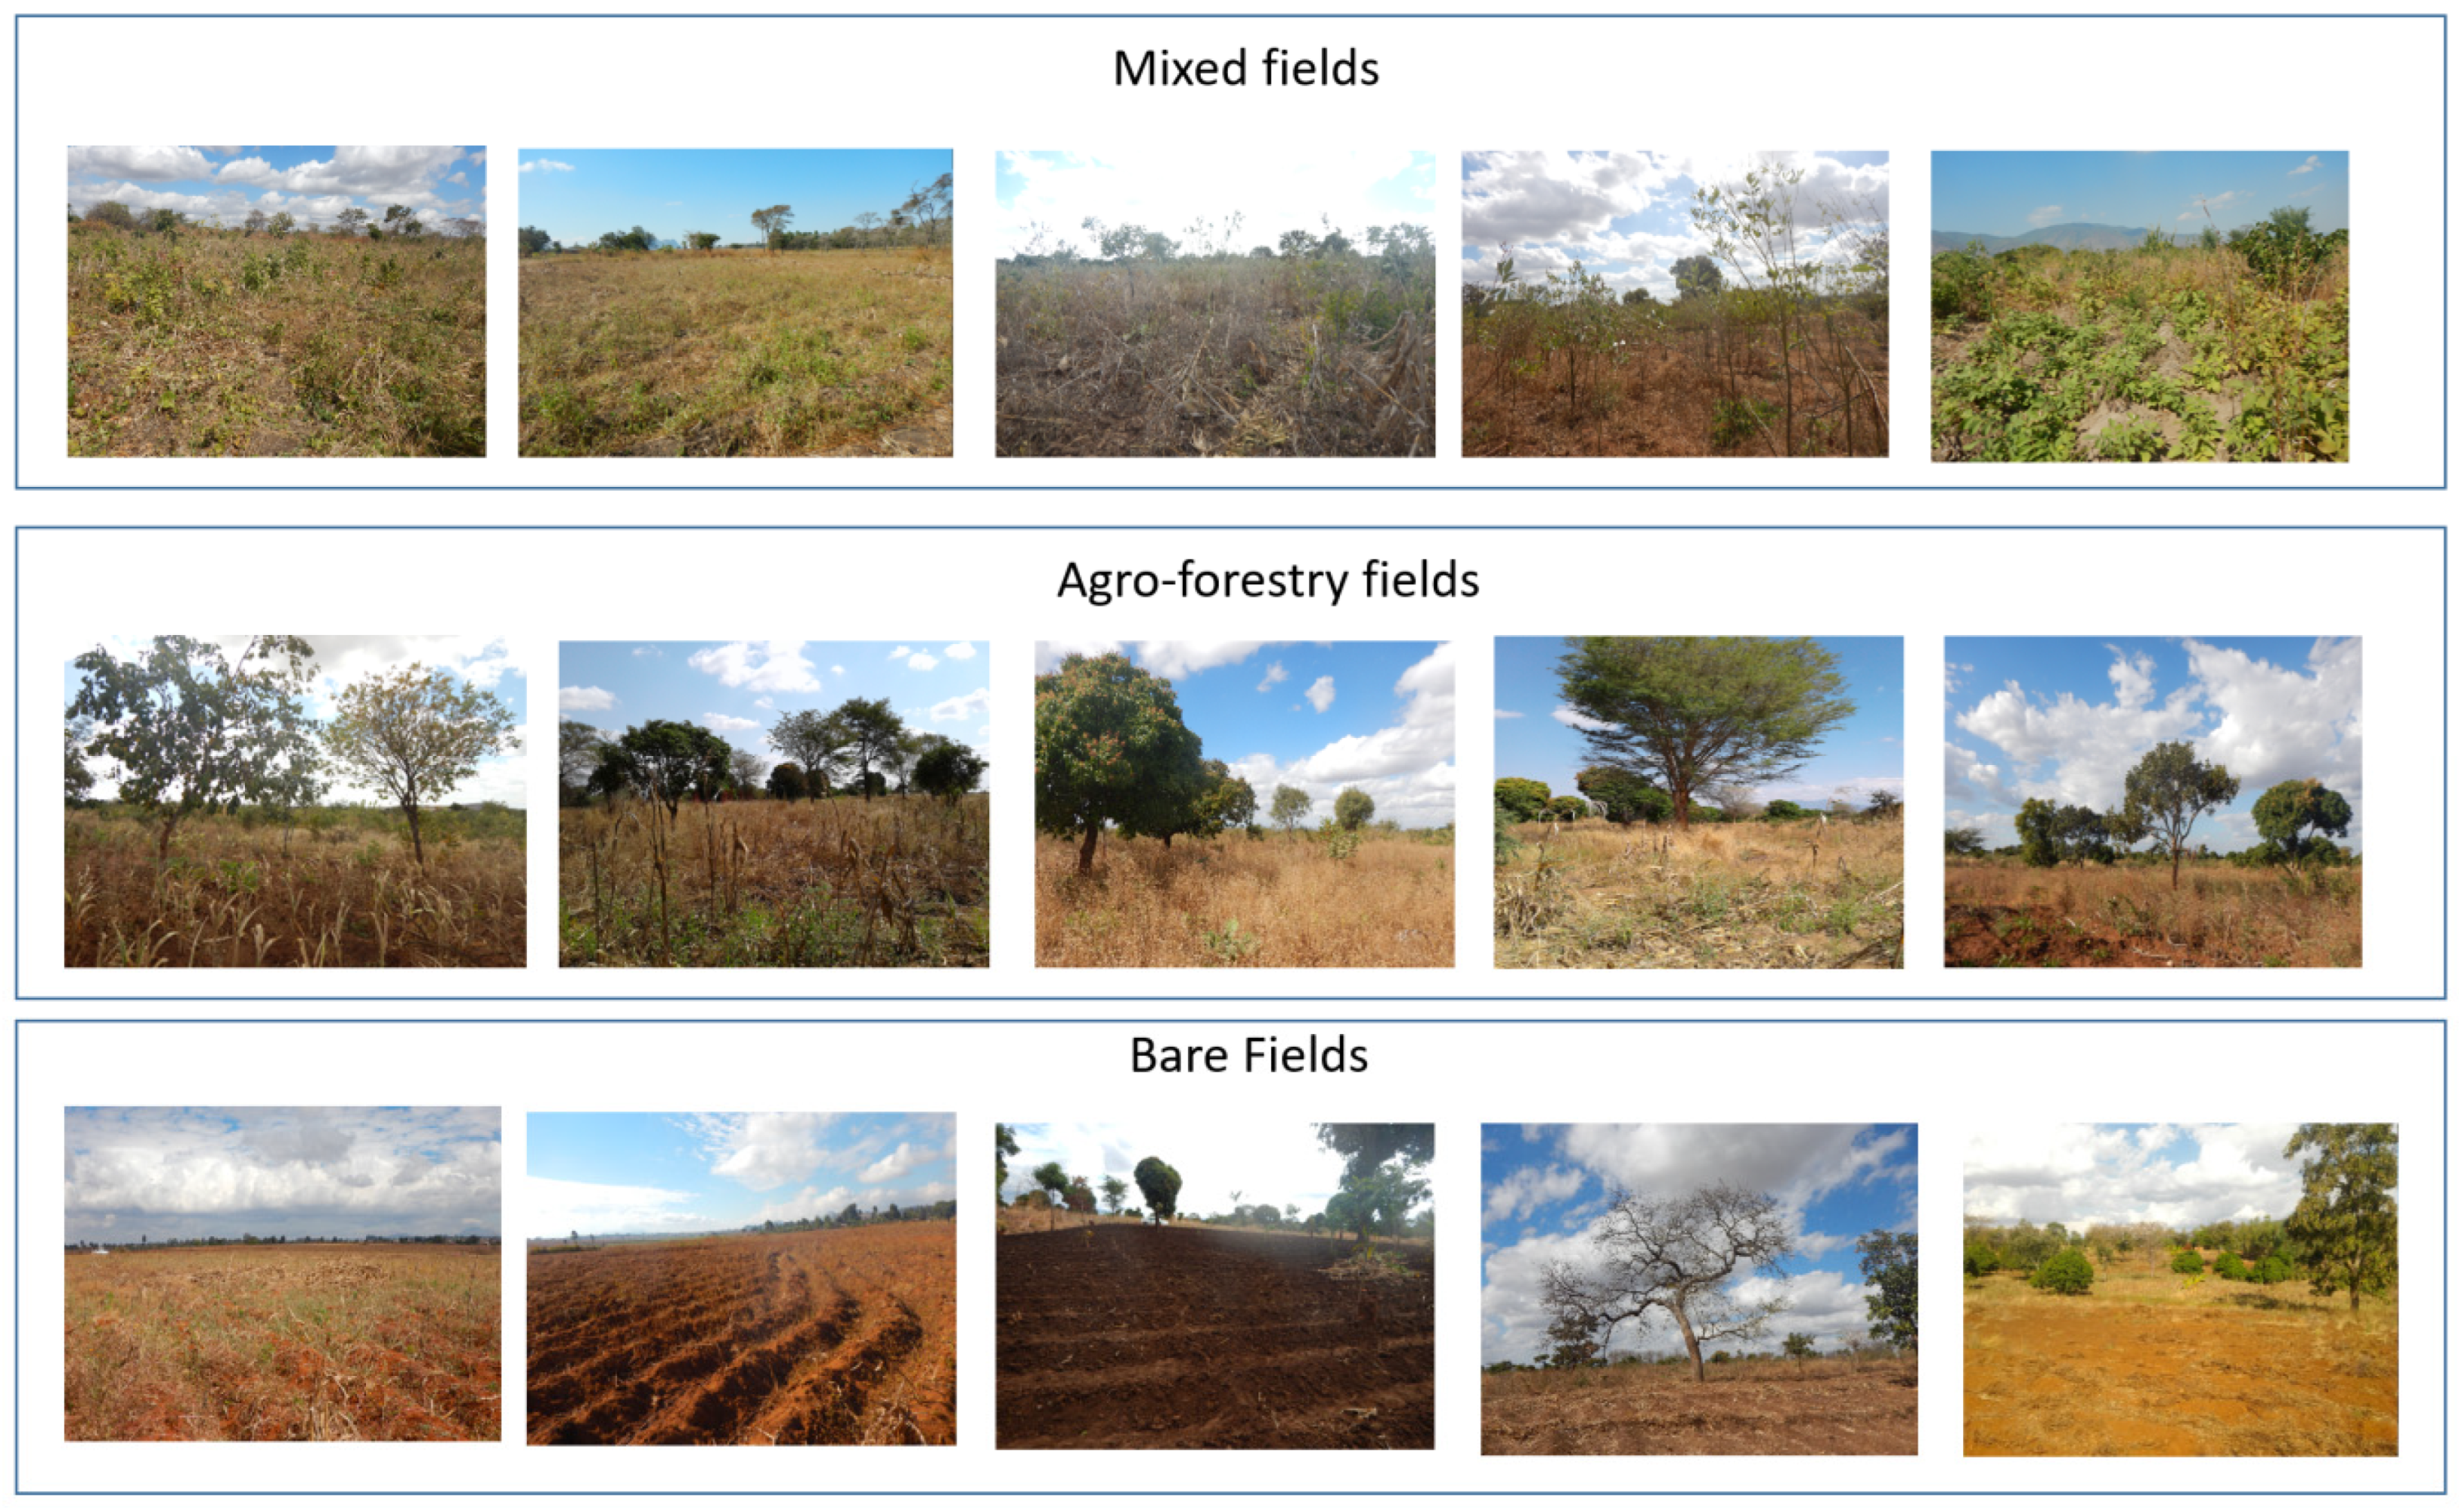
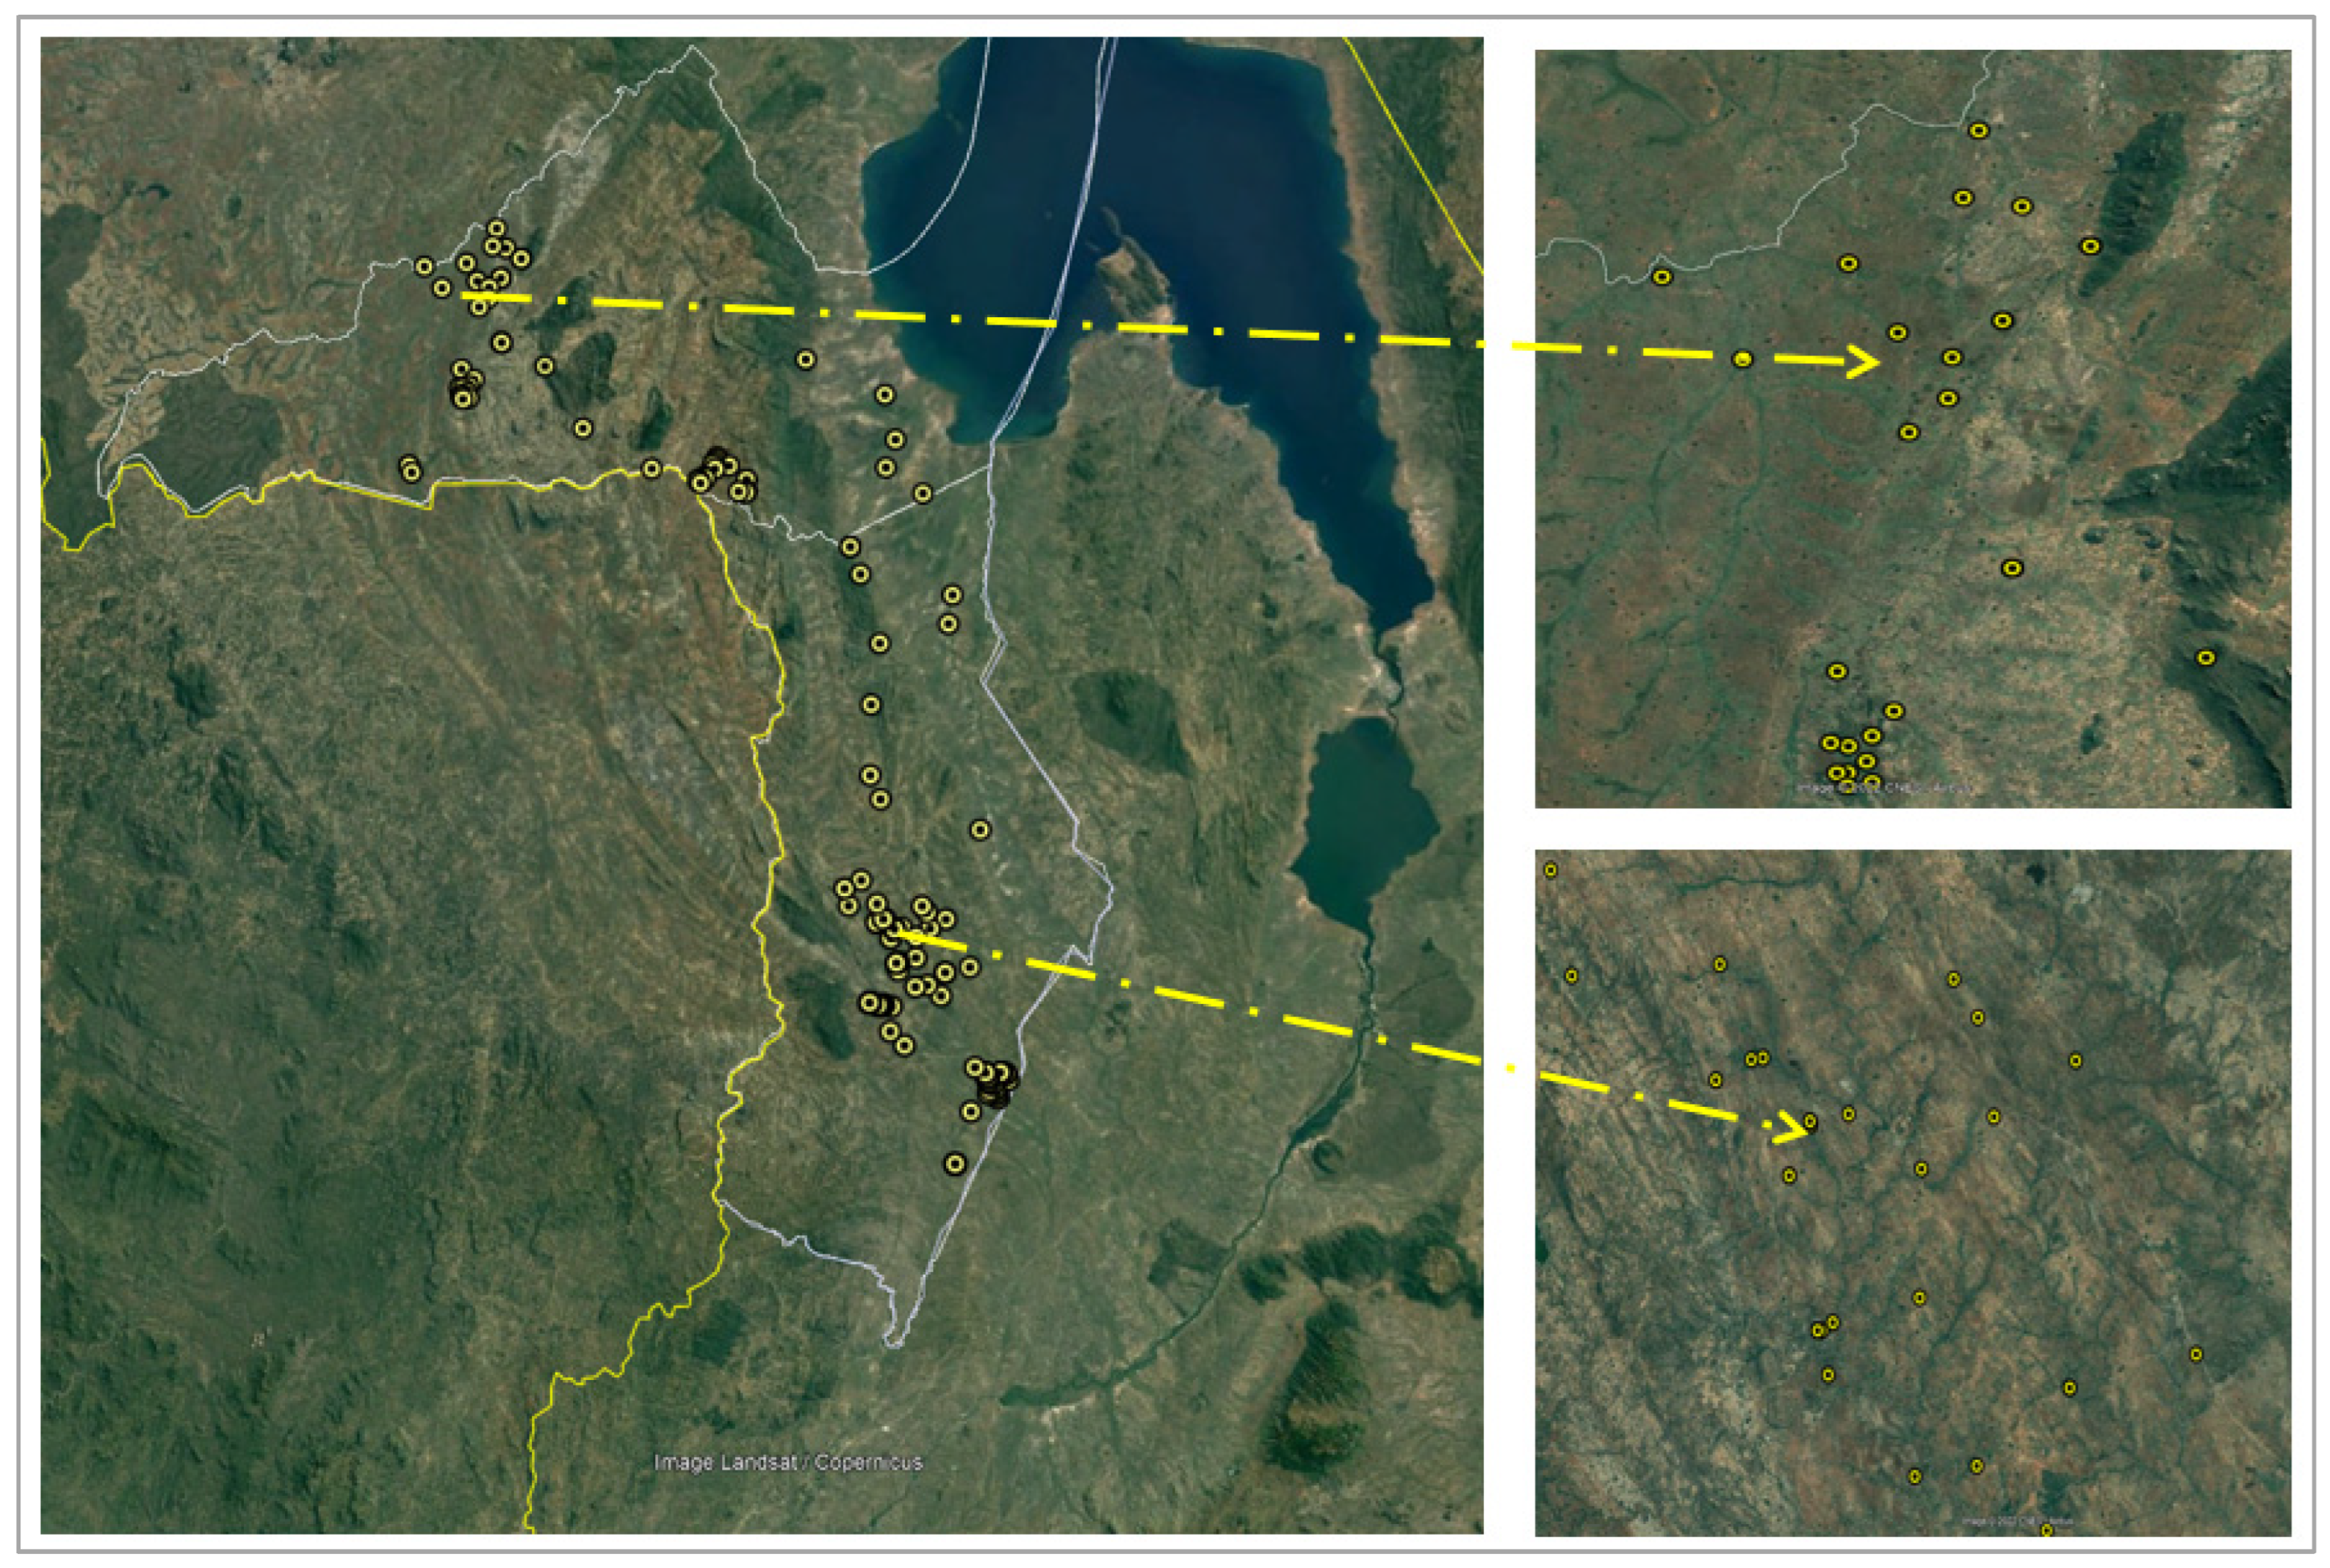
To determine agricultural land use, a time series (2001–2017) of mean Gross Primary Productivity (GPP) estimates derived from Moderate Resolution Imaging Spectroradiometer (MODIS) for the growing season were used. GPP shows differences in greenness and photosynthesis in crop phenology such as the normalized difference vegetation index (NDVI). However, GPP estimates can potentially be used to estimate yields [45]. A total of 150 observation points were extracted within the 500 m-by-500 m GPP pixel grid, across four study sites and surrounding areas of the districts and assessed in the field in Summer 2018 over a 200 km2 area (Figure 2). Field-observed sample points were collected within the 500 m-by-500 m GPP pixel grid while approximate Global Positioning System (GPS) locations were recorded as close to the sample points as possible where land was inaccessible [46]. Figure 3 shows various field site photographs taken of agricultural fields during the summer of 2018 field work.

2.3. Spatial Explanatory Variables

Past studies in Malawi show that land use and land cover changes are impacted by myriad social and biophysical drivers/causes. These include population density, infrastructure such as roads, and biophysical features such as soil properties, slope, and location near riverbanks [5,10,22,47]. The static or dynamic properties of driver variables have the potential to either constrain or enable certain land-cover changes [26,36,48]. Assumptions were made based on past studies that project future land-cover changes using existing drivers that change over time. For example, distance from major roads or rivers and population density are well known to drive urban and/or agricultural expansion and other land-cover changes. Driver variables such as slope, elevation and temperature have generally stable characteristics and static properties and are thus considered physical constraints to land-cover change [29,39,49]. These drivers were used as explanatory variables to estimate the expected quantity of change in land cover (see Table 1).
Soil data were extracted from the iSDA Soil texture and properties 30 m Africa layer and subset for Dedza and Ntcheu district boundaries (https://www.isda-africa.com/isdasoil/ (accessed on 15 April 2021)). Elevation and Slope were derived from the 30 m Shuttle Radar topography Mission (SRTM) dataset using the Google Earth Engine. Population estimates were extracted from the gridded population of the world version 4 (GPWv4) data set that contains global human population distributions from 2005 to 2014 at 1 km spatial resolution using the Google Earth Engine. This layer was subsequently resampled to 30 m resolution using ArcGIS software, assuming even distribution of people within each parent 1-km pixel to align spatial resolution with the other driver variables. Vector datasets for roads and rivers were derived from the Malawi Spatial Data Platform (http://www.masdap.mw/ (accessed on 1 April 2021)), and buffer zones were calculated at 30 m and 50 m of roads and rivers, respectively, using ArcGIS software. These buffer sizes were chosen to exclude restricted buffer zones based on the local Malawi department of roads and surveys because areas for land use are predominantly outside these zones based on a recent study [39] (see Table 1).

2.4. Training Samples Selection and Classification Analysis

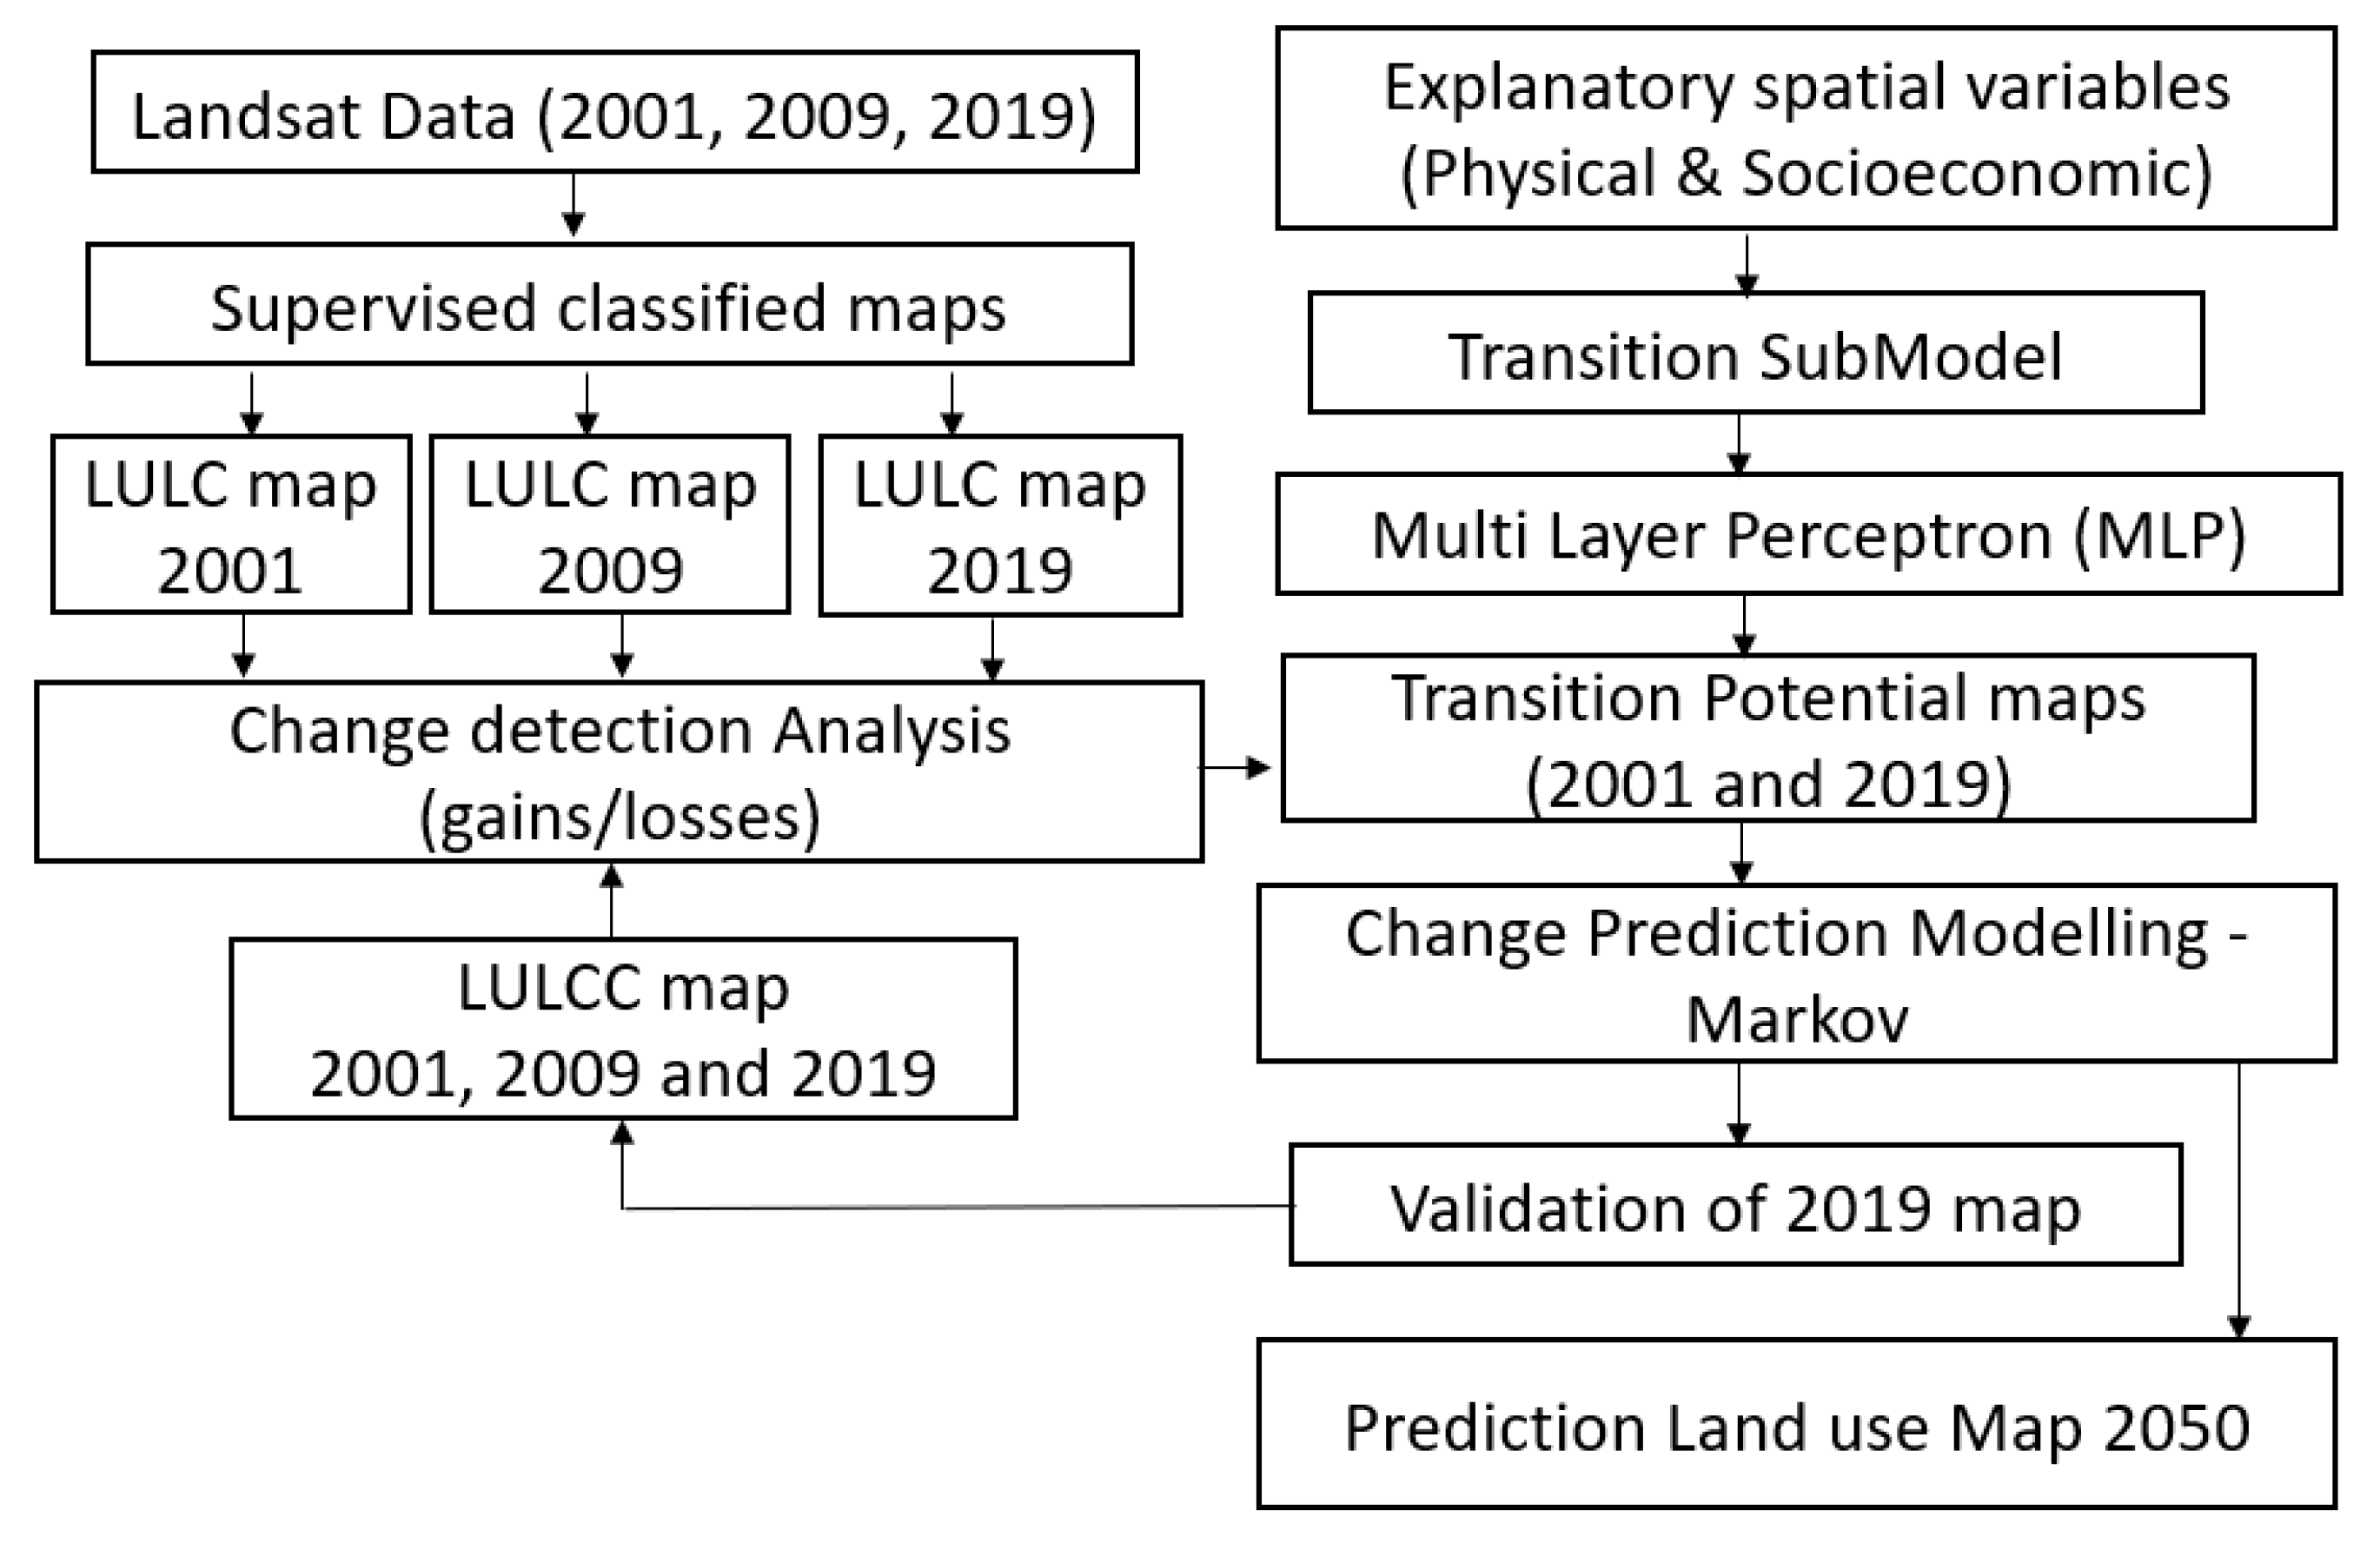
The Google Earth Engine machine learning algorithm was used to generate the training datasets along with sample points collected from field observations. Specifically, 100–200 random sample pixels were derived from Landsat for each time epoch for each land-cover class, except water, for Dedza where fewer samples were collected because of its small water surface area [44]. Google Earth explorer imagery (2001, 2009, and 2019) was used for visual identification of land cover for signature development and as well as the 150 samples collected for ground truthing. A temporal comparison between 2018 Landsat imagery that is similar to the ground truth period and Landsat 2019 imagery for the same study location showed minimal differences (Table 2: The Random Forest supervised classification method in Google Earth Engine machine learning software was used to classify the land classes (described in Table 3). Most (80%) of the sample pixels were used as training data and the remaining 20% for assessing accuracy for each image year (2001, 2009, and 2019) [44]. Random Forest supervised classification uses a random selection with replacement to classify pixels using an ensemble of decision trees [50,51]. Lastly, a post-classification image change analysis in ArcGIS v 10.7.1 was carried out; land-cover output maps and land-cover change maps across the land-cover classes for all years (2001, 2009, 2019) were completed. Figure 4 depicts the logical flow of the methodology used in this study.

2.5. Land Change Modeling

Land change modeling was carried out using the land change module (LCM) of TerrSet Software, Version 19.0.5 [48] and specifically, the multilayer perceptron (MLP) artificial neural network model. MLP contains several interconnected nodes or (points/entities) then sums weighted inputs received from other nodes and uses an activation function mapping (that is; a function that helps the model adapt to a given variety of input data to the linear or non-linear approach). In this case, the neural network examines potential transitions for each land-cover class based on the driver variables for the modeled landscape [48,53]. MLP uses a backward stepwise constant forcing procedure that looks at how driver variables predict change and gives the best fit model as described further below [48]. The potential for change in land cover is based on the relationships among the transitions of land-cover classes between 2001 (t1) and 2019 (t2) as dependent drivers and six independent variables: environmental and social drivers; elevation, slope, soil texture, distance from roads, distance from rivers, and population density as described in Section 2.3 above (Table 1).
We run separate sub-models for four transitions: Forest-mixed to Agriculture, Barren to Agriculture, Wetland to Agriculture, and Shrub-Woodland (occurred only in Ntcheu District) to Agriculture using the six input variables for each sub-model.; minor land transitions are not selected due to limited influence on the study area [29,48]. Randomly selected sets of pixels were fed through the neural network classifier using 10,000 iterations [48]. The model builds a network of neurons that starts from the input to output through a hidden layer and a signal travels from node to node and is modified by the receiving node which sums the weighted signals from previous layers and applies a non-linear function to the node before the signal is passed to the next layer [53]. The back-propagation algorithm computes a training error per iteration (training error is computed when network output is compared with desired output), this error is back-propagated through the network, and then adjusts the weights through the connections to improve model accuracy [48]. The RMS error decreases as the weights are refined [48]. The validation data are used to calculate the skill measure which is the difference between the measured transition prediction accuracy and the accuracy expected by chance [54]. The model outcomes are transition potential maps for each sub-model showing the probability for each land-cover class to experience change over a specific time interval [19].

2.6. Future Prediction

Malawi’s long-term strategic vision for 2050 and 2063 focuses on food security and strengthening a sector of the economy influenced by climate-related shocks and environmental degradation [11,13]. To simulate current land-cover change and what it might mean for planning and policy making to attain Malawi’s strategic vision, we used the transition potentials map outputs from the MLP as inputs for future prediction for the year 2050 based on Markov chain modeling in TerrSet 2020 v.19.0.5 software.
A Markov chain is a random model that creates a matrix to estimate the area for each land cover class and assumes that the probability of a land-use system in a certain state and at a particular time can be determined if the state at a prior time is known, provided that the change observed during the calibration (T1 to T2) is constant during the simulation period (T2 to T3) [28,29,49]. Determining the change process and outcome for each transition is beneficial to understanding the functioning of the land use systems under different scenarios as it can help to inform management and policy making [29].
In this study, land classifications for 2001 (T1) and 2019 (T2) are used to examine land use for potential land transitions. While the outcome of this model is a future scenario, typical land-cover validation methods cannot be employed for future (T3) time steps (2050). For model validation, this study used a quantitative measurement known as the relative operating characteristic (ROC) that assesses the model’s ability to specify location changes and predict accurately [55]. ROC calculates the sensitivity rates for the areas changed between the predicted and actual reference maps of 2019, representing the percentage of correctly predicted changes reported as a Kappa index statistic [55,56]. For the study area, the Kappa index represents the accuracy of agreement between the real and predicted maps of 2019. Dedza had a moderate Kappa index value of 0.54% while Ntcheu had 0.72%. Moreover, validation was carried out from predictions for the 2019 land-cover map referenced with the original 2019 land-cover map.

3. Results

3.1. Spatial Patterns of Land Use Land Cover

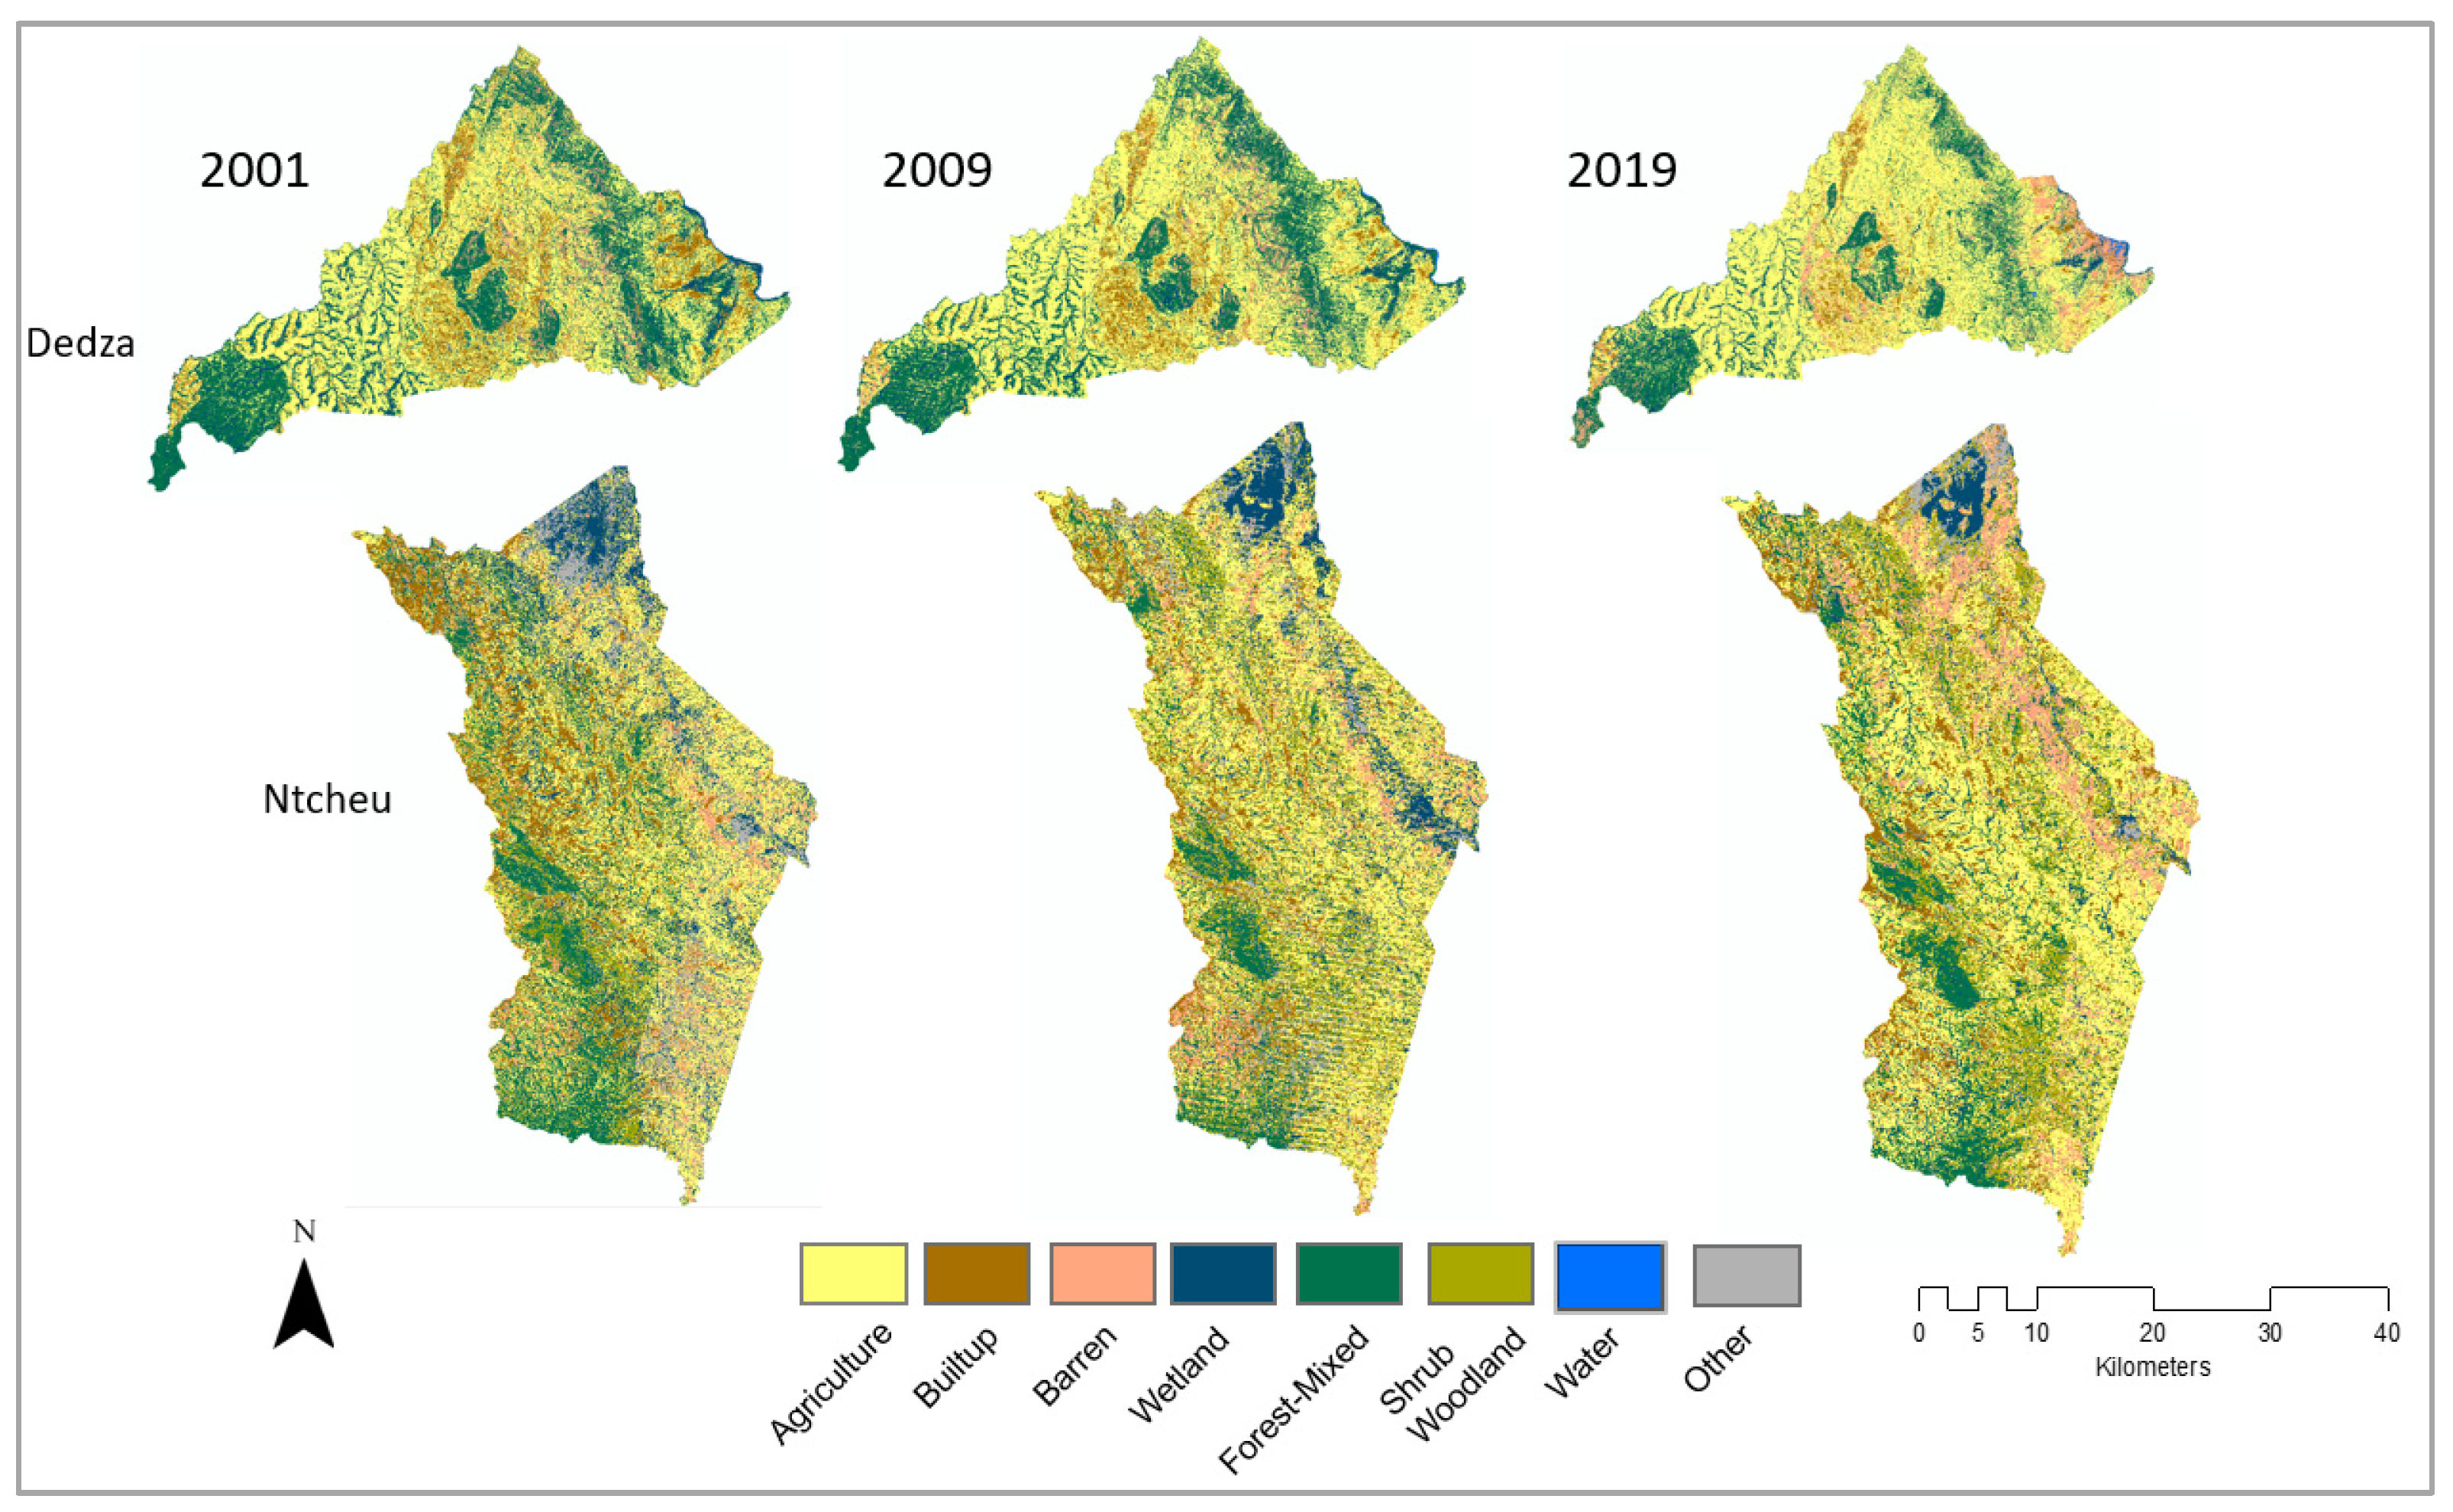
The central geographic areas across the study area are dominated by agriculture and built-up classes interspersed with brush/woodland but distributed in a dispersed and fractured manner reflecting the fragmented nature of these forest and agrarian landscapes (Figure 5). The main forest areas are in protected forests—forest reserves. Dedza has concentrated forest areas, particularly in the eastern highlands of the Dedza/Salima Escarpment that stretch across the Dedza/Salima Forest Reserve and Mua/Livuklezi Forest Reserve, central Dedza and southwestern Dedza (Chongoni Forest Reserve).. In contrast, Ntcheu was already more degraded than Dedza and much of the remaining forest cover is distributed on the western side where pronounced areas of shrub-woodland abound, reflecting forest degradation. Wetland land cover occurs along a latitudinal gradient mainly along river/stream courses in the northern-northeastern regions of Ntcheu. Surface water was detected mainly in the northeast region of Dedza. The ‘other classes’ category spreads to varying extents across both districts. This class constitutes unknown cover classes not covered by the seven main categories included in the land-cover class definitions for our study area (Figure 5).
Findings for Dedza show significant changes in land cover across the major cover classes during the 18 years, dominated by the conversion of forest-mixed to agriculture and bare/barren lands (see Table 4). While remaining the dominant land-cover type, agriculture increased in area from 48.0% to 52.4% and 59.7%, respectively, across the three time periods. The share of barren land was relatively low in 2001 but doubled by 2019 (4.7%, 5.4%, and 9.6% in 2001, 2009, and 2019, respectively). Most notably, the largest decrease in forest-mixed was during the last 9 years (2009–2019), an approximately 8% drop from 24.4% to 17.4% of cover while wetland area remained moderate but with small decreases during the period (8–9%).
Summary land-cover statistics show more stability in land-cover classes for the already degraded landscapes (forest-mixed) of the Ntcheu district as revealed in the small changes in most land-cover classes over the 18-year study period (Table 5). Thus, agriculture cover remained within 36–39%, with the second time epoch (2009–2019) while experiencing some minor loss in agriculture land use, and low losses in built-up areas (13%, 11%, and 9%) for 2001, 2009 and 2019, respectively, while the forest-mixed class had (12%, 8%, and 10%) with gains observed during 2009–2019. Increases were also observed in the brush/woodland class across the three time points (9%, 15%, and 24%, respectively), indicating forest degradation. Wetlands class decreased by more than half between 2001 (15%) and 2019 (7%), and the ‘other’ class category had land-cover losses between 2009 (6.3%) and 2019 (3.1%). Agriculture and the barren classes registered modest increases while the shrub-woodland class registered the biggest increase from 15.1% to 24% suggesting forest degradation. Notably, findings show that while both deforestation (reduction in forest cover, 1.8%) and forest degradation (as illustrated by the increase in shrub/woodland cover, 15.5%) occurred during 2001–2019, the latter transition was much more (more than 8 times) dominant than the former.
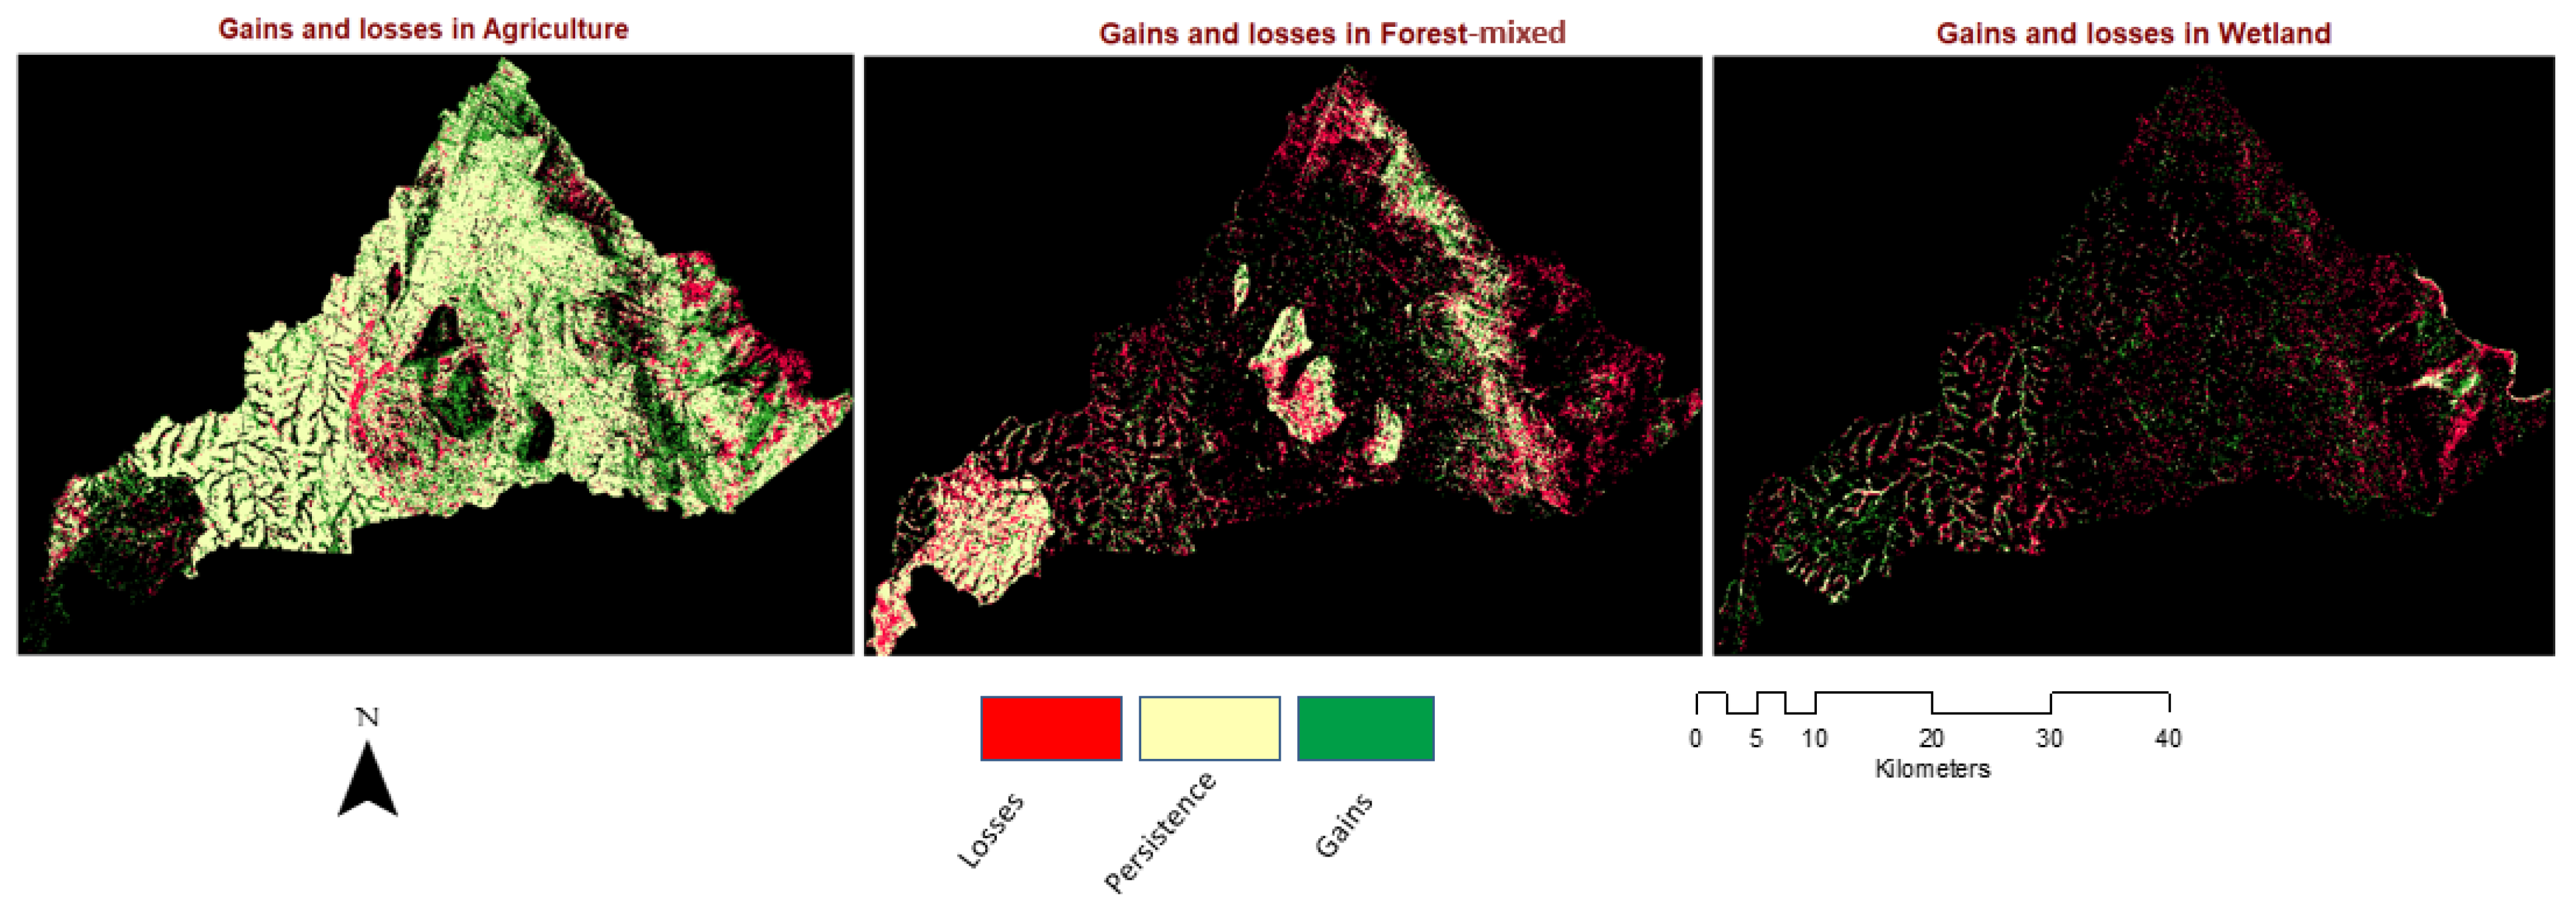
Spatially explicit examination of the land-cover transitions for Dedza (Figure 6) demonstrates that major persistent areas where land cover underwent no measurable change (yellow in the figure) were mainly agricultural lands and forested areas, particularly within forest reserves. Major transitions were mainly losses (red coloring) in the forest-mixed class and wetlands, and relatively gains (green coloring) in the agriculture class. The visual spatial change distribution indicates that the gains in agricultural land of 11.7% (Table 4) occurred mainly in eastern Dedza as well as central Dedza around Chongoni Forest Reserve and river valleys. The 7.1% loss in the forest-mixed class was also largely in the same areas of the district.
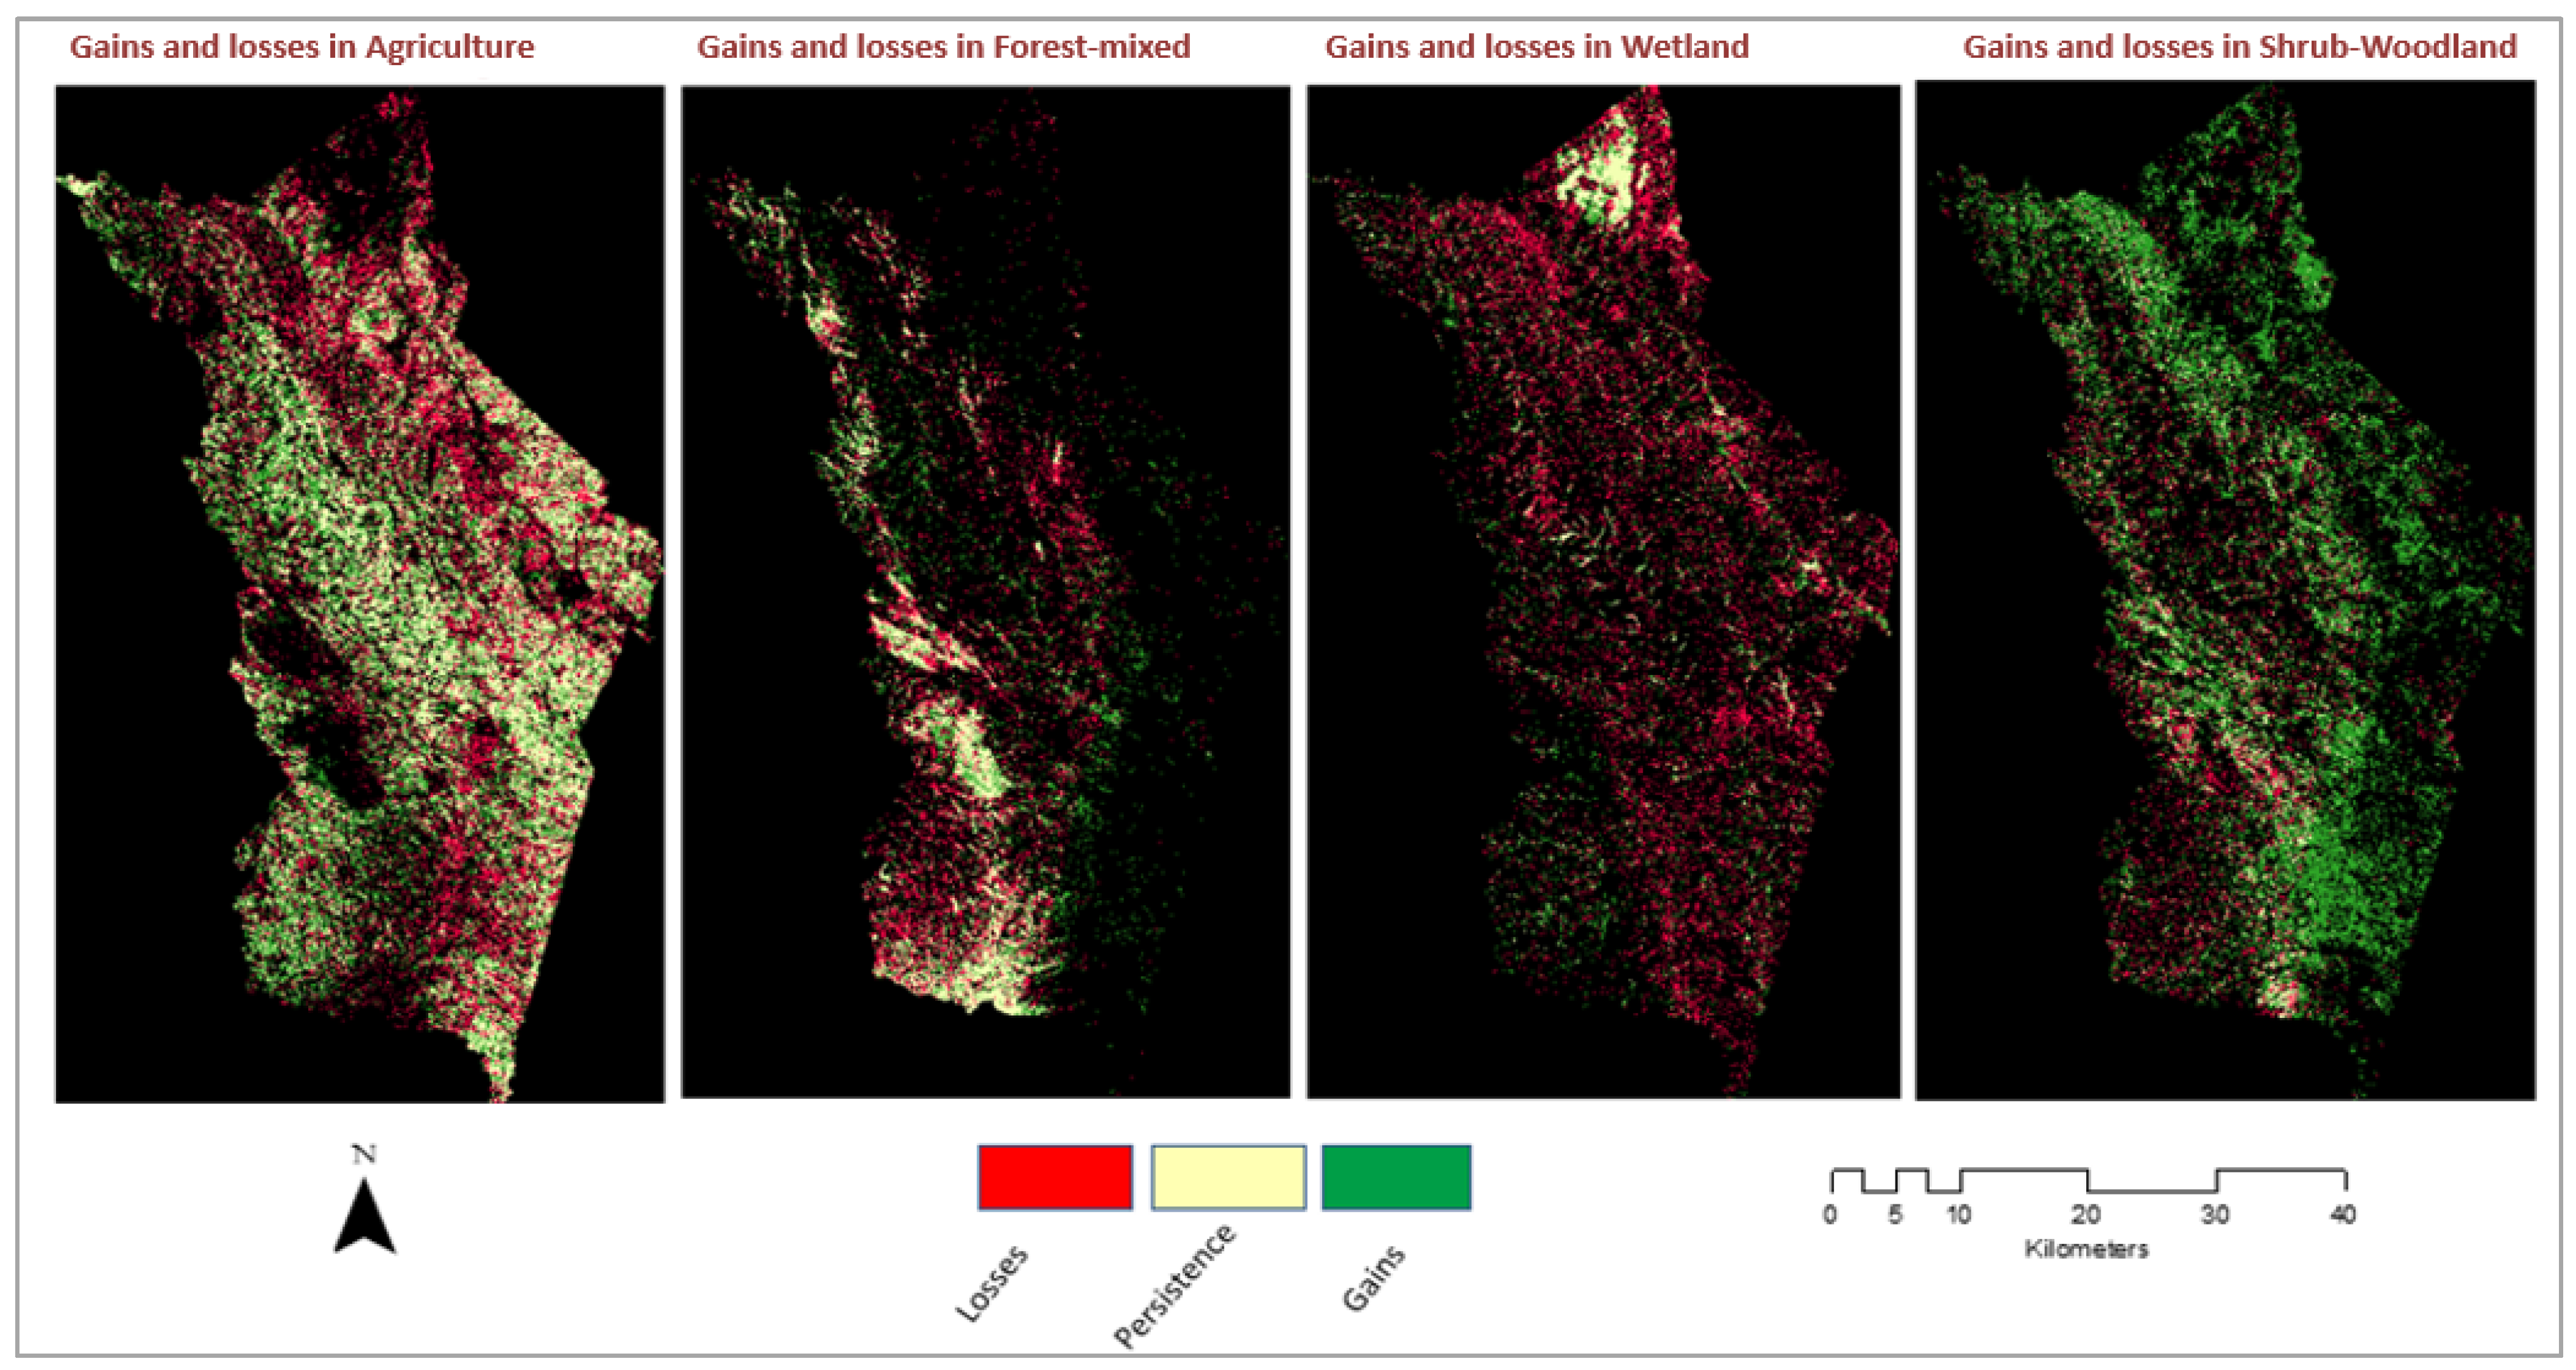
Gains in agricultural land cover were mainly on the western side while losses were prevalent on the eastern side of Ntcheu (Figure 7). Agricultural land is persistent on the eastern side and found mainly in the Shire River valley. Losses in forest-mixed cover occurred along a longitudinal gradient, with persistent forested lands found mainly in the western upland and plateau areas. Wetland cover had major losses across the district except in a stable area in the northeastern part. Shrub-woodland had gains across the region during this same time frame with increases of 15.5% (Table 5), suggesting significant forest degradation.

3.2. Accuracy Assessment

A standard accuracy assessment was conducted on the Landsat imagery classified based on Random Forest supervised classification algorithm (described in Section 2.4) and used to generate confusion matrices (supplementary materials: Tables S1–S6) and kappa statistics (including coefficient) for 2001, 2009, and 2019 [57,58]. Overall accuracy for both districts was very high and ranged from 93% to 99%. (Table 6 and Table 7). The producer’s accuracy, which shows the percentage of pixels that were correctly classified in each class, was also very high ranging from 92% to 99% across the classes. The user’s accuracy was also calculated. This shows the percentage likelihood that a pixel correctly classified to a particular class represents that class on the ground, and values ranged from 91% to 99%. Overall, the accuracy and the Kappa coefficients support the LULC products and their use in diverse post-classification methods [57,59].
Similarity in spectral signatures for land-cover classes particularly in savanna and woody savanna landscapes has been found to reduce accuracy in forest-mixed and cropland spectral classification [60]. In this study, shrub-woodland areas as found mainly in the more fragmented landscapes of the Ntcheu study area, and rural built-up areas (such as grass-thatched housing) have similar spectral signatures and are difficult to distinguish at the 30 m spatial resolution of the Landsat imagery used. Classification was also aided by field observations and Google Earth Explorer as references for ground truthing and features identification [46].

3.3. Land Cover Model Summary

The Land Change modeler (TerrSet Software, Version 19.0.5) analyzes explanatory variables of land-cover change and simulates predictions of future changes. For accuracy, the model uses a backward stepwise constant procedure as described in Section 2.5, to evaluate how well driver variables can predict change [48]. Land change modeling outcomes show each land class transition map, with the potential of change between two classes, as well as future change projection.
MLP modeling revealed moderate land-cover transition model accuracies across Dedza and Ntcheu landscapes based on the sub-model skill measure value that represents the overall accuracy of how well the predictor variables explain change in the past. Dedza’s sub-model accuracies varied between 56% and 58%, with the highest accuracy associated with sub-model transitions from the forest-mixed to agriculture (58.1%) and from barren to agriculture (58%) sub-models. The wetland to agriculture sub-model had slightly lower accuracy (56%) (Table 8). Each sub-model predicted varying degrees of transition and persistence. The wetland class skill measure revealed high persistence rates of 0.5909. The class skill measure (ratio) can be less than 0.1 or as high as 0.99 [49]. The wide range between the different land-cover classes may be due to variances affecting their ratio, such as land-cover classification accuracy as change is not controlled entirely by the drivers modeled [49]. RMS values for training and testing the model are within a range of 0.48–0.49 which is acceptable as RMS values between 0.2 and 0.5 indicate that the model can predict the data relatively accurately [49].
In Ntcheu (Table 9), the highest accuracy sub-model (67%) is associated with the transition from wetlands to agriculture, followed by the forest-mixed to agriculture, barren to agriculture and shrub-woodland to agriculture transitions. Their accuracies ranged between 60% and 59% while moderate rates of transition were predicted from wetland to agriculture at 0.53 and from forest-mixed to agriculture at 0.31 class skill values. Additionally, the RMS values ranged from 0.45 to just below 0.50. This indicates that the model can reliably predict transitions as the RMS values fall in the upper range of the recommended 0.20–0.50 range [16].
Dedza’s land transitions show generally low probabilities of land transition (10–40%). Areas with a high probability of transition (70–90%, and red in color in Figure 8), were limited in spatial scope, mostly to eastern Dedza and for transitions to agriculture. Land transitions from forest-mixed or barren to agriculture (30–70%) are likely to occur in central Dedza locations, while land transitions from wetland to agriculture had a probability of 40–60%.
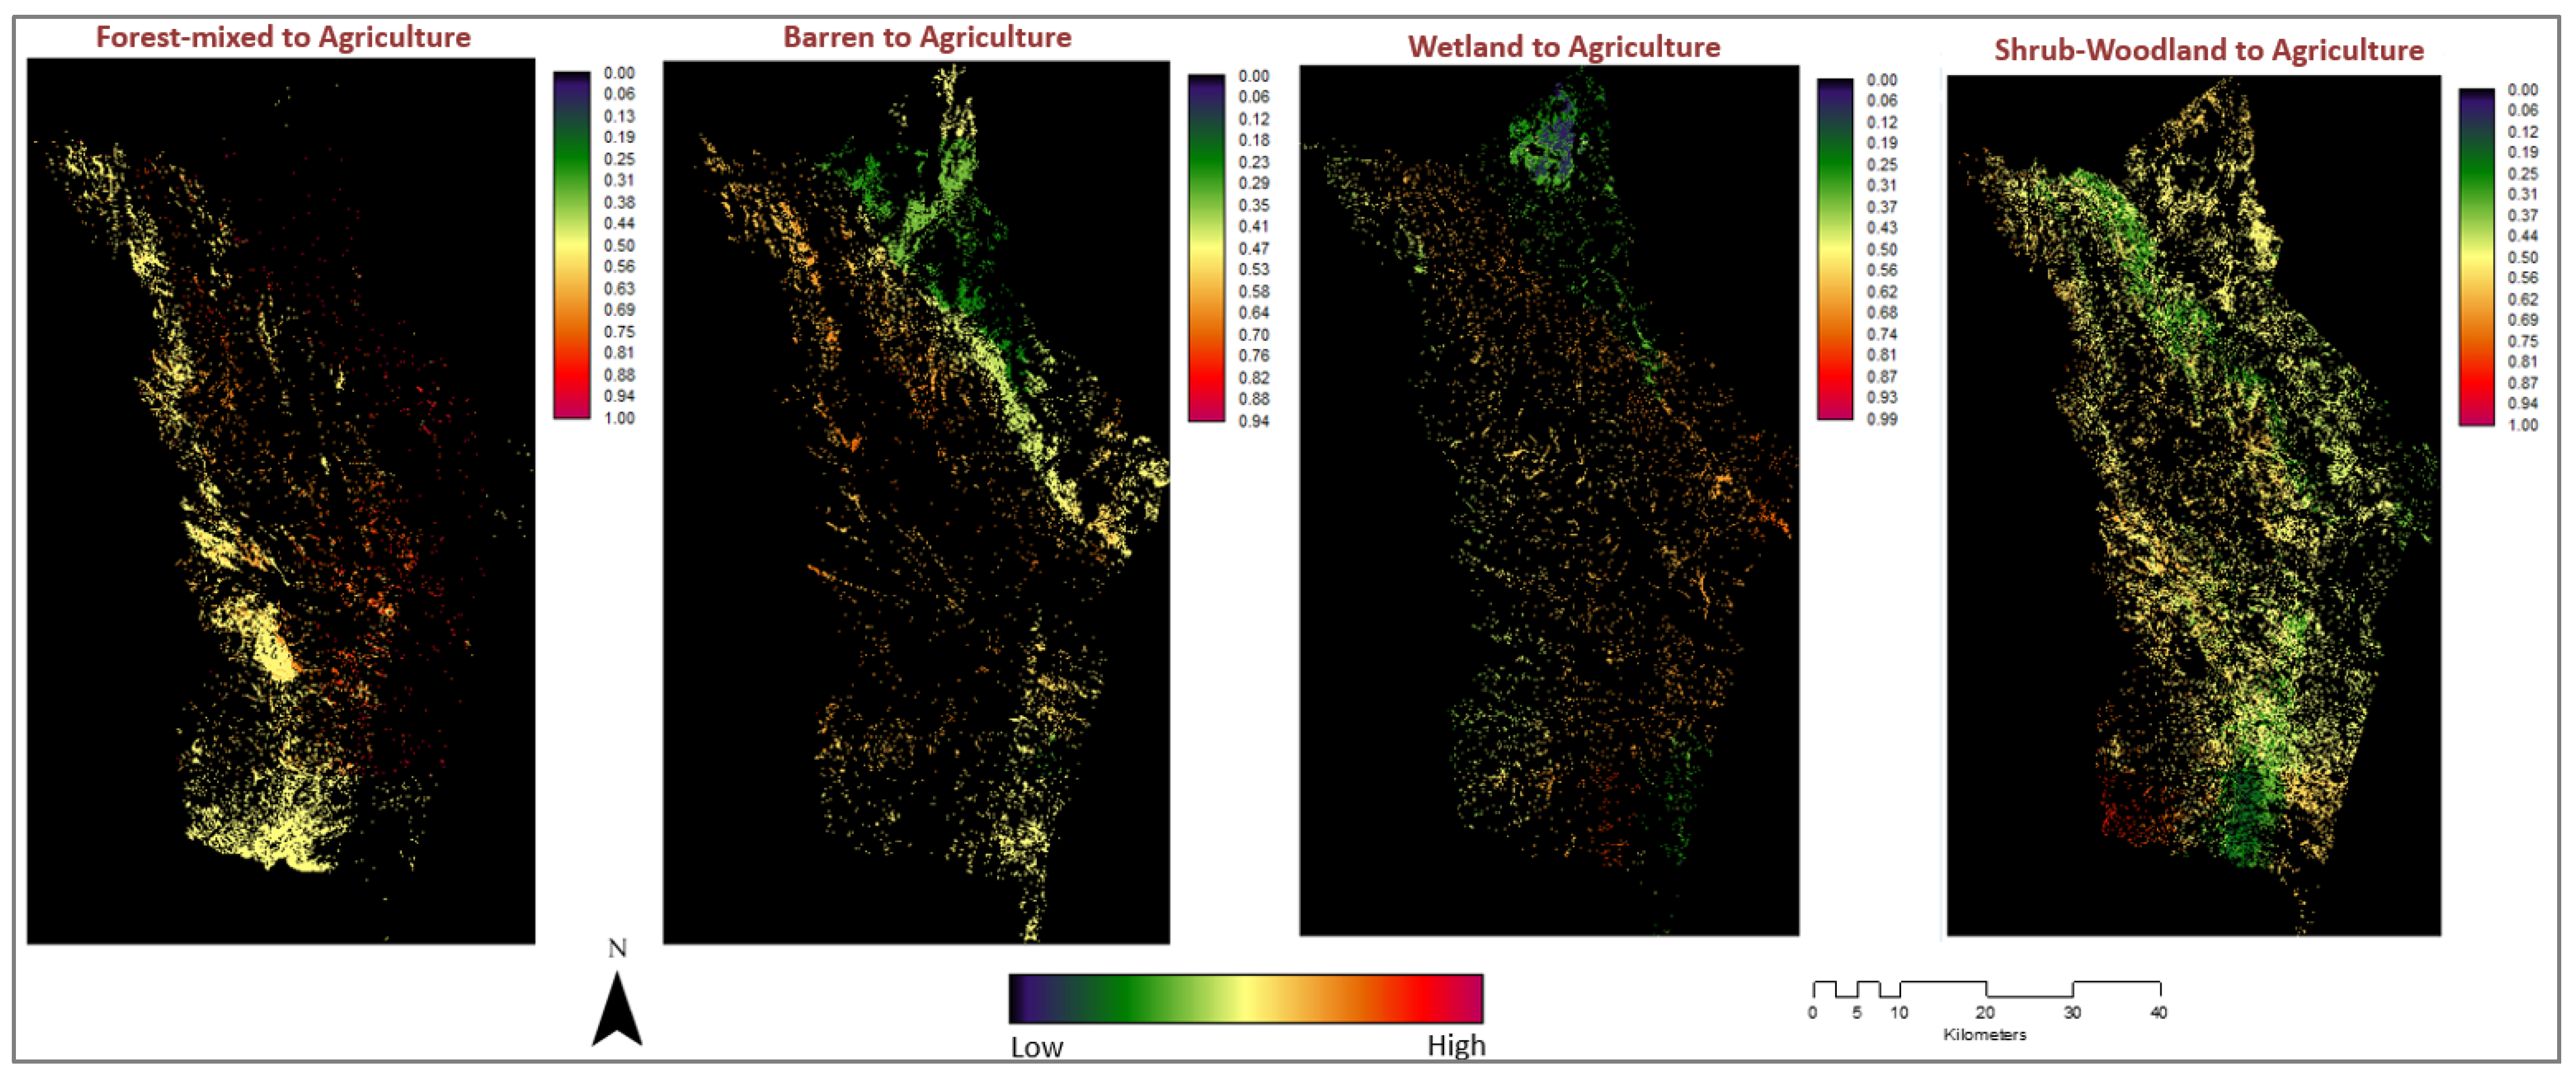
For the Ntcheu district there is a moderate overall probability (45–70%) of land transitioning from forest-mixed to agriculture, but mostly in the southeastern parts (Figure 9). Transitions from barren to agriculture also had moderate but slightly lower probabilities (40–65%). The probability of land transitions from shrub-woodland to agriculture is also moderate (45–70%) across Ntcheu. In contrast, the probability of transition from agriculture to wetland is relatively low (10–40%).
MLP-Markov chain modeling was used to predict land use change by 2050 using drivers of observed past change along with the probability of change at past and current time stamps of land cover to model future land-cover maps. By 2050 there is a high probability (80%) that most of Dedza land will be agriculture (see bold values in Table 10), while Ntcheu has a lower probability of 43%. Moderate to high probabilities were observed for conversion to built-up (from agriculture) at 72%, to barren at 66%, and to forest-mixed at 48%. Ntcheu’s (italic values in Table 10) likelihood of conversion from other classes to agriculture, built-up, shrub-woodland, barren and wetland is 30% or above, while the transition from forest-mixed is slightly lower at 26%. There are slight gains from forest to shrub-woodland at 28%, wetland to shrub-woodland (29%), and the “Other” class to shrub-woodland at 29%.
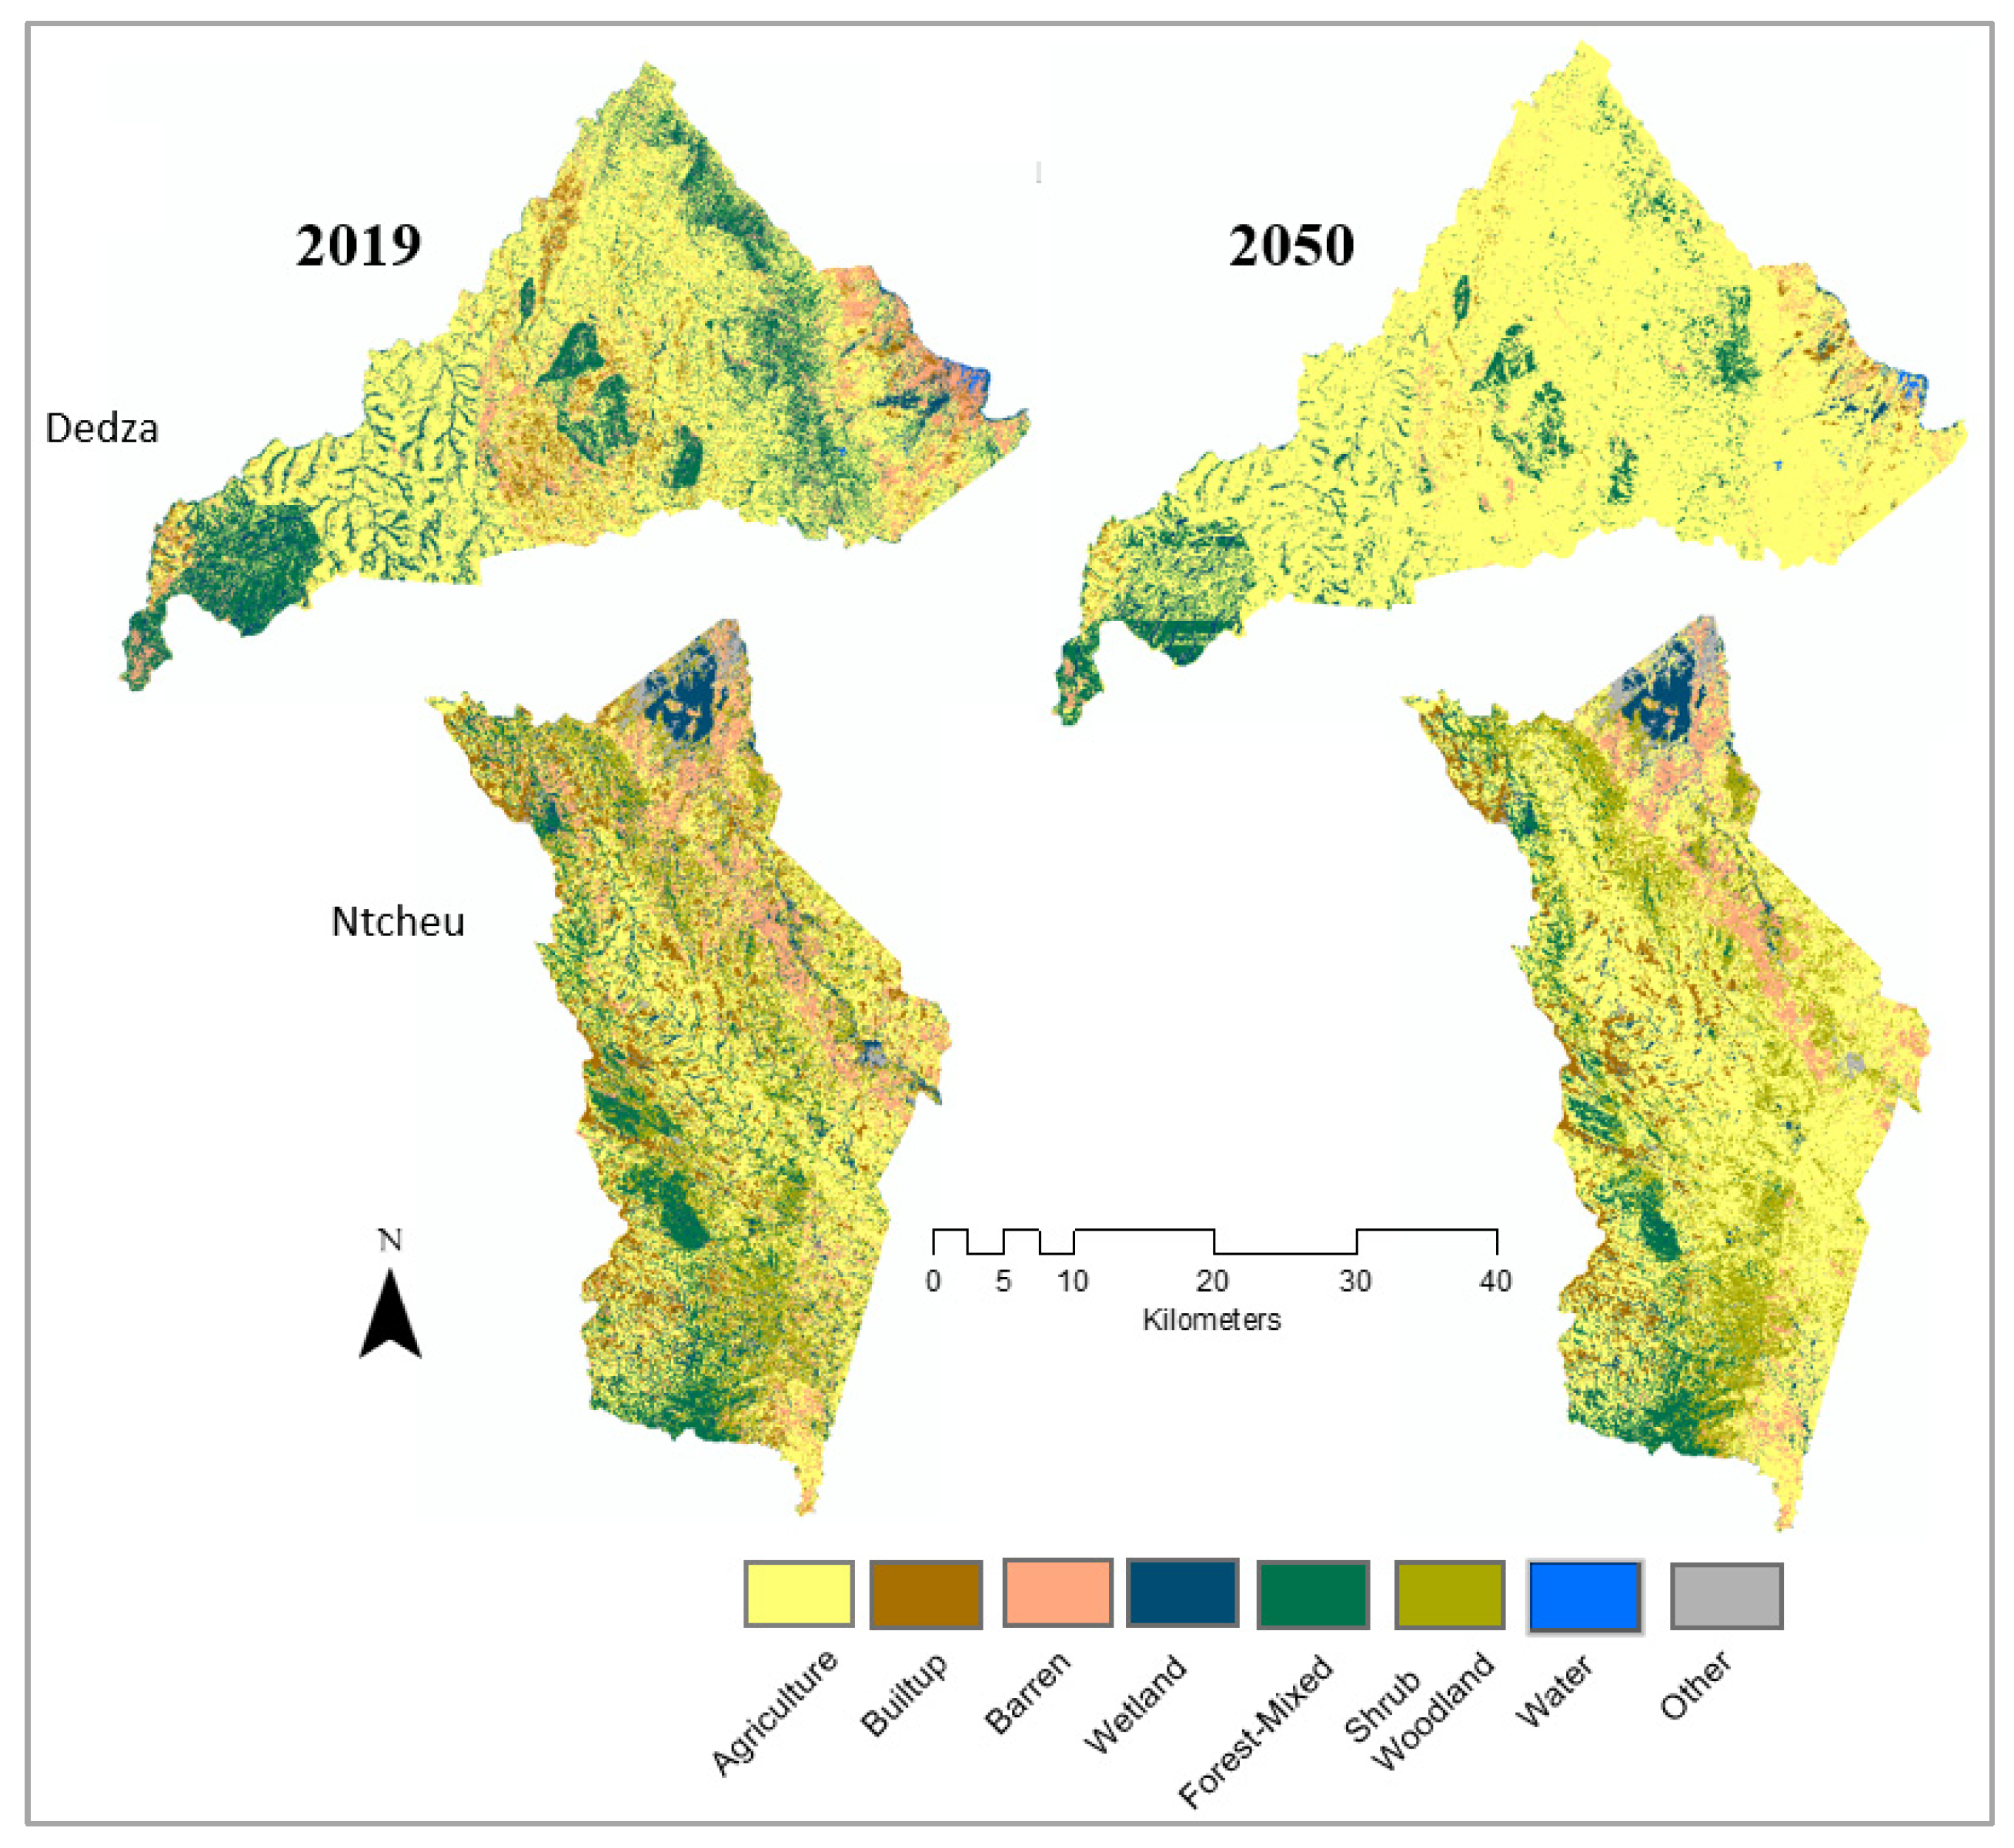
The MLP-Markov Chain models project a considerable increase in agricultural land cover that will dominate the landscapes of Dedza and Ntcheu by 2050 (Figure 10). The predicted land-cover map is in large contrast to 2019 and reveals that the agriculture class transformation and dominance will be much more pronounced for Dedza than for Ntcheu districts (Figure 10). Projections of forest conversion include encroachments into forest reserves, and for Dedza, forest cover decreases to 8.8% of total land cover (Table 11), a major source of concern. In Ntcheu, the shrub/woodland class category is projected to be the next largest class (16.0%) from agriculture, suggesting gradual forest thinning and degradation as forest cover shrinks to 7.6% (Table 11).
Projections show a significant change in agricultural land by 2050, with Dedza agriculture land area increasing from 232,291 ha in 2019 (Table 4) to 329,697 ha in 2050 while most of the other land classes decreased over time. Similarly, Ntcheu’s projections indicate significant expansion for agriculture though at a slower pace, from 120, 057 ha in 2019 to 189,258 ha, while most other land classes decreased over time (Table 5).

4. Discussion

Our land-cover change findings for Dedza and Ntcheu districts demonstrate low stability, with the agriculture class showing continued dominance, but transitions vary across the change periods. The findings that gains in the agricultural area were higher during 2009–2019 than during 2001–2009 for Dedza, while the reverse was true for Ntcheu, i.e., higher gains during 2001–2009 than from 2009 to 2019 might reflect the different initial states for the two districts. Dedza started off in 2001 with nearly half of the land already in agriculture and over a third in combined forest and wetland cover area, and the higher population growth accelerated the conversion of mainly forest and wetlands to agriculture during 2009–2019. The continuing degraded state of Ntcheu reflected in a near doubling of shrub-woodland during 2001–2009 combined with a steeper decline from the higher starting cover wetland, might account for the higher increase in agricultural land use. This might also reflect a growing trend in irrigated agriculture of wetlands locally called dimba during the dry season. Overall, population growth related to driving forces and terrain drivers such as lower slope and elevation accelerate land conversion to agriculture and account for observed increases in agricultural area as well as in settlement building, as noted in earlier findings [5,10].
The increase in barren areas during 2001–2019 in both districts suggests land-cover clearance or abandonment. This could be explained by farm practices where farmers burn or incorporate crop residues while making ridges after a harvest season, as well as by some land areas left bare of ground cover and undergoing localized soil erosion during rainfall events [61,62]. Moreover, these practices have become more challenging given the current limited use of fallows and diverse crop rotations on declining sizes of land holdings due to population pressures and lagging adjustments to government policies on land allocation [7]. The much larger increase (near doubling) in bare land for Dedza during 2009–2019 might also suggest increasing encroachment into the forest reserves and suggest the need for more protection and improved management, including the Dzalanyama Forest Reserve at the southwestern end [31].
The higher decline in the forest-mixed class in Dedza during 2009–2019 was mostly attributed to gains in agriculture, a trend also observed in previous studies. For example, local farmers contributed to an empirically observed decline in forest cover between 1999 and 2015 in Dedza due to agricultural expansion, and the use of forest products for fuelwood, charcoal production, and construction [10]. Although most of the remaining forested areas are confined to forest reserves, tree plantations, and mixed agro-forestry cropping systems are also common. It is notable that Ntcheu gained in forest areas during 2009–2019, possibly due to a combination of locally improved farming practices that incorporated tree planting and forest management. For instance, the 2009 Improved Forest Management for Sustainable Livelihoods Programme (IFMSLP, 2006–2009, and 2011–2015) supported communities in forest-based income-generating activities, including honey, timber, and firewood production through proper forest management [63]. Other recent efforts have enhanced the growth of highly vegetative and nitrogen-fixing legume crops such as pigeon peas as well as ‘fertilizer trees” such as Glirididia sepium, Faidherbia albida, Sesbania sesban and Tephrosia vogeii in mixed cropping systems with the improvement of soil organic matter and crop cover as major objectives [64,65].
The near linear increase in shrub-woodland areas that were dominant over the Ntcheu district (larger than 2.5 times increase during 2001–2019) suggests continuing disturbance and degradation of forest cover and succession or recovery, as also seen in earlier studies [33]. The shrub-woodland class is also prone to spectral signature similarity to built-up areas (grass-thatched, wood, mud, and tin housing and scattered trees in home gardens) and is prevalent in rural areas in Malawi [66]. Wetlands showed significant declines—by more than half—between 2001 (15%) and 2019 (7%) in Ntcheu. This phenomenon is also seen in a recent participatory mapping study aimed to facilitate discussions on how communities understand their landscapes, during which participants identified and mapped newly cultivated areas that used to be wetland areas [43]. Additionally, participants linked hotspots for land-cover types signifying degradation to the incidence of illegal land renting and changes in climate patterns affecting sustainable land management [43]. Similar studies across Africa reported the highest gains in land use were in agricultural land and most losses in grasslands and woodland and forests [22,31,60].
Land Change Modeling (LCM) between 2001 and 2019 revealed a dynamic landscape with significant projected land transitions to agriculture as influenced by the group of six variables. A previous study [10] showed comparable outcomes from land modeling in Dedza between 1991 and 2015, which local farmers attributed to proximity to roads and population growth. Distance from the water was locally perceived the least important driver [10]. Land transitions for Ntcheu appeared to occur along a longitudinal gradient; found mainly in western upland-plateau areas where land-cover losses to agriculture were more prevalent. Conversion to agriculture is an ongoing process; thus, fragmentation of the landscape is expected to continue in the future.
Overall, there is no clear pattern of synoptic intensification across the sub-region, as agricultural land use remains persistent. This pattern of a fragmented agrarian landscape with some trees is evident across the landscape in Malawi where agro-forestry and soil amendment models increase tree cover while large contiguous plots of forest decline (also see 36). In such landscapes, one pathway in addressing sustainable land management is to understand the effectiveness of current delivery by agricultural extension in improving knowledge on landscape function and farming practices that increase landscape resilience [67] while also observing land-cover management at the forest/agrarian landscape interface [36,61].
The projected LULC changes by 2050, reflecting agricultural cover-class dominance and a higher probability in Dedza (80% for transition to agriculture, 72% built-up, and 66% to barren land) are supported for Dedza by a previous study [39] that also predicted increases in agriculture, built-up and barren areas by 2025 attributed to unsustainable farmland practices and township growth. Despite Ntcheu’s lower transition probability, there are still significant rates of change (43%) for agricultural land, particularly from shrub-woodland, forest-mixed, and significantly wetland classes, indicative of underlying landscape fragmentation and environmental degradation. Malawi’s wetland conversion and degradation has been understudied given its growing importance to enhance food and livelihood security through supplemental dry-season irrigated farming in a predominantly rain-fed agricultural system, but one paper recognized wetland degradation caused by long-term pressures from poor farming practices, and population settlements on upland areas, which are predicted to increase in response to climate change [68]. Land-use management plans may need to be developed to equip communities and multiple stakeholders including government extension staff by first consolidating the diverse knowledge from multiple perspectives and emphasizing socio-economic and environmental benefits of functional landscapes such as wetlands to facilitate community engagement and promote sustainable land use management [69].
We acknowledge some study limitations associated with using high-medium spatial resolution remotely sensed satellite imagery to capture land-cover patterns, as well as to model biophysical and social drivers of change in heterogenous landscapes. This study uses 30 m spatial resolution imagery to model six explanatory drivers assumed to directly capture LULCC processes without consideration of indirect drivers such as climate change and assumes a business-as-usual scenario. Spectral signature separation across some land-cover classes such as between shrub-woodland and forest-mixed, and among wetland, agriculture, built-up, and the other class categories was difficult at this spatial resolution, although classification was significantly aided by primary ground truth data. The use of higher spatial resolution data would enhance the analytical rigor of future studies but as such data increase the temporal extent of historical data and as prices come down.
Lastly, predictive modeling is data intensive and tries to capture multi-scale and multi-level driver interactions. However, some drivers such as social and economic drivers of LULC change, are not captured in remote sensing spectral sensors, thereby undermining the reliability of modeling outcomes [70]. Moreover, we mentioned previous studies in the introduction section that utilized integrated methodological approaches for land use retrieval to better understand rural to urban transition and urban growth prediction [24,25] as well as the use of multiple integrated approaches and multi-sensor satellite imagery to capture unique heterogeneous landscape features that are non-existence in current land-cover products [26], this study also contributes to filling this methodological gap.
Also noteworthy are limitations associated with the temporal framing of the image datasets. For example, we used the ‘dry season’ timeframe in this study and could have captured space-time information outside the space–time frame as indirect impacts can spill over to the land [71]. Future studies could mitigate this limitation by exploring how model performance is influenced by seasonality (dry versus growing season) to maintain a realistic estimation. Moreover, future research could explore constraints and economic incentives, as well as short-long term policy implementations.
5. Conclusions

This study sought to advance knowledge in quantifying spatial-temporal gains and losses in LULC across Dedza and Ntcheu districts of Central Malawi, and modeled land transitions using driver variables among the land-cover classes and produced predictions of land cover to 2050. The study used a mixture of remote sensing and ancillary datasets, geospatial analysis and land-cover modeling based on Markov chains to generate spatially explicit land cover and transition products to advance knowledge and inform policy within and beyond the study sites and regions.
Our study informs stakeholders of spatial-temporal patterns of LULC change and its varying drivers across Dedza and Ntcheu districts. Modeled changes and future projections show significant landscape changes and a need to develop landscape-level policies that raise awareness among farming communities and policy makers. Enhanced understanding of land-use change, especially in areas that are projected to experience the most significant land transitions, can better inform policy interventions on sustainable land and other local natural resource management strategies (e.g., mandatory sub-district and district development plans) as well as shape national level policies. They could also inform the design of socio-economic incentives to encourage sustainable agricultural production and improve multifunctional use of the landscapes and enhance the targeting of conservation and restoration interventions to reduce or reverse land degradation and mitigate climate change.

Supplementary Materials

The following supporting information can be downloaded at: https://www.mdpi.com/article/10.3390/rs14143477/s1, Table S1: A Confusion matrix summary 2001 for Dedza district. (* 100 value accuracy has been rounded off). Table S2: Confusion matrix summary 2009 for Dedza district (* 100 value accuracy has been rounded off). Table S3: Confusion matrix summary 2019 for Dedza district. (* 100 value accuracy has been rounded off). Table S4: Confusion matrix summary 2001 for Ntcheu district. Table S5: Confusion matrix 2009 for Ntcheu district. Table S6: Confusion matrix 2019 for Ntcheu district. (* 100 value accuracy has been rounded off).

Author Contributions

Conceptualization, L.M.M. and J.P.M.; methodology, L.M.M.; writing—original draft preparation, L.M.M.; writing and writing—review and editing, S.S., L.C.Z., J.P.M., J.Q. and L.M.M.; funding acquisition, J.P.M. and S.S. All authors have read and agreed to the published version of the manuscript.

Funding

This research is funded by the support of the American People provided to the Feed the Future Innovation Lab for Sustainable Intensification through the United States Agency for International Development (USAID). The contents are the sole responsibility of the authors and do not necessarily reflect the views of USAID or the United States Government. Program activities are funded by USAID under Cooperative Agreement No. AID-OAA-L-14-00006.

Data Availability Statement

Data associated with this manuscript are available via Harvard Dataverse (Mungai et al., 2022) and from the corresponding author, L.M.M, upon reasonable request.

Acknowledgments

The authors also wish to thank Regis Chikowo and Vimbayi P. Chimonyo also involved with Michigan State University, Department of Plant, Soil, and Microbial Sciences, East Lansing, Mich., and Africa RISING project for their involvement in field work preparation and guidance. We thank Hannah Livuza, Emmanuel Jambo, Edward Mzumara and Daniel Nyirenda (deceased) of Africa RISING for their support in data collection. We credit Drs. Borana and Yadav giving us permission to adapt the diagram flow chart from the article (Borana and Yadav 2017).

Conflicts of Interest

The authors declare no conflict of interest.

References

  1. Food and Agriculture Organization of the United Nations (FAO). Sustainable Land Management. 2022. Available online: http://www.fao.org/land-water/land/sustainable-land-management/en/ (accessed on 21 February 2022).
  2. United Nations, Department of Economic and Social Affairs/Population Division. (DESA UN). 2018. Available online: https://population.un.org/wup/Country-Profiles/ (accessed on 28 April 2022).
  3. United Nations Environment Programme (UNEP). Our Work in Africa. 2022. Available online: https://www.unep.org/regions/africa (accessed on 16 February 2022).
  4. Center for Coordination of Agricultural Research and Development for Southern Africa. (CCARDESA). Available online: https://www.ccardesa.org/malawi (accessed on 25 April 2022).
  5. Li, G.; Messina, J.P.; Peter, B.G.; Snapp, S.S. Mapping Land Suitability for Agriculture in Malawi: Agricultural Land Suitability Mapping. Land Degrad. Dev. 2017, 28, 2001–2016. [Google Scholar] [CrossRef]
  6. Devereux, S. The impact of droughts and floods on food security and policy options to alleviate negative effects: The Impact of Droughts and Floods on Food Security and Policy Options to Alleviate Negative Effects. Agric. Econ. 2007, 37, 47–58. [Google Scholar] [CrossRef]
  7. Jayne, T.S.; Chapoto, A.; Sitko, N.; Nkonde, C.; Muyanga, M.; Chamberlin, J. Is the Scramble for Land in Africa Foreclosing a Smallholder Agricultural Expansion Strategy? J. Int. Aff. 2014, 67, 35–53. [Google Scholar]
  8. Stevens, T.; Madani, K. Future climate impacts on maize farming and food security in Malawi. Sci. Rep. 2016, 6, 36241. [Google Scholar] [CrossRef] [PubMed] [Green Version]
  9. Peter, B.G.; Messina, J.; Snapp, S.S. A Multiscalar Approach to Mapping Marginal Agricultural Land: Smallholder Agriculture in Malawi. Ann. Am. Assoc. Geogr. 2018, 108, 989–1005. [Google Scholar] [CrossRef]
  10. Munthali, M.G.; Davis, N.; Adeola, A.M.; Botai, J.O.; Kamwi, J.M.; Chisale, H.L.W.; Orimoogunje, O.O.I. Local Perception of Drivers of Land-Use and Land-Cover Change Dynamics across Dedza District, Central Malawi Region. Sustainability 2019, 11, 832. [Google Scholar] [CrossRef] [Green Version]
  11. Government of Malawi (GOM). Malawi Vision 2063: An Inclusively Wealthy and Self-Reliant Nation, Lilongwe, Malawi. 2020. Available online: https://malawi.un.org/sites/default/files/2021-01/MW2063-%20Malawi%20Vision%202063%20Document.pdf (accessed on 11 May 2022).
  12. Government of Malawi (GOM). Malawi Growth Development Strategy (MGDS III)—2017–2022. Available online: https://www.afidep.org/publication/malawi-growth-development-strategy-mgds-iii-2017-2022/.2017 (accessed on 15 February 2022).
  13. UN World Food Programme (WFP). 2021. Available online: https://www.wfp.org/ (accessed on 15 February 2022).
  14. Lambin, E.F.; Geist, H.J.; Lepers, E. Dynamics of Land-Use and Land-Cover Change in Tropical Regions. Annu. Rev. Environ. Resour. 2003, 28, 205–241. [Google Scholar] [CrossRef] [Green Version]
  15. Khalifa, M.; Elagib, N.A.; Ribbe, L.; Schneider, K. Spatio-temporal variations in climate, primary productivity and efficiency of water and carbon use of the land cover types in Sudan and Ethiopia. Sci. Total Environ. 2018, 624, 790–806. [Google Scholar] [CrossRef]
  16. Megahed, Y.; Cabral, P.; Silva, J.; Caetano, M. Land Cover Mapping Analysis and Urban Growth Modelling Using Remote Sensing Techniques in Greater Cairo Region—Egypt. ISPRS Int. J. Geoinf. 2015, 4, 1750–1769. [Google Scholar] [CrossRef] [Green Version]
  17. Hurskainen, P.; Adhikari, H.; Siljander, M.; Pellikka, P.; Hemp, A. Auxiliary datasets improve accuracy of object-based land use/land cover classification in heterogeneous savanna landscapes. Remote Sens. Environ. 2019, 233, 111354. [Google Scholar] [CrossRef]
  18. Verburg, P.H.; Schot, P.P.; Dijst, M.J.; Veldkamp, A. Land use change modelling: Current practice and research priorities. GeoJournal 2004, 61, 309–324. [Google Scholar] [CrossRef]
  19. Eastman, J.R.; He, J. A Regression-Based Procedure for Markov Transition Probability Estimation in Land Change Modeling. Land 2020, 9, 407. [Google Scholar] [CrossRef]
  20. Lin, Y.; Deng, X.; Li, X.; Ma, E. Comparison of multinomial logistic regression and logistic regression: Which is more efficient in allocating land use? Front. Earth Sci. 2014, 8, 512–523. [Google Scholar] [CrossRef]
  21. Gidey, E.; Dikinya, O.; Sebego, R.; Segosebe, E.; Zenebe, A. Cellular automata and Markov Chain (CA_Markov) model-based predictions of future land use and land cover scenarios (2015–2033) in Raya, northern Ethiopia. Model. Earth Syst. Environ. 2017, 3, 1245–1262. [Google Scholar] [CrossRef]
  22. Mwanjalolo, M.G.J.; Bernard, B.; Paul, M.I.; Joshua, W.; Sophie, K.; Cotilda, N.; Bob, N.; John, D.; Edward, S.; Barbara, N. Assessing the Extent of Historical, Current, and Future Land Use Systems in Uganda. Land 2018, 7, 132. [Google Scholar] [CrossRef] [Green Version]
  23. Mohamed, A.; Worku, H. Simulating urban land use and cover dynamics using cellular automata and Markov chain approach in Addis Ababa and the surrounding. Urban Clim. 2019, 31, 100545. [Google Scholar] [CrossRef]
  24. Din, S.U.; Mak, H.W.L. Retrieval of Land-Use/Land Cover Change (LUCC) Maps and Urban Expansion Dynamics of Hyderabad, Pakistan via Landsat Datasets and Support Vector Machine Framework. Remote Sens. 2021, 13, 3337. [Google Scholar] [CrossRef]
  25. Das, T.; Shahfahad; Naikoo, M.W.; Talukdar, S.; Parvez, A.; Rahman, A.; Pal, S.; Asgher, S.; Islam, A.R.M.T.; Mosavi, A. Analysing Process and Probability of Built-Up Expansion Using Machine Learning and Fuzzy Logic in English Bazar, West Bengal. Remote Sens. 2022, 14, 2349. [Google Scholar] [CrossRef]
  26. Schulz, D.; Yin, H.; Tischbein, B.; Verleysdonk, S.; Adamou, R.; Kumar, N. Land use mapping using Sentinel-1 and Sentinel-2 time series in a heterogeneous landscape in Niger, Sahel. ISPRS J. Photogramm. Remote Sens. 2021, 178, 97–111. [Google Scholar] [CrossRef]
  27. Mirici, M.E. Land Use/Cover Change Modelling in a Mediterranean Rural Landscape Using Multi-Layer Perceptron and Markov Chain (Mlp-Mc). Appl. Ecol. Environ. Res. 2018, 16, 467–486. [Google Scholar] [CrossRef]
  28. Borana, S.L.; Yadav, S.K. Modelling and Prediction of Land Use Changes in Jodhpur City Using Multi-Layer Perceptron Markov Techniques. Int. J. Res. Eng. 2017, 7, 14–21. [Google Scholar]
  29. Mishra, V.N.; Rai, P.K. A remote sensing aided multi-layer perceptron-Markov chain analysis for land use and land cover change prediction in Patna district (Bihar), India. Arab. J. Geosci. 2016, 9, 249. [Google Scholar] [CrossRef]
  30. Pérez-Vega, A.; Mas, J.-F.; Ligmann-Zielinska, A. Comparing two approaches to land use/cover change modeling and their implications for the assessment of biodiversity loss in a deciduous tropical forest. Environ. Model. Softw. 2012, 29, 11–23. [Google Scholar] [CrossRef]
  31. Munthali, K.G.; Murayama, Y. Land use/cover change detection and analysis for Dzalanyama forest reserve, Lilongwe, Malawi. Procedia Soc. Behav. Sci. 2011, 21, 203–211. [Google Scholar] [CrossRef] [Green Version]
  32. Asubonteng, K.; Pfeffer, K.; Ros-Tonen, M.; Verbesselt, J.; Baud, I. Effects of Tree-crop Farming on Land-cover Transitions in a Mosaic Landscape in the Eastern Region of Ghana. Environ. Manag. 2018, 62, 529–547. [Google Scholar] [CrossRef] [Green Version]
  33. Gondwe, M.F.; Cho, M.A.; Chirwa, P.W.; Geldenhuys, C.J. Land use land cover change and the comparative impact of co-management and government-management on the forest cover in Malawi (1999–2018). J. Land Use Sci. 2019, 14, 281–305. [Google Scholar] [CrossRef]
  34. Palamuleni, L.G.; Ndomba, P.M.; Annegarn, H. Evaluating land cover change and its impact on hydrological regime in Upper Shire river catchment, Malawi. Reg. Environ. Chang. 2011, 11, 845–855. [Google Scholar] [CrossRef]
  35. Pullanikkatil, D.; Palamuleni, L.G.; Ruhiiga, T.M. Land use/land cover change and implications for ecosystems services in the Likangala River Catchment, Malawi. Phys. Chem. Earth 2016, 93, 96–103. [Google Scholar] [CrossRef]
  36. Skole, D.; Samek, J.; Mbow, C.; Chirwa, M.; Ndalowa, D.; Tumeo, T.; Kachamba, D.; Kamoto, J.; Chioza, A.; Kamangadazi, F. Direct Measurement of Forest Degradation Rates in Malawi: Toward a National Forest Monitoring System to Support REDD+. Forests 2021, 12, 426. [Google Scholar] [CrossRef]
  37. Cigizoglu, H. Estimation and forecasting of daily suspended sediment data by multi-layer perceptrons. Adv. Water Resour. 2004, 27, 185–195. [Google Scholar] [CrossRef]
  38. Mwale, F.D.; Adeloye, A.J.; Rustum, R. Application of self-organising maps and multi-layer perceptron-artificial neural networks for streamflow and water level forecasting in data-poor catchments: The case of the Lower Shire floodplain, Malawi. Hydrol. Res. 2014, 45, 838–854. [Google Scholar] [CrossRef]
  39. Munthali, M.; Mustak, S.; Adeola, A.; Botai, J.; Singh, S.; Davis, N. Modelling land use and land cover dynamics of Dedza district of Malawi using hybrid Cellular Automata and Markov model. Remote Sens. Appl. Soc. Environ. 2019, 17, 100276. [Google Scholar] [CrossRef]
  40. National Statistics Office (NSO). Malawi Poverty Report. 2020. Available online: http://www.nsomalawi.mw/ (accessed on 9 March 2022).
  41. Barnett, C.; House, L.; Common, D. Mozambican Refugees in Malawi: Livelihoods and Their Impact on the Natural Resource Base; EPAU Background Papers: West Sussex, UK, 2003. [Google Scholar]
  42. Chikagwa-Malunga, S.K.; Banda, J.W. Productivity and Survival Ability of Goats in Smallholder Crop/Livestock Farming Systems in Malawi. Mortality 2006, 20, 30. [Google Scholar]
  43. Braslow, J.; Cordingley, J.E.; Snyder, K.A. A Guide for Participatory Mapping of Ecosystem Services in Multiuse Agricultural Landscapes: How to Conduct a Rapid Spatial Assessment of Ecosystem Services; International Center for Tropical Agriculture: Palmira, Colombia, 2016. [Google Scholar]
  44. Gorelick, N.; Hancher, M.; Dixon, M.; Ilyushchenko, S.; Thau, D.; Moore, R. Google Earth Engine: Planetary-scale geospatial analysis for everyone. Remote Sens. Environ. 2017, 202, 18–27. [Google Scholar] [CrossRef]
  45. Reeves, M.C.; Zhao, M.; Running, S.W. Usefulness and limits of MODIS GPP for estimating wheat yield. Int. J. Remote Sens. 2005, 26, 1403–1421. [Google Scholar] [CrossRef]
  46. Mungai, L.M. Multi-Scale Sustainable Intensification of Small-Holder Agriculture in Malawi; Michigan state University: East Lansing, MI, USA, 2020. [Google Scholar]
  47. Mkanda, F. Contribution by farmers’ survival strategies to soil erosion in the Linthipe River Catchment: Implications for biodiversity conservation in Lake Malawi/Nyasa. Biodivers. Conserv. 2002, 11, 1327–1359. [Google Scholar] [CrossRef]
  48. Eastman, J.R. TerrSet 2020 Geospatial Monitoring and Modeling System; Clark Labs, Clark University: Worcester, MA, USA, 2020. [Google Scholar]
  49. Gibson, L.; Münch, Z.; Palmer, A.; Mantel, S. Future land cover change scenarios in South African grasslands-Implications of altered biophysical drivers on land management. Heliyon 2018, 4, e00693. [Google Scholar] [CrossRef] [Green Version]
  50. Breiman, L. 1 Random Forests–Random Features; UC Berkeley TR567; University of California: Berkeley, CA, USA, 1999. [Google Scholar]
  51. Breiman, L. Random forests. Mach. Learn. 2001, 45, 5–32. [Google Scholar] [CrossRef] [Green Version]
  52. Food and Agriculture Organization of the United Nations (FAO). Atlas of Malawi Land Cover and Land Cover Change 1990–2010, Rome. 2012. Available online: https://www.fao.org/geospatial/resources/detail/en/c/1024741/, (accessed on 21 March 2022).
  53. Atkinson, P.M.; Tatnall, A.R.L. Introduction Neural networks in remote sensing. Int. J. Remote Sens. 1997, 18, 699–709. [Google Scholar] [CrossRef]
  54. Mas, J.-F.; Kolb, M.; Paegelow, M.; Olmedo, M.T.C.; Houet, T. Inductive pattern-based land use/cover change models: A comparison of four software packages. Environ. Model. Softw. 2014, 51, 94–111. [Google Scholar] [CrossRef] [Green Version]
  55. Pontius, R.; Schneider, L.C. Land-cover change model validation by an ROC method for the Ipswich watershed, Massachusetts, USA. Agric. Ecosyst. Environ. 2001, 85, 239–248. [Google Scholar] [CrossRef]
  56. Sangermano, F.; Toledano, J.; Eastman, J.R. Land cover change in the Bolivian Amazon and its implications for REDD+ and endemic biodiversity. Landsc. Ecol. 2012, 27, 571–584. [Google Scholar] [CrossRef]
  57. Congalton, R.G. A review of assessing the accuracy of classifications of remotely sensed data. Remote Sens. Environ. 1991, 37, 35–46. [Google Scholar] [CrossRef]
  58. Lewis, H.G.; Brown, M. A generalized confusion matrix for assessing area estimates from remotely sensed data. Int. J. Remote Sens. 2001, 22, 3223–3235. [Google Scholar] [CrossRef]
  59. Pontius, R.G., Jr.; Millones, M. Death to Kappa: Birth of quantity disagreement and allocation disagreement for accuracy assessment. Int. J. Remote Sens. 2011, 32, 4407–4429. [Google Scholar] [CrossRef]
  60. Palamuleni, L.; Annegarn, H.; Kneen, M.; Landmann, T. Mapping Rural Savanna Woodlands in Malawi: A Comparison of Maximum Likelihood and Fuzzy Classifiers. In Proceedings of the IEEE International Geoscience and Remote Sensing Symposium, Barcelona, Spain, 23–28 July 2007. [Google Scholar]
  61. Djenontin, I.; Zulu, L.; Ligmann-Zielinska, A. Improving Representation of Decision Rules in LUCC-ABM: An Example with an Elicitation of Farmers’ Decision Making for Landscape Restoration in Central Malawi. Sustainability 2020, 12, 5380. [Google Scholar] [CrossRef]
  62. Bouwman, T.; Andersson, J.; Giller, K. Adapting yet not adopting? Conservation agriculture in Central Malawi. Agric. Ecosyst. Environ. 2020, 307, 107224. [Google Scholar] [CrossRef]
  63. Mauambeta, D.D.; Chitedze, D.; Mumba, R.; Gama, S. Status of Forests and Tree Management in Malawi. Coord. Union Rehabil. Environ. 2010. [Google Scholar] [CrossRef]
  64. Musa, F.B.; Kamoto, J.F.M.; Jumbe, C.B.L.; Zulu, L.C. Adoption and the Role of Fertilizer Trees and Shrubs as a Climate Smart Agriculture Practice: The Case of Salima District in Malawi. Environments 2018, 5, 122. [Google Scholar] [CrossRef] [Green Version]
  65. Snapp, S.S.; DeDecker, J.; Davis, A.S. Farmer Participatory Research Advances Sustainable Agriculture: Lessons from Michigan and Malawi. Agron. J. 2019, 111, 2681–2691. [Google Scholar] [CrossRef] [Green Version]
  66. Haack, B.; Mahabir, R.; Kerkering, J. Remote sensing-derived national land cover land use maps: A comparison for Malawi. Geocarto Int. 2014, 30, 270–292. [Google Scholar] [CrossRef]
  67. Mungai, L.M.; Snapp, S.; Zulu, L.; Messina, J.P. The Role of Agricultural Extension Delivery on the Malawian Landscape. 2022; in preparation. [Google Scholar]
  68. Wood, A.; Dixon, A.; Mccartney, M. Catchments and Wetlands: A Functional Landscape Approach to Sustainable Use of Seasonal Wetlands in Central Malawi. In Wetland Management and Sustainable Livelihoods in Africa; Routledge: London, UK, 2013; pp. 85–106. [Google Scholar]
  69. Mungai, L.M.; Zulu, L.; Messina, J.P. Reassessment of wetlands classification for sustainable land management in Malawi. 2022; in preparation. [Google Scholar]
  70. Wang, J.; Bretz, M.; Dewan, M.A.A.; Delavar, M.A. Machine learning in modelling land-use and land cover-change (LULCC): Current status, challenges and prospects. Sci. Total Environ. 2022, 822, 153559. [Google Scholar] [CrossRef]
  71. Kuschnig, N.; Cuaresma, J.C.; Krisztin, T.; Giljum, S. Spatial spillover effects from agriculture drive deforestation in Mato Grosso, Brazil. Sci. Rep. 2021, 11, 21804. [Google Scholar] [CrossRef] [PubMed]
Figure 1. Study Area of two districts located in Central Malawi. The Dedza district is the upper study area while The Ntcheu district is the lower area. The figure also shows the boundaries of four agriculture extension administrative areas called Extension Planning Areas (EPA) and ground-truth field observations locations.
Remotesensing 14 03477 g001
Figure 2. Google Earth Explorer map showing location points collected during field observations ground truthing for Dedza and Ntcheu Districts in Summer 2018.
Remotesensing 14 03477 g002
Figure 3. Photographs of agricultural landscapes taken in Summer 2018 across Dedza and Ncheu District, Malawi.
Remotesensing 14 03477 g003
Figure 4. Methodology flow-chat (this diagram adapted with permission from Borana and Yadav 2017.
Remotesensing 14 03477 g004
Figure 5. Land-cover maps for Dedza and Ntcheu districts in 2001, 2009, and 2019.
Remotesensing 14 03477 g005
Figure 6. Maps of land gains, persistence, and losses for agriculture, forest-mixed, and wetland classes in Dedza district (2001–2019 period) (black pixel colors contain no information).
Remotesensing 14 03477 g006
Figure 7. Maps of land gains, persistence and losses change classes from agriculture, forest-mixed wetland, shrub-woodland classes in Ntcheu district (2001–2019 period).
Remotesensing 14 03477 g007
Figure 8. Land-Cover Transition Potentials (Probability): Dedza District.
Remotesensing 14 03477 g008
Figure 9. Land-Cover Transition Potentials (Probabilities): Ntcheu District.
Remotesensing 14 03477 g009
Figure 10. Projected Land Use and Cover—2050 for Dedza and Ntcheu Districts.
Remotesensing 14 03477 g010
Table 1. Satellite Datasets used for land-cover classification and input spatial variables used for LULC change modeling.
DatasetSourceTemporal ResolutionSpatial ResolutionDescription
Landsat 8 OLI-TIRS ^USGS16 day30 mAugust–October 2019 imagery. Tier 1 assets, 2 to 10 images, 7 Bands
Landsat 7 ETM+ VUSGS16 day30 mAugust–October 2001 and August–October 2009 imagery at 30 m resolution, Tier 1 and Real-time (RT) assets, 1 to 5 images, 7 Bands
MODIS $ Gross Primary Productivity (GPP) MOD17A2H V6NASA LP DAAC + at USGS EROS Center8 day500 mCumulative 8-day composite product
GPS points collected during ground truthingField observations (Dedza and Ntcheu) -GPS-Co-ordinates
Input Variables
Soil textureiSDAsoil #-30 mSoil properties generated based on research from African Soil Information Services (AfSIS) and other data sources
Elevation (DEM)SRTM *-NASA/USGS-30 mDigital Elevation Model (DEM) data from SRTM image
Slope (degrees)SRTM-NASA/USGS-30 mSlope was calculated based on SRTM elevation data
Population densityNASA SEDAC b-1 km (resampled to 30 m)Gridded Population of the World (GPwv4). Estimates of number of people per grid cell
Distance from riversMASDAP @--50 m protection buffer zone from main rivers
Distance from major roadsMASDAP @--30 m protection buffer zone from major roads
^ OLI-TIRS: Operational Land Imager-Thermal Infrared Sensor; V ETM: Enhanced Thematic Mapper Plus, (accessed on 10 January 2021) $ Moderate Resolution Imaging Spectroradiometer (MODIS): MODIS https://modis.gsfc.nasa.gov/data/dataprod/nontech/MOD17.php (accessed on 30 April 2018); + National Aeronautics and Space Administration (NASA) Land Processes Distributed Active Archive Center (LP DAAC) at USGS Earth Resource Observation and Science Center (EROS); # iSDA soil: https://www.isda-africa.com/isdasoil/ (accessed on 15 April 2021); * Shuttle Radar topography Mission (SRTM) Digital Elevation Model (DEM); b NASA Socioeconomic Data and Applications Center (SEDAC); @ Malawi Spatial Data Platform (MASDAP) http://www.masdap.mw/ (accessed on 1 April 2021).
Table 2. Summary statistics of Landsat imagery comparison for 2018 and 2019 at same location.
MeanMinimumMaximumSt.Dev.
Landsat 2018 ^Band 20.94320.79661.33200.0340
Band 31.04220.86431.53370.0504
Band 41.16540.88361.67030.0762
Landsat 2019 *Band 20.94990.81051.10340.0380
Band 31.05280.89471.27040.0415
Band 41.15110.89691.44460.1081
(Landsat 2018 ^ imagery: LANDSAT/LC08/C02/T1_L2/LC08_168070_20180926, Landsat 2019 *: LANDSAT/LC08/C02/T1_L2/LC08_168070_20190929).
Table 3. Land class definitions (based on an 8-category classification system adapted from [10,52]).
Land Cover ClassDescription
Agriculture Cultivated areas, such as mixed crop fields with scattered trees
Built-up Residential, urban, industrial areas, including infrastructure—roads, airports, impervious surfaces
Barren Bare lands, could include recently cultivated, areas with exposed rocks with little vegetation, quarries, land fill sites
Water Exposed water surfaces, reservoirs, rivers, water bodies visible to satellite
Wetlands Seasonal/regularly flooded land along rivers and/or irrigated farmlands with emergent vegetation
Forest-Mixed Vegetation (Forest-mixed) Tree-covered areas, forest/tree plantations, protected forests, woody vegetation, and sacred groves with stems reaching less than 5 m height in some areas.
Shrub-Woodland Open natural vegetation (15–40%) herbaceous layer, and shrub savannah
Other Unknown materials and unmanaged areas that are not covered by any of the above categories.
Table 4. Land cover distribution and statistics summary for Dedza district (Ha = Hectares).
Dedza2001 2009 2019
Land UseHaPercentHaPercentHaPercent
Agriculture186,77648.0203,91552.4232,29159.7
Built-up43,726.511.230,9167.919,5755
Forest-mixed95,06124.497,97225.267,62117.4
Barren18,2324.721,2005.437,4929.6
Wetland44,37711.434,2438.831,1368.0
Water10250.39500.210820.3
Total Area389,197100389,196100389,197100
Table 5. Land-cover distribution and statistics summary in Ntcheu district (Ha = Hectares).
Ntcheu2001 2009 2019
Land UseHa%Ha%Ha%
Agriculture124,47936.8130,69738.7120,05735.5
Built-up42,69412.635,32010.531,2809.3
Barren27,5208.132,0629.535,81110.6
Other21,4406.321,2816.310,5733.1
Wetland51,43515.241,16112.223,8327.1
Forest-mixed41,31112.226,2627.834,99310.4
Shrub-woodland29,0128.651,11015.181,34624.1
Total Area337,891100337,893100337,892100
Table 6. Accuracy assessment summary for classified land-cover maps for Dedza district. (* accuracy value of 100 has been rounded).
Dedza200120092019
Producer’s AccuracyUser’s AccuracyProducer’s AccuracyUser’s AccuracyProducer’s AccuracyUser’s Accuracy
Agriculture100 *100 *100 *100 *99.599.5
Built-up100 *100 *98.498.596.896.8
Forest-mixed100 *100 *9999.1100 *100 *
Barren99.499.4100 *100 *97.797.8
Wetland98.198.197.197.199100 *
Water100 *100 *97.297.7100 *100 *
Overall accuracy0.99 0.99 0.986
Kappa Coefficient0.99 0.99 0.986
Table 7. Accuracy assessment summary for classified land-cover maps for Ntcheu district. (* 100 value accuracy has been rounded to one decimal point).
Ntcheu200120092019
Producer’s AccuracyUser’s AccuracyProducer’s AccuracyUser’s AccuracyProducer’s AccuracyUser’s Accuracy
Agriculture96.596.594.394.398.398.4
Built-up98.298.393.893.999.399.4
Barren96.196.193.593.6100 *100 *
Other94.595.194.594.698.898.8
Wetland94.694.692.292.397.897.8
Forest-mixed96.796.792.792.799.499.4
Shrub-Woodland92.492.491.691.698.3100
Overall accuracy0.95 0.93 0.99
Kappa Coefficient0.94 0.92 0.97
Table 8. Sub models in the Multi-Layer Perceptron (MLP) using the six explanatory variables and model performance summary for Dedza district (2001–2019).
RMS
Sub-ModelClass Skill Measure (Ratio)Sub-Model Accuracy (%)Sub-Model Skill MeasureTrainingTesting
Forest-mixed to Agriculture 58.130.16260.49180.4925
Transition: Forest-mixed to Agriculture−0.0654
Persistence: Forest-mixed0.3956
Barren to Agriculture 57.950.15890.48650.4886
Transition: Barren to Agriculture0.0338
Persistence: Barren0.284
Wetland to Agriculture 55.800.1160.49460.4946
Transition: Wetland to Agriculture−0.198
Persistence: Wetland0.5909
Table 9. Sub models in the Multi-Layer Perceptron (MLP) using six explanatory variables and model performance summary for Ntcheu district (2001–2019).
RMS
Sub-ModelClass Skill Measure (Ratio)Sub-Model Accuracy (%)Sub-Model Skill MeasureTrainingTesting
Forest-mixed to Agriculture 59.000.18220.49400.4932
Transition: Forest-mixed to Agriculture0.3108
Persistence: Forest-mixed0.0536
Barren to Agriculture 59.800.1960.48950.4906
Transition: Barren to Agriculture0.1482
Persistence: Barren0.2446
Wetland to Agriculture 67.300.34510.45620.4605
Transition: Wetland to Agriculture0.5352
Persistence: Wetland0.1548
Shrub-Woodland to Agriculture 58.900.17910.48670.4878
Transition: Shrub-Woodland to Agriculture0.2804
Persistence: Shrub-Woodland0.0784
Table 10. Markov probability of land covers in Dedza (bold), Ntcheu (italic) prediction from 2019 to 2050.
2050
AgricultureBuilt-UpForestBarrenWetlandWaterShrub-WoodlandOther
Agriculture 0.8066 0.0275 0.0573 0.0835 0.0241 0.0011
0.43240.08110.06480.12310.0442 0.23570.0187
Built-up 0.7295 0.1209 0.0353 0.0880 0.0245 0.0018
0.37200.22750.05330.09980.0417 0.18420.0215
Forest-mixed 0.4848 0.0098 0.3354 0.0755 0.0191 0.0026
0.26940.03120.28720.05910.0567 0.28330.0130
Barren 0.6648 0.0357 0.1422 0.0881 0.0669 0.0024
0.38010.08760.07330.16140.0466 0.22760.0207
Wetland 0.5633 0.0154 0.2128 0.0880 0.1156 0.0049
0.30430.04550.11220.10610.1002 0.29650.0351
Water 0.5595 0.0199 0.1506 0.1101 0.0980 0.0620
Shrub-Woodland0.33530.05010.15130.09330.0535 0.30060.0159
Other0.27000.53500.11260.08990.1073 0.29370.0730
(Note: Dedza has no shrub-woodland or Other land-cover classes, and Ntcheu has no water land-cover class, so the respective cells were left blank on this table).
Table 11. Area statistics of predicted land use land cover for 2050 (Area Ha = Area in Hectares).
2050Dedza Ntcheu
Land ClassesAreaHa(%)AreaHa(%)
Agriculture329,696.784.7189,257.956
Built-up3889.41.019,643.25.8
Forest-mixed34,299.68.825,565.47.6
Barren10,608.32.722,199.36.6
Wetland9861.72.516,580.14.9
Water832.30.2--
Shrub-Woodland--54,070.016
Other--10,572.93.1
Total389,188.0100.0337,888.9100
Publisher’s Note: MDPI stays neutral with regard to jurisdictional claims in published maps and institutional affiliations.