Article

Mapping the Distribution of Summer Precipitation Types over China Based on Radar Observations

1
Key Laboratory of Environment Change and Resources Use in Beibu Gulf, Nanning Normal University, Ministry of Education, Nanning 530001, China
2
School of Geographic Sciences and Planning, Nanning Normal University, Nanning 530001, China
3
Heihe Remote Sensing Experimental Research Station, Northwest Institute of Eco-Environment and Resources, Chinese Academy of Sciences, Lanzhou 730000, China
4
Key Laboratory of Remote Sensing of Gansu Province, Northwest Institute of Eco-Environment and Resources, Chinese Academy of Sciences, Lanzhou 730000, China
5
State Key Laboratory of Internet of Things for Smart City, Department of Civil and Environmental Engineering, University of Macau, Macau 999078, China
*
Author to whom correspondence should be addressed.
Remote Sens. 2022, 14(14), 3437; https://doi.org/10.3390/rs14143437
Submission received: 7 June 2022 / Revised: 4 July 2022 / Accepted: 8 July 2022 / Published: 17 July 2022
(This article belongs to the Special Issue Remote Sensing for Precipitation Retrievals)

Abstract

:
In this study, the spatiotemporal distribution and characteristics of different precipitation types (stratiform, convective, and snow) over China are analyzed using the radar mosaic images during the summer season over 4 years (from 2018 to 2021). The convective precipitation occurs most frequently along the eastern coast regions. In June, the strong convection center is located in Southern China and moves northward to Eastern China in July, while the lowest frequency occurs in August. Stratiform precipitation dominates summer precipitation over China and mainly distributes in inland regions, with the highest frequency in August. Snowfall primarily presents in the mountains and plateau regions of Western China with the frequency of occurrence around 20%. The snowfall area in July is significantly smaller than that in June and August. The convective, stratiform, and snowfall show strong diurnal variation in terms of solar standard time (LST) especially for snowfall. The convective precipitation demonstrates a bimodal pattern, with the highest peak in the afternoon (15–16 LST) and the secondary peak in the early morning (04–07 LST). Stratiform precipitation is mainly active from the afternoon to the next morning (14–05 LST). Snowfall is significantly more common in the nighttime (around 12%) than in the daytime (around 4%). The occurrence ratio of snowfall at midnight in July is significantly higher than that in June and August. It is expected that this study on summer precipitation over China can be used as a reference to hydrometeorological research and also to improve the understanding of radar precipitation research over China.

1. Introduction

Precipitation is important for hydrologic cycle. Precipitation events vary significantly in different regions due to the influences of atmospheric circulation, land–sea distance, complex terrain, and other factors [1]. The spatiotemporal distribution of precipitation has an important implication on water resource utilization and water-related natural hazard events [2]. Precipitation can be commonly classified into two types: convective and stratiform [3,4]. Each type of precipitation can be differentiated by specific thermodynamic, dynamic, and microphysical properties [3]. In terms of the shape of the vertical profile of radar reflectivity (VPR) and the ground temperature, however, precipitation can be further categorized into five types, i.e., stratiform, convective, warm rain, snow, and hail [5,6]. China covers a vast region with complex terrain that gradually descends from west to east like three-step staircase and has a variety of climates. Such special and complex geographical location results in extremely uneven spatiotemporal distribution of precipitation in China. For example, frequent flood disasters usually dominate the southern region while drought disasters frequent the northern region.
Previous studies have found that precipitation in China has obvious regional and seasonal variations [1,7,8]. Precipitation occurs more frequently in the warm season than in the cold season. Heavy precipitation events are frequent in the East and South China due to summer monsoon. In addition, the Indian Ocean monsoon brings abundant precipitation to the southwest and southern Tibet [8]. The Asian summer monsoon contributes to form a high-frequency region of convective precipitation, especially along the coast [9]. During the warm season, the South China, the North China, and the Yangtze-Huai River Basin are the major heavy precipitation centers in China. Meanwhile, convective precipitation is considered to be the primary contributor to the total precipitation amount in warm season [10,11]. Precipitation daily peaks in northeastern and southeastern China are mostly concentrated in the afternoon, and the precipitation peak occurs in the afternoon or at the midnight in southwestern China and Qinghai-Tibet Plateau. The precipitation peak occurs more frequently during the early morning in the mid-lower Yangtze River, whereas the precipitation peak in the Jianghuai area shows a bimodal pattern (early morning and afternoon) [12].
In previous studies, the spatiotemporal distribution of precipitation is mostly derived from rain gauge and satellite observations. Rain gauges are unevenly distributed over China. The rain gauges are mainly distributed in Eastern China but are sparse in Western China. However, satellite observations are also subject to great uncertainties of the near-surface precipitation, and it is difficult to accurately estimate the rapidly developing convective precipitation. Additionally, the accuracy of satellite precipitation products is often verified using ground observation data (such as observations from rain gauge and ground-based radar). Chen et al. [13] valuated and verified the precipitation radar (PR) carried by the TRMM satellite and GPM DPR, and found that the measurement of the space-borne radar involved a relatively large error for convective precipitation [14], and similar results can be found in other reports [15,16].
Compared with rain gauge and satellite precipitation products, ground-based radar is a reliable source of weather observation data with the highest spatiotemporal resolution. The detailed spatiotemporal information of the precipitation, such as the distributions of different categories of precipitation, vertically integrated liquid water (VIL), etc. can be therefore obtained. It can better track the rapidly developing convective precipitation activities than traditional instruments. In recent years, China has deployed a dense advanced radar observation network and applied many approaches to continuously improve the quality of radar mosaics. Min et al. [17] evaluated the effective coverage of the China New Generation Weather Radar (CINCAD) and found that almost all rainy regions can be sampled by more than two radars, except for Western China, where the CINRAD suffers from more severe beam blockage than in Eastern China. Bai et al. [18] used rain gauges and the satellite precipitation product CMORPH to verify the availability of radar mosaic images, and used the radar mosaic images in South China to investigate the spatiotemporal characteristics of convection initiation over the South China during the monsoon period [19]. Therefore, the radar reflectivity mosaic product in China provides a new opportunity to better analyze the spatiotemporal variation process of precipitation, and to better understand the triggering and evolving mechanism of precipitation [7]. With the advantages of ground-based radar, studies on the spatiotemporal distribution of precipitation types in China and grasping the periodic changes of precipitation will help to understand the characteristics and evolution mechanism of precipitation in China. The object of this study is to reveal the spatiotemporal distribution characteristics of different precipitation types over China during the summer season using the radar reflectivity mosaic product, which would provide researchers in the hydrometeorology community with a detailed picture of precipitation variation over China that can be helpful in their studies related to China. Figure 1 shows the topographic features in China, rain gauge distribution and CINCAD coverage.
The rest of the paper is organized as follows: Section 2 introduces the dataset and methodology. Section 3 analyzes the spatiotemporal distribution characteristics of peak radar reflectivity and different types of precipitation over China during the summer of 2018–2021. Section 4 gives the conclusions and summary.

2. Materials and Methods
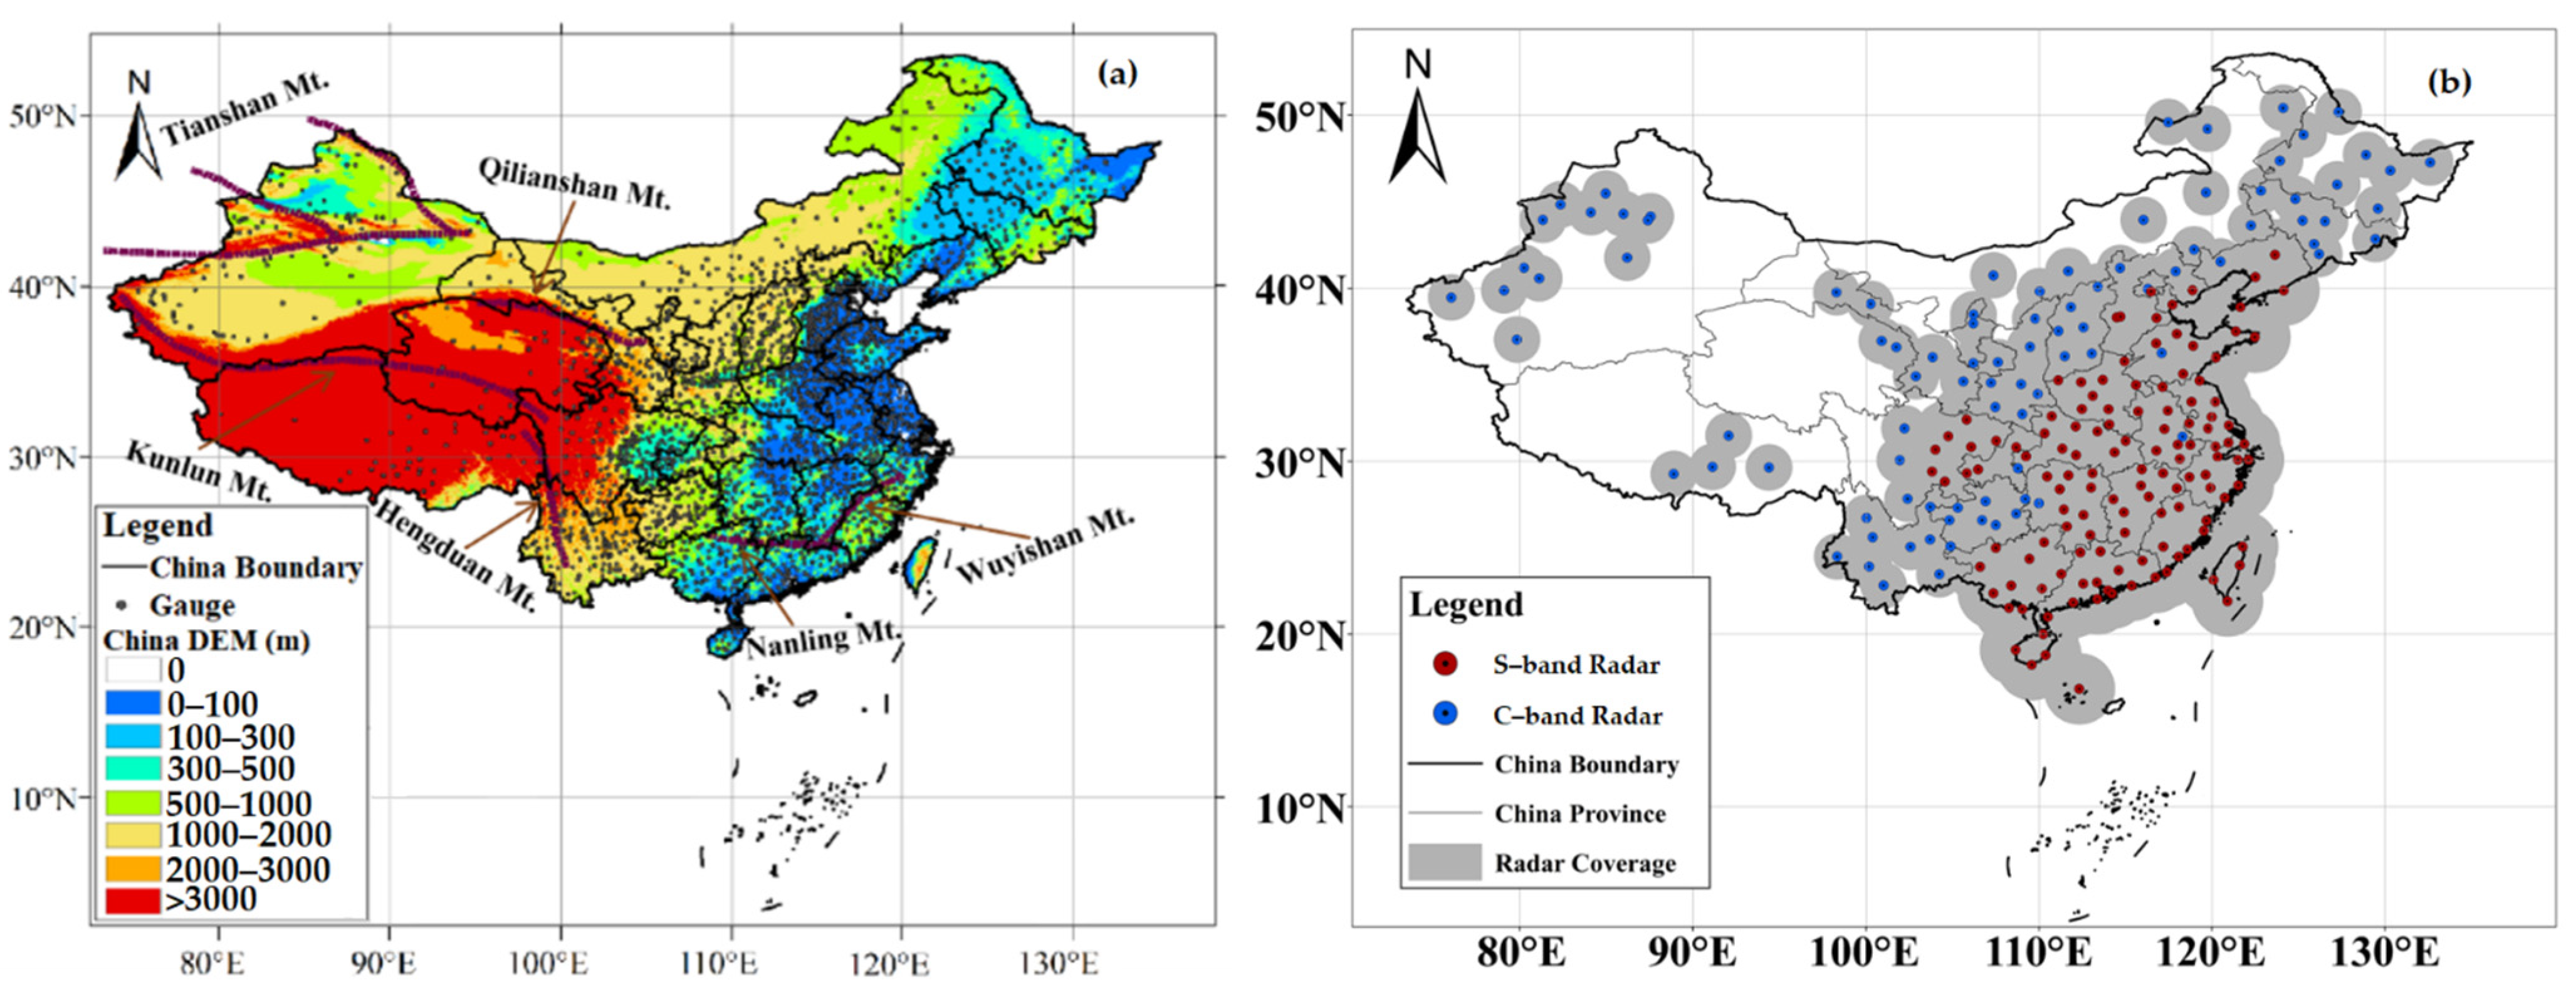
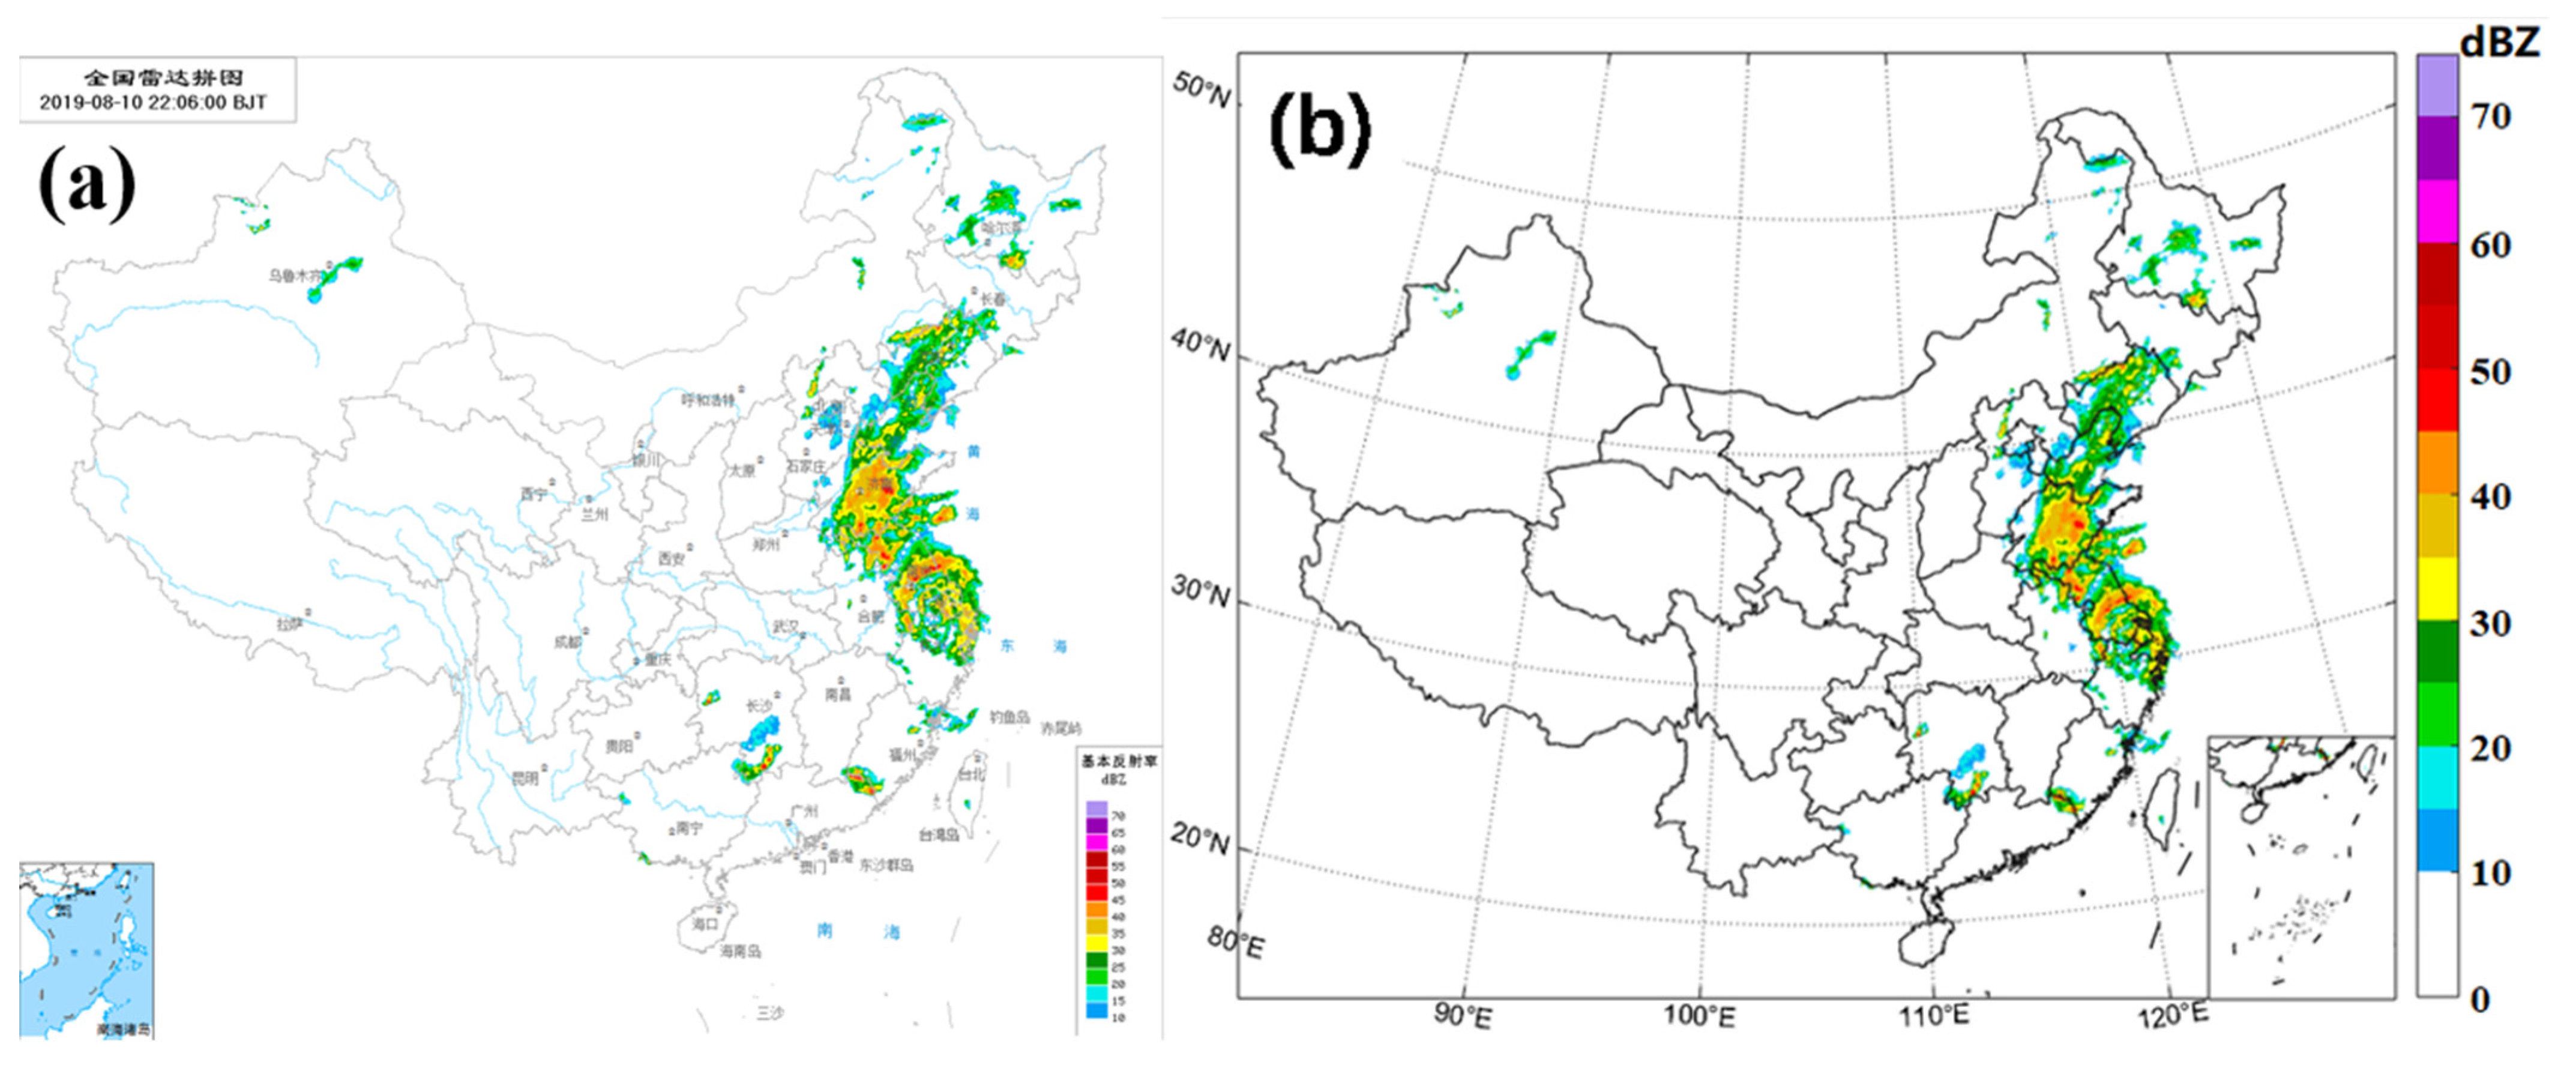
2.1. Radar Data

The radar data used in this study were derived from the radar reflectivity mosaic images released to the public by the official website of National Meteorological Center of China Meteorological Administration (CMA, available online at http://www.nmic.cn/data/online/t/4, accessed on 9 May 2022) (Figure 2a). These mosaic images were produced with the “terrain-based hybrid” scan algorithm [20], i.e., the radar reflectivity for each range and azimuth bin is an optimal selection from the observations of lowest three elevation angles (i.e., 0.5°, 0.15°, and 2.4°). During the production process, strict quality control is applied to remove the intermittent clutter and abnormal echoes like singularity and abnormal propagation (AP). Additionally, observations from geostationary satellites are used to remove clear air echo in the clear sky.
The radar reflectivity mosaic images over contiguous China are available every 6 min and constructed from 1024 × 880 grid points with an average horizontal resolution of approximately 0.05°. Since geographic annotations (place names, radar sites, rivers, and administrative boundaries) were overlapped on the radar reflectivity mosaic images, a background processing procedure was applied to remove all background information with only radar reflectivity left. In addition, a lambert re-projection embedded in Geospatial Data Abstraction Library (GDAL) was used to re-project the mosaic image to construct a new image with a spatial resolution of 2km (~0.02°) (Figure 2b). Besides, an eye inspection quality-control procedure was also applied to remove pronouncedly abnormal and damaged images. Overall, there were 85,776 usable images accounting for 98.18% of the total images during the summer of 2018–2021.

2.2. EAR5-Land

The ERA5-Land reanalysis dataset from the European Center for Medium-Range Weather Forecasts (ECMWF) was used as auxiliary data in this study (https://cds.climate.copernicus.eu/cdsapp#!/dataset/reanalysis-era5-land?tab=form, accessed on 9 May 2022). ERA5-Land is a reanalysis dataset produced by replaying the land component of the ERA5 climate reanalysis. Compared with ERA5, ERA5-Land has higher spatiotemporal resolution, with a temporal resolution of 1 h and a spatial resolution of 0.1° × 0.1°.
Two variables of 2 m temperature (t2m) and 2 m dewpoint temperature (d2m) in the ERA5-Land reanalysis dataset were used for precipitation classification during the summer from 2018 to 2021. The units of t2m and d2m variables are Kelvin (K) and can be converted to degrees Celsius (°C) by subtracting 273.15 for subsequent data processing and analysis. More information on these data is available at the Climate Copernicus website (https://cds.climate.copernicus.eu/cdsapp#!/dataset/reanalysis-era5-land?tab=overview, accessed on 9 May 2022).

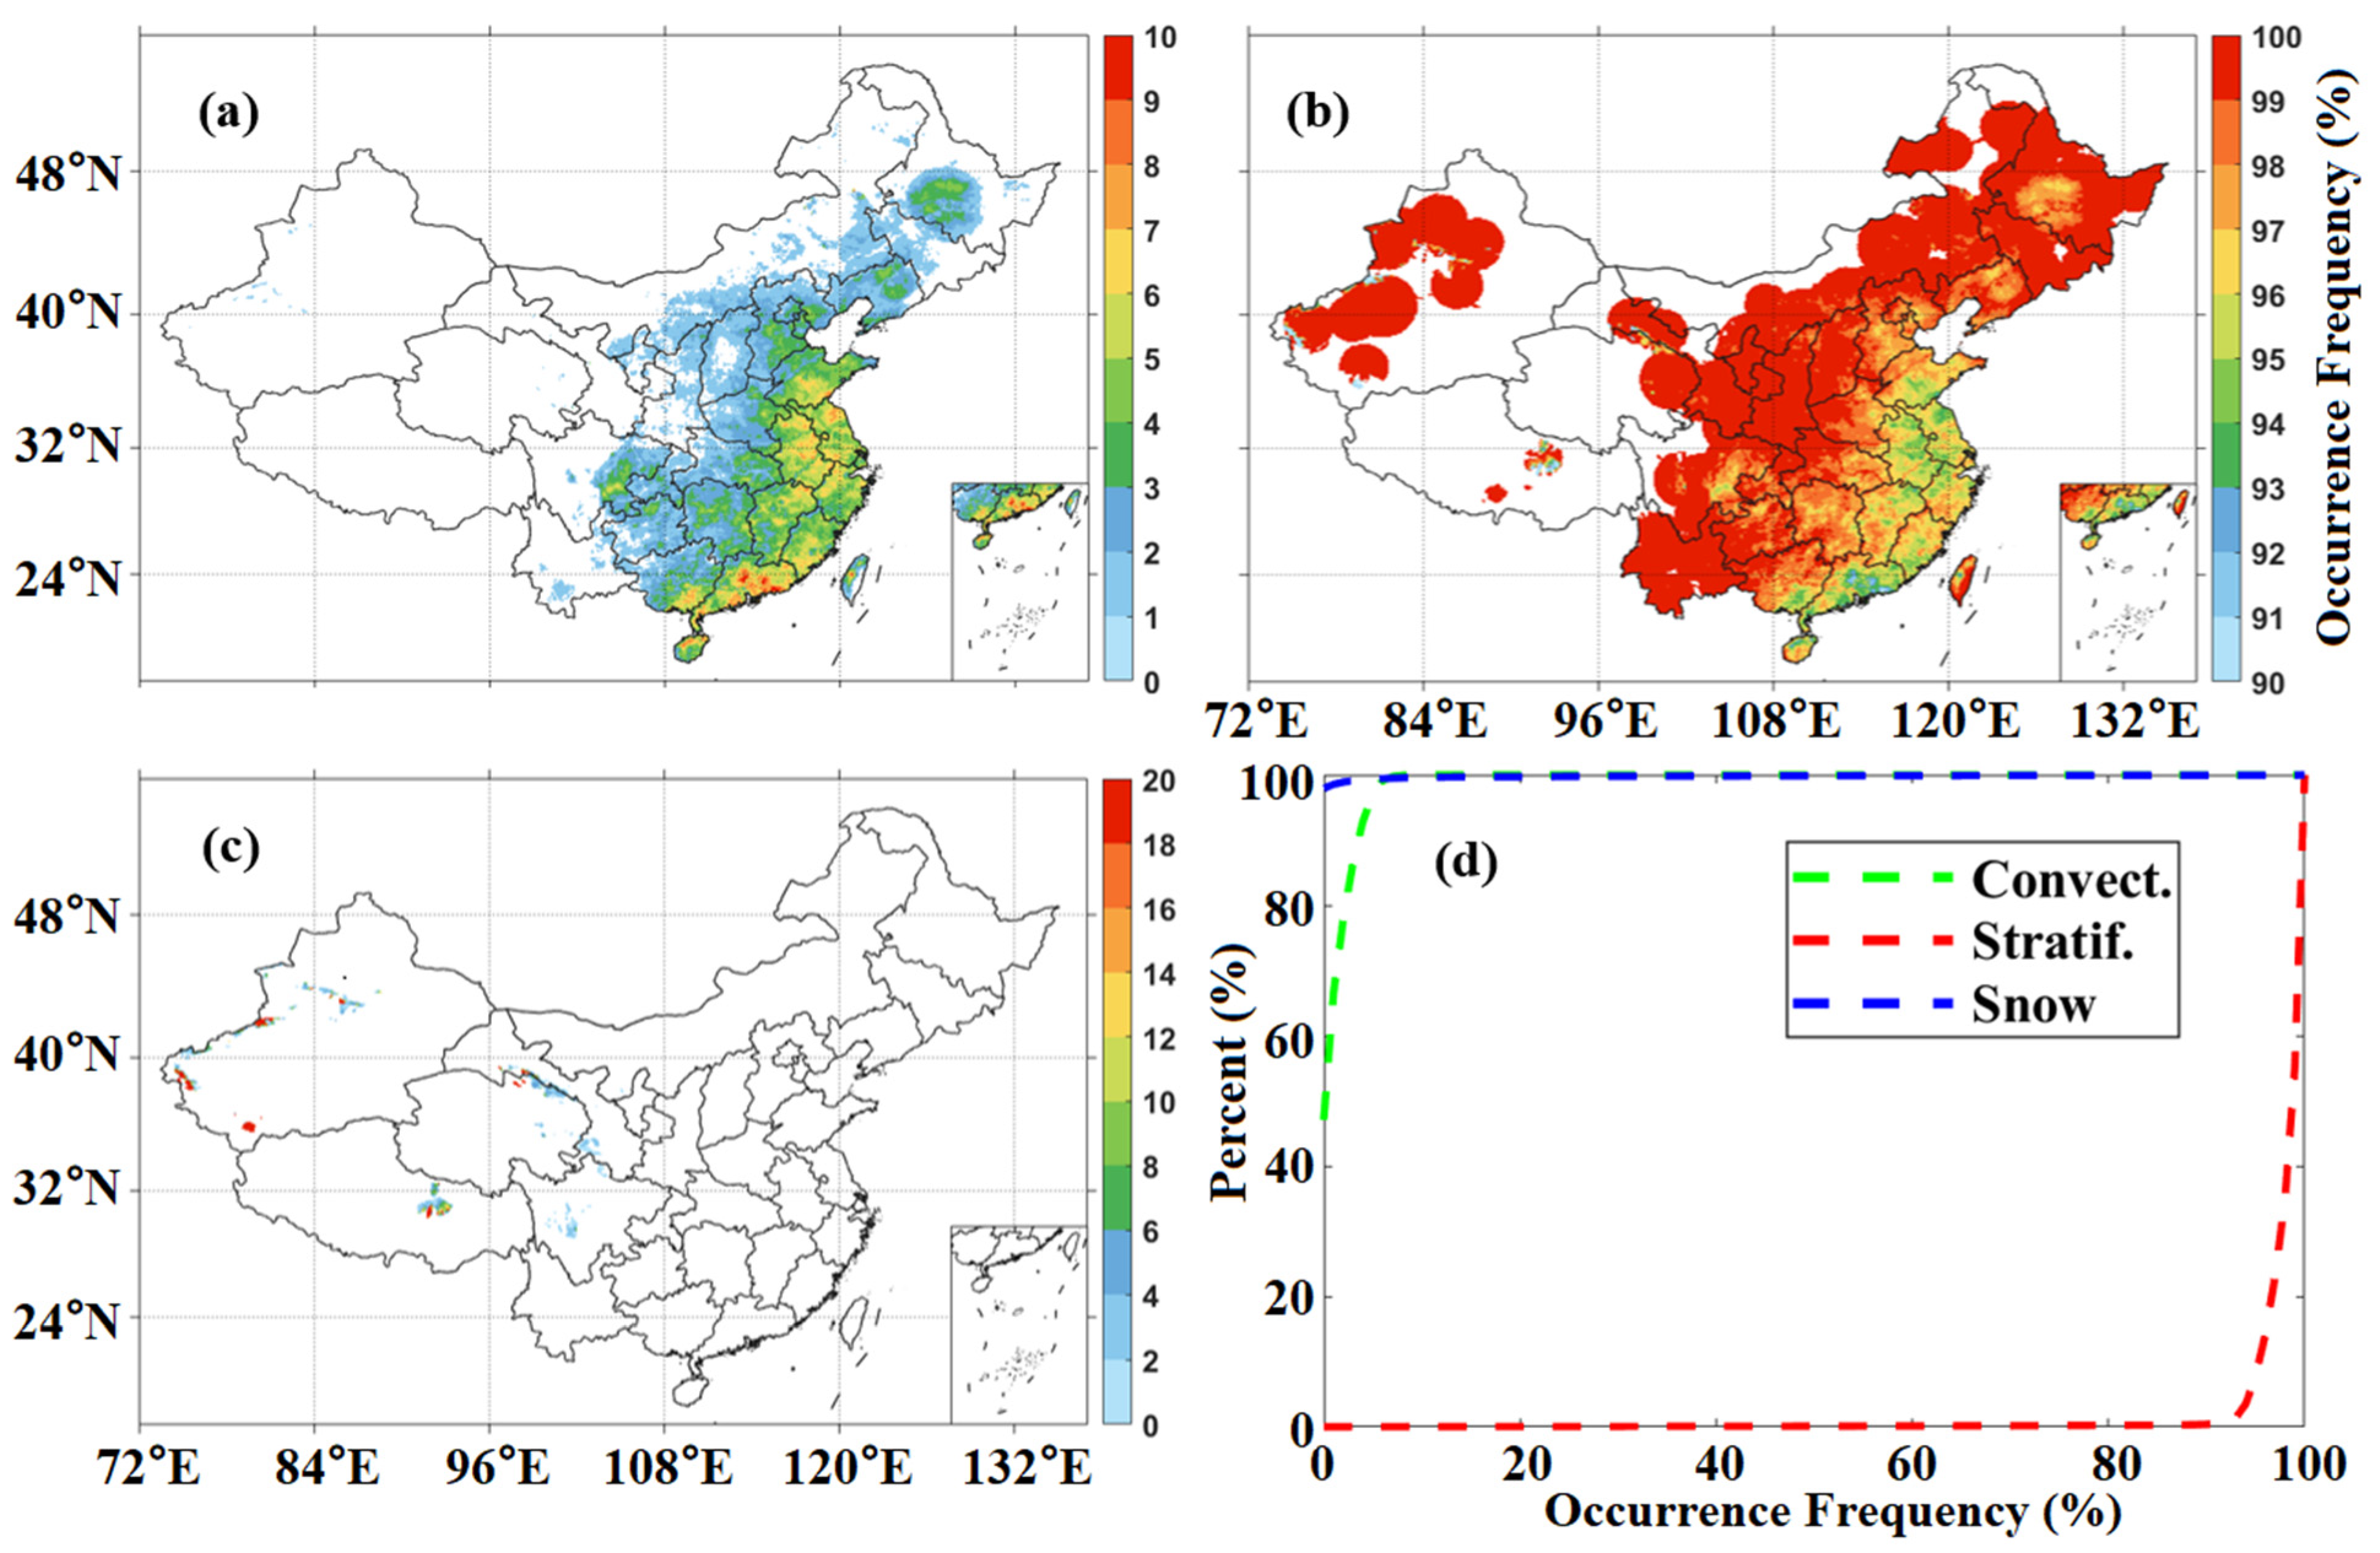
2.3. Precipitation Classification

Previous studies stated that 40 dBZ can be used as the reflectivity threshold to determine convection and discriminate convective and stratiform precipitation [18,21,22,23,24,25]. Bai et al. [18] identified convective precipitation in the warm season (April–September) over South China with a threshold of 40 dBZ and verified the accuracy of the convective precipitation dataset using rain gauges and the satellite rainfall of CMORPH [19].
The operational radar-based precipitation quantitative precipitation estimation system in National Server Storm Laboratory (NSSL) divided the QPE into five categories: (1) stratiform precipitation, (2) convective precipitation, (3) snow, (4) hail, and (5) warm rain. In this study, we refer to the precipitation classification method of Zhang et al. [6] and Chen et al. [5], and classify the precipitation into three types, including snow, stratiform, and convection with t2m and d2m in EAR5-Land as auxiliary data. The steps of classification are as follows: (1) First, determine whether there is precipitation at the grid point. If the reflectivity of the grid point is greater than or equal to 10 dBZ, then it is considered precipitation. Meanwhile, precipitation is considered snow if the t2m of the grid point is below 2 °C and the d2m temperature is below 0 °C. (2) If the precipitation is not snow, check whether the reflectance of each precipitation grid point is greater than or equal to 40 dBZ. If yes, the precipitation is judged as convective precipitation; otherwise, it is judged as stratiform precipitation.
To facilitate analysis of geographical variation of different precipitation characteristics, and to obtain enough samples to improve statistical confidence, this study firstly projects the 0.02° × 0.02° samples into 0.1° × 0.1° grids (i.e., a 0.1° × 0.1° grid contains approximately 25 0.02° × 0.02° radar grid data). Then, the spatial distribution of different precipitation frequencies is calculated based on the samples in 0.1° × 0.1° grids. The analysis method of frequency of precipitation proposed by Chen et al. [2,5] is applied to carry out the statistical analysis of precipitation based on the radar reflectivity mosaic images. The occurrence frequency of convective precipitation is defined as the ratio of the total number of convective precipitation grids to the total number of precipitations grids accumulated by grid points in the statistical period. Similarly, the occurrence frequency of stratiform precipitation (snow) refers to the ratio of the total number of stratiform precipitation (snow) grids to the total number of precipitation grids in the statistical period. The total number of precipitation grids refers to the total number of observation grids for the three types of precipitation. Based on the 0.1° × 0.1° grids, the maximum reflectivity of each grid point in the statistical period is taken as the peak reflectivity (PR) of that grid point, and the time when the maximum reflectivity appears in the statistical period is recorded, and the hour when the maximum reflectivity appears most frequently is selected as the timing of peaks in reflectivity (PRT) of that grid point.

3. Results

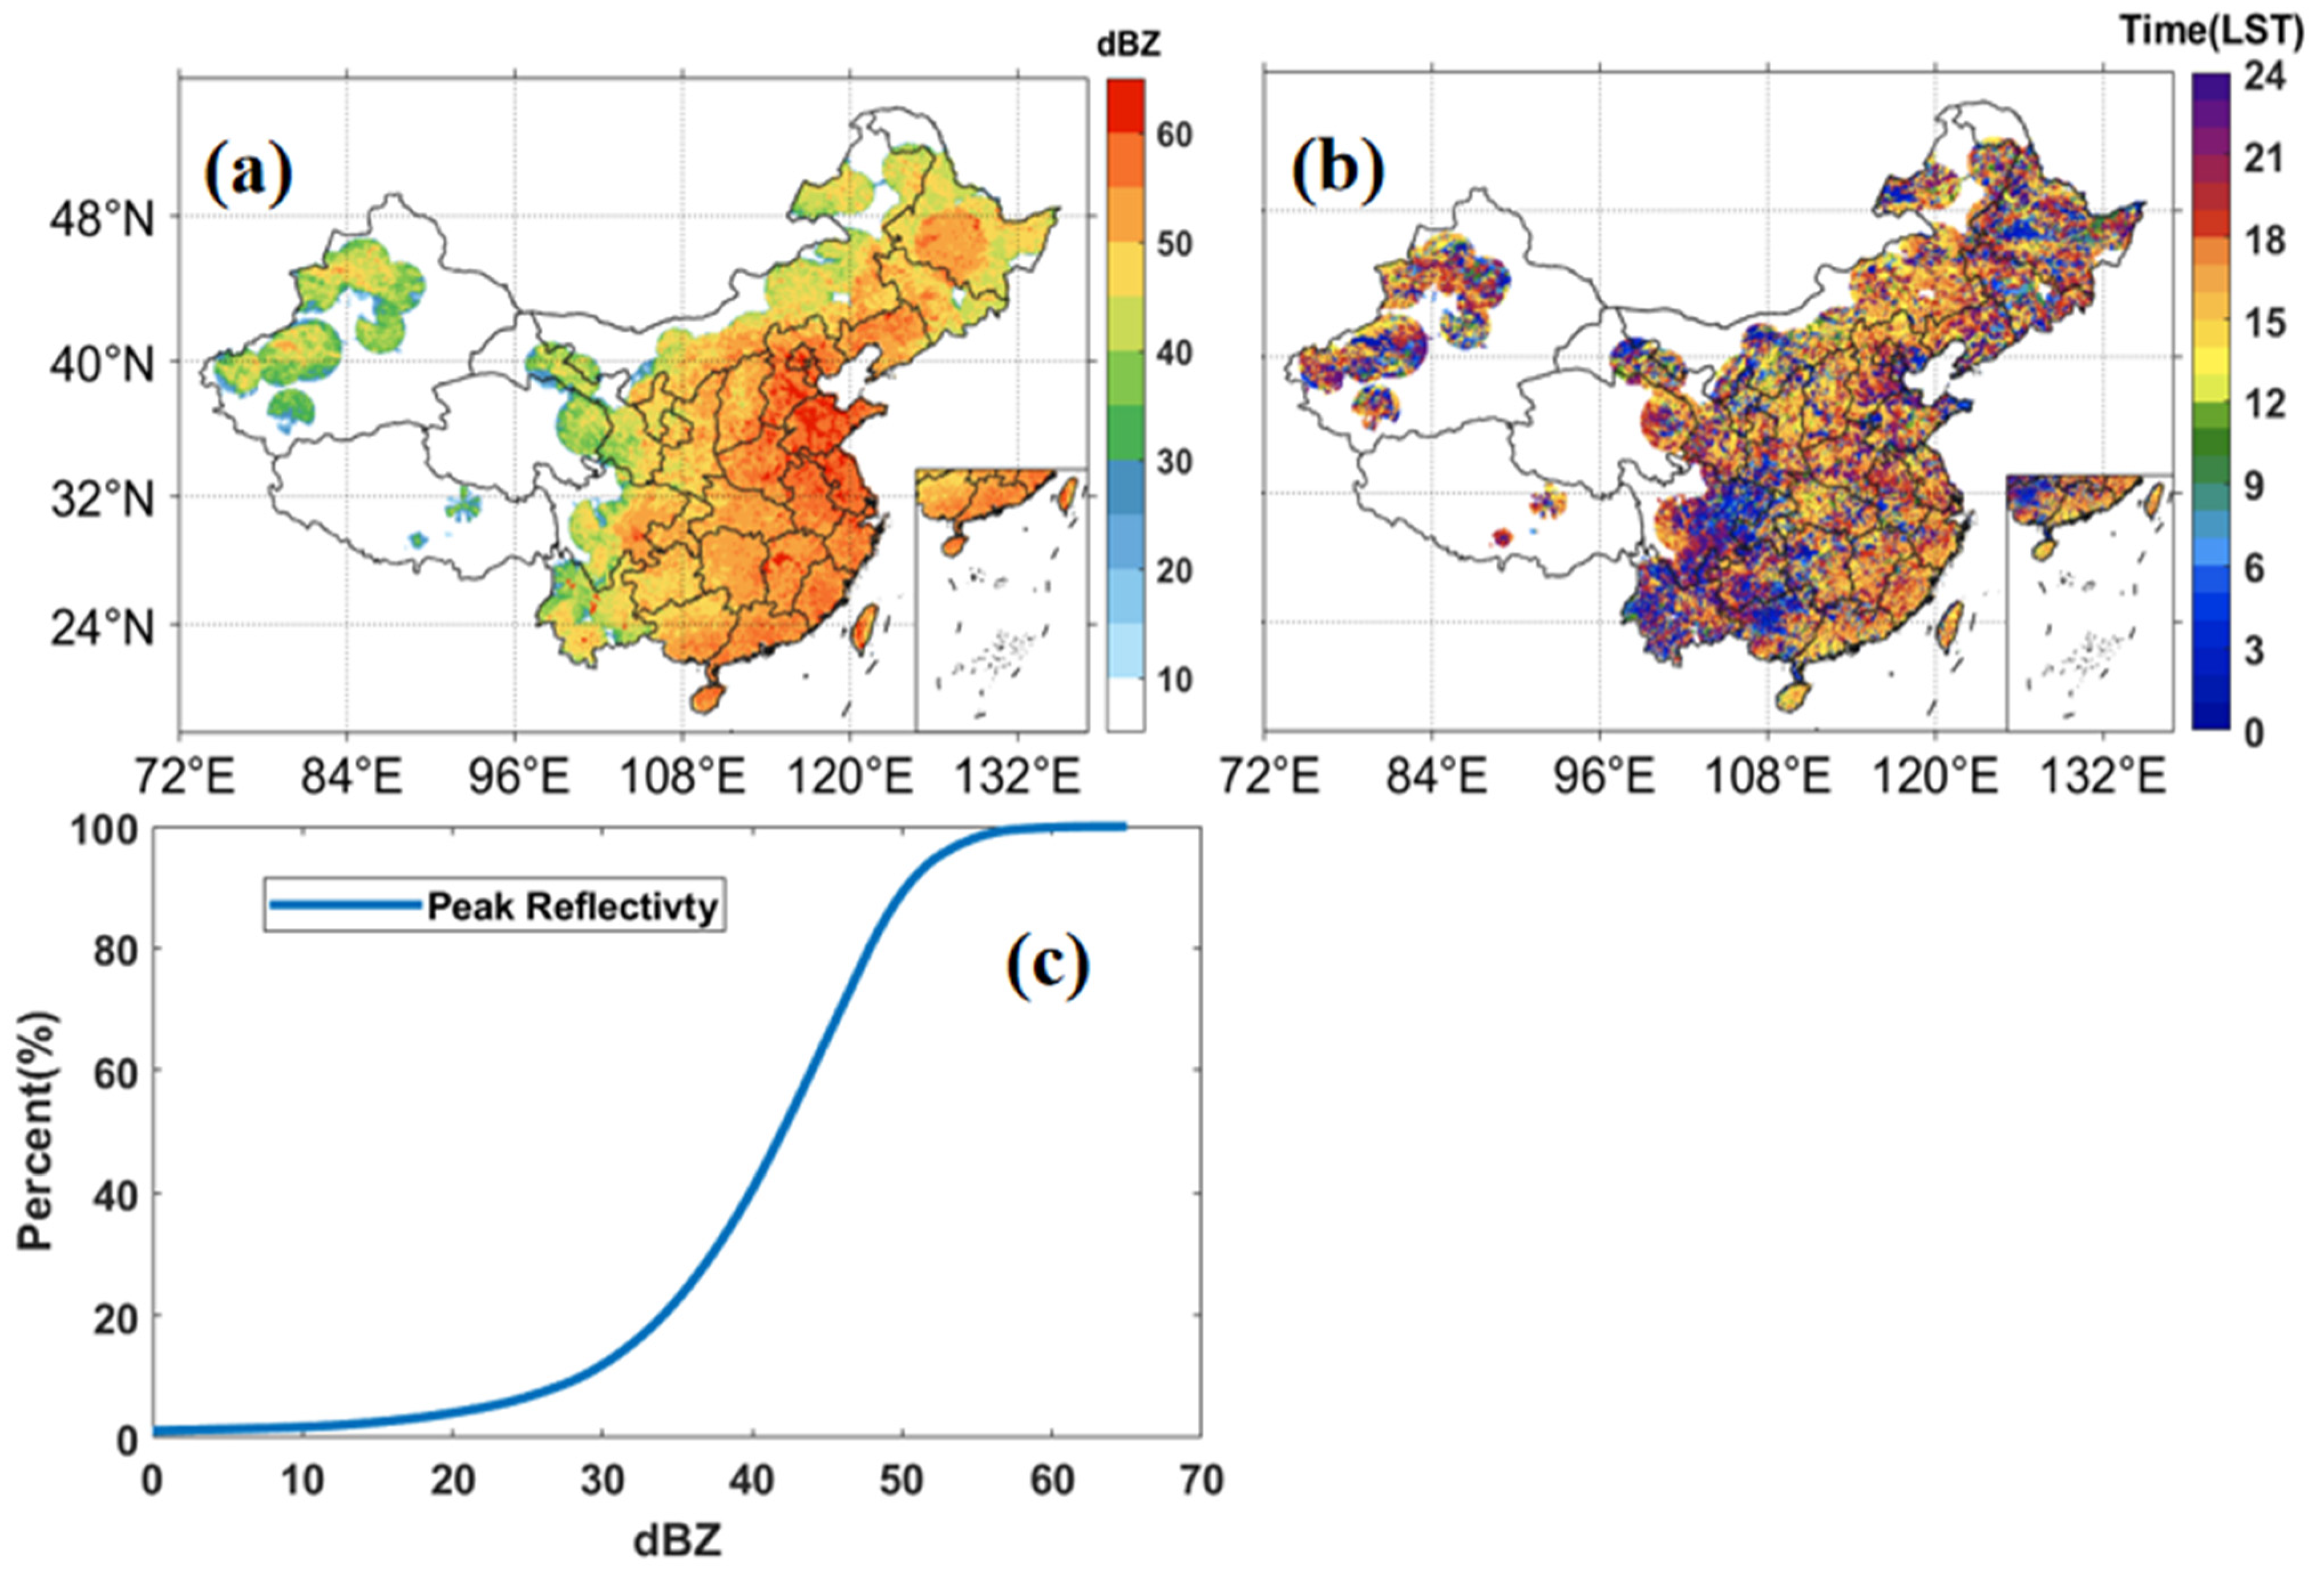
3.1. Summer Variations

Figure 3 shows the spatial distribution of different precipitation types and the cumulative probability distribution of occurrence frequency for different precipitation types. It is noted that different types of precipitation in China have pronounced geographical differences. Convective precipitation has high occurrence over Southern and Eastern China, mainly because the East Asian summer monsoon brings heavy precipitation to the Southern and Eastern China, and tropical cyclones also cause large amounts of convective precipitation over Southern and Eastern China [26,27]. Stratiform precipitation dominates summer precipitation in China, and the incidence of stratiform precipitation in almost the whole of China is higher than 90%, especially in the inland regions of Western China. In contrast, snowfall has pretty low occurrence ratio in summer over China and is mainly distributed in the mountainous regions of Western China. The snowfall occurrence ratio reaches more than 20% over the Tianshan Mountains and Kunlun Mountains where the snowfall is more intense than other regions. As shown in Figure 3d, convective precipitation has a low occurrence during summer, with most areas of convective precipitation having an incidence between 0% and 10%. The stratiform precipitation has high occurrence (>90%) and almost the whole of China has a high occurrence of stratiform precipitation, while the occurrence frequency of snowfall is very low, almost below 5%.
Figure 4 shows the spatial distribution of peak reflectivity (PR), the timing of reflectivity peaks (PRT), and the cumulative probability distribution of the peak reflectivity. The PR spatial distribution is similar to the convective precipitation. The PR in the coastal regions of Eastern China is significantly higher than that in the western inland regions, especially in coastal regions where the reflectivity is greater than 60 dBZ. The PR in parts of Northeast China, North China, Southwest China, and the western periphery of Xinjiang can reach more than 50 dBZ. In addition, it can be seen from PRT (Figure 4b) that a majority of PR occur in the afternoon (13 LST) to the evening (19 LST), and the PR in southwestern China occurs during the nighttime (21–05 LST).

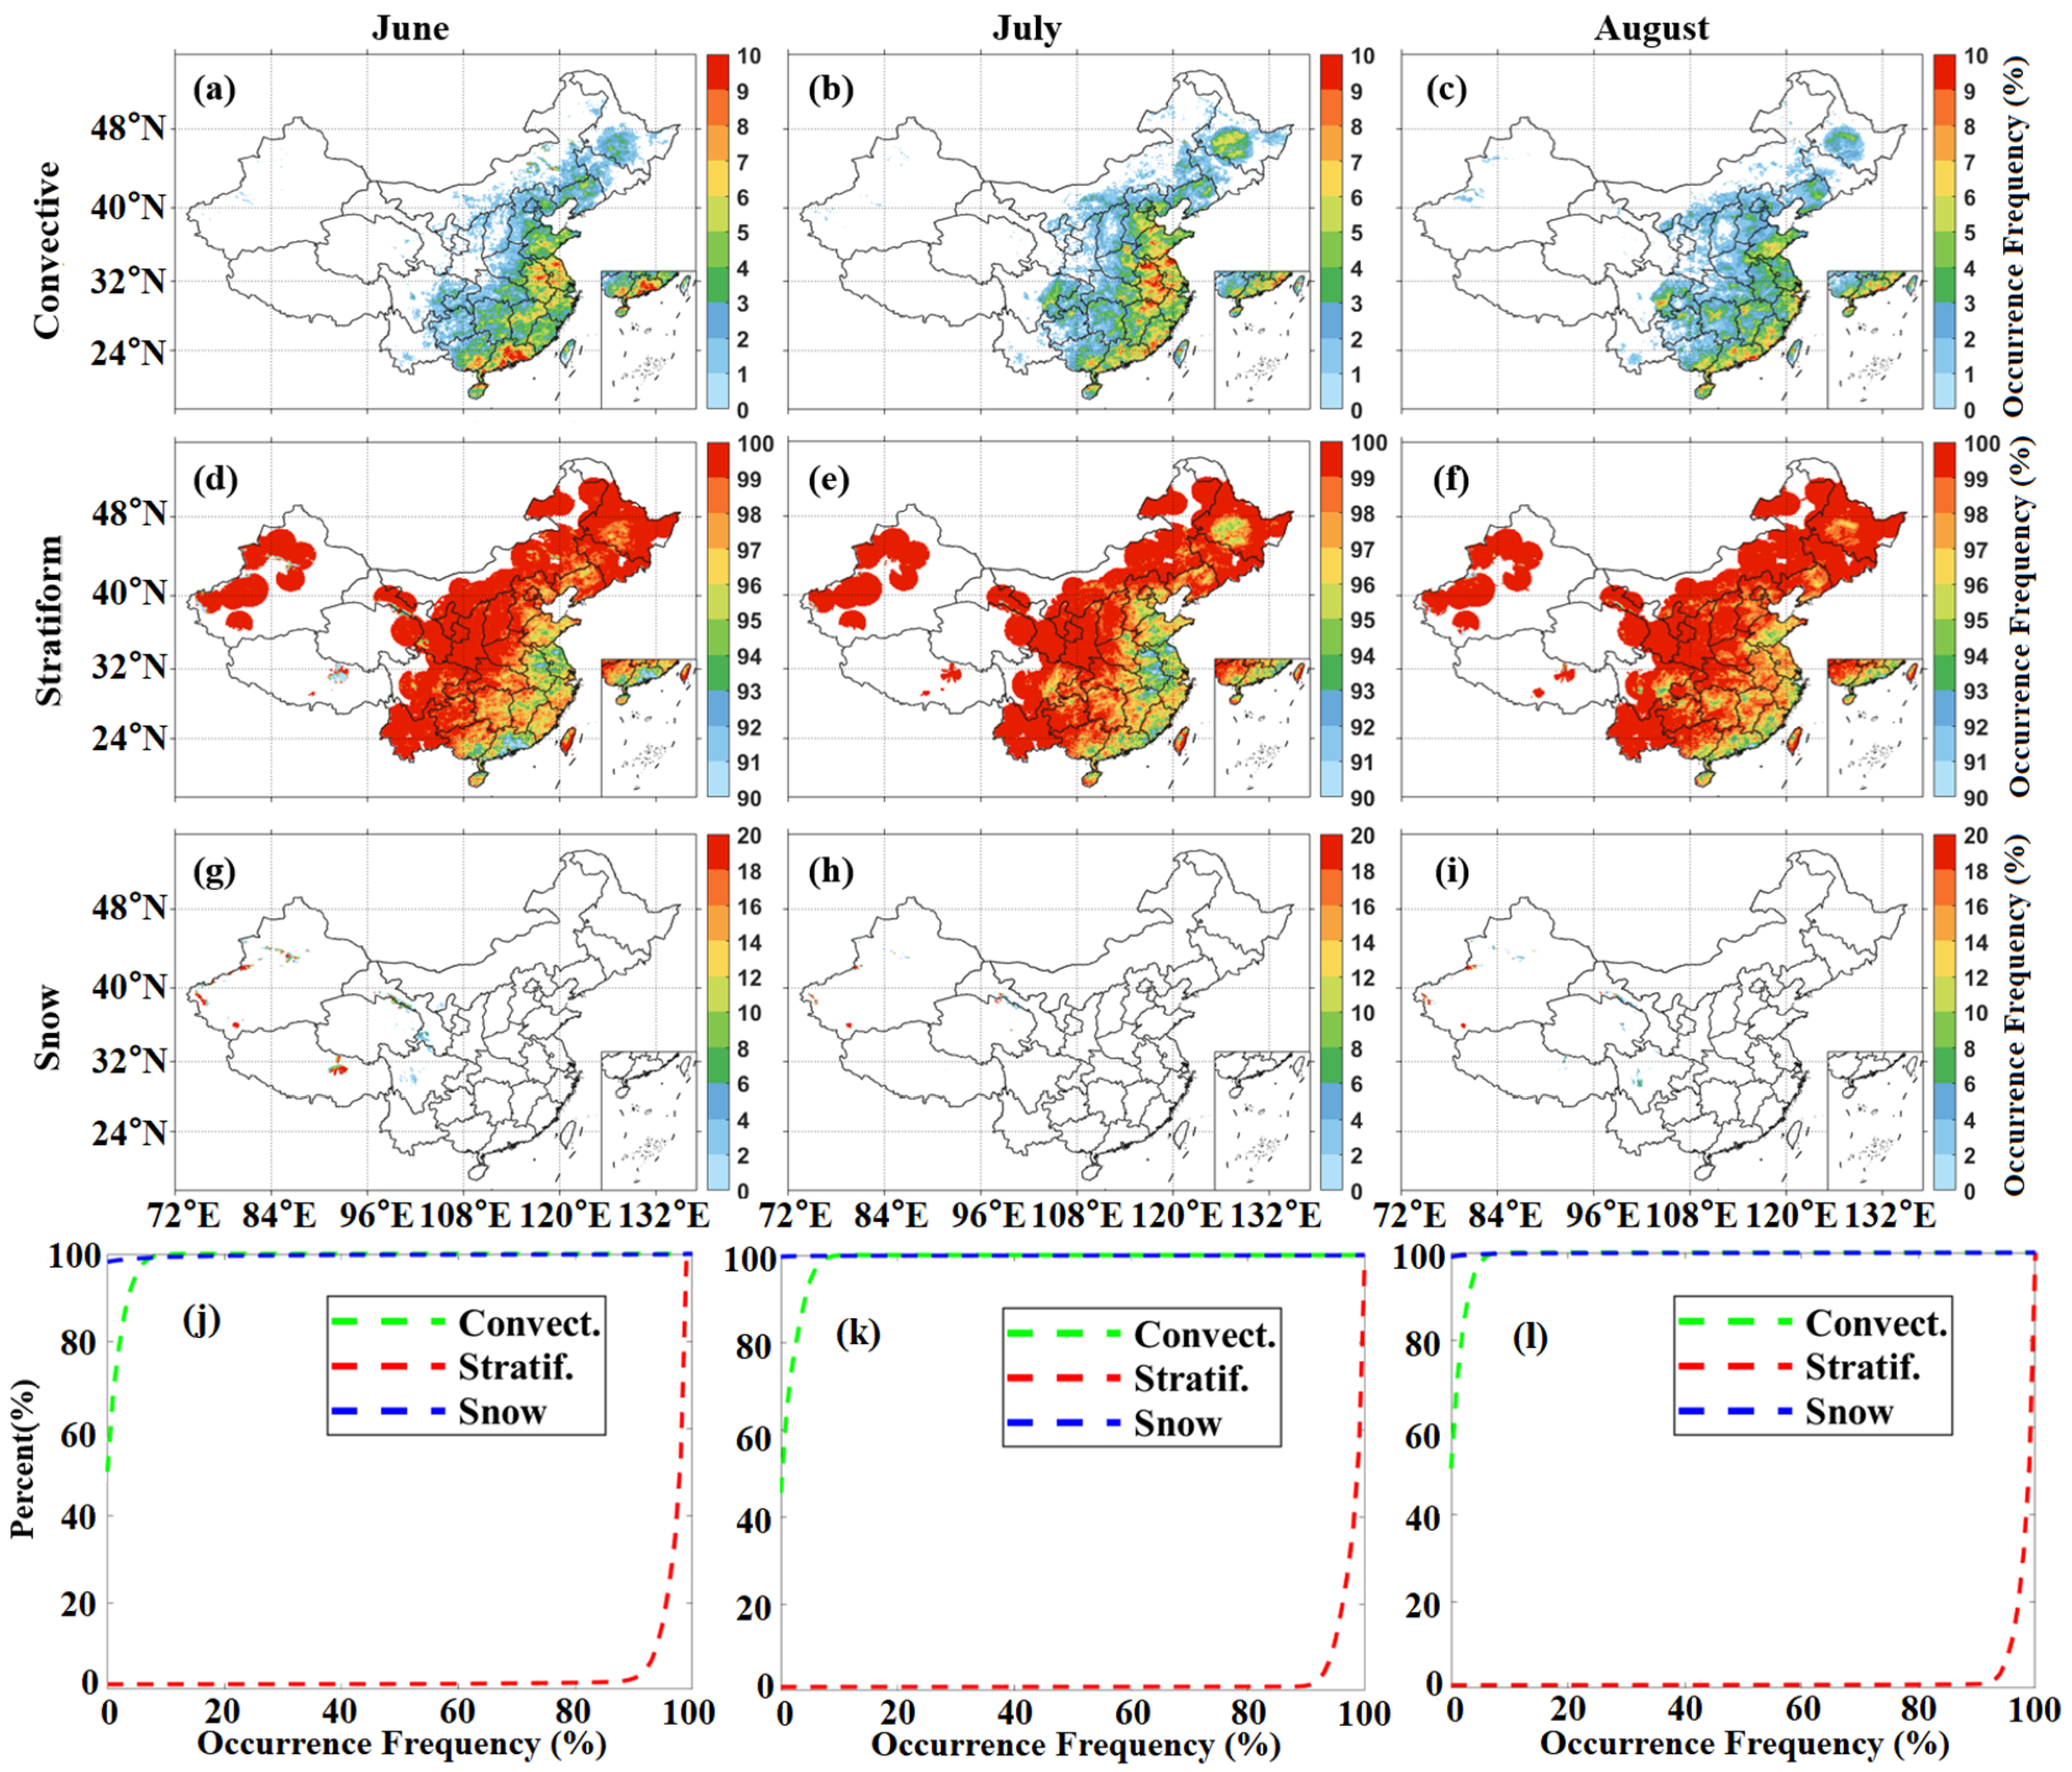
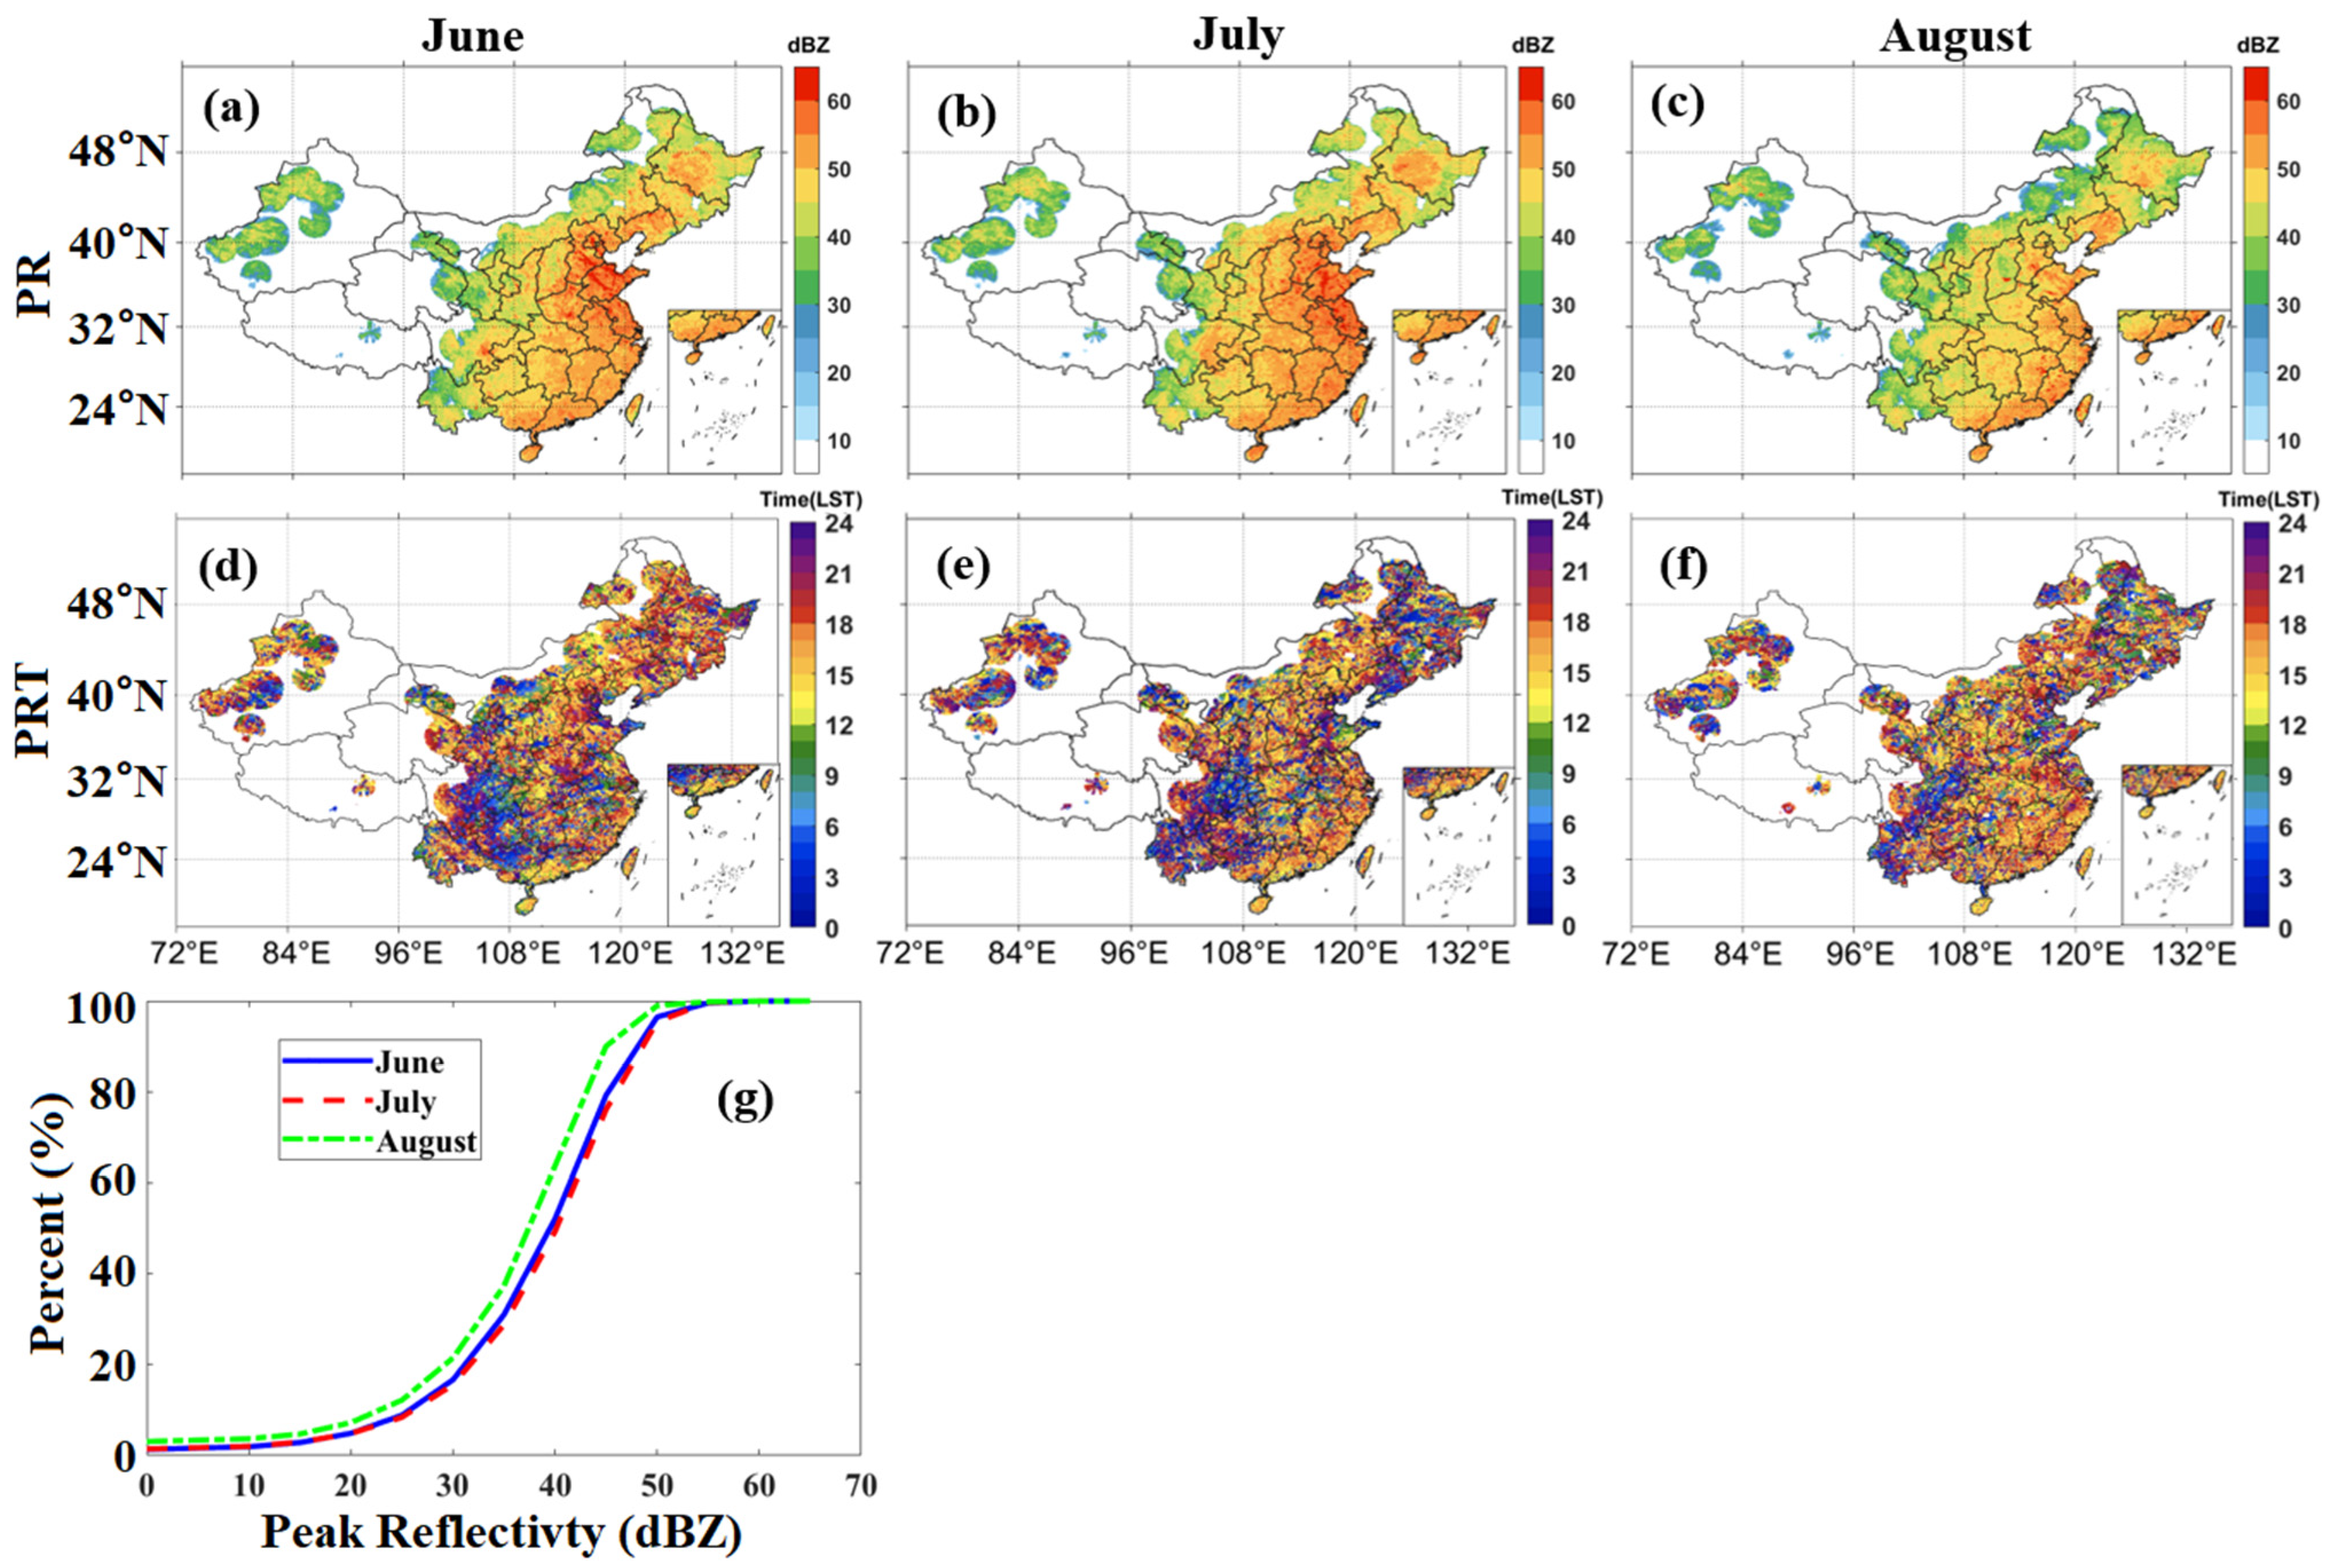
3.2. Monthly Variations

The spatial distribution of monthly precipitation occurrences for each precipitation type is shown in Figure 5a–i, and the corresponding cumulative probability distributions of precipitation occurrence of each precipitation type are illustrated in Figure 5j–l. The results show that the spatial distribution pattern of occurrence frequency of each precipitation type shows very significant monthly variations in China during summer. It can be seen that the convective precipitation occurs most frequently along the coast region than in inland region. Most convective precipitation with occurrence between 0 and 10% from June to August, with a slightly lower frequency of convective precipitation in August compared to June and July. In June, the occurrence ratio of convective precipitation is low (<8%) with the most intense precipitation located in southern China (Guangdong, Guangxi, and Hainan) especially the Pearl River Delta, and the occurrence of convective precipitation in Northern China and Eastern China (Shandong, Jiangsu, Zhejiang, Anhui, and Jiangxi provinces) is also more frequently than their circumjacent areas. In July, the center of convective precipitation shifted from Southern China to Anhui Province and its adjacent regions in Eastern China, and the occurrence ratio of convective precipitation also increased compared with June. This phenomenon is probably related to the northward movement of the summer rainband since July [7]. In August, the occurrence ratio of convective precipitation significantly declines over China; however, several centers of strong convective precipitation still appear along the southern China coast and the mid-lower Yangtze River.
Stratiform precipitation prevails over the whole China during summer, occupying the dominant position over China during summer. Stratiform precipitation has a high occurrence (>90%) over the whole of China, especially in August, with stratiform precipitation occurrences between 95% and 100%. Stratiform precipitation events are most frequent in inland China. In July, the area of the high-frequency zone of stratiform precipitation is slightly smaller than that in June. In August, stratiform precipitation continued to dominate China, and the occurrence of stratiform precipitation became more frequent. Snowfall is extremely rare during summer in China, almost with low occurrence (<5%), and snowfall occurrence is overwhelmingly distributed within 10%. It mainly occurs in the mountainous zones of the northwestern China (the Kunlun Mountains, Tianshan Mountains, Qilian Mountains, and Hengduan Mountains) and plateau regions (Qinghai-Tibet Plateau). In June, snowfall has high occurrence (20%) over the northern Tibetan Plateau and the Tianshan Mountains, and it has low occurrence (<6%) in the Qilian Mountains and Hengduan Mountains. In July and August, the snowfall area is significantly reduced, and the snowfall areas are scattered in the northwestern mountains.
Figure 6 shows the monthly spatial distribution and cumulative probability distribution of the peak reflectivity (PR). The results show that the PR have a similar spatial pattern to the convective precipitation with pronouncedly regional differences, and the PR along the coastal area is generally higher than those in inland area. Approximately 60% of the areas in China that can be observed by radar have PRs of more than 40 dBZ in summer. In June, the highest PRs occur in the Bohai Rim and Eastern China. In addition, the southern China coast and the southeastern Sichuan Basin also have high PR. The spatial distribution of the PR in July is similar to that in June, but the area above 45 dBZ increases. The high PR is still visible in the Bohai Rim and Eastern China. The PR also increased significantly over the Northeast, Central, and Southern China as well as the Sichuan Basin. In August, the PR shows a marked decrease throughout the whole of China. The areas with higher PR than 50 dBZ follow an elongated distribution along the eastern China coast.
As shown in Figure 6d–f, in most regions of China, the RPT often occurs in the afternoon (14 LST) to midnight (03 LST). In June, the RPT often occurs form the night (20–03 LST) in the mid-lower Yangtze River, and most parts of southwest China (eastern Sichuan, Guizhou, Guangxi, and northeastern Yunnan). The PRT in the northeastern, northern, and southern coast of China occurs mostly around the afternoon (13–18 LST). The PRT varies from the afternoon (14–18 LST) in the north of Tianshan Mountains to the nighttime (20–03 LST) in south of Tianshan Mountains, which is consistent with the report by Chen et al. [8] for the timing of peaks of precipitation amount and frequency over China during summer. The RPT varies from the afternoon in the northern part of the Tianshan Mountains to the nighttime in the southern part, which is consistent with the structure pointed out by Chen et al. [8] for the peak time of summer precipitation and the peak time of precipitation frequency in China. Such a phenomenon would be produced under the impact of the mountain–plains solenoids circulation between the Taklimakan Desert and the Tianshan Mountains. The PRT in July is similar to that in August, with an earlier peak along the coastal of China and later in the inland regions. The PRT occurs mostly at night (21–03 LST) in the southwestern and northeastern China, whereas the PRT in the central, northern, and eastern coastal regions occurs in the afternoon (12–18 LST).
Generally, the PR shows a similar spatial distribution pattern to the convective precipitation, the PR increases gradually from west to east (inland to coastal regions), and the reflectivity in coastal regions basically peaked earlier than in inland regions.

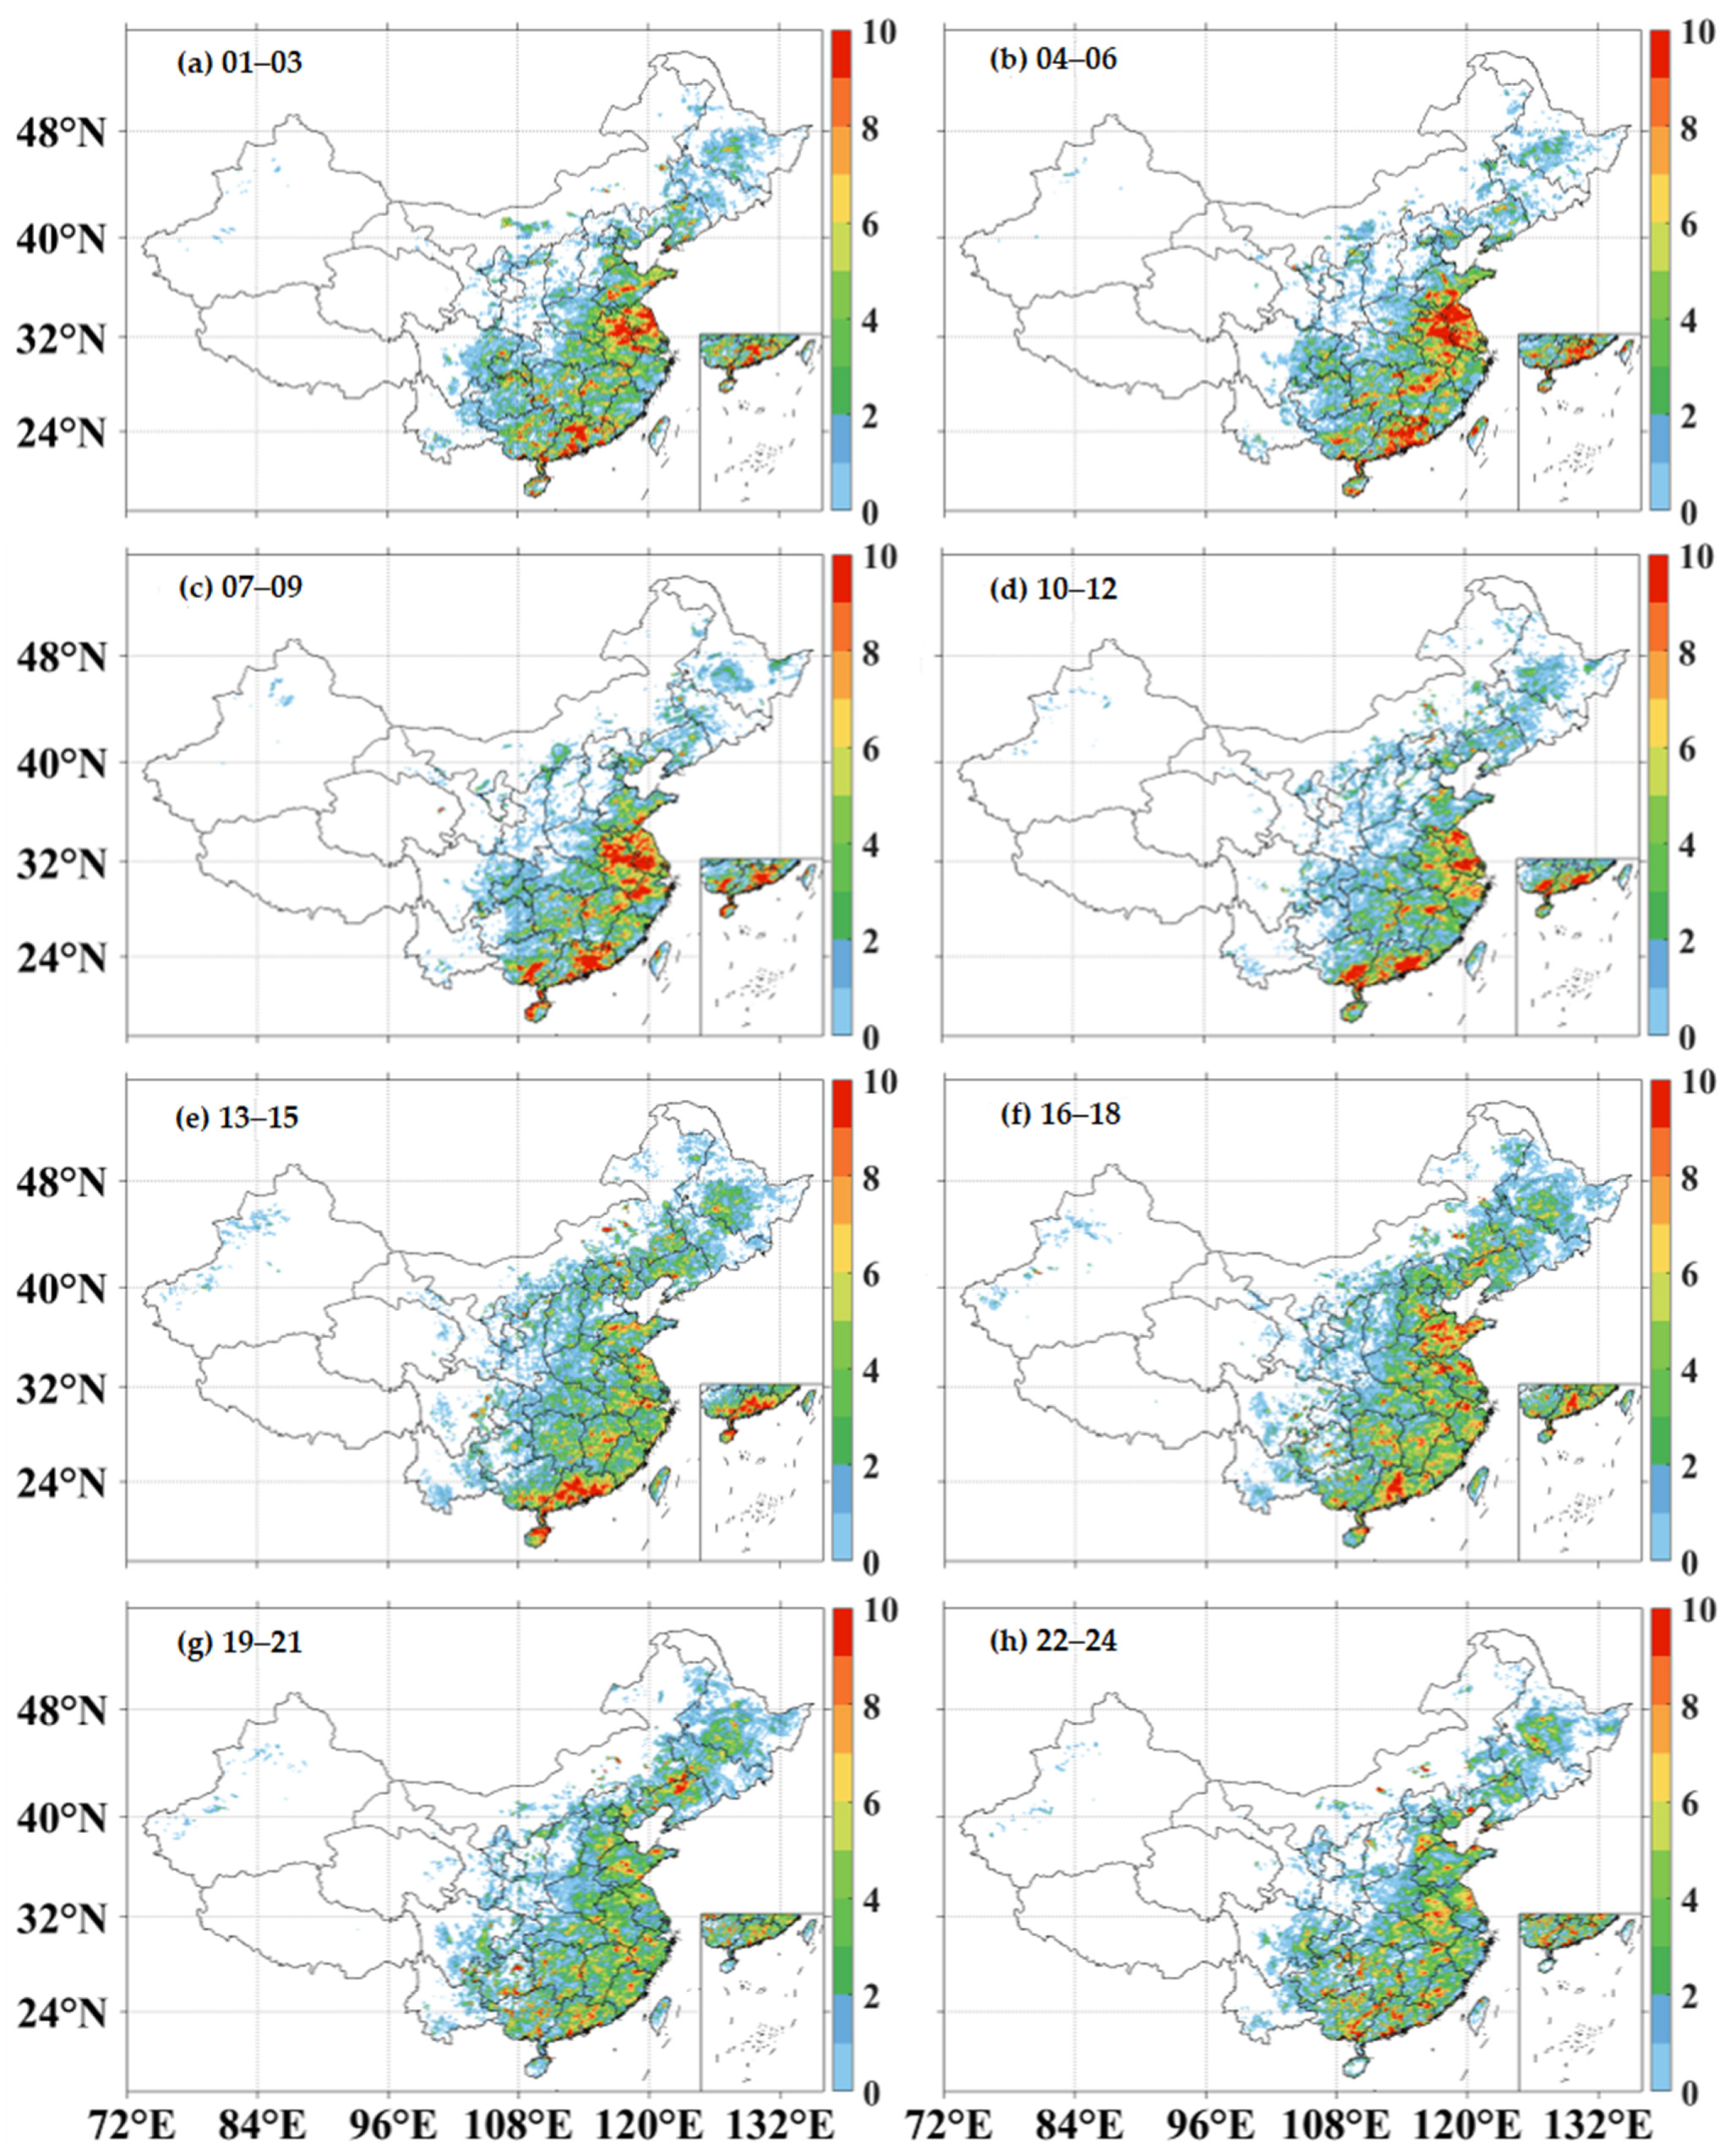
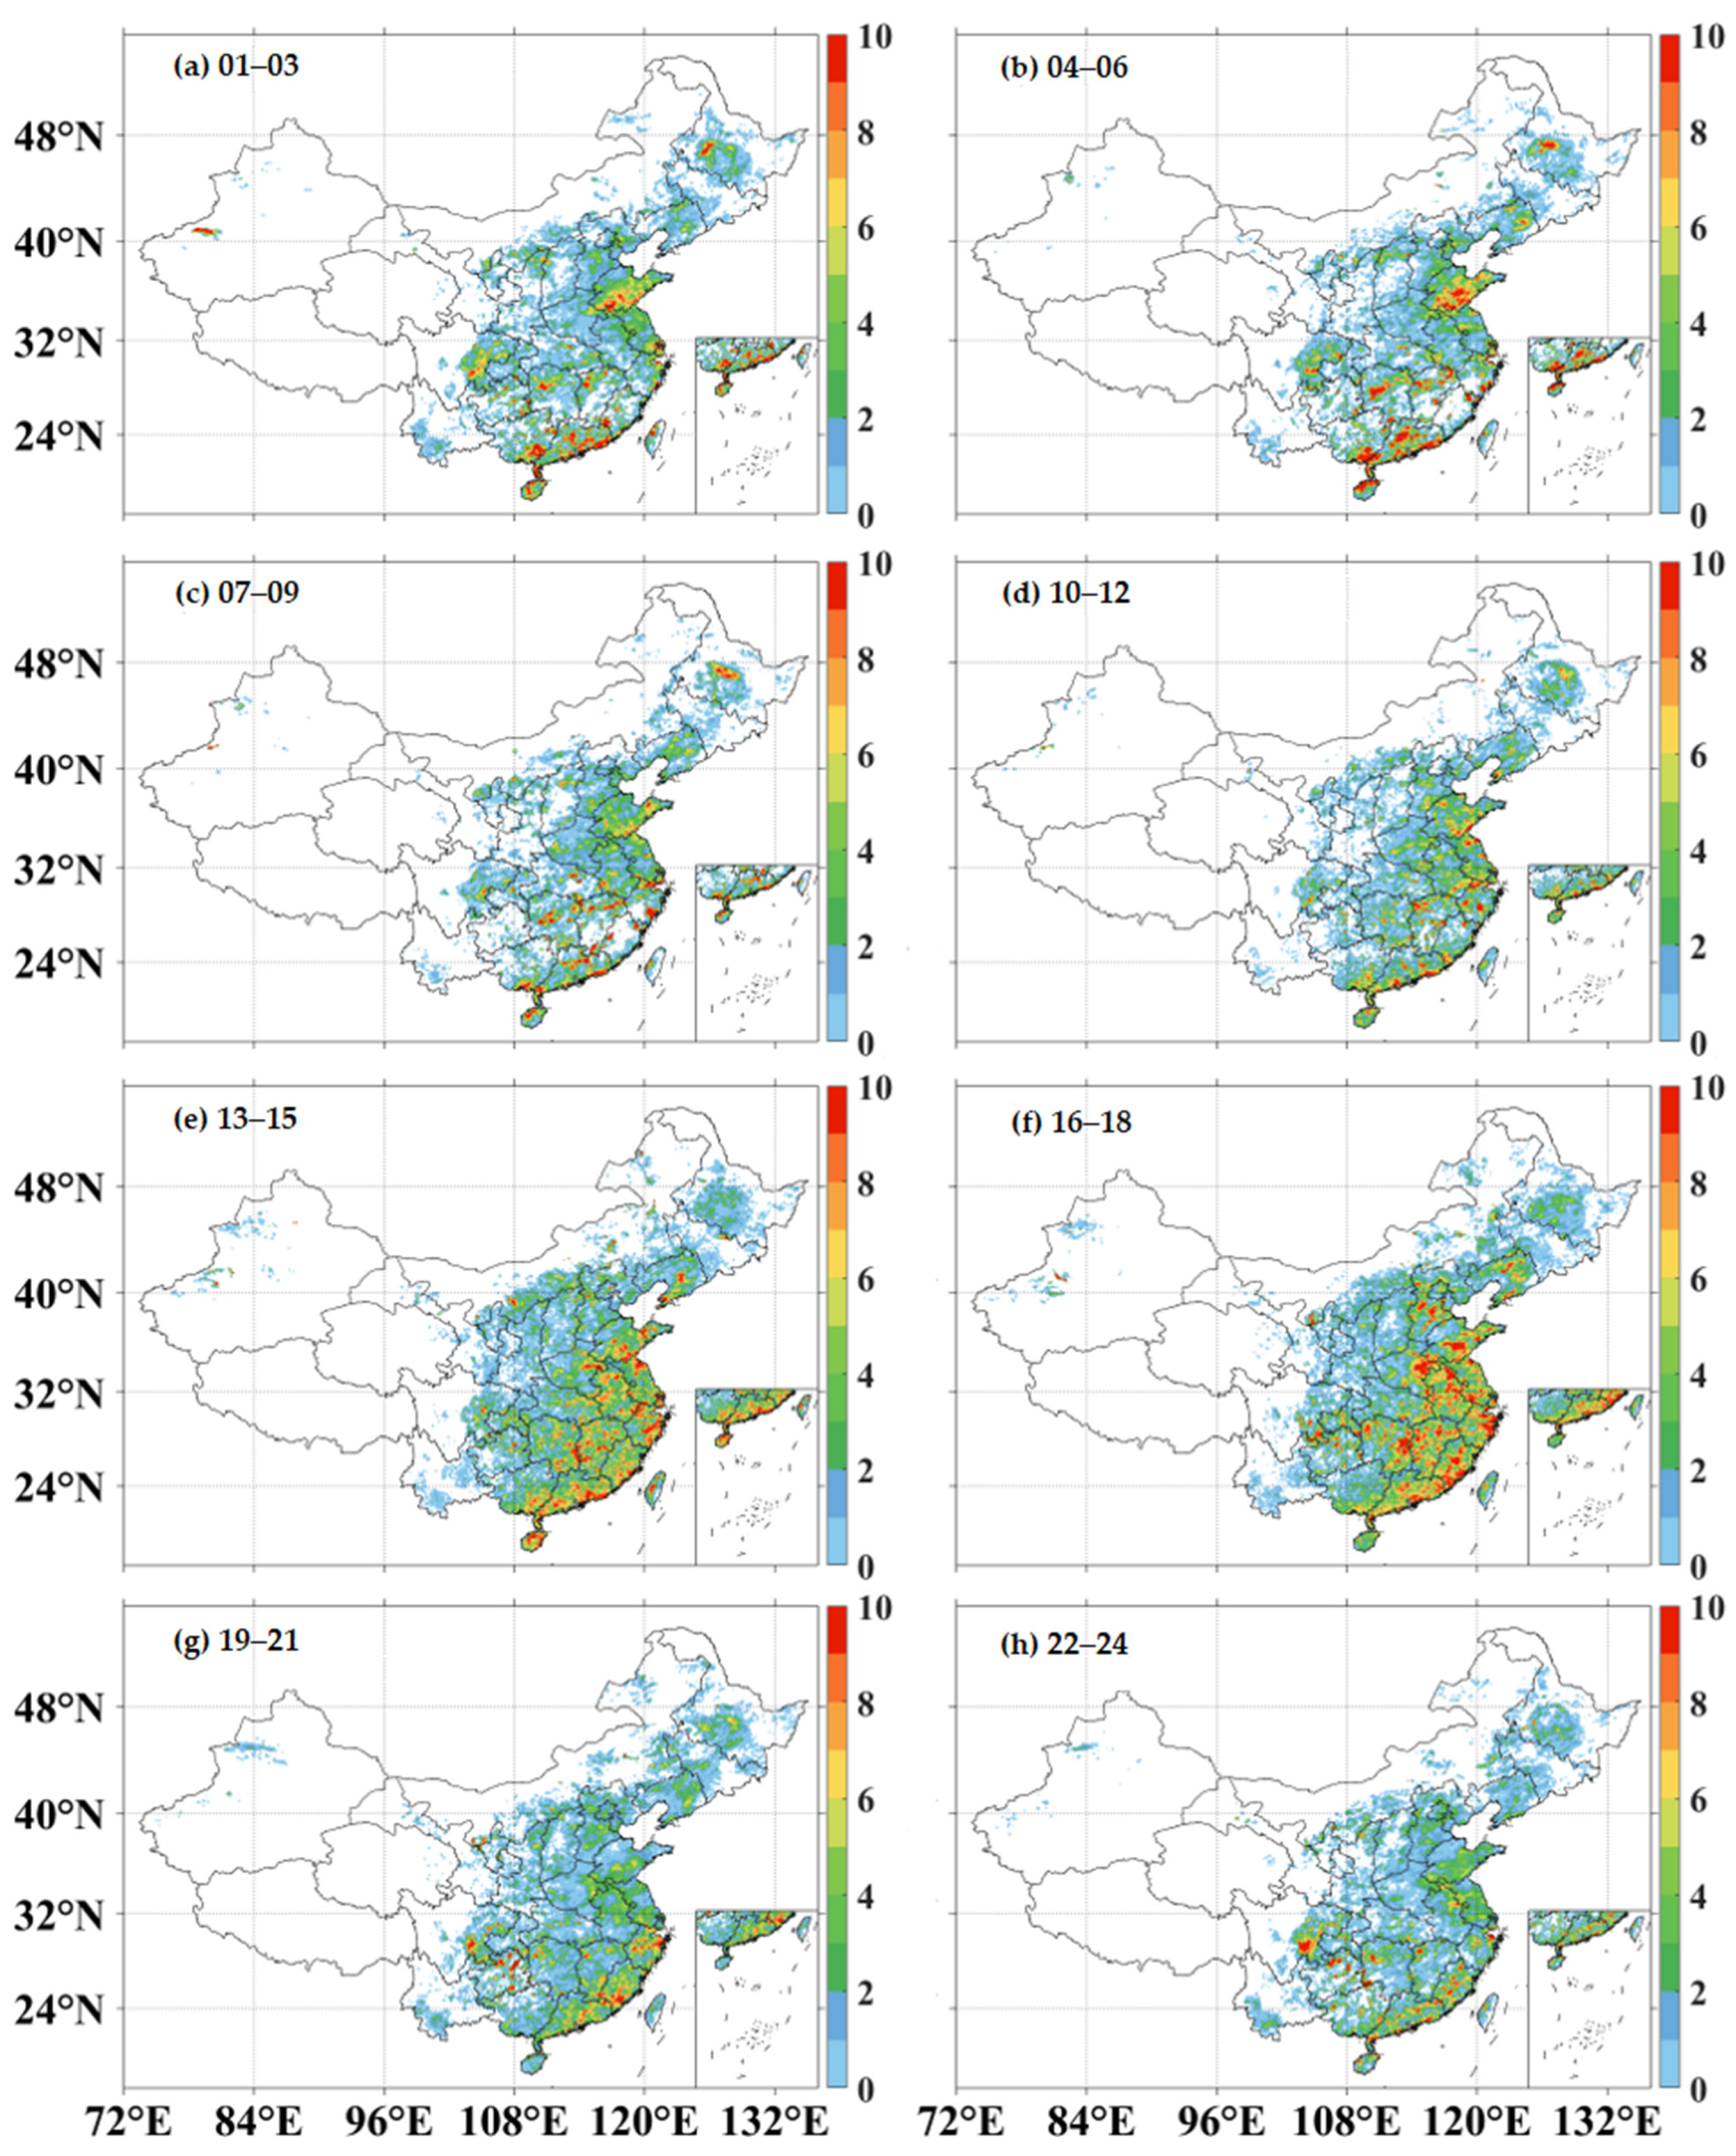
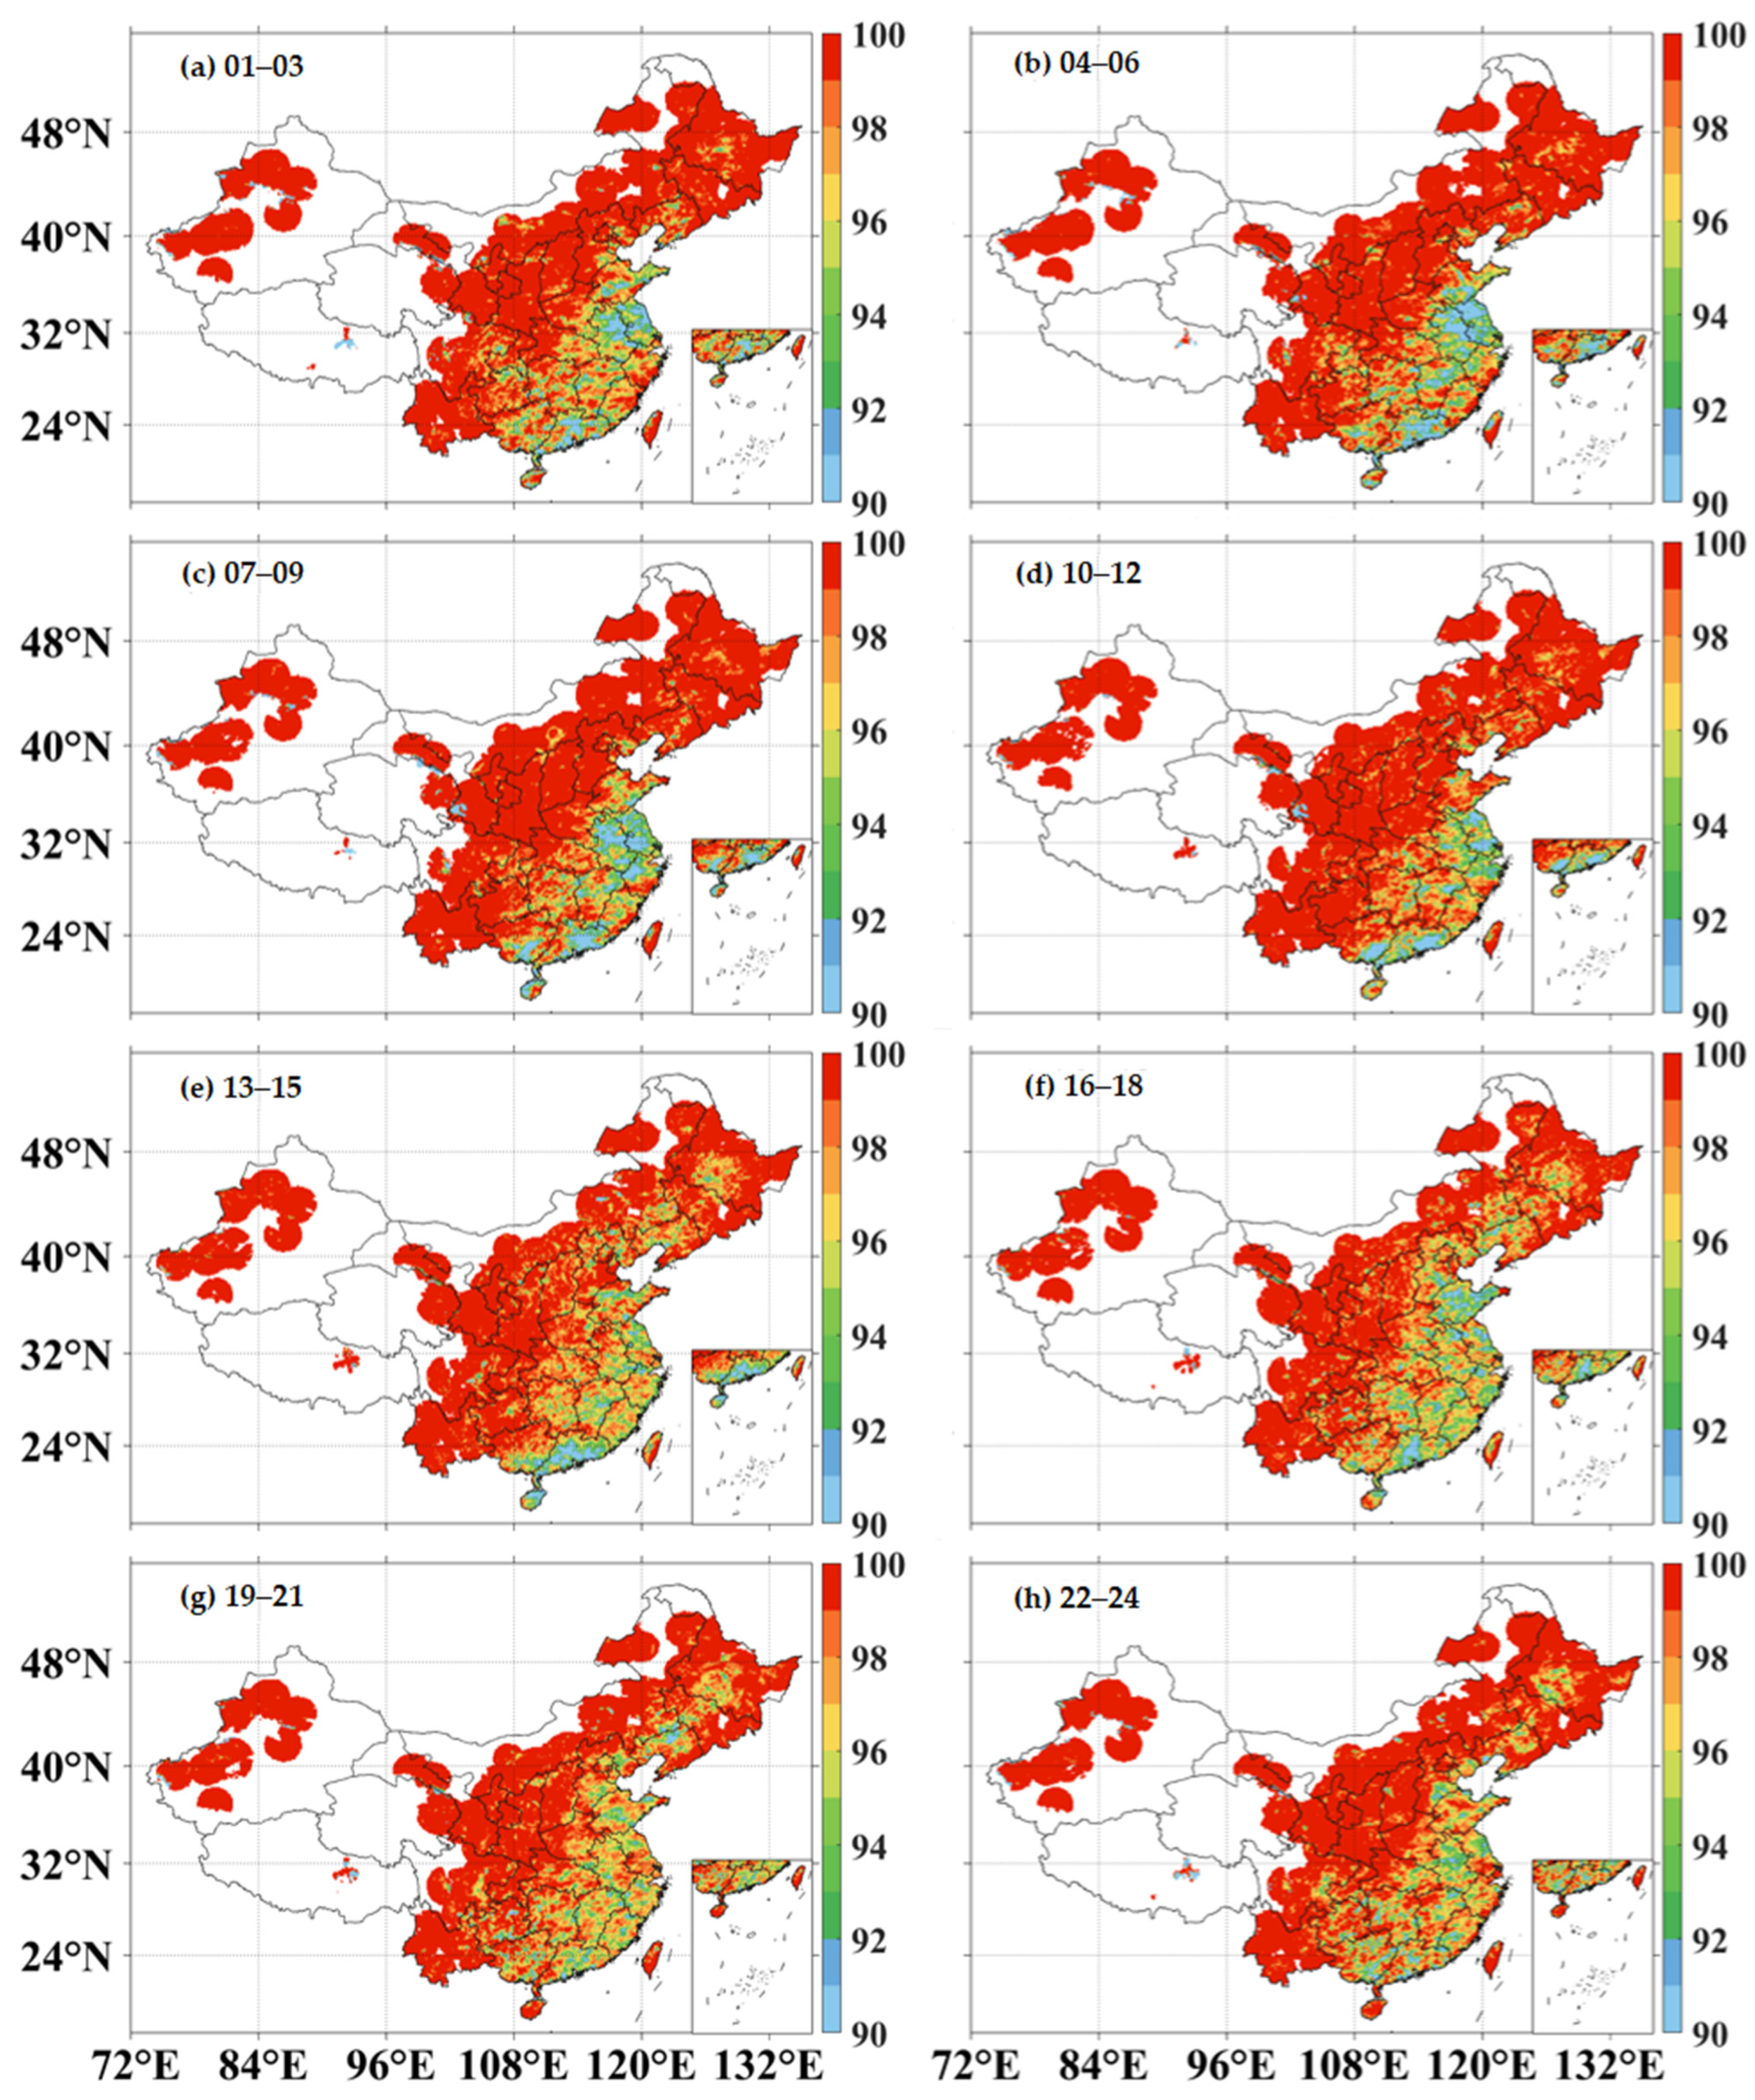
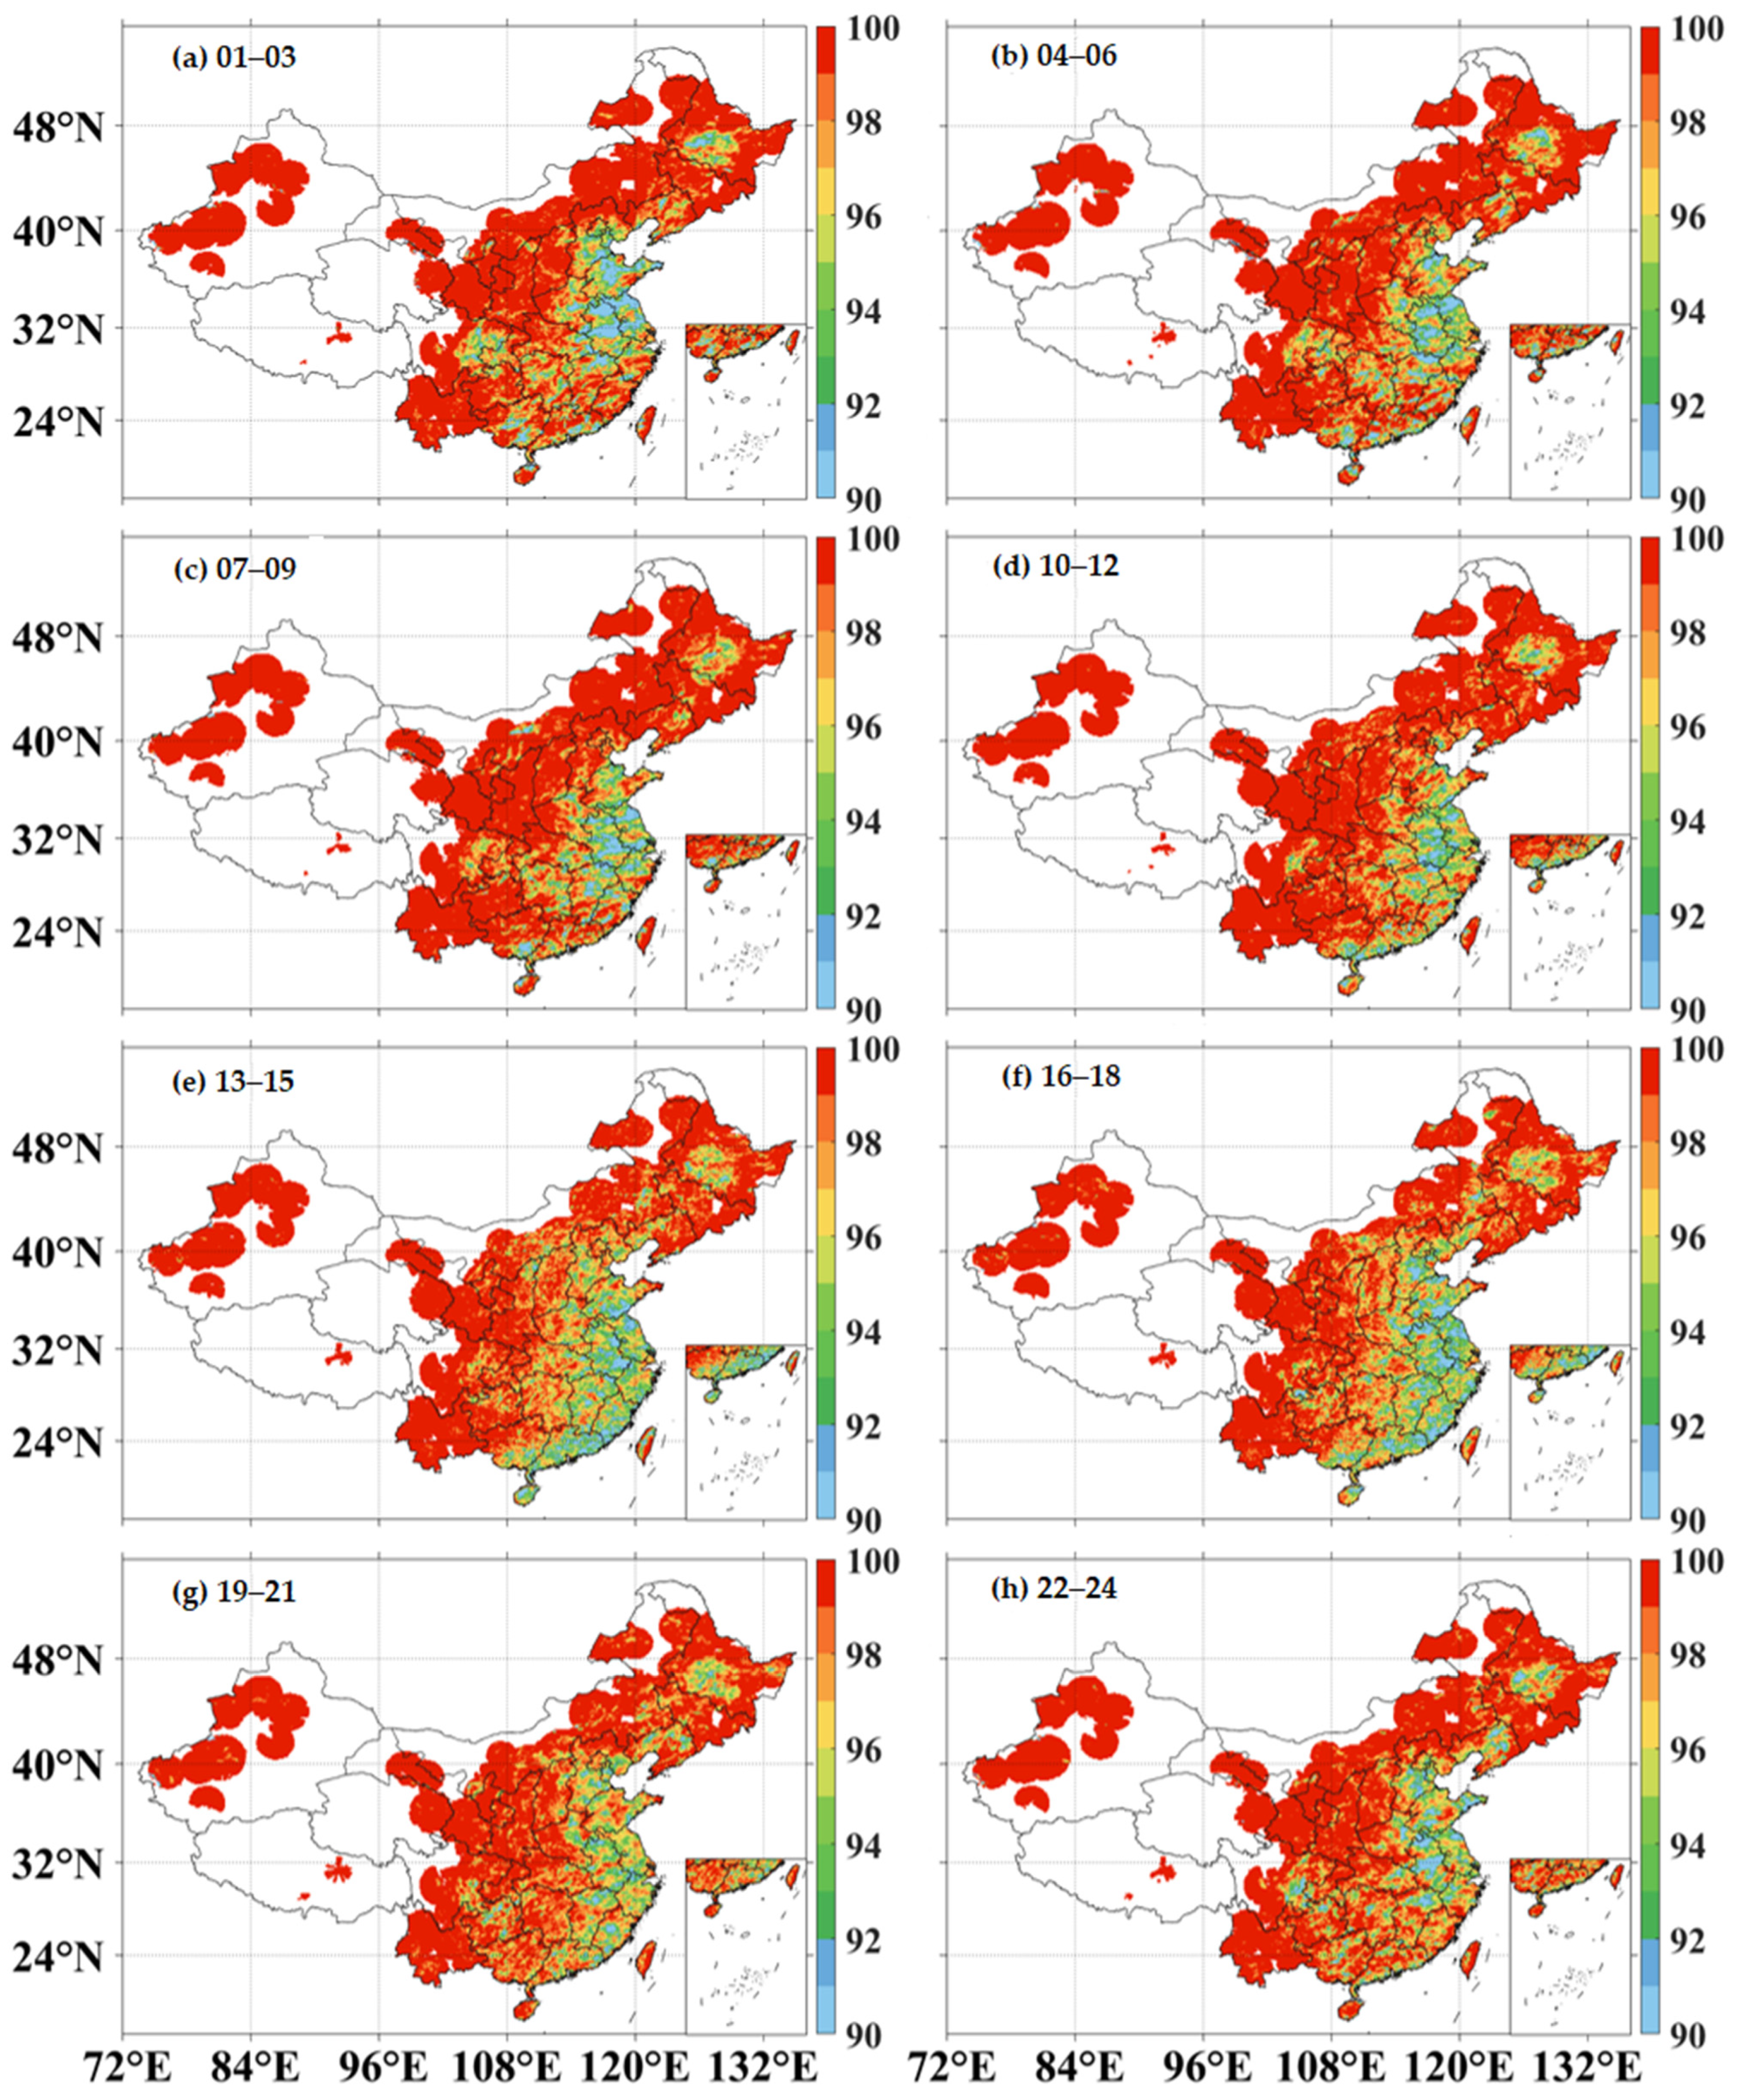
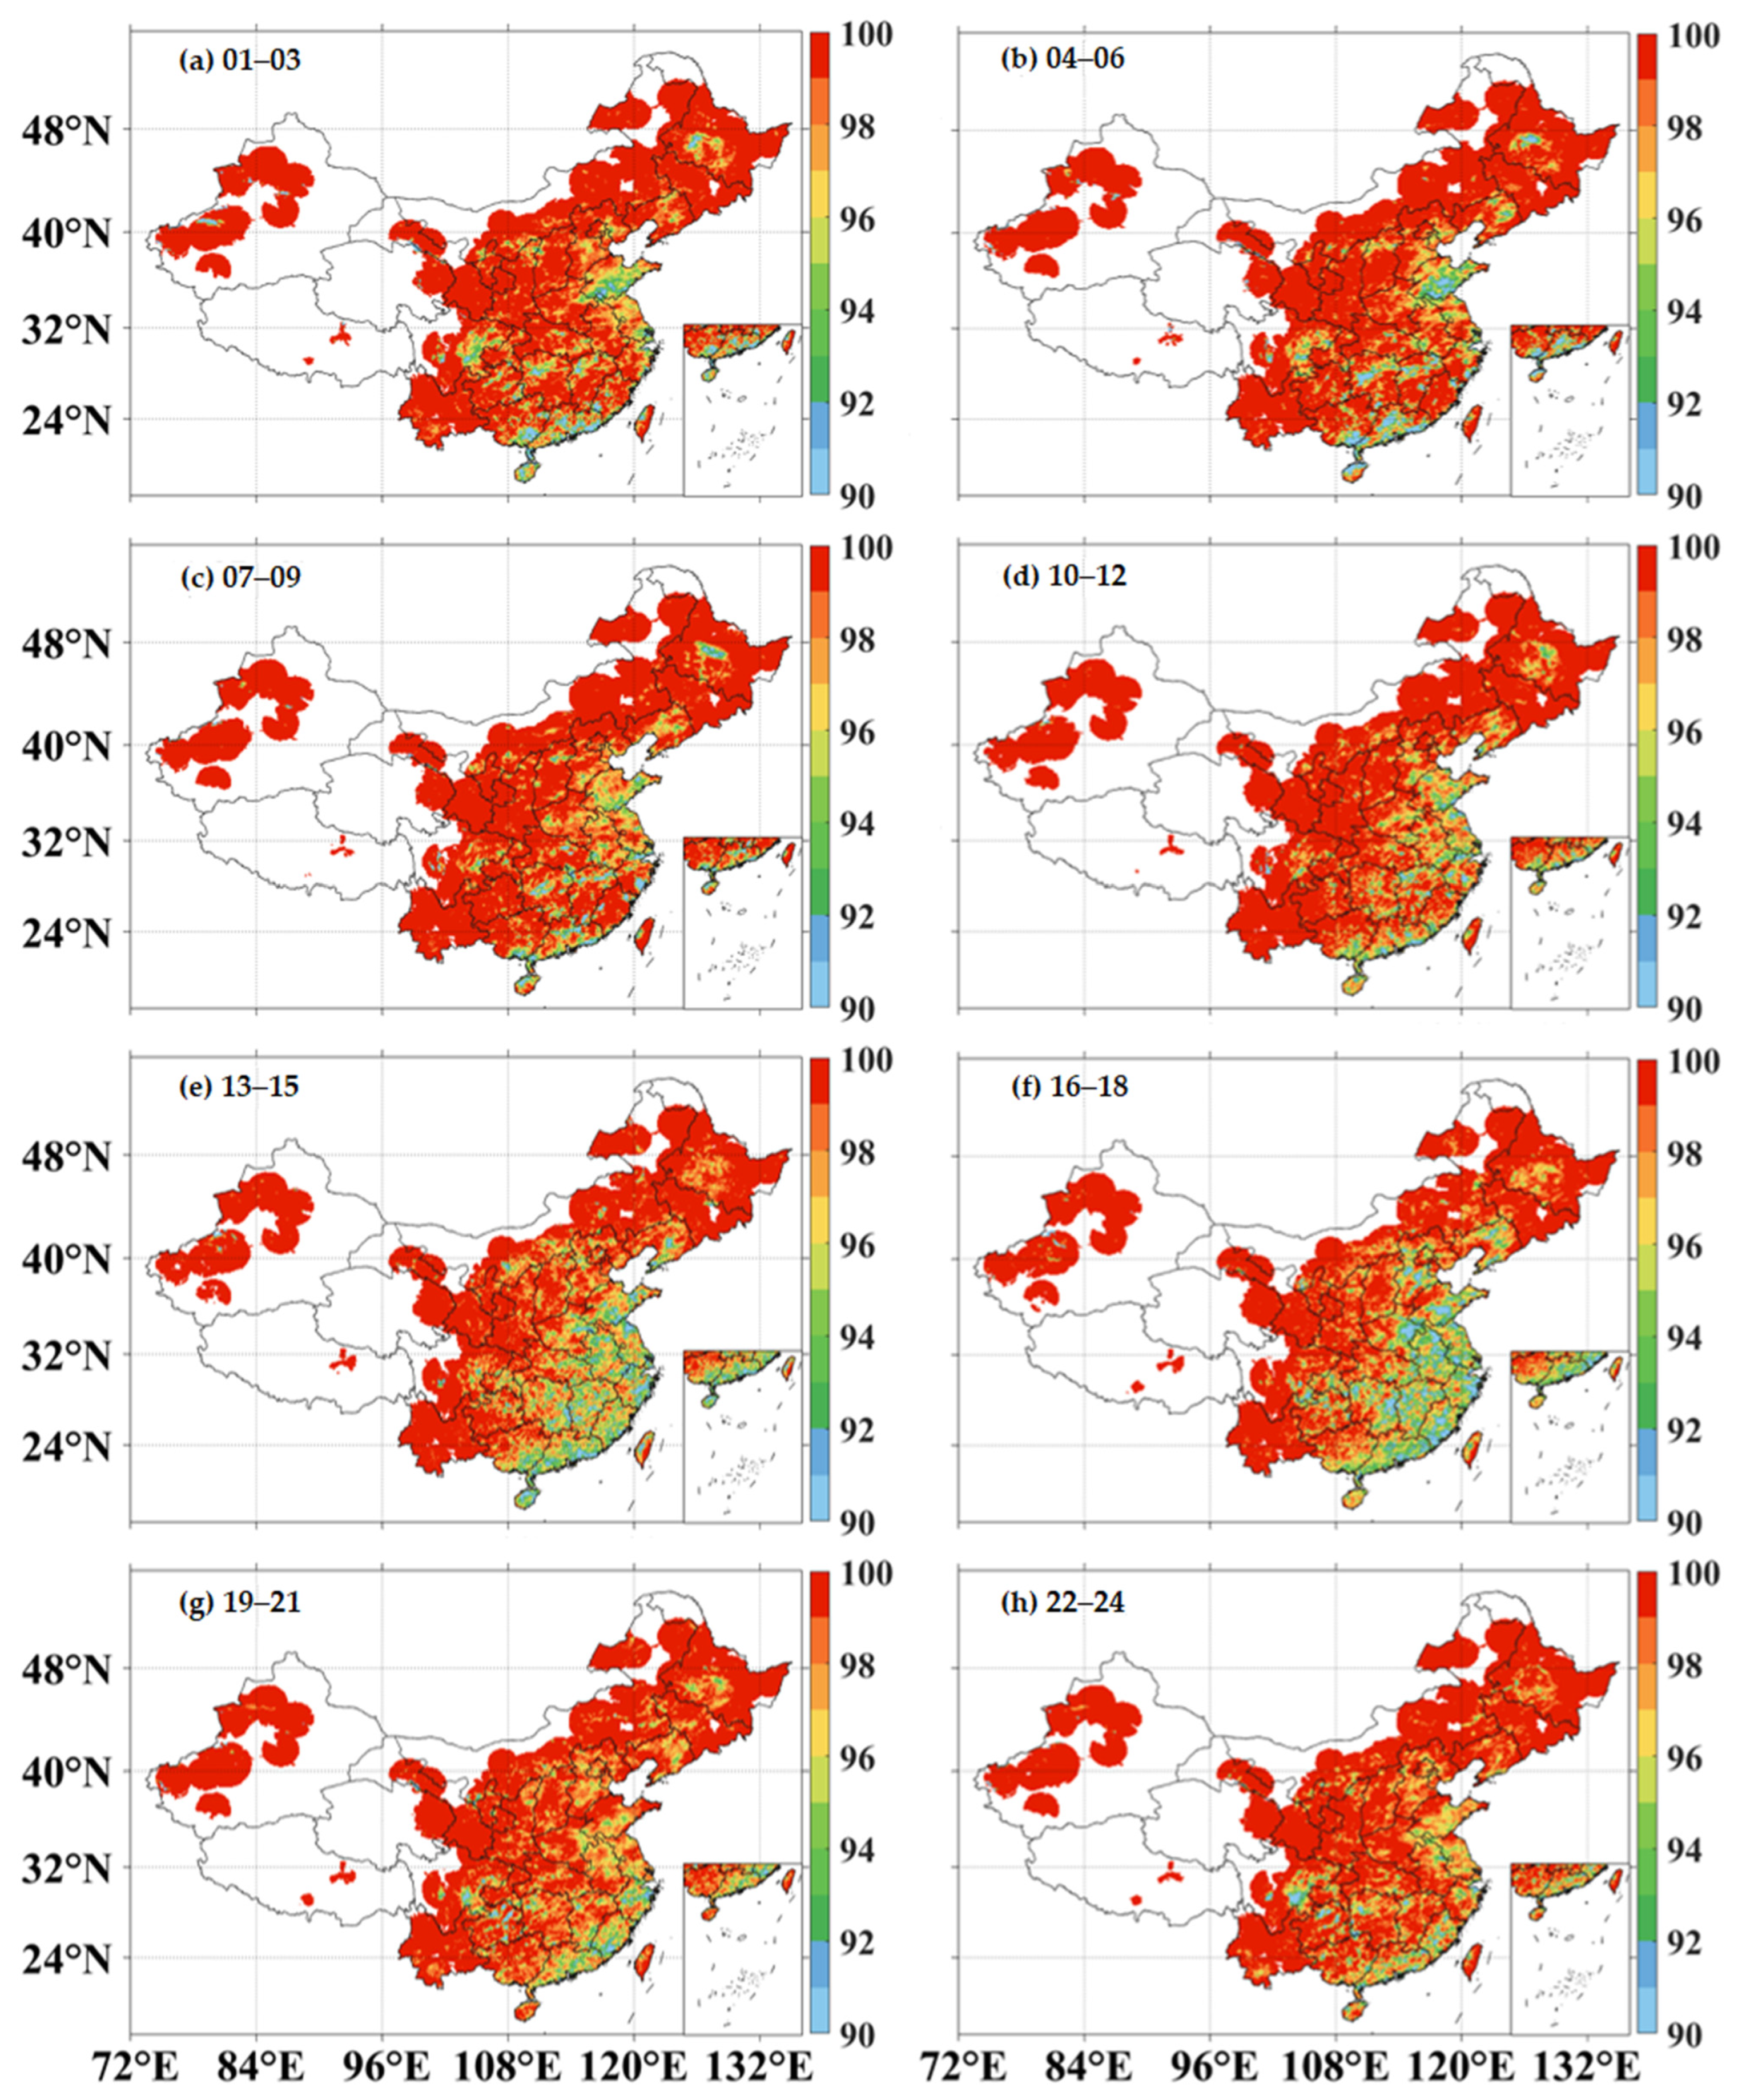
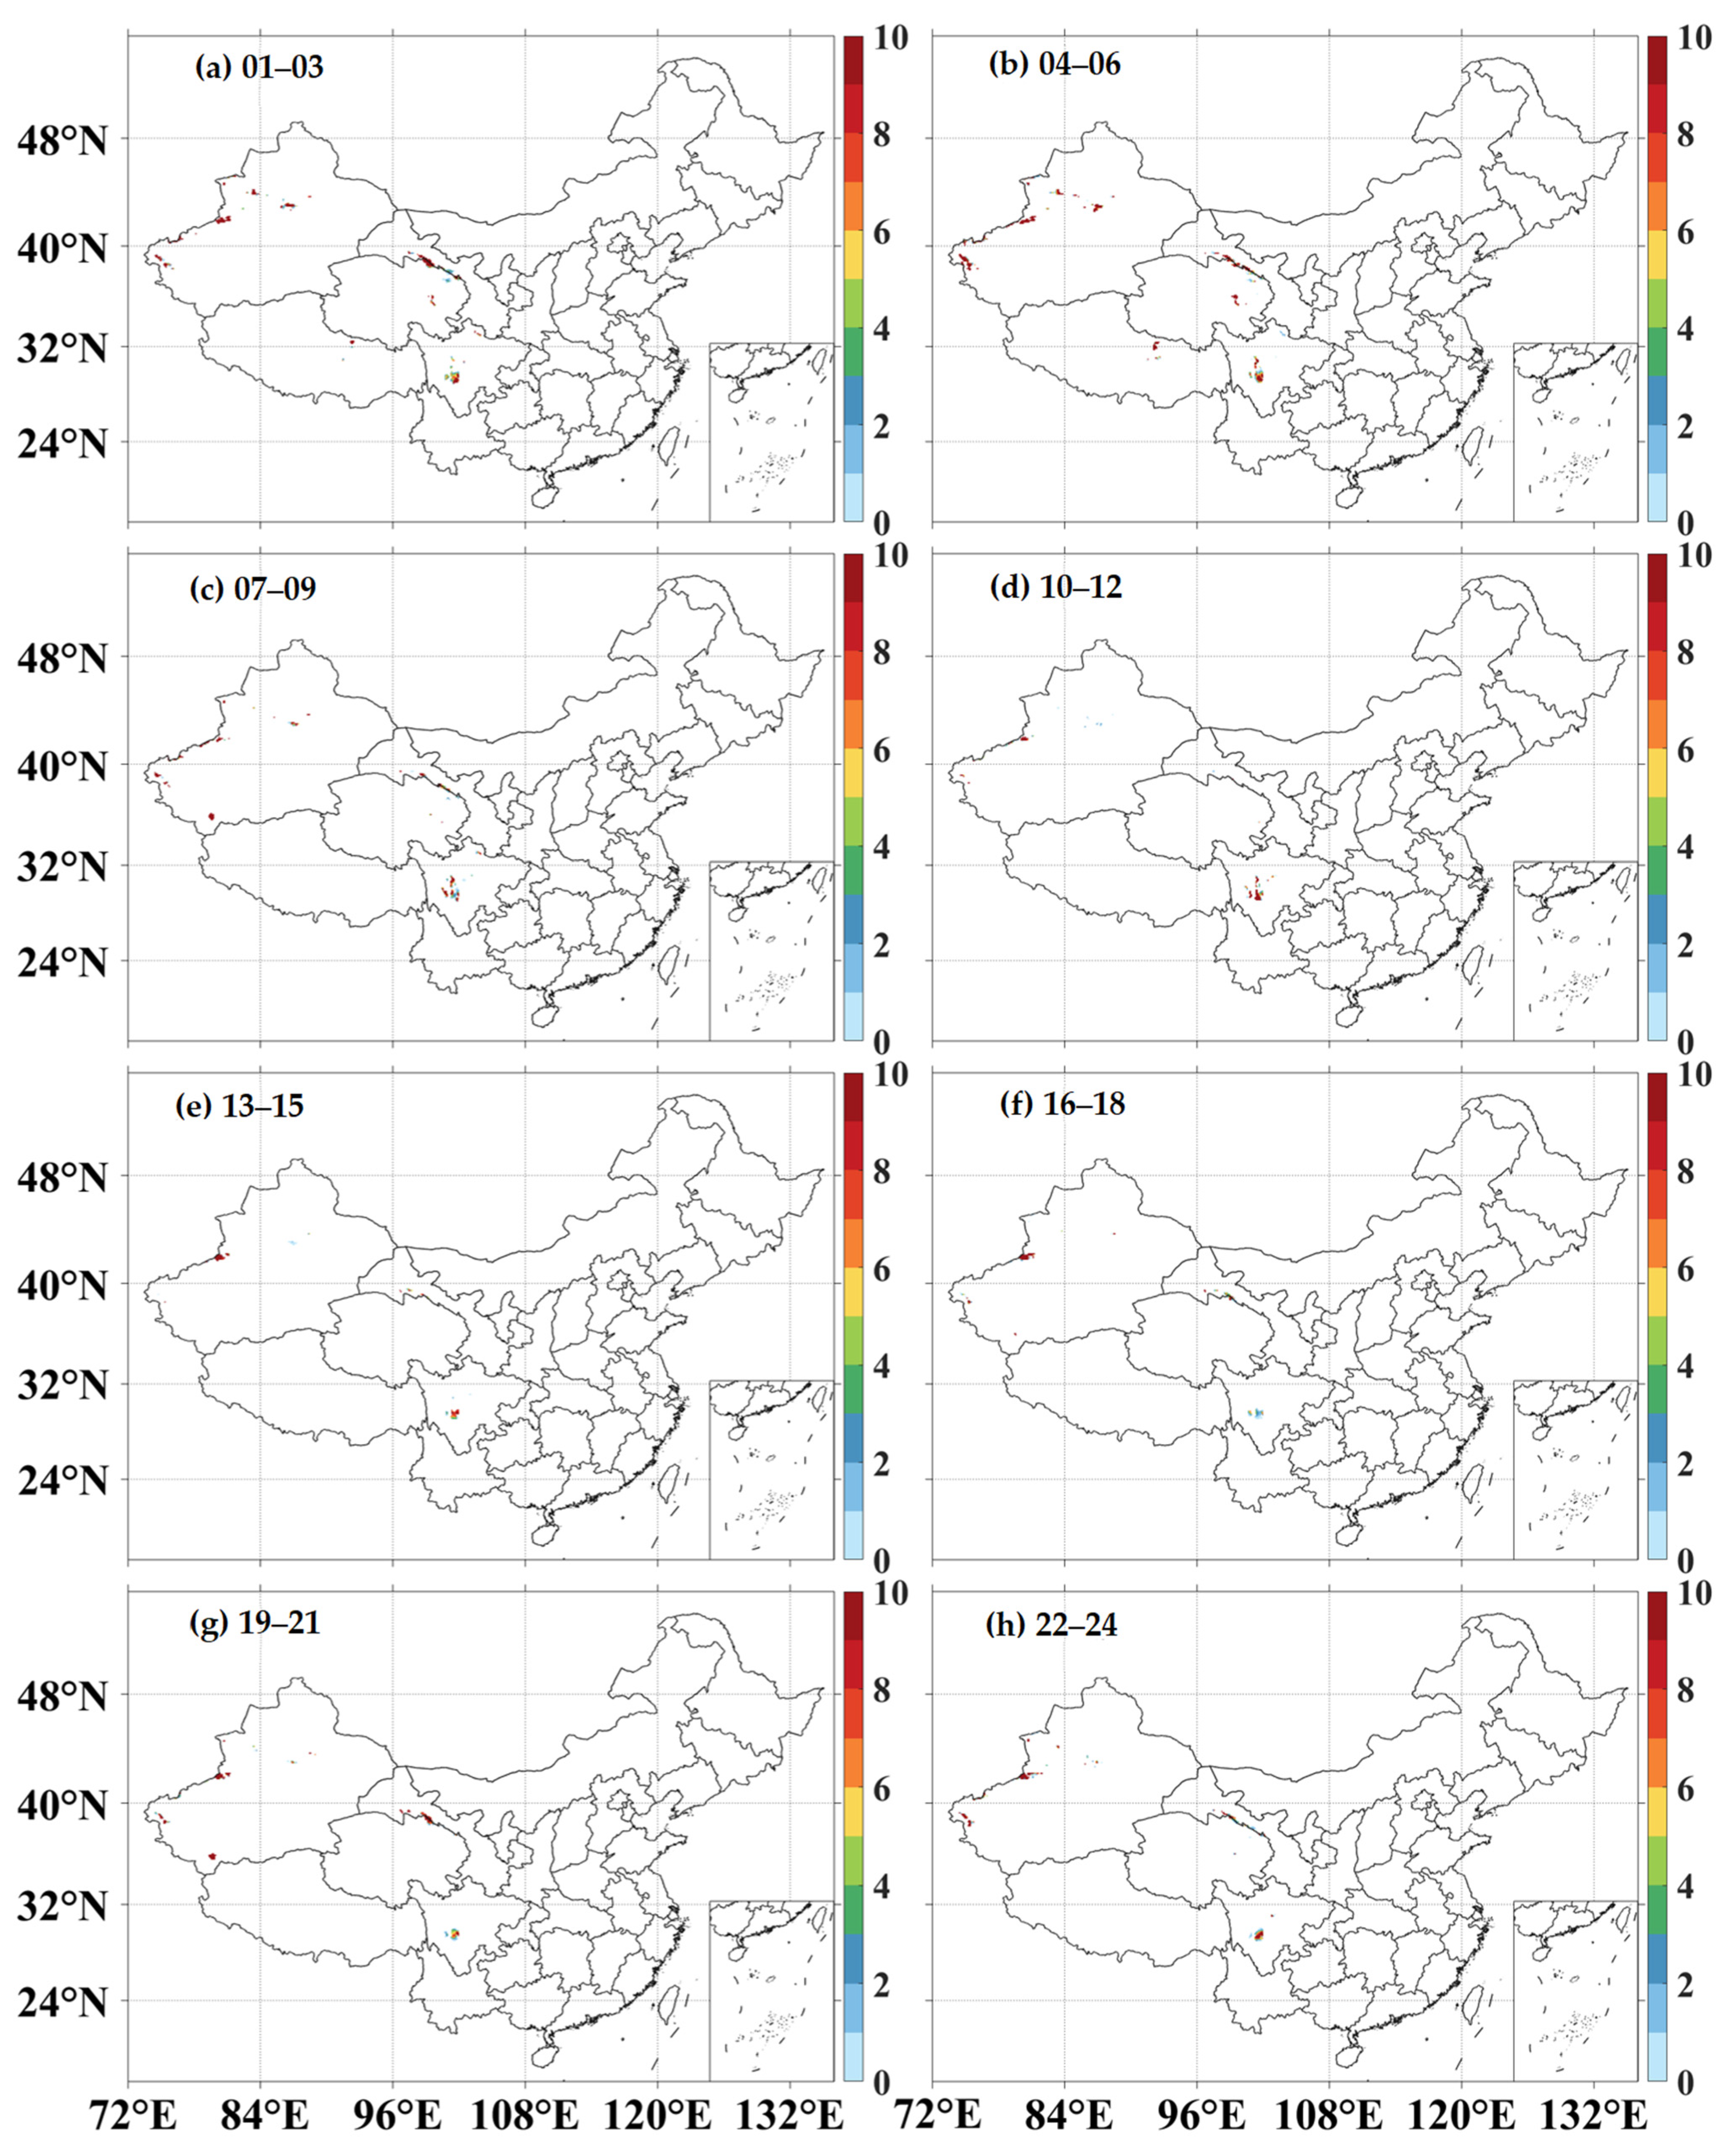
3.3. Diurnal Variations

The diurnal variation of precipitation also has a strong impact on the hydrological cycle. Figure 7a shows the diurnal variations of each precipitation types and PR during summer over China. The results show that the PR becomes increasingly frequent from 10 LST and reaches a peak at 16 LST. Correspondingly, the occurrence frequency of convective precipitation increases slowly in the early morning, possibly due to sea wind activity, then increases rapidly at 11 LST, and reaches the major peak at 16 LST. Stratiform precipitation is primarily active from 14 LST in the afternoon to 22 LST in the evening. Snowfall has a small occurrence from 12–17 LST, indicating that the snowfall activity was suppressed during the afternoon. Whereas during the nighttime, snowfall became very active with peaking time at 05 LST in the early morning, while the occurrence of snowfall decreases dramatically.
Figure 7b–d show the diurnal variation of each precipitation types and PR from June to August. The PR becomes active in the afternoon (14–18 LST). In June, the PR reaches a peak in the afternoon (15 LST), and the peak time was delayed by 1h in July and August. Additionally, the occurrence ratio of PR reaches the peak in August and declines faster than in June and July. The diurnal variation of convective and stratiform precipitation is more intense in August, while it is less variable and more stable in June. Convective precipitation shows an obvious bimodal pattern in June and July, except that the major peak occurs in the afternoon (15–16 LST) and the times of the secondary peaks are different. In June and July, the variation of convective precipitation in the morning is gentler, with the secondary peak occurs around 05–08 LST. The major peaks in the three months all occur in the afternoon (15–16 LST), but the time of the secondary peak gradually advances from the morning (06–07 LST) to the early morning (03–04 LST) from June and July. In contrast, the convective precipitation variation in the morning of August is very flat. In July, the snowfall events peak is at 05 LST, while the peak of the snowfall events in July and August are advanced to around 03–04 LST.
Figure 8, Figure 9 and Figure 10 show the spatial distribution of the frequency of convective precipitation every 3 h from June to August. The frequency of convective precipitation along the adjacent offshore areas exhibits distinctively diurnal variations. In June (Figure 8), the frequency of convective precipitation over 10% is located in Eastern China (lower Yangtze River and Shandong Province) during 01–06 LST. Convective precipitation also occurs frequently in the northeast and along the southern coast of the Beibu Gulf (Figure 8a,b). Heavy convective precipitation in Eastern China has expanded southward since 04 LST. The frequency of convective precipitation in Shandong and Northeastern China gradually decreases. Meanwhile, convective precipitation gradually becomes active in Southern China (Figure 8c,d). Wang and Lin [28] suggested that the summer monsoon, which often occurs in late May, seems to be the cause of active convection in June along the coast of Southern China and adjacent coastal regions. Due to the increase in land temperature caused by solar heating, and sea–land breezes interacting with topography [21,29,30], the frequency of convective precipitation along the coast of China gradually increases starting in the early afternoon (13 LST), and reaching a peak in the late afternoon (16–18 LST). the frequency of convective precipitation is over 10% from the Bohai Sea of China extending southward to the Beibu Gulf, and shows are zonally distributed along the coast of China (Figure 8e,f). At this time, the frequency of convective precipitation in the southwestern part also begins to increase, peaking at 22–24 LST. In contrast, the frequency of convective precipitation in coastal regions starts to weaken at 19 LST, and gradually picks up at 22 LST in the adjacent coastal regions of Eastern China (Figure 8g,h).
In July (Figure 9), convective precipitation mainly occurs from 01 to 18 LST, and there are two strong convective centers: Southern China and Eastern China. In Eastern China, convective precipitation occurs very frequently from 01–09 LST and gradually decreases in the afternoon. Convective precipitation is mainly frequent in Southern China from 04–18 LST, and the area of frequent convective precipitation extends further northward. This is likely due to the northward extension of the moist monsoon flow [19]. Convective precipitation activity is suppressed and occurs less frequently during the night (Figure 9g,h).
In August, convective precipitation occurs significantly less frequently (Figure 10) than in June and July. Convective precipitation in Shandong and Northeastern China mainly occurs from 01–06 LST and peaks at 04–06 LST. Convective precipitation in Southern China displays two peaks, with one in the early morning (04–06 LST, Figure 10b) and the other in the afternoon (13–18 LST, Figure 10e,f). Convective precipitation in Southwestern China occurs primarily at night during the summer, gradually intensifying in the late afternoon (16–18 LST), and then peaking at 22–03 LST. This is consistent with the analysis by Chen et al. [21] and Shen et al. [31].
Figure 11, Figure 12 and Figure 13 show the spatial distribution of the frequency of stratiform precipitation every 3 h from June to August. Similar to convective precipitation, the frequency of stratiform precipitation exhibits an evidently diurnal variation along the adjacent offshore areas. Most of the summer precipitation occurring in the inland regions is stratiform precipitation. In June (Figure 11), stratiform precipitation was apparently active over most of China during 19–24 LST (Figure 11g,h). Since 01 LST (Figure 11a), the earliest decrease in the frequency of stratiform precipitation occurred in the lower Yangtze River (Anhui and Jiangsu), and then stratiform precipitation also gradually decreased in the Pearl River Delta of Southern China (Figure 11b). The region with lower frequency of stratiform precipitation below 90% was expanding southward, with a slight increase in the frequency of stratiform precipitation along the coast during the 13–15 LST, followed by a rapid decrease in the late afternoon, and then a gradual increase to 24 LST.
In July (Figure 12), the frequency of stratiform precipitation during 22–12 LST was basically above 96% in most regions of China, except for Eastern China (Figure 12a–d,h). The region where less than 90% of stratiform precipitation occurred gradually expanded southward since 04–06 LST (Figure 12b). Compared with June, the frequency of stratiform precipitation from morning to noon in Southern China decreased only in coastal regions. It is until the afternoon that the frequency of stratiform precipitation gradually decreased in the inland regions of Southern China (Figure 12e,f). By 16–18 LST, the frequency of stratiform precipitation reached its minimum along the Chinese coast (Figure 12f). Beginning from the 19 LST, stratiform precipitation gradually increased (Figure 12g,h).
In August (Figure 13), the spatiotemporal distribution of daily variation of stratiform precipitation was similar to July, but the region of low value stratiform precipitation moved northward to the Bohai Rim region of Shandong. (Figure 13a–f). As time passed, the frequency of stratiform precipitation in Southern China began to decrease and reached its lowest value at 16–18 LST (Figure 13f). At 19–21 LST, almost all the precipitation that occurred in the region that could be detected by radar observations during this period of stratiform precipitation (Figure 13g,h).
From June to August, the frequency of snowfall every 3 h shows a spatial distribution that is completely different from those of convective and stratiform precipitation (Figure 14, Figure 15 and Figure 16). The snowfall is primarily located in the high mountain and plateaus at night. The high frequency of snowfall is pronounced in the Qinghai-Tibet Plateau and the Tianshan Mountains during 19–12 LST (Figure 14a–d,g,h) and around the Qilian Mountains and the Hengduan Mountains from 01 to 12 LST (Figure 14a–d). In the early morning (07 LST), the frequency of snowfall gradually decreases in the Qinghai-Tibet Plateau and the Tianshan Mountains, while the frequency of snowfall reaches its peak in the Qilian Mountains and the Southwest Transverse Range at this time (Figure 14c). In the afternoon, the frequency of snowfall decreases significantly (Figure 14e,f).
In July, snowfall occurs significantly lower than in June, and its frequency is extremely low. In this period, snowfall primarily occurs in the regions south of the Tianshan Mountains and snowfall in the Qilian Mountains occurred during 01–06 LST (Figure 15a,b). Compared to June and July, snowfall occurs more frequently in the Hengduan Mountains during August, with a peak at 10–12 LST (Figure 16d). After sunset (19 LST), the frequency of snowfall in the Tianshan Mountains and Qilian Mountains gradually increases (Figure 16g,h), peaking at 01–03 LST (Figure 16a).

4. Conclusions

Using the radar mosaics provided by the CMA during the summertime of 2018–2021, this paper explores the distribution of different precipitation types over China during summer, in order to reveal the spatial distributions, monthly variations, and diurnal variations for three precipitation types (convective, stratiform, and snow). The key findings are outlined below.
(1) Convective precipitation occurs more frequently along the coastal regions of China, especially the two strong convective regions—Southern and Eastern China. From June to July, the center of strong convection moves from South China to East China, and the occurrence of convective precipitation begins to decrease in August. The diurnal variation of convective precipitation presents a bimodal pattern, with a major peak in the afternoon (15–16 LST) and a secondary peak in the morning (04–07 LST), and the time of the secondary peak continues to advance as the month varies.
(2) Stratiform precipitation dominates summer precipitation over China, especially in inland areas where the occurrence of stratiform precipitation is basically higher than 90%. Stratiform precipitation is mainly active during the afternoon/night (14–05 LST), and reaches a secondary peak in the afternoon, and then the occurrence continues to increase, reaching the major peak around 20–21 LST in the evening. The diurnal variation of stratiform precipitation is relatively strong in August among the three months of summer.
(3) Snowfall mainly occurs in the mountains and plateaus of Western China, accounting for about 20% of the precipitation. The occurrence ratio of snowfall in July is less than that in June and August, and the snowfall area is also significantly reduced. The snowfall has strong diurnal variation and is mainly active from midnight to early morning (23–06 LST). Snowfall is often suppressed in the afternoon.
(4) PR has a similar distribution pattern over China with convective precipitation, showing a gradually increasing trend from west to east (i.e., inland to coastal regions), and the PR can reach more than 40 dBZ in nearly 60% of the regions. The areas with higher PR than 50 dBZ follow an elongated distribution along the eastern China coast. In August, the coverage area of the high PR in China was smaller than that in June and July. The PR often occurs in the afternoon (14–18 LST).
The distribution information of precipitation types and the periodic variation of precipitation types is helpful to understand the climate characteristics, and to understand the characteristics and evolution mechanism of precipitation. Using ground-based radar observations, more detailed precipitation information can be obtained. However, due to the complex topography in China, the distribution of ground-based radars in some regions (such as the Qinghai-Tibet Plateau) is very sparse, and the ground-based radars in Western China suffer from severe beam blockage, so the precipitation characteristics in these regions cannot be better analyzed. Further studies are underway to investigate the seasonal and diurnal variation characteristics of precipitation types in different seasons over China, and further research will be conducted on local precipitation in China and spatiotemporal distribution characteristics of different precipitation types in order to obtain more detailed precipitation information.

Author Contributions

Conceptualization, J.T. and S.C.; methodology, J.T. and S.C.; software, J.T. and S.C.; validation, S.C.; formal analysis, S.C. and Z.L.; investigation, S.C. and Z.L.; resources, S.C. and Z.L.; data curation, J.T. and S.C.; writing—original draft preparation, J.T.; writing—review and editing, S.C., Z.L. and L.G.; visualization, J.T.; supervision, S.C., Z.L. and L.G.; project administration, S.C. and Z.L.; funding acquisition, S.C. and Z.L. All authors have read and agreed to the published version of the manuscript.

Funding

This research was funded by the National Natural Science Foundation of China (Grant No. 41875182); Guangxi Key R&D Program (Grant No. 2021AB40108, 2021AB40137); Key Laboratory of Environment Change and Resources Use in Beibu Gulf (Grant No. NNNU-KLOP-K2103) at Nanning Normal University.

Data Availability Statement

The radar data used in this study were derived from the publicly available radar reflectivity mosaic images on the official website of National Meteorological Center of CMA (available online at http://www.nmic.cn/data/online/t/4, accessed on 9 May 2022). Additionally, the ERA5-Land reanalysis dataset from the European Center for Medium-Range Weather Forecasts (ECMWF) was used as auxiliary data in this study (https://cds.climate.copernicus.eu/cdsapp#!/dataset/reanalysis-era5-land?tab=form, accessed on 9 May 2022).

Acknowledgments

Thanks, are given to Lanqiang Bai from Foshan Meteorological Bureau, Guangdong, China, and Wei Shanguan from Sun Yat-sen University for their helps in obtaining the radar mosaic dataset and ERA5-Land reanalysis dataset. Thanks to the anonymous reviewers who provided valuable comments.

Conflicts of Interest

The authors declare no conflict of interest.

References

  1. Yu, R.; Li, J.; Chen, H.; Yuan, W. Progress in Studies of the Precipitation Diurnal Variation over Contiguous China. J. Meteor. Res. 2014, 28, 877–902. [Google Scholar] [CrossRef]
  2. Chen, S.; Tian, Y.; Behrangi, A.; Hu, J.; Hong, Y.; Zhang, Z.; Stepanian, P.M.; Hu, B.; Zhang, X. Precipitation Spectra Analysis Over China with High-Resolution Measurements from Optimally Merged Satellite/Gauge Observations—Part I: Spatial and Seasonal Analysis. IEEE J. Sel Top. Appl Earth Obs Remote Sens. 2016, 9, 2966–2978. [Google Scholar] [CrossRef]
  3. Liu, P.; Li, C.; Wang, Y.; Fu, Y. Climatic characteristics of convective and stratiform precipitation over the Tropical and Subtropical areas as derived from TRMM PR. Sci. China Earth Sci. 2012, 56, 375–385. [Google Scholar] [CrossRef]
  4. Varma, A.K.; Liu, G. On classifying rain types using satellite microwave observations. J. Geophys. Res. 2010, 115, 204. [Google Scholar] [CrossRef]
  5. Chen, S.; Zhang, J.; Mullens, E.; Hong, Y.; Behrangi, A.; Tian, Y.; Hu, X.M.; Hu, J.; Zhang, Z.; Zhang, X. Mapping the Precipitation Type Distribution Over the Contiguous United States Using NOAA/NSSL National Multi-Sensor Mosaic QPE. IEEE Trans. Geosci. Remote Sens. 2015, 53, 4434–4443. [Google Scholar] [CrossRef]
  6. Zhang, J.; Howard, K.; Langston, C.; Vasiloff, S.; Kaney, B.; Arthur, A.; Van Cooten, S.; Kelleher, K.; Kitzmiller, D.; Ding, F. National Mosaic and Multi-Sensor QPE (NMQ) System: Description, Results, and Future Plans. Bull. Amer Meteor. Soc. 2011, 92, 1321–1338. [Google Scholar] [CrossRef] [Green Version]
  7. Chen, G.; Sha, W.; Iwasaki, T. Diurnal variation of precipitation over southeastern China: Spatial distribution and its seasonality. J. Geophys Res. 2009, 114, D13. [Google Scholar] [CrossRef] [Green Version]
  8. Chen, S.; Behrangi, A.; Tian, Y.; Hu, J.; Hong, Y.; Tang, Q.; Hu, X.; Stepanian, P.M.; Hu, B.; Zhang, X. Precipitation Spectra Analysis Over China with High-Resolution Measurements from Optimally-Merged Satellite/Gauge Observations—Part II: Diurnal Variability Analysis. IEEE J. Sel Top. Appl Earth Obs Remote Sens. 2016, 9, 2979–2988. [Google Scholar] [CrossRef]
  9. Ding, Y.; Chan, J. The East Asian summer monsoon: An overview. Meteor. Atmos Phys. 2005, 89, 117–142. [Google Scholar] [CrossRef]
  10. Chen, X.; Zhao, K.; Xue, M. Spatial and temporal characteristics of warm season convection over Pearl River Delta region, China, based on 3 years of operational radar data. J. Geophys Res. 2015, 119, 12447–12465. [Google Scholar] [CrossRef]
  11. Luo, Y.; Wang, H.; Zhang, R.; Qian, W.; Luo, Z. Comparison of Rainfall Characteristics and Convective Properties of Monsoon Precipitation Systems over South China and the Yangtze and Huai River Basin. J. Climate. 2013, 26, 110–132. [Google Scholar] [CrossRef] [Green Version]
  12. Yuan, W.; Yu, R.; Fu, Y. Study of Different Diurnal Variations of Summer Long-Duration Rainfall Between the Southern and Northern Parts of the Huai River. Chin. J. Geophys. 2014, 57, 145–153. [Google Scholar]
  13. Chen, S.; Kirstetter, P.; Hong, Y.; Gourley, J.; Xue, X. Evaluation of Spatial Errors of Precipitation Rates and Types from TRMM Spaceborne Radar over the Southern CONUS. J. Hydrometeorol. 2013, 14, 1884–1896. [Google Scholar] [CrossRef] [Green Version]
  14. Chen, S.; Hong, Y.; Behrangi, A.; Qi, Y.; Hu, J. Performance and Uncertainty Analysis of Precipitation Retrievals Derived from Dual-frequency Precipitation Radar and Microwave Imager onboard GPM over CONUS. In Proceedings of the AGU Fall Meeting Abstracts, Norman, OK, USA, 1 December 2014. [Google Scholar]
  15. Kong, Y. Evaluation of the Accuracy of GPM/IMERG over the Mainland of the China; Nanjing University of Information Science & Technology: Nanjing, China, 2017. [Google Scholar]
  16. Liu, P.; Fu, Y.; Feng, S.; Cao, A.; Yang, Y.; Li, T. A comparison of the precipitation from rain gauge observations with from TRMM PR measurements in the southern China. Acta Meteor. Sin. 2010, 68, 822–835. [Google Scholar]
  17. Min, C.; Chen, S.; Gourley, J.; Chen, H.; Zhang, A.; Huang, Y.; Huang, C. Coverage of China New Generation Weather Radar Network. Adv. Meteor. 2019, 2019, 5789358. [Google Scholar] [CrossRef]
  18. Bai, L.; Chen, G.; Huang, L. Image Processing of Radar Mosaics for the Climatology of Convection Initiation in South China. J. Appl Meteor. Climatol. 2020, 59, 65–81. [Google Scholar] [CrossRef]
  19. Bai, L.; Chen, G.; Huang, L. Convection initiation in monsoon coastal areas (South China). Geophys Res. Lett. 2020, 47, e2020GL087035. [Google Scholar] [CrossRef]
  20. Fulton, R.; Breidenbach, J.; Seo, D.; Miller, D.; O’Bannon, T. The WSR-88D Rainfall Algorithm. Wea. Forecasting. 1998, 13, 377–395. [Google Scholar] [CrossRef]
  21. Chen, M.; Wang, Y.; Gao, F.; Xiao, X. Diurnal variations in convective storm activity over contiguous North China during the warm season based on radar mosaic climatology. J. Geophys. Res. 2012, 117, D20115. [Google Scholar] [CrossRef] [Green Version]
  22. Chen, X.; Zhao, K.; Xue, M.; Zhou, B.; Huang, X.; Xu, W. Radar-observed diurnal cycle and propagation of convection over the Pearl River Delta during Mei-Yu season. J. Geophys. Res. Atmos. 2015, 120, 12557–12575. [Google Scholar] [CrossRef] [Green Version]
  23. Rickenbach, T.; Rutledge, S. Convection in TOGA COARE: Horizontal scale, morphology and rainfall production. J. Atmos Sci. 1998, 55, 2715. [Google Scholar] [CrossRef] [Green Version]
  24. Steiner, M.; Houze, R.; Yuter, S. Climatological Characterization of Three-Dimensional Storm Structure from Operational Radar and Rain Gauge Data. J. Appl Meteor. Climatol. 1995, 34, 1978–2007. [Google Scholar] [CrossRef]
  25. Wilson, J.; Roberts, R. Summary of Convective Storm Initiation and Evolution during IHOP: Observational and Modeling Perspective. Mon. Wea Rev. 2006, 134, 23–47. [Google Scholar] [CrossRef]
  26. Chen, S.; Hong, Y.; Cao, Q.; Gourley, J.; Kirstetter, P.; Yong, B.; Tian, Y.; Zhang, Z.; Shen, Y.; Hu, J. Similarity and difference of the two successive V6 and V7 TRMM multisatellite precipitation analysis performance over China. J. Geophys. Res. Atmos. 2013, 118, 13060–13074. [Google Scholar] [CrossRef]
  27. Zhou, T.; Yu, R. Atmospheric water vapor transport associated with typical anomalous summer rainfall patterns in China. J. Geophys Res. 2005, 110, D08104. [Google Scholar] [CrossRef] [Green Version]
  28. Wang, B.; Lin, H. Rainy Season of the Asian–Pacific Summer Monsoon. J. Clim. 2002, 15, 386–398. [Google Scholar] [CrossRef] [Green Version]
  29. Haberlie, A.; Ashley, W.; Pingel, T. The effect of urbanisation on the climatology of thunderstorm initiation. Q. J. R. Meteorol. Soc. 2015, 141, 663–675. [Google Scholar] [CrossRef]
  30. Zhuo, H.; Zhao, P.; Zhou, T. Diurnal cycle of summer rainfall in Shandong of eastern China. J. Climatol. 2014, 34, 742–750. [Google Scholar] [CrossRef]
  31. Shen, Y.; Zhao, P.; Pan, Y.; Yu, J. A high spatiotemporal gauge-satellite merged precipitation analysis over China. J. Geophys. Res. Atmos. 2014, 119, 3063–3075. [Google Scholar] [CrossRef]
Figure 1. (a) Topographic features in China. Black dots show rain gauges. Mountain ranges are labeled and shown as dotted red lines; (b) CINRAD coverage map (without beam blockage) of 230 km for S-band and 150 km for C-band radar. White dots represent C-band radars, red dots show the S-band radars.
Remotesensing 14 03437 g001
Figure 2. Radar data. (a) Radar reflectivity mosaic image with geographic annotations (in Chinese). (b) Radar reflectivity mosaic image after background processing and re-projection.
Remotesensing 14 03437 g002
Figure 3. Spatial distribution of frequency of (a) convective, (b) stratiform, and (c) snow over China during summer. (d) Cumulative probability distribution of occurrence with different precipitation types during summer.
Remotesensing 14 03437 g003
Figure 4. (a) Peak reflectivity (PR) and (b) the timing of peaks in reflectivity (PRT) over China during summer. (c) Cumulative probability distribution of the peak reflectivity.
Remotesensing 14 03437 g004
Figure 5. (ai) Spatial distribution of monthly precipitation frequency (%) for each precipitation type over China in three months. (jl) Cumulative probability distribution of each precipitation from June to August.
Remotesensing 14 03437 g005
Figure 6. (af) Peak reflectivity (PR) and the timing of peaks in reflectivity (PRT) over China from June to August. (g) Cumulative probability distributions from June to August.
Remotesensing 14 03437 g006
Figure 7. (a) Diurnal cycle of peak reflectivity (bars) and diurnal cycle of occurrence ratio of each precipitation types (curve) in summer. (bd) Diurnal cycle of peak reflectivity (bars) and diurnal cycle of occurrence ratio of each precipitation types (curve) in from June to August of 2018 to 2021.
Remotesensing 14 03437 g007
Figure 8. Diurnal variation of frequency (%) distribution of convective precipitation for period 01–03, 04–06, 07–09, 10–12, 13–15, 16–18, 19–21, and 22–24 LST in June from 2018 to 2021.
Remotesensing 14 03437 g008
Figure 9. Diurnal variation of frequency (%) distribution of convective precipitation for period 01–03, 04–06, 07–09, 10–12, 13–15, 16–18, 19–21, and 22–24 LST in July from 2018 to 2021.
Remotesensing 14 03437 g009
Figure 10. Diurnal variation of frequency (%) distribution of convective precipitation for period 01–03, 04–06, 07–09, 10–12, 13–15, 16–18, 19–21, and 22–24 LST in August from 2018 to 2021.
Remotesensing 14 03437 g010
Figure 11. Diurnal variation of frequency (%) distribution of stratiform precipitation for period 01–03, 04–06, 07–09, 10–12, 13–15, 16–18, 19–21, and 22–24 LST in June from 2018 to 2021.
Remotesensing 14 03437 g011
Figure 12. Diurnal variation of frequency (%) distribution of stratiform precipitation for period 01–03, 04–06, 07–09, 10–12, 13–15, 16–18, 19–21, and 22–24 LST in July from 2018 to 2021.
Remotesensing 14 03437 g012
Figure 13. Diurnal variation of frequency (%) distribution of stratiform precipitation for period 01–03, 04–06, 07–09, 10–12, 13–15, 16–18, 19–21, and 22–24 LST in August from 2018 to 2021.
Remotesensing 14 03437 g013
Figure 14. Diurnal variation of frequency (%) distribution of snow for period LST 01–03, 04–06, 07–09, 10–12, 13–15, 16–18, 19–21, and 22–24 in June from 2018 to 2021.
Remotesensing 14 03437 g014
Figure 15. Diurnal variation of frequency (%) distribution of snow for period LST 01–03, 04–06, 07–09, 10–12, 13–15, 16–18, 19–21, and 22–24 in July from 2018 to 2021.
Remotesensing 14 03437 g015
Figure 16. Diurnal variation of frequency (%) distribution of snow for period LST 01–03, 04–06, 07–09, 10–12, 13–15, 16–18, 19–21, and 22–24 in August from 2018 to 2021.
Remotesensing 14 03437 g016
Publisher’s Note: MDPI stays neutral with regard to jurisdictional claims in published maps and institutional affiliations.

