Article

Assessment of Large-Scale Seasonal River Morphological Changes in Ayeyarwady River Using Optical Remote Sensing Data

by
Dhyey Bhatpuria
1,2,*,
Karthikeyan Matheswaran
1,
Thanapon Piman
1,2,
Theara Tha
1 and
Peeranan Towashiraporn
2,3
1
Stockholm Environment Institute, 10th Floor, Kasem Uttayanin Building, 254 Chulalongkorn University, Henri Dunant Road, Pathum Wan District, Bangkok 10330, Thailand
2
SERVIR Mekong, SM Tower, 24th Floor, 979/69 Paholyothin Road, Samsen Nai Phayathai, Bangkok 10400, Thailand
3
Asian Disaster Preparedness Center, SM Tower, 24th Floor, 979/69 Paholyothin Road, Samsen Nai Phayathai, Bangkok 10400, Thailand
*
Author to whom correspondence should be addressed.
Remote Sens. 2022, 14(14), 3393; https://doi.org/10.3390/rs14143393
Submission received: 26 May 2022 / Revised: 7 July 2022 / Accepted: 10 July 2022 / Published: 14 July 2022

Abstract

:
Monitoring morphologically dynamic rivers over large spatial domains at an adequate frequency is essential for informed river management to protect human life, ecosystems, livelihoods, and critical infrastructures. Leveraging the advancements in cloud-based remote sensing data processing through Google Earth Engine (GEE), a web-based, freely accessible seasonal river morphological monitoring system for Ayeyarwady River, Myanmar was developed through a collaborative process to assess changes in river morphology over time and space. The monitoring system uses Landsat satellite data spanning a 31-year long period (1988–2019) to map river planform changes along 3881.4 km of river length including Upper Ayeyarwady, Lower Ayeyarwady, and Chindwin. It is designed to operate on a seasonal timescale by comparing pre-monsoon and post-monsoon channel conditions to provide timely information on erosion and accretion areas for the stakeholders to support planning and management. The morphological monitoring system was validated with 85 reference points capturing the field conditions in 2019 and was found to be reliable for operational use with an overall accuracy of 89%. The average eroded riverbank area was calculated at around 45, 101, and 134 km2 for Chindwin, Upper Ayeyarwady, and Lower Ayeyarwady, respectively. The historical channel change assessment aided us to identify and categorize river reaches according to the frequency of changes. Six hotspots of riverbank erosion were identified including near Mandalay city, the confluence of Upper Ayeyarwady and Chindwin, near upstream of Magway city, downstream of Magway city, near Pyay city, and upstream of the Ayeyarwady delta. The web-based monitoring system simplifies the application of freely available remote sensing data over the large spatial domain to assess river planform changes to support stakeholders’ operational planning and prioritizing investments for sustainable Ayeyarwady River management.

Graphical Abstract

1. Introduction

River geomorphological changes are complex river responses in fluvial systems resulting from interrelated processes influenced by catchment geology, riparian land use, flow variability, sediment sources, and anthropogenic factors [1,2]. The monsoon season experienced by the large rivers of South and Southeast Asia adds further complexities in the form of large variations in seasonal discharge and sediment loads [3,4,5]. Monsoon-induced floods in these regions invariably alter river geomorphology at a myriad of spatio-temporal scales [6,7]. The flood-induced geomorphic alternations in one season, in turn, influences local flood patterns in subsequent monsoon seasons. Over a long period, the local scale geomorphologic process may jointly function to alter the catchment scale process [1]. Recent decades have witnessed the increasing influence of anthropogenic factors, such as upstream and riparian land use change, impoundments, and riverbank infrastructure developments, on river geomorphologic behavior. Anthropogenic activities may influence and accelerate key river geomorphologic processes such as channel migration, erosion, accretion, floods-geomorphic feedbacks, and channel avulsion.
Floodplains of morphologically active rivers in Asia like the Ayeyarwady and Ganges-Brahmaputra-Meghna systems host large populations and swathes of agricultural lands vital for the region’s food security [8]. The Ayeyarwady basin in Myanmar is home to 34 million people, representing around 66% of the country’s population [9]. Recurrent riverbank erosion because of flood pulses from intense monsoonal rainfall is a major problem in the Ayeyarwady basin [10]. This also results into high suspended and wash load of approximately 261–364 million tons per year and 144 million tons per year, respectively [11,12]. Seasonal morphological change in the Ayeyarwady River erodes settlements and agricultural lands located in the floodplains thus directly affects the riverine communities [13]. As per a recent estimate, around 381 km2 of riverbank in 47 townships along the Ayeyarwady River have been severely affected by riverbank erosion between 1987 and 2016 [14]. Some villages located along Ayeyarwady and its tributaries have been relocated several times [15]. Riverbank erosion has disrupted the livelihoods of people of riverine communities. It has been severely disrupted due to recurrent riverbank erosion. Besides, these rivers also serve as key inland transport corridors, which are affected by seasonally changing river platforms [16,17].
Understanding river geomorphological changes are also key to protecting the freshwater ecosystem biodiversity considering its potential to alter the quality and quantity of instream habitats [18,19]. Thus, monitoring river morphological change at high temporal and spatial resolutions is imperative to support sustainable river management. However, government agencies in Myanmar are constrained by the limited human and financial outlays available to repeatedly cover the large spatial area while preferring to focus on field-based monitoring only in locations deemed critical [20]. Freely accessible remote sensing data from multiple satellite platforms offer an efficient way to map river planform changes over large geographical domains at high temporal resolution [21]. Many studies have used moderate resolution optical satellite data such as Landsat to detect channel planform changes in large rivers by extracting the extent of the water spread area in the channel using indices like Normalized Difference Vegetation Index (NDVI), Normalized Difference Water Index (NDWI) and Modified Normalized Difference Water Index (MNDWI), and Enhanced Vegetation Index (EVI) [22,23,24,25]. These studies extracted the active river channel from remote sensing-based indices by applying a threshold value to differentiate water and land. The main limitation of the thresholding approach stems from selecting a suitable threshold value, which is subjective upon the user discretion. Application of machine learning techniques for classification of water and land pixels with focus on assessing river morphological characteries is gaining prominence. Some recent examples include monitoring channel morphology of Yangtze River headwater using lightweight neural network [26], deep convolutional neural network for characterizing riverscapes in Norway [27], and identifying barriers in stream network using random forest classifier [28]. However, machine learning methods require training datasets, which are not readily available in countries like Myanmar. In addition, the stakeholder understanding of the method is of great importance to ensure confidence in the monitoring system.
While persistent cloud cover in monsoon season and poor temporal resolution of Landsat satellite data pose challenges for near real-time riverbank change monitoring, it has been found adequate to map multi-year, multi-decadal changes [29,30,31]. While the new generation of satellite platforms such as Sentinel-1 and 2 provide data at much higher spatial resolution (10 m), its short temporal coverage (from 2018) makes it less ideal to assess long-term historical changes and to identify high-risk erosion hotspots.
Recent advances in cloud-based remote sensing data and processing platforms, such as Google Earth Engine (GEE), Open Data Cube, Microsoft Planetary Computer, and Earth on Amazon Web Services, have revolutionized operational applications of remote sensing data [31,32,33]. These cloud-based platforms remove considerable complexities associated with downloading large datasets and the need for computational resources for assessing large spatial domain necessary to cover the mega rivers of Asia. If designed carefully, the cloud-based computing platform with its pre-defined workflows in conjunction with a web interface alleviates the need for stakeholders to learn entire remote sensing processing chain and will allow them to focus on applying the resultant outputs for operational purposes.
The adoption of third-party decision support systems by government stakeholders is relatively low. A multitude of factors contribute to the low adoption of digital tools by the government stakeholders in developing countries. These range from complex technical expertise required for tool use, non-alignment with user needs, lack of maintenance support, and not fit within department’s operational workflow [34,35]. The adoption of tool increases when it supports rather than replaces operational activities of river management to prove its effectiveness and improve overall outcomes. The development of any monitoring system should have the user-centric focus of providing right information at the right time without the need for large learning curve in operational model. The SERVIR’s Service Planning Approach was used to ensure wide range of government stakeholders in Myanmar with water management mandate was embedded in the tool development process from demand assessment, initial tool conception, selection of classification methods, and the final outlook of the web interface [36]. The adopted collaborative development approach will ensure that the developed tool will be used for practical applications to regularly monitor morphological hotspots and support decision making. It is envisaged that the tool will be eventually used to issue seasonal bulletins on morphological hotspots in Ayeyarwady River.
The main aim of this research was to develop a web-based, remote sensing data-driven, operational, and large-scale seasonal river morphology monitoring system for the Ayeyarwady river to support decision making. The key contribution of this research stems from the application of well-proven remote sensing morphological monitoring method for the operational monitoring of 3382 km of the Ayeyarwady river and its tributaries encompassing the whole process of a stakeholder-centric co-development framework. Leveraging long-term availability of Landsat satellite data, 30 years of historical maps (1988–2019) of erosion and accretion areas along with river channel were produced to support mapping of vulnerable hotspots. A user-centric simple web interface was developed to enable wide range of stakeholders to access and download the data including an option to estimate river channel width at a desired cross-section.

2. Materials and Methods
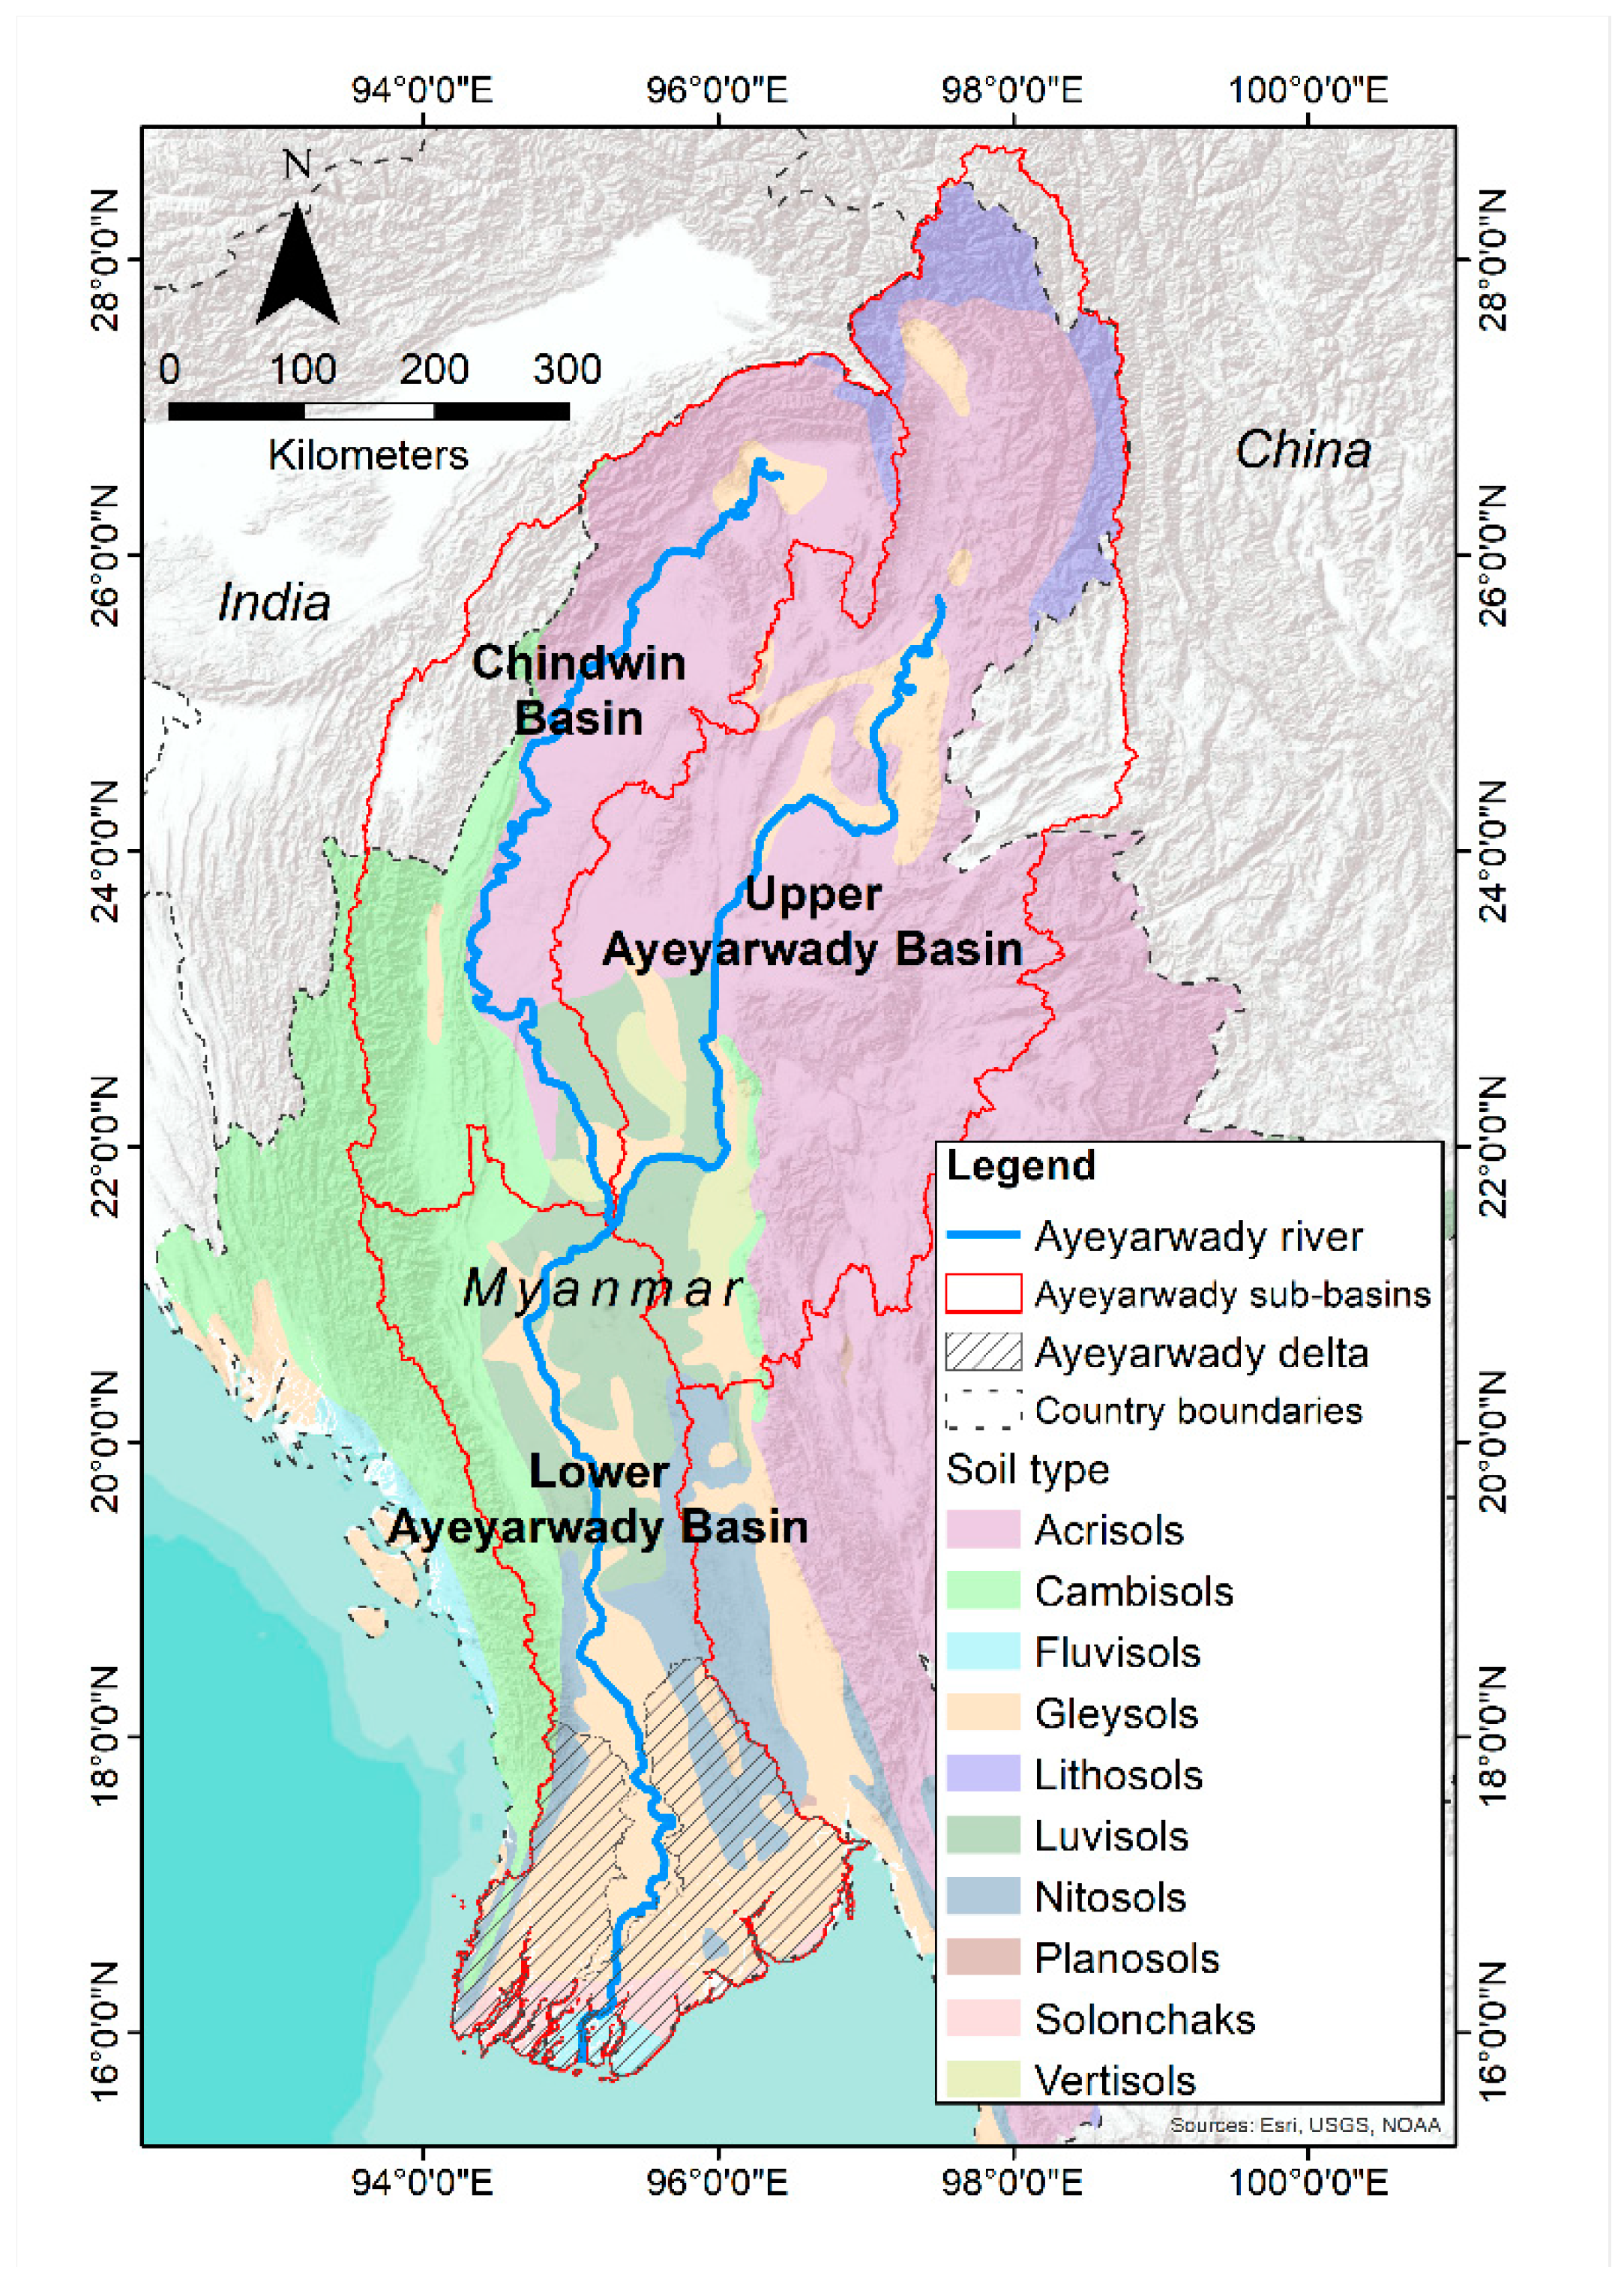
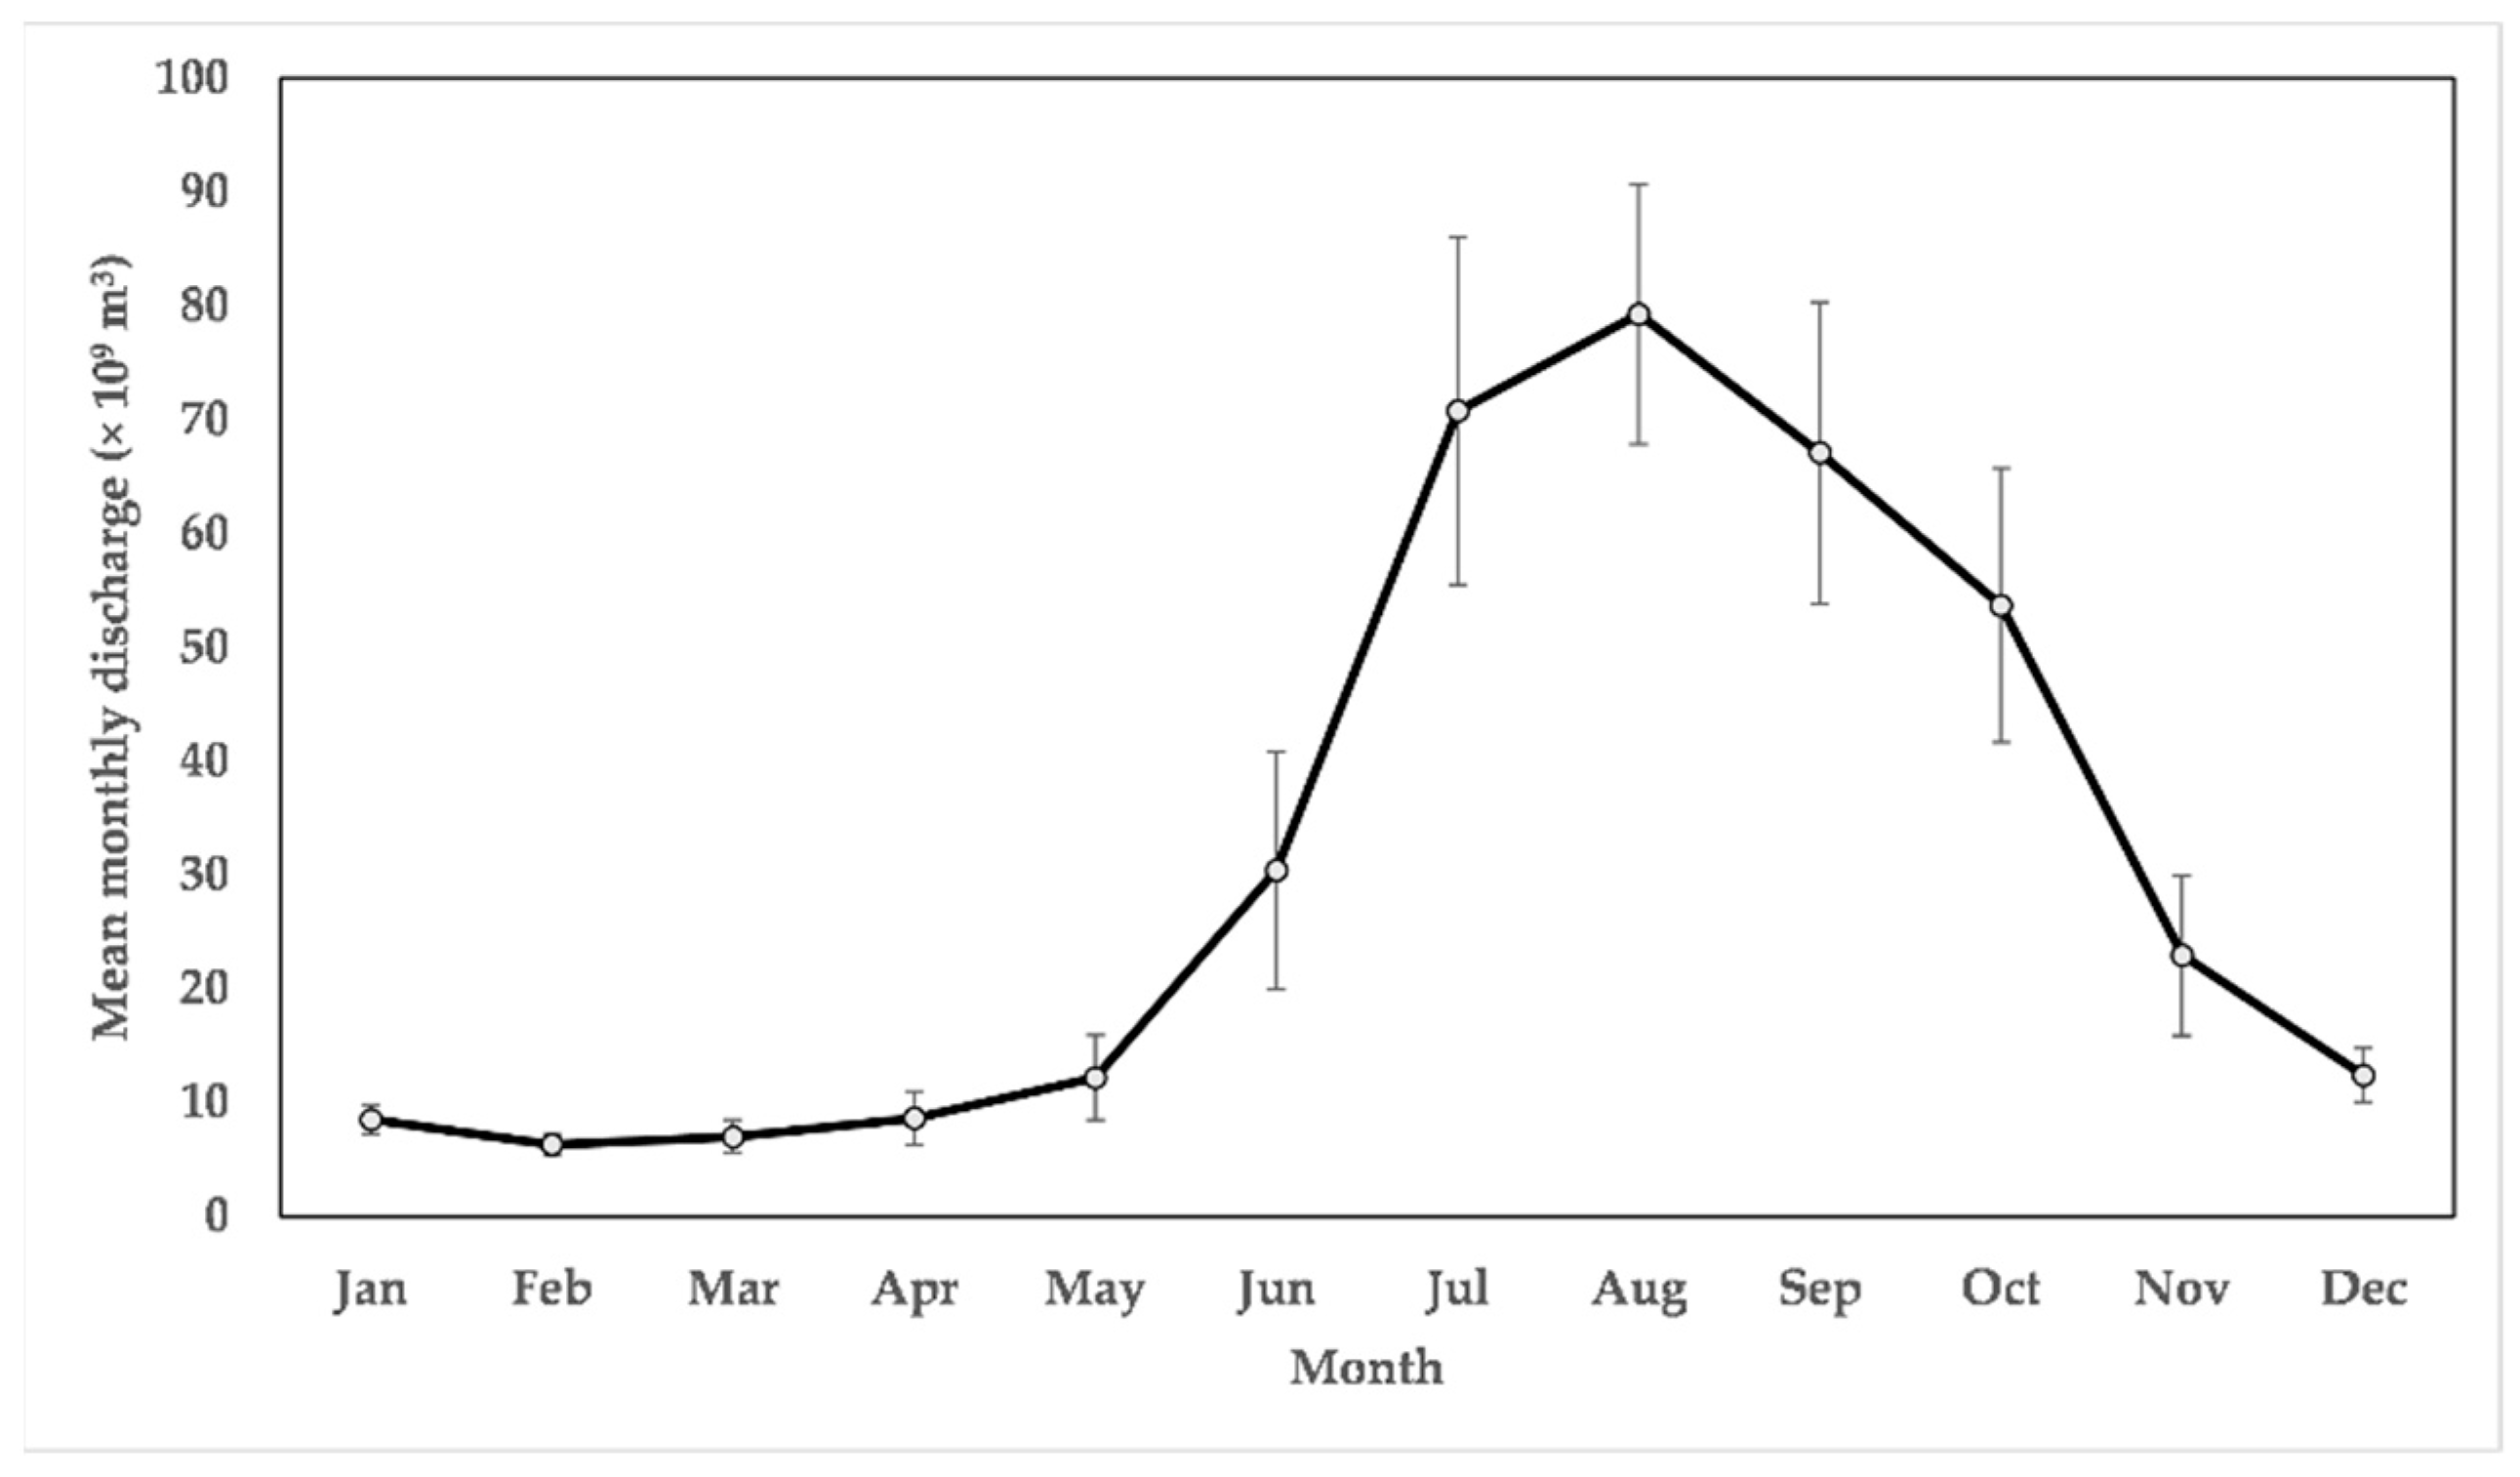
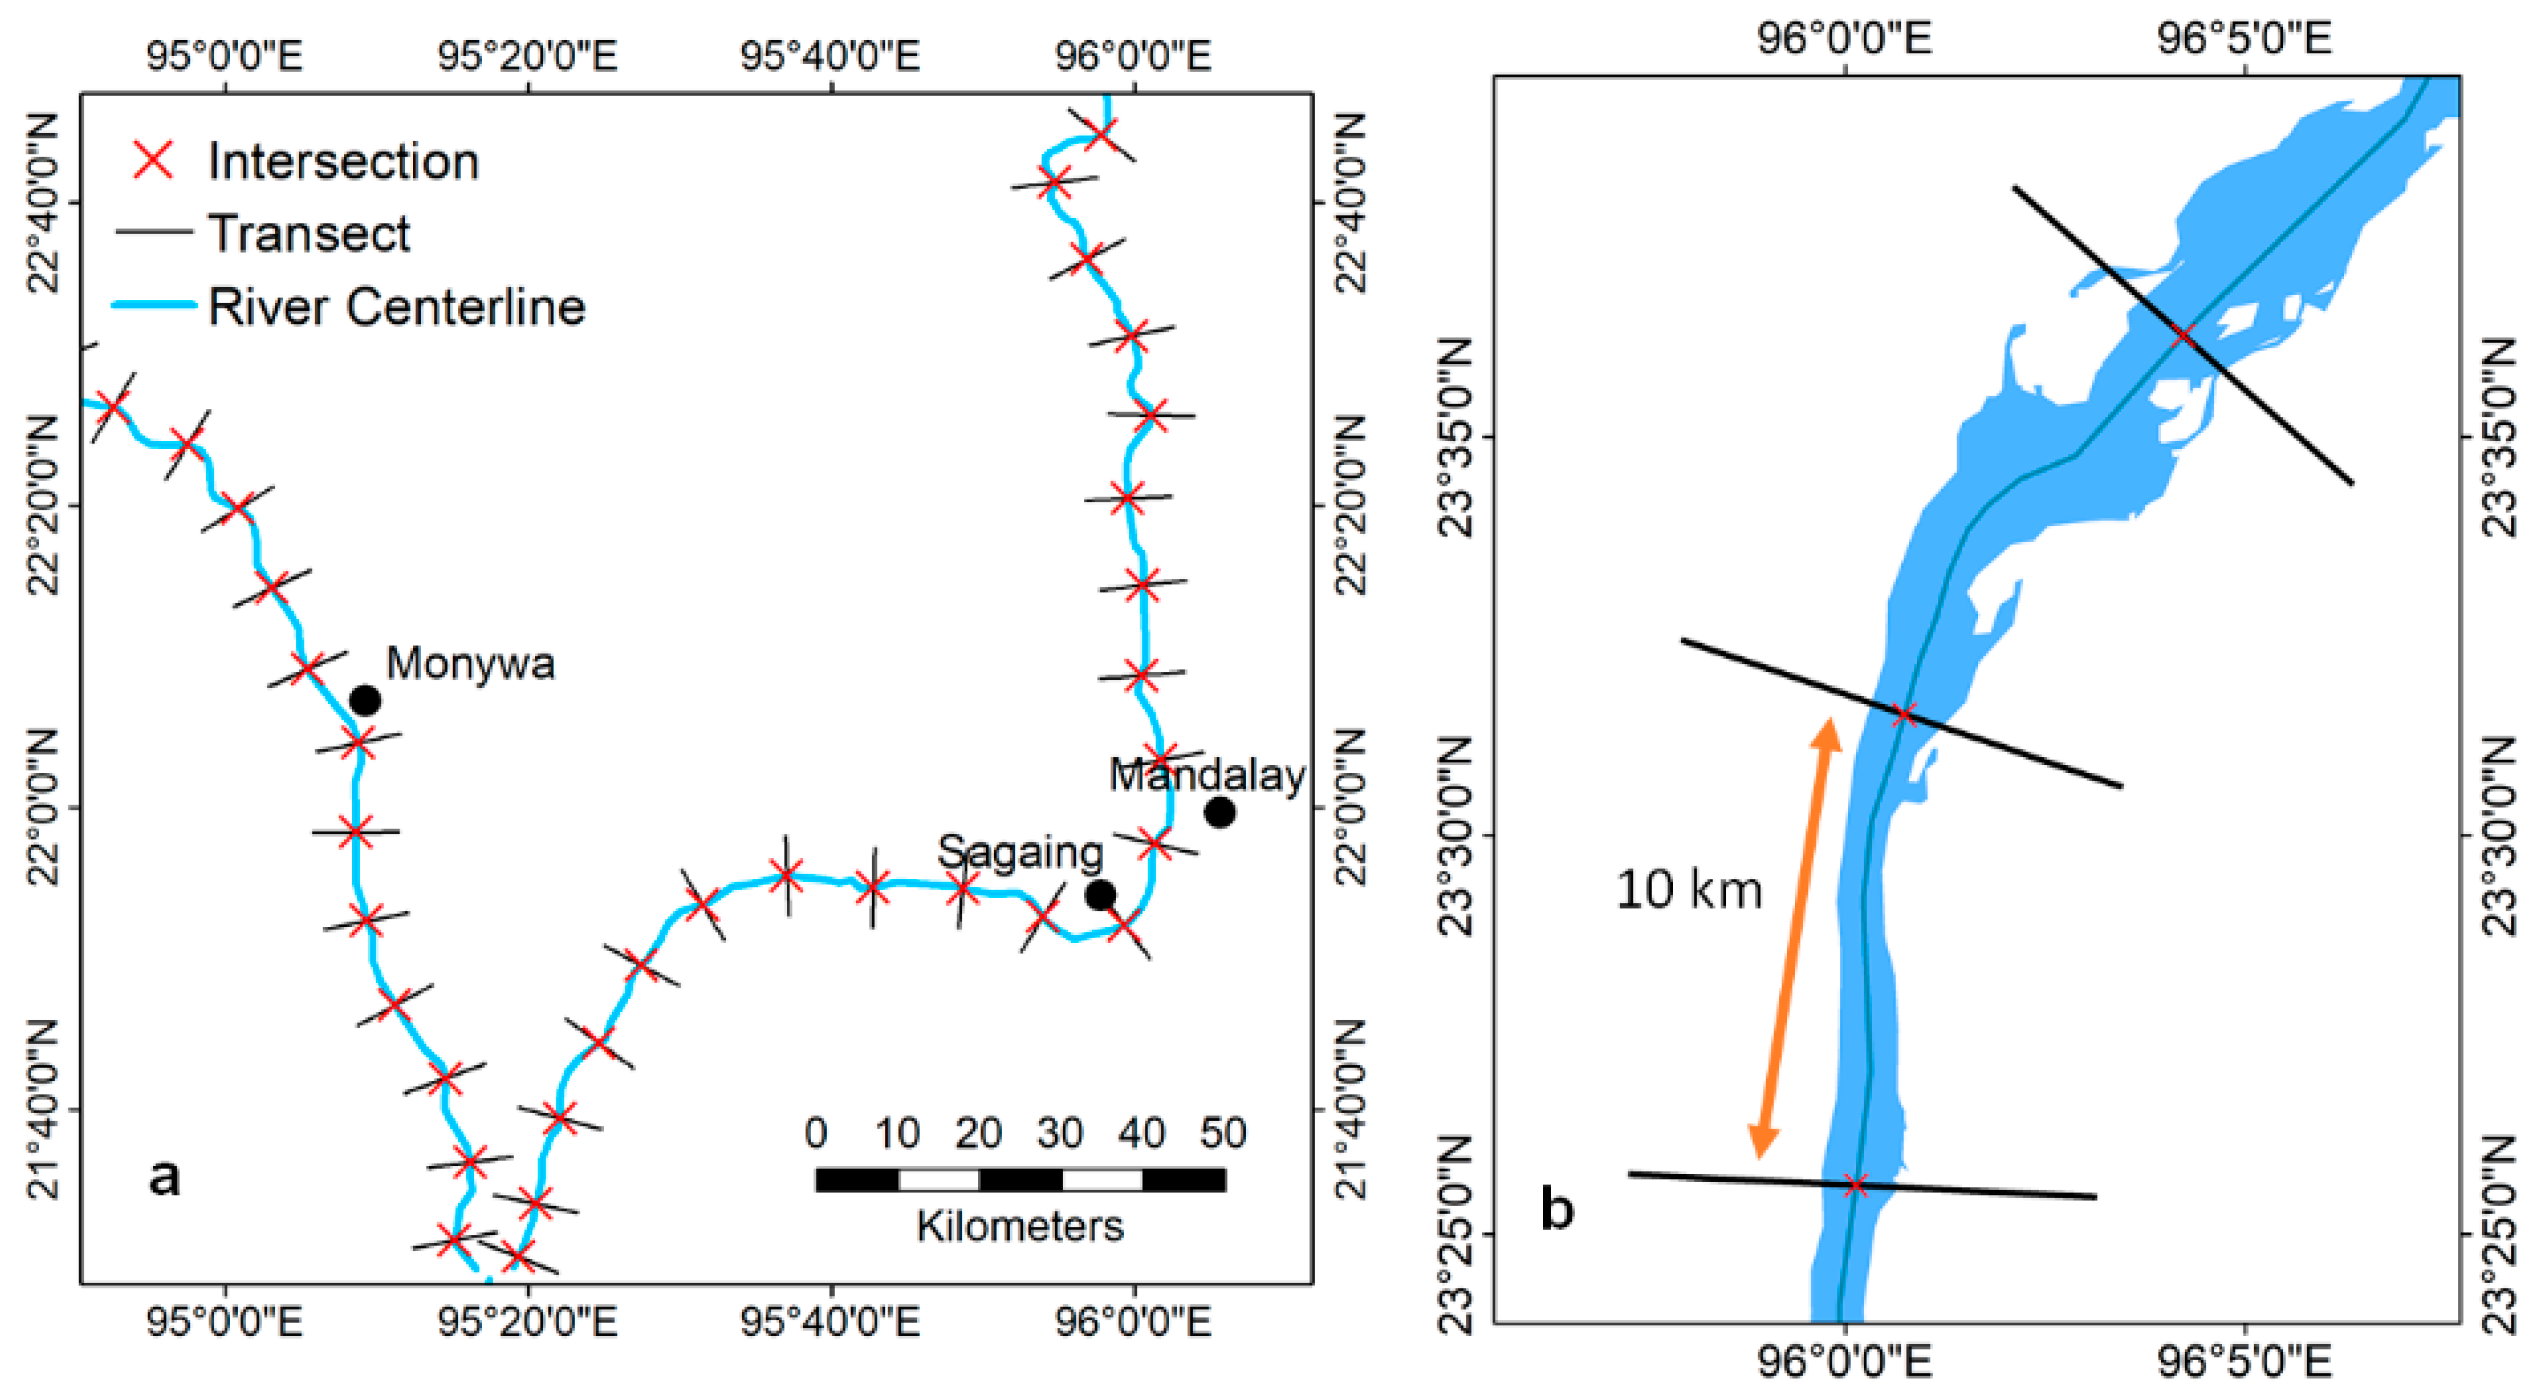
2.1. Study Area

The Ayeyarwady river is the lifeline of Myanmar flowing in the north–south direction for 2,170 km in length with a basin area of 413,710 km2 while dividing the country into two halves before draining in Andaman Sea with discharge about 400 km3 of water (Figure 1). The basin is a transboundary river basin of which 91% lies within Myanmar, around 5% (21,400 km2) in China, and 4% (17,400 km2) in India. The significance of Ayeyarwady basin is deduced from its basin area, which accounts for 60% of Myanmar’s landmass, accommodates 70% of its population, and transports 40% of its commerce [37]. It also serves as the most important national water way transport, through which a large number of people and goods are transported daily. Therefore, the Ayeyarwady river is closely intertwined with the water, energy, and food security of Myanmar and plays a crucial role in driving the economy of the Myanmar populace. Geologically, the Ayeyarwady river basin is strongly influenced by the geological features. It placed within these key tectonic features namely from west to east: The outer Arc (Indo–Burma range), which is mainly sedimentary and meta-sedimentary; the Inner Burman tertiary basin, which is in between the Indo-Burma and Sino-Burma ranges, mainly consisting of tertiary sediments and igneous rocks; and the Eastern Trough along the Sagaing fault system, which consists of mainly of old meta-sedimentary rocks and limestone and in the north with high mountains it consists of metamorphic and igneous rocks, while alluvium is found along the river and in the valleys. In terms of elevation change, there is high drop in elevation (mean slope 3 m/km) in the Upper Ayeyarwady before the confluence of the two rivers N’Mai Hka and Mali Hka, following which the elevation change is gradual (slope = 0.09 m/km) near the delta. In Chindwin basin, the slope gradient reduces from 1 m/km in the first 170 km to 0.14 m/km for the remaining length until the Chindwin/Upper Ayeyarwady confluence [38]. Since the Ayeyarwady basin extends latitudinal, there is high variability in temperature and precipitation. Temperature in the basin increases from the northern mountainous region towards the central dry zone and delta. April–May is usually hottest month (minimum: 18 °C and maximum: 35 °C) and December–January has lower minimum (<15 °C) and maximum temperatures (24–30 °C). Mean annual rainfall in the basin ranges from <1000 mm in the central dry zone to >4000 mm in the northwestern basin and delta [38].
While the Ayeyarwady river originates in the Himalayan glaciers of Northern Myanmar, it is fed predominantly by monsoonal rainfall with peak discharge coinciding with the season between May and October. The ebbs and flows of the river create seasonally inundated floodplains forming extensive wetlands along the course of the river. The annual maximum, minimum, and mean discharge of the Ayeyarwady River is 30,000, 1500, and 13,000 m3/s, respectively [39]. The main sub-catchments of the Ayeyarwady river area, the Upper Ayeyarwady (Upper and Middle), Chindwin, and Lower Ayeyarwady (Lower and Delta), cover 196,425 km2, 114,686 km2, and 111,803 km2, respectively. The river width varies from 1200 m upstream to 4000 m downstream before entering the delta region. The Ayeyarwady transports the fifth largest suspended sediment load globally, with estimates load varying from 261 to 364 million tons per year [11].
The Ayeyarwady River possess highly varying planform dynamics, featuring cutoffs, point bars, oxbow lakes, and scroll bars along its floodplain driven mainly by the high monsoonal flows and large sediment loads from the upstream basins of Chindwin and Upper Ayeyarwady. The drainage pattern and planform dynamics of the Ayeyarwady are controlled by the geological setting of the basin. The Ayeyarwady is constrained by the Shan plateau in the east and the Assam-Arakan fold belt in the west [16,40]. The catchment geology is dominated by sandstone, limestone, and shale formations [38]. At the catchment scale, the Ayeyarwady River follows a contorted drainage pattern while the drainage pattern of its tributaries varies widely from trellis (Chindwin) to rectangular (Upper Ayeyarwady) and dendritic patterns (Lower Ayeyarwady).
For this study, the Ayeyarwady River was divided into three subregions comprising of three individual sub-catchments (Upper Ayeyarwady, Chindwin, and Lower Ayeyarwady). The Ayeyarwady delta region is not considered for the morphological assessment.

2.2. Methods

2.2.1. Data

Landsat missions provide the longest record of satellite imageries to date, capturing earth surface dynamics with a 16-day revisit time [41]. Multitemporal, multispectral observations from Landsat spanning 40 years makes it uniquely positioned to monitor fluvial geomorphology changes for historical assessment and operational use [42]. The sensors onboard Landsat 5–7 collected data in the visible, near-infrared (NIR), and short-wave infrared (SWIR) channel of the electromagnetic spectrum at 30 × 30 m spatial resolution. The Landsat 5 Surface Reflectance Tier 1, Landsat 7 Surface Reflectance Tier 2, and Landsat 8 Surface Reflectance Tier 1 collection available in GEE from 1988 to 2019 were used to develop the river morphological monitoring system for the Ayeyarwady river. These products are atmospherically corrected surface reflectance produced and precomputed using Land Surface Reflectance Code (LaSRC) and Landsat Ecosystem Disturbance Adaptive Processing System (LEDAPS) algorithm by GEE. The Ayeyarwady river (the blue line region in Figure 1) is covered by 9 Landsat tiles. The Quality Assessment (QA) band available for each Landsat scene is used to mask pixels flagged as cloud or cloud shadow.

2.2.2. Creating Pre-Monsoon and Post-Monsoon Composite

The mean monthly discharge at Pyay gauging station in the Lower Ayeyarwady river showed large variations in discharge from monsoonal rains. Most optical images are severely affected by clouds during the monsoon season, which lasts from June to September. It is evident from Figure 2 that the discharge variations in the dry season (January to May) were smaller as compared to the monsoon months. January to May provides an ideal window to map morphological changes from the previous monsoon season because of low water levels. However, consultation with the Directorate of Water Resources and Improvement of River Systems (DWIR) of Myanmar indicates that surveys of erosion-affected areas along the Ayeyarwady usually begin in January with subsequent strengthening works carried out before the start of the next monsoon season in June. To negate the influence of dynamic variations in river stage over different months, November and December months of the current year were selected for the post-monsoon composite, while November and December months of the previous year was selected for creating a pre-season composite. By selecting the same temporal window each year for comparison, it is assumed that the influence of dynamic river stage changes will be negligible. The two-month window was selected to provide the best chance to obtain a cloud-free composite from four Landsat images.
Extraction of the river channel was conducted using a water index. To select a suitable water index, existing water indices (NDWINIR-Green by McFeeters [43], NDWIRed-SWIR by Rogers and Kearney [44], and MNDWI by Xu [45]) were tested. Two variations of the Normalized Difference Water Index (NDWI) were considered for this exercise, which used different combination of bands. Formulas are as given below:
NDWI G r e e n N I R = ( G r e e n N I R ) ( G r e e n + N I R )
NDWI R e d S W I R = ( R e d S W I R ) ( R e d + S W I R )
MNDWI = ( G r e e n S W I R ) ( G r e e n + S W I R )
where Green is the green band wavelength of 0.52–0.60 µm (Landsat 5 and 7) and 0.53–0.59 µm (Landsat 8), Red is the red band wavelength of 0.63–0.69 µm (Landsat 5 and 7) and 0.64–0.67 µm (Landsat 8), NIR is the near-infrared band wavelength of 0.77–0.90 µm (Landsat 5 and 7) and 0.85–0.88 µm (Landsat 8), and SWIR is the shortwave infrared band wavelength of 1.55–1.75 µm (Landsat 5 and 7) and 1.57–1.65 µm (Landsat 8).
Figure 3 shows difference in results of extracted waterbodies when using percentile-based optimum thresholding aided by histogram for each index. Here, water indexes are scaled to same range of 0–1 to support intercomparison. From the visual inspection of the indices (Figure 3c,e,g), they show similar contrast between land and water bodies. Small islands (red square) within the river channel are clearly demarked in NDWINIR-Green as compared to NDWIRed-SWIR and MNDWI; however, in case of tributary river channels (green arrow and yellow circle), there is loss of boundary pixels (Figure 3d). Thus, NDWINIR-Green would be more suitable for extracting land features from shallow water bodies. Though MNDWI and NDWIRed-SWIR have similar contrast upon applying thresholding, MNDWI (Figure 3h) preserves islands as well as smaller tributaries, thus reducing misclassification of pixel values. Thus, MNDWI was used to classify the pre- and post-monsoon Landsat composite into land and water based on a predetermined threshold as shown in Figure 4b,e.
While advanced machine learning classifiers, such as support vector machines [23] and random forest [46,47], have been increasingly used to classify remote sensing images into different physical entities, MNDWI was chosen to deliberately keep the processing chain simple and easily understandable for local stakeholders engaged in the system development. MNDWI is one of the most popular indices to extensively used for water surface extraction from optical imagery [45] and has been widely applied around the world [48,49,50]. The river channel masks extracted from the pre- and post-monsoon composites were used for further analysis. Permanent inland water bodies were removed from the pre- and post-monsoon composites based on the European Commission’s Joint Research Center (JRC) maximum water extent data [51].

2.2.3. Seasonal River Morphological Changes

Channel mask differencing was applied to the pre- and post- monsoon river channel masks to map erosion and accretion areas along the Ayeyarwady River. Figure 4 shows the derived erosion–accretion raster from the MNDWI water mask (Figure 4b,e). A pixel is deemed eroded when it transitions from land in the pre-monsoon map to water in the post-monsoon map, while for accretion, a pixel must change from water in the pre-monsoon map to land in the post-monsoon map. It is possible that large variations in river stage between the two composites and significant cloud coverage in one composite will impart some uncertainty and may lead to under or over predictions of erosion or accretion areas.
Figure 4. Shows extraction of riverbank erosion and accretion for the year 2019. Standard False Color Composite images for (a) 2018 and (b) 2019 are used to extract the MNDWI raster with water area mask in yellow for (d) 2018 and (e) 2019. (c) shows the water masks of 2019 (red) overlayed by the water mask of 2018 (blue). (f) Riverbank morphology change raster overlayed on FCC of 2019, where blue is no change in the river channel, red is erosion areas, and yellow is the accretion areas.
Remotesensing 14 03393 g004
While multiple options exist to classify optical imagery into water and land, a threshold-based approach was chosen for its ease of application and its understanding by the government stakeholder in Myanmar. Each pixel in the pre- and post-season Landsat composite was classified into land and water. Change detection was applied on the classified pre- and post-monsoon river channels to extract erosion and accretion location. In general, the land pixels in the pre-monsoon composite, which converts into water pixels in the post-monsoon composite, is classified as erosion (land loss). While if the water pixels in the pre-monsoon composite gets converted into land pixels, then it is classified as accretion (land gain). Figure 4f shows results from the change detection on 2018 and 2019 water masks delineating erosion, accretion, and no change pixels. The river bank with land loss (erosion) can be observed upon overlaying the 2018 river channel layer over 2019 as in Figure 4c. Classification of partially inundated pixels in large, multithread rivers such as the Ayeyarwady impart additional uncertainty due to a “fuzzy” spectral signature [52]. To reduce uncertainty, any resulting isolated pixel (30 × 30 m) is removed from the dataset.
Within the GEE platform, river banklines were extracted from the river channels by converting rasters to polygon and extracting their outer perimeters. Due to the multi-thread channels, delineation of stream centerlines was carried out in the ESRI ArcGIS ArcScan tool. River channels were processed in GEE to derive binary raster with outer banks of the river, thus removing multi-threading. Following to that using ArcScan vectorization tool, centerlines for each year were computed using the corresponding year binary raster. River centerlines and banklines obtained from the channel masks were used to compute migration rates between 1988 and 2019. The entire monitoring system domain was segregated into 159 equidistant points along the starting river centerline (1988). The distance between starting and ending river centerlines was computed along the latitude for the points generated earlier to compute the migration rate.

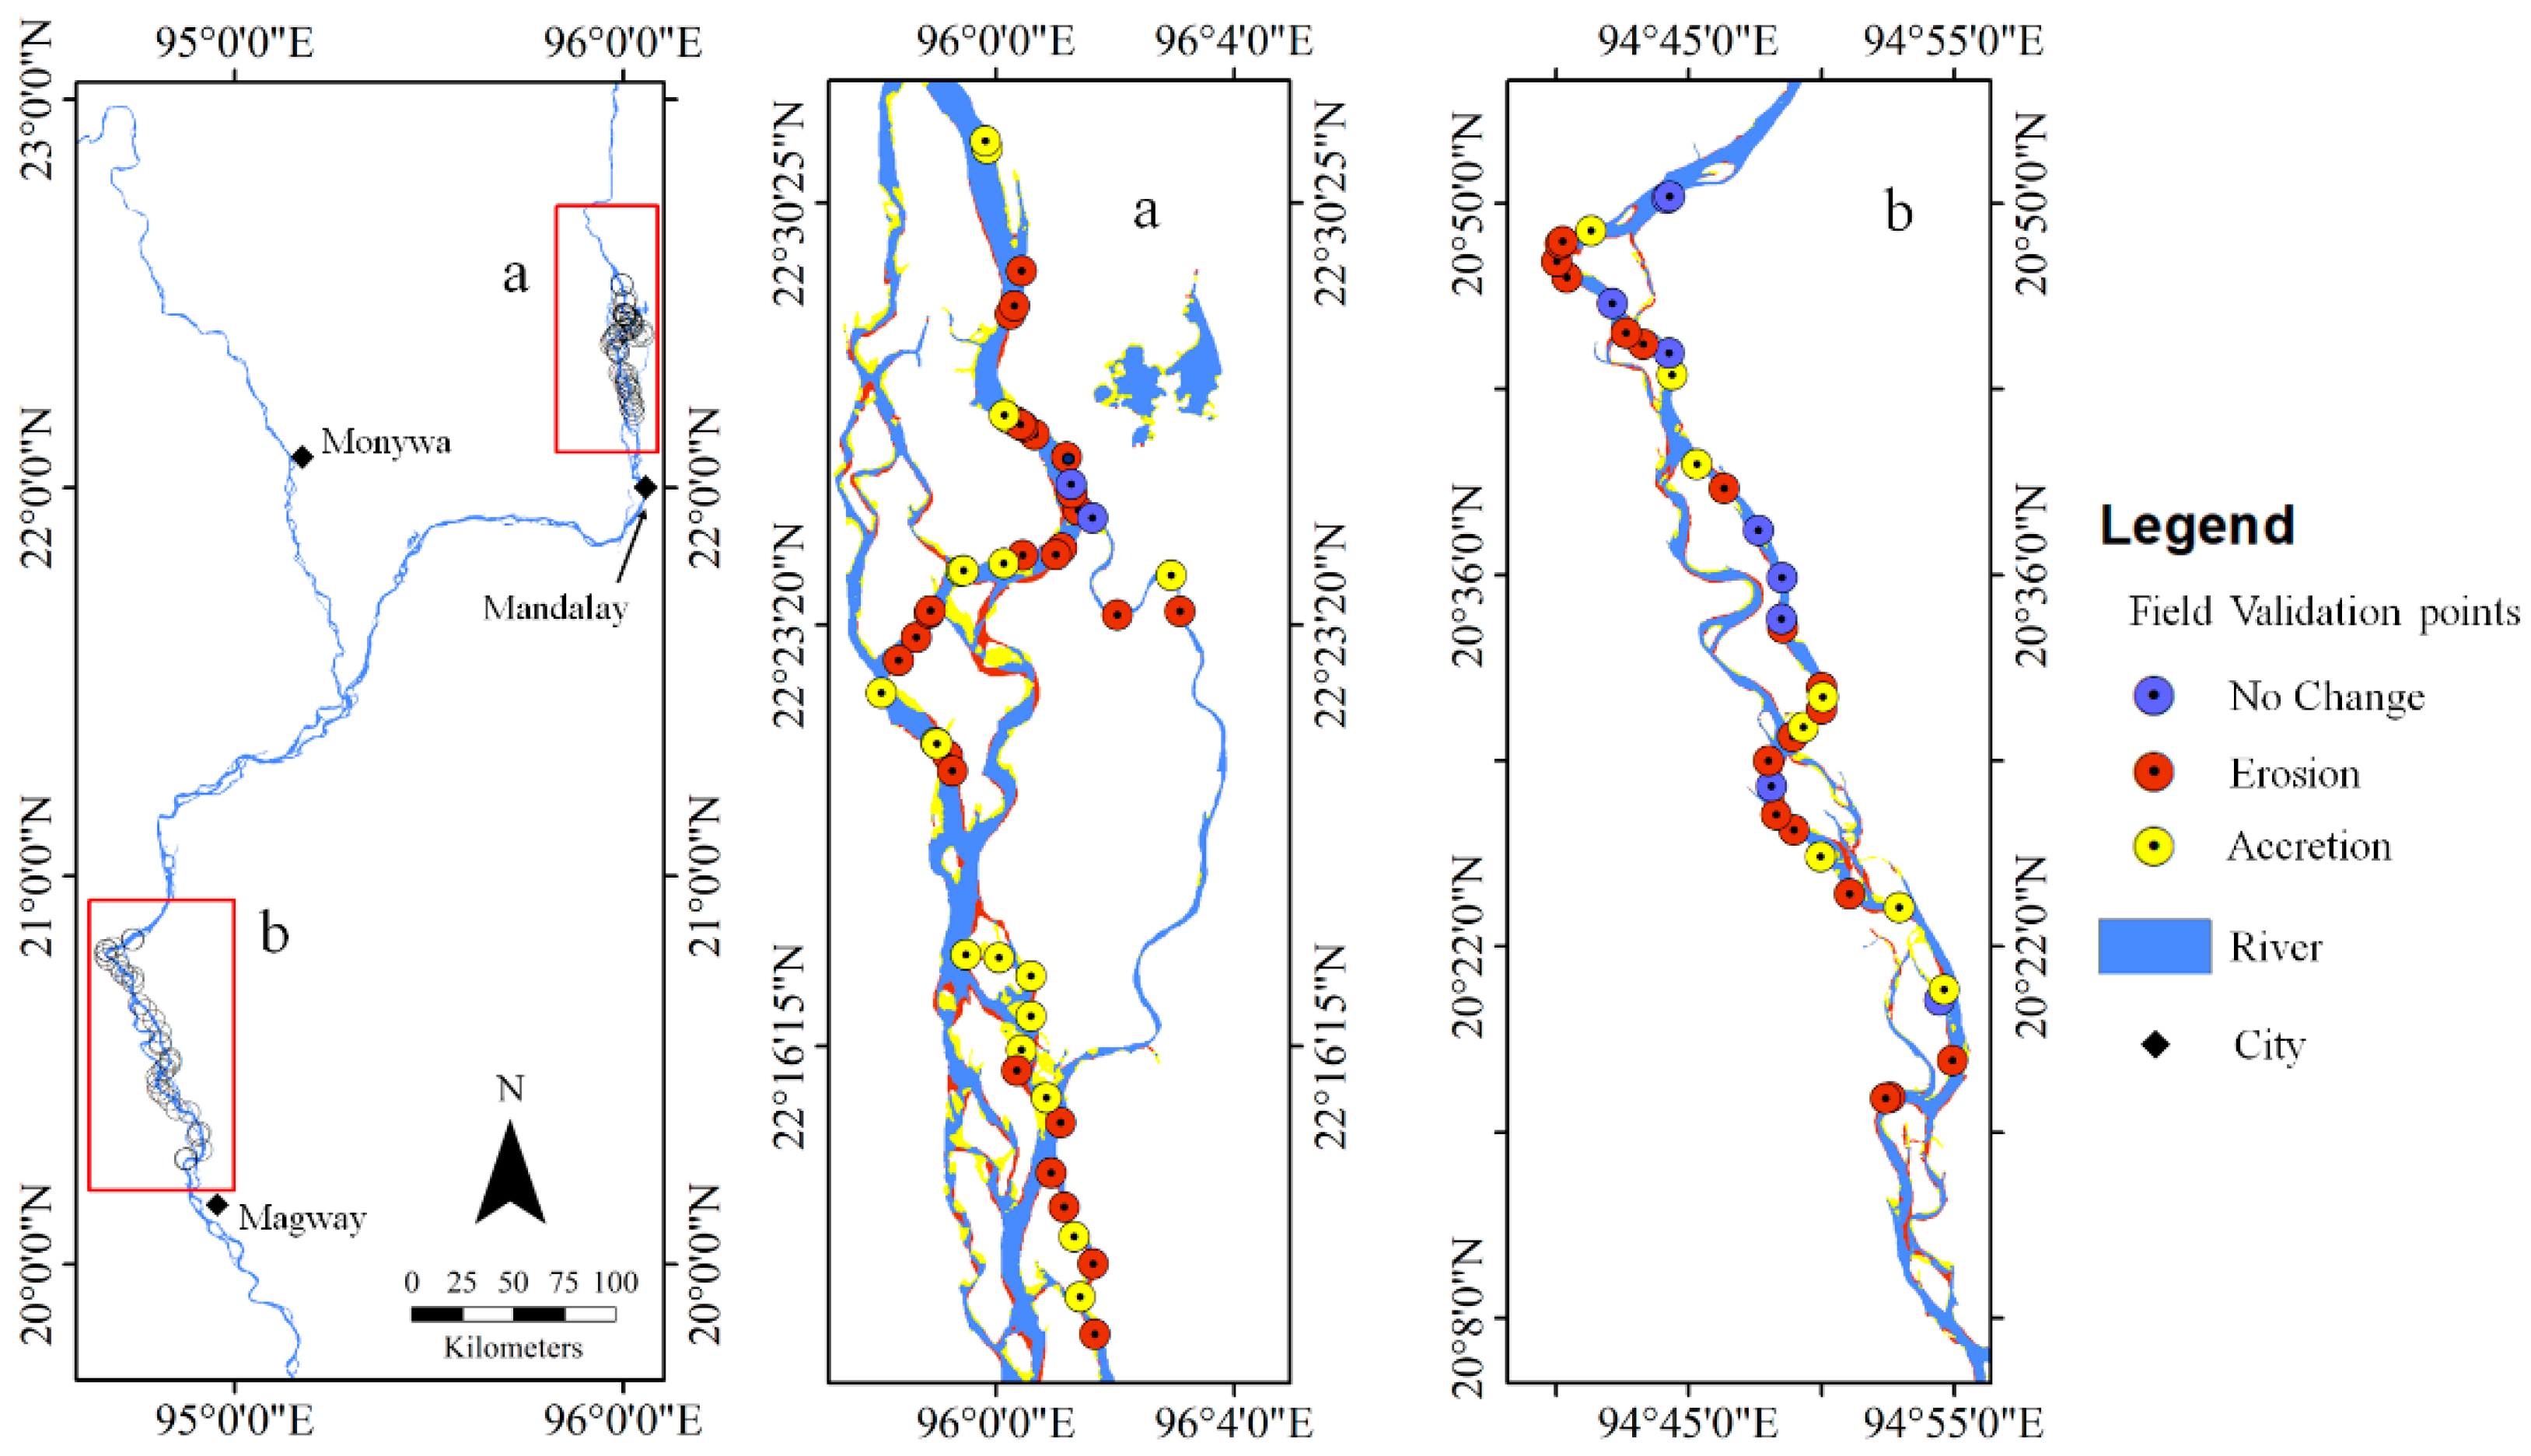
2.2.4. Field Validation

During the receding monsoon months of 2019, in situ data were collected in sections of the Upper and Lower Ayerarwady river. GPS locations of erosion and accretion were collected along with geotagged photographs, river bank side according to the river flow direction, and village/administrative unit name. A survey was conducted by boat to reach nearest location of riverbank change based on the river change raster generated from satellite data composite as well as information provided by the locals. Collected in situ data were used for the accuracy assessment of 2019. Results are shared further in Section 3.1.

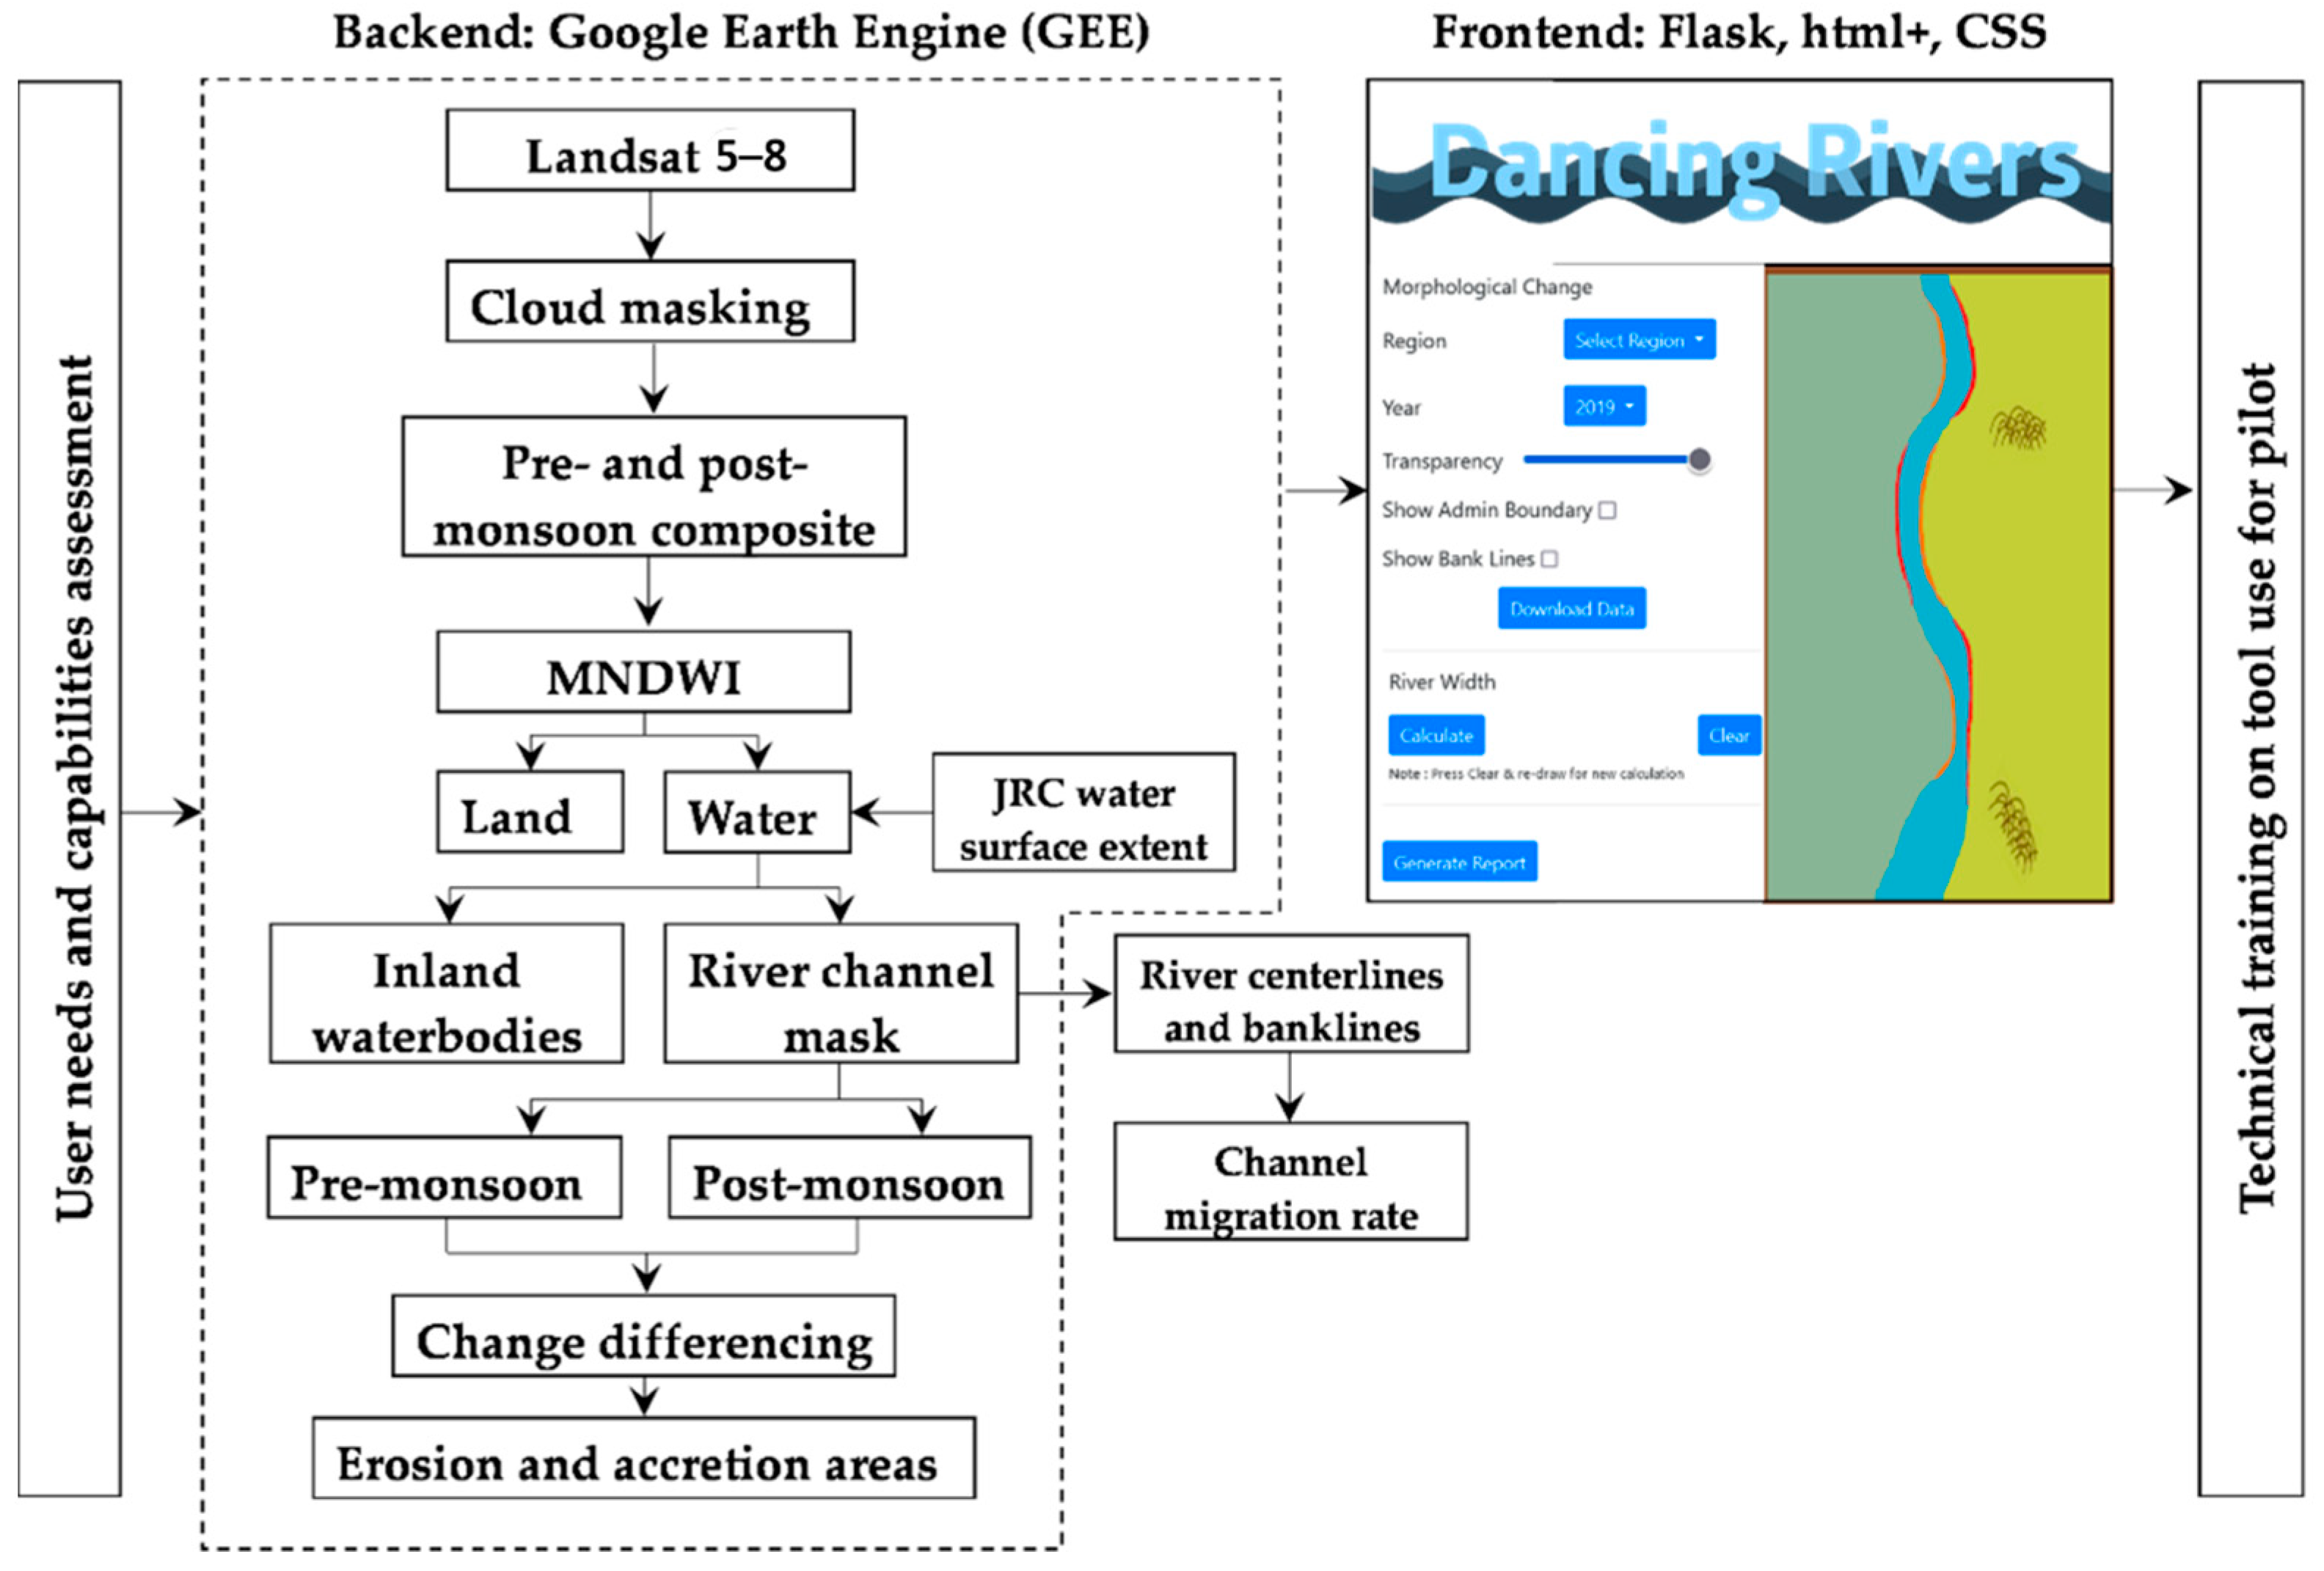
2.2.5. Developing a Web-Interface

Dancing rivers (https://myit-servir.adpc.net/, accessed on 25 May 2022) is a web application devloped to enable users to visualize and analyze river bank changes as well as download the river morphological changes data. It is developed with the GEE cloud-computing platform python API as the backend, with the frontend designed and developed using Flask, HTML5, and CSS web framework (Figure 5). Apart from the data visualization area, the user interface (UI) also contains a data querying panel with options to select region, year, banklines, administrative boundaries, and river profile options (draw transect and plot chart). Users can visualise river morphology along with the banklines for selected years and regions. The time series of river width changes for a location can be visualized in a chart by drawing a line transect along both the banks. Based on the year selected, users can also download river morphological changes raster in Georeferenced Tagged Image File Format (GeoTiff), which is interoperable in other geospatial software.
The river width profiles enables the users to draw a cross-section transect from which the time series river width at the end of every monsoon season will be calculated by aggregating the total number of pixels classified as water in post-monsoon channel masks. This operation was embedded into the web interface at the request of stakeholders. Options to download data to the local drive and online report generation were included in the web interface.

2.3. Service Planning Approach

The entire web-based river morphological monitoring system was embedded within the stakeholder-centric service planning approach that emphasizes the co-development of tools with stakeholders. The GEE methodology was developed upon discussing the needs and capabilities of DWIR, Myanmar. Upon completion of the GEE processing chain, a stakeholder discussion was organized to design the web interface centered on accessibility and ease of use. The entire process was designed to ensure tool adoption by the DWIR and other stakeholders in Myanmar and reiterate that the montoring system is intended to support rather than supplant their operational river protection activities.

3. Results

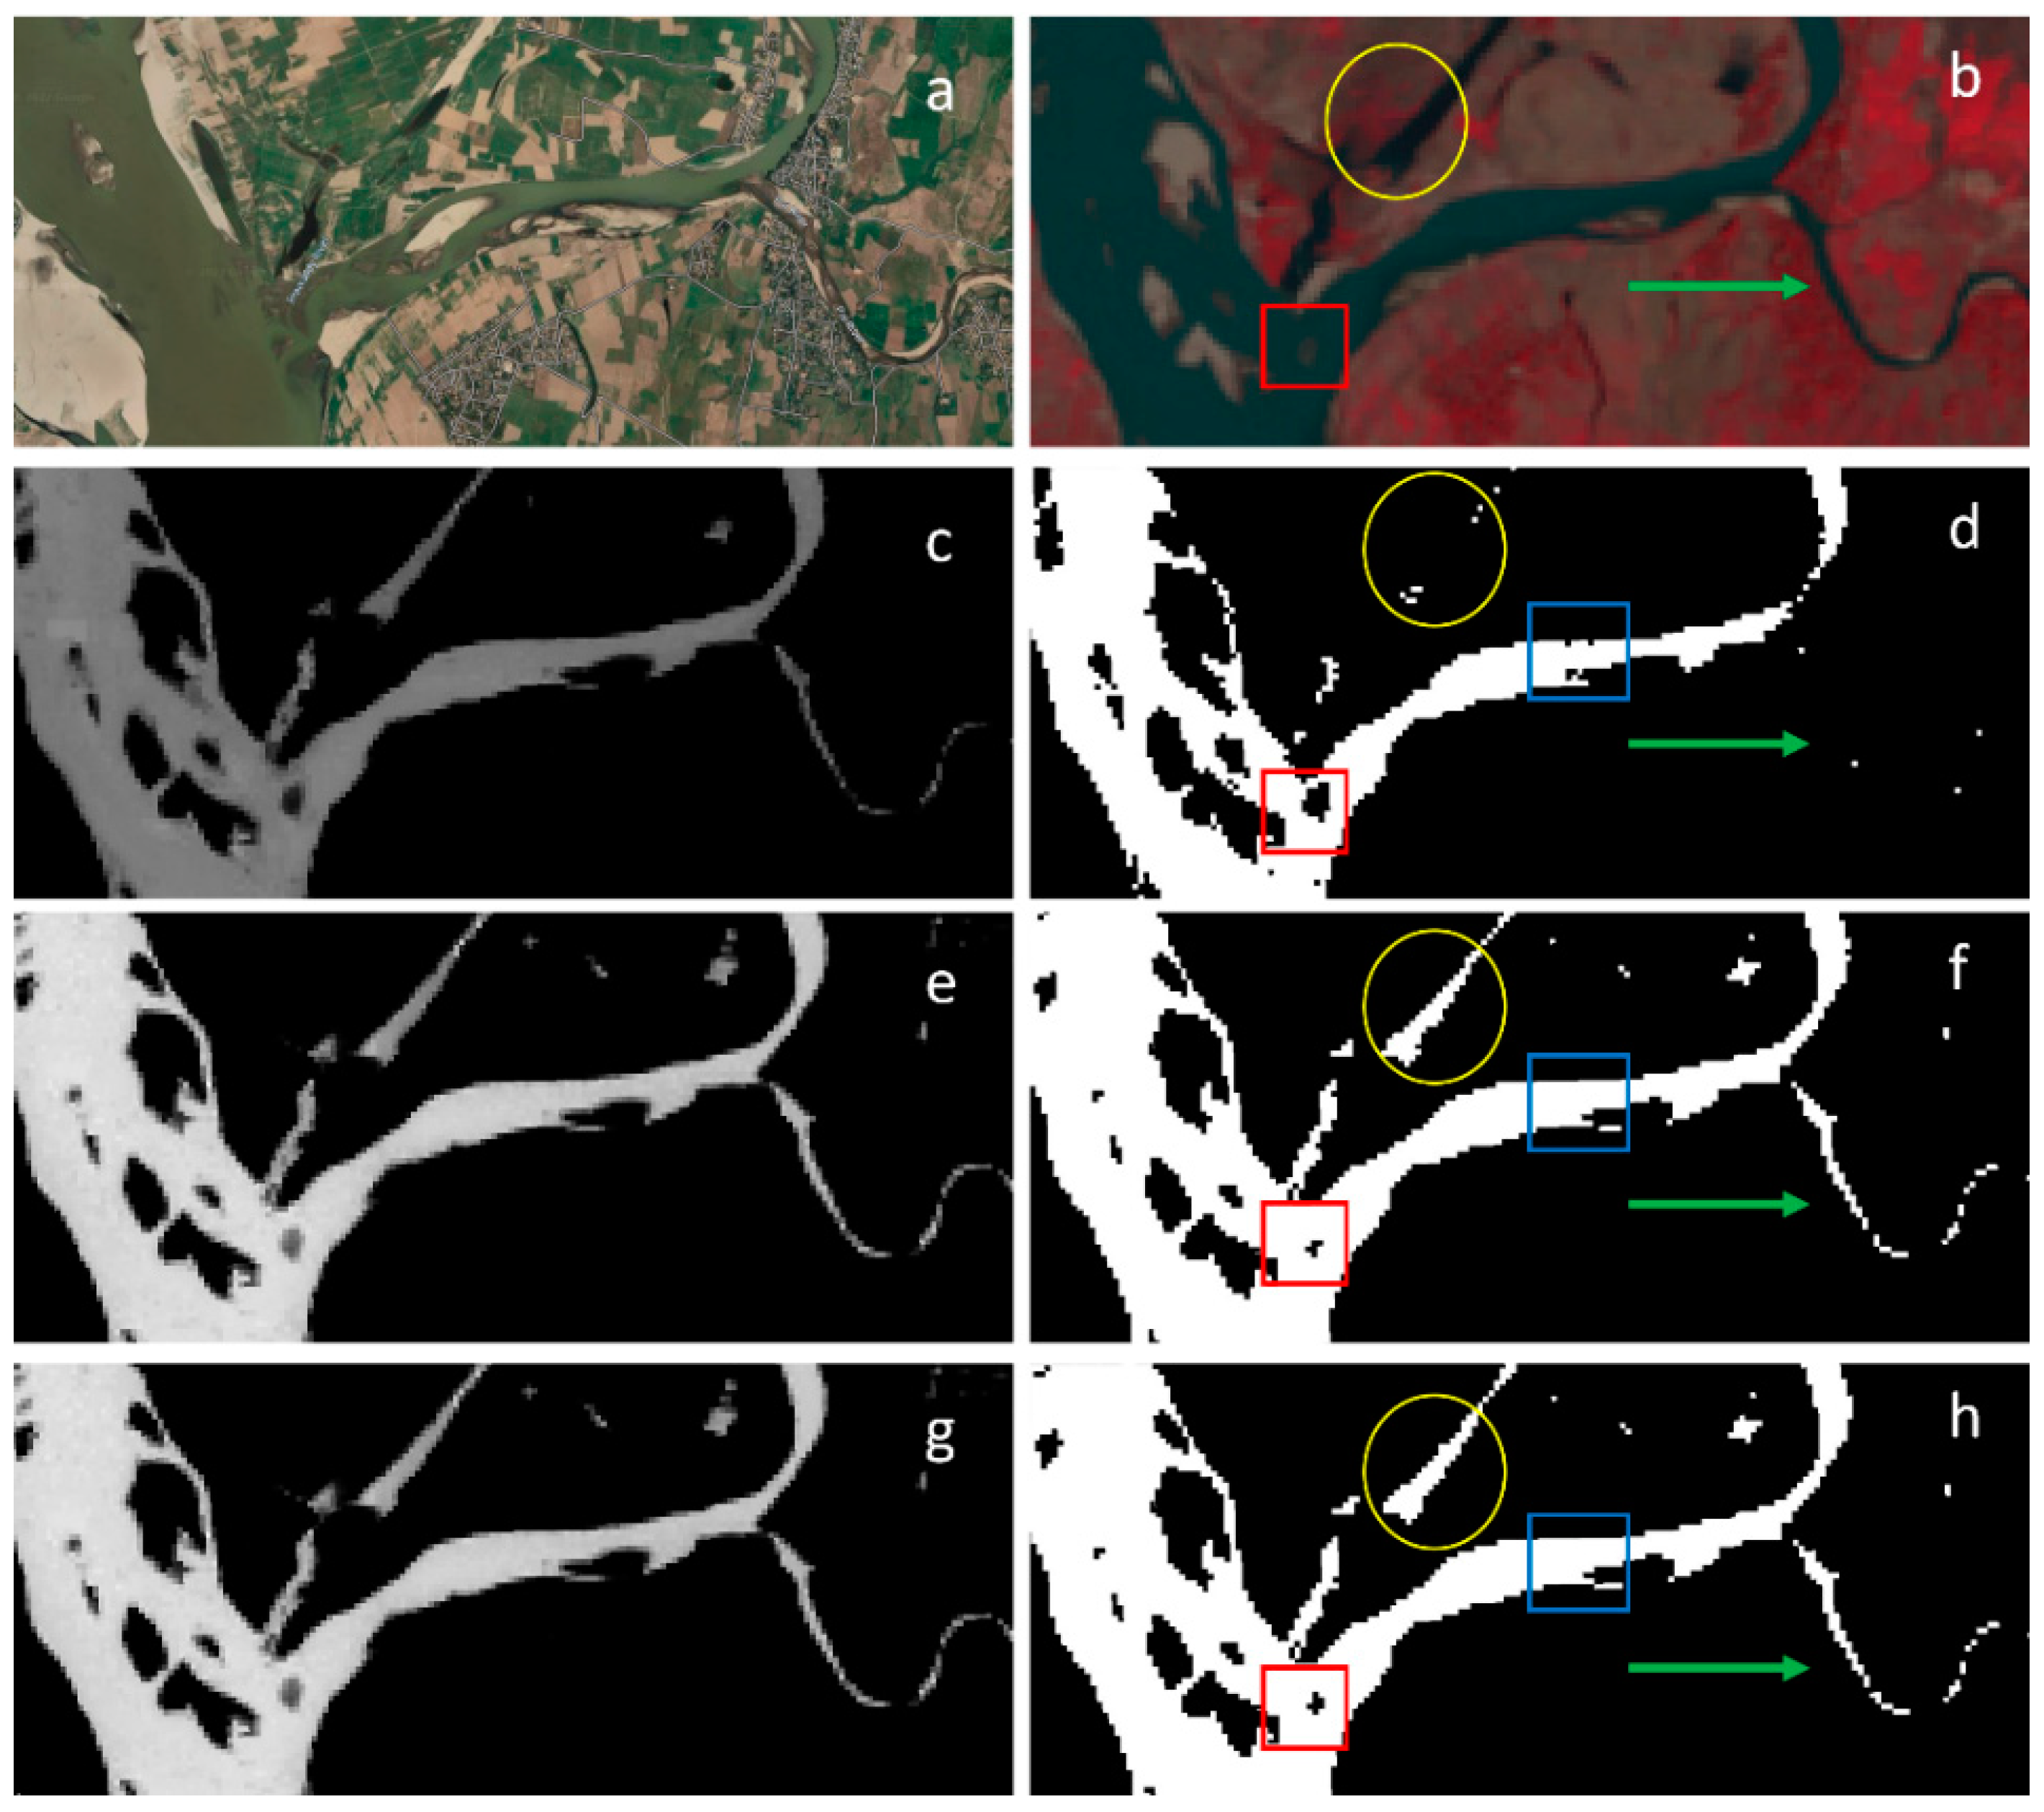
3.1. Field Validation and Accuracy Assessment

During the receding monsoon months of 2019, a field verification survey was conducted in two morphologically active river stretches (Figure 6). A total of 86 field observations were collected during the survey, which were compared with the satellite data-derived change raster of the same year. The confusion matrix in Table 1 was derived using field observations. Overall accuracy was 0.894 with a Kappa coefficient (KC), specificity, and sensitivity of 0.814, 0.942, and 0.882, respectively. Additionally, the F1 score for the matrix was 0.873, indicating high accuracy of the methodology. For both erosion and accretion class, the producer’s accuracy and user’s accuracy were satisfactory. No change class had a lower user’s accuracy (73.33%), which can be due to the limitations of spatial resolution of Landsat datasets to detect changes in land–water boundary pixels from land to water (erosion) as compared to water to land (accretion).

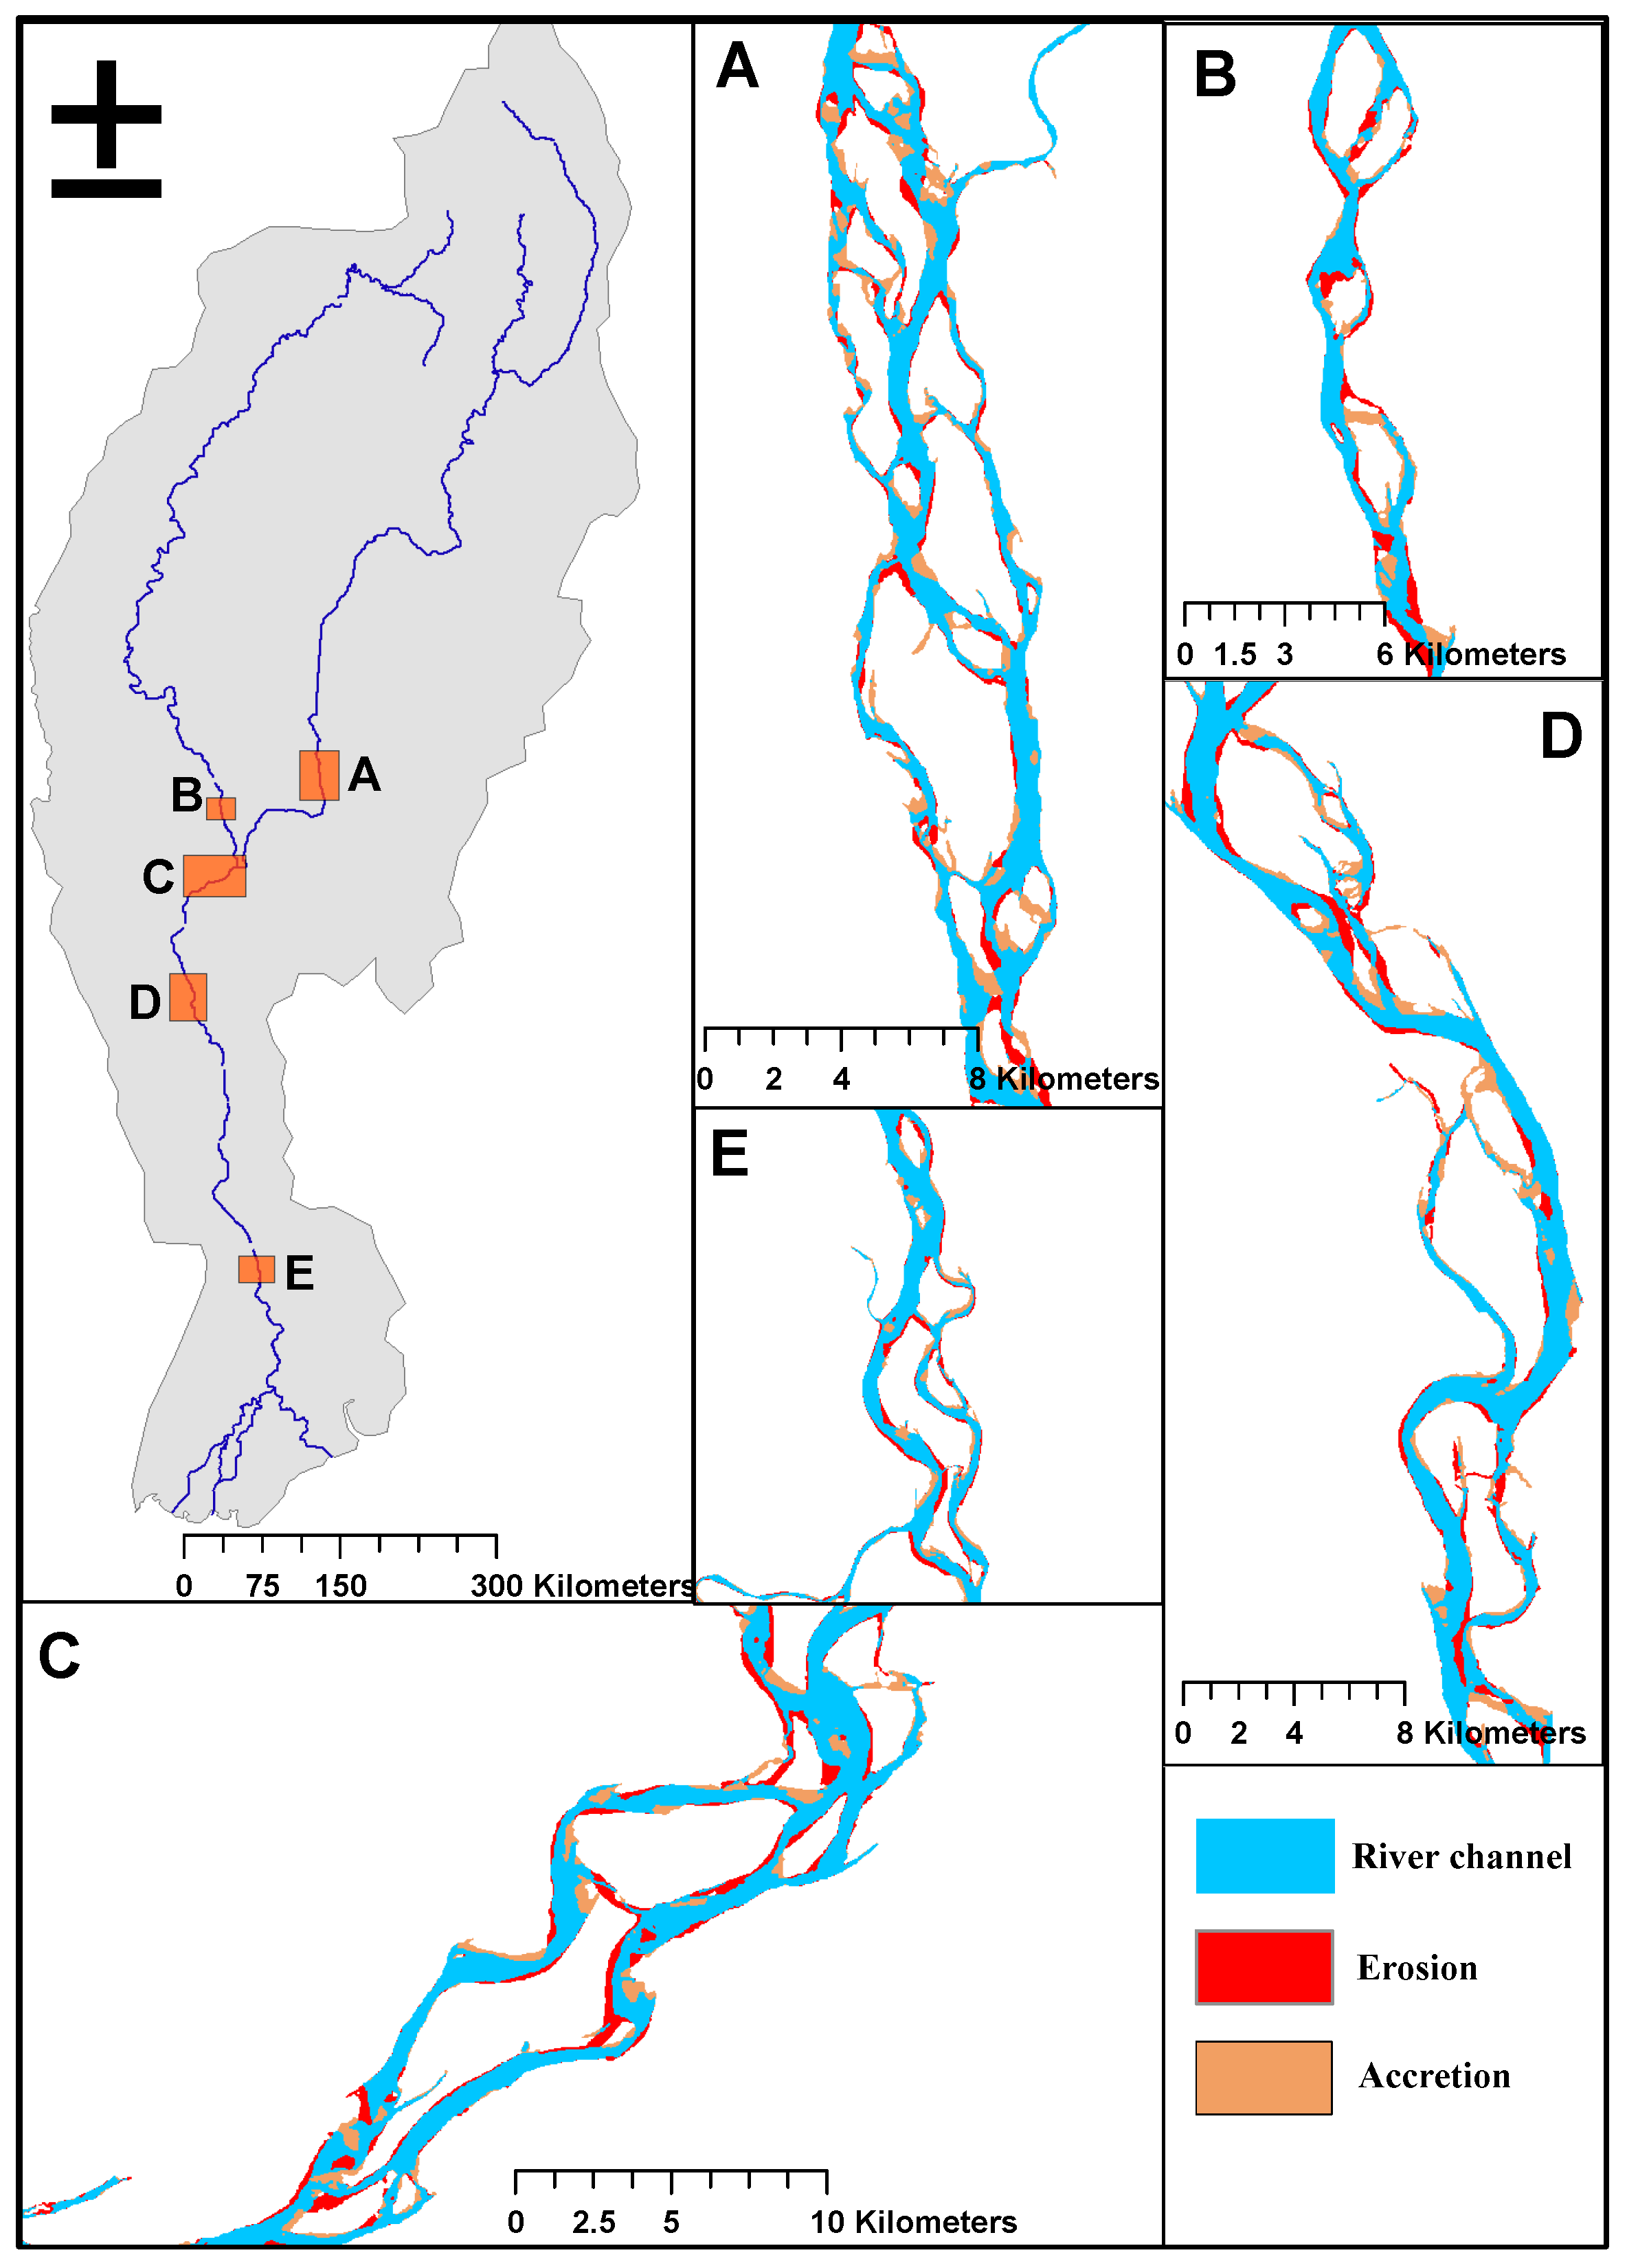
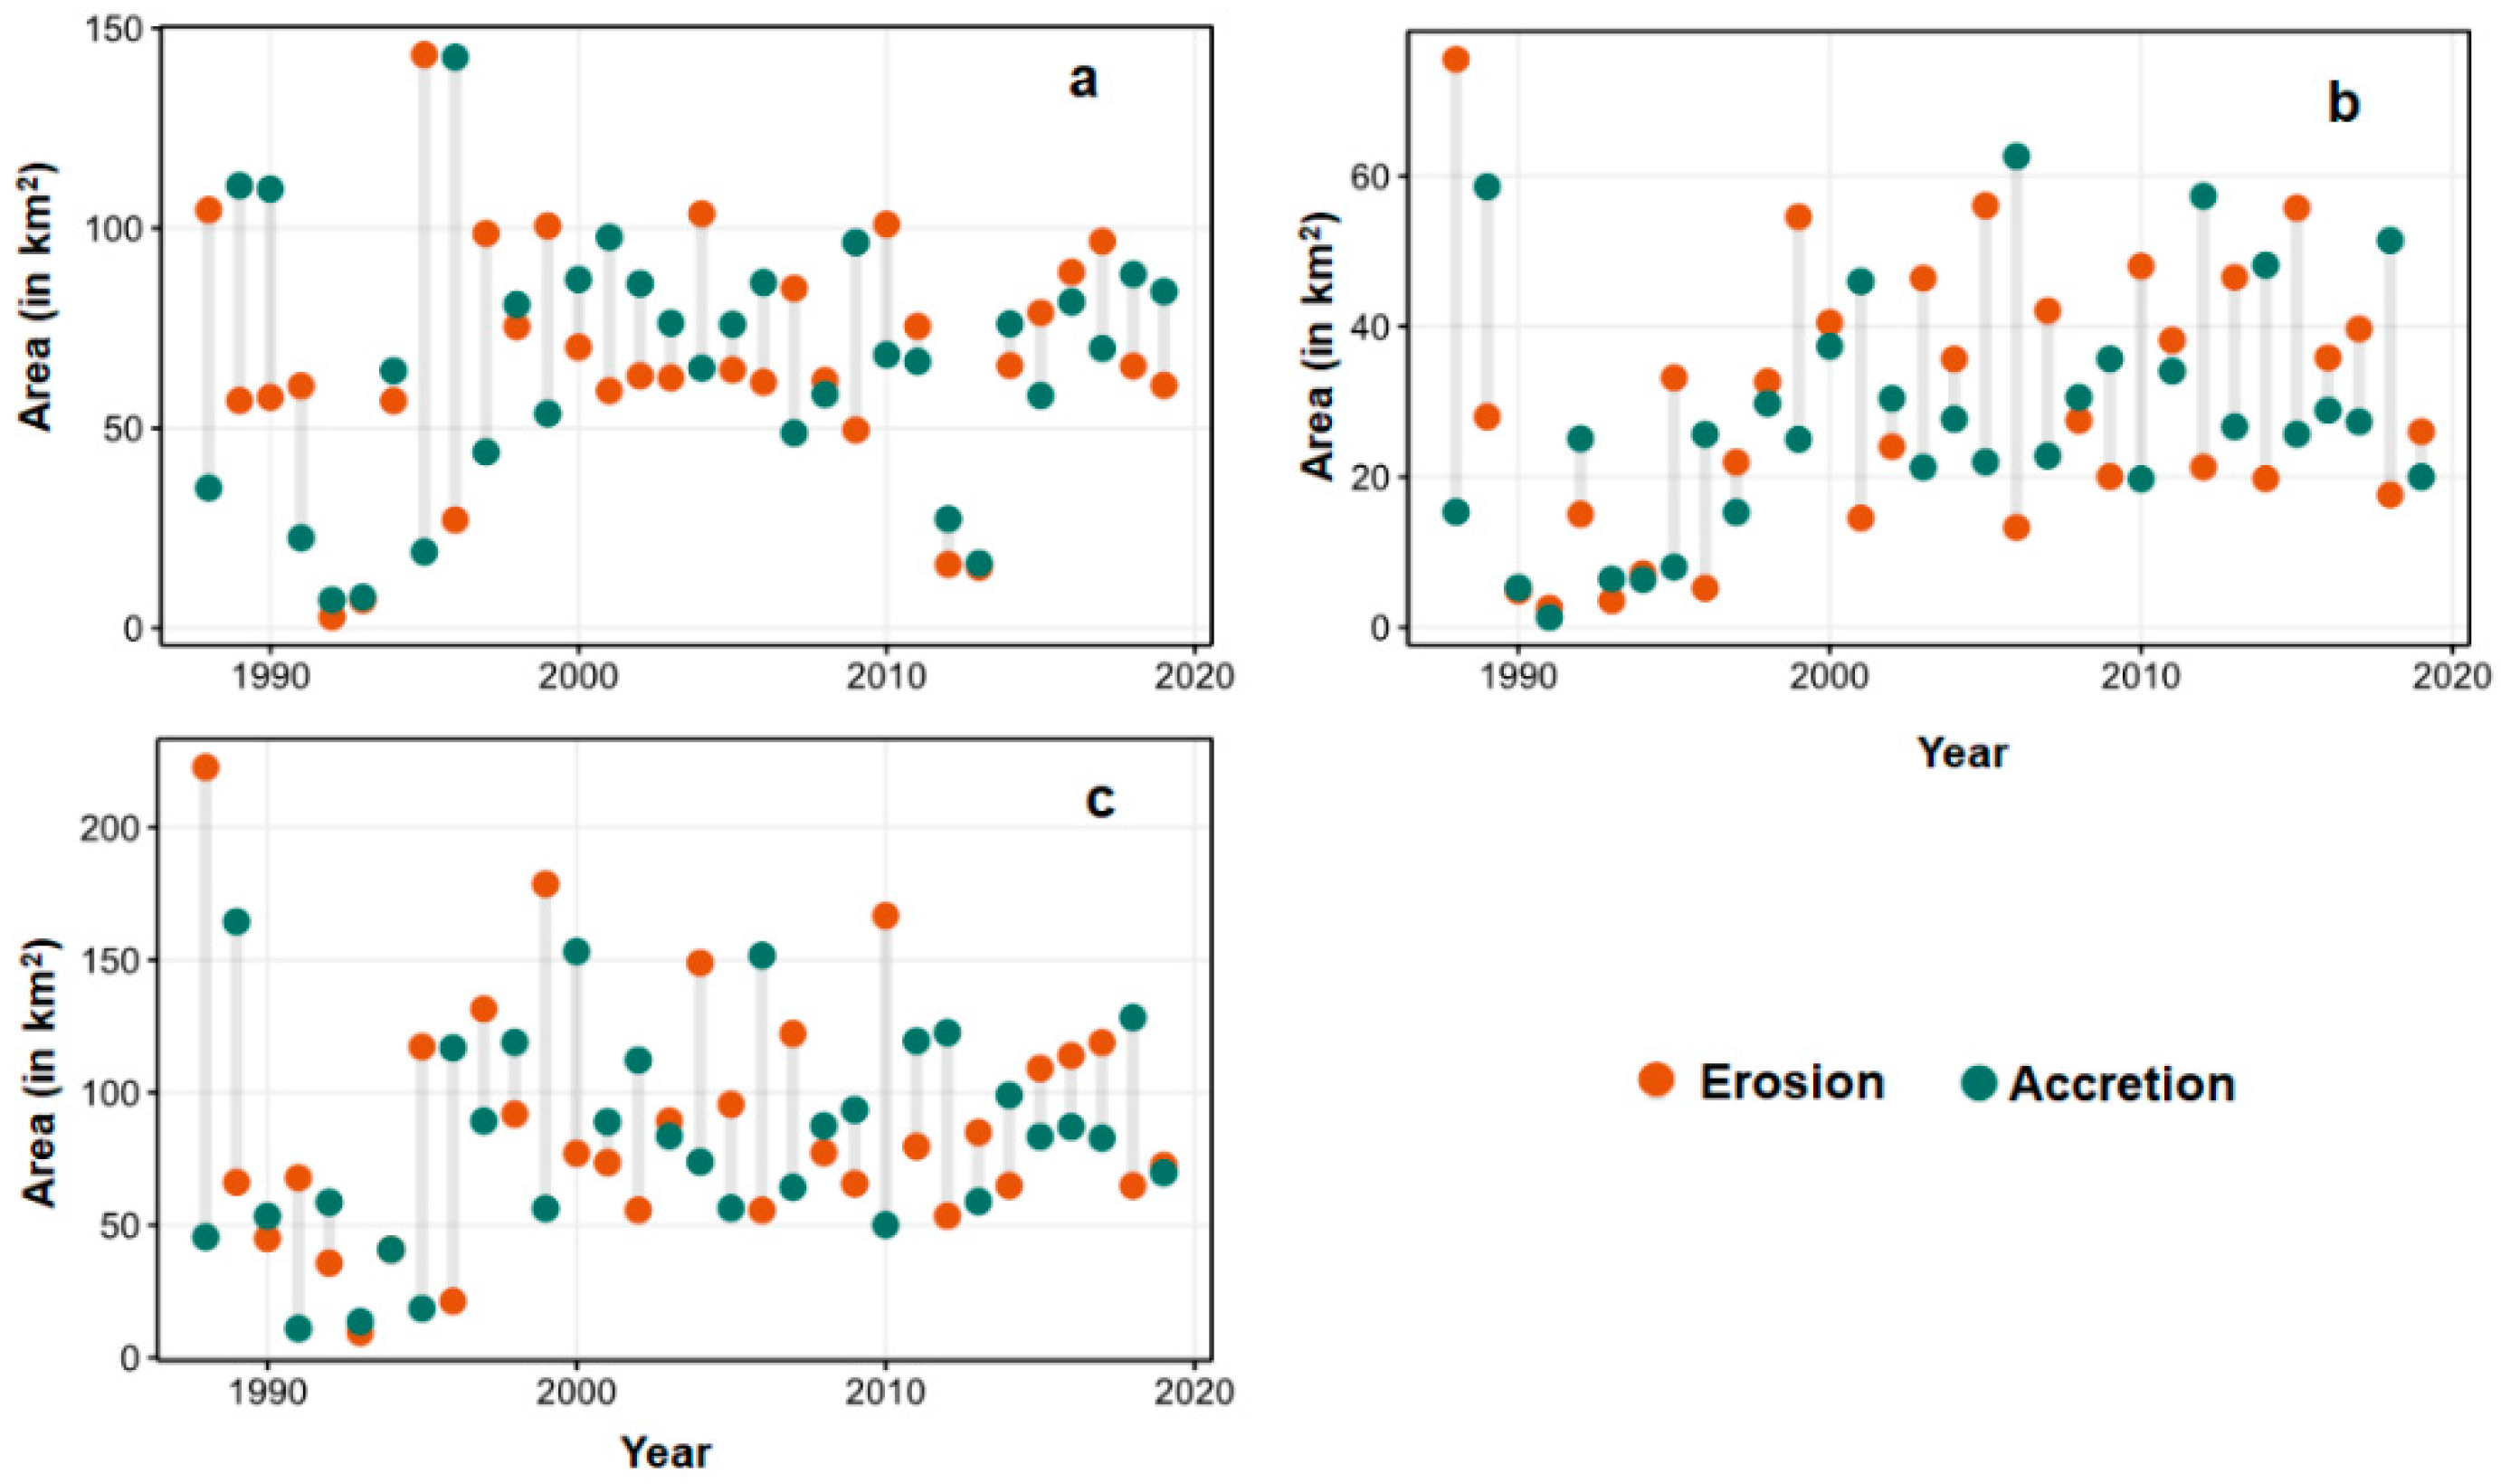
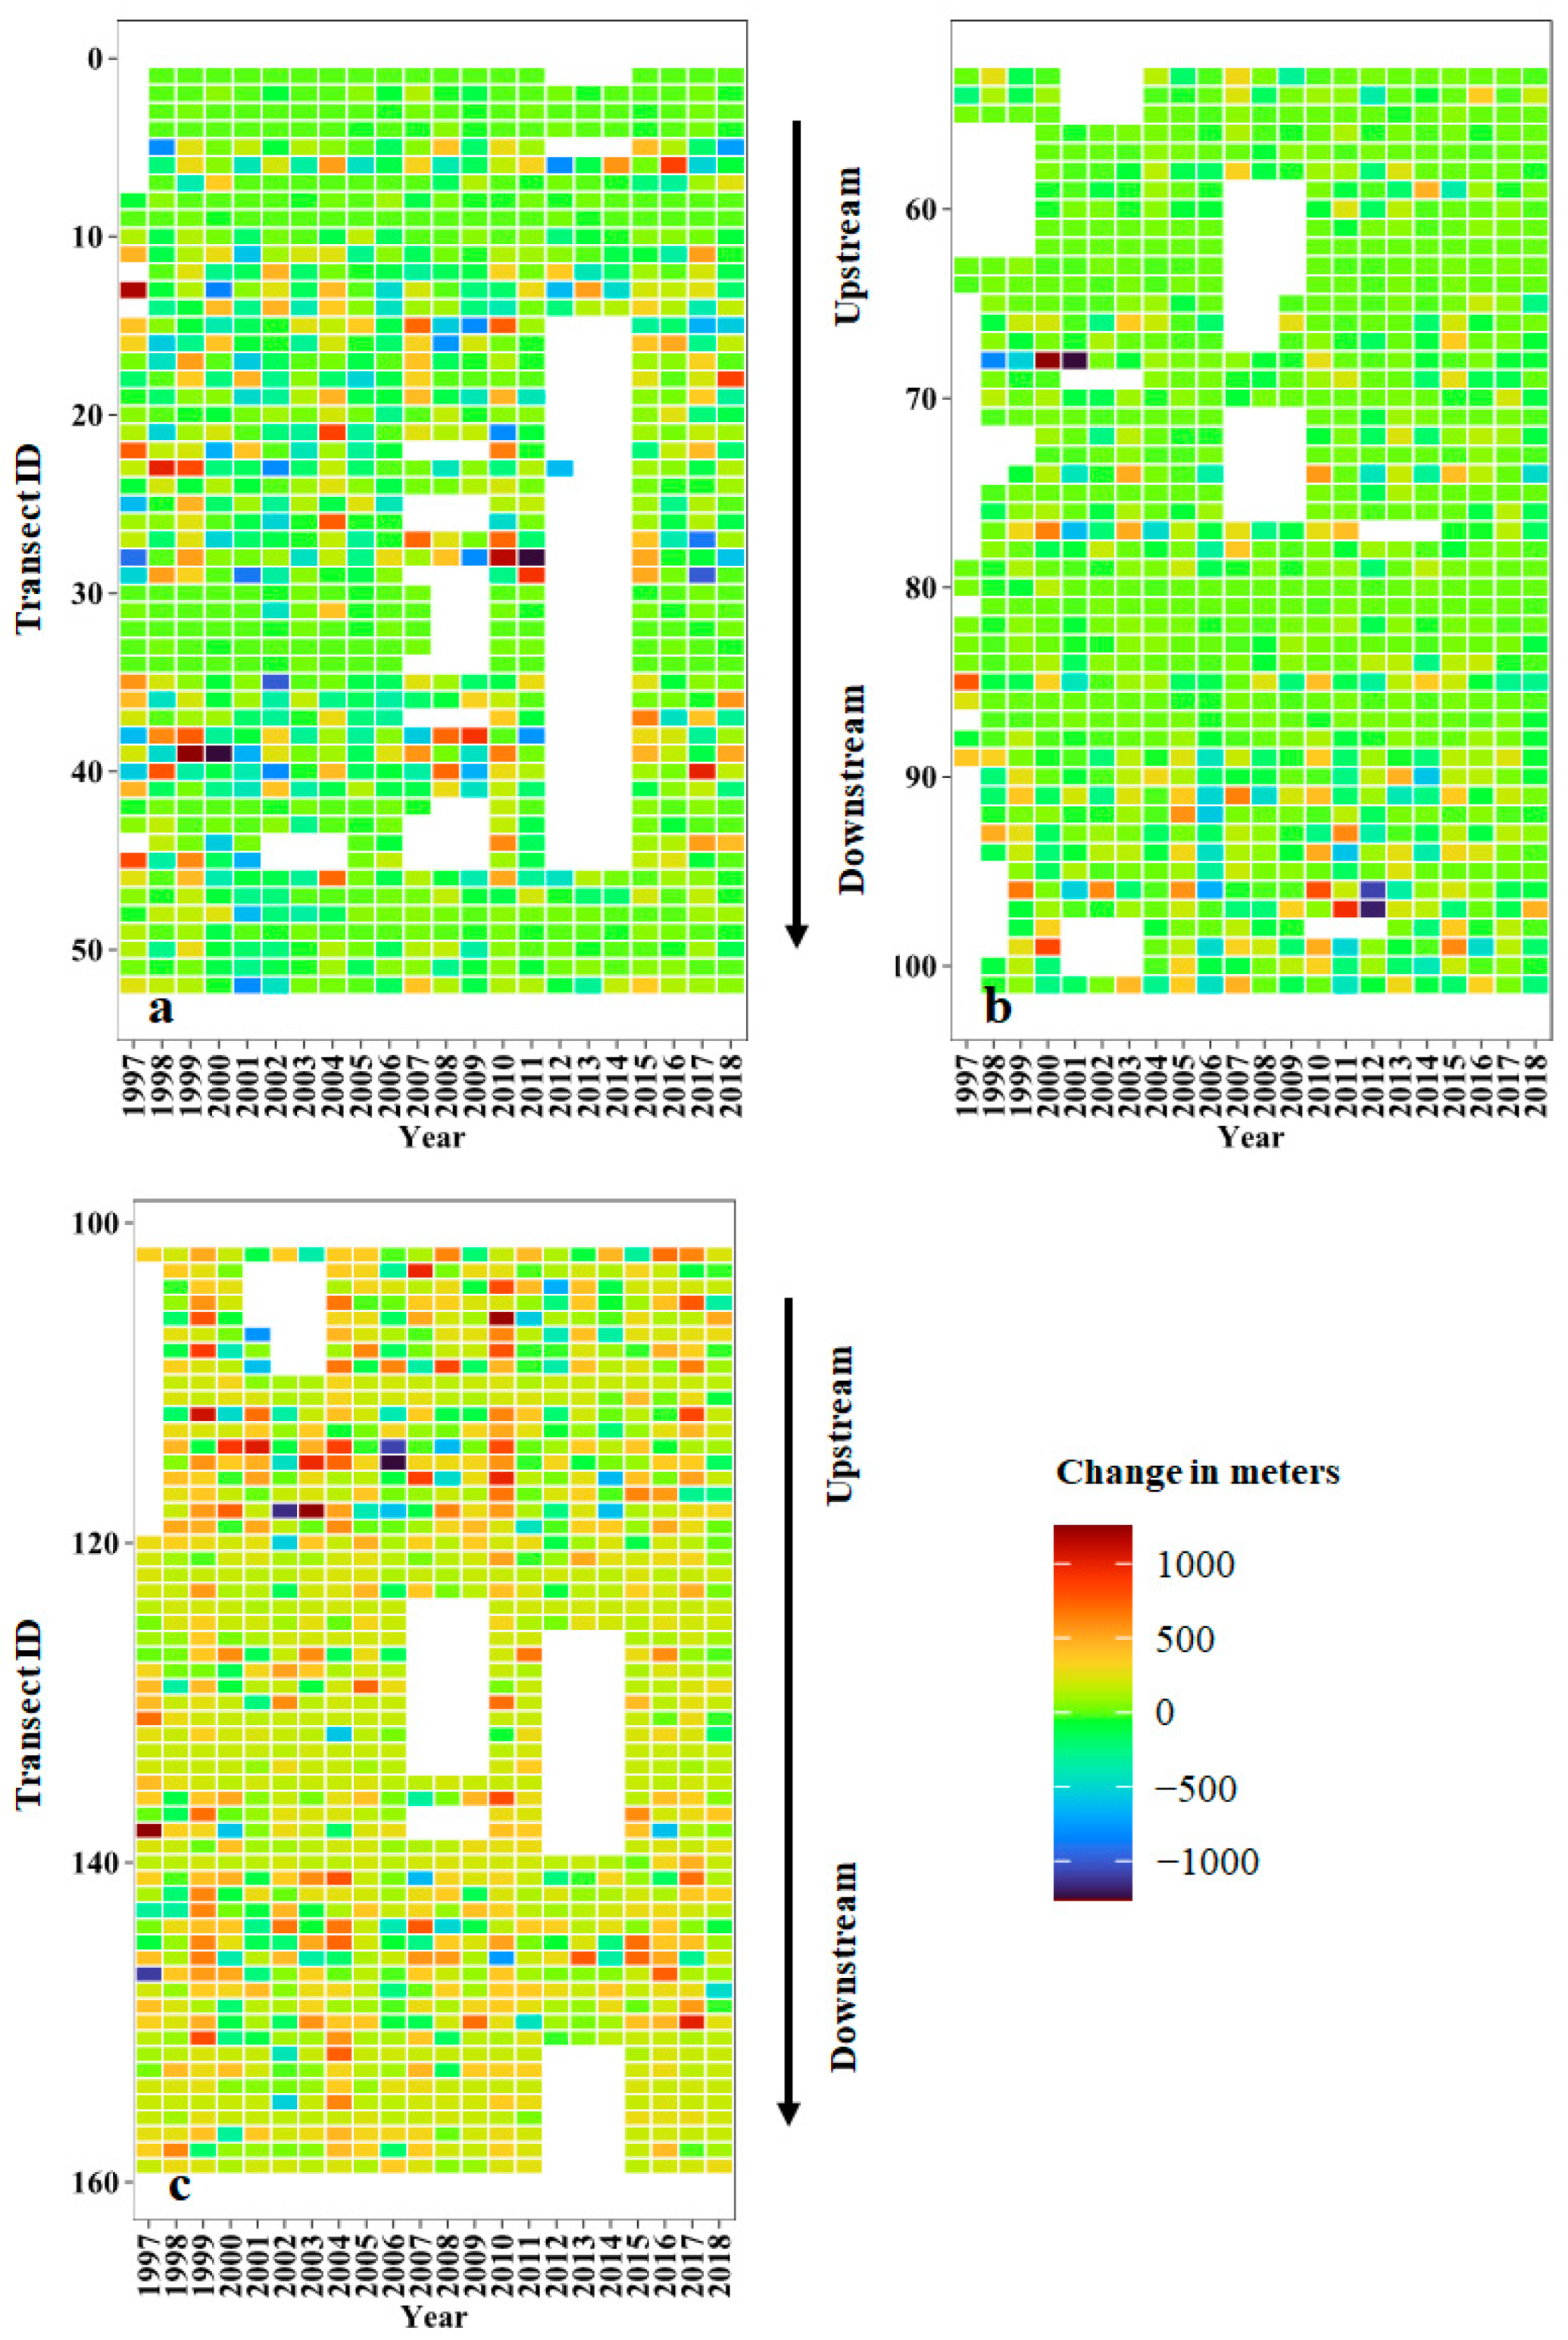
3.2. Spatio-Temporal Changes in Erosion/Accretion Areas

Figure 7A–E shows the river morpho-dynamics of erosion and accretion at five selected reach sections in the Ayeyarwady river for the 2019 monsoon season. The dataset demonstrates suitability to identify and monitor rich morphological features and its evolution at the end of every monsoon season. The assessment in 2019 was selected because we conducted field survey data collection to validate the results from remote sensing analysis. The blue color represents the stable river channel at the end of the monsoon season without any change, the red color represents the eroded riverbank areas, and the brown color illustrates the accretion areas. The flow direction of Ayeyarwady is generally from the north to the south direction. The erosion and accretion changes for the monsoon season 2019 were observed at the selected five reaches. These reaches are located either close to major cities (Figure 7A—Mandalay; Figure 7B—Monywa; Figure 7D—Magway) or in morphologically important locations (Figure 7C—the confluence of Upper Ayeyarwady and Chindwin; Figure 7E—above the Ayeyarwady delta). All the river reaches under consideration reveal multithreaded channel patterns, channel bends with different curvatures, presence of channel bars, and dynamic erosion and accretion activities along its entire length. In Figure 7A, large channel bars are a salient feature with the main channel nested in between. The main channel located on the left at the upstream section bends in between the channel bars in the middle reach before curving left at the downstream end. The left bank (in the direction of flow) appears relatively stable with few localized areas of accretion and the absence of eroded riverbank areas. This might be because of the riverbank protection built to buffer Mandalay city against erosion risks. In 2019, most of the erosion and accretion were concentrated around the channel bars except for one large erosion spot at the end. The morphological dynamics of the reach near Monywa (Figure 7B) also show similar spatial patterns, albeit with channel bars in size and numbers.
The confluence of the Chindwin and Upper Ayeyarwady (Figure 7C) showed two main channels of similar size having comparatively large areas of erosion rather than accretion in 2019. While accretion areas were mostly concentrated on the right banks, erosion areas were around channel bars and upstream of the left bank. With such significant erosion, channel bars will undergo large year-to-year variations. Figure 7E shows multi-threaded features with single dominant main channel and relatively smaller branches. The main channel in Figure 7D exhibits a high curvature bend (~90°), which might translate into a cutoff in the coming monsoon season. The Lower Ayeyarwady river reaches just downstream of the Upper Ayeyarwady and Chindwin confluence and is one of the morphological hotspots in the entire river system. Long-term channel morphology changes over the monitoring period (1988–2018) in this hotspot showed abandonment of the main channel.
Seasonal erosion and accretion areas quantified for the three Ayeyarwady tributaries/sections (Chindwin, Upper Ayeyarwady, and Lower Ayeyarwady) are shown in Figure 8. While the erosion and accretion datasets in the monitoring system are available for a period of 31 years (1988–2019), significant numbers of Landsat images are not available for the 1990–1996 period. Therefore, the resultant estimates for aggregated erosion and accretion area during those years need to be used with caution. The average eroded riverbank area over 21 years (1998–2019) is 45, 101. and 134 km2 for Chindwin, Upper Ayeyarwady, and Lower Ayeyarwady, respectively. Corresponding average accretion areas for 21 years are 42, 100, and 126 km2 for the three Ayeyarwady tributaries/sections. A maximum of 178 km2 of eroded areas was observed in the Lower Ayeyarwady for the 1999 monsoon season. In the Upper Ayeyarwady (Figure 8a), from 1998 to 2009, there is a trend of higher accretion as compared to erosion except for the years 2004 and 2007, when very high erosion is estimated. This trend reverses from 2010 to 2017, wherein higher erosion is observed with trend reversal in recent years. Figure 8b depicts variability of erosion and accretion in Chindwin, where there is high degree of difference in eroded and accretion area for most of the years. The most significant differences of erosion and accretion area were observed in 2005 (34 km2), 2006 (49 km2), 2012 (36 km2), 2014 (28 km2), and 2015 (30 km2). There is no temporal trend observed for the erosion or accretion, but seasonally there is a dominance of either erosion or accretion resulting in a very dynamic river. Similarly, for the Lower Ayeyarwady, as shown in Figure 8c, there were major years of erosion in 1999, 2004, 2007, and 2010, while there was accretion in 2000, 2002, 2005, and 2012. Higher erosion and accretion values observed generally coincide with extreme flood events. Despite large variations from year to year, average values estimated over 21 years exhibit only a very small net erosion or accretion indicating temporal balance in the longer term. No apparent temporal trend exists in either accretion or erosion areas in all three tributaries/sections.
The channel masks for the entire observation period (31 years) were aggregated to create the morphology hotspot map illustrating the frequency at which a pixel was classified as a river channel (Figure 9a). A pixel in which the river channel maintained the same position over the entire observation period has higher frequency values and is represented by darker blue color as in Figure 9e. The average frequency of pixels for the reach shown in Figure 9e is 21 compared to 10–13 for other reach sections. The river channels between Malun and Pyay are constrained by natural landforms limiting erosion and accretion potential. Reaches with highly dynamic channel positions are illustrated by light blue colors. The other reach sections (Figure 9b–d,f,g) showed complex variations in channel position characterized by avulsion, multiple unstable channels from confluence and bifurcation, lateral migration, and point and braid bars. The sections with lower frequency values demonstrate morphological hotspots with heightened risk of riverbank erosion. Lateral migration and channel avulsion in the identified morphological hotspots pose a threat to riverine villages and agricultural lands located on the riverbanks. The morphological hotspot map derived from historical data provides a basis for directly monitoring and evaluating reaches with the heightened risk posed by channel planform changes.

3.3. Changes in River Width

The seasonal active channel width changes were estimated at cross-sections (represented by transect id) along the river centerline (Figure 10a). Each cross-section is generated perpendicular to the centerline at a every 10 km interval (Figure 10b). The transect ID, which is numbered from upstream to downstream, for the Upper Ayeyarwady, Chindwin, and Lower Ayeyarwady is 1–52, 53–102, and 103–159, respectively. The space–time river width changes for the Upper and Lower Ayeyarwady (Figure 11a,c) showed substantial multiscale variability compared to the Chindwin (Figure 11b). The average river width of the Upper Ayeyarwady was 873 m with substantial variability between the seasons. In the Upper Ayeyarwady, the transects with dynamic river width changes were concentrated in two clusters between 10 and 30 and 35 and 41. The maximum river width change of 997 m was observed in the 1999 year in the Upper Ayeyarwady at the cross-section transect 39. The remaining transects showed low seasonal changes in active channel width (represented by green color) indicative of stable riverbanks. This dynamic was also observed in the erosion/accretion maps. Compared to the Upper Ayeyarwady, the active channel width remains relatively stable in most transects of the Chindwin river except for the section between 90 and 100 (~100 km length) before its downstream confluence with the Upper Ayeyarwady reaching the Lower Ayeyarwady. The average width of the Chindwin between the transect IDs 53 and 90 was 481 m, while it substantially increased to 674 m between 90 and 102. Even within this dynamic river section, the width of the changes was not consistent across periods but can be seen only in specific years. It is likely that these changes were heavily aligned with extreme flood events in the catchment.
In contrast to the Upper Ayeyarwady and Chindwin, most of the transects in the Lower Ayeyarwady showed some changes in the active channel width across the monitoring period, evident from the absence of green color in Figure 11c. The large changes in river width were clearly noticeable in transects between 102 and 120 and 140 and 154. The transects from 102 to 120 located immediately downstream of the Upper Ayeyarwady and Chindwin confluence showed the highest seasonal change in river width (598–1225 m). The average reach-wide width was 1291 m in 1997, which increased to 1797 m in 2010 but later changed substantially to 1357 m in 2019. A maximum river width change of 1254 m was observed at transect 118 in the year 2003.
The increase in the average width of the Lower Ayeyarwady is indicative of persistent channel widening and consistent with the observations about riverbank erosion noted in the field surveys by the stakeholders involved in river management. The local imbalances between erosion and accretion heavily influence changes in channel width. The river width change analysis revealed a widespread trend of active channel widening and extensive bank instability prevalent throughout the Lower Ayeyarwady. This has large implications for inland waterway transport, which forms a key transport mechanism for farmlands located right up to the riverbanks.

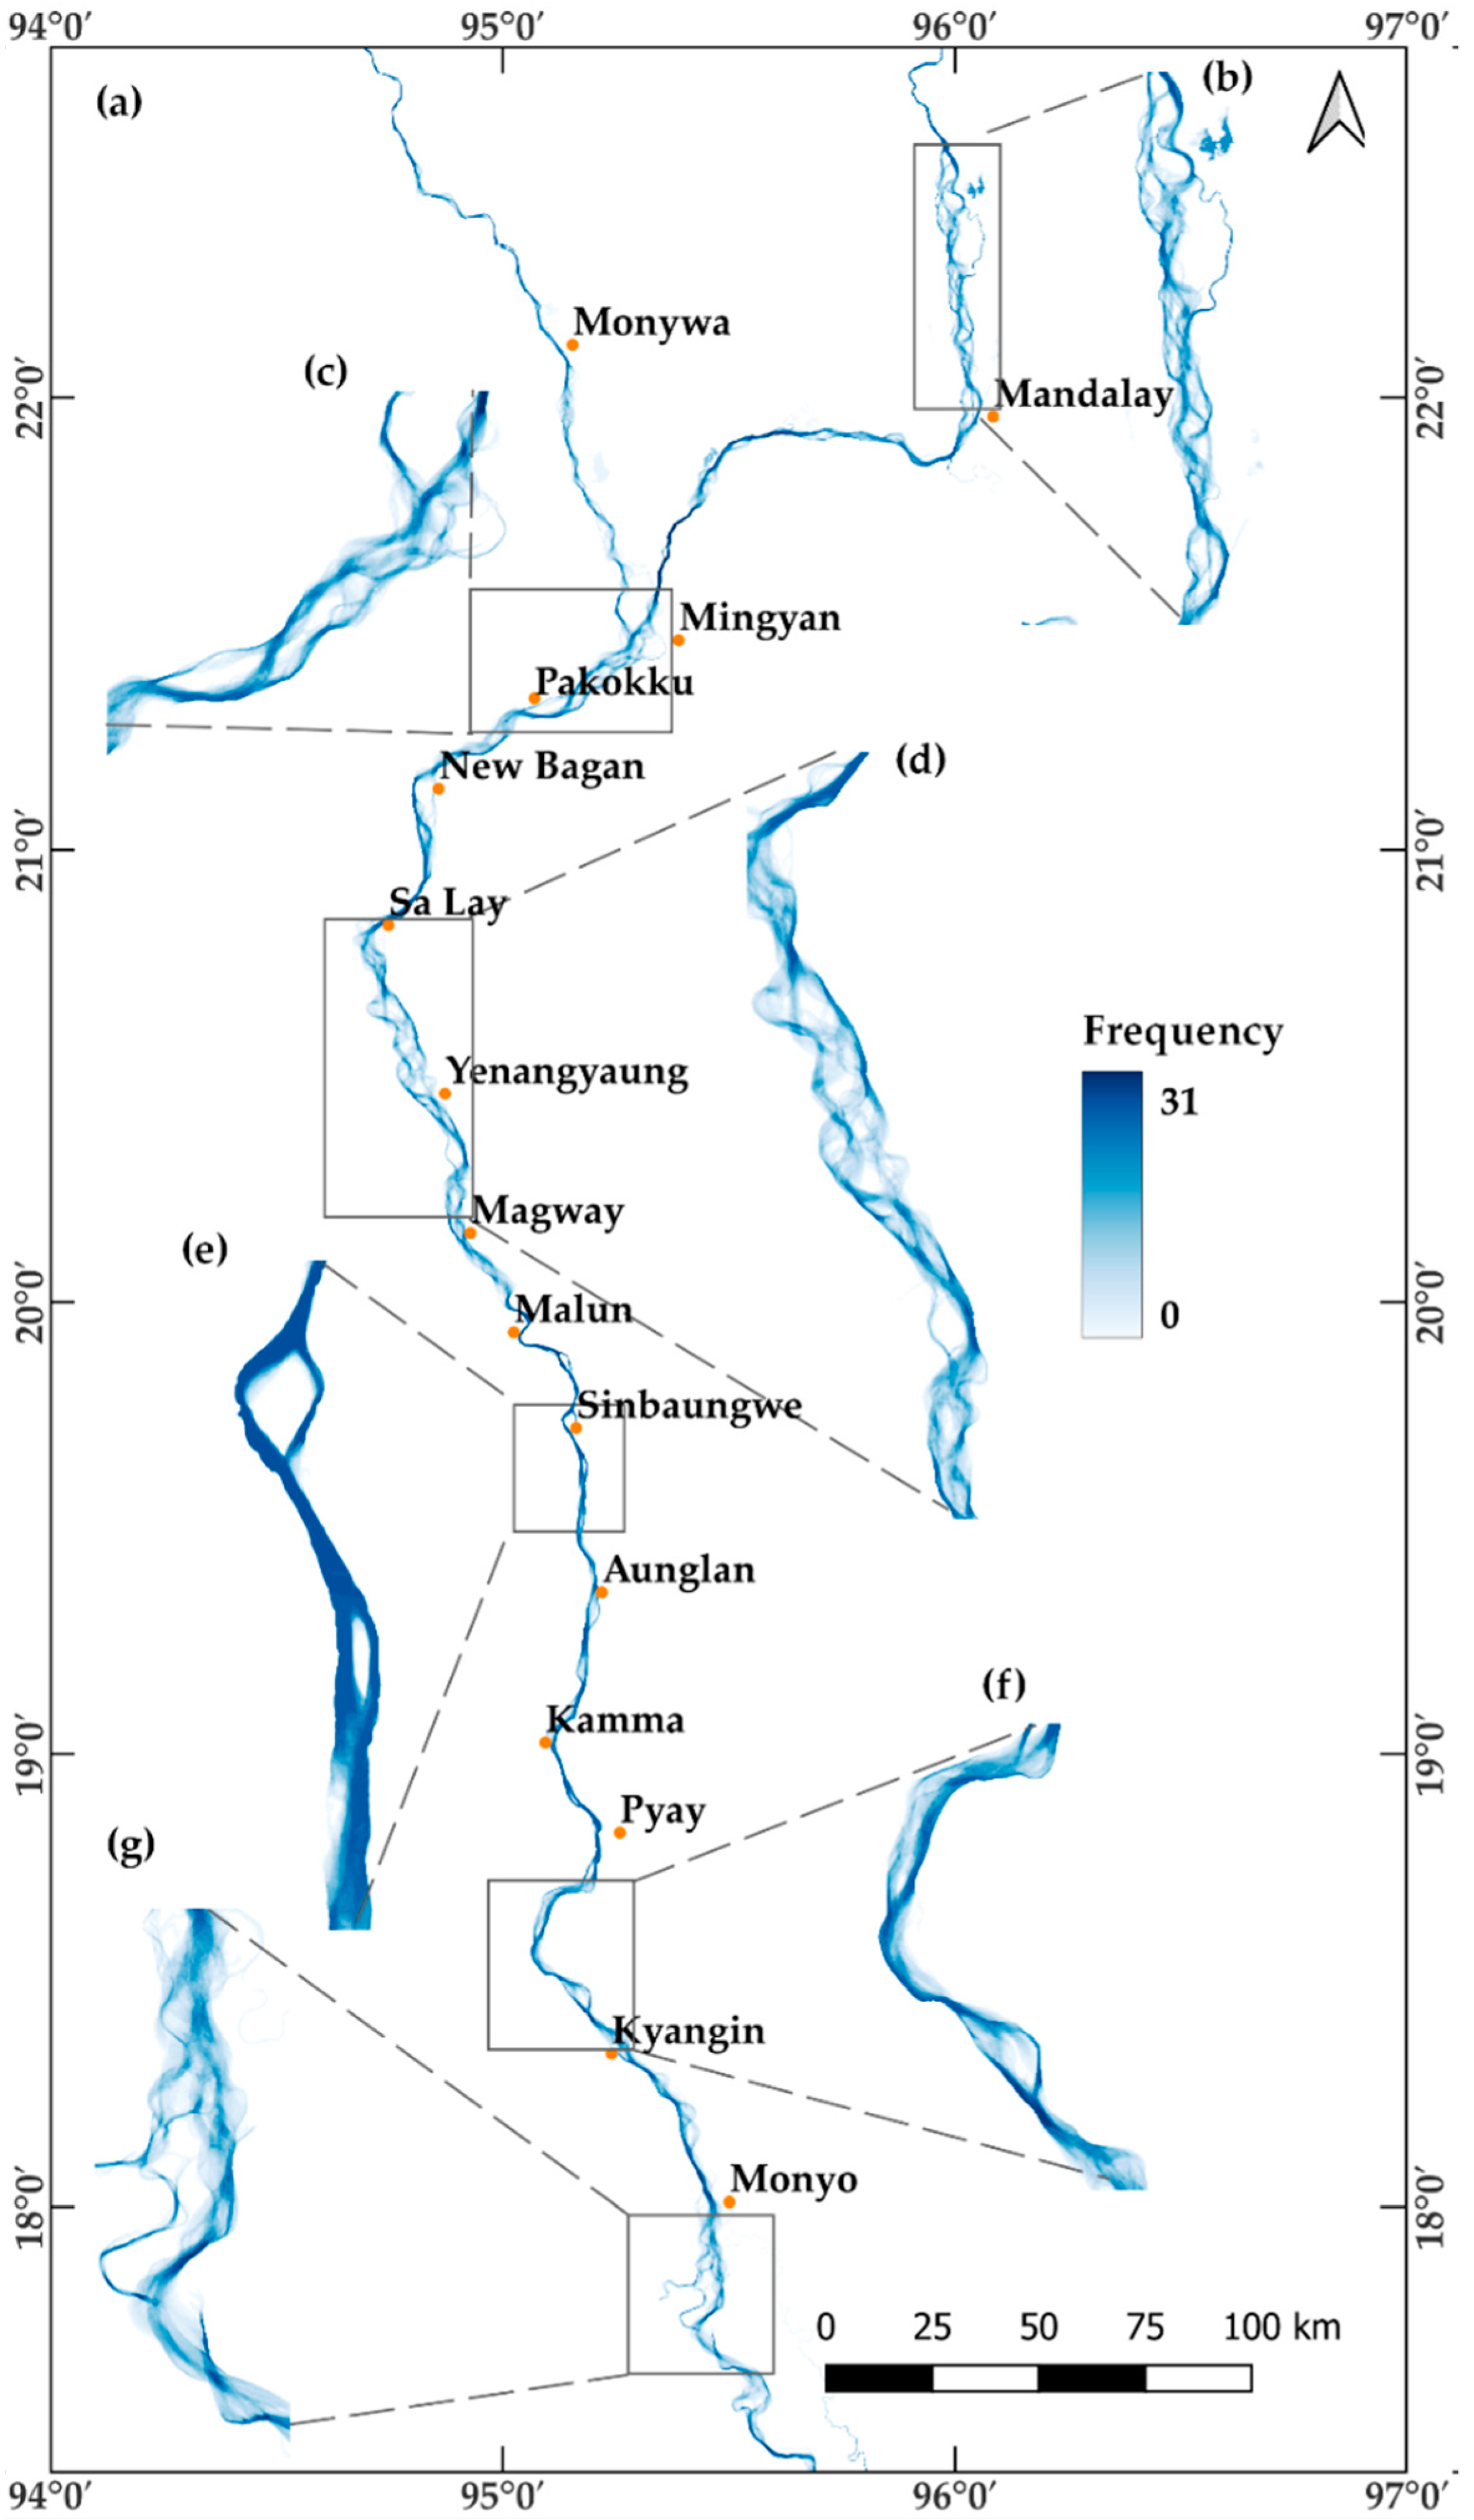
3.4. Dancing Rivers—The Ayeyarwady River Morphological Monitoring System

The river morphological monitoring system called “Dancing Rivers” (https://myit-servir.adpc.net, accessed on 25 May 2022) is the web interface of the monitoring system, as shown in Figure 12. The collaborative web interface primarily consists of features required by the users in Myanmar. To visualize erosion–accretion changes, the user must select the administrative region and year. The map interface automatically zooms into the selected region of interest for the specified period showing erosion and accretion locations along the river reach within the selected area. The user can toggle administrative boundaries and riverbank lines. The download data button provides direct access to the erosion–accretion data in raster (tiff) format without need for any user credentials. To visualize changes in river width, the user must draw a cross-section across the river using polyline tool available in the map interface and click the calculate button. A pop-up window will show the time series and river width at the selected cross-sectional transect. The whole interface was designed with the three-click rule widely followed in user interface design. Any operation within the interface from visualizing to downloading the dataset can be completed within three clicks. The interface was kept deliberately simple to ensure usability by stakeholders with different knowledge levels. To ensure the availability of these datasets in the public domain beyond the project timeframe, it was also made available through Myanmar Information Management Unit (MIMU), a unit under the United Nations Resident and Humanitarian Coordinator for strengthening the coordination, collection, processing, analysis, and dissemination of information in Myanmar.

4. Discussion

The seasonal erosion/accretion and channel width changes in the Ayeyarwady river derived from a 30-year (1988–2019) Landsat dataset demonstrated the utility of remote sensing for characterizing river morphological dynamics covering large geographical coverage while remaining relevant for also assessing reach scale processes. Over the 30-year period, high degrees of erosion and accretion were found in the Upper Ayeyarwady, Chindwin, and Lower Ayeyarwady sections/tributaries. Assessing erosion/accretion areas in a dynamic river is critical to identifying morphological hotspots and controls on planform changes for deriving river management [23]. Figure 6 provided snapshots of some of the reach sections considered as morphological hotspots in one of the last free flowing, largest rivers in Asia. Most of the identified river morphological hotspots were dominated by intense agricultural activity on either bank along with the presence of numerous riverine villages. Devoid of any permanent vegetative cover that provides cushion against intense water currents, these settlements and agricultural lands need protection from costly riverbank protection measures. The erosion/accretion dataset produced in this study can be used to assess the effectiveness of such structural intervention to protect riverbanks in the Ayeyarwady River as well as support planning in dredging sediment for navigation. Based on the direction of time series stream centerlines/banklines, it is possible to assess the degree to which a particular settlement or agricultural land is most at risk in any forthcoming monsoon season.
Compared to the large number of morphological studies conducted in other large rivers around the world, the existing knowledge base on the Ayeyarwady’s morphological dynamics is limited. Previous studies focused either on mapping or modelling erosion/accretion dynamics in a small reach [16,53,54] or characterized fluvial pattern of river channels and geomorphic zones for the entire Ayeyarwady [9]. This study addressed the key knowledge gap in monitoring river morphological changes in the Ayeyarwady using remote sensing datasets and web-based tools. Both natural and anthropogenic processes induce river morphological changes [55], but the degree to which different natural and anthropogenic factors influence channel dynamics in the Upper Ayeyarwady, Chindwin, and Lower Ayeyarwady has yet to be ascertained.
Further study incorporating meteorological, hydrological, and topographical characteristics with channel geomorphologic changes is necessary to identify key causative factors and complex channel dynamic characterized by meandering tendencies, fluvial erosion, and accretion as the river moves downstream. Naturally occurring high water volumes and sediment load because of monsoonal rains in the Ayeyarwady catchment produce seasonal geomorphologic changes in the channel. A majority of the sediment inputs for the Lower Ayeyarwady originate from the Upper Ayeyarwady and Chindwin basins. Despite the Chindwin subbasin’s smaller size (115,000 km2) when compared with the Upper Ayeyarwady (200,000 km2), it contributes more than half of Ayeyarwady’s 350 to 400 Mt y−1 sediment supply [56,57]. Part of the reason for an increased sediment load in the Chindwin is the change in land use, primarily forest cover loss (4000 km2) in the upstream part [58]. The Chindwin river has a disproportionate influence on the Ayeyarwady sediment load, implying that further intense land use changes will likely exacerbate channel planform changes not only in the Chindwin channel, but also in the Lower Ayeyarwady.
The adopted datasets and methodology impart some uncertainties to the derived morphological indicators for the Ayeyarwady river. In many locations along the Ayeyarwady river, riverine villages and agricultural lands are located right on the riverbanks and less than 30 m from the main channel. In such cases, the 30 m spatial resolution of Landsat imagery is inadequate to identify seasonal morphological changes and may not highlight the risk locations. The future version of the Dancing Rivers monitoring system will move towards adopting higher spatial resolution (10 m) with Sentinel-1 and Sentinel-2, which are increasingly used to identify seasonal morphological changes [59,60]. This will to some extent reduce the uncertainty associated with using 30 m Landsat data. The seasonal morphological changes were estimated using the Landsat composite of November and December months on the assumption that inter-annual variations within these two months are negligible. However, the discharge dynamics in Ayeyarwady river are heavily influenced by the preceding monsoon season. A significantly large variation in discharge between pre- and post-monsoon season will have direct impact on the derived river channel masks that may lead to under or overprediction of erosion and accretion areas. However, creating the median composite of November and December will limit the uncertainty associated with inter-annual discharge variations.
The Dancing River monitoring system provides only two morphometrics (erosion and accretion, and channel width changes). While many other remote sensing-based morphological indicators like migration rate, sinuosity, cutoffs, and meanders can be derived from the primary channel masks, the indicators presented in this article were chosen to feed directly into the operational activities of DWIR, Myanmar. As a part of the co-development effort, the monitoring system was deliberately kept simple and provided only the key information required by the stakeholders for operational use. The stakeholder must understand the methodology behind the system and have the necessary confidence in its outputs to pilot for operational use.

5. Conclusions

This study developed a large-scale, seasonal, morphological monitoring system for the Ayeyarwady river leveraging the long-term Landsat remote sensing data availability within the GEE platform to map seasonal erosion and accretion areas, as well as channel width changes for 3882 km river length. The study used MNDWI and thresholding approach to segregate the river channel from land pixels. The overall accuracy when comparing the satellite-based observation and the field observation in 2019 is 89%. The assessment indicated that the maximum of 178 km2 of eroded areas was observed in the Lower Ayeyarwady for the 1999 monsoon season. Using over 30 years of remote sensing data, six hotspots of active riverbank erosion are identified across the Ayeyarwady basin including near Mandalay city, the confluence of Upper Ayeyarwady and Chindwin, near upstream of Magway city, downstream of Magway city, near Pyay city, and upstream of Ayeyarwady delta. The time series analysis of equidistant cross-section assessment highlighted increase in river width in Lower Ayeyarwady section following the confluence of Upper Ayeyarwady and Chindwin river, which is also the section with the maximum river width change of 1254 m in 2003. The seasonal trend from 2015 to 2019 shows an increasing trend in erosion area for Lower Ayeyarwady, while in the Upper Ayeyarwady, there is a pattern of higher erosion for a couple of years (2015–2017) followed by higher accretion (2018–2019). It was observed that years with high erosion or accretion areas were same for all three sections of the river. This can be further analyzed with discharge data and precipitation data for the basin.
The critical contribution of the study includes producing a historical knowledge base on erosion and accretion areas over long length of the Ayeyarwady river and its tributaries, identifying stretches of hotspot to support hazard and vulnerability mapping and seasonal estimates for the operational purposes to DWIR. Through a co-development approach and end-user participation, a web-based seasonal river morphological changes monitoring system was successfully developed to visualize erosion–accretion changes and generate information for the DWIR to have a better understanding of river morphological changes and risk areas. The system was accepted by the DWIR of Myanmar, which has demanded a large-scale monitoring system of river morphological changes to identify hotspots of riverbank erosions and support planning to improve river channels for navigation and develop riverbank protection. The availability of multispectral Sentinel-2 and SAR-based Sentinel-1 having a spatial resolution higher than Landsat from 2017 can help to delineate changes in the riverbanks with more detail. The monitoring system will be upgraded to include Sentinel-1 and 2 products to overcome these identified shortcomings.

Author Contributions

Conceptualization, T.P. and K.M.; Methodology, K.M. and D.B.; Data Curation, D.B.; Formal analysis, D.B. and K.M.; Software, D.B.; Validation, D.B. and K.M.; Writing—original draft preparation, K.M., D.B., T.P. and T.T.; writing—review and editing, K.M., D.B., T.P. and T.T.; supervision, K.M., T.P. and P.T.; Funding acquisition: P.T. and T.P.; Project administration: K.M. and P.T. All authors have read and agreed to the published version of the manuscript.

Funding

This research was funded by joint US Agency for International Development (USAID) and National Aeronautics and Space Administration (NASA) initiative SERVIR and the USAID Regional Development Mission for Asia and Swedish International Development Agency (SIDA) rapid response fund and tool development fund.

Data Availability Statement

The datasets are available freely through the web portal https://myit-servir.adpc.net (accessed on 25 May 2022). The backend GEE code and front-end web interface will be made available through Github in the future incorporating future improvements.

Acknowledgments

We thank Aung Myo Khaing of DWIR-Myanmar, Than Htway of SEI-Myanmar, Ate Poortiga of Spatial Informatics Group and SERVIR-Mekong, and stakeholders from other agencies in Myanmar for their continued support during collaborative tool development process and field validation trips.

Conflicts of Interest

The authors declare no conflict of interest.

References

  1. Grabowski, R.C.; Surian, N.; Gurnell, A.M. Characterizing Geomorphological Change to Support Sustainable River Restoration and Management: Characterizing Geomorphological Change in Rivers. WIREs Water 2014, 1, 483–512. [Google Scholar] [CrossRef]
  2. Lewin, J.; Brewer, P.A.; Wohl, E. Fluvial Geomorphology. In Reference Module in Earth Systems and Environmental Sciences; Elsevier: Amsterdam, The Netherlands, 2018; ISBN 978-0-12-409548-9. [Google Scholar]
  3. Abbas, N.; Subramanian, V. Erosion and Sediment Transport in the Ganges River Basin (India). J. Hydrol. 1984, 69, 173–182. [Google Scholar] [CrossRef]
  4. Syvitski, J.P.M.; Vörösmarty, C.J.; Kettner, A.J.; Green, P. Impact of Humans on the Flux of Terrestrial Sediment to the Global Coastal Ocean. Science 2005, 308, 376–380. [Google Scholar] [CrossRef] [PubMed]
  5. Kummu, M.; Varis, O. Sediment-Related Impacts Due to Upstream Reservoir Trapping, the Lower Mekong River. Geomorphology 2007, 85, 275–293. [Google Scholar] [CrossRef]
  6. Kale, V.S.; Hire, P.; Baker, V.R. Flood Hydrology and Geomorphology of Monsoon-Dominated Rivers: The Indian Peninsula. Water Int. 1997, 22, 259–265. [Google Scholar] [CrossRef]
  7. Kale, V.S. Fluvial Geomorphology of Indian Rivers: An Overview. Prog. Phys. Geogr. Earth Environ. 2002, 26, 400–433. [Google Scholar] [CrossRef]
  8. Keskinen, M.; Guillaume, J.H.A.; Kattelus, M.; Porkka, M.; Räsänen, T.A.; Varis, O. The Water-Energy-Food Nexus and the Transboundary Context: Insights from Large Asian Rivers. Water 2016, 8, 193. [Google Scholar] [CrossRef] [Green Version]
  9. WWF. The Ayeyarwady River and the Economy of Myanmar Report; WWF: Gland, Switzerland, 2018. [Google Scholar]
  10. Steijn, R.C.; Barneveld, H.J.; Wijma, E.; Beckers, J.; Reuzenaar, T.; Koopmans, R.; Htet, K.L. Myanmar DRR Team Mission Report; DRR Team: Myanmar, 2015; Available online: https://www.drrteam-dsswater.nl/wp-content/uploads/2015/10/DRRMyanmar_missionreport_20151015.pdf (accessed on 25 May 2022).
  11. Robinson, R.A.J.; Bird, M.I.; Oo, N.W.; Hoey, T.B.; Aye, M.M.; Higgitt, D.L.; Lu, X.X.; Swe, A.; Tun, T.; Win, S.L. The Irrawaddy River Sediment Flux to the Indian Ocean: The Original Nineteenth-Century Data Revisited. J. Geol. 2007, 115, 629–640. [Google Scholar] [CrossRef] [Green Version]
  12. Latrubesse, E.M.; Park, E.; Kästner, K. The Ayeyarwady River (Myanmar): Washload Transport and Its Global Role among Rivers in the Anthropocene. PLoS ONE 2021, 16, e0251156. [Google Scholar] [CrossRef]
  13. Ohnmar, T.; Myint, T.; Aung, N.N.; NyeinNyein, M.; Oo, T.T.; Oo, N.N.; Phyo, E.E. Impacts of flooding and river bank erosion on local people of hinthada township, ayeyarwady region. J. Myanmar Acad. Arts Sci. 2018, 16, 315–330. [Google Scholar]
  14. Phyu, A.S.; Aung, M.M. Riverbank Erosion Poses Hurdle to Rural Development. The Myanmar Times. 16 February 2018. Available online: https://www.mmtimes.com/news/riverbank-erosion-poses-hurdle-rural-development.html (accessed on 25 May 2022).
  15. Mann, Z. River Bank Erosion Forces Hundreds of Families to Relocate—Myanmar. Available online: https://www.irrawaddy.com/news/burma/first-japanese-newspaper-becomes-available-in-rangoon.html (accessed on 26 April 2022).
  16. van der Velden, J. Understanding River Dynamics of the Ayeyarwady River, Myanmar How Dynamic Behaviour Contributes to Adapting the River Morphology for Navigational Purposes. Master’s Thesis, Utrecht University, Utrecht, The Netherlands, 2015. [Google Scholar]
  17. Htwe, T.T.; Takebayashi, H.; Fujita, M.; Hlaing, W. Effects of Dikes on Navigation in Braided Channel, the Ayeyarwady River, Myanmar. J. Jpn. Soc. Civ. Eng. Ser. B1 Hydraul. Eng. 2017, 73, I_889–I_894. [Google Scholar] [CrossRef] [Green Version]
  18. Davies, P.; Harris, J.; Hillman, T.; Walker, K. The Sustainable Rivers Audit: Assessing River Ecosystem Health in the Murray-Darling Basin, Australia. Mar. Freshw. Res. 2010, 61, 764–777. [Google Scholar] [CrossRef]
  19. Death, R.G.; Fuller, I.C.; Macklin, M.G. Resetting the River Template: The Potential for Climate-Related Extreme Floods to Transform River Geomorphology and Ecology. Freshw. Biol. 2015, 60, 2477–2496. [Google Scholar] [CrossRef]
  20. Newson, M.D.; Large, A.R.G. ‘Natural’ Rivers, ‘Hydromorphological Quality’ and River Restoration: A Challenging New Agenda for Applied Fluvial Geomorphology. Earth Surf. Processes Landf. 2006, 31, 1606–1624. [Google Scholar] [CrossRef]
  21. Gilvear, D.; Bryant, R. Analysis of Remotely Sensed Data for Fluvial Geomorphology and River Science. Tools Fluv. Geomorphol. 2016, 103–132. [Google Scholar] [CrossRef]
  22. Boothroyd, R.J.; Nones, M.; Guerrero, M. Deriving Planform Morphology and Vegetation Coverage from Remote Sensing to Support River Management Applications. Front. Environ. Sci. 2021, 9, 657354. [Google Scholar] [CrossRef]
  23. Schwenk, J.; Khandelwal, A.; Fratkin, M.; Kumar, V.; Foufoula-Georgiou, E. High Spatiotemporal Resolution of River Planform Dynamics from Landsat: The RivMAP Toolbox and Results from the Ucayali River: Annual Planform Morphodynamics, Ucayali. Earth Space Sci. 2017, 4, 46–75. [Google Scholar] [CrossRef]
  24. Langat, P.K.; Kumar, L.; Koech, R. Monitoring River Channel Dynamics Using Remote Sensing and GIS Techniques. Geomorphology 2019, 325, 92–102. [Google Scholar] [CrossRef]
  25. Tha, T.; Piman, T.; Bhatpuria, D.; Ruangrassamee, P. Assessment of Riverbank Erosion Hotspots along the Mekong River in Cambodia Using Remote Sensing and Hazard Exposure Mapping. Water 2022, 14, 1981. [Google Scholar] [CrossRef]
  26. Deng, B.; Xiong, K.; Huang, Z.; Jiang, C.; Liu, J.; Luo, W.; Xiang, Y. Monitoring and Predicting Channel Morphology of the Tongtian River, Headwater of the Yangtze River Using Landsat Images and Lightweight Neural Network. Remote Sens. 2022, 14, 3107. [Google Scholar] [CrossRef]
  27. Alfredsen, K.; Dalsgård, A.; Shamsaliei, S.; Halleraker, J.H.; Gundersen, O.E. Towards an Automatic Characterization of Riverscape Development by Deep Learning. River Res. Appl. 2022, 38, 810–816. [Google Scholar] [CrossRef]
  28. Buchanan, B.P.; Sethi, S.A.; Cuppett, S.; Lung, M.; Jackman, G.; Zarri, L.; Duvall, E.; Dietrich, J.; Sullivan, P.; Dominitz, A.; et al. A Machine Learning Approach to Identify Barriers in Stream Networks Demonstrates High Prevalence of Unmapped Riverine Dams. J. Environ. Manag. 2022, 302, 113952. [Google Scholar] [CrossRef] [PubMed]
  29. Torbick, N.; Chowdhury, D.; Salas, W.; Qi, J. Monitoring Rice Agriculture across Myanmar Using Time Series Sentinel-1 Assisted by Landsat-8 and PALSAR-2. Remote Sens. 2017, 9, 119. [Google Scholar] [CrossRef] [Green Version]
  30. Yao, Z.; Ta, W.; Jia, X.; Xiao, J. Bank Erosion and Accretion along the Ningxia–Inner Mongolia Reaches of the Yellow River from 1958 to 2008. Geomorphology 2011, 127, 99–106. [Google Scholar] [CrossRef]
  31. Pickens, A.H.; Hansen, M.C.; Hancher, M.; Stehman, S.V.; Tyukavina, A.; Potapov, P.; Marroquin, B.; Sherani, Z. Mapping and Sampling to Characterize Global Inland Water Dynamics from 1999 to 2018 with Full Landsat Time-Series. Remote Sens. Environ. 2020, 243, 111792. [Google Scholar] [CrossRef]
  32. Gomes, V.C.F.; Queiroz, G.R.; Ferreira, K.R. An Overview of Platforms for Big Earth Observation Data Management and Analysis. Remote Sens. 2020, 12, 1253. [Google Scholar] [CrossRef] [Green Version]
  33. Gorelick, N.; Hancher, M.; Dixon, M.; Ilyushchenko, S.; Thau, D.; Moore, R. Google Earth Engine: Planetary-Scale Geospatial Analysis for Everyone. Remote Sens. Environ. 2017, 202, 18–27. [Google Scholar] [CrossRef]
  34. Rossi, V.; Salinari, F.; Poni, S.; Caffi, T.; Bettati, T. Addressing the Implementation Problem in Agricultural Decision Support Systems: The Example of Vite.Net®. Comput. Electron. Agric. 2014, 100, 88–99. [Google Scholar] [CrossRef]
  35. Rose, D.C.; Sutherland, W.J.; Parker, C.; Lobley, M.; Winter, M.; Morris, C.; Twining, S.; Ffoulkes, C.; Amano, T.; Dicks, L.V. Decision Support Tools for Agriculture: Towards Effective Design and Delivery. Agric. Syst. 2016, 149, 165–174. [Google Scholar] [CrossRef] [Green Version]
  36. SERVIR. SERVIR Service Planning Toolkit. Available online: https://www.servirglobal.net/the-approach (accessed on 26 April 2022).
  37. DWIR. Proposal for Bend Cutting along the Bago River (Upstream of Bago City); Department of Water and Improvement of River System in Bago (DWIR): Yangon, Myanmar, 2014. [Google Scholar]
  38. HIC. Ayeyarwady State of the Basin Assessment (SOBA) 2017: Synthesis Report; HIC: Yangon, Myanmar, 2017. [Google Scholar]
  39. Win, S.H. Sediment Dynamics in Irrawaddy River, Myanmar; National University of Singapore: Singapore, 2011. [Google Scholar]
  40. Commandeur, A. The Ayeyarwady River: A Graphical Introduction to Myanmar’s Main River, 2014; Unpublished presentation.
  41. Wulder, M.A.; Masek, J.G.; Cohen, W.B.; Loveland, T.R.; Woodcock, C.E. Opening the Archive: How Free Data Has Enabled the Science and Monitoring Promise of Landsat. Remote Sens. Environ. 2012, 122, 2–10. [Google Scholar] [CrossRef]
  42. Boothroyd, R.J.; Williams, R.D.; Barrett, B.; Hoey, T.B.; Tolentino, P.L.M.; Perez, J.E.; Guardian, E.; David, C.P.; Yang, X. Detecting and Quantifying Morphological Change in Tropical Rivers Using Google Earth Engine and Image Analysis Techniques. Available online: https://www.routledge.com/River-Flow-2020-Proceedings-of-the-10th-Conference-on-Fluvial-Hydraulics/Uijttewaal-Franca-Valero-Chavarrias-Ylla-Arbos-Schielen-Crosato/p/book/9780367627737 (accessed on 25 April 2022).
  43. Mcfeeters, S.K. The Use of the Normalized Difference Water Index (NDWI) in the Delineation of Open Water Features. Int. J. Remote Sens. 1996, 17, 1425–1432. [Google Scholar] [CrossRef]
  44. Rogers, A.S.; Kearney, M.S. Reducing Signature Variability in Unmixing Coastal Marsh Thematic Mapper Scenes Using Spectral Indices. Int. J. Remote Sens. 2004, 25, 2317–2335. [Google Scholar] [CrossRef]
  45. Xu, H. Modification of Normalised Difference Water Index (NDWI) to Enhance Open Water Features in Remotely Sensed Imagery. Int. J. Remote Sens. 2006, 27, 3025–3033. [Google Scholar] [CrossRef]
  46. Pal, M. Random Forest Classifier for Remote Sensing Classification. Int. J. Remote Sens. 2005, 26, 217–222. [Google Scholar] [CrossRef]
  47. Berhane, T.M.; Lane, C.R.; Wu, Q.; Autrey, B.C.; Anenkhonov, O.A.; Chepinoga, V.V.; Liu, H. Decision-Tree, Rule-Based, and Random Forest Classification of High-Resolution Multispectral Imagery for Wetland Mapping and Inventory. Remote Sens. 2018, 10, 580. [Google Scholar] [CrossRef] [PubMed] [Green Version]
  48. Binh, D.V.; Wietlisbach, B.; Kantoush, S.; Loc, H.H.; Park, E.; de Cesare, G.; Cuong, D.H.; Tung, N.X.; Sumi, T. A Novel Method for River Bank Detection from Landsat Satellite Data: A Case Study in the Vietnamese Mekong Delta. Remote Sens. 2020, 12, 3298. [Google Scholar] [CrossRef]
  49. Worden, J.; de Beurs, K.M. Surface Water Detection in the Caucasus. Int. J. Appl. Earth Obs. Geoinf. 2020, 91, 102159. [Google Scholar] [CrossRef]
  50. Jiang, H.; Feng, M.; Zhu, Y.; Lu, N.; Huang, J.; Xiao, T. An Automated Method for Extracting Rivers and Lakes from Landsat Imagery. Remote Sens. 2014, 6, 5067–5089. [Google Scholar] [CrossRef] [Green Version]
  51. Pekel, J.-F.; Cottam, A.; Gorelick, N.; Belward, A.S. High-Resolution Mapping of Global Surface Water and Its Long-Term Changes. Nature 2016, 540, 418–422. [Google Scholar] [CrossRef]
  52. Allen, G.H.; Pavelsky, T.M. Patterns of River Width and Surface Area Revealed by the Satellite-Derived North American River Width Data Set. Geophys. Res. Lett. 2015, 42, 395–402. [Google Scholar] [CrossRef]
  53. Ligthart, D. The Physical Processes Influencing Morphodynamics in Braided Rivers: A Case Study on the Ayeyarwady River; TU Delft Repositories: Delft, The Netherlands, 2017. [Google Scholar]
  54. Shrestha, S.; Imbulana, N.; Piman, T.; Chonwattana, S.; Ninsawat, S.; Babur, M. Multimodelling Approach to the Assessment of Climate Change Impacts on Hydrology and River Morphology in the Chindwin River Basin, Myanmar. Catena 2020, 188, 104464. [Google Scholar] [CrossRef]
  55. Saleh, F.; Ducharne, A.; Flipo, N.; Oudin, L.; Ledoux, E. Impact of River Bed Morphology on Discharge and Water Levels Simulated by a 1D Saint–Venant Hydraulic Model at Regional Scale. J. Hydrol. 2013, 476, 169–177. [Google Scholar] [CrossRef]
  56. Garzanti, E.; Wang, J.-G.; Vezzoli, G.; Limonta, M. Tracing Provenance and Sediment Fluxes in the Irrawaddy River Basin (Myanmar). Chem. Geol. 2016, 440, 73–90. [Google Scholar] [CrossRef]
  57. Latrubesse, E.M.; d’Horta, F.M.; Ribas, C.C.; Wittmann, F.; Zuanon, J.; Park, E.; Dunne, T.; Arima, E.Y.; Baker, P.A. Vulnerability of the Biota in Riverine and Seasonally Flooded Habitats to Damming of Amazonian Rivers. Aquat. Conserv. Mar. Freshw. Ecosyst. 2021, 31, 1136–1149. [Google Scholar] [CrossRef]
  58. McGinn, A.J.; Wagner, P.D.; Htike, H.; Kyu, K.K.; Fohrer, N. Twenty Years of Change: Land and Water Resources in the Chindwin Catchment, Myanmar between 1999 and 2019. Sci. Total Environ. 2021, 798, 148766. [Google Scholar] [CrossRef]
  59. Spada, D.; Molinari, P.; Bertoldi, W.; Vitti, A.; Zolezzi, G. Multi-Temporal Image Analysis for Fluvial Morphological Characterization with Application to Albanian Rivers. ISPRS Int. J. Geo-Inf. 2018, 7, 314. [Google Scholar] [CrossRef] [Green Version]
  60. Kryniecka, K.; Magnuszewski, A.; Radecki-Pawlik, A. Sentinel-1 Satellite Radar Images: A New Source of Information for Study of River Channel Dynamics on the Lower Vistula River, Poland. Remote Sens. 2022, 14, 1056. [Google Scholar] [CrossRef]
Figure 1. The Ayeyarwady river basin and three sub-basins—Chindwin, Upper Ayeyarwady, and Lower Ayeyarwady—are in red overlayed on the FAO soil map of Myanmar.
Remotesensing 14 03393 g001
Figure 2. Mean monthly discharge from 1969 to 1996 at Pyay gauging station in the Lower Ayeyarwady river. Bars represent the standard deviation of discharge.
Remotesensing 14 03393 g002
Figure 3. Water indices derived from median composite Landsat 8 images for November and December 2018. Here, (a) is the Google Earth Image; (b) is the standard False Color Composite (FCC) of the median composite; (c,e,g) are the water indices NDWINIR-Green, NDWIRed-SWIR, and MNDWI, respectively, representing value range of 0 (black) to 1 (white), where values near 1 are water pixels and values near or less than 0 are land or other pixels; and (d,f,h) are extracted water bodies for NDWINIR-Green, NDWIRed-SWIR, and MNDWI, respectively. Yellow circle and green arrow highlights the tributary channels as extracted by three indices. Similarly, red and blue square is the river island and bank of main river channel respectively as extracted by the three indices.
Remotesensing 14 03393 g003
Figure 5. Methodology for development of web-based river morphological system.
Remotesensing 14 03393 g005
Figure 6. Field-based locations for the accuracy assessment in 2019 in two heavily braided river channel areas. Here, (a) is the Upper Ayeyarwady section of the river upstream of Mandalay city and (b) is in the Lower Ayeyarwady section near Magway city.
Remotesensing 14 03393 g006
Figure 7. Erosion–accretion map for selected reaches in the Ayeyarwady river for the 2019 monsoon season (A) near Mandalay, (B) Chindwin river before the confluence, (C) confluence of Upper Ayeyarwady and Chindwin, (D) near Magway city, and (E) before the Ayeyarwady delta.
Remotesensing 14 03393 g007
Figure 8. Seasonal erosion and accretion area in km2 for (a) the Upper Ayeyarwady, (b) Chindwin, and (c) Lower Ayeyarwady from 1988 to 2019. Here, the orange point represents the total area eroded (land loss) for the subbasin during a particular year and the green point represents the total area with accretion (land gain) during a particular year.
Remotesensing 14 03393 g008
Figure 9. Historical hotspot map for selected reaches in the Ayeyarwady River from 1988 to 2019: (a) complete river stretch, (b) near Mandalay, (c) confluence of the Upper Ayeyarwady and Chindwin (d) near upstream of Magway city, (e) downstream of Magway city, (f) near Pyay, and (g) upstream of the Ayeyarwady delta.
Remotesensing 14 03393 g009
Figure 10. Map showing transects and intersection points generated along the 30-year average river centerline. (a) shows location of transects before confluence of Upper Ayeyarwady and Chindwin which are placed at every 10 km as shown in (b).
Remotesensing 14 03393 g010
Figure 11. Changes in river width at transect locations spaced 10 km from 1997 to 2018: (a) Upper Ayeyarwady, (b) Chindwin, and (c) Lower Ayeyarwady.
Remotesensing 14 03393 g011
Figure 12. Web interface of the “Dancing Rivers” river monitoring system for the Ayeyarwady river.
Remotesensing 14 03393 g012
Table 1. Confusion matrix for river morphological classification of the accuracy assessment in 2019.
Field Observation
ClassErosionAccretionNo ChangeRow
Total
User
Accuracy (%)
Satellite-Based
Observation
Erosion41314591.11
Accretion02412596
No change40111573.33
Col. total45271385
Producer
Accuracy (%)
91.1188.8984.62
Overall
Accuracy
(41 + 24 + 11)/85 = 0.894
Publisher’s Note: MDPI stays neutral with regard to jurisdictional claims in published maps and institutional affiliations.

