Article

Quantifying Ecological Landscape Quality of Urban Street by Open Street View Images: A Case Study of Xiamen Island, China

1
College of Forestry, Central South University of Forestry and Technology, Changsha 410004, China
2
National Engineering Laboratory for Applied Technology of Forestry and Ecology in South China, Central South University of Forestry and Technology, Changsha 410004, China
3
College of Biological Science and Technology, Central South University of Forestry and Technology, Changsha 410004, China
4
Department of Environmental Science and Engineering, Fudan University, Songhu Road 2005, Shanghai 200438, China
*
Author to whom correspondence should be addressed.
These authors contributed equally to this work.
Remote Sens. 2022, 14(14), 3360; https://doi.org/10.3390/rs14143360
Submission received: 3 May 2022 / Revised: 27 May 2022 / Accepted: 30 June 2022 / Published: 12 July 2022
(This article belongs to the Special Issue Advances to GIS for Sensing of Earth and Human Interaction)

Abstract

:
With the unprecedented urbanization processes around the world, cities have become the main areas of political, cultural, and economic creation, but these regions have also caused environmental degradation and even affected public health. Ecological landscape is considered as an important way to mitigate the impact of environmental exposure on urban residents. Therefore, quantifying the quality of urban road landscape and exploring its spatial heterogeneity to obtain basic data on the urban environment and provide ideas for urban residents to improve the environment will be a meaningful preparation for further urban planning. In this study, we proposed a framework to achieve automatic quantifying urban street quality by integrating a mass of street view images based on deep learning and landscape ecology. We conducted a case study in Xiamen Island and mapped a series of spatial distribution for ecological indicators including PLAND, LPI, AI, DIVISION, FRAC_MN, LSI and SHDI. Additionally, we quantified street quality by the entropy weight method. Our results showed the streetscape quality of the roundabout in Xiamen was relatively lower, while the central urban area presented a belt-shaped area with excellent landscape quality. We suggested that managers could build vertical greening on some streets around the Xiamen Island to improve the street quality in order to provide greater well-being for urban residents. In this study, it was found that there were still large uncertainties in the mechanism of environmental impact on human beings. We proposed to strengthen the in-depth understanding of the mechanism of environmental impact on human beings in the process of interaction between environment and human beings, and continue to form general models to enhance the ability of insight into the urban ecosystem.

Graphical Abstract

1. Introduction

Urbanization is a dominantly demographic trend around the world, which has promoted the migration of hundreds of millions of people from the countryside to the cities [1]. The rate of global urbanization has reached 55% in 2018, and the number will be expected up to increase to 68% in 2050 [2]. The processes of urbanization bring both barriers and opportunities to achieve related Sustainable Development Goals (SDGs) [3,4]. Urban areas are usually integrating wealth creation, people inhabitancy, social services, culture and politics and have been proved by previous studies to be more efficient while utilizing human resources, economic resources, material resources, and information resources than the rural areas [5,6]. However, due to the more concentrated population, facilities and buildings, urban areas are generally associated with crowding and environmental degradation [7,8]. People who lived in urban areas with the lower urban environmental quality, are more liable to be threatened by physical and mental diseases, which, nowadays, challenge public health [9,10]. With the gradually improved living standards of urban residents, higher requirements are placed on the living environment in urban areas [11,12]. The street is an environment that urban residents can contact closely, on a daily basis, which is also an important measure that could regulate residents’ emotions and behaviors [13,14]. Better ecological landscape quality would enhance support for individuals’ needs and desires by increasing times of outdoors activities and promoting people enjoying life. Therefore, to improve the residents’ well-being, quantifying the ecological landscape quality of the streets is urgently needed for understanding the current status and proposing relevant improvement planning of urban streets [15,16].
The ecological landscape is the bridge that connects people’s feelings and their surroundings by direct and indirect pathways [17]. The landscape consists of the features of an area of land, its ecological forms, that could directly affect human physiology through sight, smell, hearing, or even touch [18]. Moreover, three domains of indirect pathways that benefit human health and well-being, especially in urban areas, have been summarized including: (1) reducing exposures to environmental stressors (e.g., air pollution, noise and heat) to achieve harm mitigation; (2) restoring attention and recovering psychophysiological stress according to environmental psychology; (3) encouraging physical activity and facilitating social cohesion [19]. Therefore, ecological landscape plays an essential role in the physical and mental health of urban residents, as well as of people working in or visiting urban areas. But the ecological landscape is very diverse in its component characteristics of shape, color and category. To research which ecological landscape types and characteristics are most beneficial to locals, an elaborative experimental design and a series of field surveys are necessary [13]. However, such a mass project may be unable to proceed due to the substantial time costs and incalculable budget at a city scale [20].
Open and conditional access street view images, such as Google Street View (GSV), Baidu Street View (BSV), and Tencent Street View, provide new data sources for quantifying ecological landscape characteristics of urban streets [21,22,23,24]. These street images were collected mainly by car and, consequently, stitched as VR photographs, then finally displayed as interactively panoramas, which were primarily designed for providing a geographic information service. Recently, these street view images provide an accessible way to analyze urban environment on a large-scale [25]. At the same time, with the development of a computerized version, deep-learning technologies, such as SegNet [26] and DeepLab [27], have potential to clarify semantic analyses and characteristics from street view images. More recently, with increasing attention to the urban environment, a series of previous studies have achieved automatic recognition of urban elements from mass street-view images, and focused on quantifying urban green and sky spaces [28,29]. However, few studies have estimated the quality of the urban street, which is a barrier to relevant urban design and planning [30,31,32].
Quantifying detailed urban street quality on a large scale from the perspective of people’s daily contact with the living environment is the foundation of urban street renewal design and planning. There are different dimensions of landscape quality, including cultural, aesthetic, spatial, historical, etc., and every single or combined aspect is reasonable and constructive for urban ecology study. In this paper, we concentrate on revealing landscape quality through a visual aspect. To solve this question, we aimed to develop a framework and selected the Xiamen Island, China as a case study to quantify urban street quality at city scale. This framework integrates semantic segmentation and landscape ecology to estimate point-to-point street quality by statistic method [33]. The framework has three main parts, (1) Data preparation; (2) Landscape indicators calculation and interpretation; (3) Quantify Street quality. Additionally, according to our results, we also made a series of suggestions to improve the street view quality of Xiamen Island. This framework was convenient to deploy and estimate street view quality which could fill in gaps of relevant urban environment research.

2. Materials and Methods
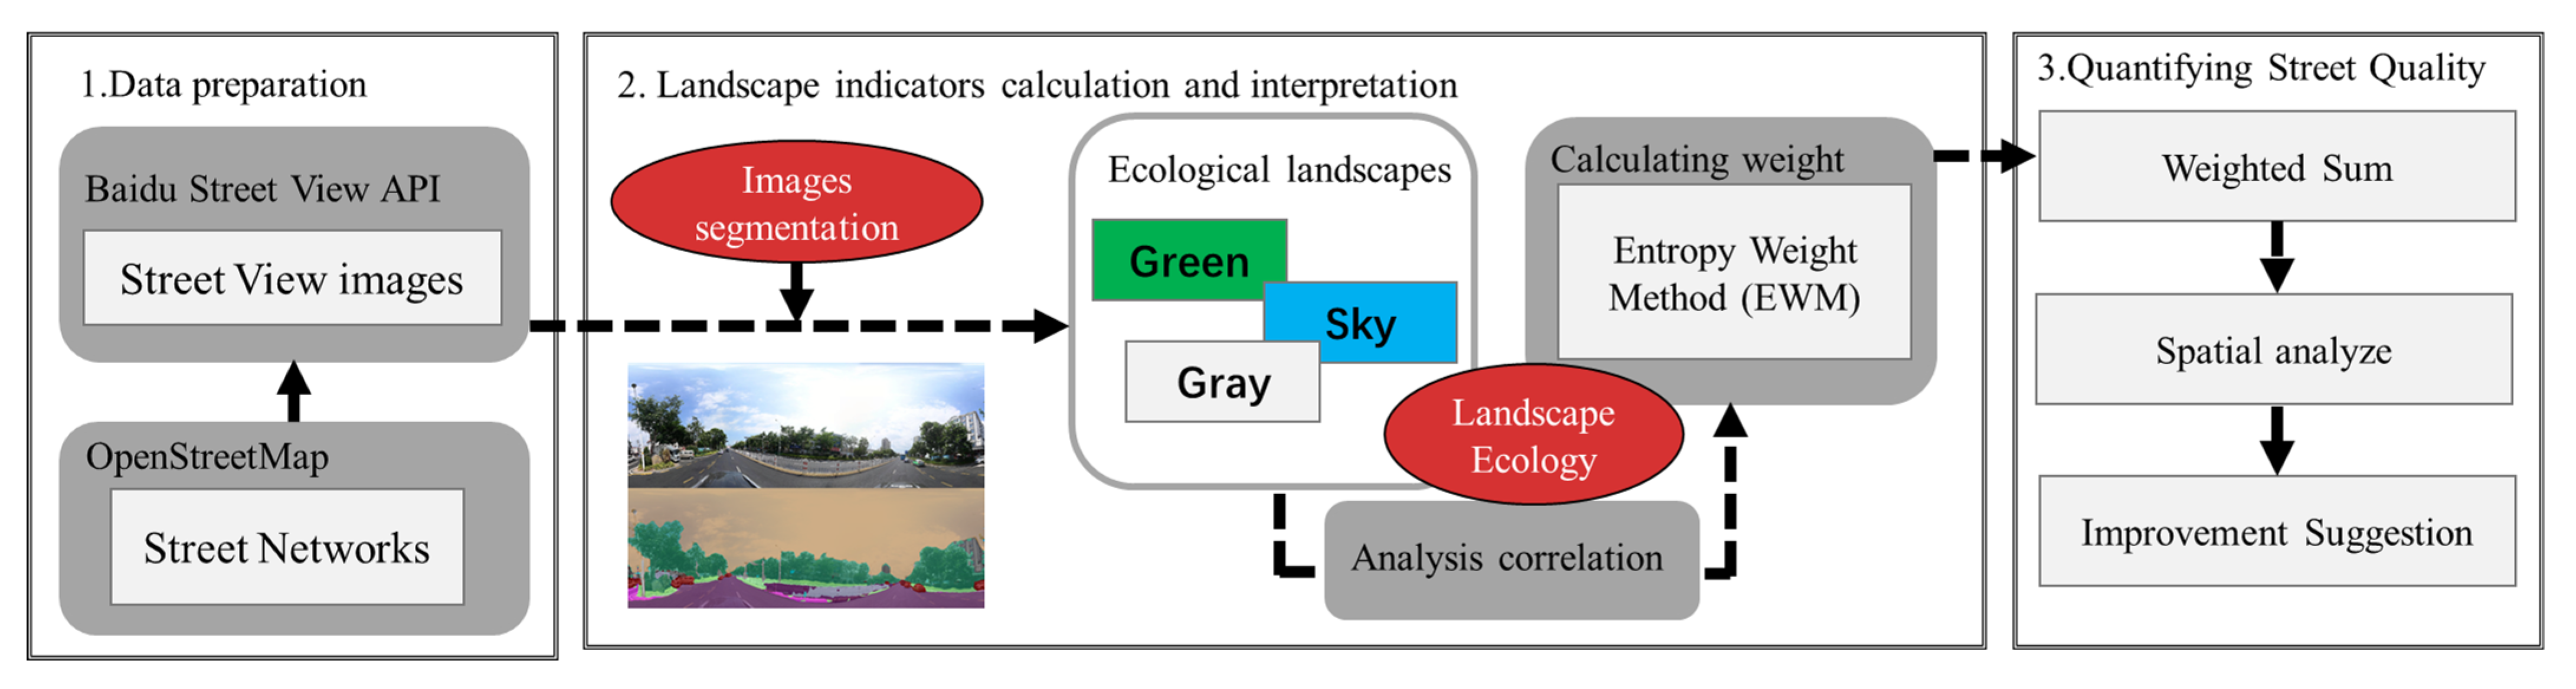
Method of street-view landscape quality in Xiamen Island based on street-view images has three sections (Figure 1).
(1)
Preparing data. Collecting open access street networks and corresponding street-view images.
(2)
Extracting key landscape quality information of Xiamen Island. The analysis landscape unit is every single street view. All collected street view images were recognized by a deep-learning model. Consequently, a set of indicators that could reflect various dimensions of street-landscape quality were selected and calculated. Then, a correlation coefficient was used to filter a set of final indicators. Finally, calculating indicators by the entropy weight method was performed.
(3)
Quantifying street quality. We figured out a landscape-quality index by the weighted sum method and appropriate interpretation of the results.
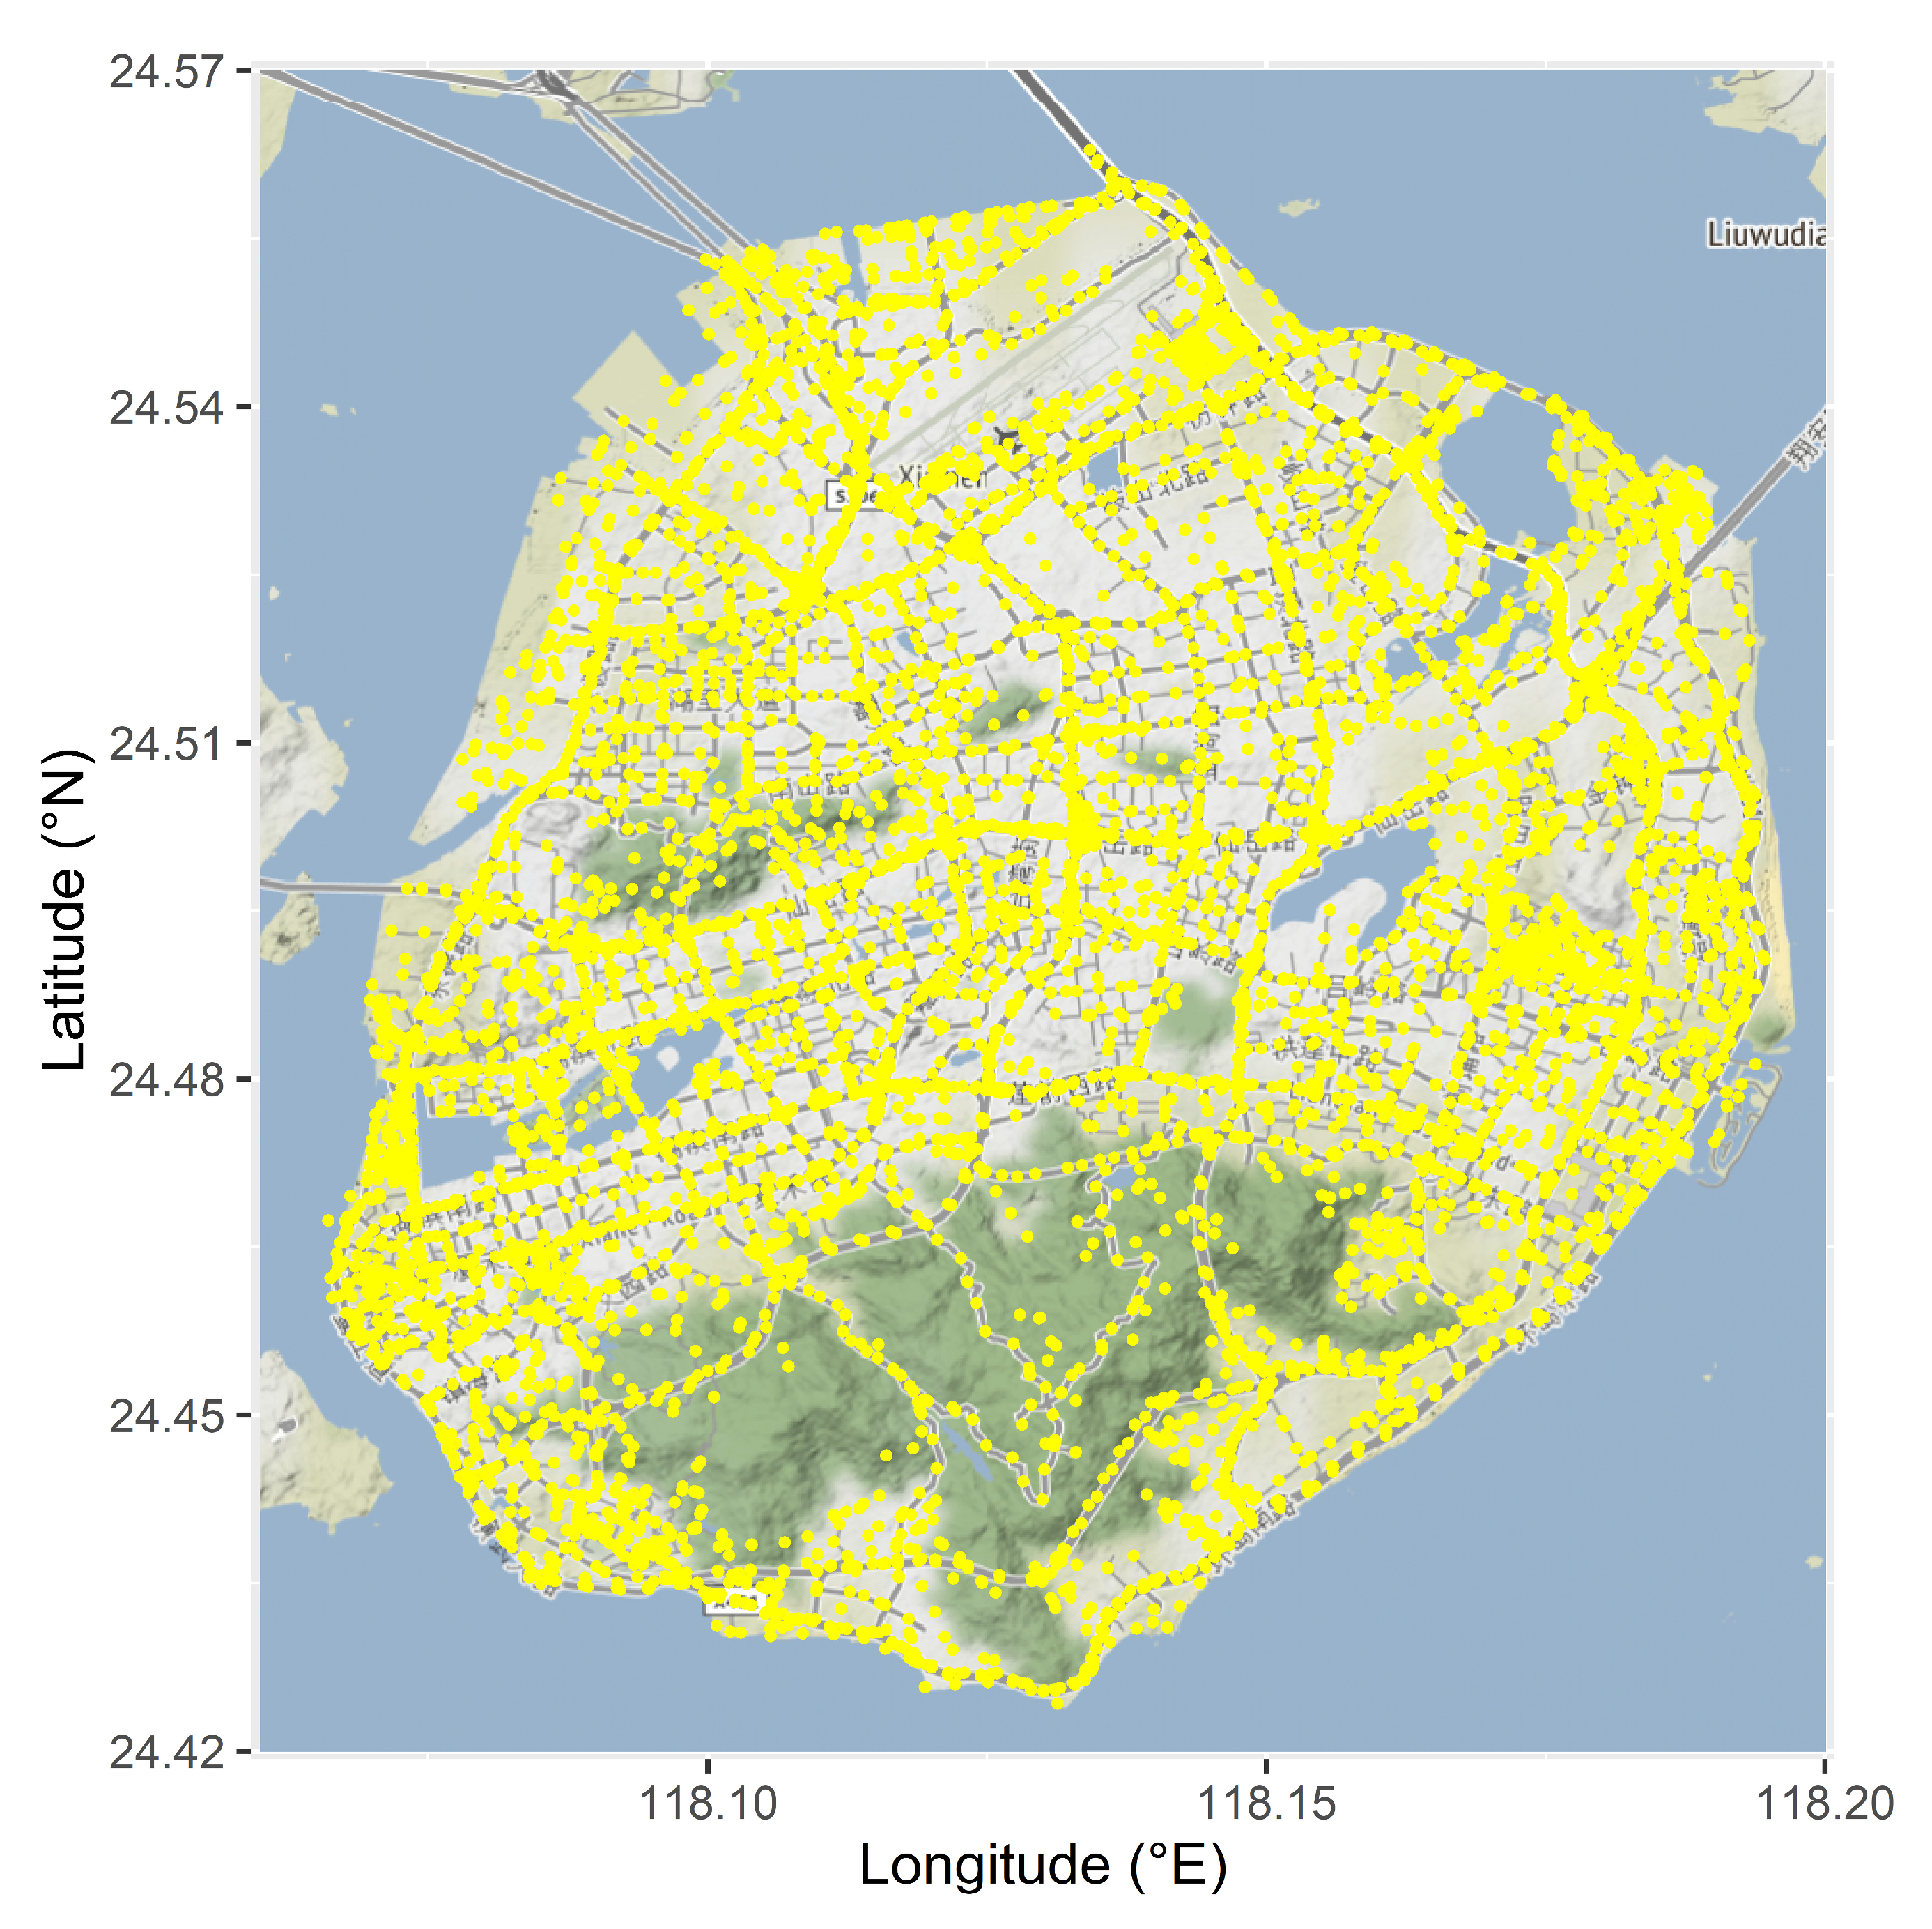
2.1. Study Area

Our study was conducted on Xiamen Island, China (Figure 2). The Xiamen Island is located in southeastern Fujian Province and is a part of Xiamen City. Xiamen Island contains the Siming District and Huli District, with a population of 1.2481 million, covering a total area of 158 km2 in 2020 [34]. Xiamen Island is the birthplace of the Xiamen Special Economic Zone and has formed Xiamen’s earlier commercial and political center, which plays an essential role in Fujian Province. Two-thirds of the topography of Xiamen Island is plain, and the other third is mountainous or hilly, with mountainous and hilly areas in the west-central and south of Xiamen Island [35]. Our study selected Xiamen Island as a case study to quantify street quality due to its long-term urbanization process, which could guide future urban environmental design and planning in China.

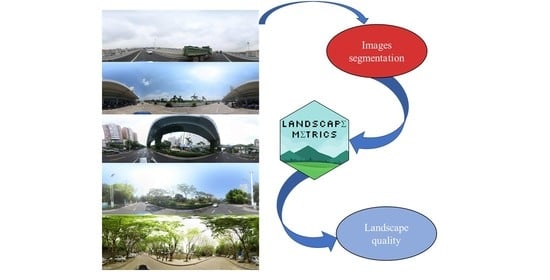
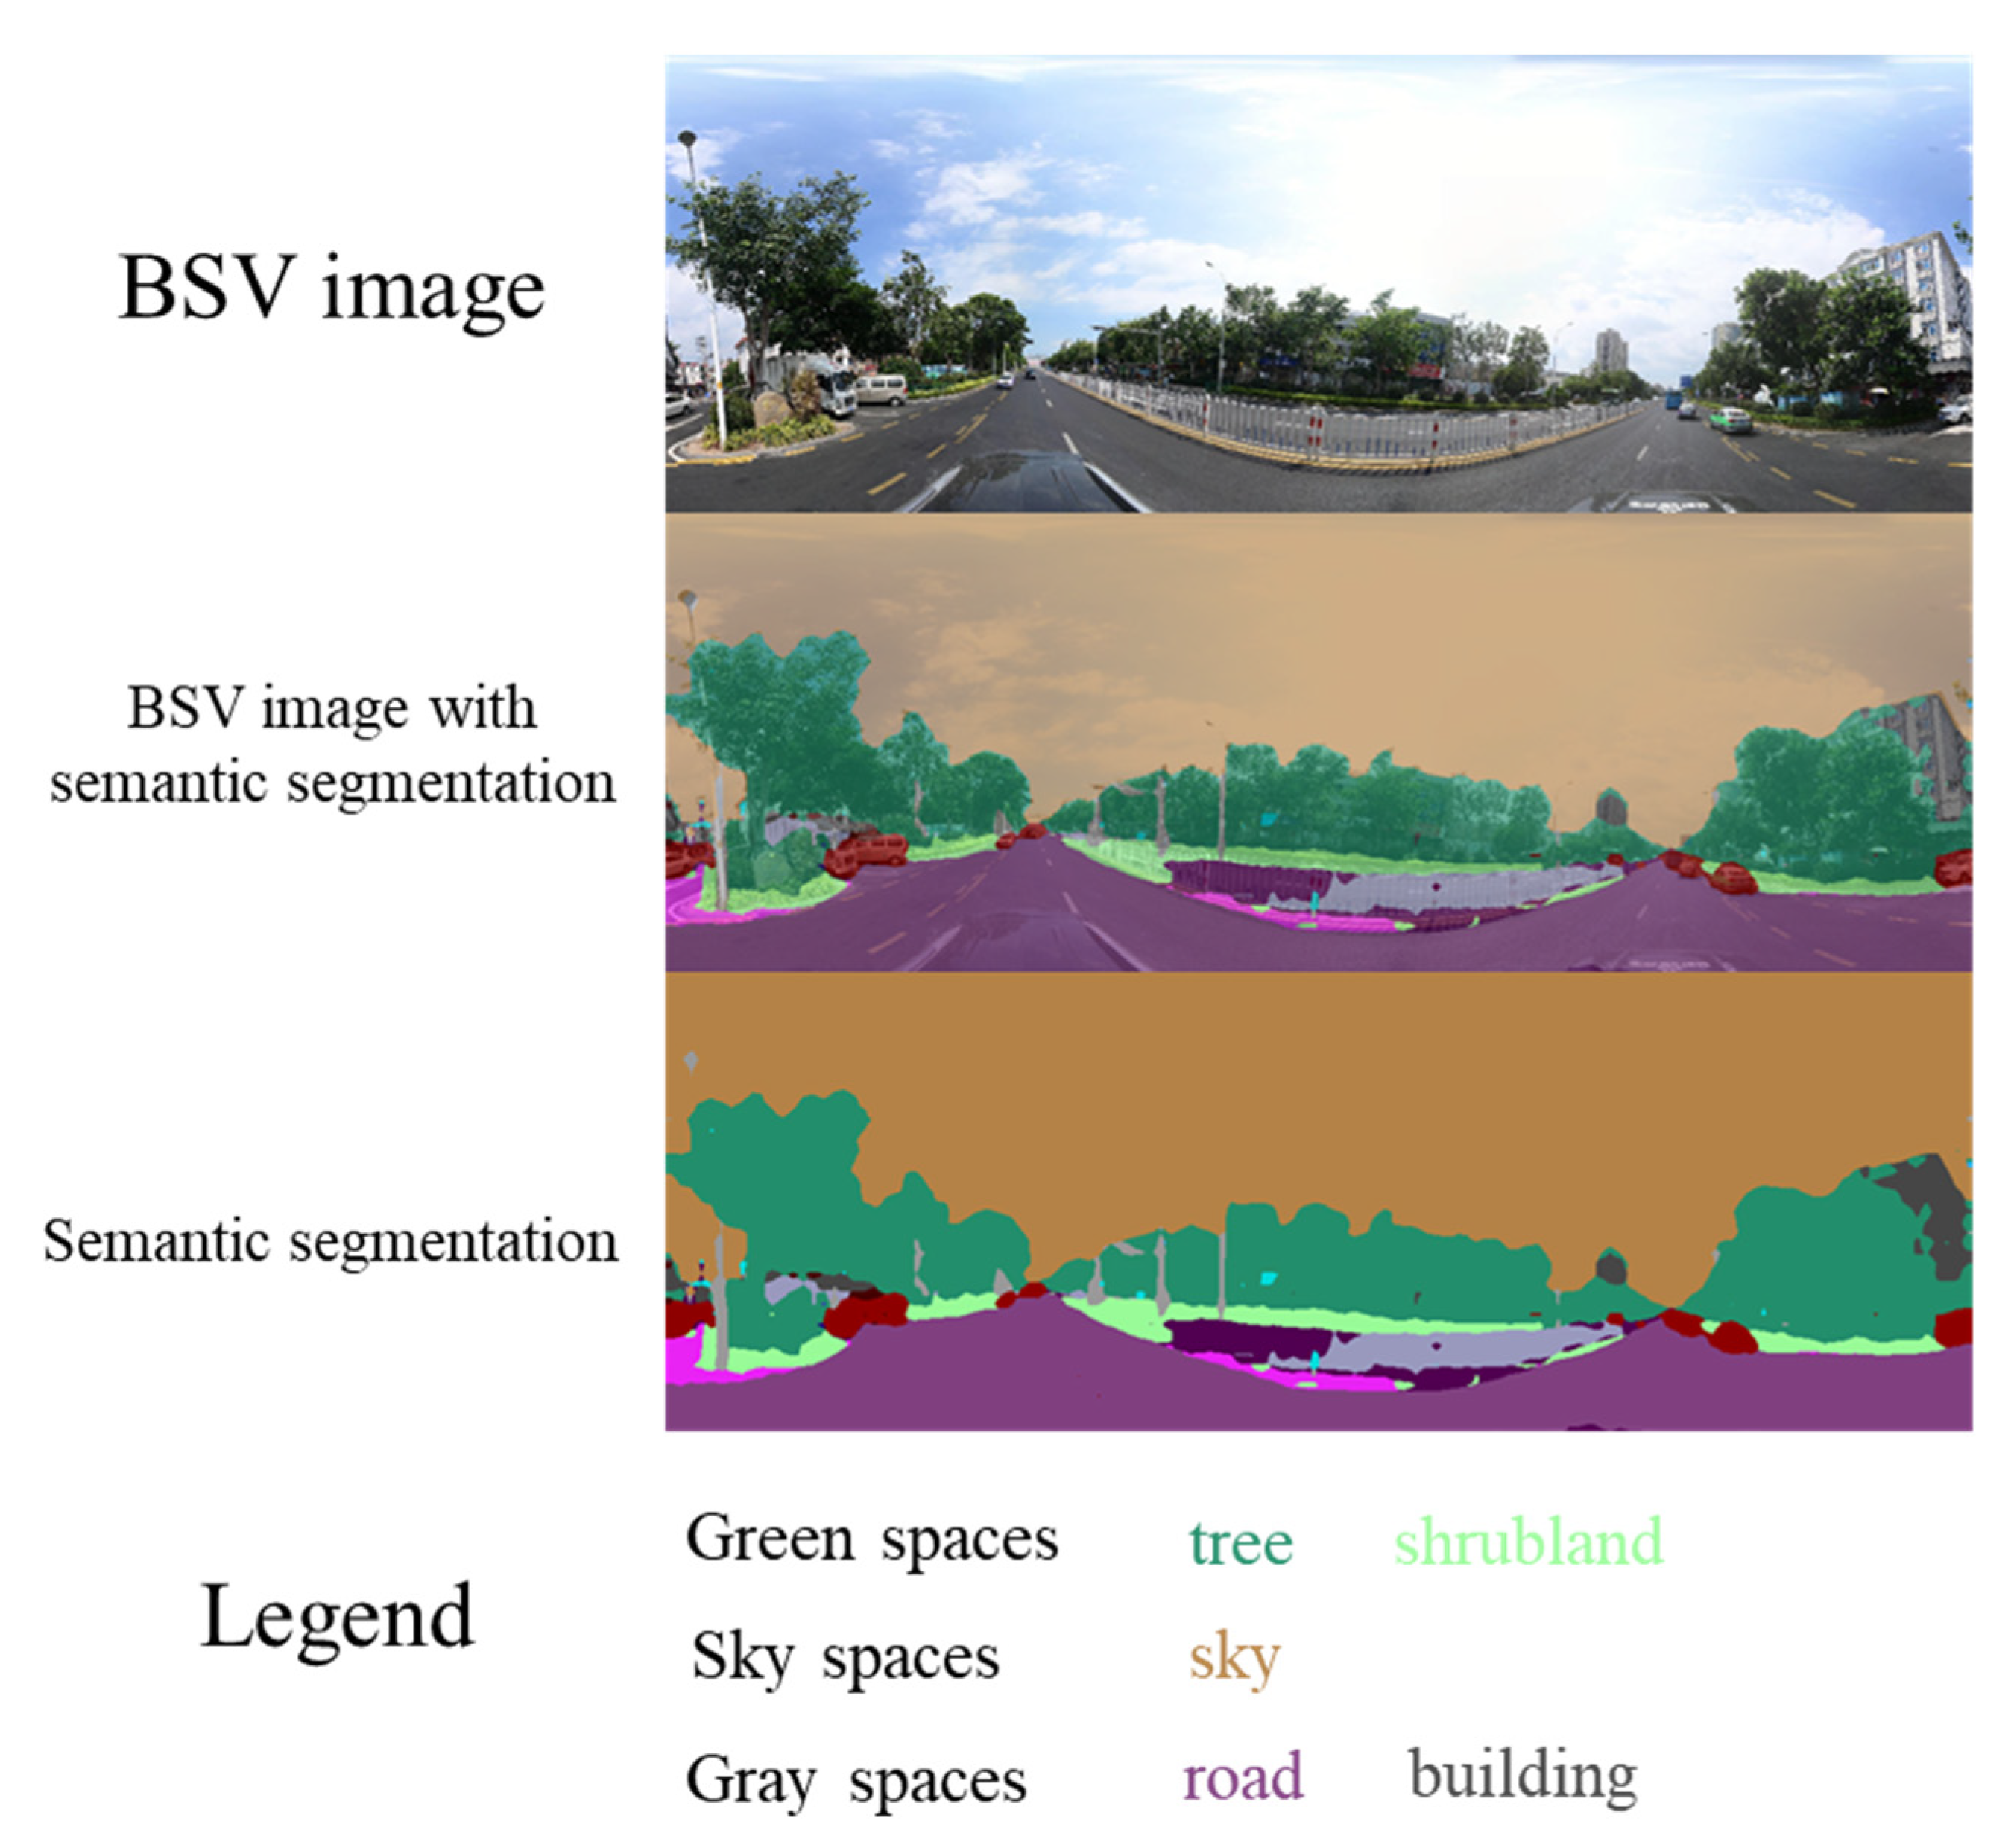
2.2. Open Street View Images and Semantic Segmentation

The street-view images were automatically grabbed based on the Baidu Maps Open Platform and the locations of sampling points. The Baidu Maps Open Platform provides an Application Programming Interface (API) service through which users could send a request to the server with standard parameters and the street images could be downloaded. The standard parameters of the request include the location, Field of View (FOV), image size, heading information, pitch, and other information of the specific street images. In this study, the parameters are unified as image size: 1024 × 512 (Width × Height), FOV = 360°. These street images are displayed as panoramas and captured by cameras mounted on the Baidu Street View cars from a height of 2.5 m. In addition, the locations of sampling points were derived from the Open Street Map (OSM, https://www.openstreetmap.org/ (accessed on 12 January 2022)). First, we downloaded road networks in Xiamen Island from OSM by the OSMnx Python package [36]. Second, the locations of sample points were randomly generated with 150 m intervals on the road network. Finally, a total of 8882 sample points were collected and the longitude and latitude coordinates were used as the input parameters to the Baidu Map API. The road network of Xiamen Island and sampling points were shown in Figure 3.
After collecting street-view images, the DeepLabv3+ was used to convert street images to semantic landscapes. The DeepLab is one open-source semantic segmentation model proposed by Google based on the Convolutional Neutral Netwrok (CNN), which has achieved pixel-level classification for images. The fine-labeled Dataset is key input to the deep-learning model. The Cityspaces Dataset provides a series of suit and large-scale benchmark datasets for understanding urban semantic landscapes [37]. Using the combination of the DeepLab and the Cityspace Dataset to understand the semantics of urban street landscape has proven reliable in street-view image segmentation applications. In this study, we used the Cityspace Dataset to train the DeepLabv3+ model. The street view landscapes were divided into 20 types, including sky, vegetation, road, building, etc. After the standard image segmentation, we did a reclassification to better analyze urban street landscapes, which regarded the natural landscapes as green spaces, the sky landscape as blue space, the construction landscapes as gray spaces (Table 1). The following Figure 4 shows the Baidu Street View image and the result of semantic segmentation.
In this paper, we defined green and sky spaces as ecological landscape, while the gray spaces were anti-ecological landscape. According to previous study, green and sky spaces in urban areas have the ability to relieve the pressure when residents are close to these landscapes [12]. On the contrary, the gray spaces may increase the magnitude of uneasy [38].

2.3. Landscape Metrics

Landscape metrics are indicators that quantify categorical map patterns. There are about 200 different indices that could express landscape information. Using all of the landscape metrics is not an efficient measure to illustrate the landscape structure. Therefore, we selected a set of landscape metrics that meet the following reference requirements [39,40,41]: (1) relevant to our topic; (2) calculable based on remote sensing data; (3) reliable, measurable, and stable. To reflect the urban-street landscapes in Xiamen Island, seven landscape metrics were taken into consideration and calculated at each sampling point, including the percentage of landscape (PLAND), largest patch index (LPI), agglomeration index (AI), division index (DIVISION), mean fractal dimension index (FRAC), and landscape shape index (LSI) at the class level, and Shannon’s diversity index (SHDI) at the landscape level [42]. PLAND and LPI are area metrics, describing the percentage of the specific landscape and the percentage of the largest patch landscape type, respectively. AI and DIVISION are relative metrics, indicating landscape aggregation and fragmentation, respectively. LSI is a shape metric, reflecting fragmentation of the specific class. FRAC is a shape metric, explaining the mean patch complexity based on the patch perimeter and the patch area. SHDI is a diversity metric, indicating the number of landscape class and the abundance of each landscape class. All landscape metrics were calculated by the “landscapemetrics” R package [43], and the class level metrics were under the eight-neighbor rule. In order to make further analysis more convenient, we reclassified the class-level landscape metrics to three categories, including the green, blue and gray spaces. The formulas for the landscape metrics are listed as following (Table 2).

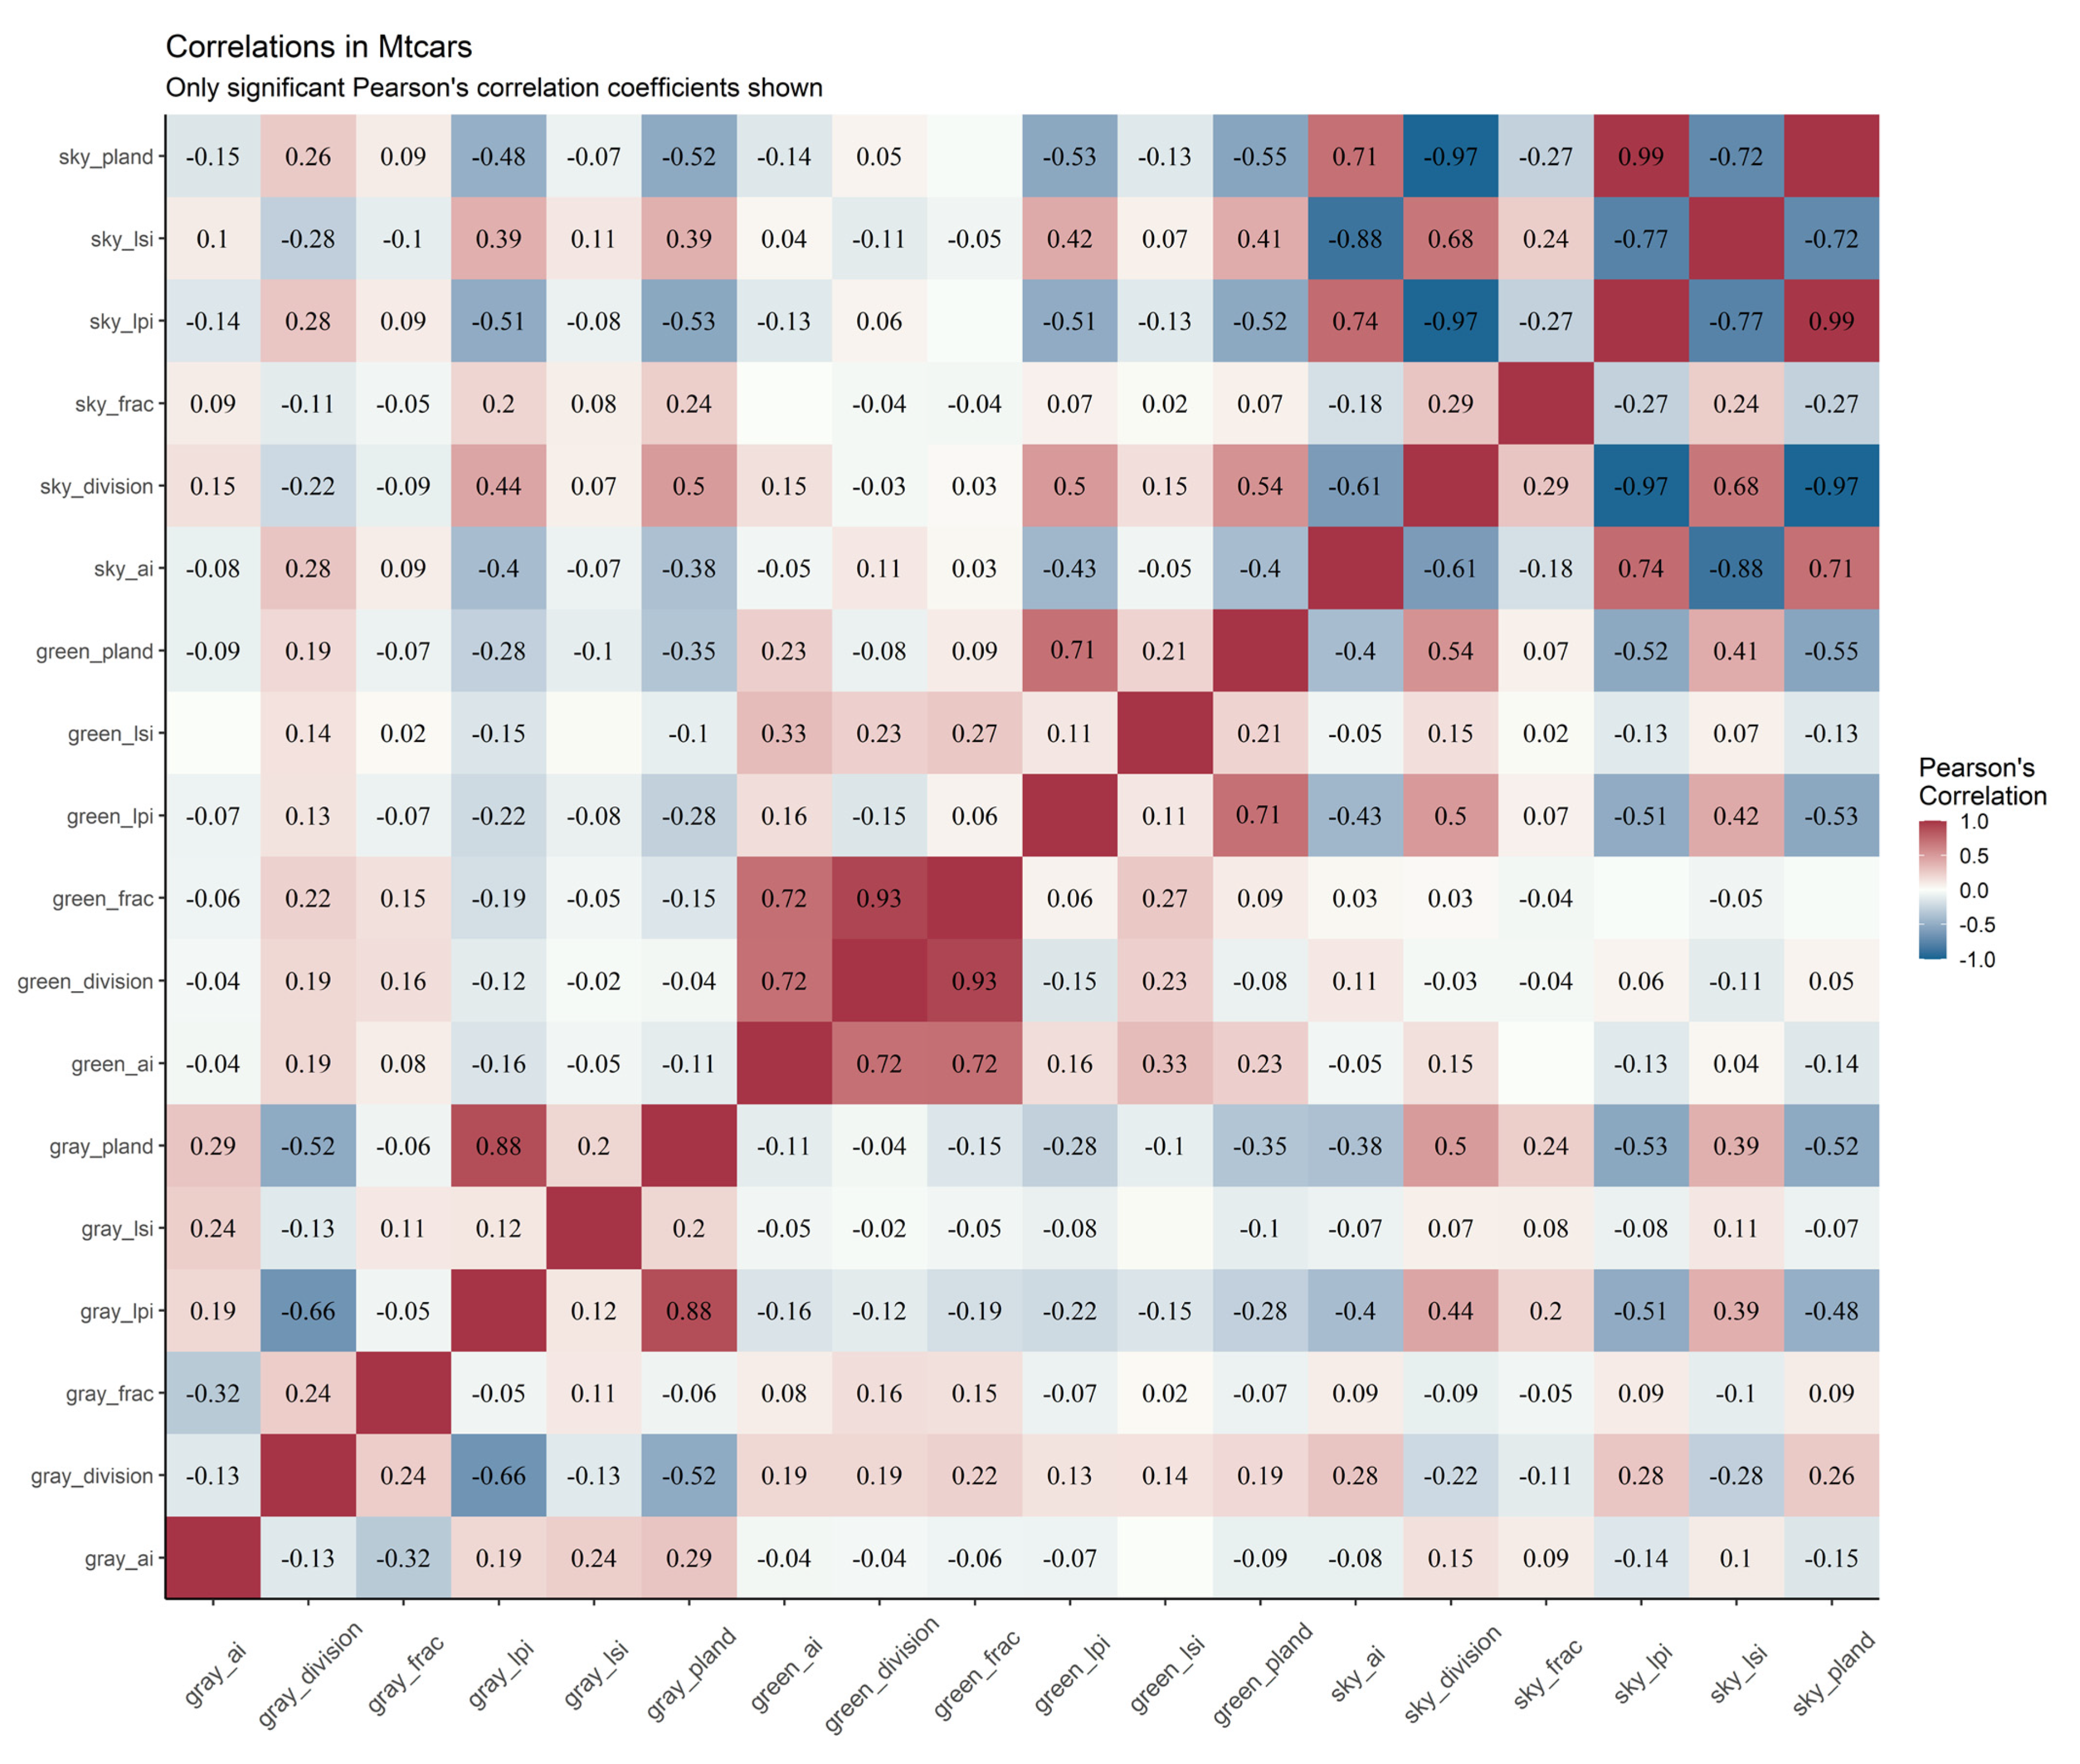
2.4. Analysis of Correlation and Indicator Selection

Using various landscape indicators with high-correlation may give us redundant information and affect the results of quantifying the street landscape quality [39]. The person’s correlation coefficient (p < 0.05) between different landscape metrics was used for selecting each pair of indicators. While the calculated absolute correlation coefficient was greater than 0.8 or more, only one of the two indicators would be retained. Moreover, the final set of indicators should meet the diversity that could reflect various dimensions of street-landscape quality. Finally, the selected indicators would be assigned weights by the following entropy method.

2.5. Calculate Indicator Weigths by Entropy Method

The entropy weight method (EWM) is a widely used weighting method that measures value dispersion in quantifying environmental quality [44]. Based on the information theory, entropy is a measure of uncertainty. The greater the dispersion degree of an estimated factor, the greater uncertainty, and more information could be derived, then the greater the weight of the factor on the comprehensive evaluation. The entropy weight method is considered as an objective weighting method because it only depends on the discreteness of the data itself. In such a high-level urbanized area, referencing previous studies, the more ecological landscape components, and the greater well-being residents gain in Xiamen Island. Therefore, the ecological landscapes included green and sky spaces; on the contrary, the gray spaces were defined as anti-ecological landscapes. All of the factors were standardized, while the ecological landscape indicators used the positive processing (A1), and anti-ecological used the negative processing (A2) (see Appendix A). The standardized value of the ith factor in the jth sample was defined as pij.
p i j = x i j j = 1 n x i j
Then, the entropy value E i of the ith factor was defined as the following equation.
E i = j = 1 n p i j ln p i j ln n
According to the EWM ideology, the range of entropy value E i was [0,1]. The larger E i was, the more information could be derived, and the higher weight should be given to the i index. Thereby, the weight w i was calculated by following method.
w i = 1 E i j = 1 m 1 E i

2.6. Quantifying Ecological Street Landscape Quality

To illustrate the landscape quality across the Xiamen Island, we built a comprehensive ecological street-landscape quality index (ESLQI) model based on point-level landscape diversity and information as follows.
E S L Q I j = S H D I × i = 1 m w i × H i j
where the SHDI is the diversity landscape metric, w i and H i j are the weight and standardized value of factor i for sampling point j, respectively. Overall, the ecological-landscape quality was rated as excellent, good, moderate, fair, and poor, corresponding to the five levels of the Jenks Natural Breaks classification method.

3. Results

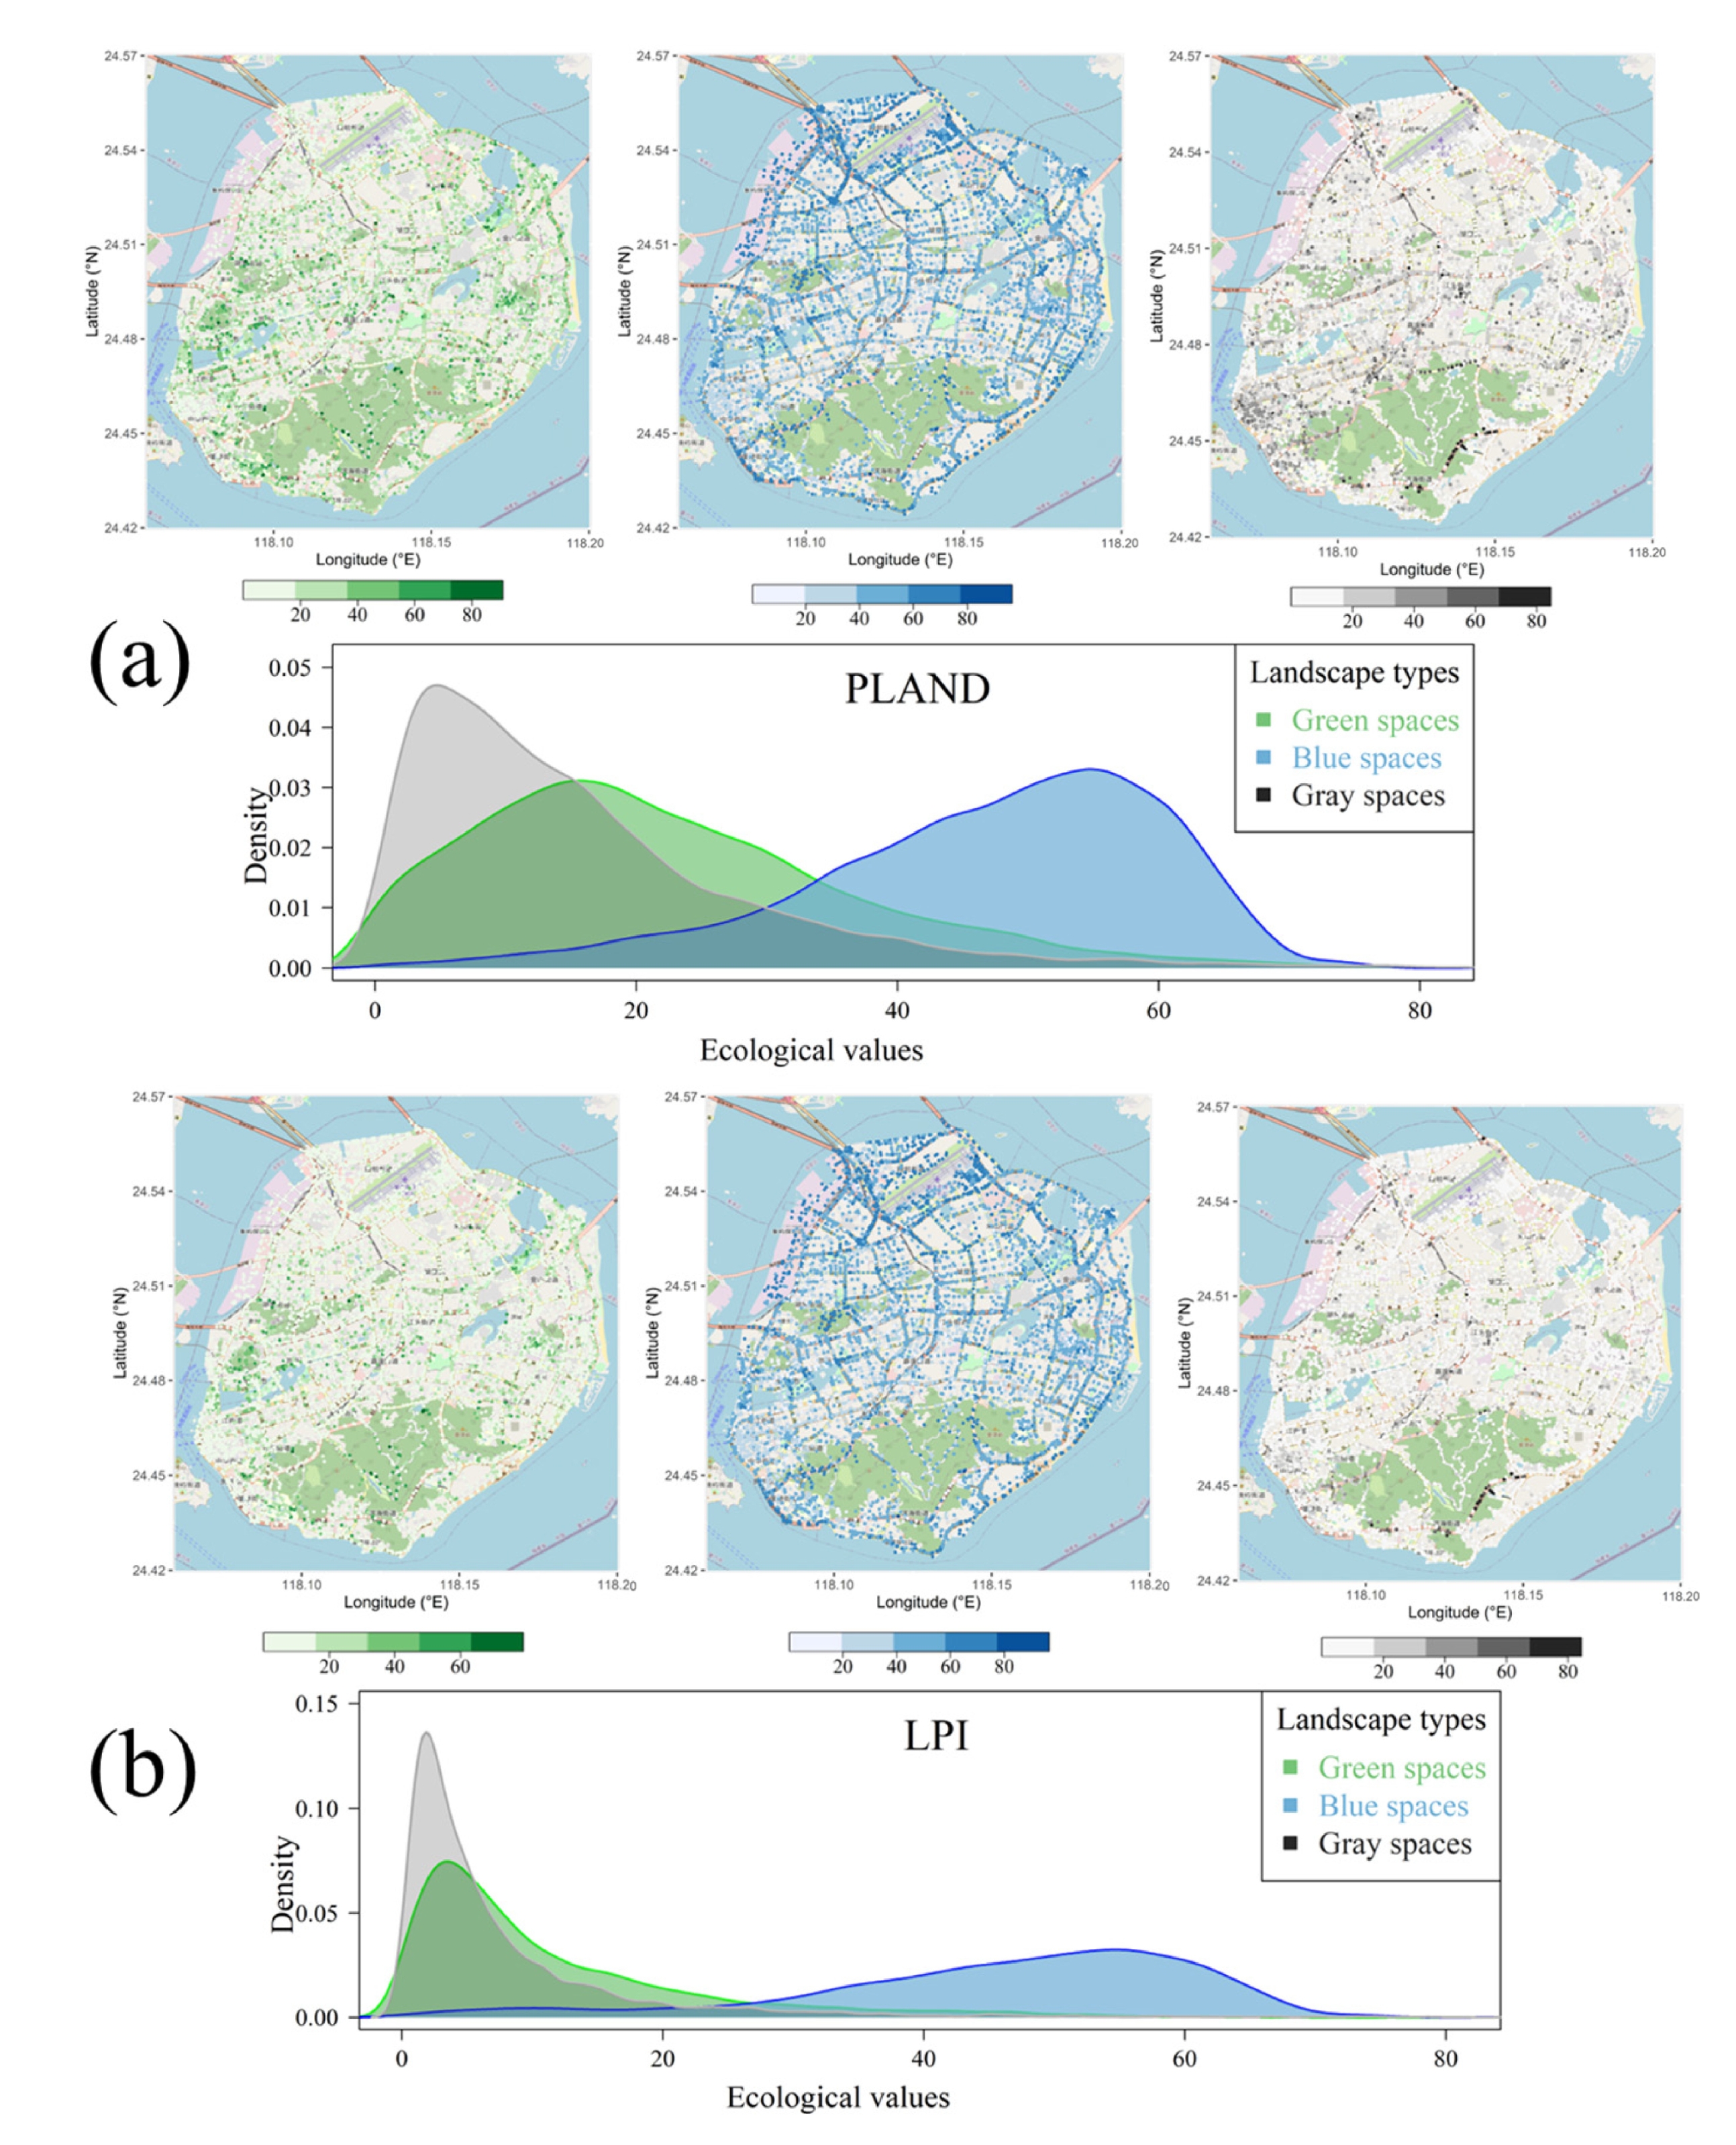
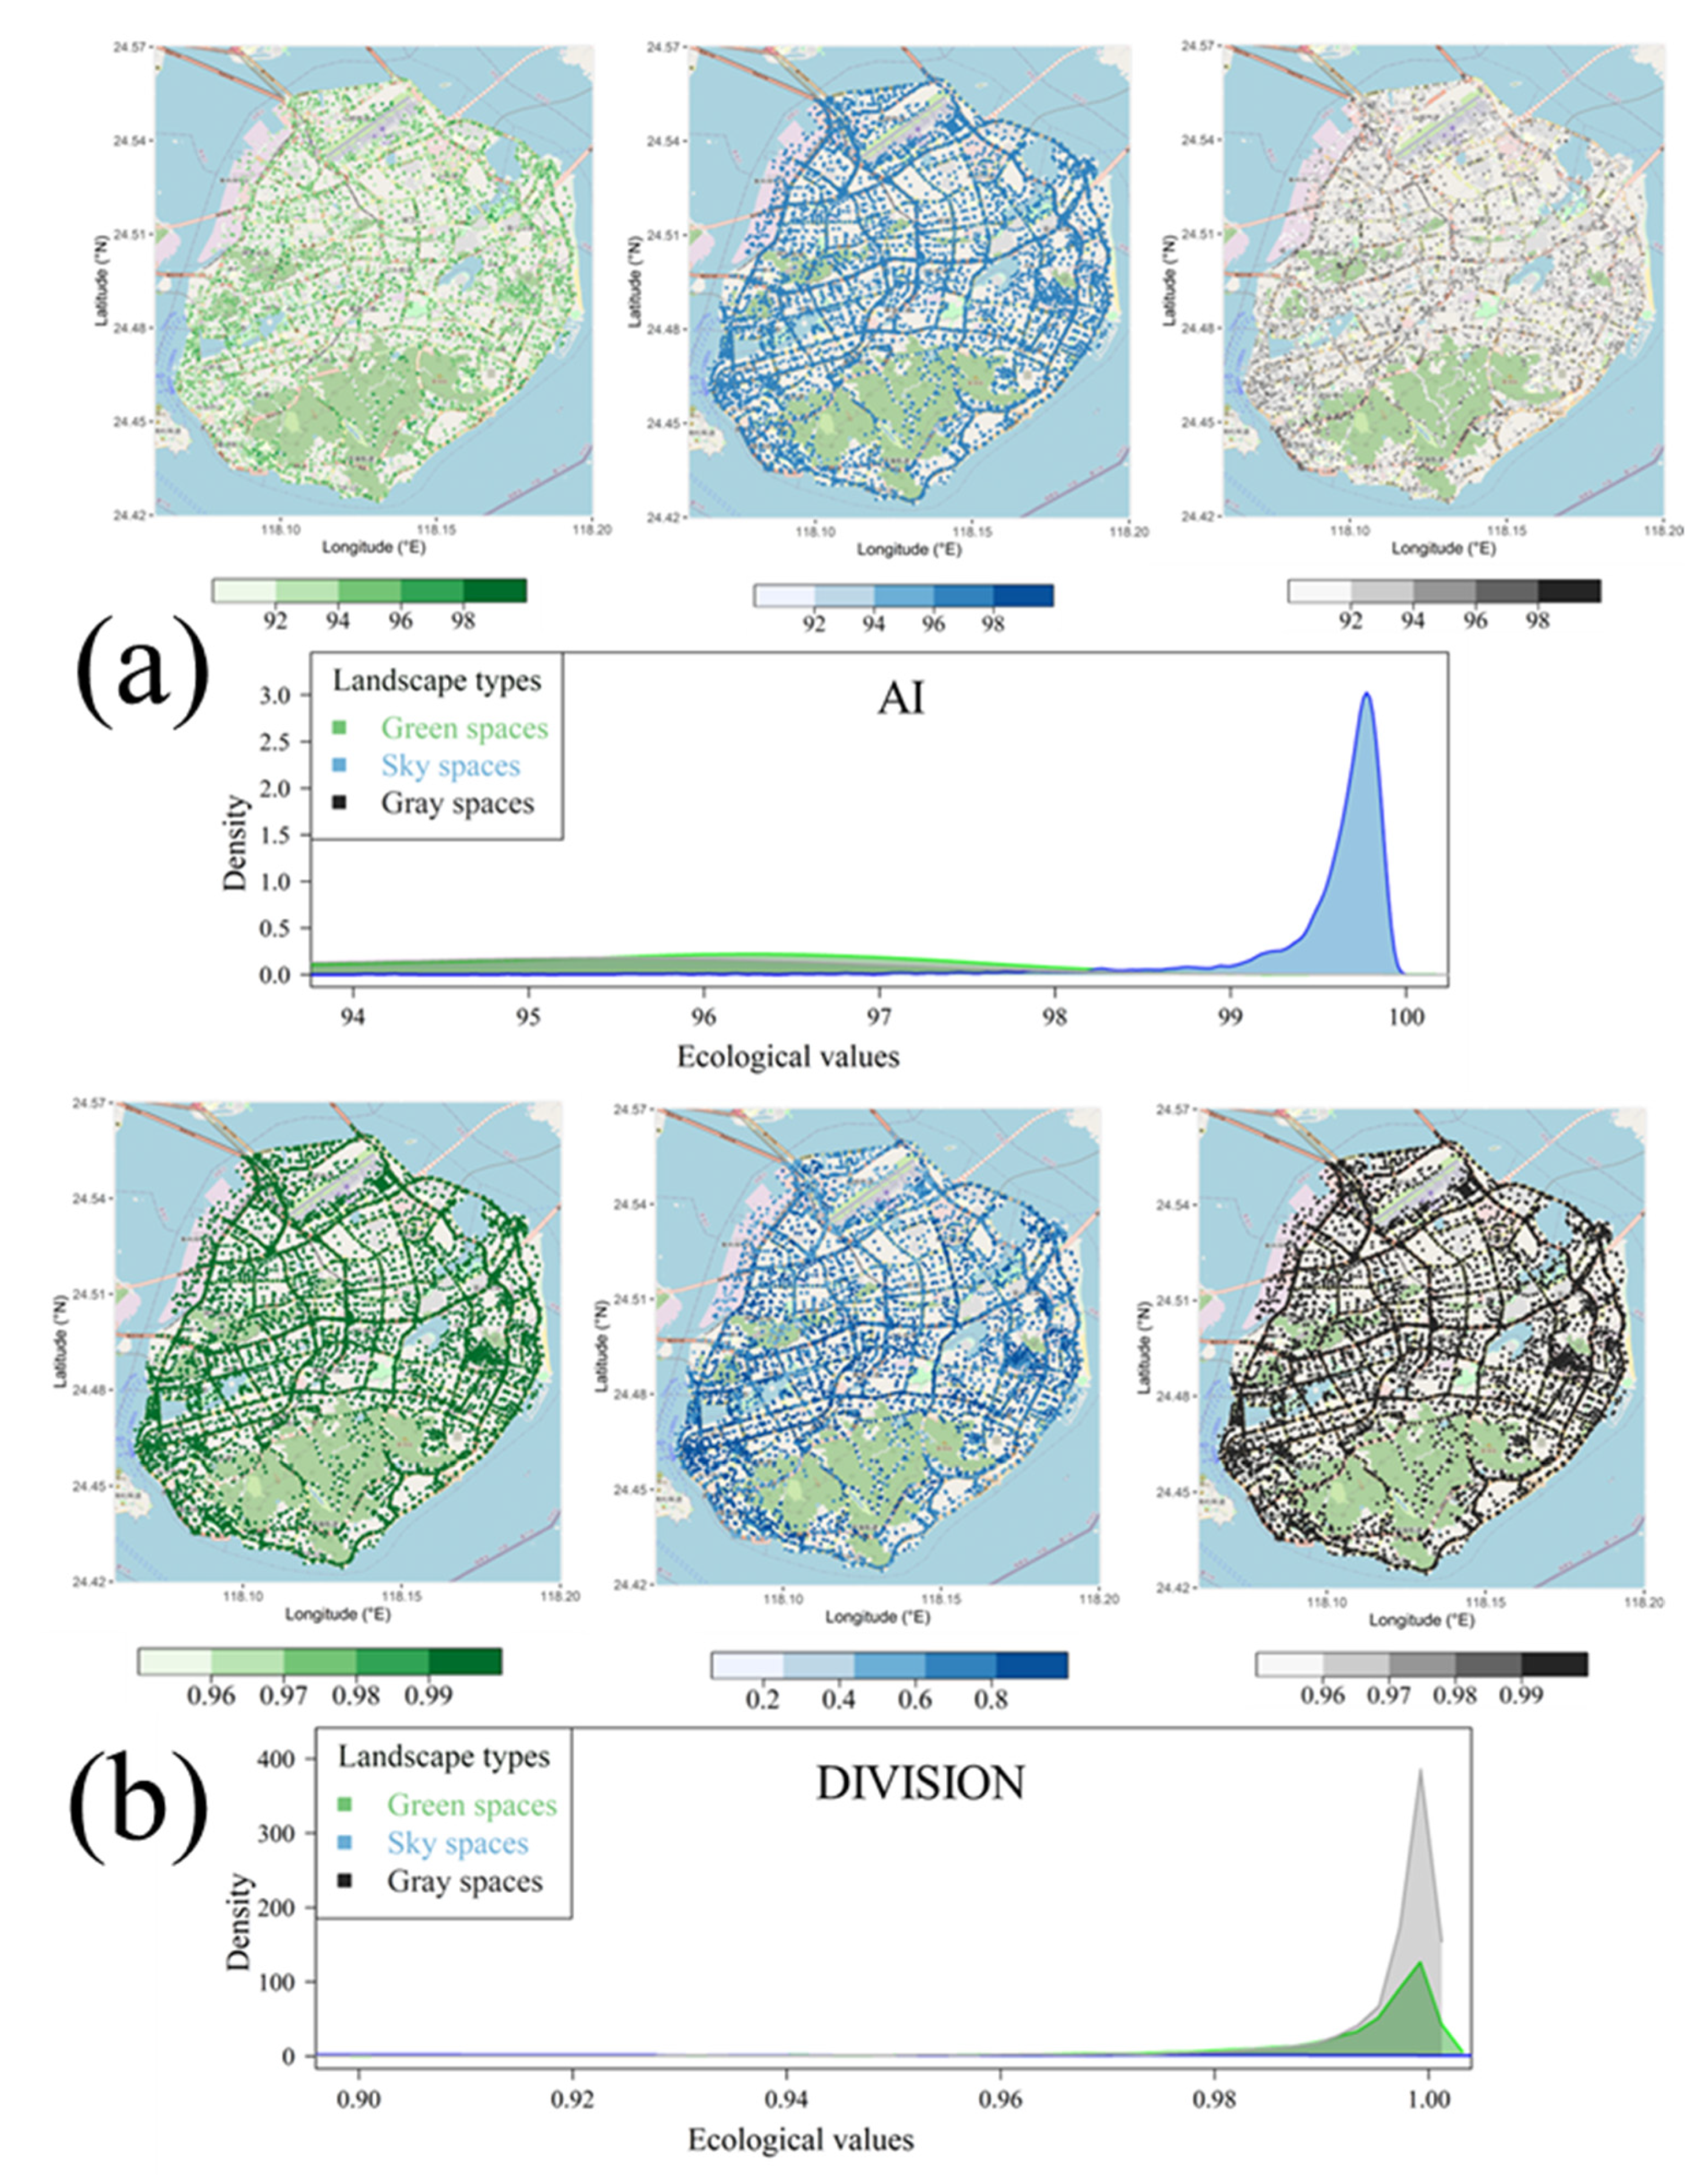
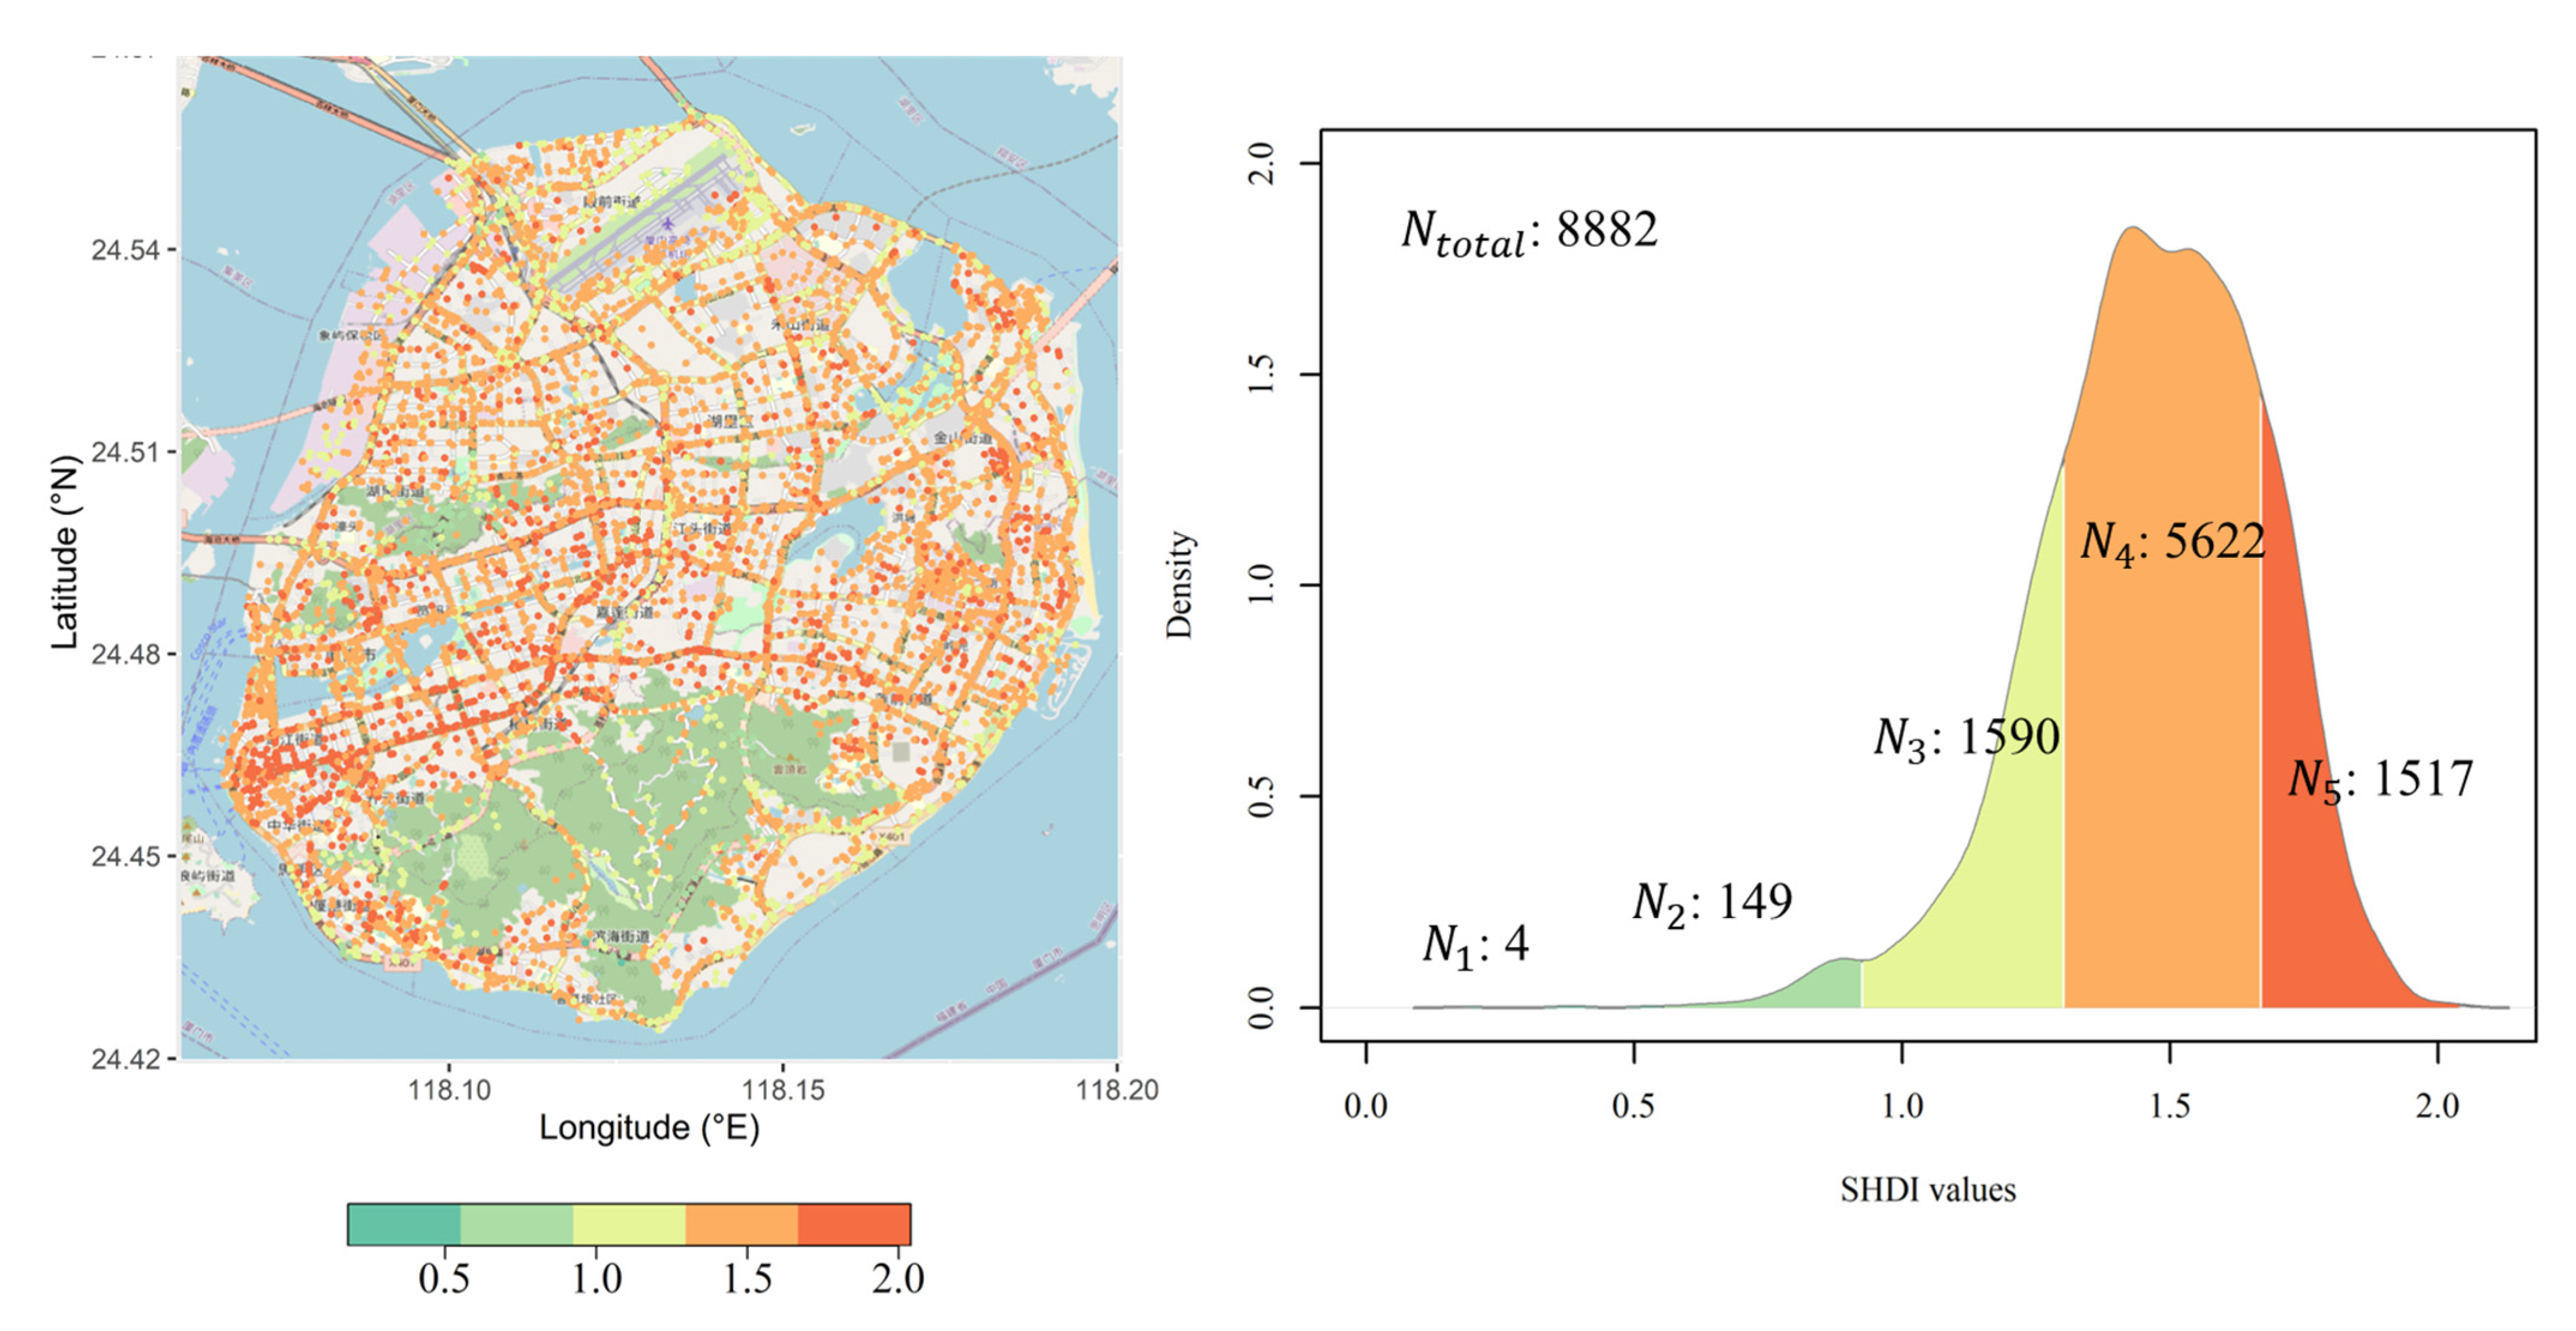
3.1. Green, Sky and Gray Spaces Characteristics in Xiamen Island

Figure 5 demonstrates the spatial heterogeneity and density distribution of ecological street landscapes in Xiamen Island. The density distribution of street landscape PLAND shows the gray spaces are clustered in the range from 0% to 25%, and the sky spaces are mainly distributed in extent from 25% to 70% (Figure 5a). The green spaces have more dispersed distribution and are moderate in the three kinds of landscapes of Xiamen Island. The spatial distribution of PLAND shows large heterogeneity in Xiamen Island. For green spaces, the higher regions are mainly located in the northeast, east, south, and southwest while regions in the north and center of Xiamen Island are relatively lower than others; for sky spaces, sampling points at the coastline of Xiamen are generally higher than that in the inland areas. The density distribution of LPI illustrates that the street landscapes for gray and green spaces concentrate on the range from 0% to 10%, while the sky spaces are dominant landscape types and are generally greater than the gray and green spaces. The green spaces and gray spaces with higher LPI distribute in the south of Xiamen Island, while the sky spaces are similar with their PLAND distribution. Some areas with a high proportion of gray spaces are identified in the southwest and southeast of Xiamen Island. According to the landscape ecology rule [45], the variations between PLAND and LPI generally indicate the cohesion between the landscape patches. Specifically, if the landscape metrics, PLAND and LPI, have similar distribution density in one specific landscape, then this landscape will be more cohesive. According to this rule, the sky spaces have the most cohesion value, while the green and gray spaces are relatively dispersed due to the higher differences between PLAND and LPI.
Figure 6a shows the LSI of sky spaces concentrated in the range from 1.5 to 2.5, and the green and gray spaces distributed with more dispersal in the range from 1 to 5. The LSI is a substitutable measure of patch aggregation; with the LSI increasing, the patches become more disaggregated and less compact. Therefore, the gray and sky spaces are more polymeric than that in green spaces. The spatial and density distributions of the last landscape indicator, FRAC, are shown in Figure 6b. The FRAC of green and gray spaces display similar spatial and density distribution in Xiamen Island, and concentrate in the range from 1.15 to 1.25., and the FRAC for sky spaces distributed larger than green and gray spaces but concentrated in the range of 1.10 to 1.20. Generally, the sky spaces are tidier and more compact than green and gray spaces, due to the FRAC mainly determining the complexity of the landscape patches.
Figure 7 shows the street-landscape agglomeration and fragmentation of Xiamen Island. Compared with street landscape for green and gray spaces, the sky spaces have the highest agglomeration. For Figure 7a, the density distribution of sky spaces generally clusters at more than 99 in AI, while the density distribution of DIVISION for blue spaces does not have agglomeration. This situation illustrates that the blue spaces for Xiamen Island are integrated, although the street landscapes for green and gray spaces are fragmented. The DIVISION density distribution for green and gray concentrates near 1 and the magnitude for green spaces is lower than that for gray spaces, as shown in Figure 7b.

3.2. Relationship between Ecological Indicators in Xiamen Island

We analyzed the relationship between the ecological landscape indicators by the Pearson’s correlation coefficient (PCC), according to Figure 8. The LPI and PLAND for sky landscapes have the largest PCC, which is up to 0.99. Additionally, the PCCs of the LPI and PLAND for green landscape and sky spaces are 0.90 and 0.88, respectively. The combination of LPI and PLAND reflect the integration in the ecological landscapes. The landscape will be more integrated, while the PCC for LPI and PLAND has a higher value. Therefore, the sky spaces tend to be more integrated and unbroken than that of green and gray spaces. However, the LSI has significant negative values with LPI and PLAND in sky spaces of Xiamen Island, which has reached −0.77 and −0.72, respectively. The PLAND for sky spaces has a negative PCC with green spaces and has a positive one with gray spaces, and both values are slightly greater than 0.5. The rest of the PCCs have an even less obvious relationship with the others and achieve a lower than 0.5 value, generally. According to the correlation results, we finally selected LPI, PLAND, AI and LSI for green spaces, AI, PLAND, LPI and FRAC for sky spaces, and FRAC, PLAND and LSI for gray spaces as our final landscape-quality indicators.

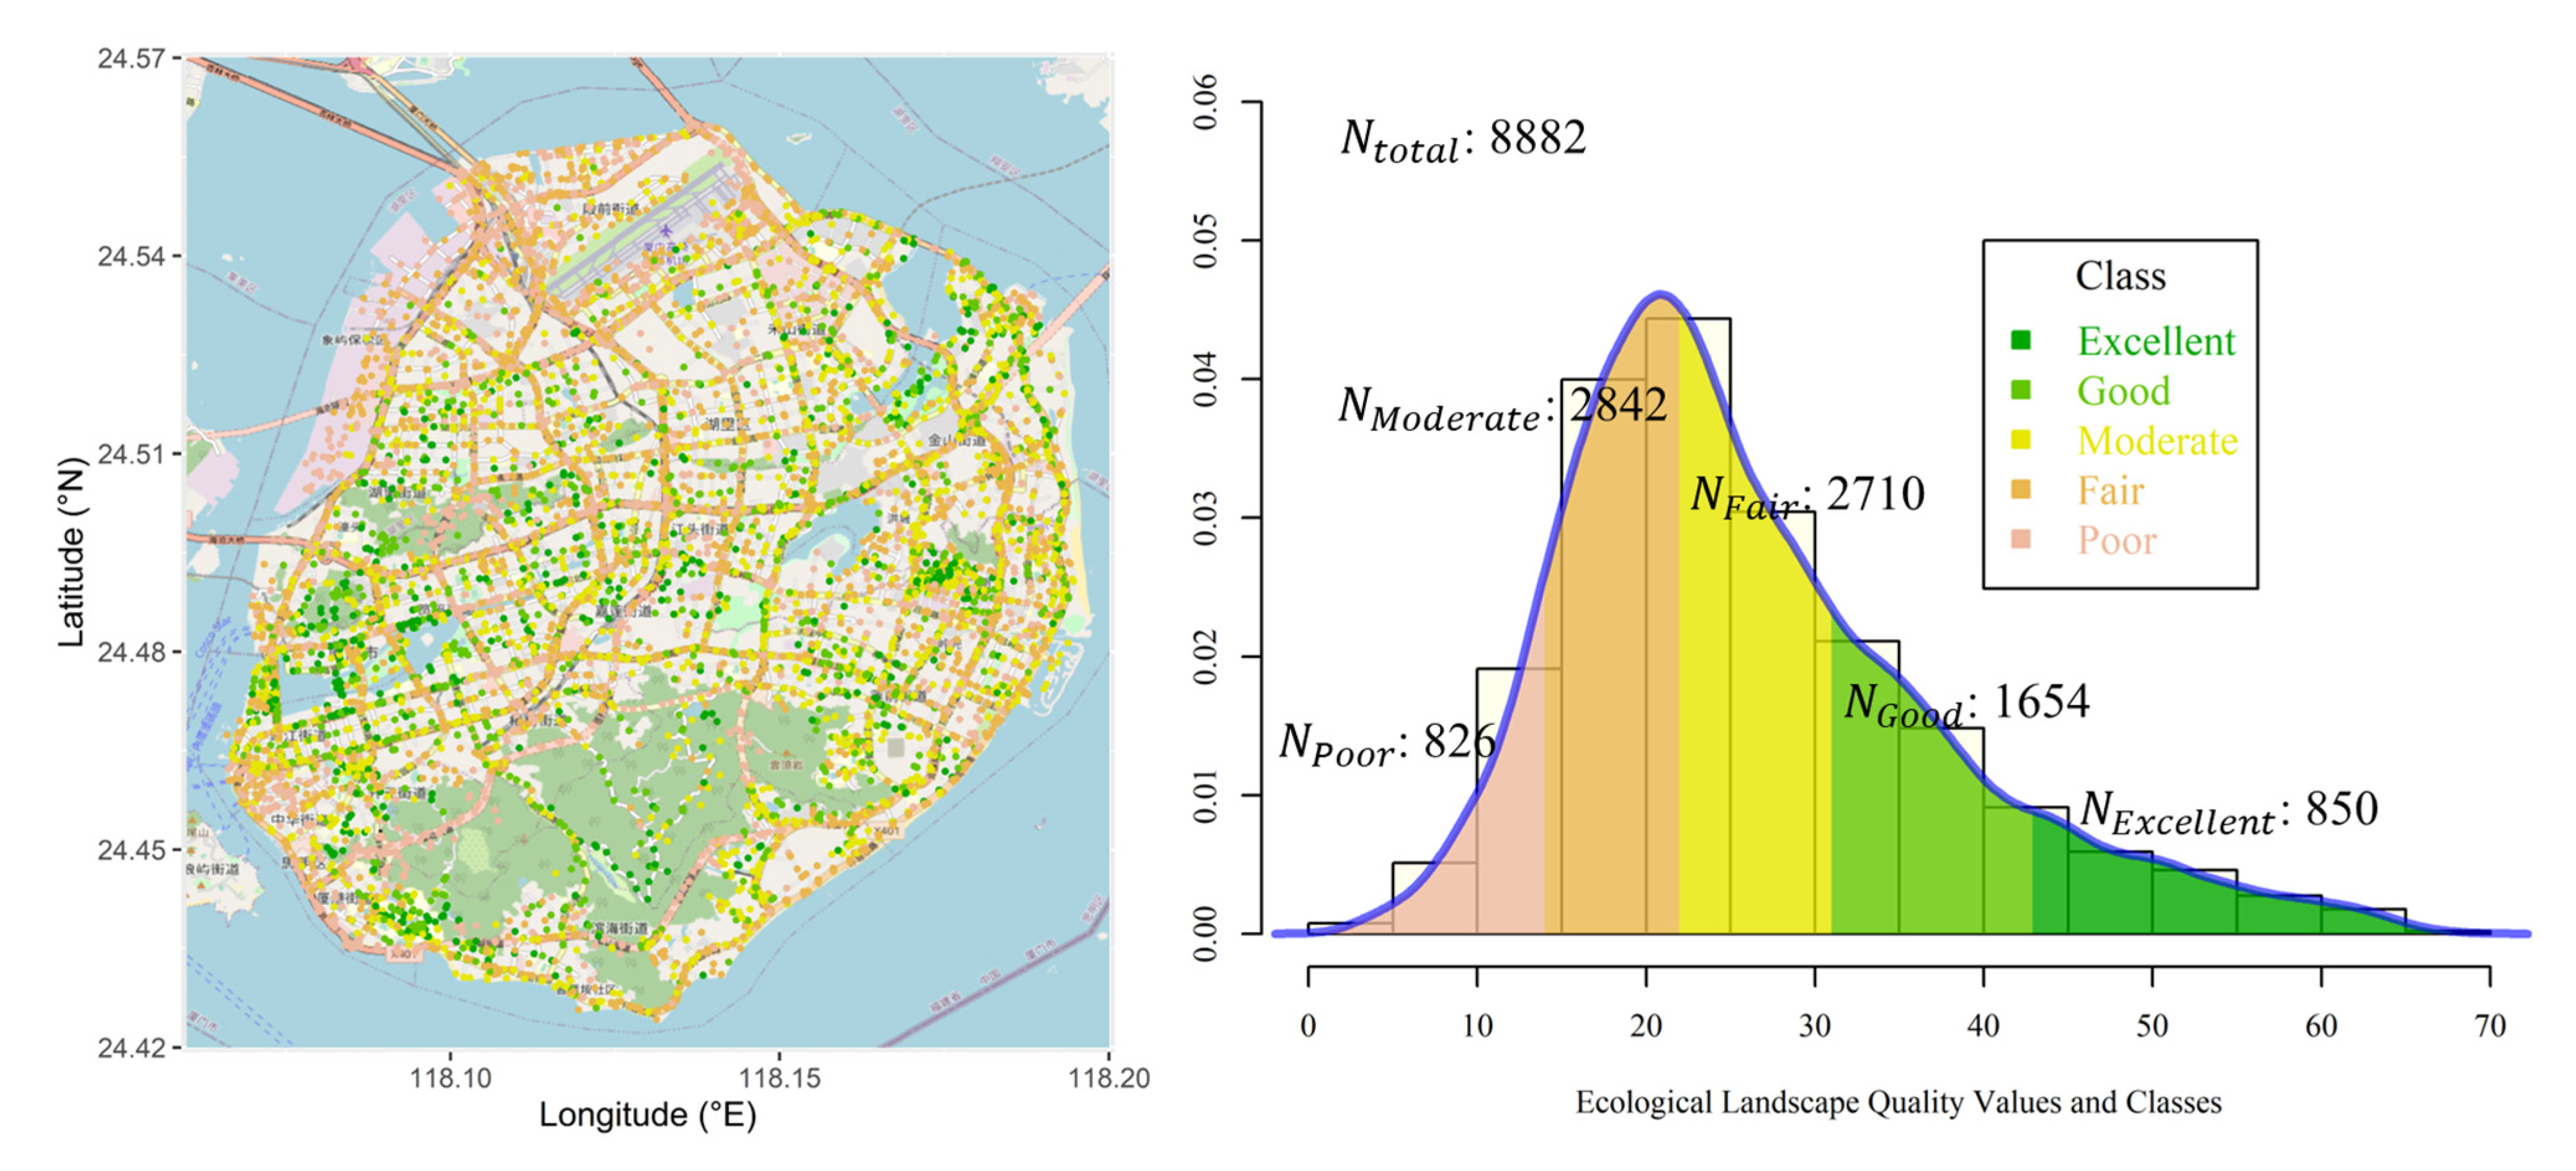
3.3. Results of Ecological Landscape Quality in Xiamen Island

The weights of landscape metrics are shown in Figure 9. The LPI for green spaces has the largest weight, the PLAND for green spaces are as follows, then the PLAND for green. The rest of landscape indicators distribute in a more concentrated way and demonstrate less uncertainty, which results in little variations between these landscape indicators.
Figure 10 shows the landscape diversity distribution of Xiamen Island. Most of the street landscape SHDI values are greater than 1.0, and the majority of SHDI values concentrate in the range from 1.3 to 1.6. There is an area with higher SHDI values identified in the southwest of Xiamen Island, and this area extends along the roads to the center, while the other regions scatter higher SHDI values; however, the SHDI values are relatively lower than that in the inside of Xiamen Island.
According to Equation (9), we calculated the ESLQI values at each sample point, the spatial distribution is shown in Figure 11 (left). Referencing the Jenks Natural Breaks, we obtained 4 breakpoints at 17, 25, 34, and 46 for ESLQI values. Consequently, we classified the ESLQI values into 5 levels, including excellent, good, moderate, fair and poor, and its density is shown in Figure 11 (right). A total of 850 sampling points were identified as excellent and 1654 points were regarded as good. These relative better-landscape quality regions are distributed in the middle of Xiamen Island and displayed as a strip along with the center roads. Additionally, there are high ESLQI areas in the interior and southwestern part of the Xiamen botanical garden. More than half of the sample points were classified as fair or lower than fair. These points are shown in the north of Xiamen Island, especially assembled in the area around the coastline. The southeastern and southwestern coastline regions are also figured-out agglomerations with low ESLQI values.

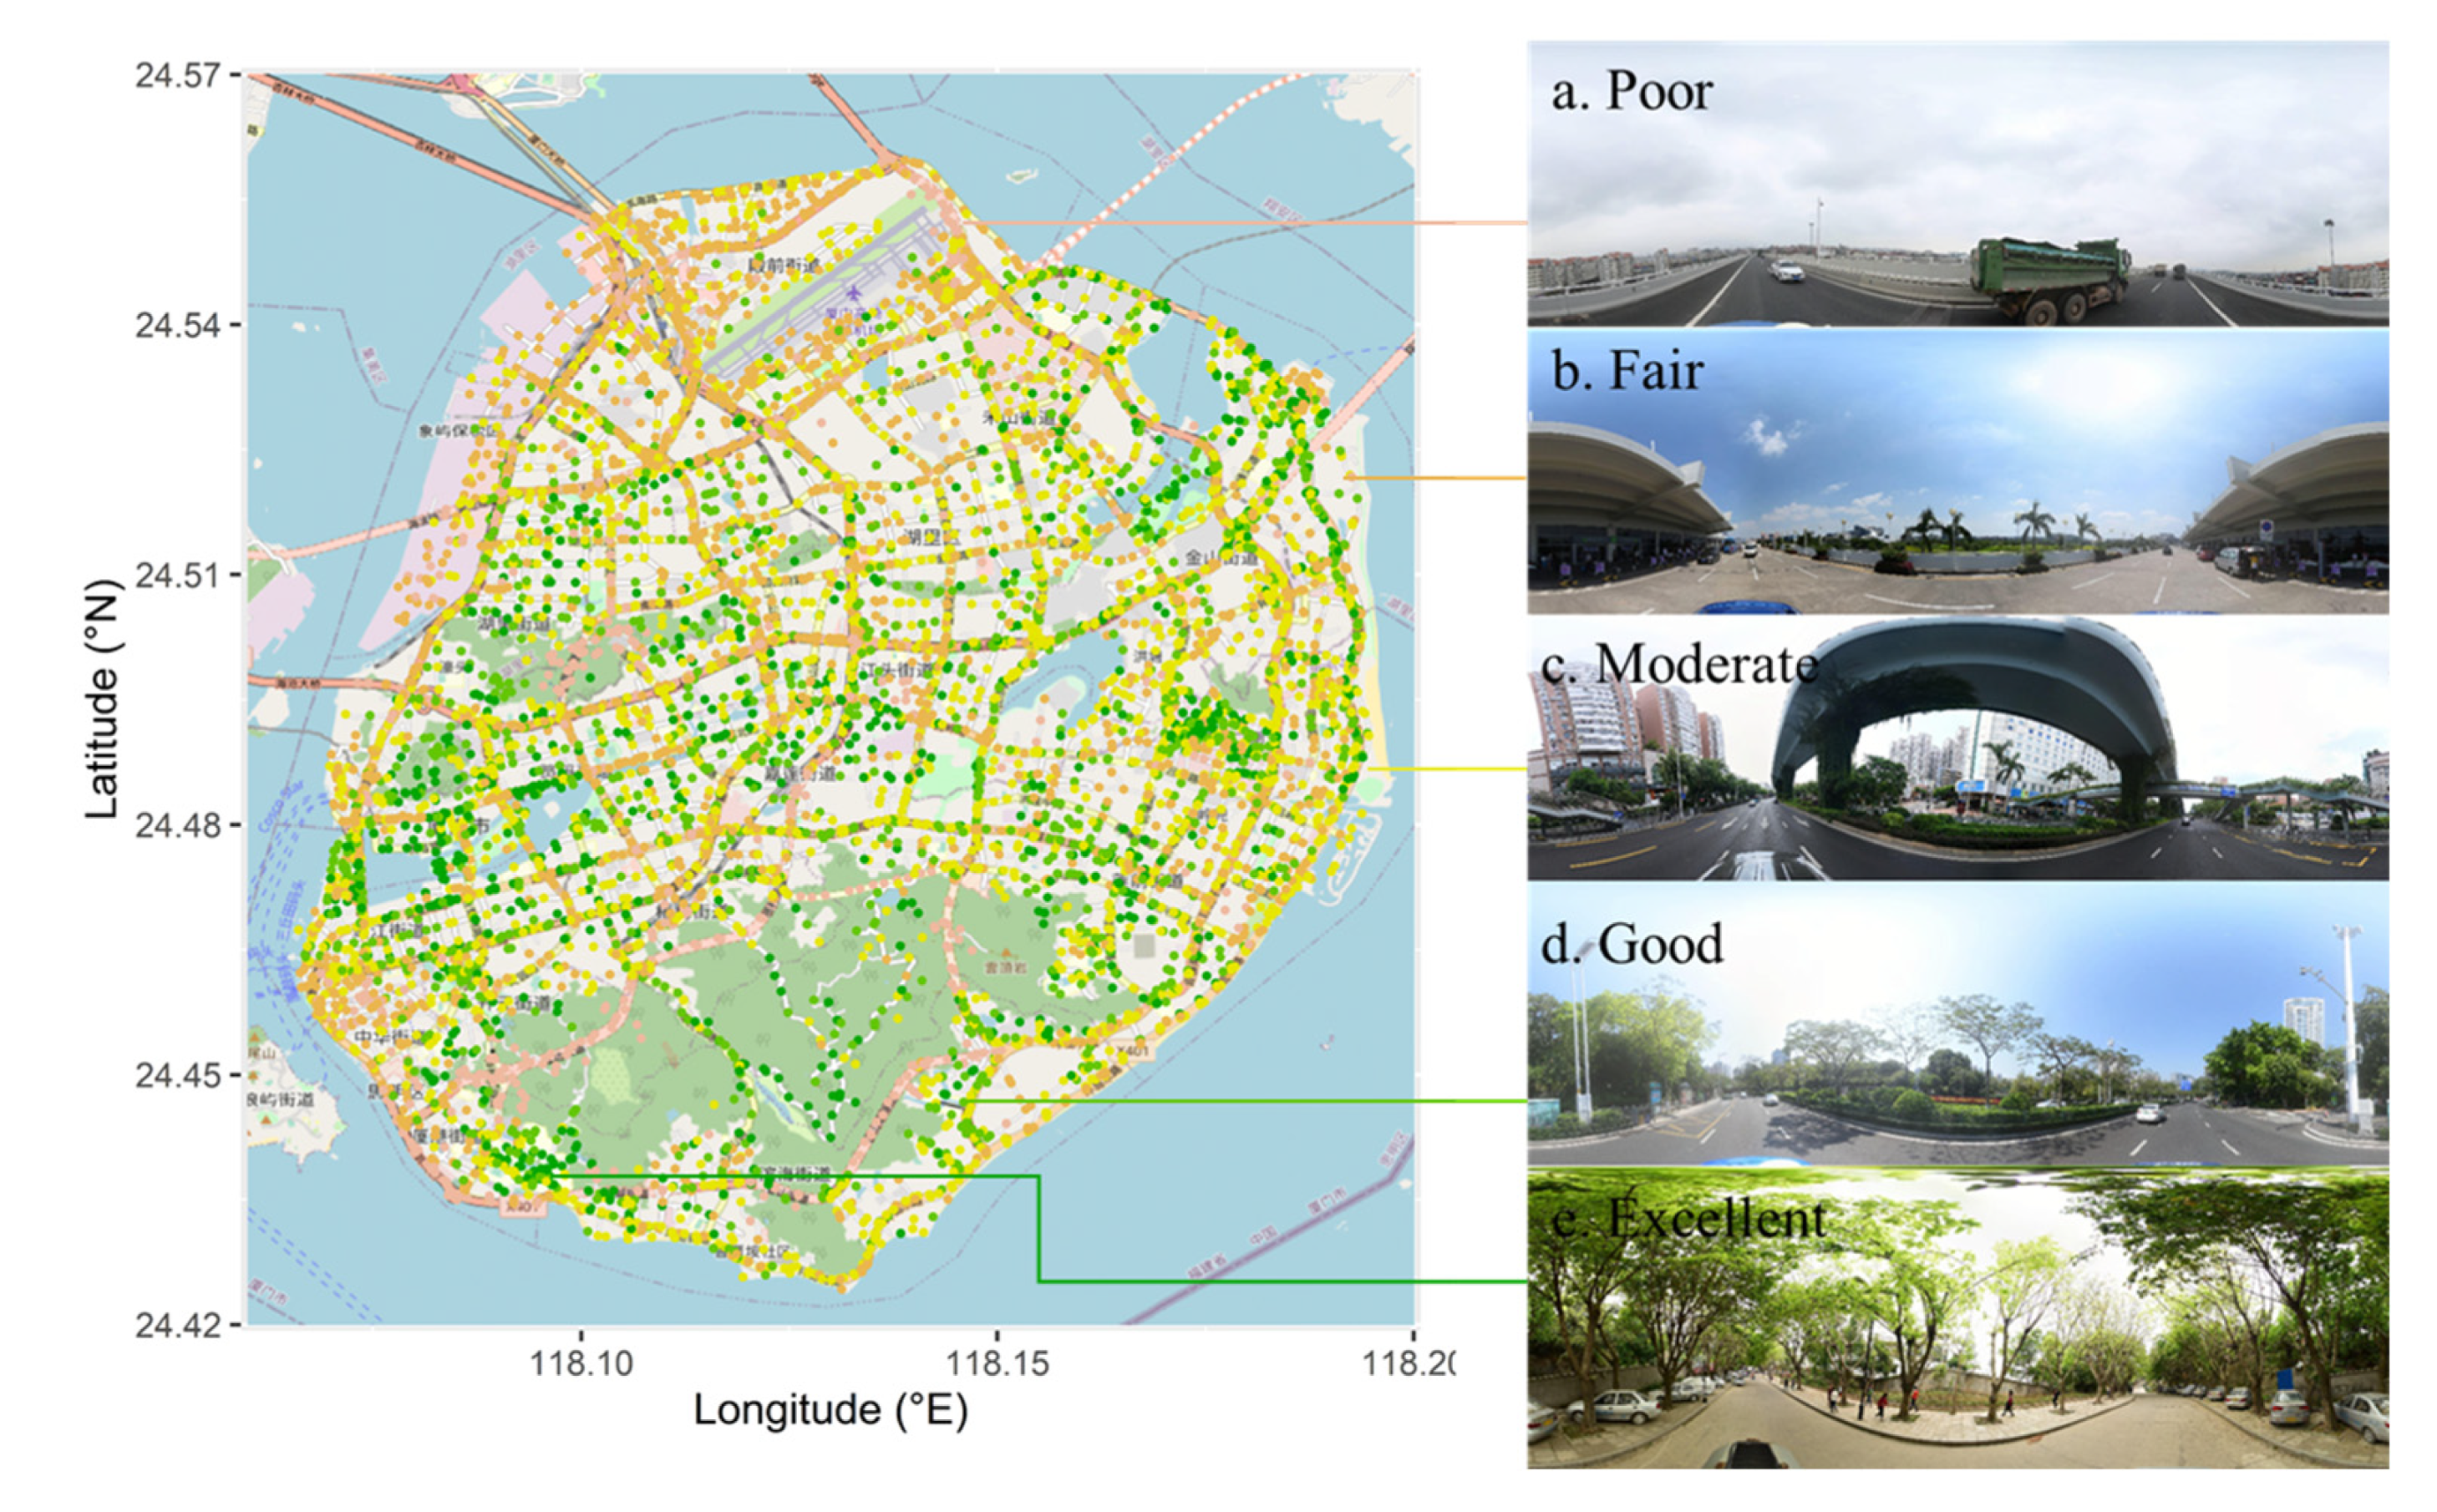
3.4. Verification of Street View Landscape Quality

The performance of the landscape quality in Xiamen Island was evaluated with an expert scoring method. In this study, we invited 20 related professional urban-planning and design experts, and 10 people with no related subject background to verify our automatic generated results. To ensure the verification result was objective, scientific and high-robust, we randomly selected 880 (~10% of total points) street-landscape points as our verification sample database. Additionally, the sample quantity was determined by the sample-rating quantity proportion. The verification results show that the accuracy of the street-landscape quality is 80.56%, and the standard deviation is 0.08, which means the results have a high accuracy for quantifying street-landscape quality (Figure 12).

4. Discussion

4.1. Quantifying Urban Street Quality at City Scale

Investigating the current status of urban-landscape quality is key preparation for identifying further urban-landscape quality improvement. Timely and accurate access to urban status will also help following urban renewal. Since many big cities in China have undergone large-scale urbanization, the increasement of new urban development will decrease year by year, and the construction of future big cities will pay attention to renewing the older urban areas. However, such an investigation may require a huge budget and well-trained investigators to collect local street status at city scale, especially in larger cities such as Beijing, Shanghai or Shenzhen. To solve this problem, our paper integrated deep-learning and landscape-ecology methods and provided a systemic and automatic framework for urban-street quality quantifying at city scale. This framework has great potential to be used on a larger scale due to its accessibility and easy deployment. Using street-view images to quantify the urban-street quality can lower the field survey costs from institution.
A series of urban construction planning projects have been designed and implemented at the city level in China. Previous studies often pay more attention to urban function or macroscopical landscape planning, while street-view designing and planning at city scale tends to be ignored, resulting in part of the street landscape not being ecological or friendly. Our proposed method could quantify urban-street quality at city scale, which can provide a supportive information for further urban construction, designing and planning.

4.2. Inspirations for Further Urban Construction

China has experienced unprecedented urbanization processing, which has transported hundreds of millions of people from rural to urban, and the urbanization rate has increased to 60.6% in 2020, while it was 17.92% in 1978. Such a rapid urbanization process inevitably caused the urban environment to become unfriendly due to the fact that some advanced urban-design concepts are not suited to local urban development [46]. According to previous studies [47,48], areas with better landscape quality had lower adult mortality, fewer premature babies and produced good achievements at schools. Although the detailed mechanisms about how ecological landscape connects with human health were not revealed clearly, we still had common sense telling us that people had a good quality of life when they lived closely with higher quality ecological landscape [47]. Nowadays, some areas built-up long ago may need to improve their landscape quality for better human well-being. In our study, we figured out a series meaningful information and suggestions for further urban construction. The LPI for green spaces has the largest weight in the quantifying framework; it has a negative correlation with LPI and PLAND, while having a positive value with LSI for sky spaces. It means that the blue and green spaces battle for occupied contribution of street landscape in Xiamen. It suggests that we can build more green infrastructure until the green spaces could cover a part of sky spaces. In this way, the PLAND and LPI for green, and the LSI for sky spaces will increase and the ecological-landscape quality will reach a high level [49]. Additionally, the roads on the ring of Xiamen Island generally have lower-level street quality due to its simplex landscape and low occurrence of green spaces. The landscapes in these regions have more open sky but the green infrastructure is not enough. We suggest that the manager could improve landscape quality in these places by building various Parthenocissus vegetations along the roads [50,51]. Finally, we want to address the older urbanized area with high street quality in the southwestern of Xiamen Island. There is a lot of low height and crowded buildings concentrated, and green spaces are not ignored although the places are limited. This region is the best place for tourists due to its unique culture background, and its street landscape is well designed. Further, considering that the street-view images provided by the map service supporters will be continuously updated, an effective management system with nearly real-time updating images can be developed and support local urban construction at the city scale [38].

4.3. Limitations and Future Work

This study also has limitations; we think these shortcomings can be solved by future interdisciplinary research. The first limitation is the data source of street-view imagery. The street-view images acquired in this study are panoramas by Baidu Street View (BSV), and these images are collected by the BSV cars. These images have wide spatial distribution in Xiamen Island, but the qualities of the images are different due to the variations from weather and photographic lighting. This limitation can be solved while more photographic date information can be provided in the BSV images, and then the image qualities can be normalized by advanced computer version algorithm [38]. Second, the weights for assessing the quality of the street landscape may inevitably need to be reconsidered. In this study, we used the EWM to generate weights for each ecological indicator. However, this calculation method is based on the degree of uncertainty of the system and the simplest demand of human beings for the ecological landscape. Due to human needs for ecological landscapes in different periods and moods, the emotional feedback generated may vary greatly. Only considering the uncertainty of the landscape ecosystem and not involving more people’s feelings may cause this assessment to have a lot of uncertainty [52,53]. Therefore, the mechanism of impact on people during the interaction between the environment and people requires in-depth understanding in order to dig out its corresponding model, which needs the emerging science, such as exposome, and related subjects, such as remote-sensing, to equip more advanced measures and achieve deep insight for urban ecosystems [30].
Urban-street quality is an important factor that could estimate resident’s health conditions. Our research is a preliminary exploration and provided a framework to quantify street quality by integrating deep-learning and landscape ecology. In this study, we mapped the distribution of street quality and analyzed the characteristics of the poor-quality areas in Xiamen Island. Additionally, we took up a series of suggestions that could improve the street quality for poor areas. This study provided a meaningful reference for further wider urban-street quality studies and a series of related studies could be carried out, which would enable us to explore the environmental exposome of residents in order to bring more well-being for people.

5. Conclusions

In this study, a systemic and automatic framework to quantify urban-street quality was proposed based on deep-learning and landscape ecology. The ELQI was estimated as an indicator integrating ecological landscape indicators and landscape diversity for describing the urban-street quality in a street-view image. This framework also provides a weighting system by the EWM. According to our results, we discovered the ring of Xiamen Island had relatively lower street quality, and a series of excellent and poor agglomerations were also identified in Xiamen Island. We think this study is an attempt to quantify urban-street quality at the city scale, providing a series of meaningful information for further urban design and planning in Xiamen Island. This framework can be deployed conveniently in other large cities around the world, filling in the gaps in this field and will help their managers to improve local street qualities for achieving related sustainable development goals. At the same time, we applied the mechanism of impact on people during the interaction with the environment, and people should be taken into greater consideration for achieving further environmental exposome, deep understanding and thinking.

Author Contributions

Conceptualization; Formal analysis; Investigation; Methodology; Resource; Software; Validation; Visualization; Writing—original draft; Writing—review and editing, D.W. and M.L.; Supervision; Writing—review and editing, D.W. and Z.Y. All authors have read and agreed to the published version of the manuscript.

Funding

This research was funded by the National Natural Science Foundation of China (grant number: 42171093), Scientific and Innovative Action Plan of Shanghai (grant number: 21ZR1408500), Shanghai Pujiang Program (grant number: 21PJ1401600), Shanghai Key Lab for Urban Ecological Processes and Eco-Restoration (grant number: SHUES2021A02).

Data Availability Statement

Not applicable.

Acknowledgments

We would like to thank editor and anonymous referees for their constructive suggestions and comments that helped to improve the quality of this paper. We would also thank Wenxi Tang for her suggestions in the primary manuscript.

Conflicts of Interest

The authors declare no conflict of interest.

Appendix A

X = A 1 X X m i n X m a x X m i n A 2 X m a x X X m a x X m i n
where X is the original data, and X′ is the data after normalization; Xmax is the maximum value of the original data, Xmin is the minimum value of the original data. (A1) is the positive processing while the (A2) is the negative processing.

References

  1. Jiang, H.; Sun, Z.; Guo, H.; Weng, Q.; Du, W.; Xing, Q.; Cai, G. An assessment of urbanization sustainability in China between 1990 and 2015 using land use efficiency indicators. NPJ Urban Sustain. 2021, 1, 34. [Google Scholar] [CrossRef]
  2. United Nations Department of Economic and Social Affairs. World Urbanization Prospects: The 2018 Revision; United Nations Department of Economic and Social Affairs: New York, NY, USA, 2019. [Google Scholar]
  3. Sun, L.; Chen, J.; Li, Q.; Huang, D. Dramatic uneven urbanization of large cities throughout the world in recent decades. Nat. Commun. 2020, 11, 5366. [Google Scholar] [CrossRef] [PubMed]
  4. Shuai, C.; Yu, L.; Chen, X.; Zhao, B.; Qu, S.; Zhu, J.; Liu, J.; Miller, S.A.; Xu, M. Principal indicators to monitor sustainable development goals. Environ. Res. Lett. 2021, 16, 124015. [Google Scholar] [CrossRef]
  5. Bettencourt, L.M.A.; Lobo, J.; Helbing, D.; Kühnert, C.; West, G.B. Growth, innovation, scaling, and the pace of life in cities. Proc. Natl. Acad. Sci. USA 2007, 104, 7301. [Google Scholar] [CrossRef] [PubMed] [Green Version]
  6. Bloom David, E.; Canning, D.; Fink, G. Urbanization and the Wealth of Nations. Science 2008, 319, 772–775. [Google Scholar] [CrossRef] [PubMed] [Green Version]
  7. Strano, E.; Simini, F.; De Nadai, M.; Esch, T.; Marconcini, M. The agglomeration and dispersion dichotomy of human settlements on Earth. Sci. Rep. 2021, 11, 23289. [Google Scholar] [CrossRef]
  8. Wu, J. Landscape sustainability science (II): Core questions and key approaches. Landsc. Ecol. 2021, 36, 2453–2485. [Google Scholar] [CrossRef]
  9. Remme, R.P.; Frumkin, H.; Guerry, A.D.; King, A.C.; Mandle, L.; Sarabu, C.; Bratman, G.N.; Giles-Corti, B.; Hamel, P.; Han, B.; et al. An ecosystem service perspective on urban nature, physical activity, and health. Proc. Natl. Acad. Sci. USA 2021, 118, e2018472118. [Google Scholar] [CrossRef]
  10. Song, Y.; Chen, B.; Ho, H.C.; Kwan, M.-P.; Liu, D.; Wang, F.; Wang, J.; Cai, J.; Li, X.; Xu, Y.; et al. Observed inequality in urban greenspace exposure in China. Environ. Int. 2021, 156, 106778. [Google Scholar] [CrossRef]
  11. Pataki, D.E.; Alberti, M.; Cadenasso, M.L.; Felson, A.J.; McDonnell, M.J.; Pincetl, S.; Pouyat, R.V.; Setälä, H.; Whitlow, T.H. The Benefits and Limits of Urban Tree Planting for Environmental and Human Health. Front. Ecol. Evol. 2021, 9. [Google Scholar] [CrossRef]
  12. Keeler, B.L.; Hamel, P.; McPhearson, T.; Hamann, M.H.; Donahue, M.L.; Meza Prado, K.A.; Arkema, K.K.; Bratman, G.N.; Brauman, K.A.; Finlay, J.C.; et al. Social-ecological and technological factors moderate the value of urban nature. Nat. Sustain. 2019, 2, 29–38. [Google Scholar] [CrossRef]
  13. Wang, R.; Feng, Z.; Pearce, J.; Zhou, S.; Zhang, L.; Liu, Y. Dynamic greenspace exposure and residents’ mental health in Guangzhou, China: From over-head to eye-level perspective, from quantity to quality. Landsc. Urban Plan. 2021, 215, 104230. [Google Scholar] [CrossRef]
  14. Markevych, I.; Schoierer, J.; Hartig, T.; Chudnovsky, A.; Hystad, P.; Dzhambov, A.M.; de Vries, S.; Triguero-Mas, M.; Brauer, M.; Nieuwenhuijsen, M.J.; et al. Exploring pathways linking greenspace to health: Theoretical and methodological guidance. Environ. Res. 2017, 158, 301–317. [Google Scholar] [CrossRef]
  15. Gao, P. The Exposome in the Era of One Health. Environ. Sci. Technol. 2021, 55, 2790–2799. [Google Scholar] [CrossRef]
  16. Labib, S.M.; Lindley, S.; Huck, J.J. Spatial dimensions of the influence of urban green-blue spaces on human health: A systematic review. Environ. Res. 2020, 180, 108869. [Google Scholar] [CrossRef]
  17. Wang, R.; Helbich, M.; Yao, Y.; Zhang, J.; Liu, P.; Yuan, Y.; Liu, Y. Urban greenery and mental wellbeing in adults: Cross-sectional mediation analyses on multiple pathways across different greenery measures. Environ. Res. 2019, 176, 108535. [Google Scholar] [CrossRef] [Green Version]
  18. Yang, B.-Y.; Zhao, T.; Hu, L.-X.; Browning, M.H.E.M.; Heinrich, J.; Dharmage, S.C.; Jalaludin, B.; Knibbs, L.D.; Liu, X.-X.; Luo, Y.-N.; et al. Greenspace and human health: An umbrella review. Innovation 2021, 2, 100164. [Google Scholar] [CrossRef]
  19. WHO. Green and Blue Spaces and Mental Health: New Evidence and Perspectives for Action; WHO: Geneva, Switzerland, 2021.
  20. Wang, R.; Feng, Z.; Pearce, J.; Yao, Y.; Li, X.; Liu, Y. The distribution of greenspace quantity and quality and their association with neighbourhood socioeconomic conditions in Guangzhou, China: A new approach using deep learning method and street view images. Sustain. Cities Soc. 2021, 66, 102664. [Google Scholar] [CrossRef]
  21. Larkin, A.; Gu, X.; Chen, L.; Hystad, P. Predicting perceptions of the built environment using GIS, satellite and street view image approaches. Landsc. Urban Plan. 2021, 216, 104257. [Google Scholar] [CrossRef]
  22. Ito, K.; Biljecki, F. Assessing bikeability with street view imagery and computer vision. Transp. Res. Part C Emerg. Technol. 2021, 132, 103371. [Google Scholar] [CrossRef]
  23. Sun, Y.; Wang, X.; Zhu, J.; Chen, L.; Jia, Y.; Lawrence, J.M.; Jiang, L.-h.; Xie, X.; Wu, J. Using machine learning to examine street green space types at a high spatial resolution: Application in Los Angeles County on socioeconomic disparities in exposure. Sci. Total Environ. 2021, 787, 147653. [Google Scholar] [CrossRef]
  24. Ye, Y.; Richards, D.; Lu, Y.; Song, X.; Zhuang, Y.; Zeng, W.; Zhong, T. Measuring daily accessed street greenery: A human-scale approach for informing better urban planning practices. Landsc. Urban Plan. 2019, 191, 103434. [Google Scholar] [CrossRef]
  25. Ibrahim, M.R.; Haworth, J.; Cheng, T. Understanding cities with machine eyes: A review of deep computer vision in urban analytics. Cities 2020, 96, 102481. [Google Scholar] [CrossRef]
  26. Badrinarayanan, V.; Kendall, A.; Cipolla, R. SegNet: A Deep Convolutional Encoder-Decoder Architecture for Image Segmentation. IEEE Trans. Pattern Anal. Mach. Intell. 2017, 39, 2481–2495. [Google Scholar] [CrossRef]
  27. Chen, L.C.; Papandreou, G.; Kokkinos, I.; Murphy, K.; Yuille, A.L. DeepLab: Semantic Image Segmentation with Deep Convolutional Nets, Atrous Convolution, and Fully Connected CRFs. IEEE Trans. Pattern Anal. Mach. Intell. 2018, 40, 834–848. [Google Scholar] [CrossRef] [Green Version]
  28. Zuurbier, M.; van Loenhout, J.A.F.; le Grand, A.; Greven, F.; Duijm, F.; Hoek, G. Street temperature and building characteristics as determinants of indoor heat exposure. Sci. Total Environ. 2021, 766, 144376. [Google Scholar] [CrossRef]
  29. Zhou, H.; He, S.; Cai, Y.; Wang, M.; Su, S. Social inequalities in neighborhood visual walkability: Using street view imagery and deep learning technologies to facilitate healthy city planning. Sustain. Cities Soc. 2019, 50, 101605. [Google Scholar] [CrossRef]
  30. Weichenthal, S.; Hatzopoulou, M.; Brauer, M. A picture tells a thousand…exposures: Opportunities and challenges of deep learning image analyses in exposure science and environmental epidemiology. Environ. Int. 2019, 122, 3–10. [Google Scholar] [CrossRef]
  31. Pamukcu-Albers, P.; Ugolini, F.; La Rosa, D.; Grădinaru, S.R.; Azevedo, J.C.; Wu, J. Building green infrastructure to enhance urban resilience to climate change and pandemics. Landsc. Ecol. 2021, 36, 665–673. [Google Scholar] [CrossRef]
  32. Li, X.; Zhang, C.; Li, W.; Ricard, R.; Meng, Q.; Zhang, W. Assessing street-level urban greenery using Google Street View and a modified green view index. Urban For. Urban Green. 2015, 14, 675–685. [Google Scholar] [CrossRef]
  33. Chen, L.; Lu, Y.; Sheng, Q.; Ye, Y.; Wang, R.; Liu, Y. Estimating pedestrian volume using Street View images: A large-scale validation test. Comput. Environ. Urban Syst. 2020, 81, 101481. [Google Scholar] [CrossRef]
  34. Fang, L.; Huang, J.; Zhang, Z.; Nitivattananon, V. Data-driven framework for delineating urban population dynamic patterns: Case study on Xiamen Island, China. Sustain. Cities Soc. 2020, 62, 102365. [Google Scholar] [CrossRef]
  35. Liu, C.; Yang, M. An empirical analysis of dynamic changes in ecological sustainability and its relationship with urbanization in a coastal city: The case of Xiamen in China. J. Clean. Prod. 2020, 256, 120482. [Google Scholar] [CrossRef]
  36. Boeing, G. OSMnx: New methods for acquiring, constructing, analyzing, and visualizing complex street networks. Comput. Environ. Urban Syst. 2017, 65, 126–139. [Google Scholar] [CrossRef] [Green Version]
  37. Cordts, M.; Omran, M.; Ramos, S.; Rehfeld, T.; Enzweiler, M.; Benenson, R.; Franke, U.; Roth, S.; Schiele, B. The cityscapes dataset for semantic urban scene understanding. In Proceedings of the IEEE Conference on Computer Vision and Pattern Recognition, Las Vegas, NV, USA, 27–30 June 2016; pp. 3213–3223. [Google Scholar]
  38. Zhong, T.; Ye, C.; Wang, Z.; Tang, G.; Zhang, W.; Ye, Y. City-Scale Mapping of Urban Façade Color Using Street-View Imagery. Remote Sens. 2021, 13, 1591. [Google Scholar] [CrossRef]
  39. Sowińska-Świerkosz, B.; Michalik-Śnieżek, M. The Methodology of Landscape Quality (LQ) Indicators Analysis Based on Remote Sensing Data: Polish National Parks Case Study. Sustainability 2020, 12, 2810. [Google Scholar] [CrossRef] [Green Version]
  40. Uuemaa, E.; Antrop, M.; Roosaare, J.; Marja, R.; Mander, Ü. Landscape metrics and indices: An overview of their use in landscape research. Living Rev. Landsc. Res. 2009, 3, 1–28. [Google Scholar] [CrossRef]
  41. Sowińska-Świerkosz, B.; Wójcik-Madej, J.; Michalik-Śnieżek, M. An Assessment of the Ecological Landscape Quality (ELQ) of Nature-Based Solutions (NBS) Based on Existing Elements of Green and Blue Infrastructure (GBI). Sustainability 2021, 13, 1674. [Google Scholar] [CrossRef]
  42. Fei, W.; Zhao, S. Urban land expansion in China’s six megacities from 1978 to 2015. Sci. Total Environ. 2019, 664, 60–71. [Google Scholar] [CrossRef]
  43. Hesselbarth, M.H.K.; Sciaini, M.; With, K.A.; Wiegand, K.; Nowosad, J. landscapemetrics: An open-source R tool to calculate landscape metrics. Ecography 2019, 42, 1648–1657. [Google Scholar] [CrossRef] [Green Version]
  44. Song, H.; Lu, B.; Ye, C.; Li, J.; Zhu, Z.; Zheng, L. Fraud vulnerability quantitative assessment of Wuchang rice industrial chain in China based on AHP-EWM and ANN methods. Food Res. Int. 2021, 140, 109805. [Google Scholar] [CrossRef] [PubMed]
  45. Forman, R.T. Some general principles of landscape and regional ecology. Landsc. Ecol. 1995, 10, 133–142. [Google Scholar] [CrossRef]
  46. Yanru, H.; Masoudi, M.; Chadala, A.; Olszewska-Guizzo, A. Visual Quality Assessment of Urban Scenes with the Contemplative Landscape Model: Evidence from a Compact City Downtown Core. Remote Sens. 2020, 12, 3517. [Google Scholar] [CrossRef]
  47. Opdam, P. Implementing human health as a landscape service in collaborative landscape approaches. Landsc. Urban Plan. 2020, 199, 103819. [Google Scholar] [CrossRef]
  48. Bieling, C.; Plieninger, T.; Pirker, H.; Vogl, C.R. Linkages between landscapes and human well-being: An empirical exploration with short interviews. Ecol. Econ. 2014, 105, 19–30. [Google Scholar] [CrossRef] [Green Version]
  49. Chmielewski, S.; Bochniak, A.; Natapov, A.; Wężyk, P. Introducing GEOBIA to Landscape Imageability Assessment: A Multi-Temporal Case Study of the Nature Reserve “Kózki”, Poland. Remote Sens. 2020, 12, 2792. [Google Scholar] [CrossRef]
  50. Wong, I.; Baldwin, A.N. Investigating the potential of applying vertical green walls to high-rise residential buildings for energy-saving in sub-tropical region. Build. Environ. 2016, 97, 34–39. [Google Scholar] [CrossRef]
  51. Zhang, L.; Deng, Z.; Liang, L.; Zhang, Y.; Meng, Q.; Wang, J.; Santamouris, M. Thermal behavior of a vertical green facade and its impact on the indoor and outdoor thermal environment. Energy Build. 2019, 204, 109502. [Google Scholar] [CrossRef]
  52. Siroux, V.; Agier, L.; Slama, R. The exposome concept: A challenge and a potential driver for environmental health research. Eur. Respir. Rev. 2016, 25, 124. [Google Scholar] [CrossRef] [Green Version]
  53. Vermeulen, R.; Schymanski Emma, L.; Barabási, A.-L.; Miller Gary, W. The exposome and health: Where chemistry meets biology. Science 2020, 367, 392–396. [Google Scholar] [CrossRef]
Figure 1. The workflow in this study.
Remotesensing 14 03360 g001
Figure 2. The location of the study area in this research. The left image is the study area location in China; the middle image is the Xiamen city location in Fujian province; and the right image is the Xiamen Island.
Remotesensing 14 03360 g002
Figure 3. The distribution of collected sampling points in Xiamen Island.
Remotesensing 14 03360 g003
Figure 4. An example to illustrate the performance of street view images and semantic segmentation.
Remotesensing 14 03360 g004
Figure 5. The spatial and density distribution for ecological landscape indicators, (a) for PLAND and (b) for LPI.
Remotesensing 14 03360 g005
Figure 6. The spatial and density distribution for ecological landscape indicators, (a) for LSI and (b) for FRAC.
Remotesensing 14 03360 g006
Figure 7. The spatial and density distribution for ecological landscape indicators; (a) for AI and (b) for DIVISION.
Remotesensing 14 03360 g007
Figure 8. The relationships between different landscape indicator.
Remotesensing 14 03360 g008
Figure 9. The estimated weights by the EWM in this study.
Remotesensing 14 03360 g009
Figure 10. The landscape diversity estimated by the SHDI. The (left) is the spatial distribution and (right) is its density.
Remotesensing 14 03360 g010
Figure 11. The spatial (left) and density (right) distribution for ecological landscape quality values and classes.
Remotesensing 14 03360 g011
Figure 12. Randomly selected 5 locations to illustrate landscape quality in Xiamen Island.
Remotesensing 14 03360 g012
Table 1. The definitions of landscape types in this study.
NameTypeLandscapes
Green spacesEcological landscapeTree, shrubland
Sky spacesEcological landscapesky
Gray spacesAnti-ecological landscapeBuilding, road
Table 2. Calculated landscape metrics.
AbbreviationFull NameFormulasUnit
PLANDPercentage of landscape
occupied by a given class
P L A N D = j = 1 n a i j A × 100 %
LPILargest patch index L P I = max j = 1 a i j A × 100 %
AIAggregation index A I = g i i max g i i × 100 %
DIVISIONDivision index D I V I S I O N = ( 1 j = 1 n ( a i j A ) 2 ) × 100 %
FRAC_MNMean fractal dimension index F R A C M N = m e a n ( j = 1 n 2   ln ( 0.25 p i j ) ln a i j × 100 ) -
LSILandscape shape index L S I = e i min e i -
SHDIShannon’s diversity index S H D I = i = 1 m ( P i × ln P i ) -
Where a i j is the area of each patch, A is the total landscape area, p i j is the perimeter, e i is the total edge length in cell surfaces, and P i is the proportion of the i landscape.
Publisher’s Note: MDPI stays neutral with regard to jurisdictional claims in published maps and institutional affiliations.

