Article

Satellite Observation of the Long-Term Dynamics of Particulate Organic Carbon in the East China Sea Based on a Hybrid Algorithm

1
Ocean College, Zhejiang University, Zhoushan 316021, China
2
Interdisciplinary Student Training Platform for Marine Areas, Zhejiang University, Hangzhou 310027, China
*
Author to whom correspondence should be addressed.
Remote Sens. 2022, 14(13), 3220; https://doi.org/10.3390/rs14133220
Submission received: 16 May 2022 / Revised: 24 June 2022 / Accepted: 1 July 2022 / Published: 4 July 2022
(This article belongs to the Special Issue Seawater Bio-Optical Characteristics from Satellite Ocean Color Data)

Abstract

:
The distribution pattern and flux variation of POC in the continental shelf seas are essential for understanding the carbon cycle in marginal seas. The hydrodynamic environment and complicated estuarine processes in the East China Sea result in challenging estimates and substantial spatio-temporal variability in terms of POC concentrations. A hybrid retrieval model based on the mutual combination of the color index algorithm (CIPOC) and the empirical band ratio algorithm was applied in this study to effectively and dynamically monitor the surface POC concentration in the East China Sea in a long-term series for the first time using MODIS/Aqua remote sensing satellite data from 2003 to 2020. A hybrid retrieval model based on the mutual combination of the color index algorithm (CIPOC) and the empirical band ratio algorithm was applied in this study. The MODIS/Aqua remote sensing satellite data from 2003 to 2020 were employed for the first time to dynamically monitor the surface POC concentrations in the East China Sea for a long time series. The results demonstrated that the performance (R2 = 0.84, RMSE = 156.14 mg/m3, MAPE = 43.30%, bias = −64.79 mg/m3) exhibited by this hybrid retrieval algorithm confirms the usability of inversion studies of surface POC in the East China Sea. Different drivers such as river discharge, phytoplankton, wind, and the sea surface current field jointly influence the spatial and temporal distribution of POC concentrations in the East China Sea. This paper also verifies that the hybrid algorithm can be applied to retrieval tasks for POC in different seas with similar optical properties to the waters of the East China Sea. In conclusion, the long-term series East China Sea POC data record, which was established based on MODIS/Aqua, provides supplementary information for in-situ sampling, which will aid the long-term monitoring of POC fluxes in shelf seas. At the same time, it has also improved our understanding of the transport and spatio-temporal variability of POC in the East China Sea, enhancing our comprehension of the impact of POC on environmental changes and carbon cycling in marginal seas.

Graphical Abstract

1. Introduction

Particulate organic carbon (POC) is a crucial component of organic matter in the water column [1] and an essential portion of the ocean carbon cycle, participating in various biogeochemical processes and influencing organic and inorganic carbon cycles [2,3,4,5]. Although shelf seas account for less than 10% of the global ocean, they also play a crucial role in the global carbon cycle [6]. As the border between the East Asian continent and the Pacific Ocean, the East China Sea shelf is an area with a very active carbon cycle [7] and one of the most productive marginal seas in the world [8,9]. On the one hand, obtaining the distribution pattern of POC in the East China Sea can help us understand the potential size of POC as a form of carbon storage. On the other hand, it can help to clarify the spatial and temporal characteristics and drivers of organic carbon in the East China Sea and deepen our understanding of the role played by particulate organic carbon within the carbon cycle. Therefore, studying POC in the East China Sea is vital to understand the global ocean carbon cycle.
Unfortunately, the spatial and temporal variability of POC content in the East China Sea has not been fully characterized due to sparse conventional oceanographic sampling. In contrast, satellite remote sensing is labor-saving, has extensive coverage, and can be observed for long periods, providing a unique method for monitoring marine POC and a beneficial alternative tool for exploring the long-term dynamics of POC [10]. Since the first POC remote sensing retrieval algorithm by Stramski [11], many empirical and semi-analytical algorithms have been utilized to estimate ocean surface POC concentrations [6,12,13,14,15,16,17,18,19,20]. Although these algorithms provide reasonable estimates of POC in waters at regional or global scales, they perform poorly when applied to complex optical properties in waters or coastal waters with numerous POC sources [17,19]. In addition, IOP observations are not available for many coastal waters, which hinders the development, validation, and application of IOP-based algorithms [21].
Large-scale mapping of POC concentrations in coastal waters is challenging due to the lack of stable estimation inversion models for complex waters with multiple POC origins. Le [21] created an ocean color index method (CIPOC) for the retrieval of POC concentrations in the global open ocean and coastal waters based on absorption coefficients of waters (three-band difference) with robust application to minimize redundant noise effects and enhance algorithm performance. Nevertheless, the algorithm still has significant uncertainties, particularly in turbid and complex coastal water environments. To this end, a hybrid retrieval model is proposed to accurately estimate POC concentrations in turbid waters using a simple water classification method based on the different optical properties of waters in this study. This study investigates the applicability and transferability of the hybrid inversion model for retrieving sea surface POC in coastal waters with complex optical properties and explores the mechanism of POC dynamics. In this paper, we collected measured POC data, matched remote sensing images in the East China Sea, and applied the constructed hybrid retrieval algorithm to the East China Sea. The spatial distribution and annual variation of POC in the East China Sea from 2003 to 2020 are revealed for the first time in a long-term series.
The results not only validate the fantastic performance and applicability of the hybrid algorithm for POC inversion in coastal waters but also demonstrate the potential of MODIS/Aqua remote sensing data for the long-term series monitoring of POC concentrations in the surface layer of the East China Sea. The achievement also provides a basis for further applications in other coastal waters. At the same time, the main drivers affecting the distribution pattern of POC in the sea were investigated, and our understanding of the future POC concentration and flux variation and the carbon cycle in the East China Sea was strengthened.

2. Dataset and Methods

2.1. Study Area and Field Measurements

The East China Sea, located east of mainland China, is one of the most productive marginal seas on Earth [9] and receives a substantial supply of terrigenous material imported from large rivers such as the Changjiang and Qiantang [8,22,23,24]. In addition, the East China Sea is a highly variable marine ecosystem where different water masses introduced or discharged by the Kuroshio Current, Taiwan warm current, Northern Jiangsu current, and Zhejiang-Fujian coastal current intersect and interact, resulting in complex optical properties and significant seasonal variations in water quality parameters in this region [25]. In this paper, field surveys of four cruises in the East China Sea were conducted from May to June 2014, July–August 2017, and May–September 2019 (as illustrated in Figure 1A,B), respectively, and a total of 120 sample points were collected for the development and verification of the inversion model. Another different bio-optical dataset (N = 33) was collected in the Chaoshan sea area (as demonstrated in Figure 1C) from June to July 2021 to verify the migration ability of the POC retrieval model under different water optical conditions.

2.2. Satellite Data

MODIS/Aqua’s Rrs products were downloaded from the NASA website (http://oceancolor.gsfc.nasa.gov/ (accessed on 10 September 2021). Based on the SeaWiFS Data Analysis System software (SeaDAS, version 8.0, NASA Ocean Biology Processing Group, Greenbelt, MD, USA), the remote sensing data were reprocessed utilizing the latest calibration coefficients and algorithms (Version 2018.0, NASA Ocean Biology Processing Group, Greenbelt, MD, USA) and extracted Rrs of position and time matching the in-situ POC. Due to the preciousness of the measured data, a time gap of ±5 days was used to match satellite data. The median value of a 3 × 3 window centered on each sampling point was substituted for the pixel value of the corresponding sampling point to filter the satellite sensors and remote sensing algorithm’s noise. Analysis and comparisons between in-situ POC and satellite-derived POC were only made when the number of valid pixels (i.e., after discarding the pixels that failed quality control flags) in the box was >4 and the coefficient of variation (CV) among pixel values was <0.4 [26]. A total of 79 satellite remote sensing reflectance datasets matched with in-situ measured samples were filtered for MODIS/Aqua (as shown in Figure 1a,b), which were employed to establish the POC time series for 18 years between 2003 and 2020. Another 15 MODIS/Aqua remote sensing reflectance datasets matched with in-situ measured data (as shown in Figure 1c) were observed near the Chaoshan sea area to prove the transferability of the POC remote sensing algorithm.

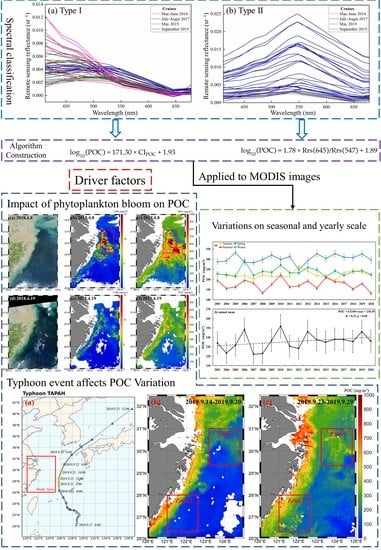
2.3. Classifying Waters and Building a Hybrid POC Algorithm

Hu [27] proposed an algorithm based on the difference in reflectance (i.e., color index algorithm) between the blue, green, and red bands to invert the surface chlorophyll-a concentration in nutrient-poor oceans. Considering the advantages of the CI algorithm in estimating chlorophyll-a and the inheritable correlation between chlorophyll-a and POC, Le [28] improved the algorithm based on the measured POC data collected on SeaBASS and the dataset matched by MODIS/Aqua, which retrieved the POC concentration of the global ocean. Aiming at the high uncertainty of remote sensing reflectance at 412 nm and 443 nm, a three-band difference algorithm (Equation 1) of 488 nm, 547 nm, and 678 nm was developed. The result demonstrates that the algorithm has an advantage over the traditional empirical band-ratio algorithm for inversion in open waters. For a more detailed description of the algorithm, please read [28]. The algorithm is expressed as follows:
CI POC = Rrs 547     Rrs 488 + 547     488 678     488   ×   Rrs 678     Rrs 488
where CI POC is the color index of POC, and Rrs ( x ) is the central wavelength at different bands in MODIS/Aqua. Despite the satisfactory performance of the CIPOC algorithm in inverting POC in oceanic waters, the algorithm still has significant uncertainties when targeting particularly complex coastal waters. The optical properties of the East China Sea exhibit significant differences from the estuary of the Changjiang River to the open ocean. As shown in Figure 1a,b, two distinct optical characteristics of the remote sensing reflectance spectra of the Changjiang River estuary and the East China Sea waters exist. The different optical properties of the waters were classified, and different forms of inversion models were constructed to meet the accuracy requirements. The Changjiang River releases enormous amounts of sediment and organic matter into the East China Sea. Under the dual influence of high sediment concentration and CDOM concentration, the Rrs spectra of the Changjiang estuary waters generally show a reflection peak at 547 nm. In contrast, the Rrs in the open waters of the East China Sea gradually decrease with increasing wavelengths. As demonstrated in Figure 2, using the unique patterns of these optical properties, this paper provides a simple classification of the different types of remote sensing reflectance into two major categories, as follows:
  type   I = Rrs 488     Rrs 547
type   II = Rrs 488   <   Rrs 547
A separate remote sensing inversion algorithm was developed based on the different Rrs types mentioned above in this study. The water column of type I (as illustrated in Figure 2a) exhibits typical open water characteristics, and therefore the CIPOC algorithm is employed. The continuous import of river plumes has contributed to the resuspension of sediments in the Changjiang estuary, creating a highly turbid sea area. The inability of phytoplankton-related particles to dominate the optical properties in this sea area will prevent the CIPOC algorithm, which was established based on the absorption coefficient of waters, from accurately estimating the POC concentration. For this reason, a band-ratio algorithm needs to be constructed to monitor the POC concentration in turbid water bodies such as the Changjiang estuary based on the empirical relationship between the measured data and the remote sensing reflectance (as shown in Figure 2b). In the process of algorithm construction, this study verified various band-ratio algorithms and found that Rrs(645)/Rrs(547) was the most suitable for measuring POC. A study by Le [29] demonstrated that the chlorophyll combination algorithm built based on this classification method is preferred over the existing chlorophyll ocean color algorithm. Therefore, a hybrid inversion model was constructed by combining the CIPOC algorithm and the empirical band-ratio algorithm for application in the East China Sea to verify the algorithm’s performance for estimating the retrieved POC concentrations in the shelf sea in this paper.

2.4. Environmental Datasets

This paper compares satellite-retrieved POC data with several environmental forcing variables, including the river discharge of the Changjiang River and chlorophyll-a concentration data. For major rivers in China, the Ministry of Water Resources of the People’s Republic of China (MWRC) conducts river discharge measurements at the corresponding hydrological stations of the rivers. It compiles a bulletin to be published on its official website (http://www.mwr.gov.cn/sj/#tjgb (accessed on 10 September 2021)) [10]. The monthly mean river discharge data from the most downstream non-tidal hydrographic station, Datong Station, published by the MWRC for 2003–2020 was used in this study to investigate how the Changjiang River’s flushing water influences the POC dynamics in the East China Sea. Considering that the study area is located near the mouth of the Changjiang River, ocean color satellite data usually overestimate chlorophyll-a concentrations in turbid coastal waters. Cui [30] evaluated satellite observations and in-situ measurements in the turbid coastal waters of the Bohai Sea from 2003 to 2007. The results revealed that although satellite observation overestimates field measurement results to some extent, the two observations were consistent in terms of spatial distribution and time variation. He [31] compared the measured chlorophyll-a from 2006 to 2007 cruises in the Bohai Sea, Yellow Sea, and East China Sea with that retrieved by MODIS satellites. The experimental results demonstrated that the in-situ measurements were strongly correlated with the satellite-derived results (R = 0.72, SD = 0.40, p < 0.0001), and the chlorophyll-a products derived from the satellite inversion were calibrated based on this relationship. For this purpose, this paper calibrates the L3 chlorophyll-a (chlor_a) product from MODIS/Aqua processed by NASA’s OPBG group based on this method to eliminate the overestimation of chlorophyll-a by turbid waters. The time series of localized monthly chlorophyll-a concentrations in the East China Sea from 2003 to 2020 were estimated using the calibrated chlorophyll-a products to analyze the synergistic relationship between phytoplankton and POC. The chlorophyll-a data used subsequently in this paper were also calibrated using this method.

2.5. Accuracy Evaluation of POC Retrieval Algorithm

For the determination of the best regression fit effect, this study quantified the superiority of fit by examining the explained coefficient of determination (R2) (defined in Equation (4)) in this paper. The root mean square error (RMSE) (defined in Equation (5)) and the mean absolute percentage error (MAPE) (defined in Equation (6)) were calculated to assess the predictive performance of the algorithm. The significance test (p) was utilized to indicate errors occurring in the algorithmic model. Bias (defined in Equation (7)) was applied to measure the accuracy of prediction results. The related equations are expressed as follows:
        R 2 = 1 i = 1 N POC retrieved , i     POC measured , i 2 i = 1 N POC retrieved , i     POC mean , i 2
RMSE = i = 1 N POC retrieved , i     POC measured , i 2 N
MAPE = 1 N i = 1 N POC retrieved , i     POC measured , i N 100 %
  Bias = 1 N i = 1 N POC retrieved , i     POC measured , i 100 %
where POC measured is the in-situ POC concentration, POC retrieved is the POC concentration estimated by the inverse model, POC mean is the average of the measured POC concentrations, and N is the number of sample points. In this paper, all data were sorted according to the concentration of the POC, and the extraction interval was determined based on the number of sample points. Finally, training and testing samples were extracted from the sample dataset. The newly composed training and testing samples had the same interval (arithmetic sequence) to ensure that the POC concentration gradient had a uniform distribution to meet the requirement of constructing a high-precision inversion model. In this way, the sample dataset was divided into two parts: approximately 70% of the sample points were designated to calibrate the algorithm’s coefficients, and the remaining 30% were designated to evaluate the performance of the POC retrieve model. All statistical analyses were undertaken using R.4.12 software.

3. Results

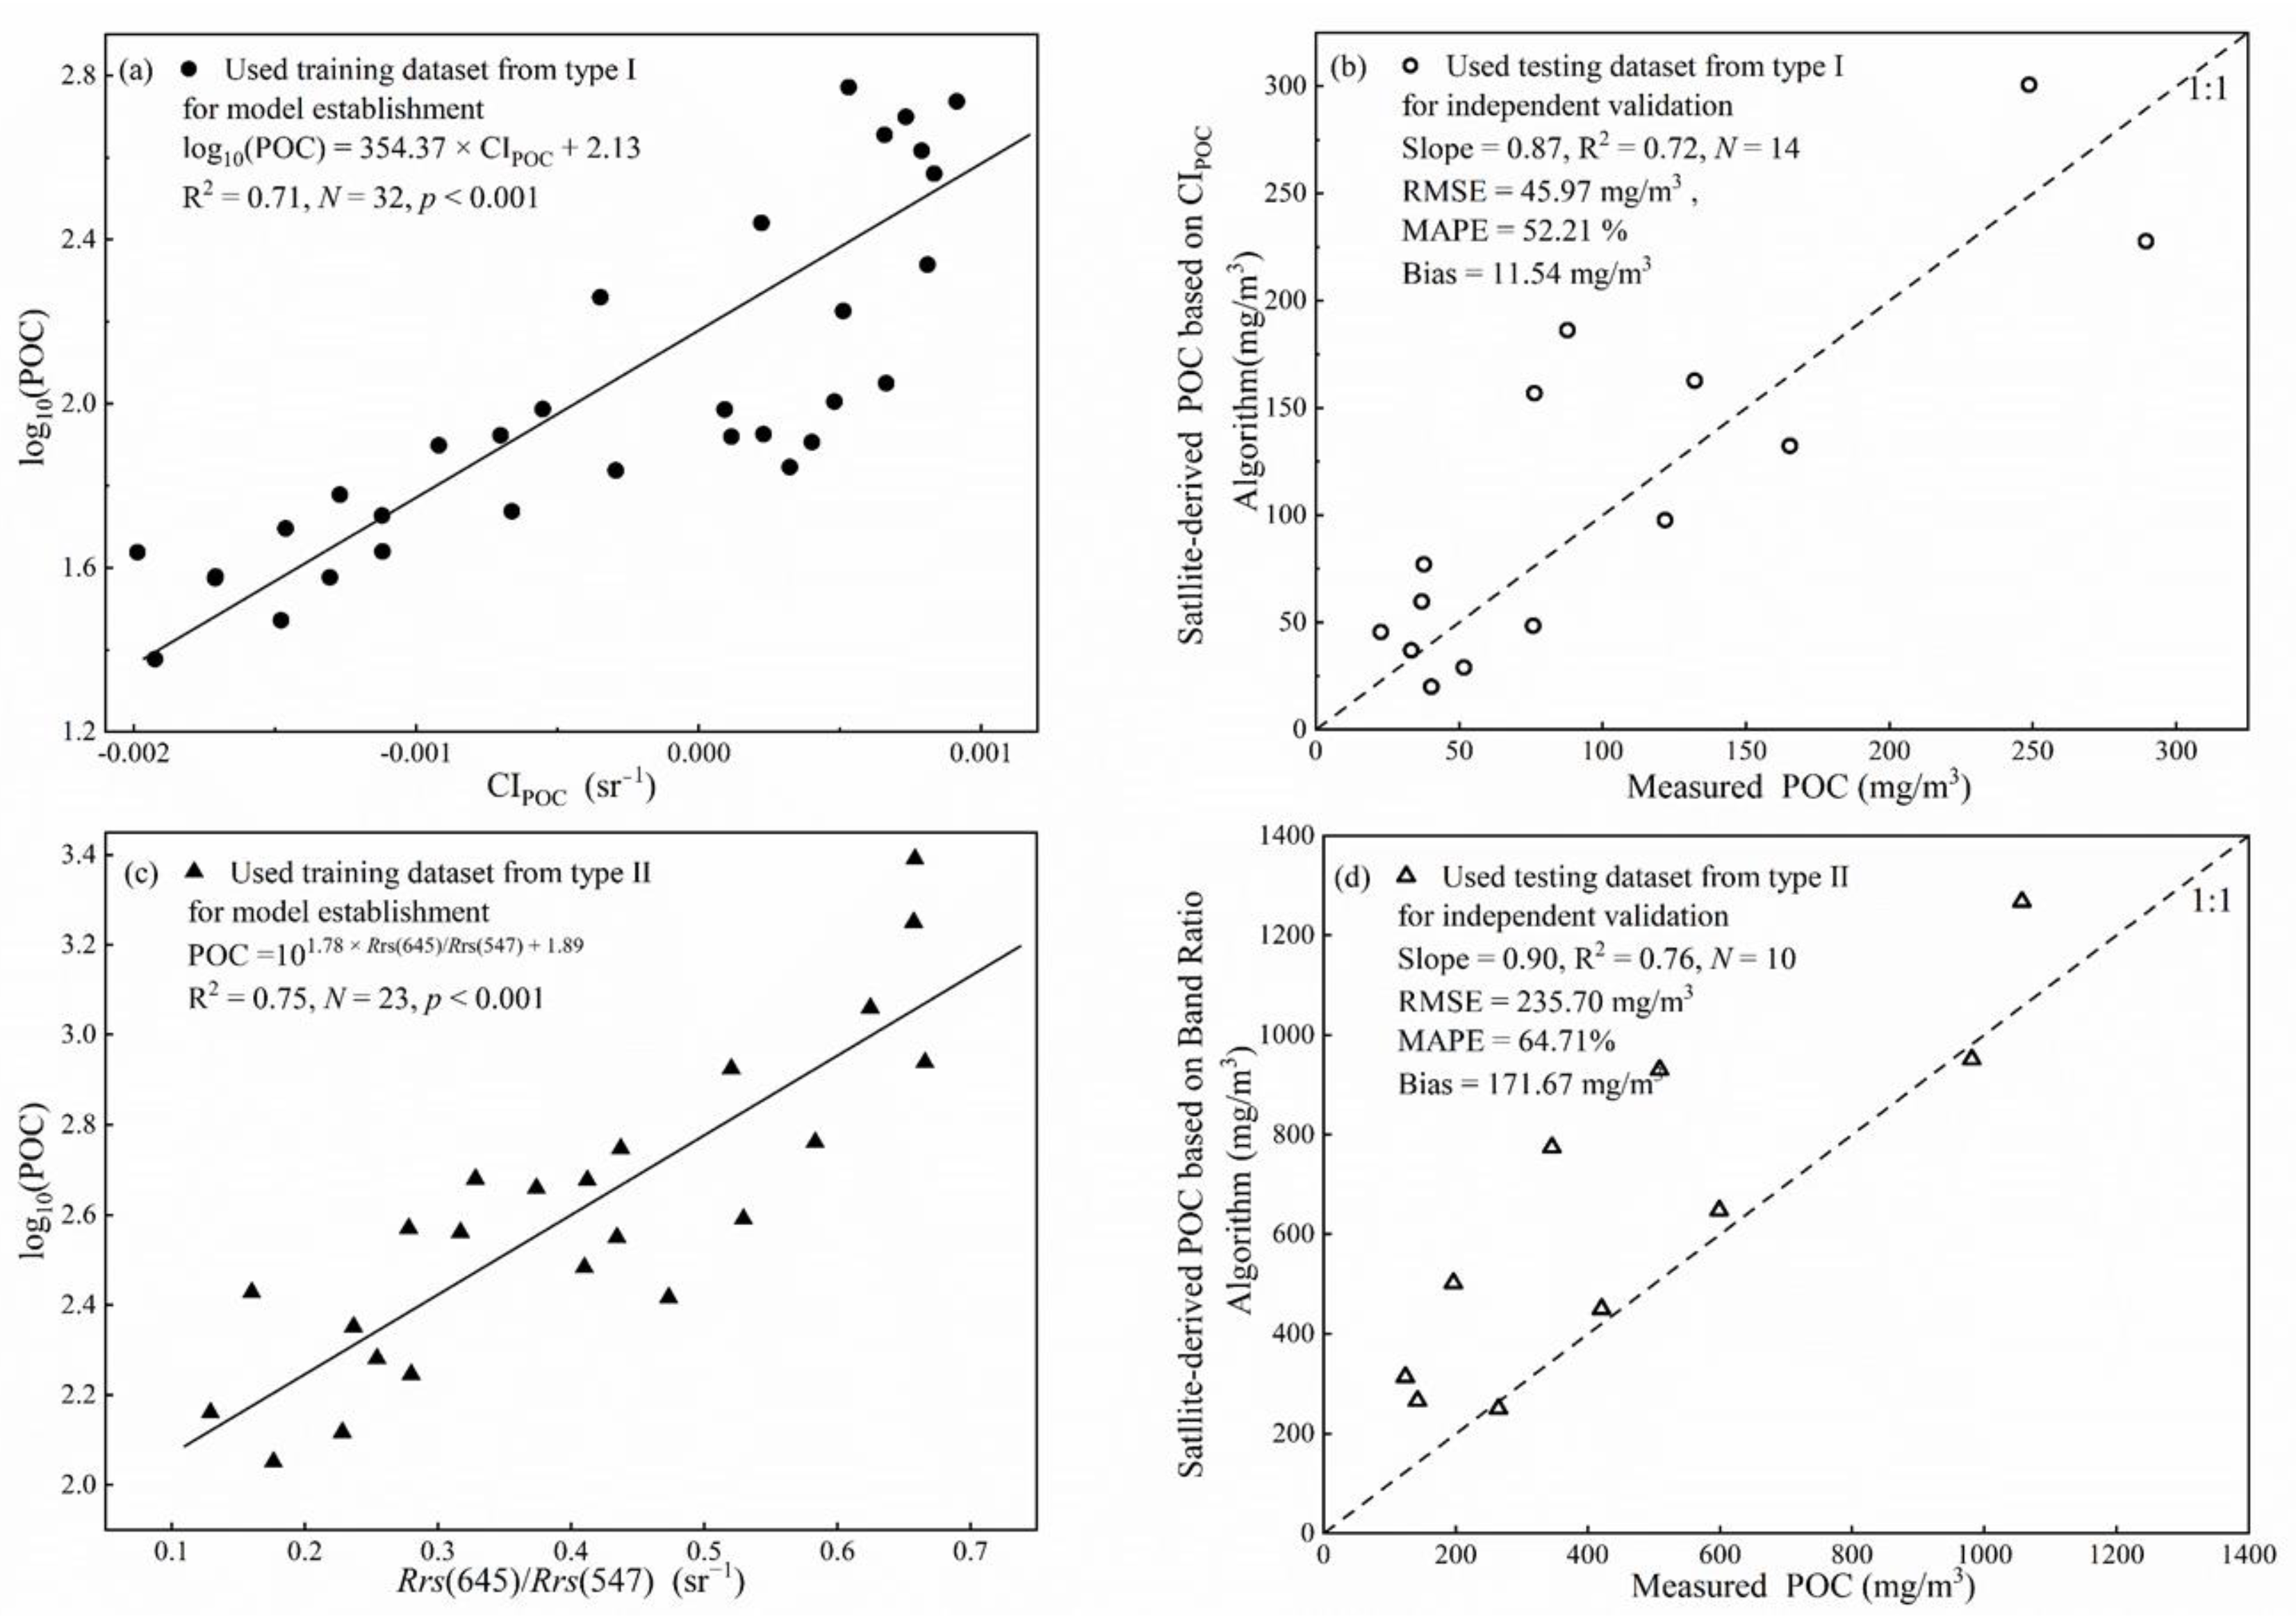
3.1. Performance Evaluation of Hybrid Retrieval Models

The 79 MODIS/Aqua satellite remote sensing reflectances matched to the measured sample points were classified using the methodology in Section 2.3, and 70% of the classification results were employed for derivation model parameters and performance evaluation. The sample points in the type I dataset (N = 32) were applied to the CIPOC algorithm (Equation (1)), and the sample points in the type II dataset (N = 23) were applied to the band-ratio algorithm. These two datasets were linearly related to the measured log10(POC) data to determine the coefficient of the best-fit regression, respectively (as shown in Equations (8) and (9):
log 10 POC = 171.30 × CI POC + 1.93
log 10 POC = 1.78 × Rrs 645 / Rrs 547 + 1.89
The correlation coefficients R2 of the CIPOC algorithm and the band-ratio algorithm are 0.71 and 0.75, respectively, according to Figure 3a,c, and the significance test p is less than 0.001 for both, indicating a favorable linear relationship between the measured log10(POC) and the two algorithms. The remaining 30% of matched remote sensing reflectance in both datasets was used in the established models to evaluate the algorithm performance. As illustrated in Figure 3b,d, the predicted POC concentration values exhibited excellent linearity with the measured concentrations, with the range of numerical variables between the two being in general agreement and the scatter points evenly scattered on both sides of the 1:1 line. The slopes of linear regressions calculated from the measured and model-predicted values were 0.87 and 0.90, respectively, with coefficients of determination R2 of 0.72 and 0.76, MAPEs of 52.21% and 64.71%, p < 0.001, RMSEs of 45.97 mg/m3 and 235.70 mg/m3, and biases of 11.54 mg/m3 and 171.67 mg/m3, respectively. The precision verification parameters demonstrate that the two algorithms have excellent capability for interpretation and prediction.

3.2. Comparison with Different Forms of Algorithms

Accuracy is critical to ocean retrieval because time-series analyses call for the most robust products in order to stabilize temporal variation. However, current POC algorithms for marginal seas often have significant uncertainties due to the optical complexity of coastal waters. We evaluated the inversion performance of multiple forms of POC algorithms in the East China Sea based on Stramski [32].
Among them, the CAT1 algorithms are referred to as BR-PF (band ratio-power function) and have the form shown in Table 1, where X is usually the ratio of the two bands. The current NASA standard POC algorithms fall into this category. For example, a global standard POC concentration product has been produced using this algorithm based on the MODIS bands [19]. The CAT2 algorithm is called MBR-OCx (maximum band ratio-OCx), where x indicates the number of bands involved in the equation of the algorithm. This algorithm has also been used to manufacture global ocean color (OC) chlorophyll-a products [33,34]. For this reason, the CAT2 algorithm was migrated to the East China Sea for POC inversion in this paper. The CAT3 algorithm is a color index algorithm (CI) developed to improve chlorophyll algorithms in waters with low chlorophyll-a based on the concept of three-band reflectance difference [27] and is now also used in global POC estimation [28]. The CAT4, CAT5, and CAT6 algorithms are conceptually similar to the normalized difference vegetation index (NDVI), initially developed for terrestrial vegetation, and the algorithm formulation was later rewritten and used by Son [17] for POC estimation in the Gulf of Mexico. The CAT7 algorithms are based on the multiple linear regression (MLR) approach. Le [21] and Chen [35] applied their similar MLR algorithm in POC studies of the Louisiana shelf and the Ross Sea, respectively, and obtained excellent inversion results.
Table 1 mainly defines the inversion models for the seven categories mentioned above, and many alternative candidate formulas are further derived in each category. In the comparative analysis for the purpose of evaluating all algorithms, the best coefficients were fitted using the same training dataset based on ordinary least squares. The accuracy of each algorithm in estimating the POC was quantified using the same testing dataset using the statistical measures in Section 2.5. For brevity, here, we limit the presentation of these algorithms to the case of MODIS bands. Since the MODIS sensor lacks a band centered at or near 510 nm, a virtual band of 510 v was constructed based on the reflectivity of 488 nm versus 547 nm, drawing on the method of Stramski [32]. For more details on the description, please refer to the literature by Stramski [32]. As can be seen from Table 1, the POC concentrations retrieved by the locally optimized inversion models are widely underestimated, with high uncertainties. It is worth noting that the CIPOC-based CAT3 algorithm performs the worst in terms of statistical metrics (slope = 0.36, R2 = 0.34, RMSE = 374.26 mg/m3), which also demonstrates that the CIPOC algorithm is not sensitive enough to accurately estimate POC in particularly turbid and complex waters. Although the hybrid inversion model features an overestimation phenomenon (slope = 1.14, bias = −64.79 mg/m3), it still demonstrates better performance (R2 = 0.84, RMSE = 156.14 mg/m3, MAPE = 43.30%) and can be used for the retrieval of POC concentrations in the East China Sea shelf area and to capture the dynamic variation of POC in coastal waters.

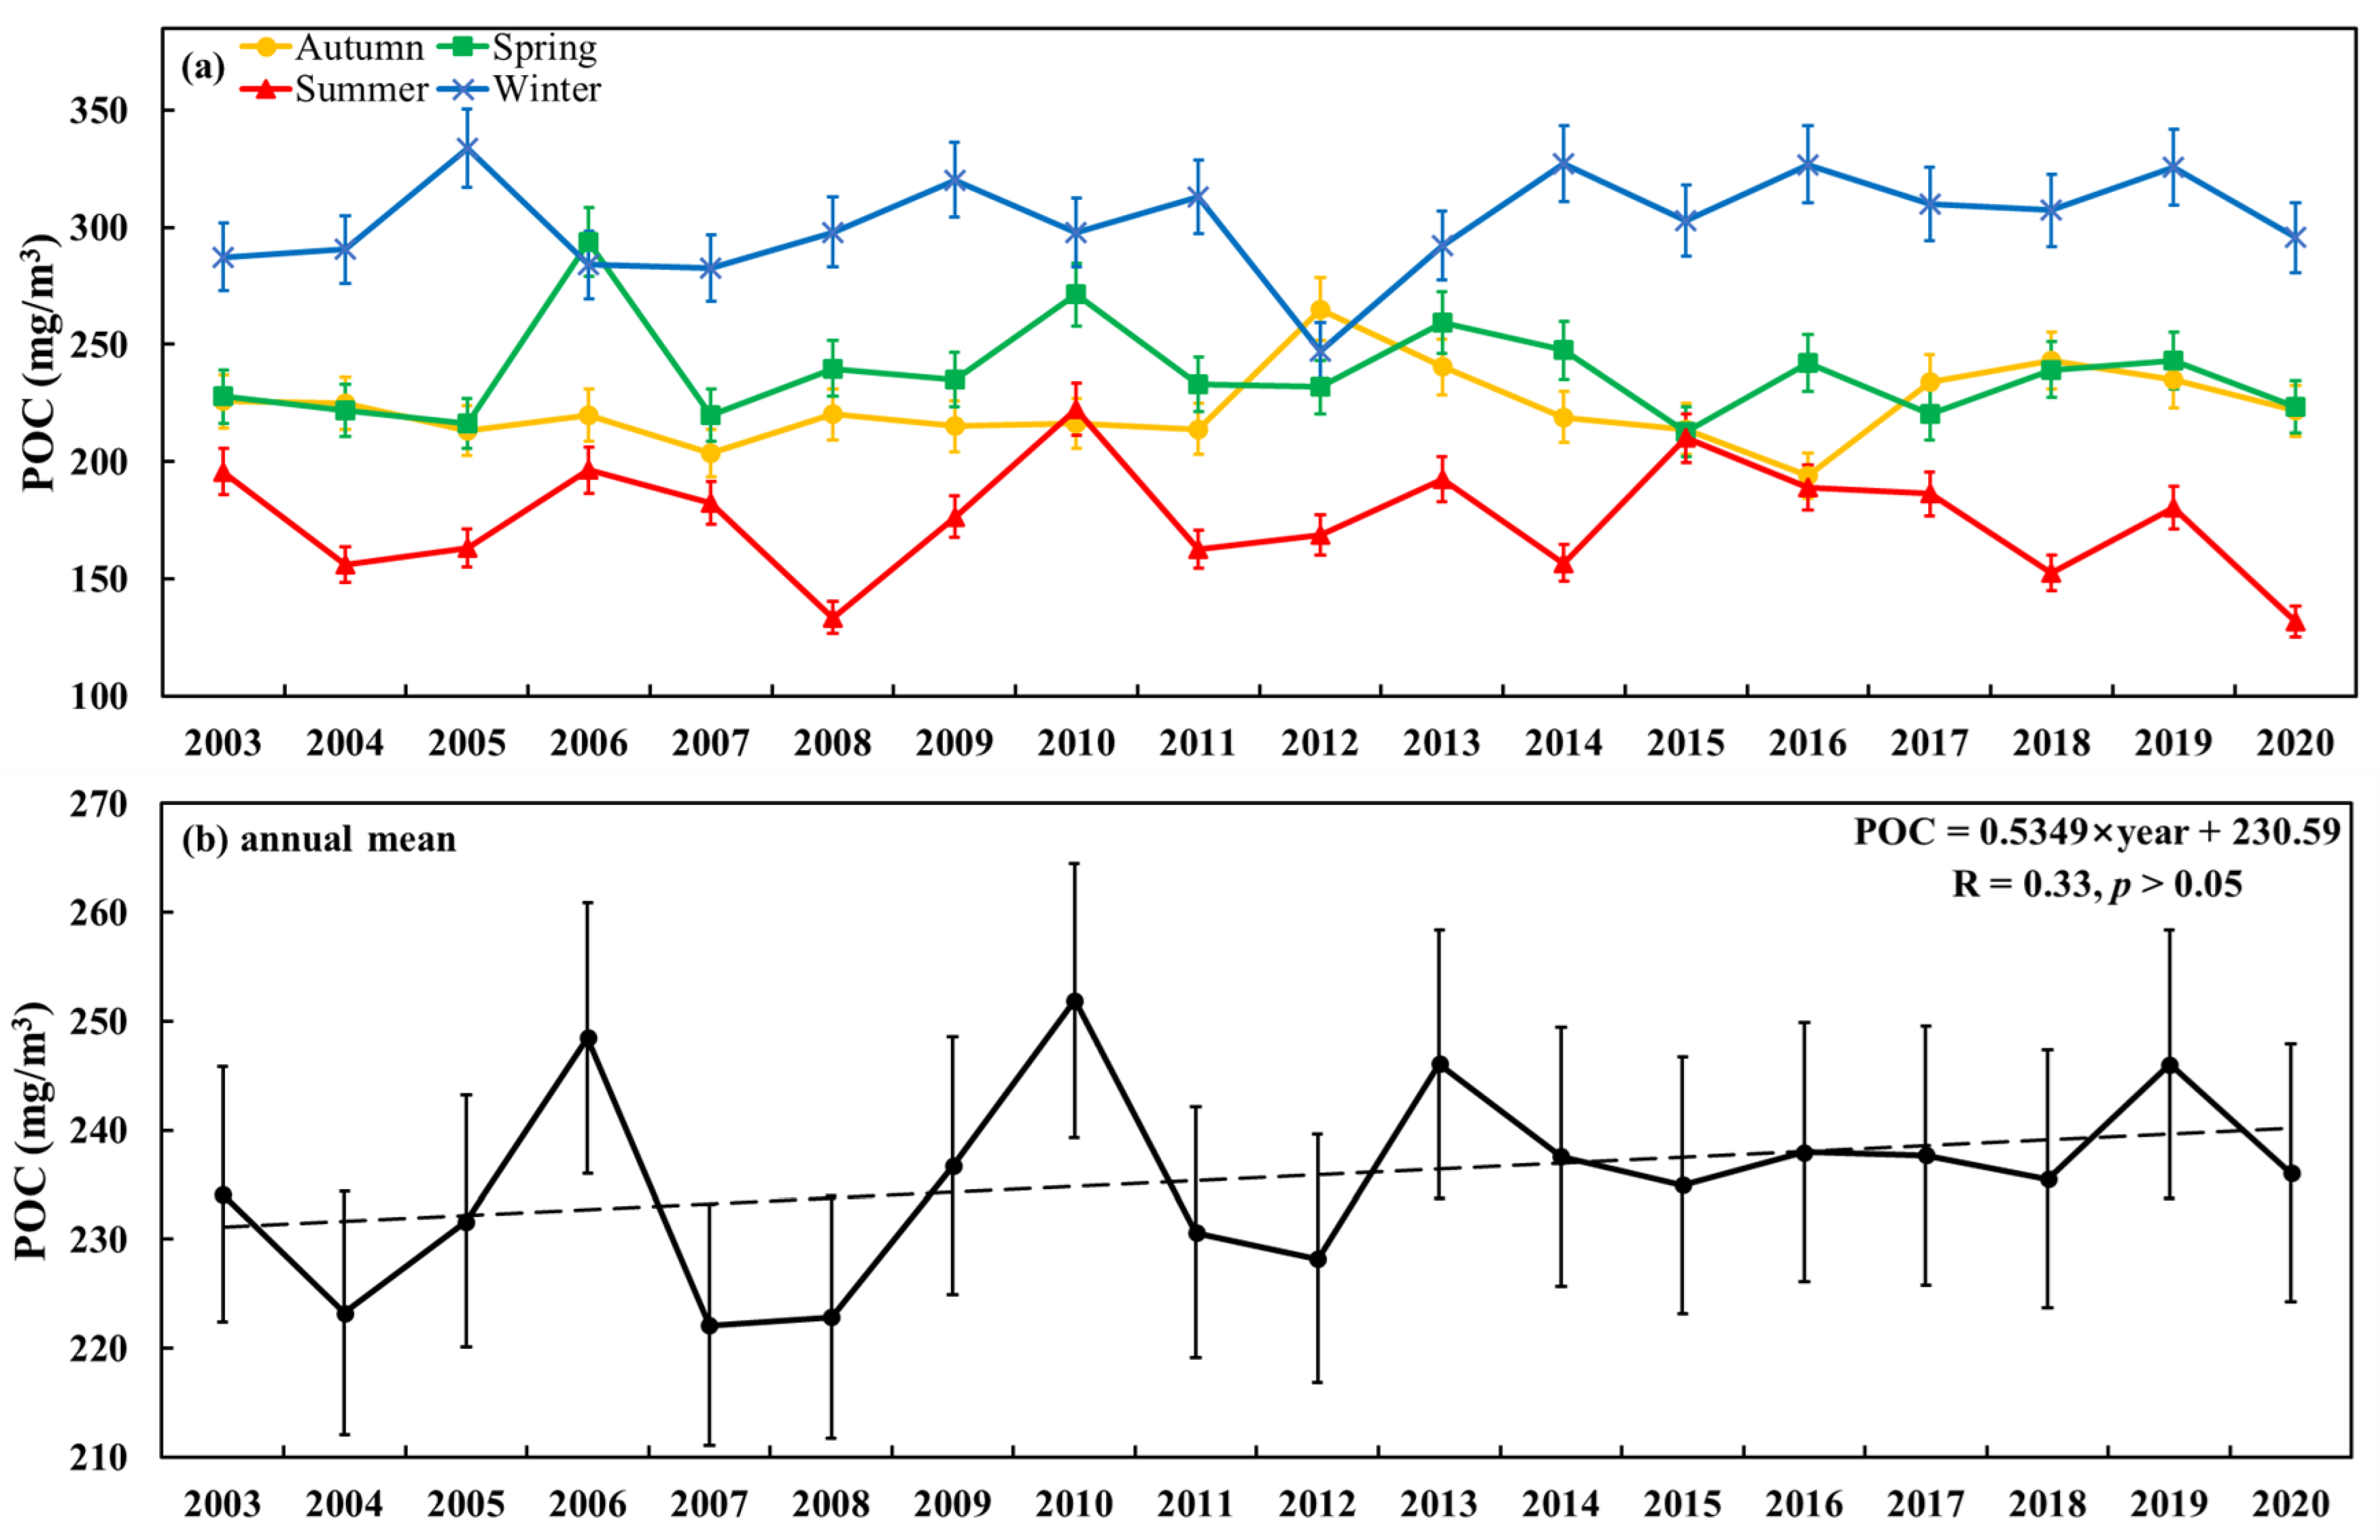
3.3. Spatial and Temporal Variation of POC

After verifying the POC hybrid remote sensing retrieval model, Equations 8 and 9 in Section 3.1 were applied to the MODIS/Aqua remote sensing images of the East China Sea area from 2003 to 2020. The calculated annual average concentration of POC in this sea area based on the East China Sea area (25–32°N, 120.5–126°E) is plotted in Figure 1. The seasonal average POC concentration values for spring (March to May), summer (June to August), autumn (September to November), and winter (December to February) were also calculated using MODIS/Aqua satellite remote sensing data concerning POC concentration values from 2003 to 2020 (as shown in Figure 4). Figure 5 presents the long-term series distribution of the average POC concentration in the sea area near the sampling site from 2003 to 2020. Each scene image is synthesized from all available remote sensing data for that year.
From Figure 4, it can be observed that the POC concentration levels in the East China Sea are generally high, showing a gradually increasing trend (R = 0.33, p > 0.05) with significant spatial and temporal variability. From 2003 to 2006, the annual average POC concentration fluctuated and increased continuously and reached its first peak in 2006, with a yearly average POC concentration of 211.70 mg/m3. With the completion of the Three Gorges Dam on the Changjiang mainstream in 2006, the average POC concentration decreased sharply to 188.07 mg/m3 in 2007 but then gradually increased between 2007 and 2010. The average POC concentration in the East China Sea fluctuated during the following decade due to the second peak of POC caused by the mega-flood in the Changjiang River basin in 2010. The dynamic variation characteristics of POC in different seasons were the same, with the peak POC concentration occurring in winter each year (248.75 ± 26.19 mg/m3), whereas the POC concentration in the spring (215.85 ± 19.59 mg/m3) was higher than that in the autumn (186.34 ± 13.28 mg/m3) and summer (151.62 ± 19.40 mg/m3). From a spatial point of view (as illustrated in Figure 5), POC concentrations were subject to a forceful gradient decrease, with high values occurring near the Changjiang estuary and Hangzhou Bay in the East China Sea, values gradually decreasing toward the southeast, a gradual reduction in POC concentrations from nearshore to open waters, and the lowest average POC concentrations occurring in the waters connected with the western Pacific Ocean.

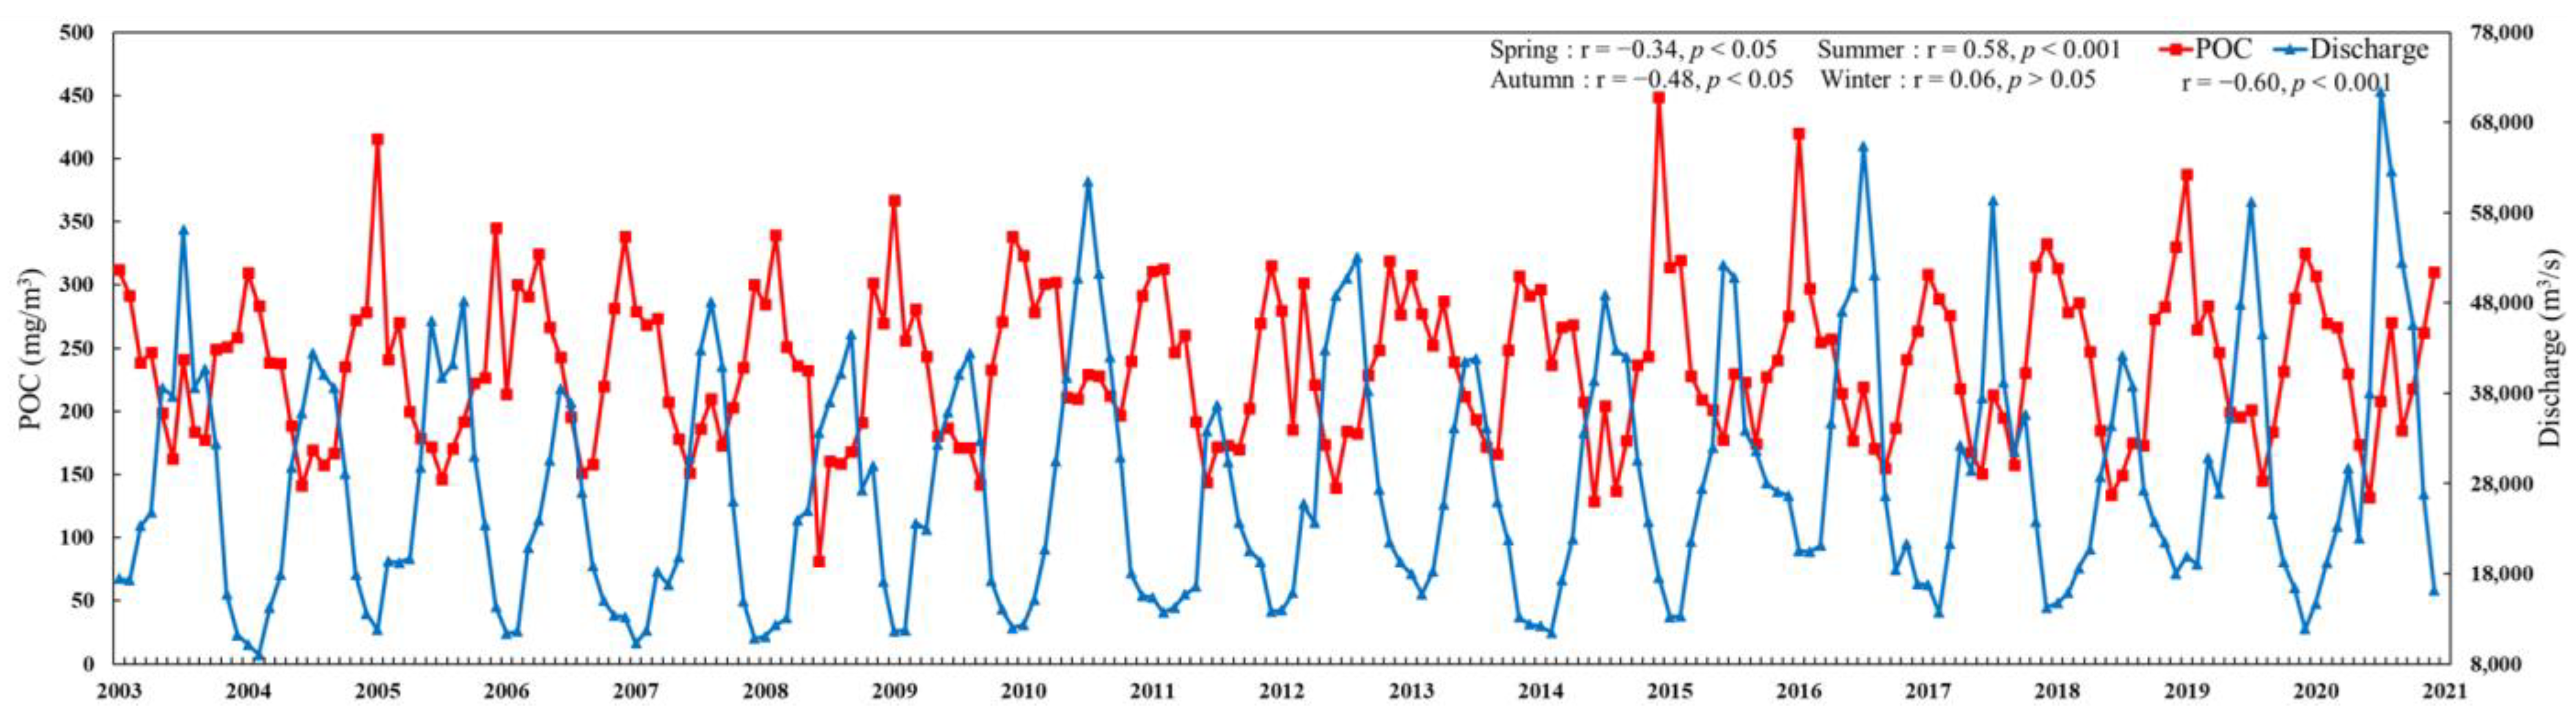
3.4. Driving Factors of POC Dynamics on the East China Sea

The effects of different drivers such as phytoplankton, TSM, tidal processes, precipitation, temperature, river discharge, surface sea currents, and wind speed on the distribution pattern of POC concentrations in seawater have been the subject of previous studies [3,21,36,37]. Given that the distribution of POC concentrations in the East China Sea shows significant spatial and temporal variations, this paper attempts to identify the causes of this phenomenon. In contrast, the components of POC in the East China Sea are extremely intricate. The spatiotemporal variability of sources such as high primary productivity, riverine flux, sediment resuspension, and DOC transformation in different waters of the East China Sea exacerbates the conclusion that the origins of POC are inconsistent [38], so the synergistic effects of different driving factors for POC in the East China Sea need to be considered. The monthly average POC values of the region were counted according to the drawn sea area range (25–32°N, 120.5–126°E) and combined with the monthly average river discharge from the Datong hydrological station on the Changjiang River mainstream for correlation analysis, which is exhibited in Figure 6. The river discharge of the Changjiang River is significantly negatively correlated with POC concentration (r = −0.60, p < 0.001). During the spring and autumn, the river discharge remains stable. The dilution of water brought by the Changjiang River will further dilute the original POC content in the East China Sea and contribute to a decrease in the POC concentration; thus, the river discharge in spring and autumn has a strong negative correlation with POC concentration (spring r = −0.34, p < 0.05; Autumn r = −0.48, p < 0.05). Moreover, extreme weather events such as heavy rainfall weather and increased frequency of flooding during the summer period lead to a sharp increase in river discharge and affect the flux and composition of the terrestrial material transported from the river to the sea [39]; thus, releasing more terrestrial organic matter into the marginal sea means that the river discharge exhibits a degree of positive correlation with POC (r = 0.41, p < 0.001). Despite the annual rainy season (June–August), which is the peak discharge period of the Changjiang River and the main period for the import of organic matter from terrestrial sources [40], substantial amounts of soil are washed into the river by precipitation [41]. As a result, the POC decreases with the increase in suspended matter due to the adsorption of inorganic minerals [10]. The annual rainy season is also the season with the lowest POC concentration. As precipitation gradually decreases in winter and the river discharge diminishes, there is also a decrease in terrestrial organic matter entering the ocean from rivers. Figure 6 also illustrates no statistical correlation between the two in this period.
Due to it being one of the most productive marginal seas in the world [9], high primary productivity and phytoplankton blooms are frequently observed in the East China Sea. The occurrence of such events also leads to the export of significant POC. In recent years, spring phytoplankton blooms have been a recurring event in the East China Sea [42]. Phytoplankton in the ocean’s surface layer utilizes photosynthesis to convert dissolved CO2 into its cellular components and POC. For this purpose, the effect of phytoplankton bloom events on POC distribution in the East China Sea requires investigation. As an essential proxy for phytoplankton biomass in the ocean, chlorophyll-a can be identified by satellite-derived data to characterize the area of phytoplankton blooms [31,43]. This study applied remote sensing images with low cloudiness in spring and a chlorophyll-a threshold of >10 mg/m3 to evaluate whether a phytoplankton bloom event occurred in this sea area [31]. Figure 7 plots the spatial and temporal distribution of chlorophyll-a and POC concentrations on 8 and 19 April 2018. Interestingly, the chlorophyll-a concentration in the red boxed area is abnormally high and greater than 10 mg/m3, thus determining that a phytoplankton bloom event occurred in the East China Sea at this time (as shown in Figure 7b). In contrast, high POC concentrations can also be observed at the corresponding location (as demonstrated Figure 7c). After about ten days, the chlorophyll-a concentration at the corresponding location returned to normal, and no POC concentration abnormality was observed (as represented in Figure 7d,e). This phenomenon demonstrates that a short phytoplankton bloom can produce abnormally high POC concentrations in the region of the East China Sea. With the depletion of nutrients, the phytoplankton will also disappear rapidly, contributing to the gradual disappearance of the POC concentrations initially present in the region.
In this study, long-term series of the dynamics of chlorophyll-a and POC were also determined using satellite archived data for the last two decades. Considering that there are also geographical differences in the East China Sea, the original sea area was divided into two regions for analysis: the Changjiang estuary region (30–32°N, 120.5–126°E) and the East China Sea region (25–30°N, 120.5–126°E). The results in Figure 8 show that the proliferation of marine phytoplankton in winter plays an important regulatory role regarding POC ((a) r = 0.93, p < 0.001; (b) r = 0.94, p < 0.001). This conclusion is consistent with the research of [21,36], who demonstrated the POC concentration in seawater increases with higher chlorophyll-a concentrations, that there is no correlation between winter river discharge and POC, and that POC dynamics during this period is dominated by phytoplankton (chlorophyll-a). The same statistical results exist for chlorophyll-a and POC in summer ((a) r = 0.75, p < 0.001; (b) r = 0.85, p < 0.001), but both are regulated by the import of nutrients from high-intensity rivers. The Changjiang River carries enormous amounts of sediment into the East China Sea, making the optical properties of the waters in this area exceptionally complex [9], interfering with the correlation between chlorophyll-a and POC and affecting the dynamics of POC concentrations. Although phytoplankton bloom events frequently occur during spring and autumn, Figure 8 reveals that the correlation between POC concentrations and phytoplankton is insignificant, which also indicates that sudden changes in chlorophyll-a concentrations over a short period are not capable of causing a trend shift, while other processes may also regulate the spatial and temporal distribution of POC.
Wind and sea surface currents can also influence the migration of seawater, thereby indirectly affecting the spatial distribution of POC. For example, extreme weather events such as tropical cyclones or typhoons cause POC migration driven by solid winds that trigger sea surface currents. To further investigate the dynamic variation of POC before and after the transit of a typhoon, this study selected Typhoon TAPAH (No. 1917), which transited in the East China Sea waters on 21–22 September 2019, with a maximum wind speed of 33 m/s and a wind circle radius of 500 km during the transit (http://typhoon.nmc.cn/web.html (accessed on 24 June 2022), as shown in Figure 9a). Figure 9b demonstrates the composite map of POC concentration distribution for seven days before the typhoon’s transit. The POC in the coastal waters of the Changjiang estuary was still at a high concentration level, while the POC concentration in the open waters of the East China Sea was low. Figure 9c indicates a composite map of the POC concentration distribution for seven days after the passage of Typhoon TAPAH, where the POC concentration in the coastal waters of the Changjiang estuary showed a significant increase and the POC concentration in the open waters of the East China Sea increased significantly (lower right area of Figure 9b). In this study, two sub-regions were mapped to highlight the effect of typhoons on POC transportation. There is a distinct downward trend in the POC exhibited in Zone 1 compared to the pre-transit period, and higher concentrations of POC in Zone 2 spread from coastal waters to more distant waters (>122°E). Such extreme weather events induce water mixing, enhance land runoff, and promote sediment resuspension, causing an increase in sea surface POC concentrations and diffuse migration to more distant open waters [44]. In contrast, when no extreme weather events occur, wind and sea surface currents also carry out these hydrodynamic processes, but the processes are relatively slow; however, they affect the dynamic distribution of POC to some extent.
Other studies have revealed that ocean currents in different regions of the East China Sea impact the distribution of POC. For example, the sea surface currents in the northeastern region flow roughly southeastward in spring and autumn, accelerating the rapid transport of the Changjiang River plume, which results in higher POC concentrations in this sea area. The prevalence of the northwest monsoon in winter enhances Ekman pumping, and the surface currents also reach their maximum at this time, thus driving convective mixing in the upper ocean and increasing the depth of the mixed layer, thus transporting bottom nutrients to the surface [36,45,46]. These phenomena also promote the rapid growth of phytoplankton and increase biomass and POC concentrations. In summer, the south wind reverses the direction of local surface currents, and the Changjiang river’s dilution water is restricted to the northeastern part of the East China Sea, which also prevents the transfer of terrestrial substances to more distant waters, resulting in low POC concentrations in summer. Similar effects in terms of sea surface currents on POC concentrations can also vary seasonally. Winds also interact with the distribution of POC in the East China Sea by driving surface currents, as the prevailing northwesterly winds in winter accelerate the movement of the Jiangsu coastal current to the southeast. In contrast, during summer, prevailing southeasterly winds contribute to the northwestward flow of the Taiwan warm current [47]. These current movements contribute to higher POC concentrations in the East China Sea in winter than in summer, since the Jiangsu coastal current brings high POC concentrations while the Taiwan warm current does not [3].
As mentioned above, the seasonal variation in terms of POC concentrations in the East China Sea is mainly influenced by river discharge and phytoplankton. At the same time, the relationship between POC and chlorophyll-a is also influenced by the Changjiang river’s dilution water, resulting in significant territorial differences. The import of terrestrial material and phytoplankton reproduction affect the spatial distribution of POC in the East China Sea, where winds and surface currents also accelerate the migration and transformation of POC in seawater, contributing to spatial variability in terms of POC in the East China Sea.

4. Discussion

4.1. Performance and Applicability of Algorithms in Other Marine Areas

Satellite remote sensing is inexpensive, consumes extremely little labor, and is an excellent alternative tool for exploring long-time series POC variability [10]. However, obtaining accurate POC predictions in nearshore waters remains challenging due to the complex optical properties of coastal waters and the many different sources of water column components that produce a range of biochemical contaminants of POC [21]. Recognizing the difficulty of retrieving POC in coastal waters, this paper successfully estimates POC in the coastal and open waters of the East China Sea using a newly constructed hybrid retrieval algorithm. Since the CI algorithm effectively exploits the effect of variations in absorption and backscattering coefficients on remote sensing reflectance based on the water column, it can improve uncertainties caused by atmospheric corrections, inversion errors, and sensor noise. It also provided a satisfactory performance in the retrieval application in the open waters of the East China Sea (R2 = 0.71, RMSE = 45.97 mg/m3, MAPE = 52.21%, bias = 11.54 mg/m3).
From the remote sensing reflectance spectra matched to the sampling points in Figure 1c, the optical properties of water bodies in the tidal waters remain consistent with the spectral distribution characteristics of water bodies in type I. For this reason, the algorithm form of type I in the hybrid algorithm (i.e., Equation (8)) was applied to the Chaoshan sea area to examine its potential applicability. The reasonably favorable statistical parameters (slope = 0.67, R2 = 0.81, RMSE = 23.39 mg/m3, MAPE = 19.58%, bias = −14.29 mg/m3) are exhibited in Figure 10, and the POC concentration distribution in the Chaoshan sea area retrieved from MODIS/Aqua remote sensing images using this hybrid algorithm is presented in Figure 11. The results prove that the hybrid inversion algorithm can accurately capture the dynamic variation of POC in the Chaoshan sea area (Figure 11). At the same time, the inverse POC values also have good consistency compared with the in-situ data, with similar spatio-temporal distribution patterns to East China Sea waters. The reliability shown by the model in the Chaoshan Sea implies that the hybrid algorithm used in this study can be extended to other sea areas with similar water types. However, it is essential to be cautious before validating the migration of the model. Empirically, this algorithm works stably only in similar environments, for which it was designed. When the model is transferred and implemented in waters with typically complex optical properties, the performance often fails to meet the requirements. The model form needs to be dynamically adjusted for a local optimization to meet the application requirements based on the sampled measured sample points.

4.2. Assessment of Uncertainty

It has been suggested that the backscatter coefficient may be strongly correlated with POC and can be a proxy for POC concentration levels in the open ocean [11,19,28,32,48]. However, Hunter [49] concludes that organic particles may contribute enormously to the absorption and slightly less to the backscattering coefficients. This inference indicates that absorption may be a better optical proxy for retrieving POC than the backscattering coefficient and that the total absorption coefficient of seawater significantly causes the variation in remote sensing reflectance. Therefore, some connections can be established by remote sensing reflectance for POC retrieval. However, the performance of the hybrid algorithm based on remote sensing reflectance may be influenced by many factors during the remote sensing application.
The Rrs variables utilized in the hybrid algorithm are estimated from satellite inversions, where the algorithm established between Rrs and POC does not relay the measured relationships between these variables. The Rrs variables are also subject to processes such as specific algorithms for atmospheric correction and the processing of raw top-of-atmosphere radiation signal data, which can be incorrectly calculated and introduce uncertainty into the inversion POC [28]. In extremely turbid waters with complex optical properties, strong backscattering influenced by high concentrations of non-algal suspended matter can significantly increase water-leaving reflectance in the green and red wavelength bands. Although the increase in water-leaving reflectance in the blue band is relatively small compared to the longer band, the strong absorption caused by extensive detritus and chromophoric dissolved organic matter (CDOM) reduces the blue-green band reflectance [31,50].
These same factors can make Rrs potentially erroneous in the inversion process. As shown in Figure 3a, it can be observed that some sample points in the lower right cluster are more densely distributed in the area with CIPOC values of 0–0.001 and log10(POC) values of 1.8–2.4. After data analysis, the positions of sampling points that deviate from the regression line are mainly distributed near the mouth of the Changjiang River, resulting in higher POC concentrations in the sampled waters. In this case, the signal of suspended sediment and CDOM will reach the MODIS sensor through the reflection and scattered light from the waters when the satellite is conducting the waters signal observation, which causes the reflectance error. The sensor fails to promptly capture the rapid variation of POC in the waters over a short period, resulting in a significant difference between the POC retrieved by the model constructed based on the remote sensing reflectance and the actual measured value. These errors also bring some uncertainties to the algorithm in terms of calibration and validation.
All the factors described above may vary with river discharge. Firstly, river discharge affects phytoplankton biomass by influencing freshwater export fluxes and water column stratification [26]. The Changjiang river dilution water also carries abundant nutrients and accelerates the dynamic distribution of phytoplankton in water column mixing regulating regions, thereby affecting POC concentrations. Secondly, rivers also release enormous amounts of silt to resuspend sediments in shallow waters [51] or deepen the surface mixing layer, which reduces the availability of light to the phytoplankton community as a whole and impacts its photosynthesis, indirectly decreasing the production of POC. Finally, high concentrations of suspended sediment and abundant organic matter exported by rivers can significantly affect the relationship between Rrs and POC, contributing to errors in the estimation of POC. In addition, higher sea surface temperatures may reduce phytoplankton processes, such as enhanced phytoplankton respiration (decreased net primary productivity) and increased zooplankton grazing. Variations in phytoplankton community structure associated with changes in nutrient, temperature, and grazing regimes [26] can indirectly affect POC estimates. Simultaneous matching validation was performed using MODIS/Aqua remote sensing imagery with a time window of ±5 days and in-situ data. Although the modeling and validation results are more satisfactory, the lack of timeliness means this method cannot quickly capture temporal and spatial variations in POC over a short period, limiting the accuracy of the inversion results. In field measurement data, inconsistent sample acquisition methods and measurement steps may introduce errors. Factors such as limited samples, a small number of sample points, and an uneven spatio-temporal distribution may also affect the dynamic analysis of POC and yield incorrect conclusions.
In summary, the results of this study are encouraging, even though these factors can introduce more uncertainties in the retrieved POC. The performance exhibited by the hybrid model constructed based on the CIPOC algorithm and the empirical band-ratio algorithm demonstrates the potential applicability of the remote sensing inversion of the POC of the Chinese shelf seas, especially for applications in complex coastal waters.

5. Conclusions

The CIPOC algorithm based on the absorption coefficient of waters does not perform well in extremely complex water environments. Still, it can be adopted in the remote sensing and retrieval of POC in coastal and open waters when combined with an empirical band-ratio algorithm. The new hybrid algorithm provides acceptable verification results. The estimated POC concentration is consistent with the in-situ POC at the height of the matching points, for which the spatial and temporal distribution of POC along the coastal and open waters of the East China Sea from 2003 to 2020 was successfully retrieved. Factors such as river discharge and phytoplankton largely determine the dynamics of POC concentrations in the East China Sea. At the same time, wind and sea surface currents also influence the transport and transformation of POC.
Future improvements in the remote sensing of complex waters by new sensors could improve accuracy in the monitoring of POC fluxes in different regions of the shelf seas by using Sentinel-3/OLCI data with higher sensitivity and better resolution in coordination with MODIS/Aqua data. This study also provides a new method for monitoring coastal POC distribution dynamics in the long term and on a large scale. It is believed that with an improvement in the quality and quantity of field measurement data and continuous research into the remote sensing inversion mechanism, the regional algorithm of inversion for POC will continue to develop, improve, and better serve ocean monitoring research. It can also provide valuable clues for other marine studies in similar water environments, assist in estimations of the carbon budget of nearshore and open waters, and aid in formulating related policies such as peak carbon dioxide emissions and carbon neutrality.

Author Contributions

Conceptualization, S.C.; methodology, S.C. and M.W.; analysis, S.C., M.W. and C.L.; writing and editing, S.C. and M.W.; supervision, M.W. All authors have read and agreed to the published version of the manuscript.

Funding

This work was supported by the National Natural Science Foundation of China (Grants Nos. 41976164 and 41976230), the Natural Science Foundation of Zhejiang Province for Distinguished Young Scholars (LR20D060002), and the National Key Research and Development Program of China (2019YFD0901305).

Data Availability Statement

Not applicable.

Acknowledgments

We thank the NASA Goddard Space Flight Center for providing all satellite data.

Conflicts of Interest

The authors declare no conflict of interest.

References

  1. Piirsoo, K.; Laas, A.; Meinson, P.; Nõges, P.; Pall, P.; Viik, M.; Vilbaste, S.; Nõges, T. Changes in particulate organic matter passing through a large shallow lowland lake. Proc. Est. Acad. Sci. 2018, 67, 93–105. [Google Scholar] [CrossRef]
  2. Bai, Y.; Cai, W.-J.; He, X.; Zhai, W.; Pan, D.; Dai, M.; Yu, P. A mechanistic semi-analytical method for remotely sensing sea surface pCO2 in river-dominated coastal oceans: A case study from the East China Sea. J. Geophys. Res. Ocean. 2015, 120, 2331–2349. [Google Scholar] [CrossRef]
  3. Liu, D.; Bai, Y.; He, X.; Tao, B.; Pan, D.; Chen, C.-T.A.; Zhang, L.; Xu, Y.; Gong, C. Satellite estimation of particulate organic carbon flux from Changjiang River to the estuary. Remote Sens. Environ. 2019, 223, 307–319. [Google Scholar] [CrossRef]
  4. Bauer, J.E.; Cai, W.-J.; Raymond, P.A.; Bianchi, T.S.; Hopkinson, C.S.; Regnier, P.A.G. The changing carbon cycle of the coastal ocean. Nature 2013, 504, 61–70. [Google Scholar] [CrossRef]
  5. Regnier, P.; Friedlingstein, P.; Ciais, P.; Mackenzie, F.T.; Gruber, N.; Janssens, I.A.; Laruelle, G.G.; Lauerwald, R.; Luyssaert, S.; Andersson, A.J.; et al. Anthropogenic perturbation of the carbon fluxes from land to ocean. Nat. Geosci. 2013, 6, 597–607. [Google Scholar] [CrossRef]
  6. Gardner, W.D.; Mishonov, A.V.; Richardson, M.J. Global POC concentrations from in-situ and satellite data. Deep Sea Res. Part II Top. Stud. Oceanogr. 2006, 53, 718–740. [Google Scholar] [CrossRef]
  7. Gao, X.; Song, J. Main Geochemical Characteristics and Key Biogeochemical Carbon Processes in the East China Sea. J. Coast. Res. 2006, 22, 1330–1339. [Google Scholar] [CrossRef]
  8. Hung, J.J.; Chen, C.H.; Gong, G.C.; Sheu, D.D.; Shiah, F.K. Distributions, stoichiometric patterns and cross-shelf exports of dissolved organic matter in the East China Sea. Deep Sea Res. Part II Top. Stud. Oceanogr. 2003, 50, 1127–1145. [Google Scholar] [CrossRef]
  9. Wei, X.; Shen, F.; Pan, Y.; Chen, S.; Sun, X.; Wang, Y. Satellite Observations of the Diurnal Dynamics of Particulate Organic Carbon in Optically Complex Coastal Oceans: The Continental Shelf Seas of China. J. Geophys. Res. Ocean. 2019, 124, 4710–4726. [Google Scholar] [CrossRef]
  10. Liu, D.; Bai, Y.; He, X.; Pan, D.; Chen, C.-T.A.; Li, T.; Xu, Y.; Gong, C.; Zhang, L. Satellite-derived particulate organic carbon flux in the Changjiang River through different stages of the Three Gorges Dam. Remote Sens. Environ. 2019, 223, 154–165. [Google Scholar] [CrossRef]
  11. Stramski, D.; Reynolds, R.A.; Kahru, M.; Mitchell, B.G. Estimation of Particulate Organic Carbon in the Ocean from Satellite Remote Sensing. Science 1999, 285, 239–242. [Google Scholar] [CrossRef] [PubMed]
  12. Cetinić, I.; Perry, M.J.; Briggs, N.T.; Kallin, E.; D’Asaro, E.A.; Lee, C.M. Particulate organic carbon and inherent optical properties during 2008 North Atlantic Bloom Experiment. J. Geophys. Res. Ocean. 2012, 117, C06028. [Google Scholar] [CrossRef]
  13. Duan, H.; Feng, L.; Ma, R.; Zhang, Y.; Arthur Loiselle, S. Variability of particulate organic carbon in inland waters observed from MODIS Aqua imagery. Environ. Res. Lett. 2014, 9, 084011. [Google Scholar] [CrossRef]
  14. Evers-King, H.; Martinez-Vicente, V.; Brewin, R.J.W.; Dall’Olmo, G.; Hickman, A.E.; Jackson, T.; Kostadinov, T.S.; Krasemann, H.; Loisel, H.; Röttgers, R.; et al. Validation and Intercomparison of Ocean Color Algorithms for Estimating Particulate Organic Carbon in the Oceans. Front. Mar. Sci. 2017, 4, 251. [Google Scholar] [CrossRef]
  15. Jiang, G.; Loiselle, S.A.; Yang, D.; Gao, C.; Ma, R.; Su, W.; Duan, H. An absorption-specific approach to examining dynamics of particulate organic carbon from VIIRS observations in inland and coastal waters. Remote Sens. Environ. 2019, 224, 29–43. [Google Scholar] [CrossRef]
  16. Jiang, G.; Ma, R.; Loiselle, S.A.; Duan, H.; Su, W.; Cai, W.; Huang, C.; Yang, J.; Yu, W. Remote sensing of particulate organic carbon dynamics in a eutrophic lake (Taihu Lake, China). Sci. Total Environ. 2015, 532, 245–254. [Google Scholar] [CrossRef]
  17. Son, Y.B.; Gardner, W.D.; Mishonov, A.V.; Richardson, M.J. Multispectral remote-sensing algorithms for particulate organic carbon (POC): The Gulf of Mexico. Remote Sens. Environ. 2009, 113, 50–61. [Google Scholar] [CrossRef] [Green Version]
  18. Stramska, M.; Cieszyńska, A. Ocean colour estimates of particulate organic carbon reservoirs in the global ocean—Revisited. Int. J. Remote Sens. 2015, 36, 3675–3700. [Google Scholar] [CrossRef]
  19. Stramski, D.; Reynolds, R.A.; Babin, M.; Kaczmarek, S.; Lewis, M.R.; Röttgers, R.; Sciandra, A.; Stramska, M.; Twardowski, M.S.; Franz, B.A.; et al. Relationships between the surface concentration of particulate organic carbon and optical properties in the eastern South Pacific and eastern Atlantic Oceans. Biogeosciences 2008, 5, 171–201. [Google Scholar] [CrossRef] [Green Version]
  20. Allison, D.B.; Stramski, D.; Mitchell, B.G. Empirical ocean color algorithms for estimating particulate organic carbon in the Southern Ocean. J. Geophys. Res. Ocean. 2010, 115, C10044. [Google Scholar] [CrossRef]
  21. Le, C.; Lehrter, J.C.; Hu, C.; MacIntyre, H.; Beck, M.W. Satellite observation of particulate organic carbon dynamics on the Louisiana continental shelf. J. Geophys. Res. Ocean. 2017, 122, 555–569. [Google Scholar] [CrossRef] [PubMed]
  22. Li, X.; Bianchi, T.S.; Allison, M.A.; Chapman, P.; Mitra, S.; Zhang, Z.; Yang, G.; Yu, Z. Composition, abundance and age of total organic carbon in surface sediments from the inner shelf of the East China Sea. Mar. Chem. 2012, 145–147, 37–52. [Google Scholar] [CrossRef]
  23. Wang, H.; Wu, X.; Bi, N.; Li, S.; Yuan, P.; Wang, A.; Syvitski, J.P.M.; Saito, Y.; Yang, Z.; Liu, S.; et al. Impacts of the dam-orientated water-sediment regulation scheme on the lower reaches and delta of the Yellow River (Huanghe): A review. Glob. Planet. Chang. 2017, 157, 93–113. [Google Scholar] [CrossRef]
  24. Zhou, M.-J.; Shen, Z.-L.; Yu, R.-C. Responses of a coastal phytoplankton community to increased nutrient input from the Changjiang (Yangtze) River. Cont. Shelf Res. 2008, 28, 1483–1489. [Google Scholar] [CrossRef]
  25. Wang, F.; Wang, Y.; Chen, Y.; Liu, K. Remote sensing approach for the estimation of particulate organic carbon in coastal waters based on suspended particulate concentration and particle median size. Mar. Pollut. Bull. 2020, 158, 111382. [Google Scholar] [CrossRef]
  26. Le, C.; Hu, C.; English, D.; Cannizzaro, J.; Chen, Z.; Feng, L.; Boler, R.; Kovach, C. Towards a long-term chlorophyll-a data record in a turbid estuary using MODIS observations. Prog. Oceanogr. 2013, 109, 90–103. [Google Scholar] [CrossRef]
  27. Hu, C.; Lee, Z.; Franz, B. Chlorophyll algorithms for oligotrophic oceans: A novel approach based on three-band reflectance difference. J. Geophys. Res. Ocean. 2012, 117, C01011. [Google Scholar] [CrossRef] [Green Version]
  28. Le, C.; Zhou, X.; Hu, C.; Lee, Z.; Li, L.; Stramski, D. A Color-Index-Based Empirical Algorithm for Determining Particulate Organic Carbon Concentration in the Ocean from Satellite Observations. J. Geophys. Res. Ocean. 2018, 123, 7407–7419. [Google Scholar] [CrossRef]
  29. Le, C.; Lehrter, J.C.; Hu, C.; Murrell, M.C.; Qi, L. Spatiotemporal chlorophyll-a dynamics on the Louisiana continental shelf derived from a dual satellite imagery algorithm. J. Geophys. Res. Ocean. 2014, 119, 7449–7462. [Google Scholar] [CrossRef]
  30. Cui, T.; Zhang, J.; Groom, S.; Sun, L.; Smyth, T.; Sathyendranath, S. Validation of MERIS ocean-color products in the Bohai Sea: A case study for turbid coastal waters. Remote Sens. Environ. 2010, 114, 2326–2336. [Google Scholar] [CrossRef]
  31. He, X.; Bai, Y.; Pan, D.; Chen, C.T.A.; Cheng, Q.; Wang, D.; Gong, F. Satellite views of the seasonal and interannual variability of phytoplankton blooms in the eastern China seas over the past 14 yr (1998–2011). Biogeosciences 2013, 10, 4721–4739. [Google Scholar] [CrossRef] [Green Version]
  32. Stramski, D.; Joshi, I.; Reynolds, R.A. Ocean color algorithms to estimate the concentration of particulate organic carbon in surface waters of the global ocean in support of a long-term data record from multiple satellite missions. Remote Sens. Environ. 2022, 269, 112776. [Google Scholar] [CrossRef]
  33. O’Reilly, J.E.; Maritorena, S.; Siegel, D.A.; O’Brien, M.C.; Toole, D.; Mitchell, B.G.; Kahru, M.; Chavez, F.P.; Strutton, P.; Cota, G.F. Ocean color chlorophyll a algorithms for SeaWiFS, OC2, and OC4: Version 4. SeaWiFS Postlaunch Calibration Valid. Anal. 2000, 3, 9–23. [Google Scholar]
  34. O’Reilly, J.E.; Werdell, P.J. Chlorophyll algorithms for ocean color sensors—OC4, OC5 & OC6. Remote Sens. Environ. 2019, 229, 32–47. [Google Scholar] [CrossRef] [PubMed]
  35. Chen, S.; Smith, W.O., Jr.; Yu, X. Revisiting the Ocean Color Algorithms for Particulate Organic Carbon and Chlorophyll-a Concentrations in the Ross Sea. J. Geophys. Res. Ocean. 2021, 126, e2021JC017749. [Google Scholar] [CrossRef]
  36. Hu, S.; Cao, W.; Wang, G.; Xu, Z.; Zhao, W.; Lin, J.; Zhou, W.; Yao, L. Empirical ocean color algorithm for estimating particulate organic carbon in the South China Sea. Chin. J. Oceanol. Limnol. 2015, 33, 764–778. [Google Scholar] [CrossRef] [Green Version]
  37. Wang, Z.; Bai, Y.; He, X.; Tao, B.; Li, T.; Chen, X.; Wang, T.; Gong, F. Estimating particulate organic carbon flux in a highly dynamic estuary using satellite data and numerical modeling. Remote Sens. Environ. 2021, 252, 112116. [Google Scholar] [CrossRef]
  38. Huang, C.; Jiang, Q.; Yao, L.; Li, Y.; Yang, H.; Huang, T.; Zhang, M. Spatiotemporal Variation in Particulate Organic Carbon Based on Long-Term MODIS Observations in Taihu Lake, China. Remote Sens. 2017, 9, 624. [Google Scholar] [CrossRef] [Green Version]
  39. Wu, Y.; Bao, H.; Yu, H.; Zhang, J.; Kattner, G. Temporal variability of particulate organic carbon in the lower Changjiang (Yangtze River) in the post-Three Gorges Dam period: Links to anthropogenic and climate impacts. J. Geophys. Res. Biogeosciences 2015, 120, 2194–2211. [Google Scholar] [CrossRef] [Green Version]
  40. Wang, X.; Ma, H.; Li, R.; Song, Z.; Wu, J. Seasonal fluxes and source variation of organic carbon transported by two major Chinese Rivers: The Yellow River and Changjiang (Yangtze) River. Glob. Biogeochem. Cycles 2012, 26, GB2025. [Google Scholar] [CrossRef]
  41. Zhang, L.; Xue, M.; Wang, M.; Cai, W.-J.; Wang, L.; Yu, Z. The spatiotemporal distribution of dissolved inorganic and organic carbon in the main stem of the Changjiang (Yangtze) River and the effect of the Three Gorges Reservoir. J. Geophys. Res. Biogeosci. 2014, 119, 741–757. [Google Scholar] [CrossRef] [Green Version]
  42. Qiu, Y.; Laws, E.A.; Wang, L.; Wang, D.; Liu, X.; Huang, B. The potential contributions of phytoplankton cells and zooplankton fecal pellets to POC export fluxes during a spring bloom in the East China Sea. Cont. Shelf Res. 2018, 167, 32–45. [Google Scholar] [CrossRef]
  43. Kim, H.-J.; Miller, A.J.; McGowan, J.; Carter, M.L. Coastal phytoplankton blooms in the Southern California Bight. Prog. Oceanogr. 2009, 82, 137–147. [Google Scholar] [CrossRef]
  44. Xu, F.; Yao, Y.; Oey, L.; Lin, Y. Impacts of pre-existing ocean cyclonic circulation on sea surface chlorophyll-a concentrations off northeastern Taiwan following episodic typhoon passages. J. Geophys. Res. Ocean. 2017, 122, 6482–6497. [Google Scholar] [CrossRef]
  45. Shang, S.; Li, L.; Li, J.; Li, Y.; Lin, G.; Sun, J. Phytoplankton bloom during the northeast monsoon in the Luzon Strait bordering the Kuroshio. Remote Sens. Environ. 2012, 124, 38–48. [Google Scholar] [CrossRef]
  46. Wang, J.; Tang, D.; Sui, Y. Winter phytoplankton bloom induced by subsurface upwelling and mixed layer entrainment southwest of Luzon Strait. J. Mar. Syst. 2010, 83, 141–149. [Google Scholar] [CrossRef]
  47. Shen, F.; Zhou, Y.; Li, J.; He, Q.; Verhoef, W. Remotely sensed variability of the suspended sediment concentration and its response to decreased river discharge in the Yangtze estuary and adjacent coast. Cont. Shelf Res. 2013, 69, 52–61. [Google Scholar] [CrossRef]
  48. Loisel, H.; Morel, A. Light scattering and chlorophyll concentration in case 1 waters: A reexamination. Limnol. Oceanogr. 1998, 43, 847–858. [Google Scholar] [CrossRef] [Green Version]
  49. Hunter, P.D.; Tyler, A.N.; Présing, M.; Kovács, A.W.; Preston, T. Spectral discrimination of phytoplankton colour groups: The effect of suspended particulate matter and sensor spectral resolution. Remote Sens. Environ. 2008, 112, 1527–1544. [Google Scholar] [CrossRef]
  50. Hao, Q.; Chai, F.; Xiu, P.; Bai, Y.; Chen, J.; Liu, C.; Le, F.; Zhou, F. Spatial and temporal variation in chlorophyll a concentration in the Eastern China Seas based on a locally modified satellite dataset. Estuar. Coast. Shelf Sci. 2019, 220, 220–231. [Google Scholar] [CrossRef]
  51. Salisbury, J.E.; Campbell, J.W.; Linder, E.; David Meeker, L.; Müller-Karger, F.E.; Vörösmarty, C.J. On the seasonal correlation of surface particle fields with wind stress and Mississippi discharge in the northern Gulf of Mexico. Deep Sea Res. Part II Top. Stud. Oceanogr. 2004, 51, 1187–1203. [Google Scholar] [CrossRef]
Figure 1. The locations of the measured sample points obtained during the cruises in the Changjiang Estuary, East China Sea, and Chaoshan Sea are shown in boxes (AC), respectively. (ac are the remote sensing reflectances extracted from the corresponding locations according to Section 2.2, where the solid line represents type II waters, the dotted line represents type I waters and different colors represent the POC concentration level at the sampling points.)
Remotesensing 14 03220 g001
Figure 2. (a,b) describe the spectral characteristics of remote sensing reflectance of different water types matched based on the location of sampling points, respectively. (Different colors are used to represent cruises in different periods).
Remotesensing 14 03220 g002
Figure 3. (a) Relationships between in-situ log10(POC) and satellite-derived CIPOC, and (c) in-situ log10(POC) and satellite-derived Rrs(645)/Rrs(547); comparison between measured POC and satellite-derived POC determined from the CIPOC (b) and band-ratio (d) algorithms.
Remotesensing 14 03220 g003
Figure 4. Variations in POC mean concentrations in the East China Sea on a seasonal (a) and yearly (b) scale (The black dotted line represents the trend line of POC and year).
Remotesensing 14 03220 g004
Figure 5. Long-term series distribution of annual mean particulate organic carbon concentration in surface seawater of the East China Sea from 2003 to 2020.
Remotesensing 14 03220 g005
Figure 6. Time series of the monthly mean surface concentration of POC in the East China Sea and the monthly mean discharge of the Changjiang River’s Datong hydrological station from 2003 to 2020.
Remotesensing 14 03220 g006
Figure 7. (a) is the true-color MODIS remote sensing image when the phytoplankton bloom event occurred in the East China Sea; (b,c) are the chlorophyll-a and POC distribution maps at the time of the phytoplankton bloom, respectively; (d) is the true-color MODIS remote sensing image ten days after the phytoplankton bloom event occurred in the East China Sea; (e,f) are the chlorophyll-a and POC distribution maps approximately ten days after the phytoplankton bloom (the red boxed area is the identified phytoplankton bloom).
Remotesensing 14 03220 g007
Figure 8. Time series of the monthly mean surface concentration of POC and chlorophyll-a in the Changjiang Estuary (upper) and the East China Sea (bottom) from 2003 to 2020, respectively.
Remotesensing 14 03220 g008
Figure 9. (a) is the distribution map of the path of Typhoon TAPAH, and (b,c) are the composite maps of the POC concentration distribution for seven days before and after the typhoon’s transit, respectively (red boxes are the selected subregions).
Remotesensing 14 03220 g009
Figure 10. Comparison of in-situ POC and MODIS-derived POC concentration in Chaoshan sea.
Remotesensing 14 03220 g010
Figure 11. Examples of POC distribution derived from MODIS observations in the Chaoshan Sea.
Remotesensing 14 03220 g011
Table 1. Model Comparisons of local adjusted particulate organic carbon (POC) algorithms in the East China Sea.
CategoriesNameAlgorithm FormulaDefinitions of XSlope R2RMSE
(mg/m3)
MAPE
(%)
Bias
CAT1BR-PFPOC = a(X)b + cRrs(443)/Rrs(547)0.66 0.57 212.49 53.16 25.97
CAT2MBR_V3log(POC) = a0 + a1log(X)1 + a2log(X)2 + a3log(X)3max[ Rrs 443 Rrs 547 , Rrs 488 Rrs 547 ]1.47 0.61 187.31 68.44 −18.87
MBR_V4log(POC) = a0 + a1log(X)1 + a2log(X)2 + a3log(X)3 + a4log(X)4max[ Rrs 443 Rrs 547 , Rrs 488 Rrs 547 , Rrs 510 v Rrs 547 ]0.64 0.47 230.73 57.74 35.07
MBR_V5log(POC) = a0 + a1log(X)1 + a2log(X)2 + a3log(X)3 + a4log(X)4 + a5log(X)5 max [ Rrs 412 Rrs 547 , Rrs 443 Rrs 547 , Rrs 488 Rrs 547 , Rrs 510 v Rrs 547 ]0.63 0.48 232.41 56.43 36.09
CAT3CIPOClog(POC) = aX + b Rrs ( 547 ) [ Rrs ( 488 ) + 547 488 678 488 × (Rrs(678)-Rrs(488))]0.36 0.34 374.26 98.03 92.50
CAT4NDCIlog(POC) = a0 + a1X1 + a2X2 + a3X3 + a4X4 + a5X5 Rrs 547 Rrs 443 Rrs 547 + Rrs 443 0.75 0.55 200.36 55.33 26.10
CAT5MNDCIlog(POC) = a0 + a1X1 + a2X2 + a3X3 Rrs 547 max Rrs 412 , Rrs 443 , Rrs 488 Rrs 547 + max Rrs 412 , Rrs 443 , Rrs 488 0.88 0.61 175.98 54.87 19.29
CAT6BRDI_1log(POC) = a0 + a1X1 + a2X2 + a3X3 + a4X4 Rrs 443 Rrs 547 Rrs 488 0.59 0.61 231.53 52.49 35.59
BRDI_2log(POC) = a0 + a1X1 + a2X2 + a3X3 + a4X4 + a5X5 Rrs 443 Rrs 547 Rrs 510 0.77 0.54 197.51 58.71 22.46
BRDI_3log(POC) = a0 + a1X1 + a2X2 + a3X3 + a4X4 + a5X5 Rrs 488 Rrs 547 Rrs 510 0.62 0.62 217.11 59.68 28.77
CAT7MLR_1log(POC) = a0 + a1Rrs(λ1) + a2Rrs(λ2)λ1 = 443, λ2 = 5470.70 0.57 204.83 63.47 33.83
MLR_2log(POC) = a0 + a1Rrs(λ1) + a2Rrs(λ2)λ1 = 443, λ2 = 5100.60 0.42 244.17 76.61 37.46
MLR_3log(POC) = a0 + a1Rrs(λ1) + a2Rrs(λ2)λ1 = 488, λ2 = 5100.66 0.60 209.97 59.00 33.01
MLR_4log(POC) = a0 + a1Rrs(λ1) + a2Rrs(λ2)λ1 = 488, λ2 = 5470.76 0.70 172.22 56.54 33.23
MLR_5log(POC) = a0 + a1Rrs(λ1) + a2Rrs(λ2) + a3Rrs(λ3) + a4Rrs(λ4)λ1 = 412, λ2 = 469, λ3 = 488, λ4 = 5310.70 0.70 183.33 60.29 27.18
This studylog(POC) = aX + b
if Rrs(488) ≥ Rrs(547)
Rrs ( 547 ) [ Rrs ( 488 ) + 547 488 678 488 × (Rrs(678) − Rrs(488))]1.140.84156.1443.30−64.79
log(POC) = aX + b
if Rrs(488) < Rrs(547)
Rrs(645)/Rrs(547)
Publisher’s Note: MDPI stays neutral with regard to jurisdictional claims in published maps and institutional affiliations.

