Article

Spatio-Temporal Evolution of a Typical Sandstorm Event in an Arid Area of Northwest China in April 2018 Based on Remote Sensing Data

1
School of Soil and Water Conservation, Beijing Forestry University, Beijing 100083, China
2
Key Laboratory of Soil and Water Conservation and Desertification Prevention, Beijing Forestry University, Beijing 100083, China
3
Jinyun Forest Ecosystem Research Station, School of Soil and Water Conservation, Beijing Forestry University, Beijing 100083, China
4
Department of Soil Protection and Recultivation, Faculty of Environment and Natural Sciences, Brandenburg University of Technology, D-03046 Cottbus, Germany
*
Author to whom correspondence should be addressed.
Remote Sens. 2022, 14(13), 3065; https://doi.org/10.3390/rs14133065
Submission received: 28 April 2022 / Revised: 2 June 2022 / Accepted: 21 June 2022 / Published: 26 June 2022

Abstract

:
Northwest China is significantly affected by sandstorm disasters. To mitigate the negative impacts of sandstorm events, it is critical to understand the spatio-temporal variations in typical sand and dust storms and their influencing factors. In this work, using ground-based measurements of particulate matter and remote sensing data such as MODIS, OMI, and CALIPSO data, the sources of aerosol pollution and aerosol optical properties of a typical sandstorm event that occurred in Northwest China in 2018 was studied. In addition, the HYSPLIT model was used to explore the air mass trajectories in order to analyze the sand and dust migration process during the sandstorm event. Furthermore, the wind erosion sensitivity of Northwest China was analyzed via single factor analysis and multi-factor superposition of wind field intensity, soil drought index, vegetation coverage, and relief amplitude. Finally, the region of the study area having a high comprehensive wind erosion sensitivity was identified. The results showed that the PM10 concentrations exceeded 400 µg/m3 and the PM2.5/PM10 ratio did not exceeded 0.6 during the sandstorm event, indicating that natural particulate matter was dominant in the ambient air. At the epicenter of pollution, the aerosol optical depth (AOD) at 550 nm was 0.75–1. By combining AOD data with wind speed and direction data from field observation stations, it was found that the sandstorm event in 2018 mainly occurred between 1 April and 3 April, and affected all of Northwest China on 2 April and 3 April. The absorbed aerosol index (AAI) ranged between 2.5 and 4, indicating that the Taklimakan Desert was the main source of sandstorm events in Northwest China. The CALIPSO total attenuated backscatter coefficient at 532 nm indicated that the main component of tropospheric aerosol in this region was distributed in the range of 0–12.5 km. The simulated airflow track showed that it had the same dust source regions as AAI index studies. Moreover, investigation of wind erosion sensitivity in the study areas indicated that the Taklimakan Desert and other desert regions were the main ecologically sensitive areas. These conclusions can provide references and suggestions for the mitigation of damage caused by sandstorm events, in addition to the enhancement of ecological governance.

1. Introduction

Sandstorm events originate in drylands when strong winds blow and separate non-stabilized soil particles from a dried surface, and are common in Northwest China [1,2,3,4]. These events negatively affect the climate and human health, and also have adverse environmental and socio-economic impacts [5,6,7]. Furthermore, wind-blown dust is a significant contributor to the transport of pathogens and pollutants, which can influence air quality by reducing visibility and changing the nature of air pollutants [8,9,10]. This dust can also cause respiratory illness, allergies, and skin diseases by increasing the inhalable dust in the air [11,12,13]. As a part of the Central Asian sandstorm region, Northwest China is the main source of dust aerosols in East Asia [14,15]. Sand and dust transported by wind from this area are deposited as sediment in the Loess Plateau and also cause pollution throughout northern China [11]. Therefore, it is important to explore the trajectories of sandstorms to improve vegetation conditions in vulnerable areas and mitigate the damage caused by sand and dust events.
Abundant sources of sand and dust, dry weather, strong wind, and unstable thermal conditions are prerequisites to the occurrence of sand and dust events [16,17]. During such events, desert winds can transport particles from sand and dust storm sources thousands of kilometers from their source region [2,18,19]. In addition, the intensity of dust events is further enhanced under strong winds and causes more serious soil wind erosion during its transportation [20]. Wind erosion of soil, which is closely related to soil properties, is the primary cause of sandstorm events in arid desert areas having stable sand sources. Previous studies [16] have found that the generation and development of sandstorms are influenced by local climatic factors such as temperature, precipitation, wind, humidity, and land cover change. Thus, it is important to detect the possibility of wind erosion and the extent of its development, identify ecologically sensitive areas, and predict the occurrence and movement of regional sandstorm events by analyzing the wind erosion sensitivity of soil in the source regions of these events.
Dust is a major source of tropospheric aerosol loading and constitutes an important parameter in climate aerosol forcing studies, making real-time monitoring of sand and dust events essential [21]. However, traditional monitoring methods are limited in their temporal and spatial coverage, which renders them unsuitable to study the long-range transportation of sandstorms. Remote sensing is an effective method to identify and monitor sandstorms [22,23,24]. Numerous studies on dust transport at large spatial scales have been conducted based on dust aerosol data from MODIS, CALIPSO, and other satellites [25,26,27]. Li et al. [9] proposed three methodologies to monitor sand and dust events using the features of different sensor channels and dust event spectra based on MODIS data. Liu et al. [15] monitored and analyzed the ground conditions on the basis of sandstorm identification models (SVI), in addition to MODIS data and observation data from meteorological observation stations. Sun et al. [26] developed a dynamic threshold sandstorm monitoring method based on the MODIS MOD09A1 product. However, aerosol optical depth data obtained via satellites have low accuracy and a short time series due to limitations in the data processing algorithms employed [22]. LiDAR observations can accurately reflect the vertical distribution of dust; however, such dust stations are sparsely distributed [28,29].
In this study, Northwest China, which has the most abundant sand and dust sources in China, was selected as the target area. The aerosol transport paths and dust sources of sandstorm events originating in Northwest China were explored with the HYSPLIT model using ground-based measurements of particulate matter, in addition to MODIS, OMI, and CALIPSO data. Moreover, the wind field intensity, vegetation coverage, relief amplitude, and soil drought index of the target region in 2018 were analyzed based on satellite and field observation data to identify areas with high wind erosion sensitivity. The results of this work are expected to provide a scientific reference for the mitigation of sandstorm-induced damage in vulnerable ecological regions in similar areas.

2. Materials and Methods
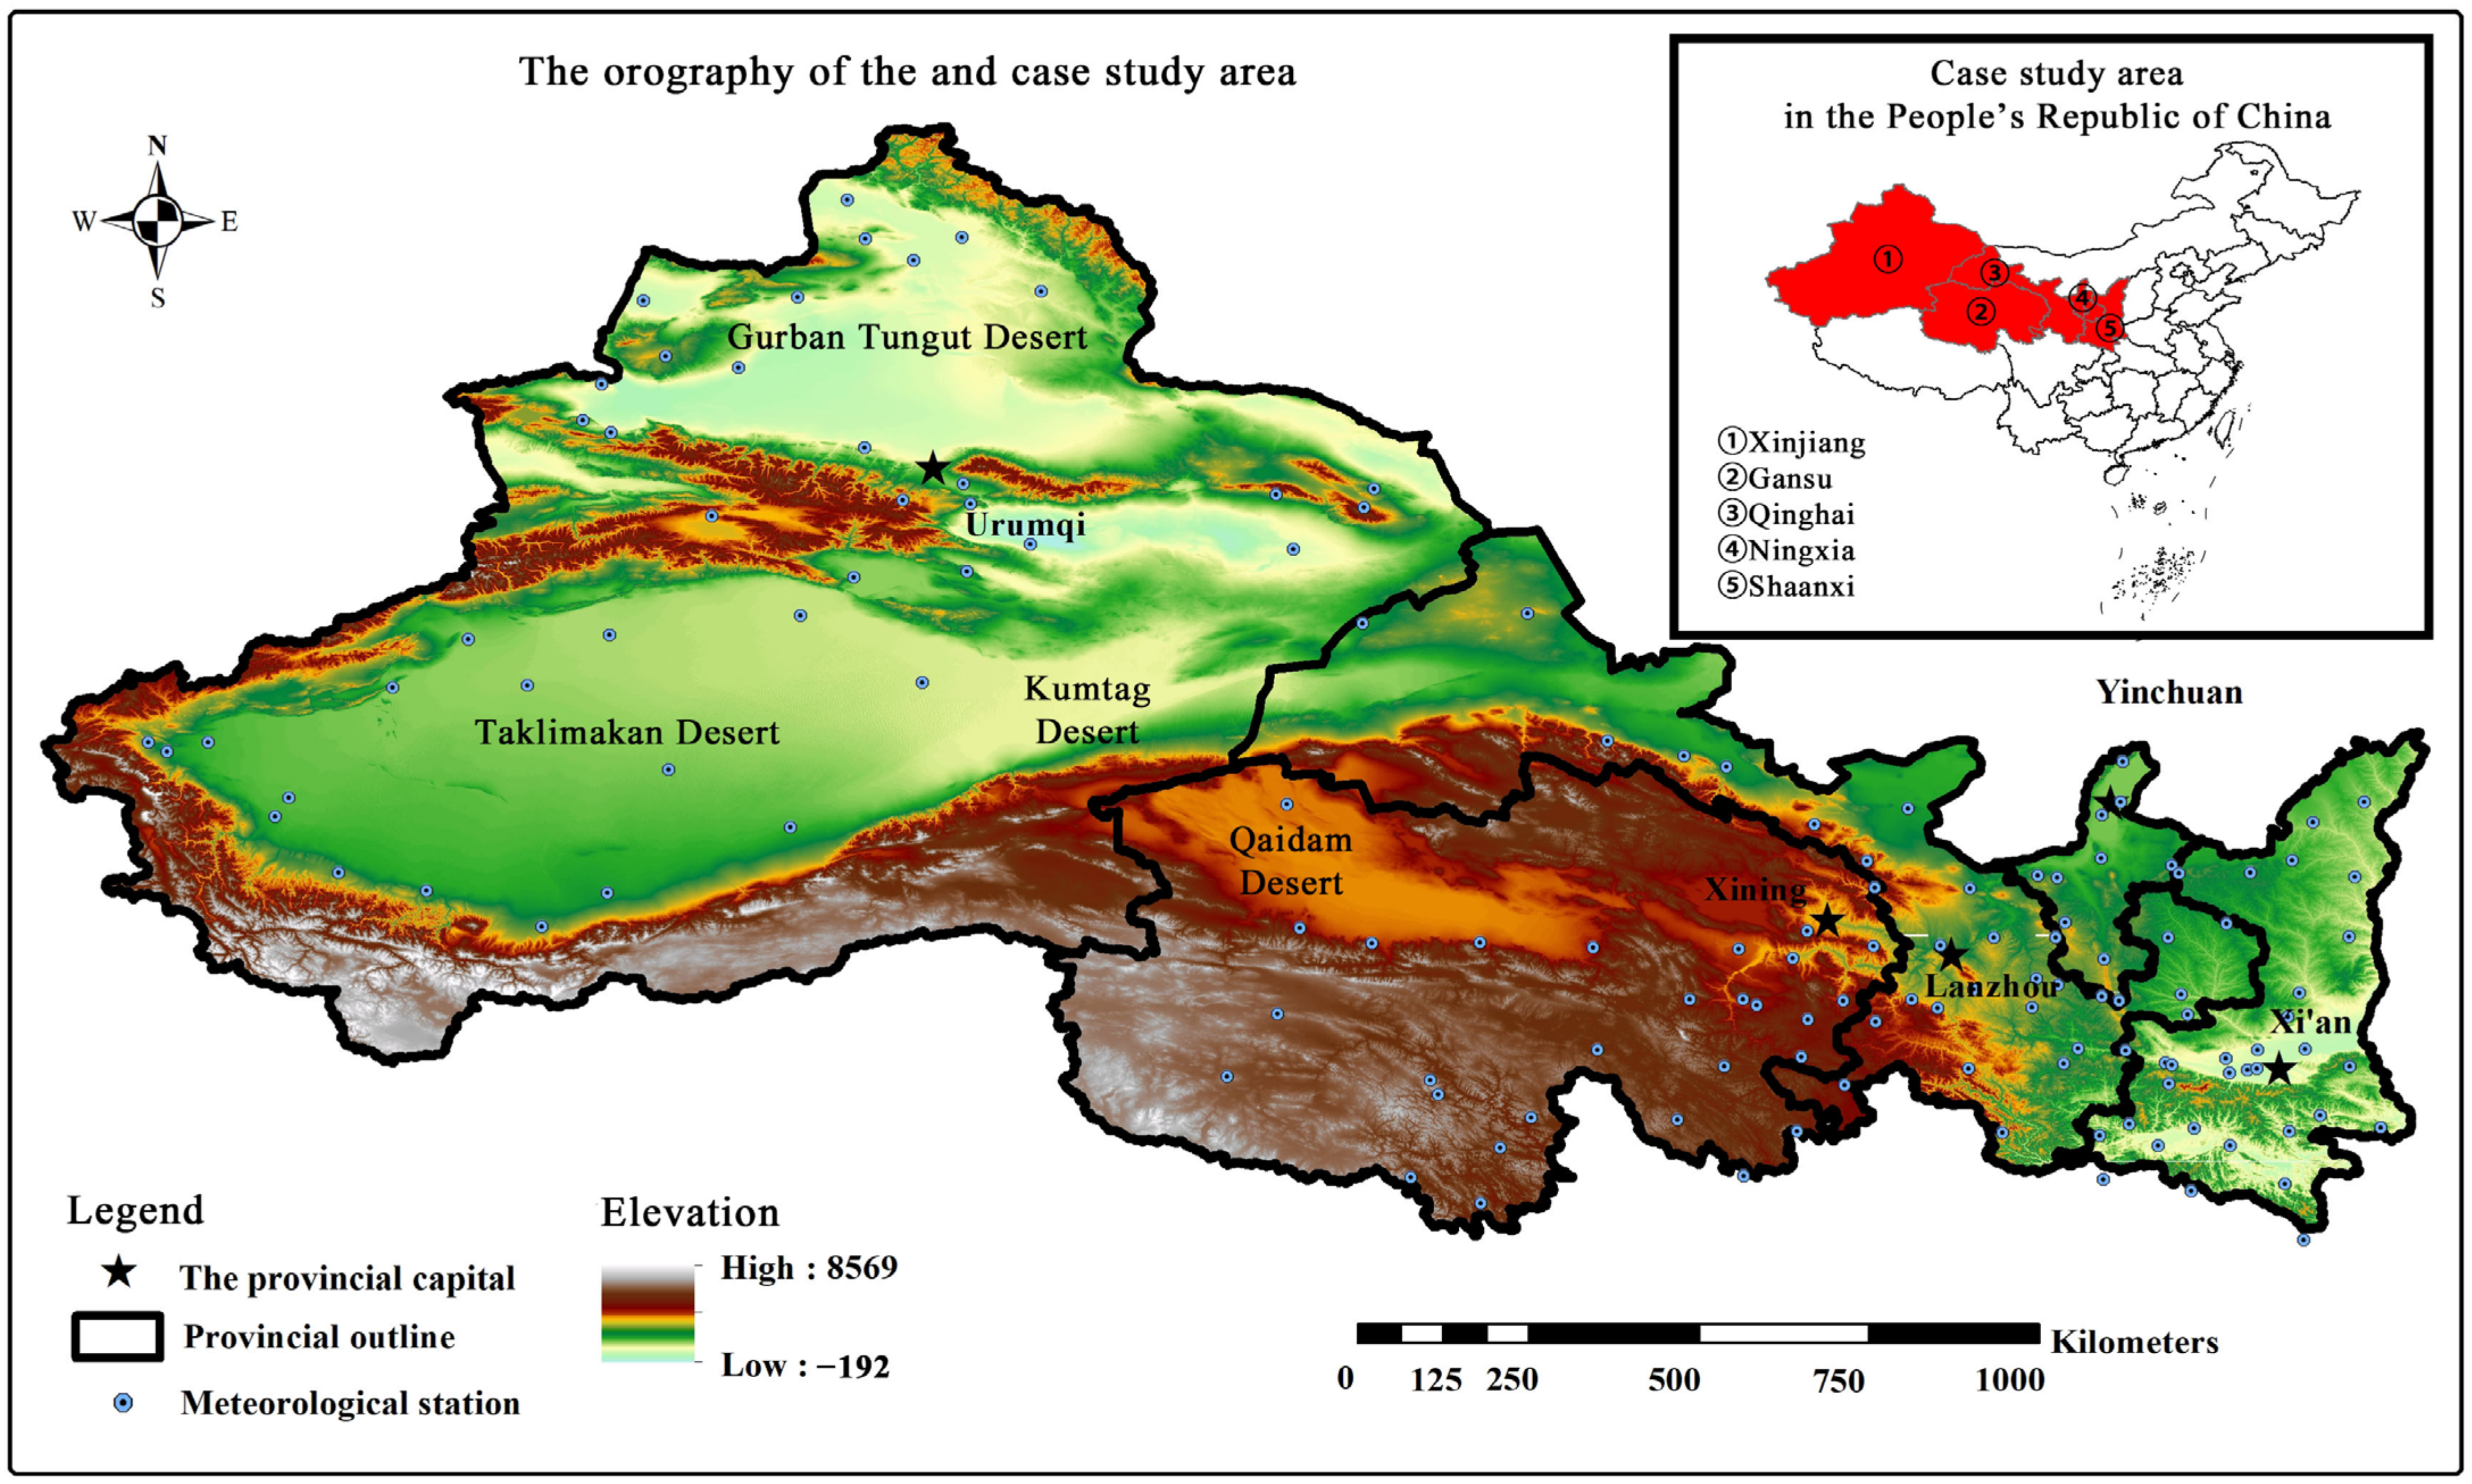
2.1. Study Area

This study took Northwest China as the study area, including Shaanxi, Gansu, Qinghai, Ningxia, and Xinjiang, which accounts for nearly one-third of China’s total land area (Figure 1). It is located inland and close to the source of the winter monsoon, and most areas of this region experience a moderately temperate and warm temperate continental climate, whereas a very small proportion of the region experiences an alpine climate. Due to the arid climate, the total annual precipitation in the region is low, with most areas having a total annual precipitation of less than 400 mm, with a decreasing trend from east to west. Droughts and winds are prominent features of the natural environment in this area [25,30]. The wind speed in this region is higher in the south and lower in the north, and the annual average wind speed in most regions is 1–4 m/s. Most of the area is under the control of westerly winds. The average annual relative humidity in much of the northwest region is below 50%. The relative humidity of Qaidam Basin is only 30%, which is the driest place in China. This region exhibits large differences in diurnal and annual temperature. The terrain of Northwest China consists mainly of a plateau and basin with widespread deserts, and the elevation in the region varies greatly. These topographic areas all belong to the second ladder of China’s topography. In terms of altitude, the Weihe Plain of Guanzhong in Shaanxi province is about 400 to 600 m above sea level, the average altitude of the Loess Plateau is about 1000 m, and the Qaidam Basin of Qinghai Province is between 2600 and 3000 m above sea level. Due to the natural geographical environment in the study area, desertified land and deserts are densely distributed in this region of China. In terms of soil and vegetation structure, the distribution of vegetation in the horizontal direction has a clear regional variation in longitude, from east to west, from grassland to desert steppe to desert. The soil in this region is dominated by desert soil, namely black lime soil. The natural geographical characteristics of the study area make it the most concentrated area of desertified land and desert in China. There are four major deserts in Northwest China, namely the Gurban Tungut Desert, Taklimakan Desert, Kumtag Desert, and Qaidam Desert.

2.2. Data Sources

A typical sandstorm event during the period of 1–3 April 2018 was selected according to the reach of sandstorms and duration of events of 2018 in the Sand-dust Weather Almanac published by China Meteorological Press.
PM2.5 (PM10) refers to an environment comprising air particles having a diameter less than or equal to 2.5 (10) micron particles. For aerosol pollution analysis, atmospheric particulate matter (PM2.5 and PM10) data were obtained from the Real-time Urban Air Quality Publishing platform of the National Environmental Monitoring Center (http://data.cma.cn/ (accessed on 20 May 2021)). Furthermore, the wind speed and wind direction data in this dataset were selected, and the main wind speed and wind direction during the sandstorm event were reproduced on a map using the cubic spline interpolation method. For analysis of the optical characteristics of dust aerosols, the MODIS MCD19A2 data (https://ladsweb.nascom.nasa.gov/search (accessed on 26 May 2021)) product derived from MODIS aerosol optical depth (AOD) data was used. The sand and dust migration process was studied comprehensively using a composite of UV absorbing aerosol index (AAI) data from the OMI-Aura L3 OMAERO-e data product (https://disc.gsfc.nasa.gov/ (accessed on 26 May 2021)), CALIPSO Level 1 data (https://subset.larc.nasa.gov/calipso/index.php (accessed on 26 may 2021)), and the backward trajectory simulated by the HYPLIT model (https://www.arl.noaa.gov/hysplit/ (accessed on 15 June 2021)). The meteorological data used for the HYSPLIT model were taken from the Official Website of the Global Data Assimilation System (https://www.ready.noaa.gov/archives.php (accessed on 15 June 2021)).
Wind field intensity calculations during the sandstorm event in 2018 were performed using the average wind speed data for each station in the study area from the China Surface Climate Data daily dataset of the China Meteorological Data Service Centre. In addition, mean annual precipitation and temperature data were used to calculate soil dryness across the study area after interpolation with a resolution of 1 km.
The vegetation coverage was estimated based on the Normalized Difference Vegetation Index (NDVI) dataset of the MODIS MOD13Q1 data product. The regional relief amplitude was obtained from DEM data.

2.3. Wind Field Intensity Calculations

The wind field intensity of the region was estimated using the daily average wind speed data from 118 stations in 2018. It was calculated using the formula in the revised wind erosion equation (RWEQ) provided by the USA Department of Agriculture [31], as follows:
W = i = 1 n U × ( U U C ) 2
where W is the wind field intensity (m3/s3); U is the wind speed at a height of 2 m above the ground at the monitoring meteorological station (m/s); and UC is the critical wind speed at a height of 2 m above the ground, which is normally set as 2 m/s. Subsequently, the spatial sensitivity pattern of the regional wind energy was obtained via cubic spline interpolation based on the calculated wind field intensity data.

2.4. Soil Drought Index Calculations

The calculation method of the modified Selianinov model is relatively feasible, and can meet the calculation needs without significant adjustment, based on the annual accumulated temperature data of each temperature base point recorded by meteorological observation stations in 2018 [32].
This model was used to calculate the soil drought index based on the annual precipitation and cumulative temperature [33], as follows:
D = 0.16 T ( > 10 ° C ) / P
where D (°C/mm) is the soil drought index of the study area, P (mm) is the annual precipitation, and T (°C) > 10 °C refers to the annual cumulative temperature that exceeds 10 °C.
The annual precipitation was calculated by the daily precipitation of 133 meteorological stations in Northwest China and the accumulated temperature greater than 10 °C was calculated from the daily average temperature. We obtained the data of annual precipitation and accumulated temperature of the whole region by cubic spline interpolation, then estimated the soil drought index in the study area.

2.5. Vegetation Coverage Calculations

MOD13Q1 data for the study area in 2018 were used to calculate vegetation coverage. Higher vegetation coverage indicates better plant growth. Based on the NDVI data obtained from the MOD13Q1 dataset, the vegetation coverage was estimated as follows [34]:
f v = N D V I N min N max N min
where fν is the vegetation coverage of the study area, and Nmax and Nmin refer to the maximum and minimum NDVI values, respectively.

2.6. Relief Amplitude Calculations

SRTM-3 data having a resolution of 90 m in 2018 were used to construct a regional relief amplitude model [35]. The equation employed was as follows:
R = H max H min
where R (m) represents the relief amplitude, and Hmax (m) and Hmin (m) represent the maximum and minimum elevation values in the study area, respectively.

3. Results

3.1. Spatio-Temporal Evolution of Typical Sandstorm Events in the Arid Area of Northwest China

Sandstorm events occur in the study area more than ten times per year on average. One sandstorm event that occurred from 1 April to 3 April in 2018 was investigated in this study, due to its intensity and range of influence.

3.1.1. Aerosol Pollution during Typical Sandstorm Events

During the sandstorm event, the dust in the atmosphere increased significantly and formed one of the main components of tropospheric aerosol. The concentration of particulate matter also increased in the sand source area and over the impacted areas during this event. Therefore, aerosol pollution of sandstorm events is an important parameter to study, and analysis of aerosol pollution can help provide a comprehensive insight into sandstorm events. Moreover, the PM2.5/PM10 ratio can be used as an indicator of the quantities of these particles in the atmosphere, and can help determine the sources of these particles and their formation processes [36,37], because fine and highly dispersed aerosol particles in the atmosphere have different sources, physical properties, and chemical properties. A high PM2.5/PM10 ratio indicates that the pollution is anthropogenic, whereas a low ratio may indicate that the pollution event involves significant quantities of hard particles originating from natural sources [38], which may be sandstorm events.
This study used the air pollution concentration of typical cities to explore the air pollution properties of surrounding areas. Five provincial capitals in the study area were selected as representative cities in this study, due to the fact that they would receive more attention from the local government. Then, the nature of air pollution sources in these cities and the change trend of pollution based on monitoring data of atmospheric particulate matter in the urban areas of these cities were estimated.
The results (Figure 2) showed that daily PM10 concentrations in provincial capitals in Northwest China changed greatly from 25 µg/m3 to more than 200 µg/m3 during the sandstorm event. The PM10 concentrations in all cities significantly exceeded the threshold of 50 µg/m3 specified by the National Ambient Air Quality Standard (GB3095-2012), and were sometimes more than 400 µg/m3. During the sandstorm event in 2018, the PM10 concentration in Urumqi did not exhibit any notable change, making it difficult to determine whether the sandstorm event caused any changes in the PM10 concentrations. The concentration of PM10 in Xining rose to 286 µg/m3 on 3 April, and then continued to rise to 484 µg/m3 on 4 April and 586 µg/m3 on 5 April. PM10 concentration in Lanzhou was at a high level during the study period, and PM10 concentration in Lanzhou from 3 April to 5 April was also significantly higher than that in other periods. On 3 April, the concentration was 339 µg/m3, and rose rapidly to 895 µg/m3 on 4 April, and then fell back to 347 µg/m3 on 5 April. The concentration of PM10 in Yinchuan reached 206 µg/m3 on 2 April, when the dust storm occurred, and was 318 µg/m3 and 265 µg/m3, respectively, on 4 April and 5 April. The concentration of PM10 in Xi’an was relatively high from 1 April to 3 April, reaching 352 µg/m3 in the following 4 days. Thus, we can infer the 2018 sandstorm event affected all of the studied cities, except Urumqi.
The PM2.5/PM10 ratios in the target cities were lower than 0.6 during the sandstorm events, indicating that the proportion of fine particles in atmospheric particulate matter was small during this period. This result indicated that the influence of natural dust sources led to the increase in inhalable particulate matter content in the atmosphere in these cities. Moreover, it was evident that the air quality in Xining, Yinchuan, Lanzhou, Xi’an, and surrounding areas was significantly affected. Furthermore, the evolution trends of the PM2.5/PM10 ratios indicated that the change was influenced by natural pollution sources, so it could be inferred that the sandstorm event had a strong impact on the above areas. Therefore, these cities were selected as specific points in the simulated reverse trajectory of the sandstorm event.

3.1.2. Evaluation of Regional AOD

Accurate observation of aerosol optical characteristics is the basis for comprehensive scientific evaluation of sandstorm events. AOD is one of the main physical parameters of aerosol optical characteristics, and can be used to represent the aerosol content and atmospheric pollution [39,40]. Dust can reduce ground visibility and increase AOD, which leads to changes in AOD due to its specific extinction effect. In this study, the regional AOD was obtained via field- and satellite-based observations [41]. Land AOD data from the MODIS MCD19A2 data product were used to analyze the optical characteristics of regional aerosols.
As seen from the AOD data, the spatial distribution of the atmospheric aerosol optical depth in Northwest China changed significantly and showed regional variation over time during the sandstorm event in 2018 (Figure 3). AOD data obtained during the sandstorm event in 2018 showed that the spatial distribution of the AOD index in Northwest China changed obviously. Areas with high AOD values were distributed in small parts of Gansu, Ningxia, Shaanxi, and the central part of the Southern Xinjiang Basin on 30 March, and this was consistent with the distribution of PM10 concentrations. This was because the possibility of other events causing the high value cannot be excluded. From 2 April onwards, some areas of the southern Xinjiang Basin began to exhibit extremely high AOD values. During the next few days, the area of influence of this event continued to expand until most areas of southern Xinjiang Basin were affected. The AOD values in other parts of the study area were lower than those in the southern Xinjiang Basin.
Overall, the spatial distribution of the atmospheric aerosol optical depth in Northwest China demonstrated considerable regional variation. Prior to the occurrence of the events, the aerosol concentration in the study area was in the range of 0.1–0.6, and the areas with relatively high aerosol concentrations were mainly distributed in the desert area of the southern Xinjiang Basin and a small part of northern Xinjiang. During the sandstorm event, there was an area that exhibited an aerosol index in the range of 0.75–1, and this area migrated as the event progressed. The area with the high aerosol index first appeared in the desert region of Xinjiang, and gradually expanded within this region with the occurrence of the sandstorm. Subsequently, this area appeared in Qinghai, followed in turn by Gansu, Ningxia, and Shaanxi, and this was also the trajectory followed by the sandstorm. It could be concluded that the sandstorm event originated in southern Xinjiang and affected the southern Xinjiang basin, in addition to Qinghai, Gansu, Ningxia, and Shaanxi provinces.
This study explored the change in the wind speed and direction with AOD, as Parajuli et al. [42] found that wind speed had a good correlation with AOD and the relationship between wind and dust presented a non-linear correlation. Figure 4 shows the distribution of wind speed and wind direction during the sandstorm event. According to the study of Huang et al. [43], for the daily average wind speed near the surface, the cubic spline function interpolation can achieve better interpolation accuracy. Therefore, the main wind speed and wind direction data are reproduced on the map during the sandstorm event based on this method. The size of the arrows in the figure indicates the magnitude of the wind speed, and the direction of the arrows indicates the wind direction. The direction of dust aerosol propagation was highly consistent with the wind direction. Figure 4 shows that the surface wind speed was mostly easterly at the junction of Xinjiang-Gansu-Qinghai, which was not conducive to the transport of dust aerosol downstream from the deserts. It is known that the wind direction at different altitude levels in Taklamakan Desert and surrounding areas is different; as a result, the near-surface level is not conducive to the eastward transport of dust [44]. In this study, the data of wind speed and direction were taken mainly from near-surface meteorological stations. Only when its rises to more than 3 km can dust be transported to downstream under the action of the westerly wind. This may be the cause for the different simulation results of wind direction and airflow reverse trajectory near the surface. The sandstorm event mainly occurred during the period of 1–3 April, and affected all of Northwest China on 2 April and 3 April. This indicates that the atmospheric concentration of dust aerosol was higher, the transmission speed was greater, and the influence range was wider.

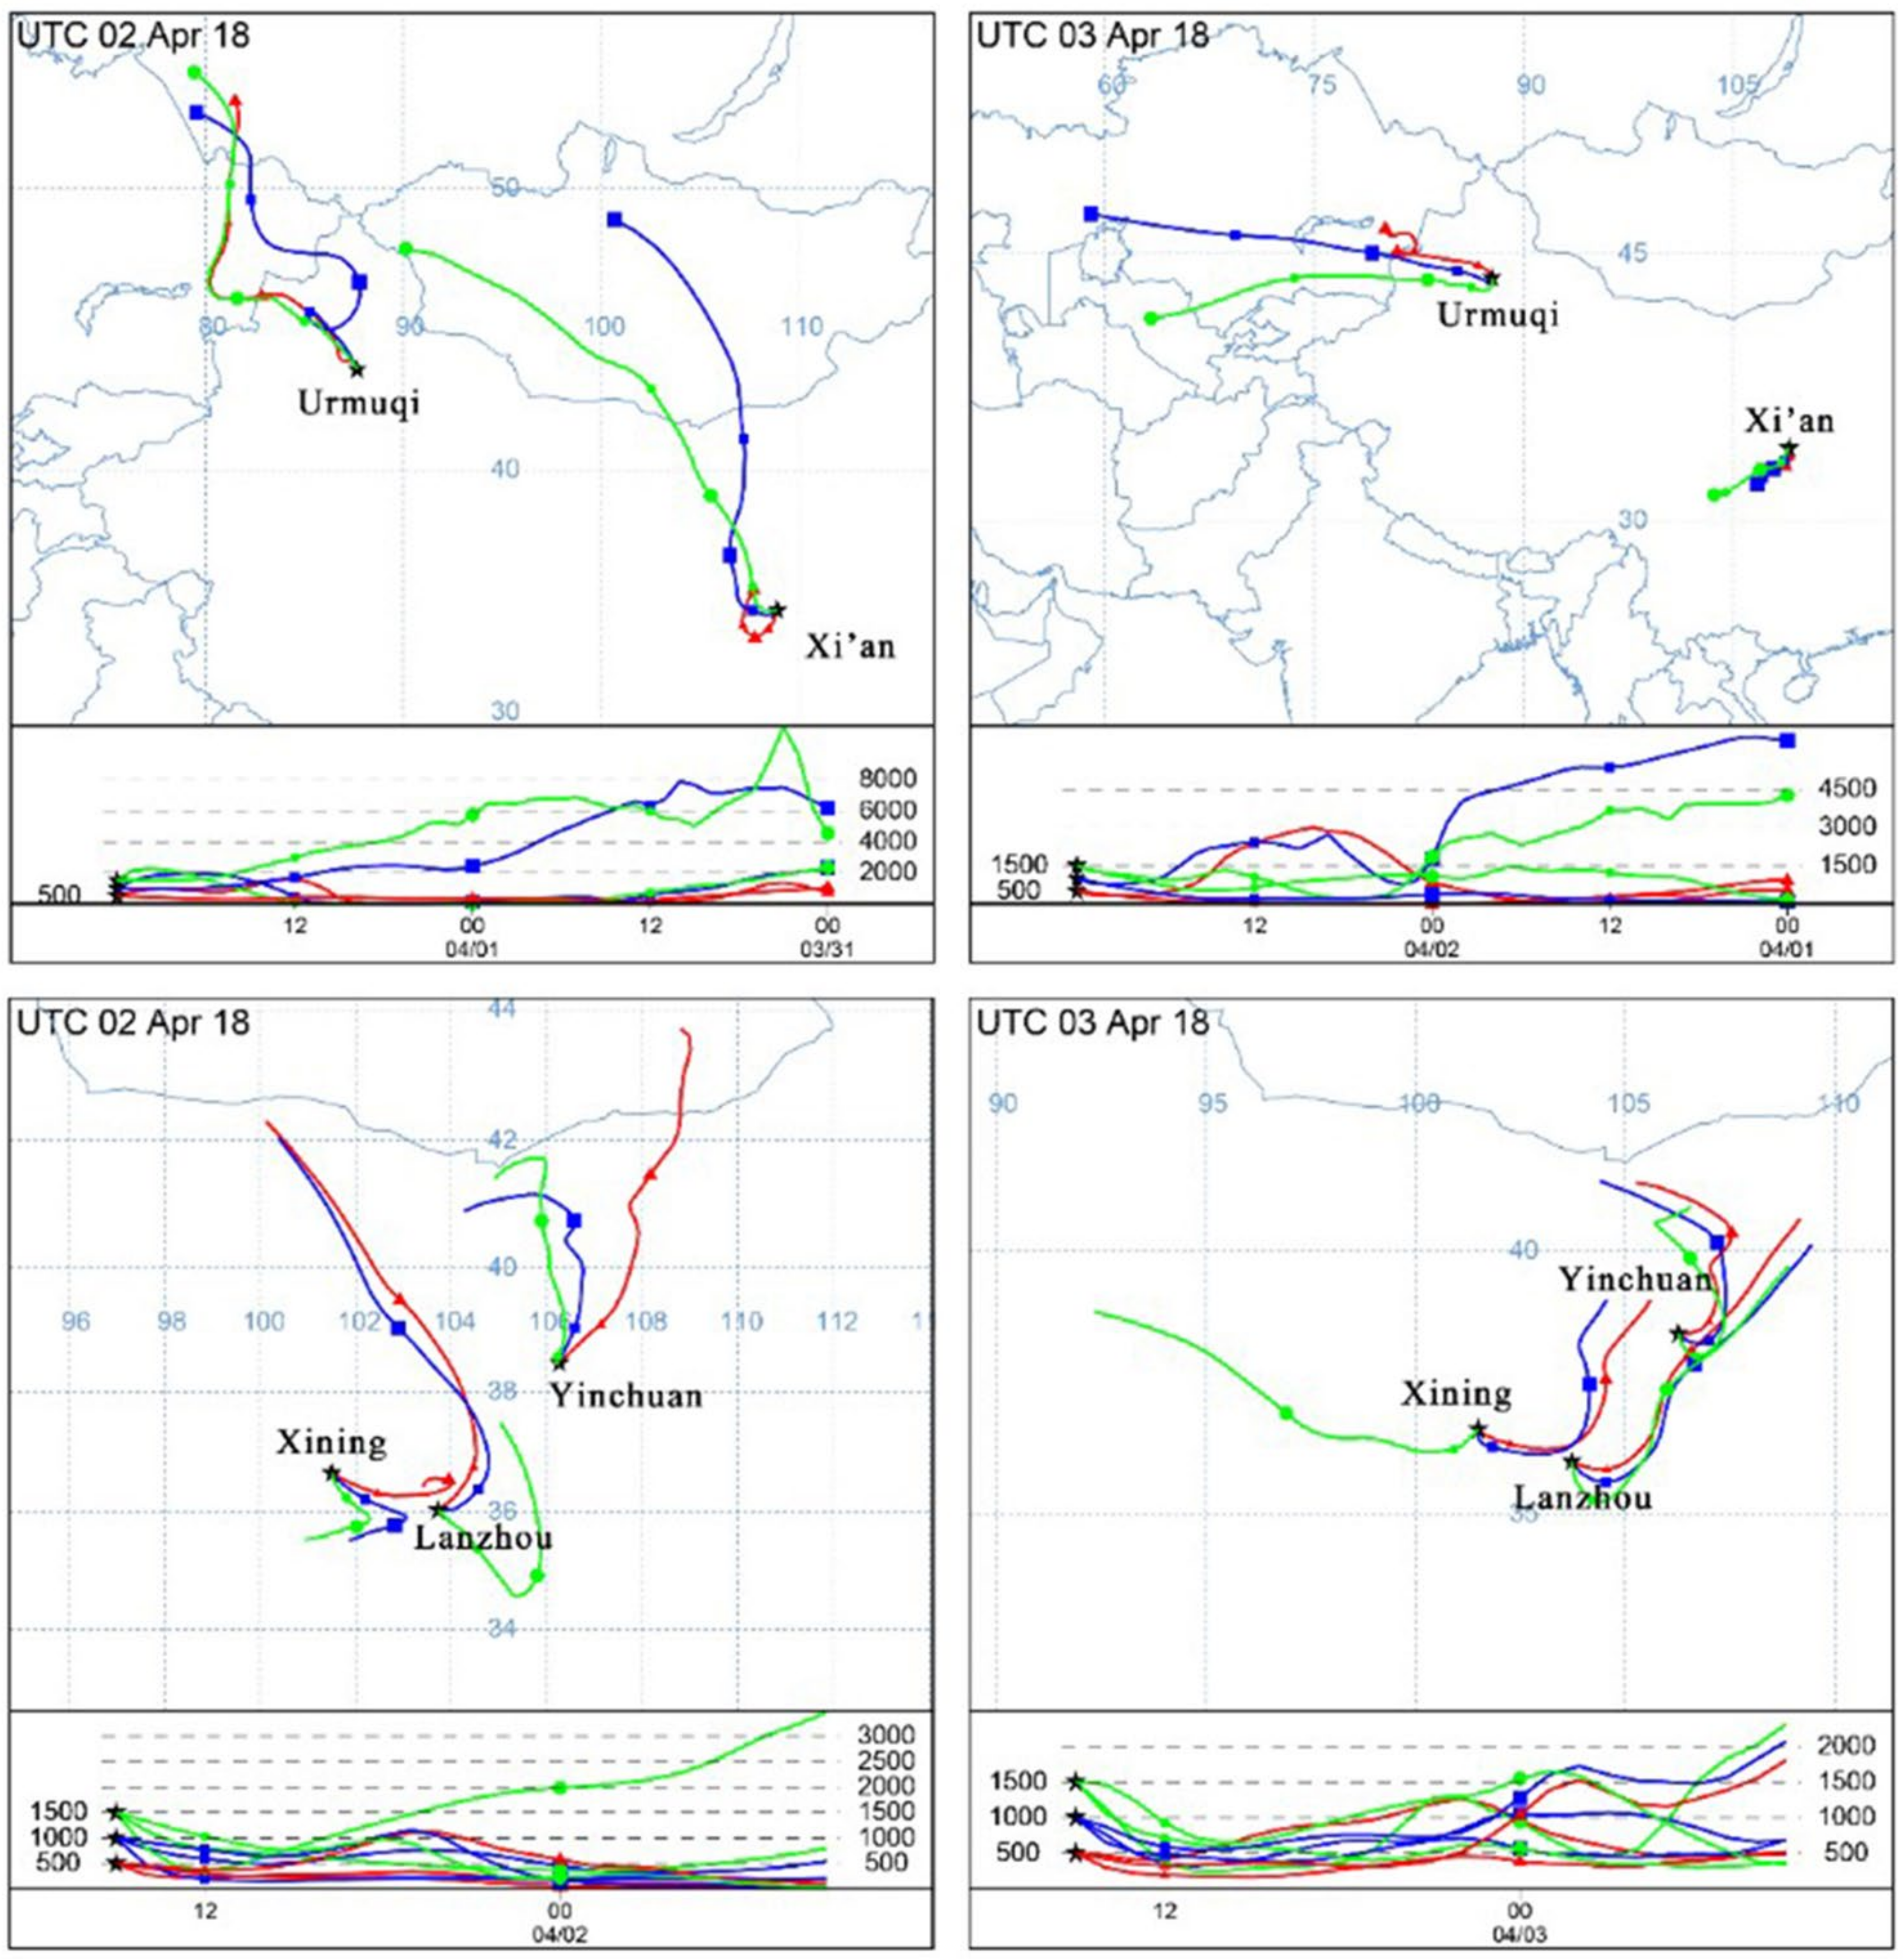
3.1.3. Description of Sand and Dust Migration Process

This study determined the dust centers of the sandstorm events based on the spatial distribution of the absorbing aerosol index (AAI) in Northwest China from OMI data by analyzing the vertical profile of the backscattering coefficients of multiple potential source regions through which the trajectory of CALIPSO’s sub-satellite point passed. The backward trajectories for the high aerosol pollution during the sandstorm event were constructed using the HYSPLIT model. This model was used to determine the source of sand and dust, and to simulate the sand and dust migration process based on the 48h backward trajectory at the heights of 500, 1000, and 1500 m.
The spatial distribution of AAI from 30 March to 3 April in 2018 indicated that the AAI value in certain parts of the southern Xinjiang Basin was significantly higher than that in other areas, in which the AAI value exceeded 2. The main area affected by the 2018 sandstorm event was the basin area of southern Xinjiang and its adjacent areas (Figure 5).
According to Filonchyk et al. [25], the CALIPSO total attenuation backscattering coefficient diagram at 532 nm can be used to observe the distribution of aerosols in vertical profiles. Therefore, this study adopted the same method to observe the vertical distribution of dust aerosols. Figure 6 shows the total attenuation backscattering coefficient at 532 nm, and the dark blue area at the bottom of the figure represents the area for which measurements could not be obtained due to the influence of the terrain. The air masses having dust during the 2018 sandstorm event were also mainly distributed at the heights of 5–10 km above the ground. The spatial distribution of the atmospheric backscattering factor from 31 March to 1 April indicates that there was a high proportion of aerosol particles in the atmosphere. The air mass with dust near the Otindag Sandy Land occurred 5–12 km above the ground. The air mass with dust over the Tarim Basin was distributed at heights of 3–5 km above the ground during this event. The distributions of air mass with dust over the Alxa Plateau and Tianshan Mountains were still influenced by topography.
The HYSPLIT model was used to prepare backward trajectory maps to trace the source areas of the dust particles. In this study, several provincial capitals were selected for simulation. The air flow reverse trajectory simulation can only be carried out at specific points [25,45], and the receptor sites affected by the sandstorm event should be chosen. The study on air pollution presented in Section 3.1 confirmed that these cities were affected by natural sources of the sandstorm event, so we selected them as receptor sites. Backward trajectories for 48 h prior to the sandstorm events were calculated using the heights of 500, 1000, and 1500 m above the ground. The backward trajectory simulated for the 2018 event indicated that the transportation of air masses mainly occurred in the north and northwest directions (Figure 7). The height of the upper-air wind carrying dust affecting Xining, Lanzhou, and Yinchuan on 1 April was 3000 m, and its path showed a clear direction from northwest to southeast, which was consistent with the wind direction. The source of the sand and dust material could have been the Gaishun Basin in northern Xinjiang. On 2 April, the upper-air wind in Urumqi was as high as 4000 m. When the dust rose to more than 3 km, dust could be transported to the downstream cities under the action of the westerly wind. Subsequently, the air flow affecting all cities changed on 3 April, with the exception of the upper-air wind in Xining, which may have been caused by a change in the real-time wind direction.
Based on the simulated backward trajectory and the scale of the sandstorm, the source of sand during the 2018 event was found to be the Xinjiang desert region, including the Taklamakan Desert and the Gurban Tungut Desert located in the Zhungeer Basin. In addition, the sand that affected northern Xinjiang, including Urumqi, originated from Kazakhstan and Mongolia.

3.2. Sensitivity Analysis of Wind Erosion

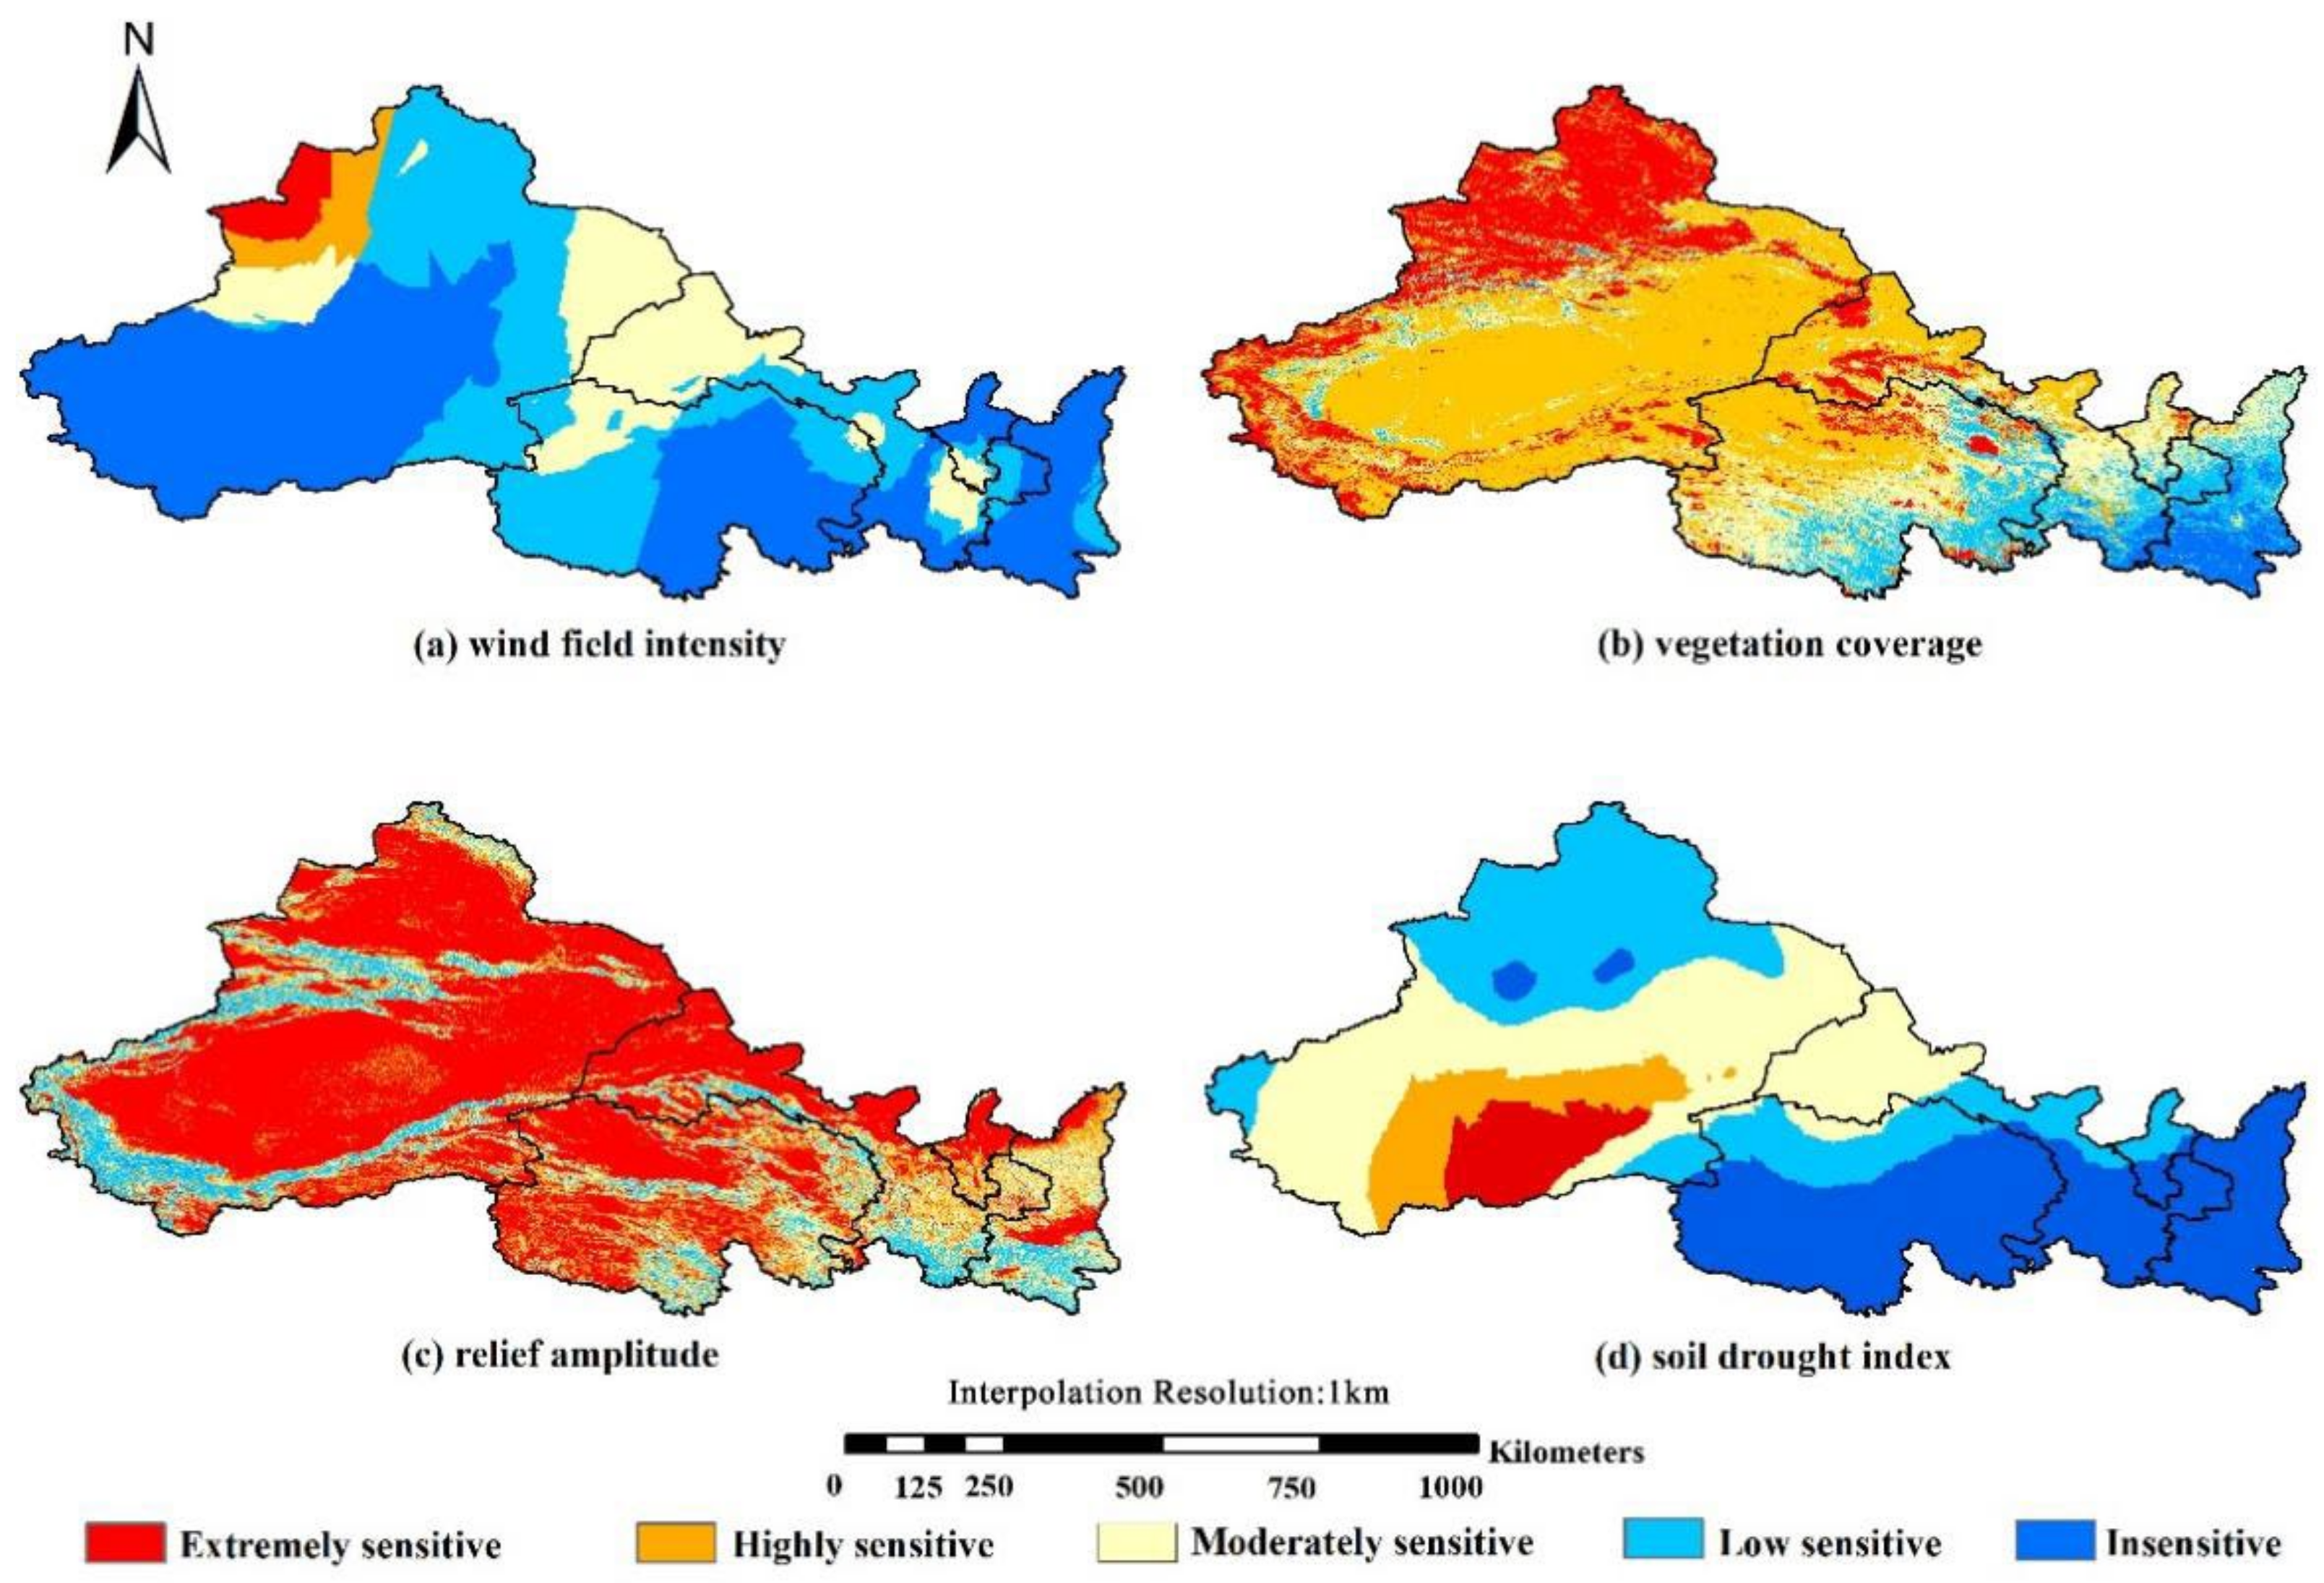
3.2.1. Sensitivity Analysis of Wind Erosion Factors in Northwest China

Wind erosion generates large quantities of mineral particles, such as dust and aerosols, within desert areas, which are then released into the atmosphere [46]. Due to large-scale wind transportation, the significant contribution of particulate matter to air pollution may be caused by aerosol sources over long distances [47]. Therefore, sensitivity analysis of regional wind erosion combined with analysis of dust aerosols helps provide a comprehensive understanding of conditions in the study area. In this study, the wind field intensity, vegetation coverage, relief amplitude, and soil drought index in the region based on data from the whole year of 2018 were evaluated, and the sensitivity to regional wind erosion was estimated by combining the results of these analyses. Table 1 showed the criteria for the sensitivity scale for dividing the sensitivity indicators of each factor. According to these criteria, we mapped the sensitivity of the four factors respectively (Figure 8).
Because it accounts for the influence of airflows such as strong winds on soil particle transport, the revised wind erosion equation (RWEQ) was used to calculate the wind field intensity based on daily average wind speed data for Northwest China. The erosion sensitivities were classified according to the intensity of the wind field, and an intensity sensitivity diagram of the wind field was obtained (Figure 8a). The existence of a strong wind field caused the destruction of grassland and arable land in the vast arid area. The area having strong wind erosion sensitivity was very small, and was mainly distributed in the border area between Xinjiang and Kazakhstan, which is located between the Tianshan Mountains and the Tarbagatai Mountains. The effect of narrowing caused by the unique geographical location between the two mountain ranges may be the main cause for the high wind field intensity factor in the region.
Vegetation can protect the surface soil against wind erosion by covering a part of the surface and preventing wind and sands from blowing at low altitudes. The surface vegetation coverage was obtained using the Normalized Difference Vegetation Index (NDVI) to establish the vegetation coverage sensitivity model in Northwest China (Figure 8b). There was a significant negative correlation between the vegetation coverage and the regional soil wind erosion, indicating that the higher the vegetation coverage, the lower the sensitivity to soil wind erosion [48]. Figure 8b shows that the extremely sensitive areas were concentrated to the south of the Tianshan Mountains in Xinjiang, including Turpan Basin, Kashun Gobi, and Tarim Basin in southern Xinjiang, Qaidam Basin in Qinghai Province, and most areas in western Gansu. The NDVI values of these areas were less than 0.08. The desertification-sensitive areas screened out in this study were generally consistent with those screened out by Han et al. [48].
The degree of roughness of the terrain and topography represents an influence on atmospheric airflow, which was the main cause of the high correlation between soil wind erosion and the topography of the study area. The intensity of soil wind erosion was high in regions in which the terrain was relatively flat, whereas it was relatively low in regions having rugged topography. The terrain elevation within the study area showed a decreasing trend from south to north. According to Figure 8c, the extremely sensitive areas, for which the elevation difference was less than 20 m, are distributed in the Xinjiang and Qinghai Basin area, in addition to in the Junggar Basin, Tarim Basin, and Qaidam Basin. These basins exhibit an extremely flat terrain, and the elevation difference in these basins is small. Consequently, wind erosion disasters are common.
The precipitation and average temperature are directly related to the soil moisture content in the region. In areas with low precipitation and high temperature, the soil easily becomes dry. Dry soil is easily entrained by wind and other forms of airflow, and wind erosion increases. There are few extremely sensitive areas in the study area, which are mainly distributed in the Taklamakan Desert (Figure 8d). This may be because this area is located in a desert area having minimal precipitation, high temperature, and extremely dry desert soil. The areal extent of these highly sensitive areas was also small. It could be concluded that the dry soil was mainly found in the central area of the Taklamakan Desert.

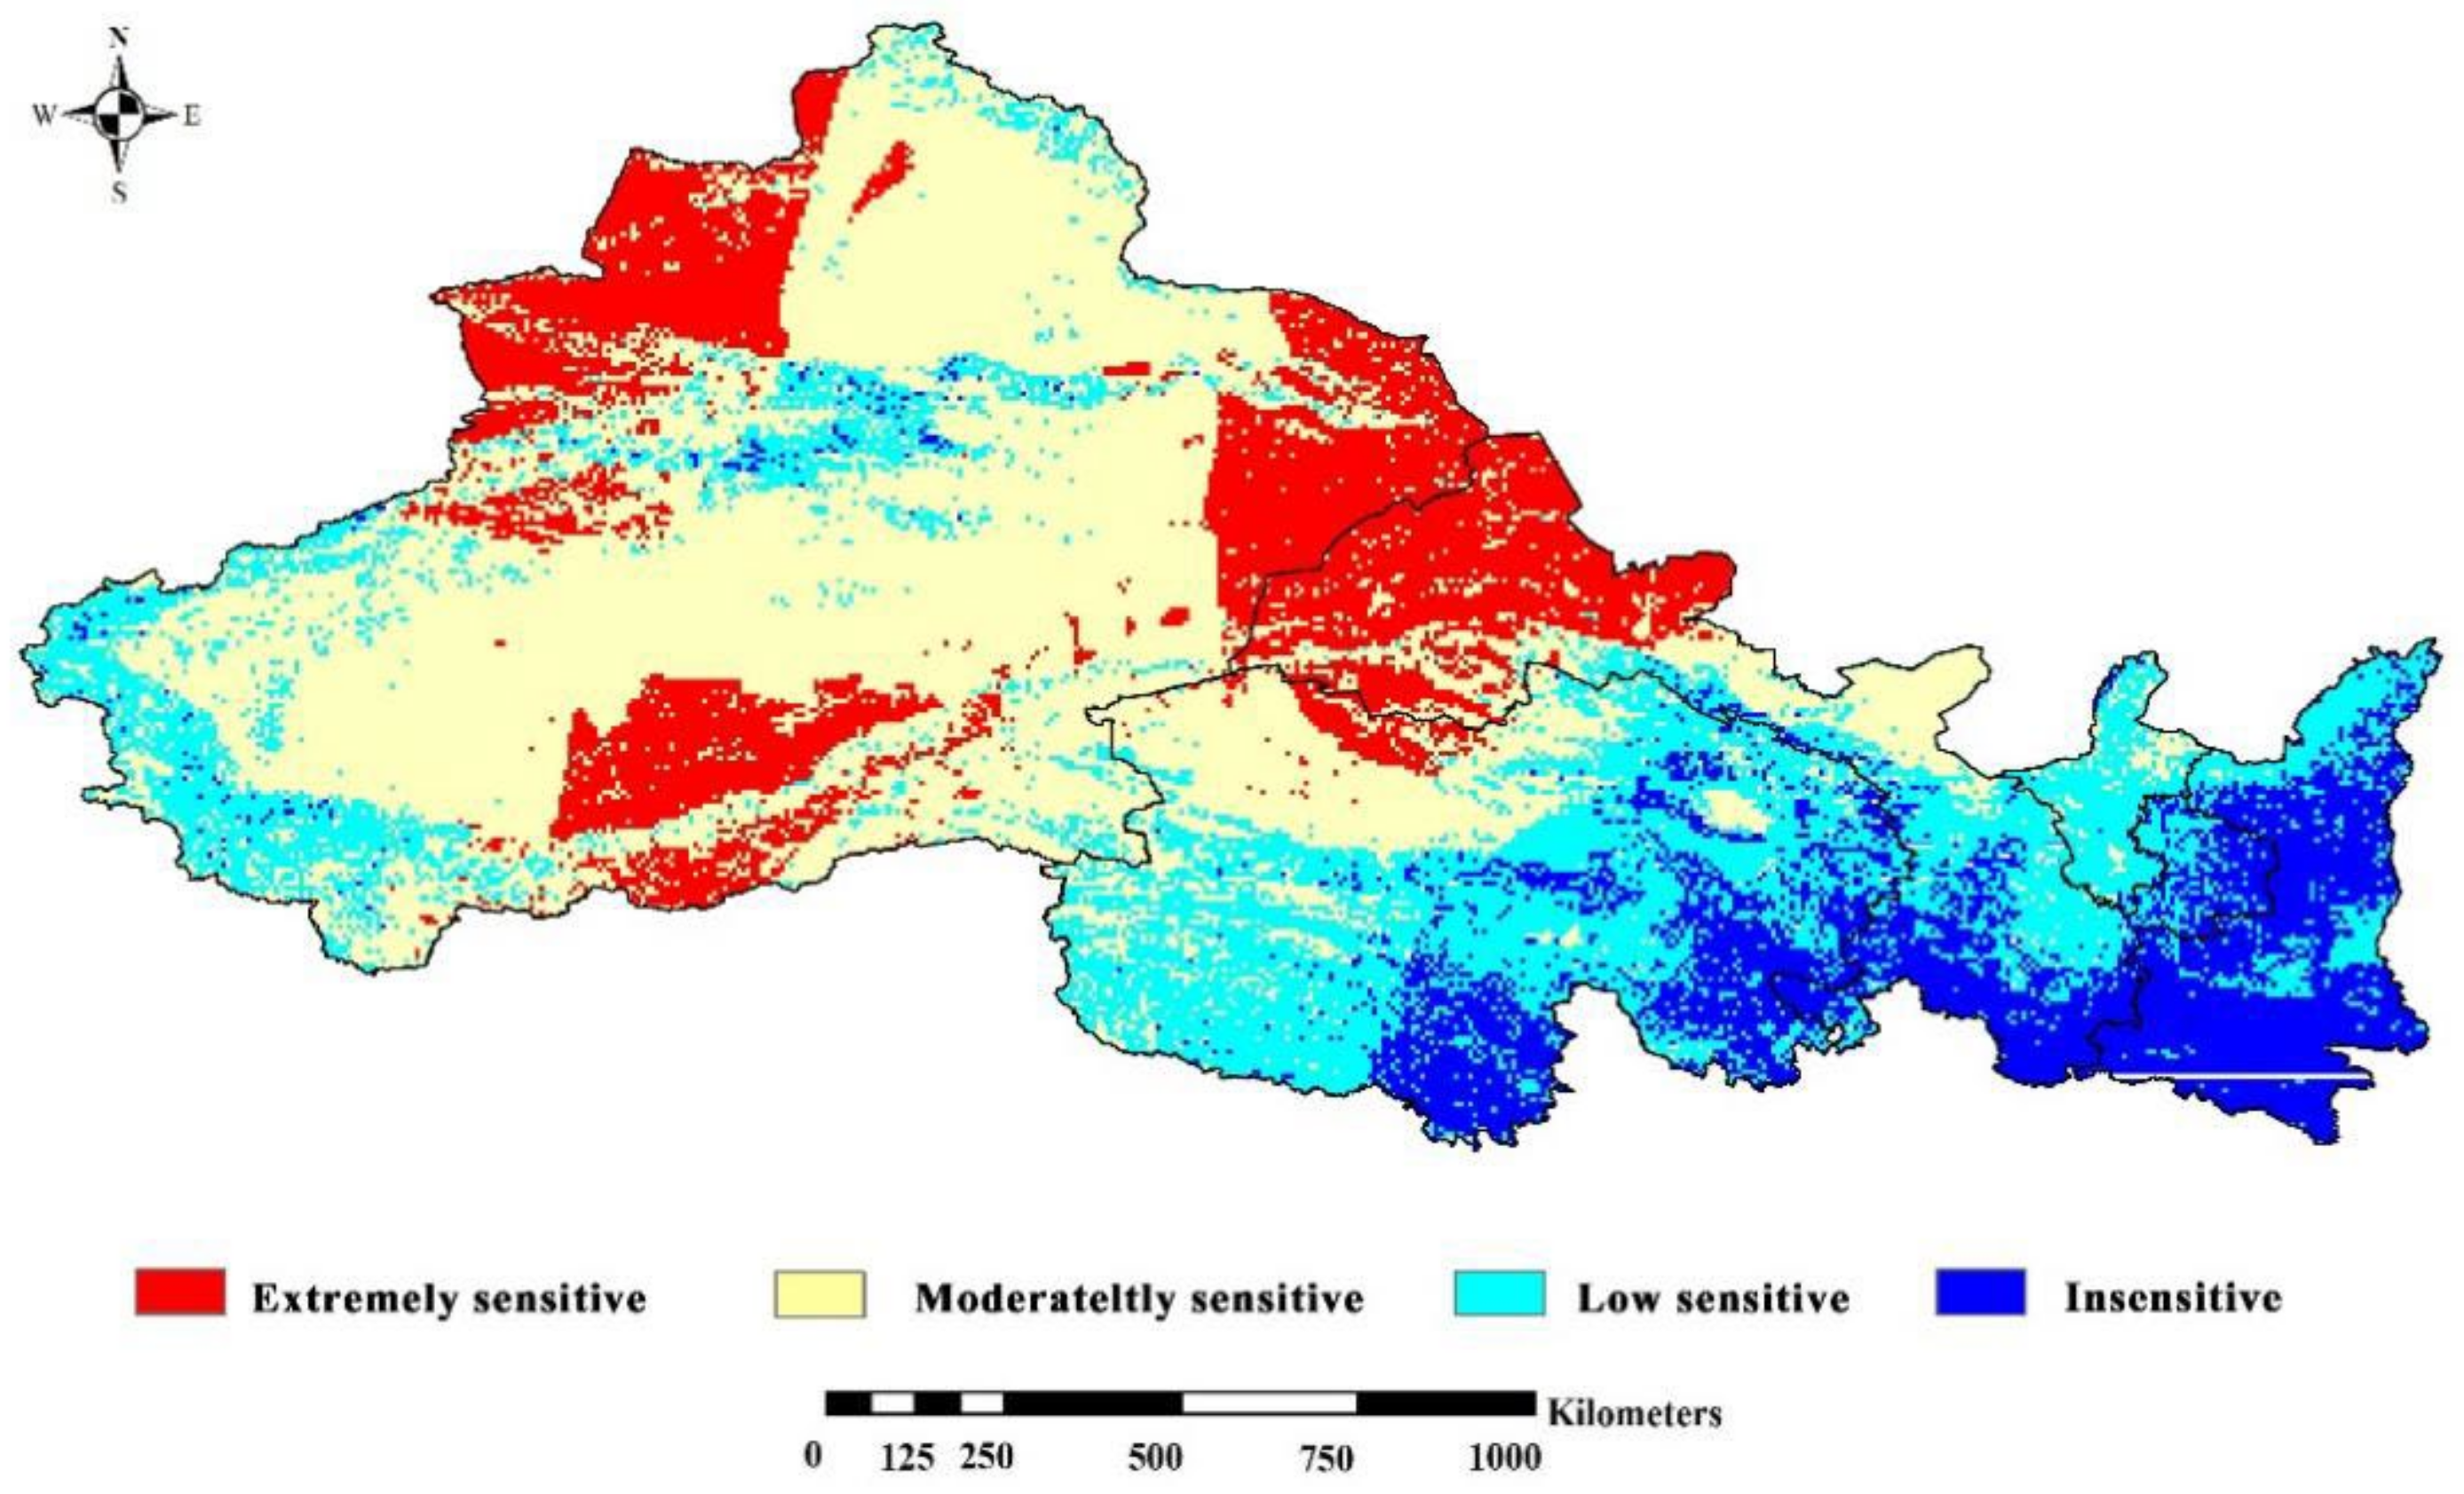
3.2.2. Comprehensive Sensitivity Analysis of Wind Erosion in Northwest China

Wind erosion is more likely to occur in areas with low topographic relief, poor vegetation coverage, high soil dryness, and high wind field intensity [18]. Empirical single-factor analysis was used to determine the weight of each influencing factor on wind erosion, and the spatial distribution of regional wind erosion sensitivity was derived. The regions with high wind erosion sensitivities, which typically exhibited high wind field intensity, high soil dryness, poor vegetation coverage, and low topographic relief, were the Gurban Tungut Desert, Taklamakan Desert, the inter-mountain region between Borokonu Mountain and Kharketawu Mountain in the border area between Xinjiang and Kazakhstan, the Gobi Desert, Kumtag Desert, and Qaidam Basin region in the border area between Xinjiang and Mongolia (Figure 9).
Based on the dust sources identified and the areas with high wind erosion sensitivity, the Taklamakan Desert and other desert areas in Northwest China were found to be the main ecologically fragile areas. Ecological protection measures, such as setting up windbreaks and sand-blocking forests in desert margins and oasis areas, should be actively applied in these regions to prevent large amounts of dust from being carried away.

4. Discussion

Aerosol pollution characteristics are one of the significant issues for the sandstorm analysis [49]; thus, the analysis of aerosol pollution characteristics was the first step in this study of sandstorms. In this study, several provincial capitals were selected for analysis of aerosol pollution characteristics, which confirmed the increase in the PM10 index caused by natural pollution sources. However, the analysis of only a few provincial capitals has certain limitations. For example, the pollution situation of Urumqi cannot indicate that the pollution situation of Xinjiang overall and southern Xinjiang was obviously different from that of northern Xinjiang during this sandstorm event.
Dust aerosols are the most important source of atmospheric aerosols during a sandstorm event [50]. The variation in dust aerosols can be seen from AOD analysis [51]. The numerical results of AOD and AAI in this study had good agreement on the influence range of sandstorm. This was consistent with the research results of Chen et al. [16]; that is, dust measurement indexes such as the aerosol absorption index (AAI) and aerosol optical depth (AOD) can be combined to realize the analysis of sand and dust event weather conditions. This study combined the wind speed and wind direction data with AOD data to try to analyze the variation trend of AOD, but the wind direction near the ground was different from the airflow track simulated later. This may because the dust was only transported to downstream cities by westerly winds when it rose above 3 km [44]. Therefore, a follow-up study of the wind field from the vertical angle will make a good contribution to the study of sandstorm events. In addition, the wind field was constructed by interpolation of the observed data of ground stations instead of using the atmospheric dynamic model, which has certain limitations. In future studies, a more accurate atmospheric dynamic model can be used to simulate the actual wind field near the ground.
The vertical analysis of aerosols confirmed that there were large dust aerosols over the basin geomorphic types in Northwest China. Xia et al. [52] also proved that aerosol particle concentration was high under heavy dusty weather conditions, which was consistent with the vertical analysis results of aerosols in this region in this study. Under the heavy dust event, the size of large particles in the air increased, and the landform of the basin was not conducive to air diffusion, which led to the accumulation of a large number of air particles. In addition, the analysis of the air flow track, especially the air flow with a height of more than 3 km, can better trace the source of dust at a certain point [25]. However, the selection of only a few cities as representatives in this study posed certain limitations. In future research, a large number of pilots can be selected to realize the batch analysis of air quality, so as to more accurately reflect the air pollution situation in the study area.
According to the study of this sandstorm event, the main natural aerosol sand source in the sandstorm event was Taklamakan and other desert regions; this finding was consistent with the research of Filonchyk et al. [25]. The regions with high wind erosion sensitivities, which typically exhibited high wind field intensity, high soil dryness, poor vegetation coverage, and low topographic relief, were the Gurban Tungut Desert, Taklamakan Desert, the inter-mountain region between Borokonu Mountain and Kharketawu Mountain in the border area between Xinjiang and Kazakhstan, the Gobi Desert, Kumtag Desert, and Qaidam Basin region in the border area between Xinjiang and Mongolia. Ginoux et al. [53] found that the largest natural sources were associated with basins in China, including the Taklamakan Desert of the Tarim Pendi, the Qaidam Pendi, and the Turpan Pendi. Each of these confirmed the credibility of this study.
Wind field intensity is an important factor affecting the transport capacity of wind to particulate matter, and it is the most direct power source of wind erosion. Gillette et al. [54] proved that the change in wind speed threshold significantly affects the amount of dust generation in the air, so makes an important contribution to the degree of soil erosion in the regions where dust events occur. Vegetation increases soil resistance to wind erosion by improving surface roughness and soil structural stability [55]. Topography affects the distribution characteristics of soil wind erosion through the disturbance of air flow. Soil dryness is influenced by regional precipitation and generally represented by the ratio of the water budget to heat balance in the region. It is used to measure how easily the wind can bring dust into the air [56]. Therefore, using the above four factors to construct the soil wind erosion sensitivity index system could better reflect the conditions of wind erosion in the study area, which was of great significance for the identification of dust sources.
The southern Xinjiang Basin was the most seriously affected by the sandstorm events, and was the source region for the sandstorm event, having the second largest mobile desert in the world—the Taklamakan Desert [57]. Dust aerosol particles were extremely abundant in the air. However, the topography of the region was not conducive to the diffusion of the dust aerosol particles. Therefore, sandstorm events that occurred under strong winds had the greatest impact on the region. The findings of this study can provide a scientific reference for wind erosion prevention and ecological governance of similar areas in other parts of the world.
The findings of this study indicate that the source of sand and dust in a region can be effectively identified using remote sensing technologies, and the regional wind erosion parameters can be effectively combined to identify ecologically vulnerable areas based on multi-factor assessment. The remote sensing time series data could be mutually verified, but it was difficult to conduct a comprehensive analysis and verification of sandstorm events using only monitoring data from a single instrument. Moreover, this study focused on the large-scale monitoring of sandstorm events, based on the identification of dust aerosols by high-altitude satellites, and ignored the monitoring of vertical characteristics of dust columns at low altitudes. Future research can focus on exploring the relationship between near-surface sediment particles and sediment processes using remote sensing approaches. During the process of wind erosion sensitivity analysis, the selection of factors was considered primarily on the basis of the principle of acquisition, and the seasonal effects of these factors were ignored. In future studies, seasonal variations in these factors should be considered to explore their effects on soil wind erosion during different periods, vegetation conditions, wind speeds, and precipitation conditions, so as to comprehensively reflect the sensitivity of soil wind erosion.

5. Conclusions

In this study, a typical sandstorm event during the period of 1–3 April in 2018 was identified using the field observations of particulate matter, in addition to MODIS, OMI, and CALIPSO data. The HYSPLIT model was used to determine the dust transmission path and the main dust sources. Moreover, the wind erosion sensitivity of the study area was analyzed, and ecologically fragile areas were determined. The specific conclusions were as follows:
(1)
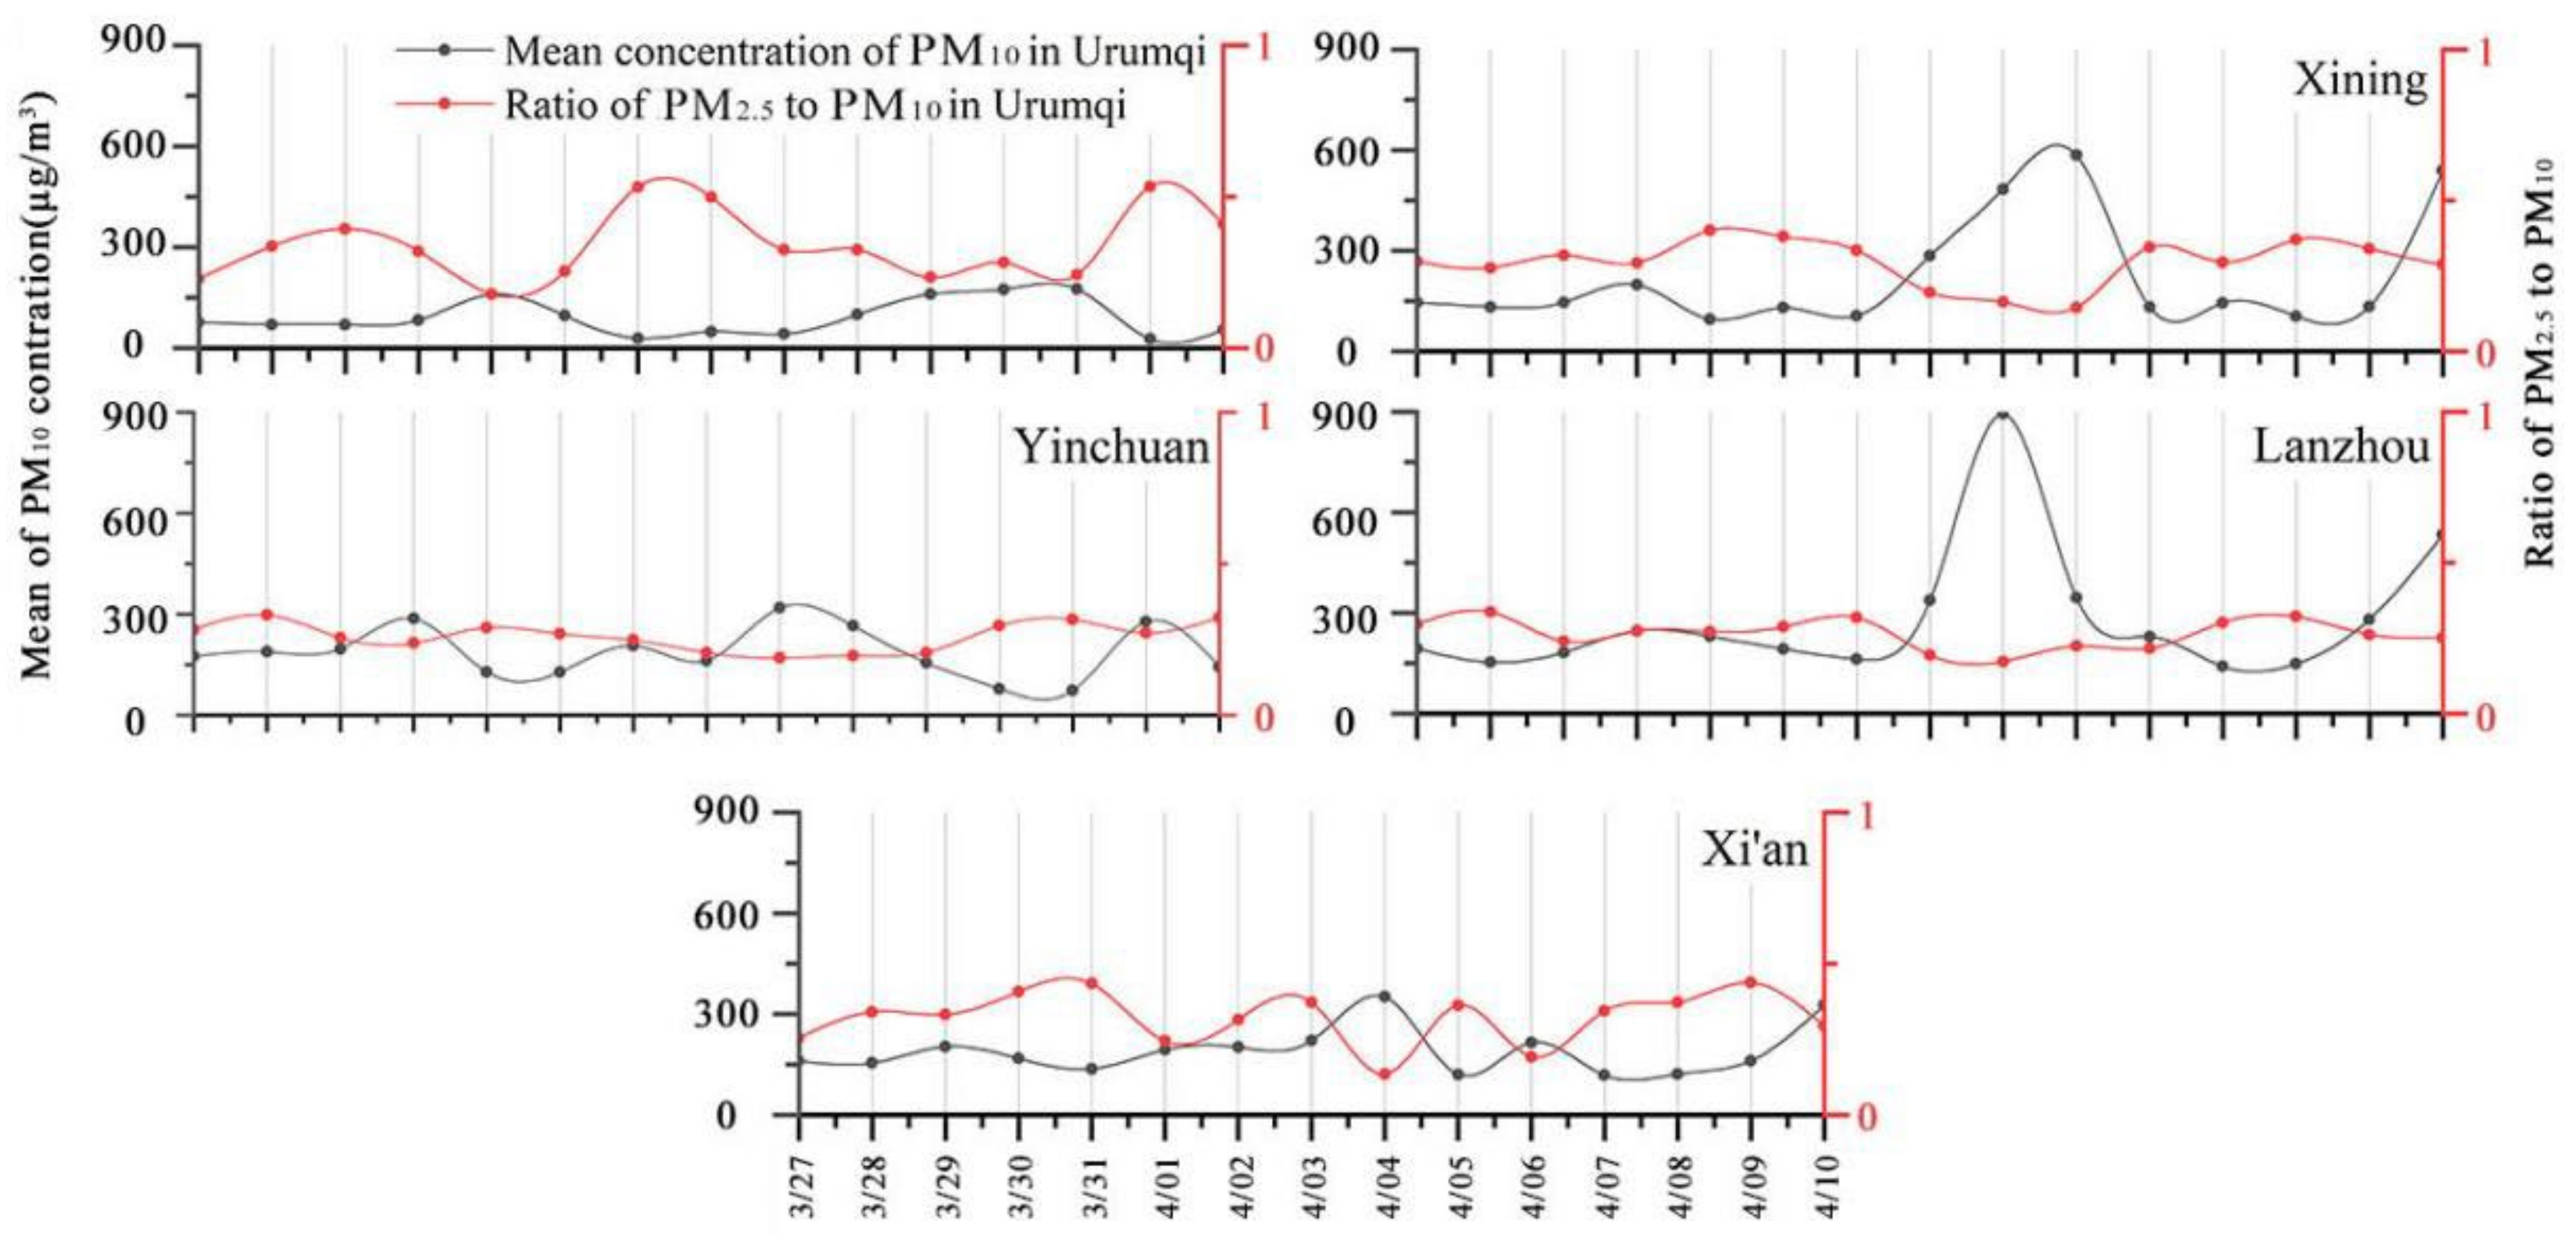
Atmospheric particulate matter data revealed that the PM10 concentrations during this sandstorm event exceeded 400 µg/m3. The PM2.5/PM10 ratios in all major cities in Northwest China were lower than 0.6 during the sandstorm events, indicating that the proportion of fine particles in atmospheric particulate matter was small, which was due to the increase in inhalable particulate matter content in the atmosphere caused by natural pollution sources. Therefore, it could be inferred that this sandstorm event had a great impact on the PM10 index of those cities. This conclusion means that the occurrence of dust events leads to the occurrence of extreme values of PM10.
(2)
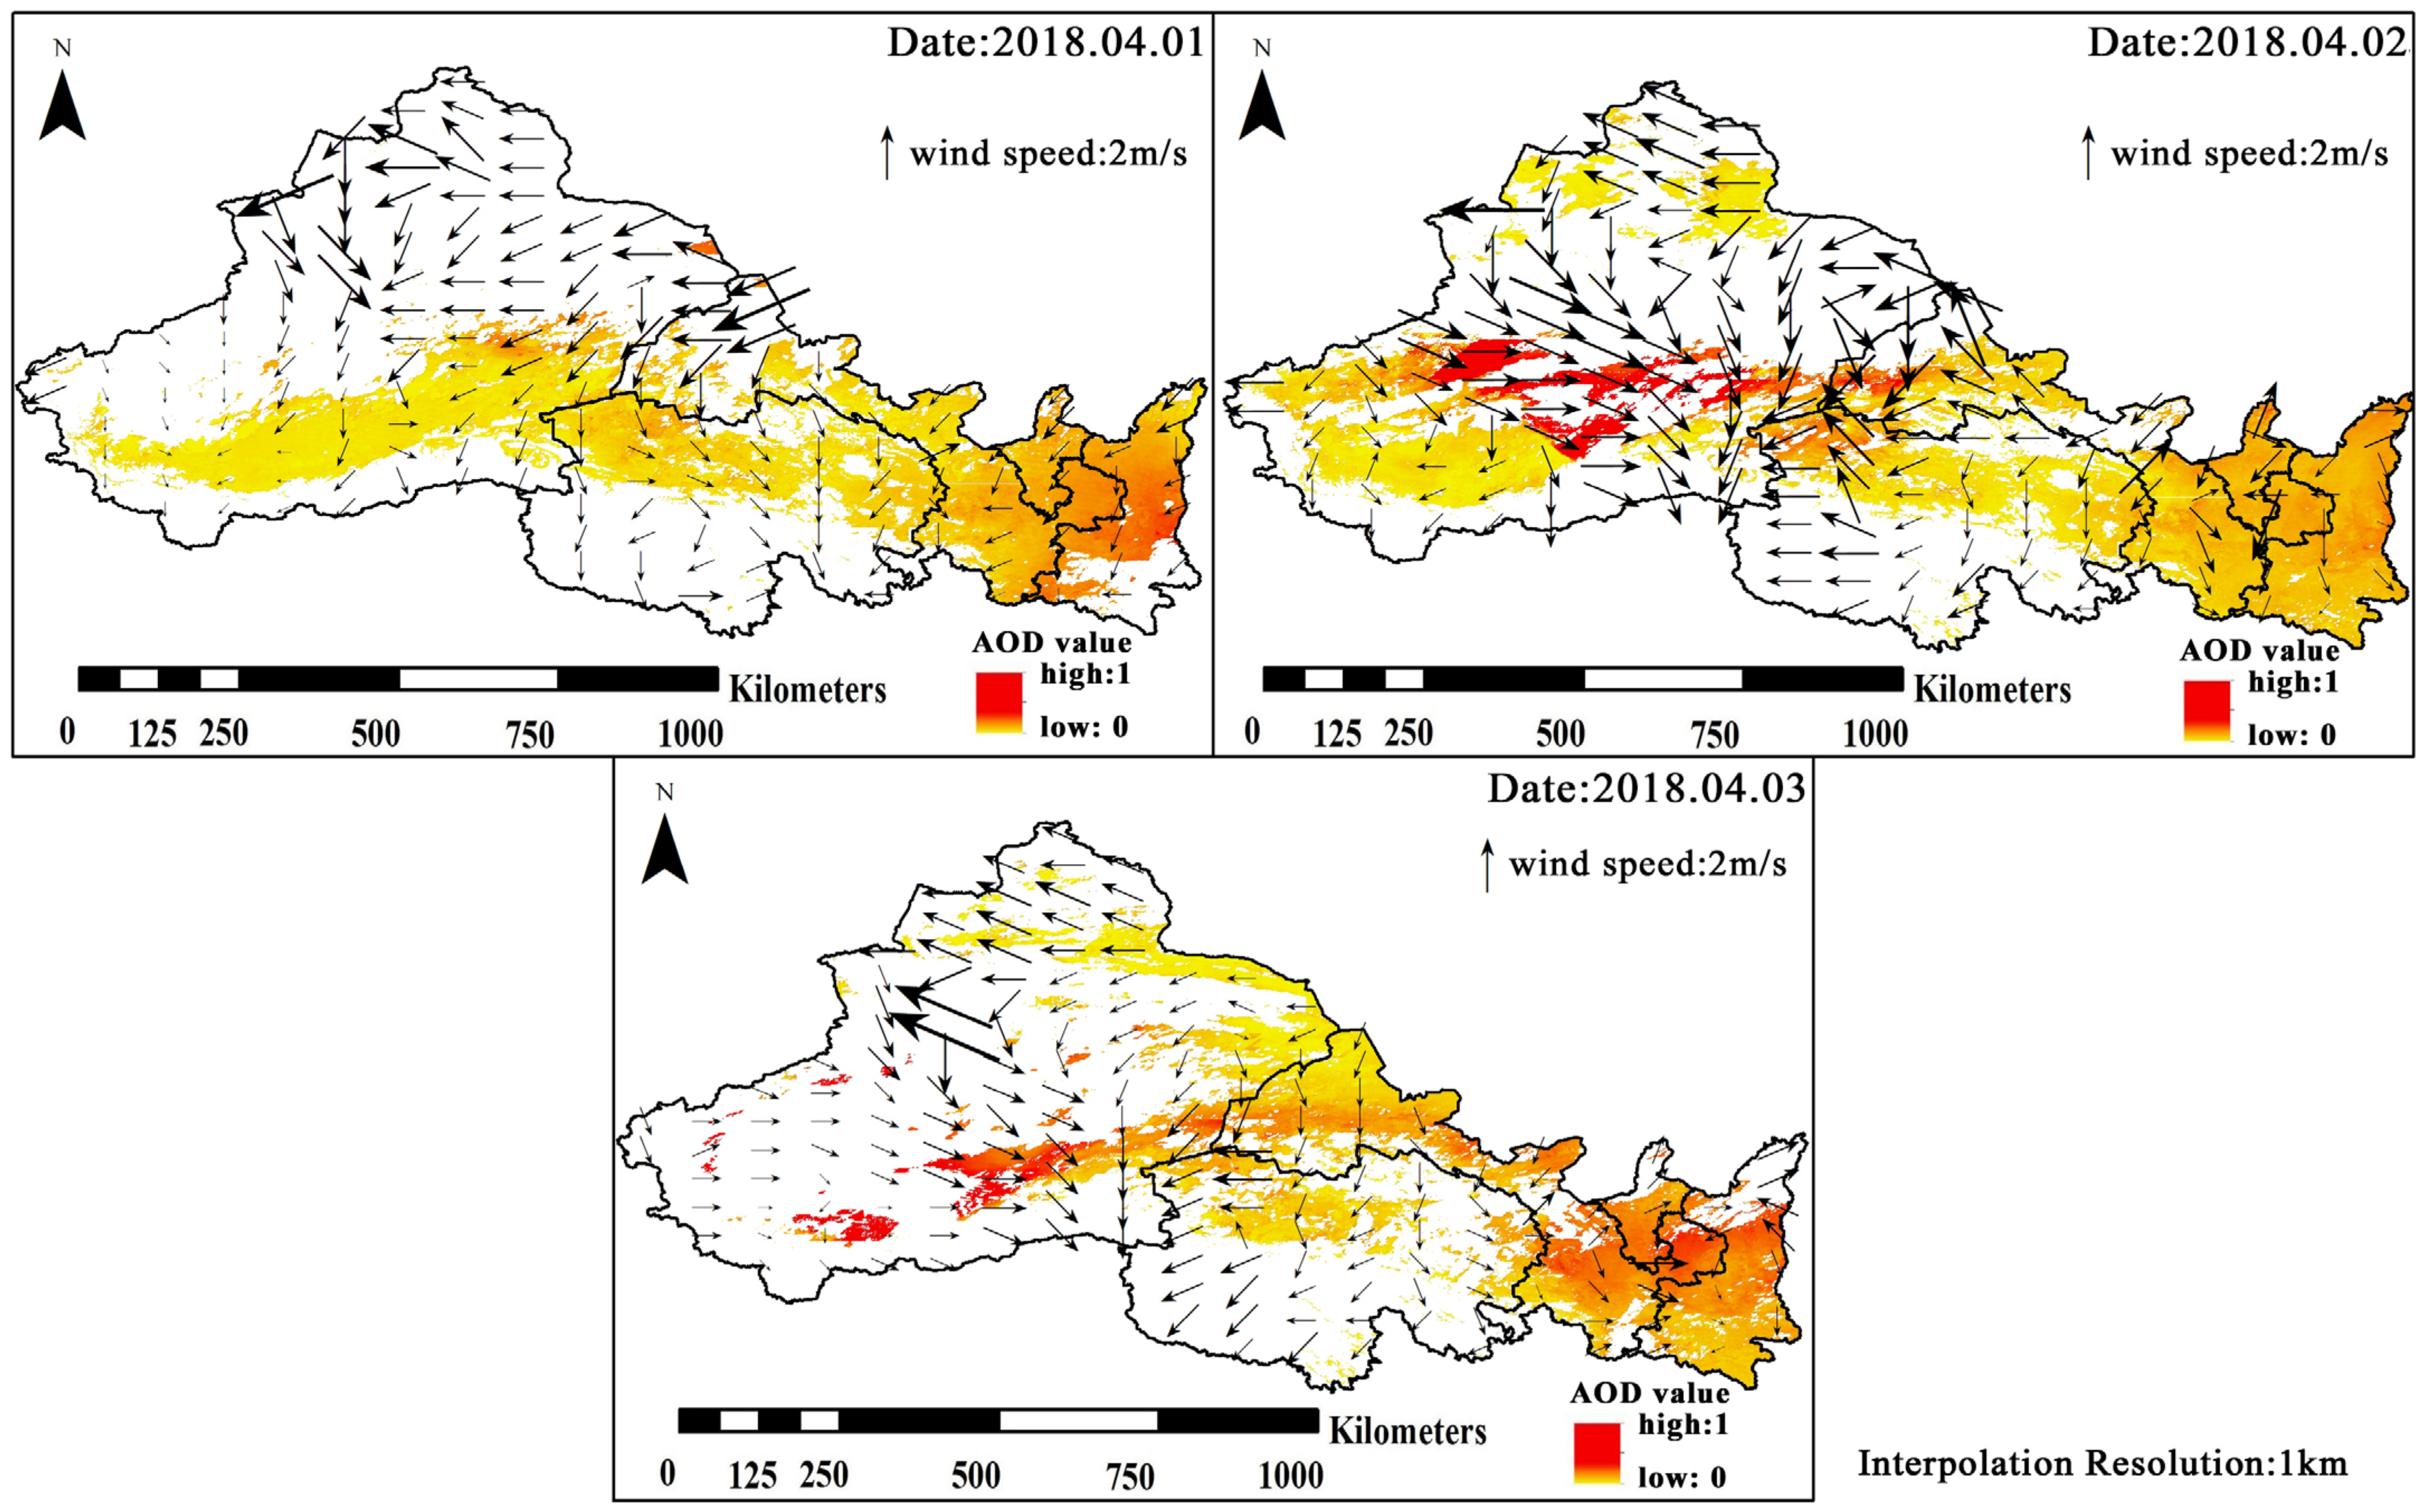
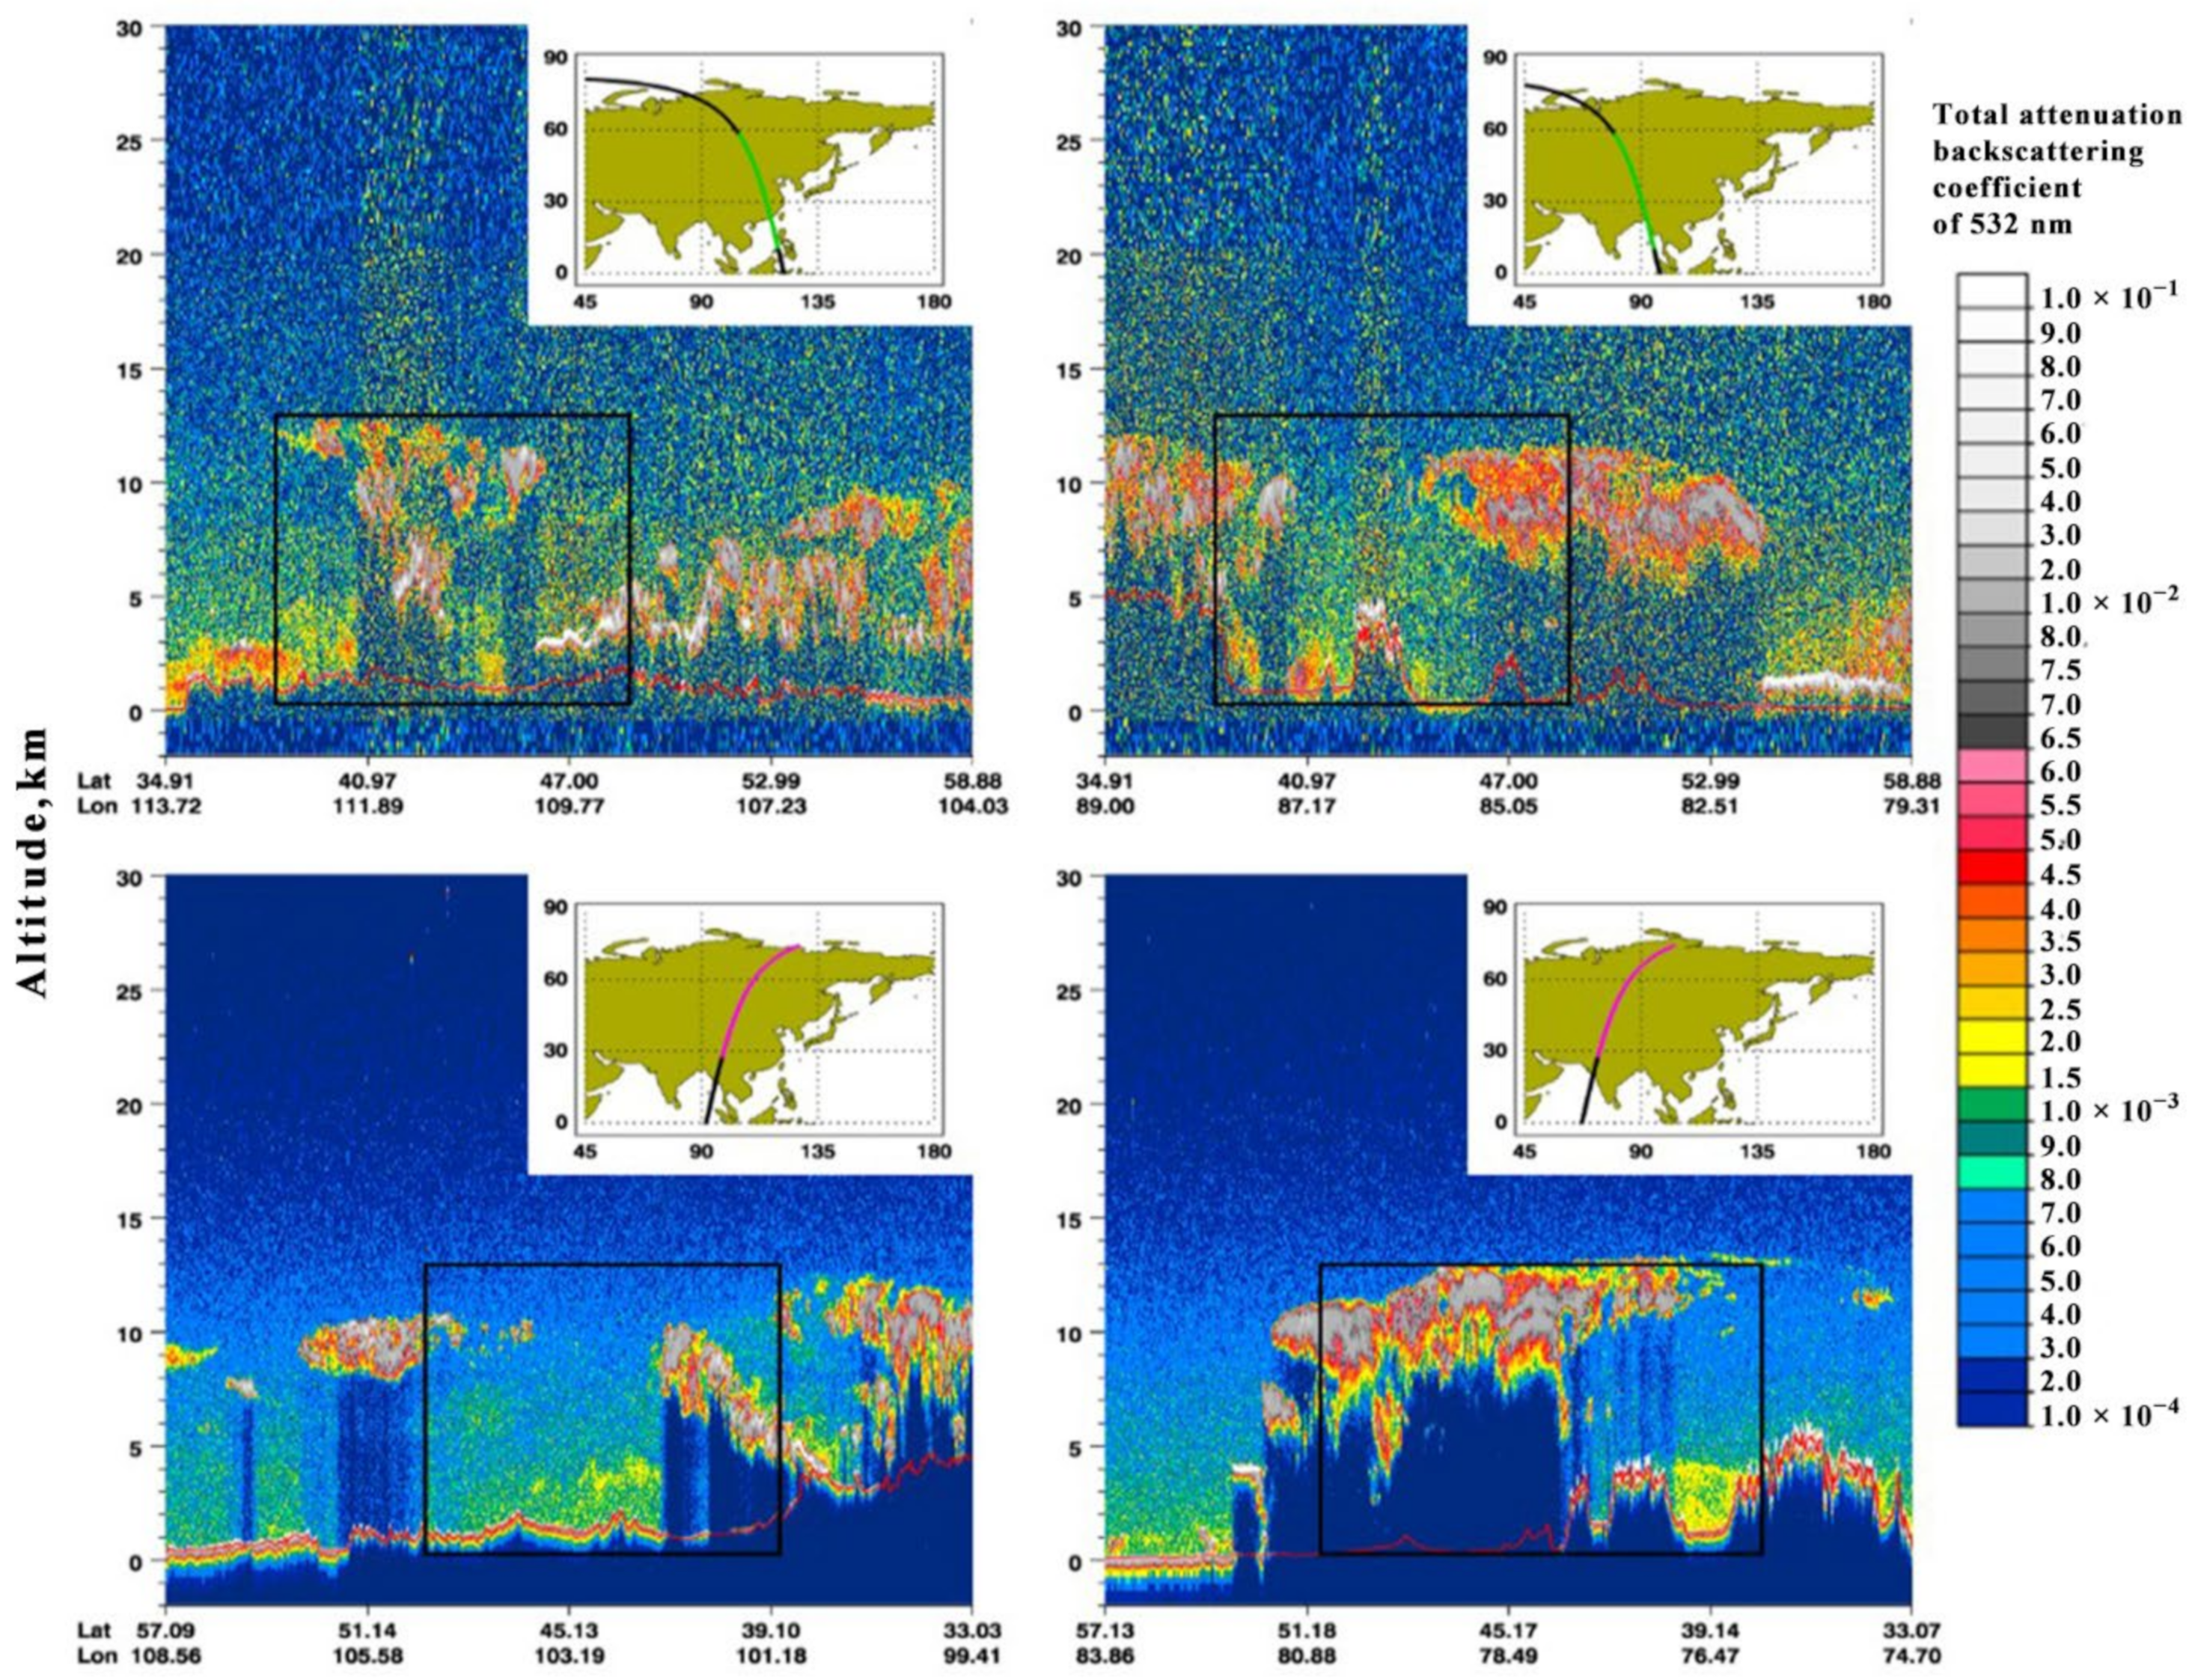
Prior to the occurrence of the events, AOD index values throughout the study area were approximately 0.1–0.6, and relatively high values were mainly concentrated in the desert area of the southern Xinjiang Basin and a small part of northern Xinjiang. During the sandstorm event, an area with high aerosol index values (0.75–1) was observed, and this area migrated as the sandstorm event progressed. It could be concluded that the sandstorm event originated in southern Xinjiang and affected the southern Xinjiang basin, in addition to Qinghai, Gansu, Ningxia and Shaanxi provinces. Furthermore, the results of AOD and AAI in this study had good agreement regarding the influence range of the sandstorm.
(3)
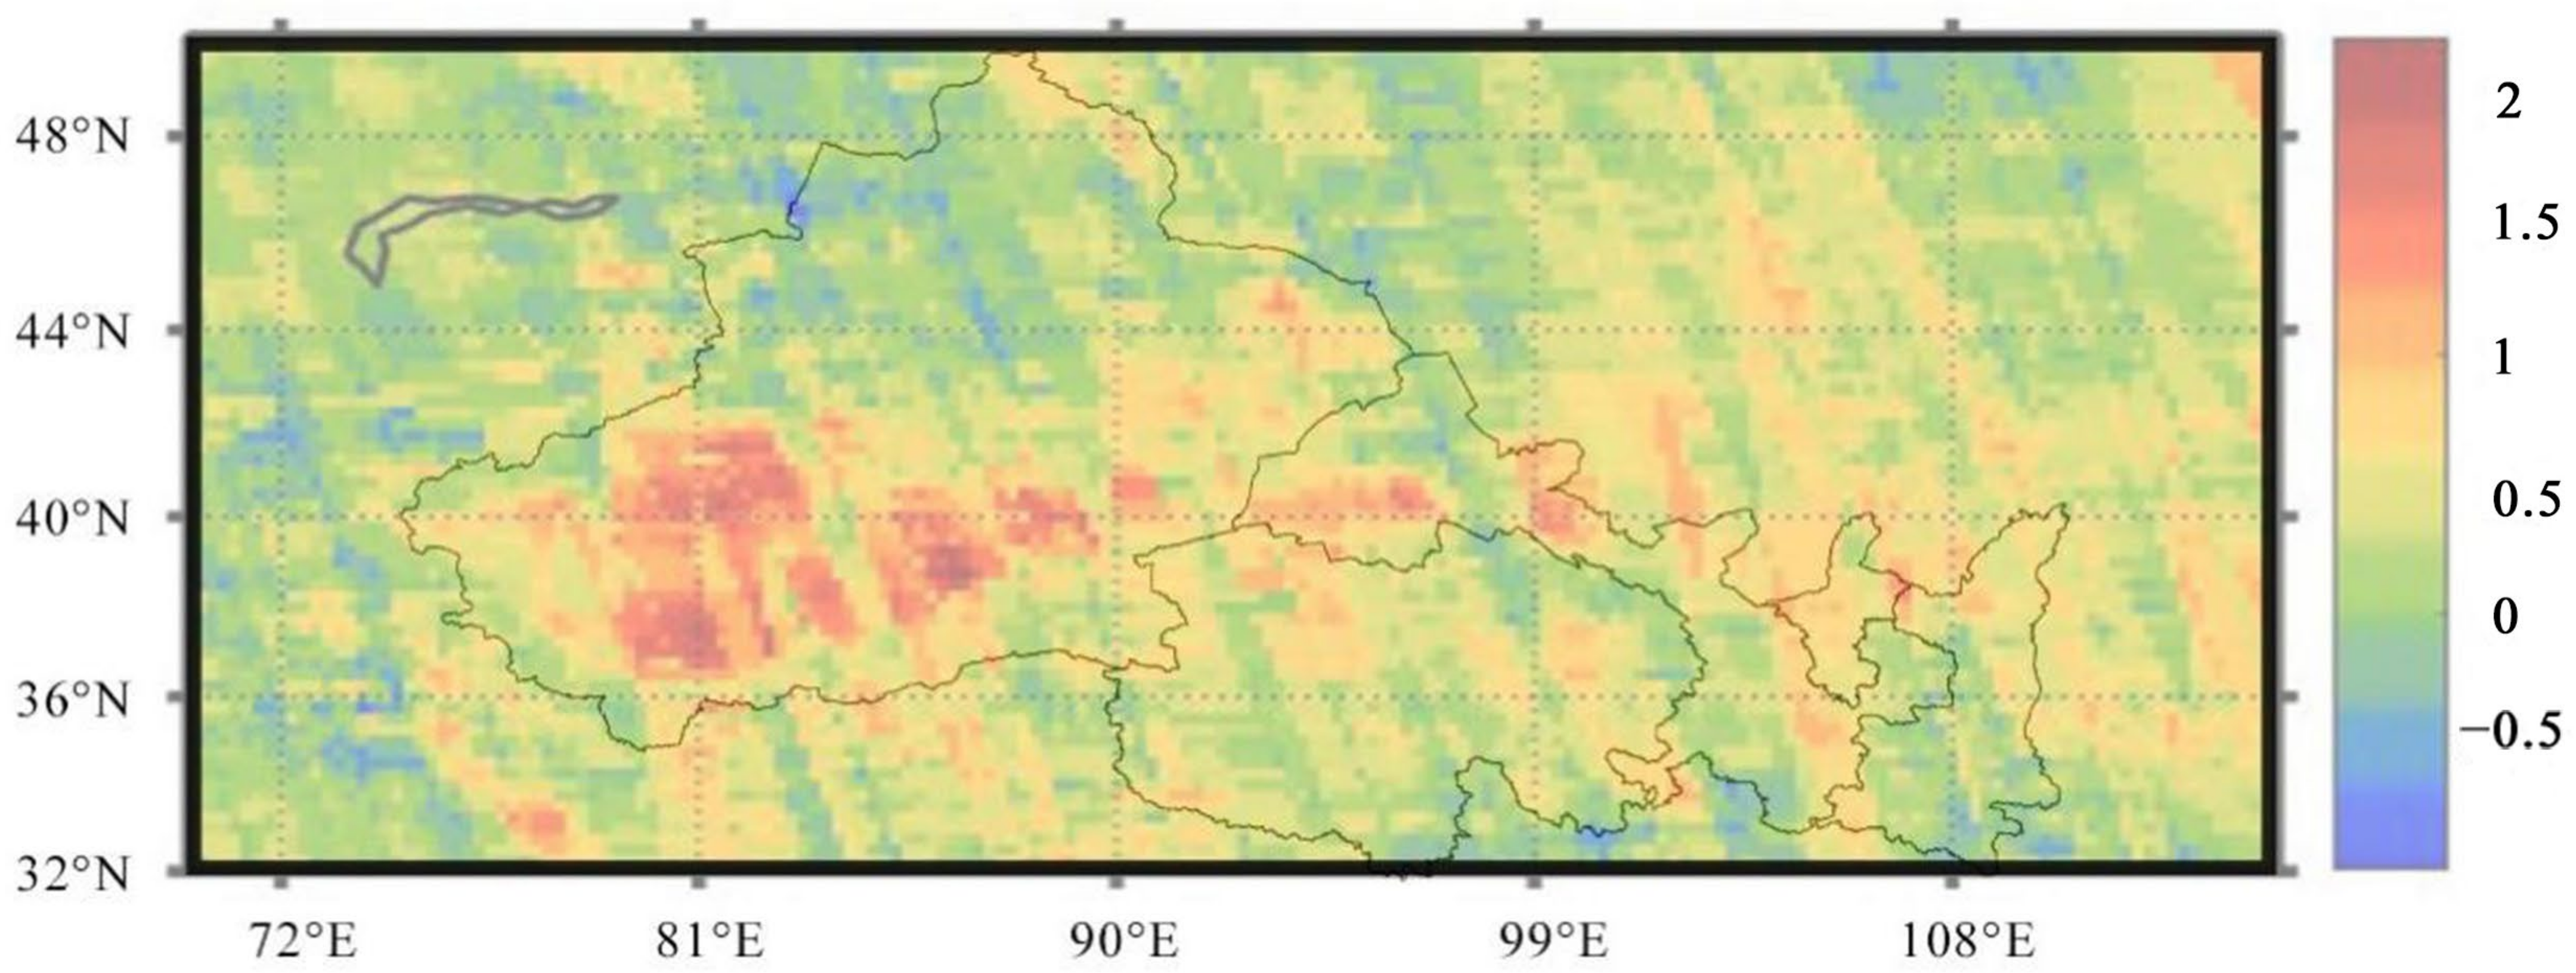
From the analysis of the sand and dust migration process, the sandstorm event affected the study area through the northwest path, and mainly affected the southeast area of southern Xinjiang Basin in China. The dust particles mainly came from the Taklimakan Desert in southern Xinjiang and the Gurban Tungut desert in Zhungeer Basin.
(4)
The regions having high wind erosion sensitivity in Northwest China were characterized by strong wind field intensity, high soil dryness, low vegetation coverage, flat topographies, and low relief. These were mainly Taklimakan Desert in Tarim Basin in southern Xinjiang; Badain Jaran Desert in Mongolia; Tengger Desert and Qaidam Desert in Qaidam Basin in northern Xinjiang; the Gobi region at the junction of Xinjiang and Mongolia; and Gurban Tungut Desert in Junggar Basin.
In this study, the process of sandstorm occurrence was visualized by combining the ground measured data and remote sensing data, and the sensitivity of regional wind erosion was analyzed by the geographic information technology. This can not only directly represent the sandstorm migration process, but also shows the sand and dust sources. Furthermore, it is also of great significance to judge whether the specific point of sandstorm events is affected; this is important for sandstorm prevention and management by local government. The conclusions can provide references and suggestions for strengthening ecological governance.

Author Contributions

Data curation, Z.W.; writing—original draft preparation, Z.W.; writing—review and editing, Q.J.; visualization, Y.Y.; supervision, D.F.; project administration, H.X.; funding acquisition, Q.J. All authors have read and agreed to the published version of the manuscript.

Funding

This research is supported by the National key research and development program (No. 2019YFE0116500), the National Science and Technology Projects (No. 2017X07101004), the National Natural Science Foundation of China (No. 41901234 and No. 31870706), and the Fundamental Research Funds for the Central Universities (No. 2015ZCQSB03). Data supports from projects of the National Natural Science Foundation of China (No. 71225005) and the Exploratory Forefront Project for the Strategic Science Plan in IGSNRR, CAS are also appreciated.

Data Availability Statement

Not applicable.

Acknowledgments

We would like to thank the anonymous reviewers for their helpful remarks.

Conflicts of Interest

The authors declare no conflict of interest.

Abbreviations

Aerosol optical depth (AOD); Absorbed aerosol index (AAI); Sandstorm identification models (SVI); Normalized Difference Vegetation Index (NDVI); Revised wind erosion equation (RWEQ).

References

  1. Chi, W.; Kuang, W.; Jia, J.; Liu, Z.J. Study on Dynamic Remote Sensing Monitoring of LUCC and Soilwind Erosion Intensity in the Beijing-Tianjin Sandstorm Source Control Project Region. Remote Sens. Technol. Appl. 2019, 33, 5. [Google Scholar]
  2. Kunte, P.D.; Aswini, A.M. Detection and monitoring of super sandstorm and its impacts on Arabian Sea—Remote sensing approach. Atmos. Res. 2015, 160, 109–125. [Google Scholar] [CrossRef]
  3. Wiesinger, F.; Sutter, F.; Fernández-García, A.; Wette, J.; Wolfertstetter, F.; Hanrieder, N.; Schmücker, M.; Pitz-Paal, R. Sandstorm erosion on solar reflectors: Highly realistic modeling of artificial aging tests based on advanced site assessment. Appl. Energy 2020, 268, 114925. [Google Scholar] [CrossRef]
  4. Wu, Z.; Wang, M.; Zhang, H.; Du, Z. Vegetation and soil wind erosion dynamics of sandstorm control programs in the agro-pastoral transitional zone of northern China. Front. Earth Sci. 2019, 13, 2. [Google Scholar] [CrossRef]
  5. An, S.; Sin, H.H.; Dubow, M.S. Modification of atmospheric sand-associated bacterial communities during Asian sandstorms in China and South Korea. Heredity 2015, 114, 5. [Google Scholar] [CrossRef] [Green Version]
  6. Chen, Y.; Li, X.; Liu, X.; Zhang, Y.; Huang, M. Tele-connecting China’s future urban growth to impacts on ecosystem services under the shared socioeconomic pathways. Total Environ. 2019, 652, 765–779. [Google Scholar] [CrossRef]
  7. Meo, S.A.; Almutairi, F.J.; Abukhalaf, A.A.; Alessa, O.M.; Al-Khlaiwi, T.; Meo, A.S. Sandstorm and its effect on particulate matter PM 2.5, carbon monoxide, nitrogen dioxide, ozone pollutants and SARS-CoV-2 cases and deaths. Sci. Total Environ. 2021, 795, 148764. [Google Scholar] [CrossRef]
  8. Jardine, G.; Crocker, A.; Bailey, I.; Cooper, M.; Milton, J.; Wilson, P. The imprint of windblown dust from the North American Southwest on the California Channel Islands and Pacific Ocean sediments. Quat. Sci. Rev. 2021, 261, 106934. [Google Scholar] [CrossRef]
  9. Li, N. Urban dust in the Guanzhong basin of China., part II: A case study of urban dust pollution using the WRF-Dust model. Sci. Total Environ. 2016, 541, 1614–1624. [Google Scholar] [CrossRef]
  10. Tian, L.; Zeng, Q.; Dong, W.; Guo, Q.; Wu, Z.; Pan, X.; Li, G.; Liu, Y. Addressing the source contribution of PM2.5 on mortality: An evaluation study of its impacts on excess mortality in China. Environ. Res. Lett. 2017, 12, 104016. [Google Scholar] [CrossRef]
  11. Guan, Q.; Yang, J.; Zhao, S.; Pan, B.; Liu, C.; Zhang, D. Climatological analysis of dust storms in the area surrounding the Tengger Desert during 1960–2007. Clim. Dyn. 2015, 45, 3–4. [Google Scholar] [CrossRef]
  12. Wang, J.X.L. Mapping the Global Dust Storm Records: Review of Dust Data Sources in Supporting Modeling/Climate Study. Curr. Pollut. Rep. 2015, 1, 82–94. [Google Scholar] [CrossRef] [Green Version]
  13. Lei, L.; Nie, F.; Li, X.; Wang, L. The effect of sandstorm weather in the Hexi Corridor region of Gansu on the death of ischemic heart disease among local residents. Contemp. Med. 2019, 15, 1–4. [Google Scholar]
  14. Guan, Q.; Li, F.; Yang, L.; Zhao, R.; Yang, Y.; Luo, H. Spatial-temporal variations and mineral dust fractions in particulate matter mass concentrations in an urban area of northwestern China. J. Environ. Manag. 2018, 15, 95–103. [Google Scholar] [CrossRef]
  15. Liu, J.; Wang, R.; Zhao, Y.; Yang, Y. A 40,000-year record of aridity and dust activity at Lop Nur, Tarim Basin, northwestern China. Quat. Sci. Rev. 2019, 211, 208–221. [Google Scholar] [CrossRef]
  16. Chen, Y.Y.; Chen, N.; Tan, Z.Q.; Li, Q.; Nie, J.X. Condition analysis of thermal and dynamical characteristics of heavy dust storm in Ningxia on March 9, 2013. Arid Land Geogr. 2016, 39, 285–293. [Google Scholar]
  17. Ghassemlooy, Z.; Leitgeb, E.; Perez, J. On the Performance of FSO Communications Links under Sandstorm Conditions. In Proceedings of the 12th International Conference on Telecommunications—ConTEL 2013, Zagreb, Croatia, 26–28 June 2013. [Google Scholar]
  18. Park, J.; Li, P.; Ichijo, T.; Nasu, M.; Yamaguchi, N. Effects of Asian dust events on atmospheric bacterial communities at different distances downwind of the source region—ScienceDirect. J. Environ. Sci. 2018, 72, 133–139. [Google Scholar] [CrossRef]
  19. Zhao, S.; Yu, Y.; Xia, D.; Yin, D.; He, J.; Liu, N.; Li, F. Urban particle size distributions during two contrasting dust events originating from Taklimakan and Gobi Deserts. Environ. Pollut. 2015, 207, 107–122. [Google Scholar] [CrossRef]
  20. Dong, Z.; Su, F.; Zhang, Z.; Wang, S. Observation of chemical components of PM2.5 and secondary inorganic aerosol formation during haze and sandy haze days in Zhengzhou., China. J. Environ. Sci. 2020, 2, 10. [Google Scholar] [CrossRef]
  21. Holdt, J.V.; Eckardt, F.D.; Wiggs, G. Landsat identifies aeolian dust emission dynamics at the landform scale. Remote Sens. Environ. 2017, 198, 229–243. [Google Scholar] [CrossRef]
  22. Baddock, M.C.; Bryant, R.G.; Acosta, M.D.; Gill, T.E. Understanding dust sources through remote sensing: Making a case for CubeSats. J. Arid. Environ. 2021, 184, 104335. [Google Scholar] [CrossRef]
  23. Córdoba-Jabonero, C.; Andrey-Andrés, J.; Gómez, L.; Adame, J.A.; Sorribas, M.; Navarro-Comas, M.; Puentedura, O.; Cuevas, E.; Gil-Ojeda, M. Vertical mass impact and features of Saharan dust intrusions derived from ground-based remote sensing in synergy with airborne in-situ measurements. Atmos. Environ. 2016, 142, 429. [Google Scholar] [CrossRef]
  24. Chen, C.-Y.; Chen, H.W.; Sun, C.-T.; Chuang, Y.H.; Nguyen, K.L.P.; Lin, Y.T. Impact Assessment of River Dust on Regional Air Quality through Integrated Remote Sensing and Air Quality Modeling. Sci. Total Environ. 2020, 755, 142621. [Google Scholar] [CrossRef] [PubMed]
  25. Filonchyk, M.; Yan, H.; Yang, S.; Lu, X. Detection of Aerosol Pollution Sources during Sandstorms in Northwestern China Using Remote Sensed and Model Simulated Data. Adv. Space Res. 2018, 61, 1035–1046. [Google Scholar] [CrossRef]
  26. Fan, J.; Yue, X.; Sun, Q.; Wang, S. Case study of dust event sources from the Gobi and Taklamakan deserts: An investigation of the horizontal evolution and topographical effect using numerical modeling and remote sensing. J. Environ. Sci. 2017, 56, 62–70. [Google Scholar] [CrossRef]
  27. Lakshmi, N.B.; Nair, V.S.; Babu, S.S. Assessment of the vertical distribution of speciated aerosol absorption over South Asia using spaceborne LIDAR and ground-based observations. Remote Sens. Environ. 2020, 253, 112164. [Google Scholar] [CrossRef]
  28. Houborg, R.; Mccabe, M.F. Impacts of dust aerosol and adjacency effects on the accuracy of Landsat 8 and RapidEye surface reflectances. Remote Sens. Environ. 2017, 194, 127–145. [Google Scholar] [CrossRef]
  29. Kandakji, T.; Gill, T.E.; Lee, J.A. Identifying and characterizing dust point sources in the southwestern United States using remote sensing and GIS. Geomorphology 2020, 353, 107019. [Google Scholar] [CrossRef]
  30. Luo, H.; Guan, Q.; Pan, N.; Wang, Q.; Li, H.; Lin, J.; Tan, Z.; Shao, W. Using composite fingerprints to quantify the potential dust source contributions in northwest China. Sci. Total Environ. 2020, 742, 140560. [Google Scholar] [CrossRef]
  31. Fryrear, D.W.; Bilbro, J.D.; Saleh, A.; Schomberg, H.; Stout, J.E.; Zobeck, T.M.; Fryrear, D.W.; Bilbro, J.D.; Kadhim-Saleh, A.; Schomberg, H.H.; et al. RWEQ: Improved wind erosion technology. J. Soil Water Conserv. 2000, 55, 183–189. [Google Scholar]
  32. Thorbjarnarson, B.; McMurry, T.; Wang, X.; Ding, Y.; He, L.; Shao, M.; Xie, W. A review on dryness index and its application in geographical ecology. Chin. J. Plan Ecol. 2004, 28, 853–861. [Google Scholar]
  33. Khalili, A.; Darwish Sefat, A.; Baradaran-E-Rade, R.; Bazrafshan, J. A method for climatic classification on Selianinov system in GIS media (A case study for north west of Iran). DESERT (BIABAN) 2004, 9, 227–237. [Google Scholar]
  34. Wu, L.X.; Ma, B.D.; Liu, S.J. Analysis to vegetation coverage change in Shendong mining area with SPOT NDVI data. J. China Coal Soc. 2009, 34, 1217–1222. [Google Scholar]
  35. Feng, Z.; Tang, Y.; Yang, Y.; Zhang, D. The Relief Degree of Land Surface in China and Its Correlation with Population Distribution. Acta Geogr. Sin. 2007, 62, 1073–1082. [Google Scholar]
  36. Querol, X.; Alastuey, A.; Ruiz, C.R.; Artiñano, B.; Hansson, H.C.; Harrison, R.M.; Buringh, E.; ten Brink, H.M.; Lutz, M.; Bruckmann, P.; et al. Speciation and origin of PM10 and PM2.5 in selected European cities. Atmos. Environ. 2004, 38, 6547–6555. [Google Scholar] [CrossRef]
  37. Zha, H.; Wang, R.; Feng, X.; An, C.; Qian, J. Spatial characteristics of the PM2.5/PM10 ratio and its indicative significance regarding air pollution in Hebei Province, China. Environ. Monit. Assess. 2021, 193, 486. [Google Scholar] [CrossRef]
  38. Khodeir, M.; Shamy, M.; Alghamdi, M.; Zhong, M.; Sun, H.; Costa, M.; Chen, L.; Maciejczyk, P. Source apportionment and elemental composition of PM 2.5 and PM 10 in Jeddah City, Saudi Arabia. Atmos. Pollut. Res. 2012, 3, 331–340. [Google Scholar] [CrossRef] [Green Version]
  39. Cachorro, V.E.; de Frutos Baraja, A.M.; Vilaplana, J.M.; Henriques, D.; Toledano, C.; Vergaz, R.; Laulainen, N. Study of desert dust events over the southwestern Iberian Peninsula in year 2000: Two case studies. Ann. Geophys. 2006, 24, 1493–1510. [Google Scholar] [CrossRef]
  40. Saeed, T.M.; Al-Dashti, H.; Spyrou, C. Aerosol’s optical and physical characteristics and direct radiative forcing during a shamal dust storm, a case study. Atmos. Chem. Phys. 2014, 13, 3751–3769. [Google Scholar] [CrossRef] [Green Version]
  41. Wang, D.; Zhang, F.; Yang, S.; Xia, N.; Ariken, M. Exploring the spatial-temporal characteristics of the aerosol optical depth (AOD) in Central Asia based on the moderate resolution imaging spectroradiometer (MODIS). Environ. Monit. Assess. 2020, 192, 383. [Google Scholar] [CrossRef]
  42. Parajuli, S.P.; Yang, Z.L.; Kocurek, G. Mapping erodibility in dust source regions based on geomorphology, meteorology, and remote sensing. J. Geophys. Res. Earth Surf. 2015, 119, 1977–1994. [Google Scholar] [CrossRef]
  43. Huang, P.; Chang, Y.; Zhao, J. Comparision and Analysis of the Precision of Different Interpolation Methods for Near-ground Wind Speed InterpolationShip. Electron. Eng. 2020, 40, 4. (In Chinese) [Google Scholar]
  44. Han, Y.; Wang, T.; Tang, J.; Wang, C.; Jian, B.; Huang, Z.; Huang, J. New insights into the Asian dust cycle derived from CALIPSO lidar measurements. Remote Sens. Environ. 2022, 272, 112906. [Google Scholar] [CrossRef]
  45. Attiya, A.A.; Jones, B.G. Assessment of mineralogical and chemical properties of airborne dust in Iraq. SN Appl. Sci. 2020, 2, 1614. [Google Scholar] [CrossRef]
  46. Dong, Z.; Wang, X.; Liu, L. Wind Erosion in Arid and Semiarid China: An Overview. J. Soil Water Conserv. 2000, 55, 439–443. [Google Scholar]
  47. Sciare, J.; Bardouki, H.; Moulin, C.; Mihalopoulos, N. Aerosol sources and their contribution to the chemical composition of aerosols in the Eastern Mediterranean Sea during summertime. Atmos. Chem. Phys. 2003, 3, 1287–1315. [Google Scholar] [CrossRef] [Green Version]
  48. Han, K.S.; Park, Y.Y.; Yeom, J.M. Detection of change in vegetation in the surrounding Desert areas of Northwest China and Mongolia with multi-temporal satellite images. Asia-Pac. J. Atmos. Sci. 2015, 51, 173–181. [Google Scholar] [CrossRef]
  49. Yao, Q.; Cai, Z.Y.; Han, S.Q.; Qun, P. Study on the Pollution Characteristics of Aerosols During Low Visibility Weather at Tianjin City in Autumn and Winter 2009. Meteorol. Mon. 2012, 38, 1096–1102. [Google Scholar]
  50. Mori, I.; Nishikawa, M.; Tanimura, T.; Quan, H. Change in size distribution and chemical composition of kosa (Asian dust) aerosol during long-range transport. Atmos. Environ. 2003, 37, 4253–4263. [Google Scholar] [CrossRef]
  51. Zhang, X.Y.; Gong, S.L.; Arimoto, R.; Shen, Z.X.; Mei, F.M.; Wang, D.; Cheng, Y. Characterization and Temporal Variation of Asian Dust Aerosol from a Site in the Northern Chinese Deserts. J. Atmos. Chem. 2003, 44, 241–257. [Google Scholar] [CrossRef]
  52. Li, X.; Hu, X.Q.; Cui, C.X.; Li, J. Research on Dust Aerosol Optical Properties in South Tarim Basin and Classification of Different Dusty Weather in China. J. Desert Res. 2005, 25, 488–495. [Google Scholar]
  53. Ginoux, P.; Prospero, J.M.; Gill, T.E.; Hsu, N.C.; Zhao, M. Global-scale attribution of anthropogenic and natural dust sources and their emission rates based on MODIS Deep Blue aerosol products. Rev. Geophys. 2012, 50, 3. [Google Scholar] [CrossRef]
  54. Gillette, D.A.; Hanson, K.J. Spatial and temporal variability of dust production caused by wind erosion in the United States. J. Geophys. Res. Atmos. 1989, 94, 2197–2206. [Google Scholar] [CrossRef]
  55. Zhou, P.; Luukkanen, O.; Tokola, T.; Nieminen, J. Effect of vegetation cover on soil erosion in a mountainous watershed. Catena 2008, 75, 319–325. [Google Scholar] [CrossRef]
  56. Liang, H.; Shi, H.; Bai, Z.; Hu, Y. Assessment of Wind Erosion Hazard Degree in Typical Farming-Pastoral Ecotone of Northern China. J. Geo-Inf. Sci. 2010, 12, 510–516. [Google Scholar] [CrossRef]
  57. Chen, H.; Wang, X.; Yu, M. Effects of Strong Winds on Sandstorms in Xinjiang. Acta Sci. Nat. Univ. Pekin. 2003, 39, 187–193. [Google Scholar]
Figure 1. Location of the study area.
Remotesensing 14 03065 g001
Figure 2. Changing trend of the concentration of PM10 and PM2.5/PM10 ratio of the period relevant to the sandstorm event in April 2018, for the case study area.
Remotesensing 14 03065 g002
Figure 3. Spatial distribution of daily mean AOD at 550 nm during the period relevant to the sandstorm event in April 2018, for the case study area.
Remotesensing 14 03065 g003
Figure 4. Spatial distribution of wind speed and wind direction during the period relevant to the sandstorm event in April 2018, for the case study area.
Remotesensing 14 03065 g004
Figure 5. Spatial distribution of multi-day average AAI of the period relevant to the sandstorm event in April 2018, for the case study area.
Remotesensing 14 03065 g005
Figure 6. Total attenuation backscattering coefficient of 532 nm obtained by CALIPSO for the period relevant to the sandstorm event in April 2018, for the case study area.
Remotesensing 14 03065 g006
Figure 7. Simulation of dust backward trajectories in different cities of Northwest China for the period relevant to the sandstorm event in April 2018, for the case study area.
Remotesensing 14 03065 g007
Figure 8. Results of sensitivity analysis of wind erosion factors (annual values of wind field intensity, vegetation coverage, relief amplitude, and soil drought index for 2018).
Remotesensing 14 03065 g008
Figure 9. Sensitivity to wind erosion estimated for the case study area, using wind erosion factors estimated for 2018.
Remotesensing 14 03065 g009
Table 1. Criteria for the sensitivity scale.
ClassificationWind Filed Intensity
(m3 × s−3)
Vegetation CoverageRelief Amplitude
(m × km−2)
Soil Drought Index
Extremely sensitive0.7–0.96<0.0870–90<3.85
Highly sensitive0.5–0.70.08–0.1545–703.85–8.56
Moderately sensitive0.4–0.50.15–0.3325–458.56–15.31
Low sensitive0.3–0.40.33–0.5615–2515.31–25.68
Insensitive<0.30.56–0.92<1525.68–70.00
Publisher’s Note: MDPI stays neutral with regard to jurisdictional claims in published maps and institutional affiliations.

