Abstract
The vortex electromagnetic wave radar based on monostatic geometry can realize the imaging of a radar target in both range dimension and azimuth dimension by adjusting vortex electromagnetic wave modes, but it has no ability to distinguish the elevation of the radar target. To achieve three-dimensional imaging of the radar target, a three-dimensional imaging method of vortex electromagnetic wave based on bistatic geometry is proposed. The echo model of the target based on vortex electromagnetic wave in bistatic geometry is constructed firstly. The elevation resolution of the target is realized, and then the three-dimensional coordinate of the target is reconstructed. Moreover, the elevation resolution and the computational complexity of the proposed method are also analyzed. Simulation results demonstrate the effectiveness of the proposed method. The results also illustrate that the array element requirements and the computational complexity of presented algorithm are less than Multiple Signal Classification (MUSIC) algorithm.
1. Introduction
With the diverse applications for radar target detection, the traditional imaging technology cannot meet the new requirements, the imaging ability of synthetic aperture radar (SAR) or inverse synthetic aperture radar (ISAR), which is limited in the situation of no relative motion between the targets and radar. Driven by these actual requirements, new radar imaging technologies have emerged in past decades. In particular, the radar imaging technology based on vortex electromagnetic (EM) wave has attracted extensive attention. The vortex EM wave has the spiral structure along the propagation direction and the phase distribution is helical []. The different modes can be obtained by changing the orbital angular momentum (OAM); thus, the vortex EM wave provides a new freedom for radar imaging.
In the last ten years, a large number of research results have appeared regarding vortex EM wave imaging technology [,,,,,,,,,,,,,,]. Ref. [] shows the ability of vortex EM wave to distinguish the azimuth of radar targets by using the dual relationship between OAM modes and azimuth. Thereafter, Refs. [,,,,,,] realized the high-resolution imaging of azimuth and reconstructed the two-dimensional imaging results of the target by using fast Fourier transform (FFT) or sparse Bayesian learning (SBL). Refs. [,] realized that radar coincidence imaging (RCI) depends on spatial phase distribution characteristics of the vortex EM wave in the different modes. The vortex EM wave radar with fractional modes has good anti-noise performance [,]. Ref. [] reduces the requirement of the azimuth resolution on the amount of mode data by using compressed sensing (CS) theory. Ref. [] only obtains elevation of the radar target by CS through the location relationship between the target and elements of uniform circular array (UCA). Ref. [] uses Multiple Signal Classification (MUSIC) algorithm to further improve the azimuth resolution of radar target and obtain the imaging results in both azimuth dimension and elevation dimension through two-dimensional spatial search. However, it has no ability to achieve three-dimensional imaging of radar target because of the correlation problem of scattering points. In summary, the above research [,,,,,,,,,,,,,,] reconstructs the imaging of radar targets with the monostatic geometry by using UCA. The transmitter is usually set at the center of the UCA, and the receiver uses the UCA in this observation geometry, thus only two-dimensional imaging can be obtained with this monostatic configuration.
In fact, it is valuable to obtain more characteristics of the target from three-dimensional (3-D) imaging results, such as the target size, the relative position of scatters and so on. In order to obtain these characteristics of the target, lots of research apply the vortex EM wave to the SAR or other conventional radars [,,,,]. Ref. [] based on interferometric SAR processing solves the height information with the designed observation geometry. Ref. [] utilizes the relative motion between radar and targets and obtains the 3-D imaging of the targets. Refs. [,,] applies the vortex EM wave to SAR, the three-dimensional information is obtained in which the term of fast time, slow time and the OAM mode, respectively. It means that the cross range is solved by virtual antenna aperture and the azimuth is solved by the OAM modes. Refs. [,,,,] describe the 3-D imaging of the target using monostatic geometry based on the vortex EM wave, but the 3-D imaging method still needs the aperture in the term of space.
In order to realize the three-dimensional imaging of stationary or non-relative moving targets based on vortex electromagnetic wave radar, a three-dimensional imaging method with bistatic vortex electromagnetic wave radar is proposed in this paper. Compared with monostatic geometry, the bistatic geometry is applied, where two transmitters are set outside of the UCA. The angle between transmitting path and receiving path is relatively large, which means a new observation perspective for the target. Thus, in addition to the range-azimuth imaging, the elevation of radar target is expected to be obtained by utilizing the geometric relationship between the transmitters and the receivers.
In this paper, the echo model of bistatic vortex electromagnetic wave radar is constructed, and the capability of the elevation resolution of radar target is analyzed in Section 2. In Section 3, the three-dimensional imaging method is given. The elevation resolution and the calculation complexity of proposed algorithm are discussed in detail. Compared with [], the number of array elements of receiving unit and the calculation complexity are significantly reduced. Finally, the effectiveness of the proposed method is verified by simulation experiments in Section 4. Conclusions are made in Section 5.
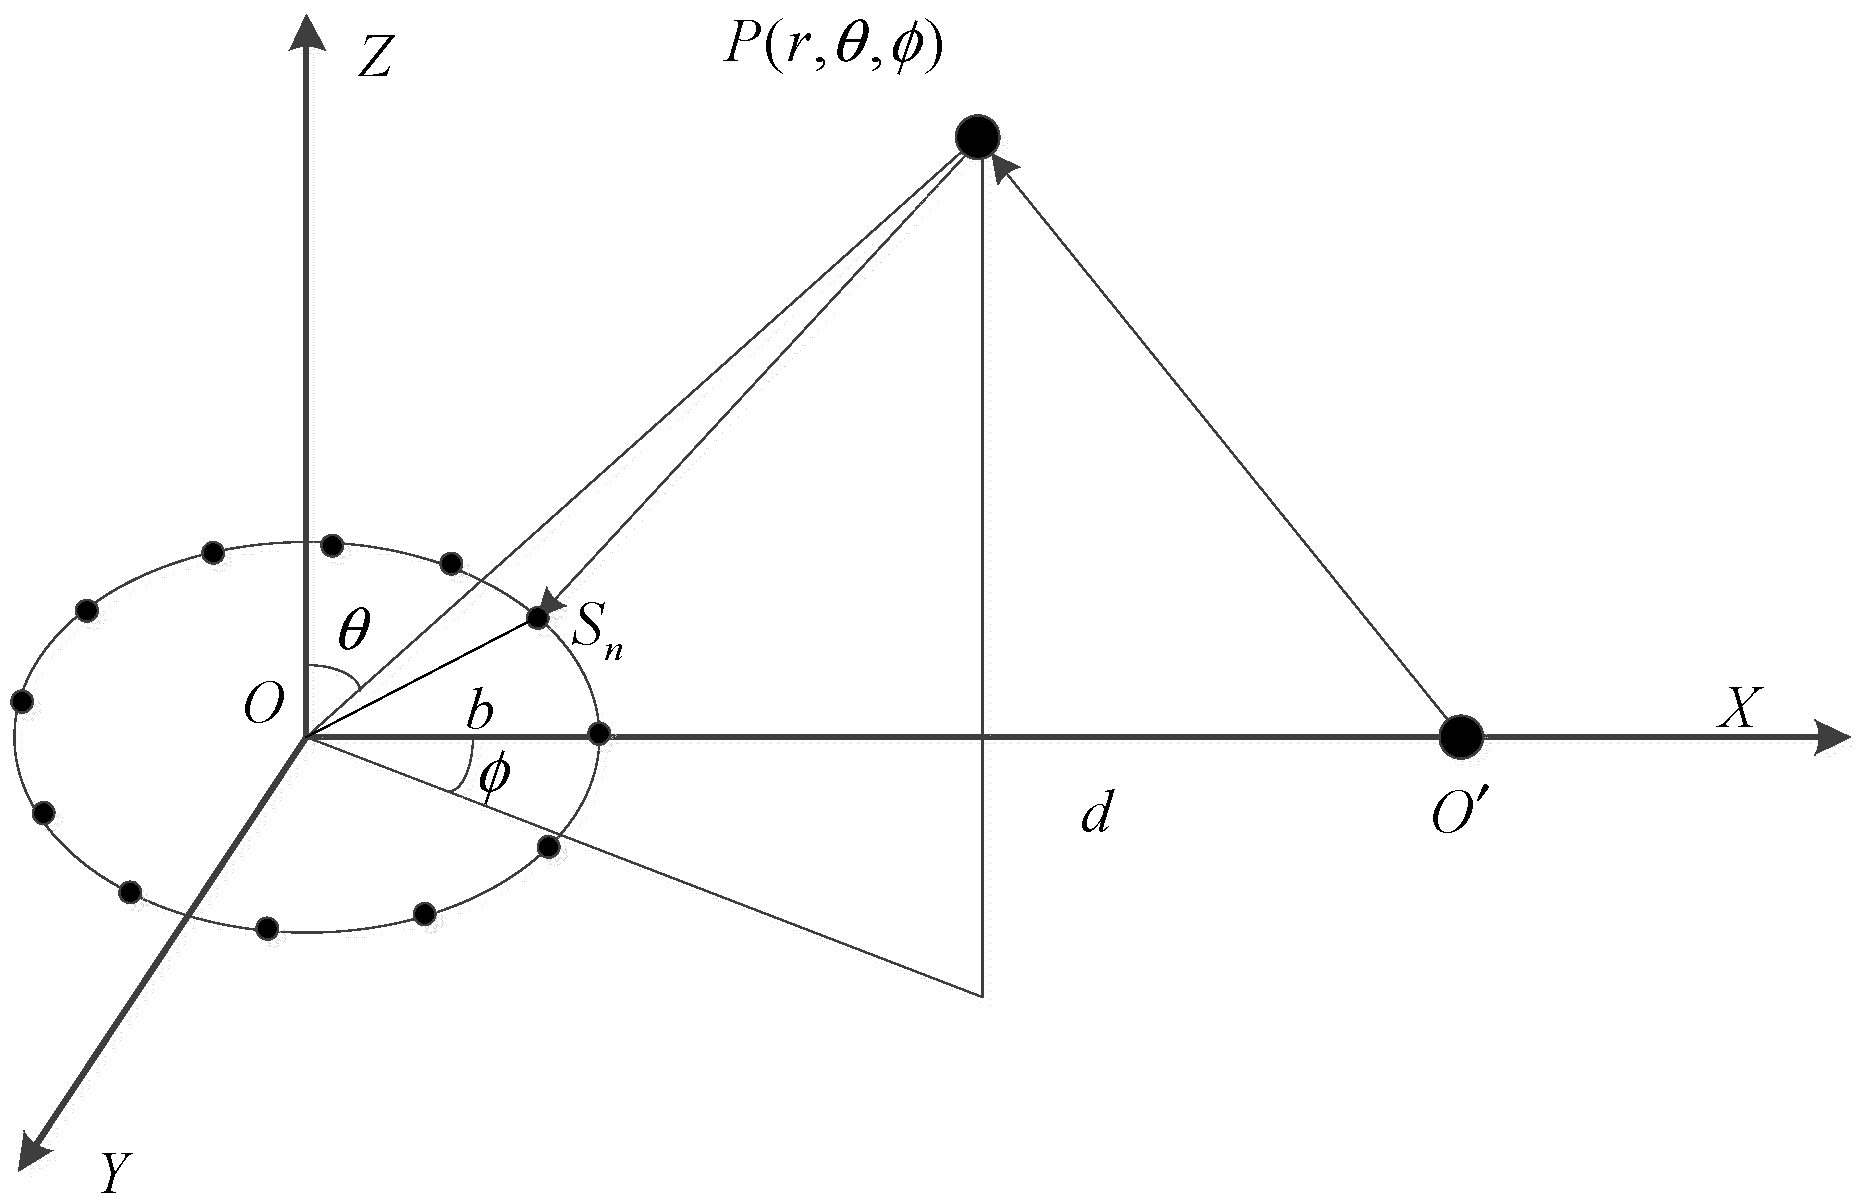
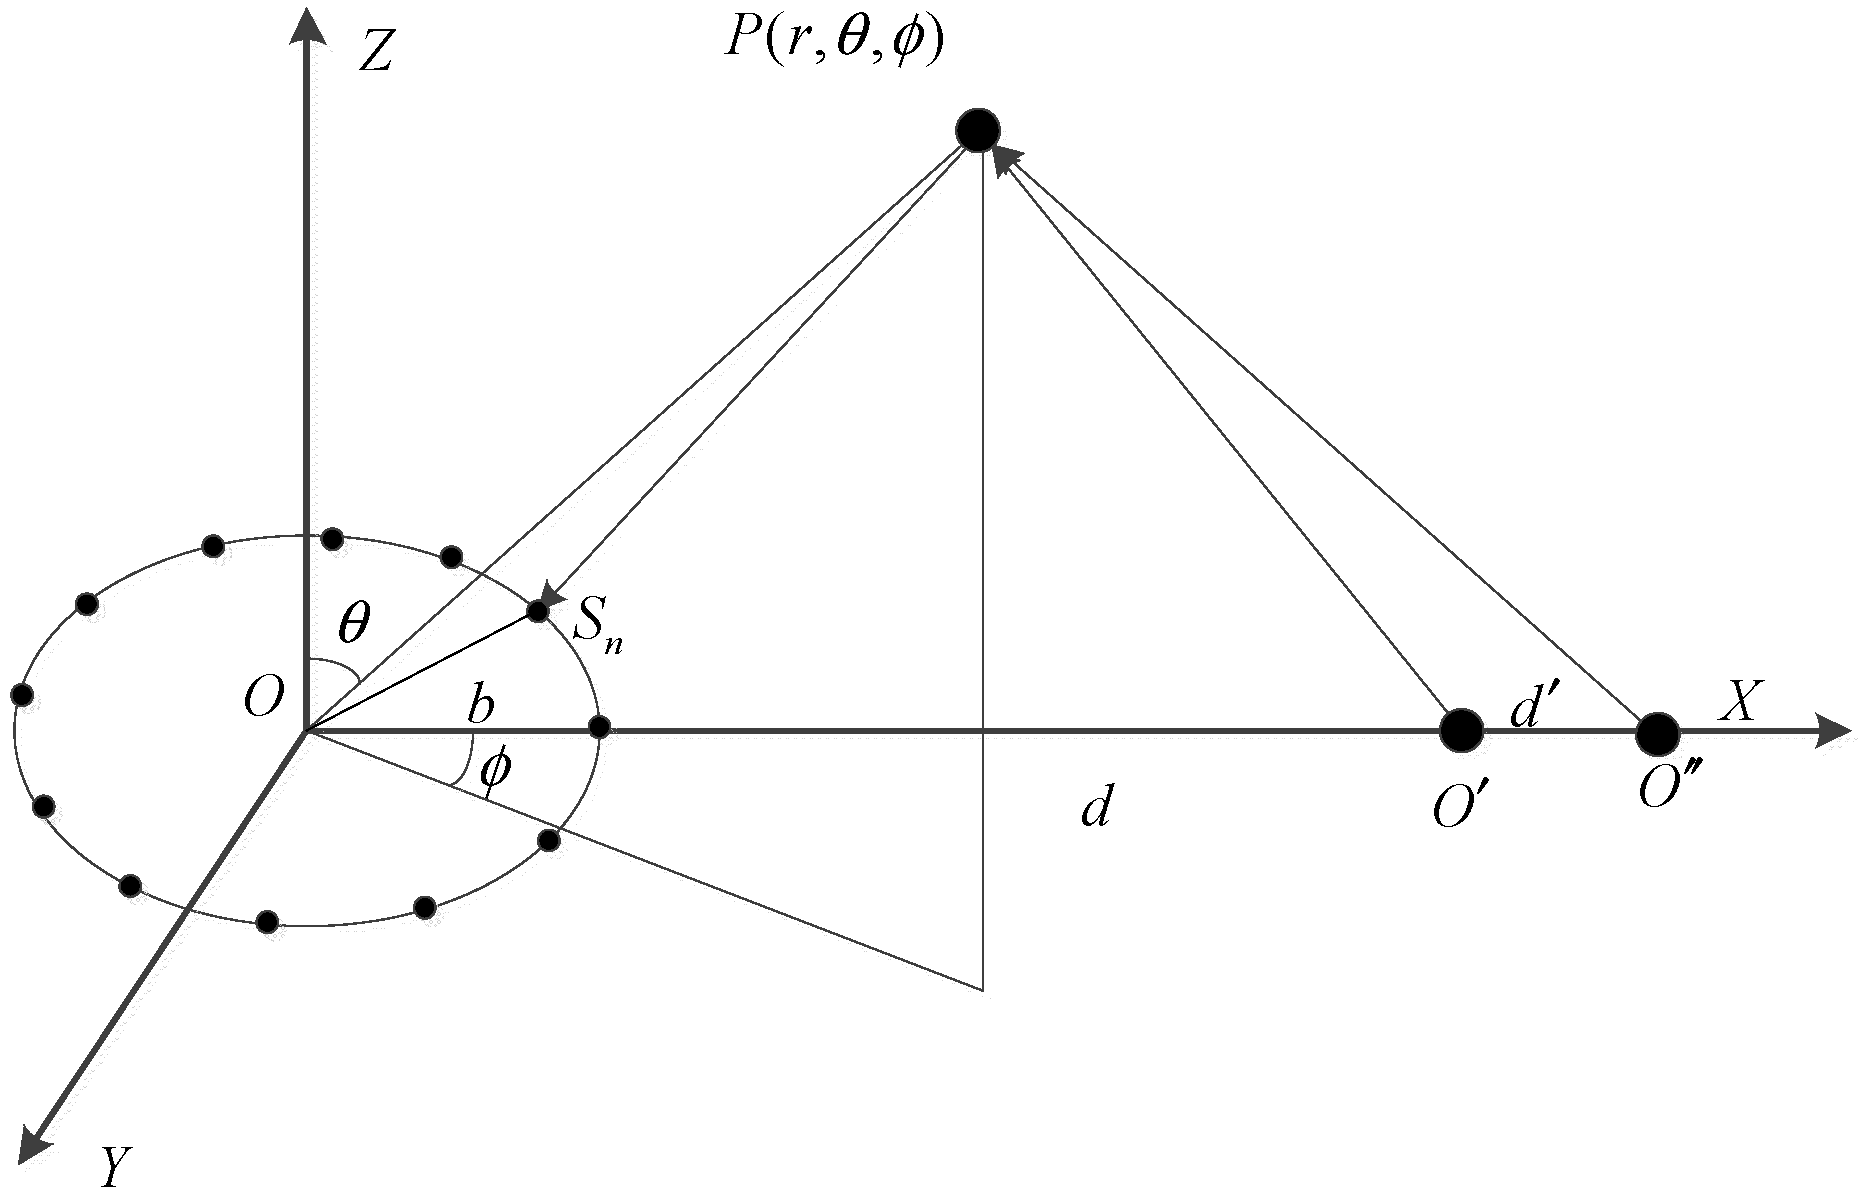
2. Echo of Bistatic Vortex EM Wave Radar
As shown in Figure 1, the UCA is used as the receiving unit and the center of UCA is located at the coordinate origin . The UCA is consisting of omnidirectional elements placed equidistantly on the circle with radius . The location of the nth elements of the UCA is denoted as . The transmitting unit is an independent omnidirectional antenna located at , and the transmitted linear frequency modulation (LFM) signal is denoted as . Assume is an arbitrary independent scatterer in the space. According to [], the echo of the scatterer received by the UCA can be expressed as:
where is the scattering coefficient of , is the delay of the signal and , is the speed of the light, is the propagation distance in the space, and is the mode number of the vortex EM wave. When the angle between the transmission path and the receiving path is small, the radar geometry shown in Figure 1 can be approximated to a monostatic radar. Therefore, can be approximately calculated as thus the time delay Although the information of the range and azimuth can be obtained from (1) by FFT method in terms of fast time and OAM mode, respectively, the elevation still cannot be calculated from the amplitude term of the echo. Therefore, in the monostatic geometry, only a two-dimensional image can be obtained.
Figure 1.
The radar geometry.
Let the transmitter move from point to point that located in the positive direction of X-axis, and the distance between and is . The echo of scatterer received by element can be expressed as:
where is the fast time and , is the propagation delay and , is the signal pulse width, is the rate of frequency modulation, is the angle between the element and positive direction of X-axis in the plane. The total echo received by the N elements of UCA can be expressed as:
Compared with the monostatic geometry, the angle between the transmission path and the receiving path is relatively large, so this kind of radar geometry can be considered as bistatic. The propagation distance need be expressed as , where is the distance from element to point and is the distance from point to element Assume the unit vector is along the direction of the line , it can be written as:
Then, the vector expression of line can be given as , and the vector expression of line can be given as . Thus, the distance and can be separately expressed as:
According to (5) and (6), the with bistatic is different from monostatic by adding the term of , thus the total echo can be further expressed as:
where and . Let = , and according to the Janoci-Anger formula, can be expressed as:
where is the first kind of th order Bessel function. It can be easily calculated that the expression of equals . When the value of is large, the amplitude of th order Bessel function is much larger than other orders. Thus, (8) can be approximately expressed as:
Finally, the echo received by UCA of can be expressed as:
where . Then, the 2-D Fourier transform can be used in processing echo data to obtain the range and azimuth of the target. Compare the expression of echo in (1) and (10), the information of azimuth is same in two different geometries, but the information of the range in bistatic geometry is expressed as . It means the elevation of target can be obtained from the range information.
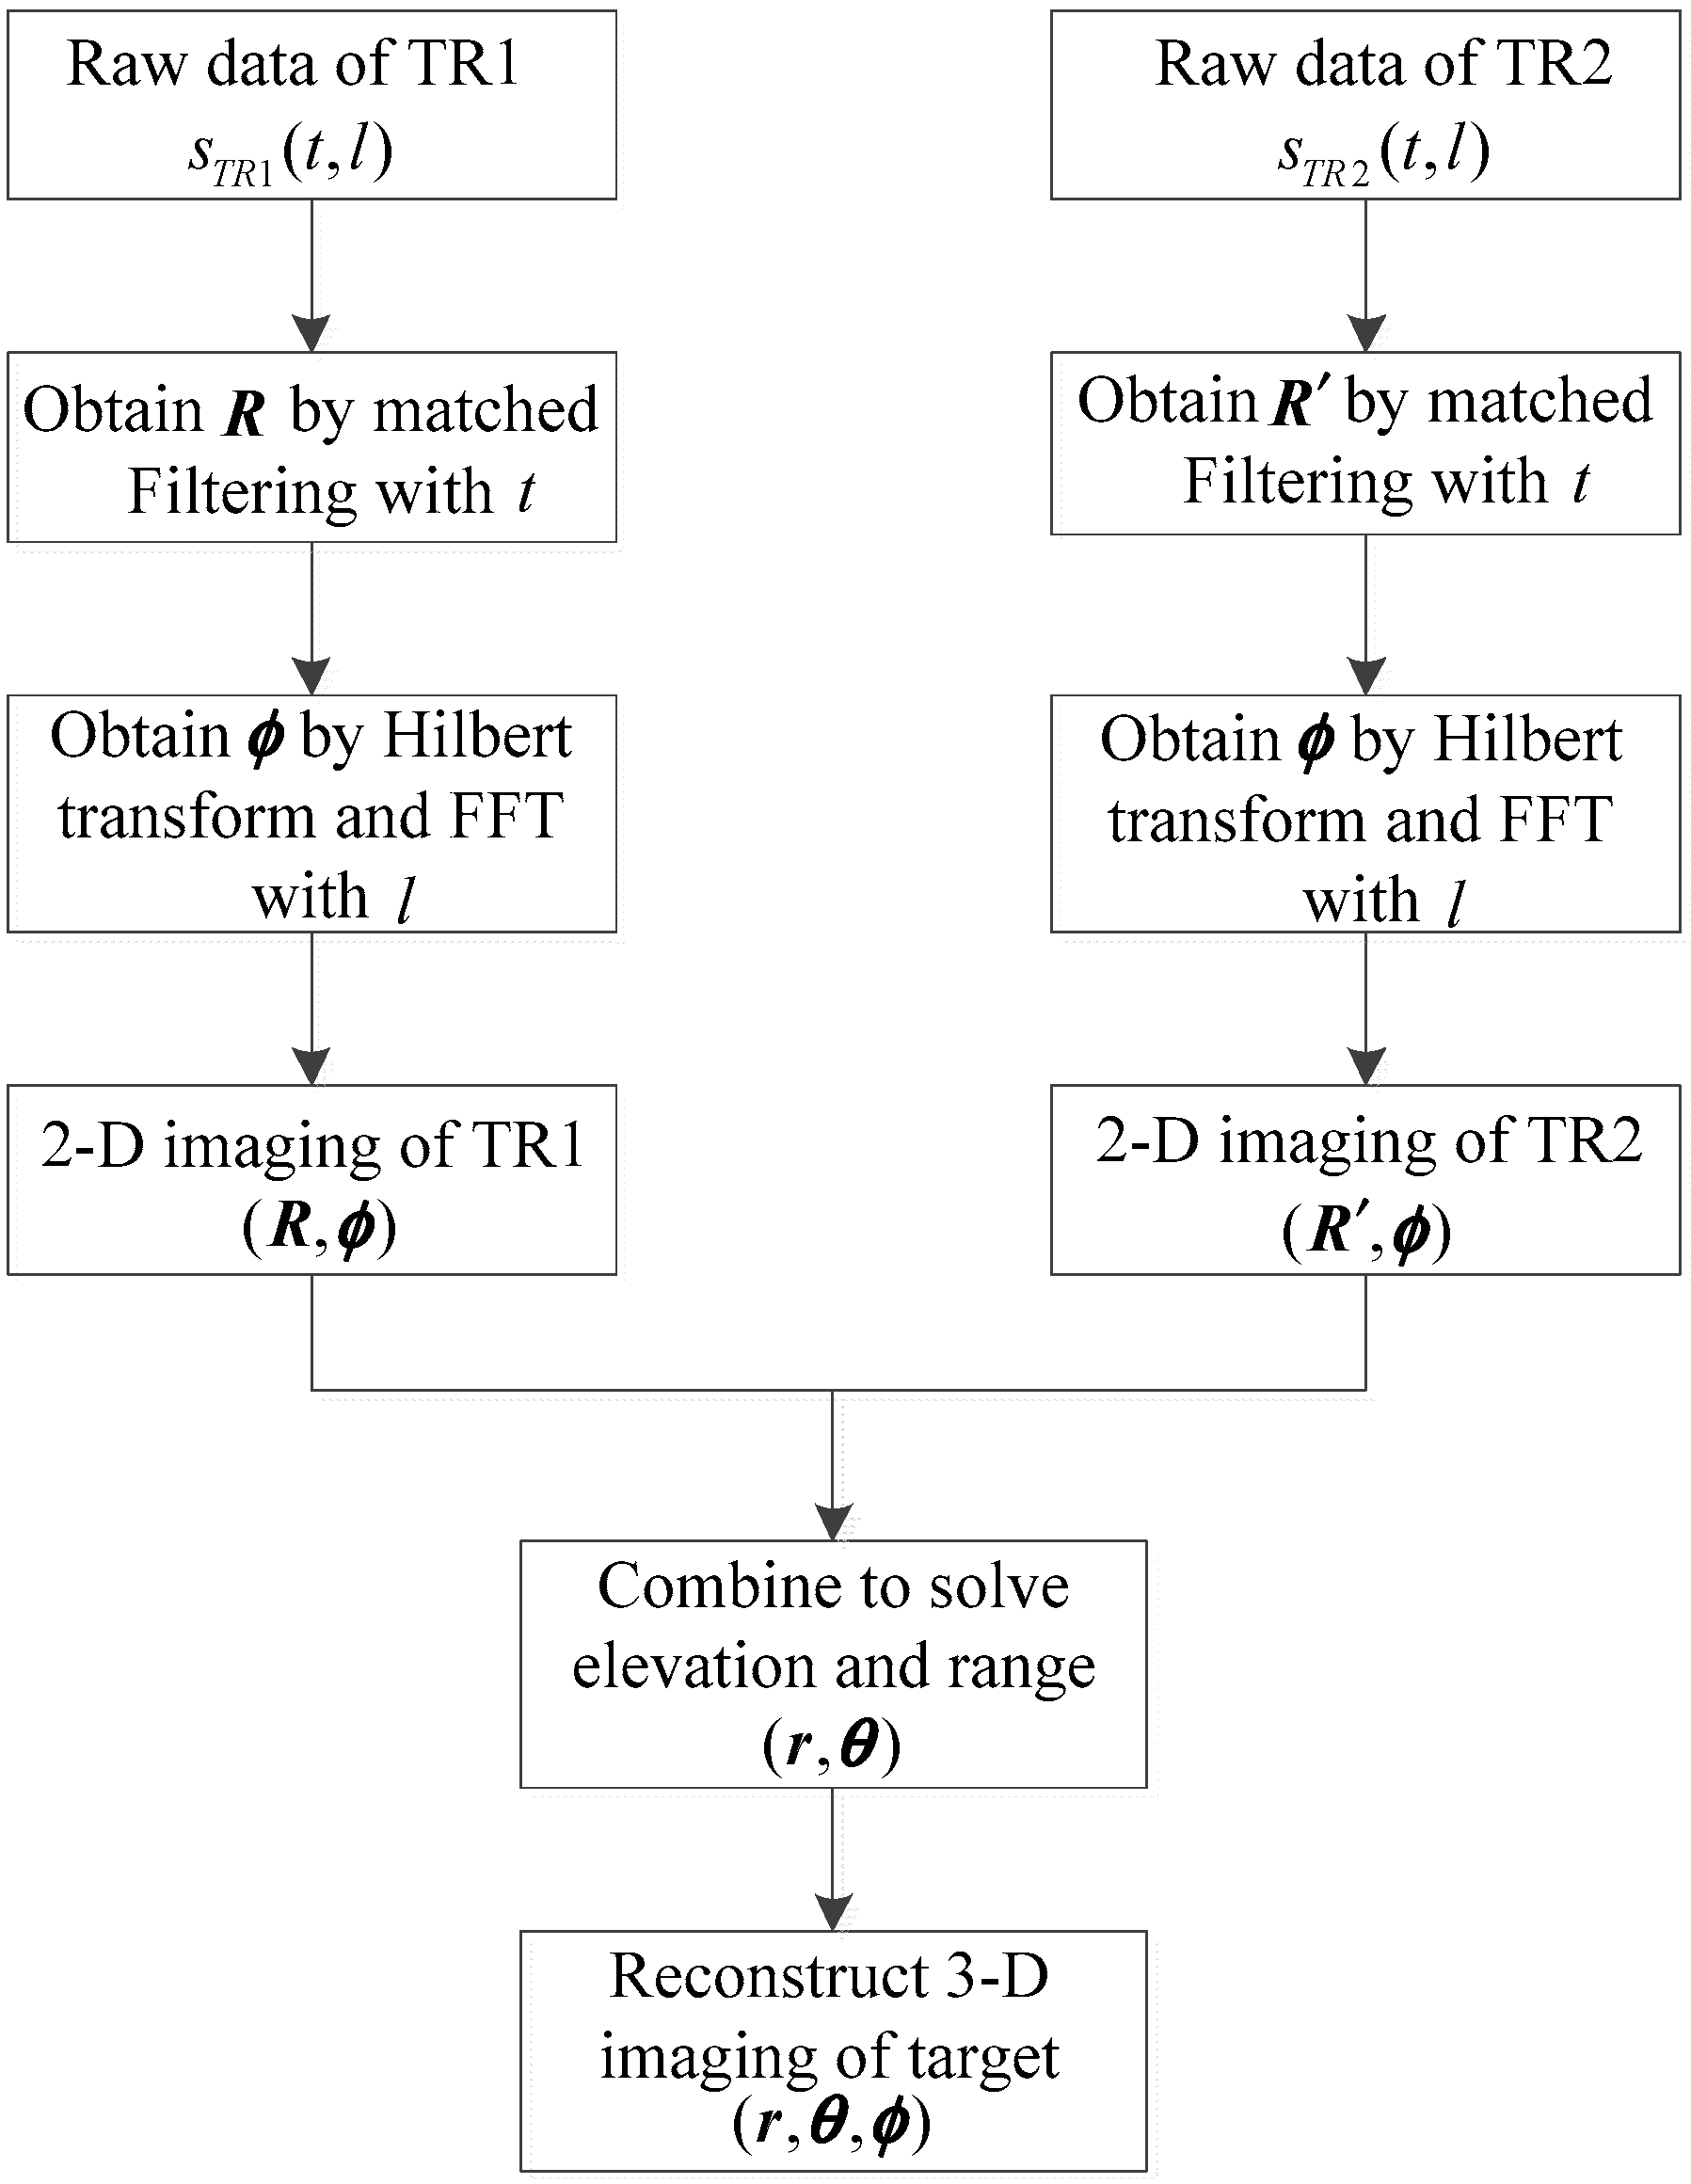
3. Three-Dimensional Imaging Method in Bistatic Geometry
Suppose the radar target consists of scatterers and the location of the th scatterer is denoted by . In the bistatic geometry, the echo of radar target can be written as:
where is the time delay of the th scatter and , is the scattering coefficient of the th scatterer. The target can be imaged in range dimension by using matched filtering. The center point of the target is set as , then the echo of the point is set as the reference signal and denoted by . The signal output by the matched filtering can be expressed as:
where . The information of the range can be obtained from the peak locations of (12).
The FFT in terms of l is subsequently used to get the azimuth . In fact, the Bessel function is a part of the amplitude of the echo, and its effects on imaging result of azimuth must be considered. As it is known that when , the Bessel function can be approximately expressed as:
From (13), it can be found that, in the FFT result of the Bessel function, there will be a null at zero frequency and a pair of symmetrically distributed narrowband spectrum shift components at , which has no relation with the elevation . Therefore, the spectrum shift by equals the effect by the square of Bessel function. The square of Bessel function is shown in Figure 2. It will exhibit symmetric spectral components at after FFT. According to [], the frequency shift can be eliminated through Hilbert transformation, so the echo signal is firstly processed through Hilbert transformation before the FFT, then the azimuth information of the scatterer is obtained.
Figure 2.
The spectrum of square of Bessel function.
After the above processing, the azimuth and the range have been obtained. However, is not the real range information of the target but includes the three-dimensional information of the target. From the expression , where is known, the azimuth can be solved. For scatterers, the expression can be given by:
where is the range vector and , is the elevation vector and , is the equation coefficient and , is the Hadamard product. The elevation and the range of scatterers need to be solved from (14) to achieve the target three-dimensional reconstruction. However, in fact, groups of cannot be solved just from (14).
Let an additional transmitting element be added at point along the positive direction of X-axis, which is shown in Figure 3, and the distance between and is , the signal transmitted by element is , which is orthogonal with . It means the transmitters and receivers form two mutually independent channels, which is recorded as TR1 and TR2, respectively. Similarly, the range information can be obtained from the echo data of TR2, and the expression can also be written as:
where is the equation coefficient vector, , is the range vector of TR2, . Equations (14) and (15) can be united to solve the elevation of the target, and the expression of elevation of the th scatterer can be given by:
Figure 3.
The radar geometry with two transmitters.
According to (14)–(16), the information of elevation is obtained. Thus, the elevation resolution is determined by the range resolution when the azimuth resolution is enough. Suppose the elevation resolution is no less than , following must be satisfied:
where and is the bandwidth of the transmitting signal. The elevation resolution is in inverse proportion to the bandwidth of signal. If the elevation resolution is set as , the bandwidth needs to be , where . However, the value of is different in the various extent from 0 to as shown in Figure 4. Figure 4 shows the value of is small when the elevation is relatively large, which means the bandwidth of signal should be set according to the maximum elevation of the target.
Figure 4.
The value profile of with different .
After is solved from (16), can be obtained from (14) or (15). In summary, the 3-D imaging method proposed in this paper is described as follows:
Step (1): a Cartesian coordinate system is constructed with the center of the UCA array as the origin, then two transmitters are set up at different positions along the X-axis, which composes TR1 and TR2 with the UCA, respectively;
Step (2): the echo data of TR1 and TR2 is processed by matched filtering in terms of the fast time;
Step (3): Hilbert transform and FFT are successively applied in terms of the OAM mode;
Step (4): the solution of and are united to solve the real range and elevation of each scatterer, then the 3-D imaging is obtained.
The flow of the three-dimensional imaging method is summarized in Figure 5.
Figure 5.
The flow of 3-D imaging method.
The computational complexity of the proposed method is obviously less than the MUSIC method. The computational complexity of the standard MUSIC is given by []:
where is the number of spatial search points and , is the elevation resolution. The number of the target must be known in advance for MUSIC algorithm, and the number of the OAM mode needs to be more than the target scatterer number []. Thus, the number of the array elements is assumed one more than the number of target , then it yields:
It is obvious that the computational complexity of MUSIC is mainly decided by the number of array elements and the elevation resolution. The computational complexity of the proposed method depends on 2-D FFT in terms of the fast time and the OAM mode, and it can be given by:
where is the number of sampling points in the fast time domain, is the amount of calculation in range imaging and is the amount of calculation in azimuth imaging. When N and M are set as the same as the MUSIC method, (20) can be further expressed as:
It can be found that the computational complexity of the proposed method is mainly decided by N and . is in direct proportion with the bandwidth of transmitting signal such as , where is the range of detection area. The range resolution has the relation with the bandwidth of transmitting signal, so can be given by:
The elevation resolution of the proposed method is decided by the range resolution, so will be increased with the rise of the elevation resolution and lead to higher computational complexity.
By comparing (19) and (21), the term related to is the cubic term and the residual term is the square of and for the MUSIC method, but the term in (21) related to and is all approximate linear relation. With the increased resolution in elevation dimension, the amount of calculation of MUSIC will increase exponentially, but will increase only linearly for the proposed method.
4. Simulation
Assume the UCA consists of 50 elements, the center of array is located at the origin and the radius of UCA is 0.3 m. The two transmitters are set at the direction of X-axis in different position and the distance between them is 2 m. The LFM signal is set as transmitting signal, the center carrier frequency is 10 GHz and the bandwidth is 2 GHz. The range of the OAM mode is . Four scatterers are set in the space, which are , , and respectively.
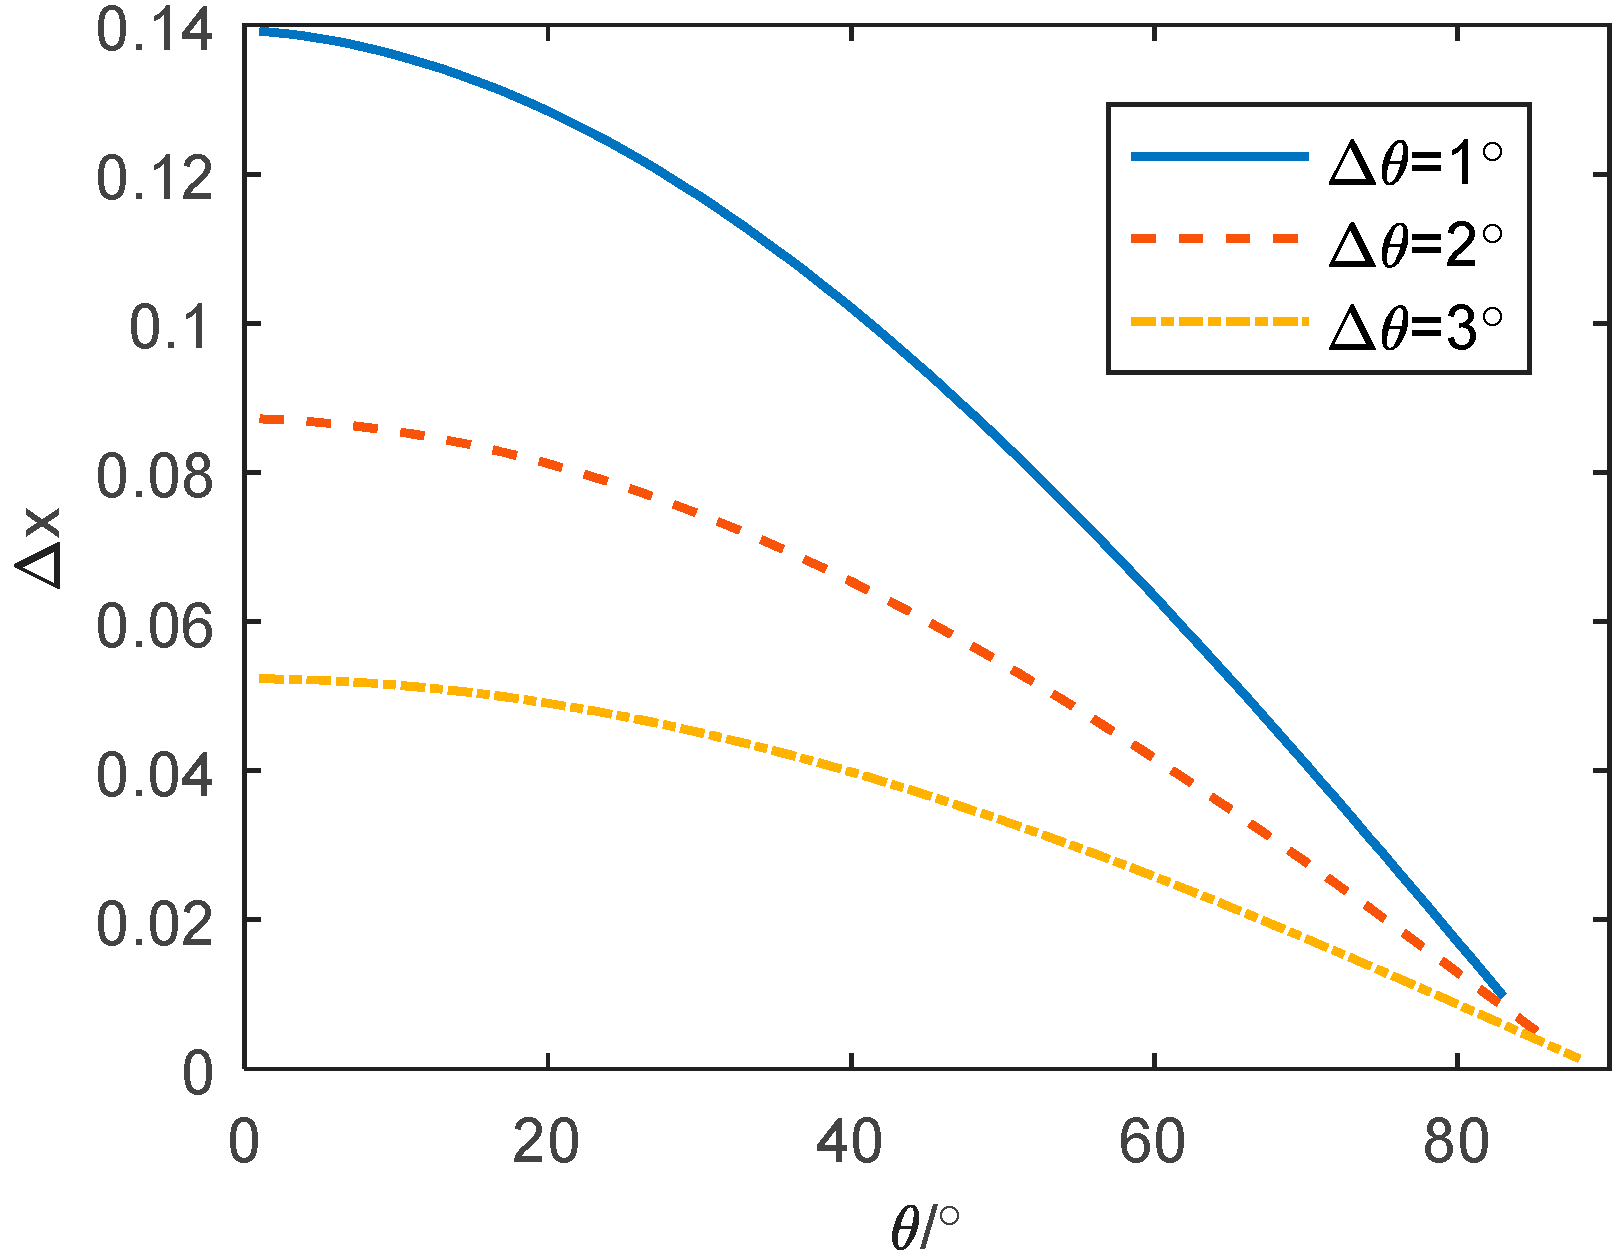
4.1. Range Imaging in Bistatic Geometry
The result of the scatterers in the range dimension can be obtained through the matched filtering as shown in Figure 6. Figure 6a is the range imaging in the monostatic geometry based on [,,], and the result is and it is same as the real range of target. Figure 6b,c show the range imaging in the monostatic geometry of TR1 and TR2, respectively. According to (10), the information of contains the 3-D coordinate information of target and ; thus, from the expression of the , the range result of TR1 and TR2 is listed in Table 1. It is verified by simulation results in Figure 6b,c, respectively.
Figure 6.
The range imaging results. (a) The range imaging in monostatic geometry; (b) the range imaging in bistatic geometry of TR1; (c) the range imaging in bistatic geometry of TR2.
Table 1.
The range result in different geometry.
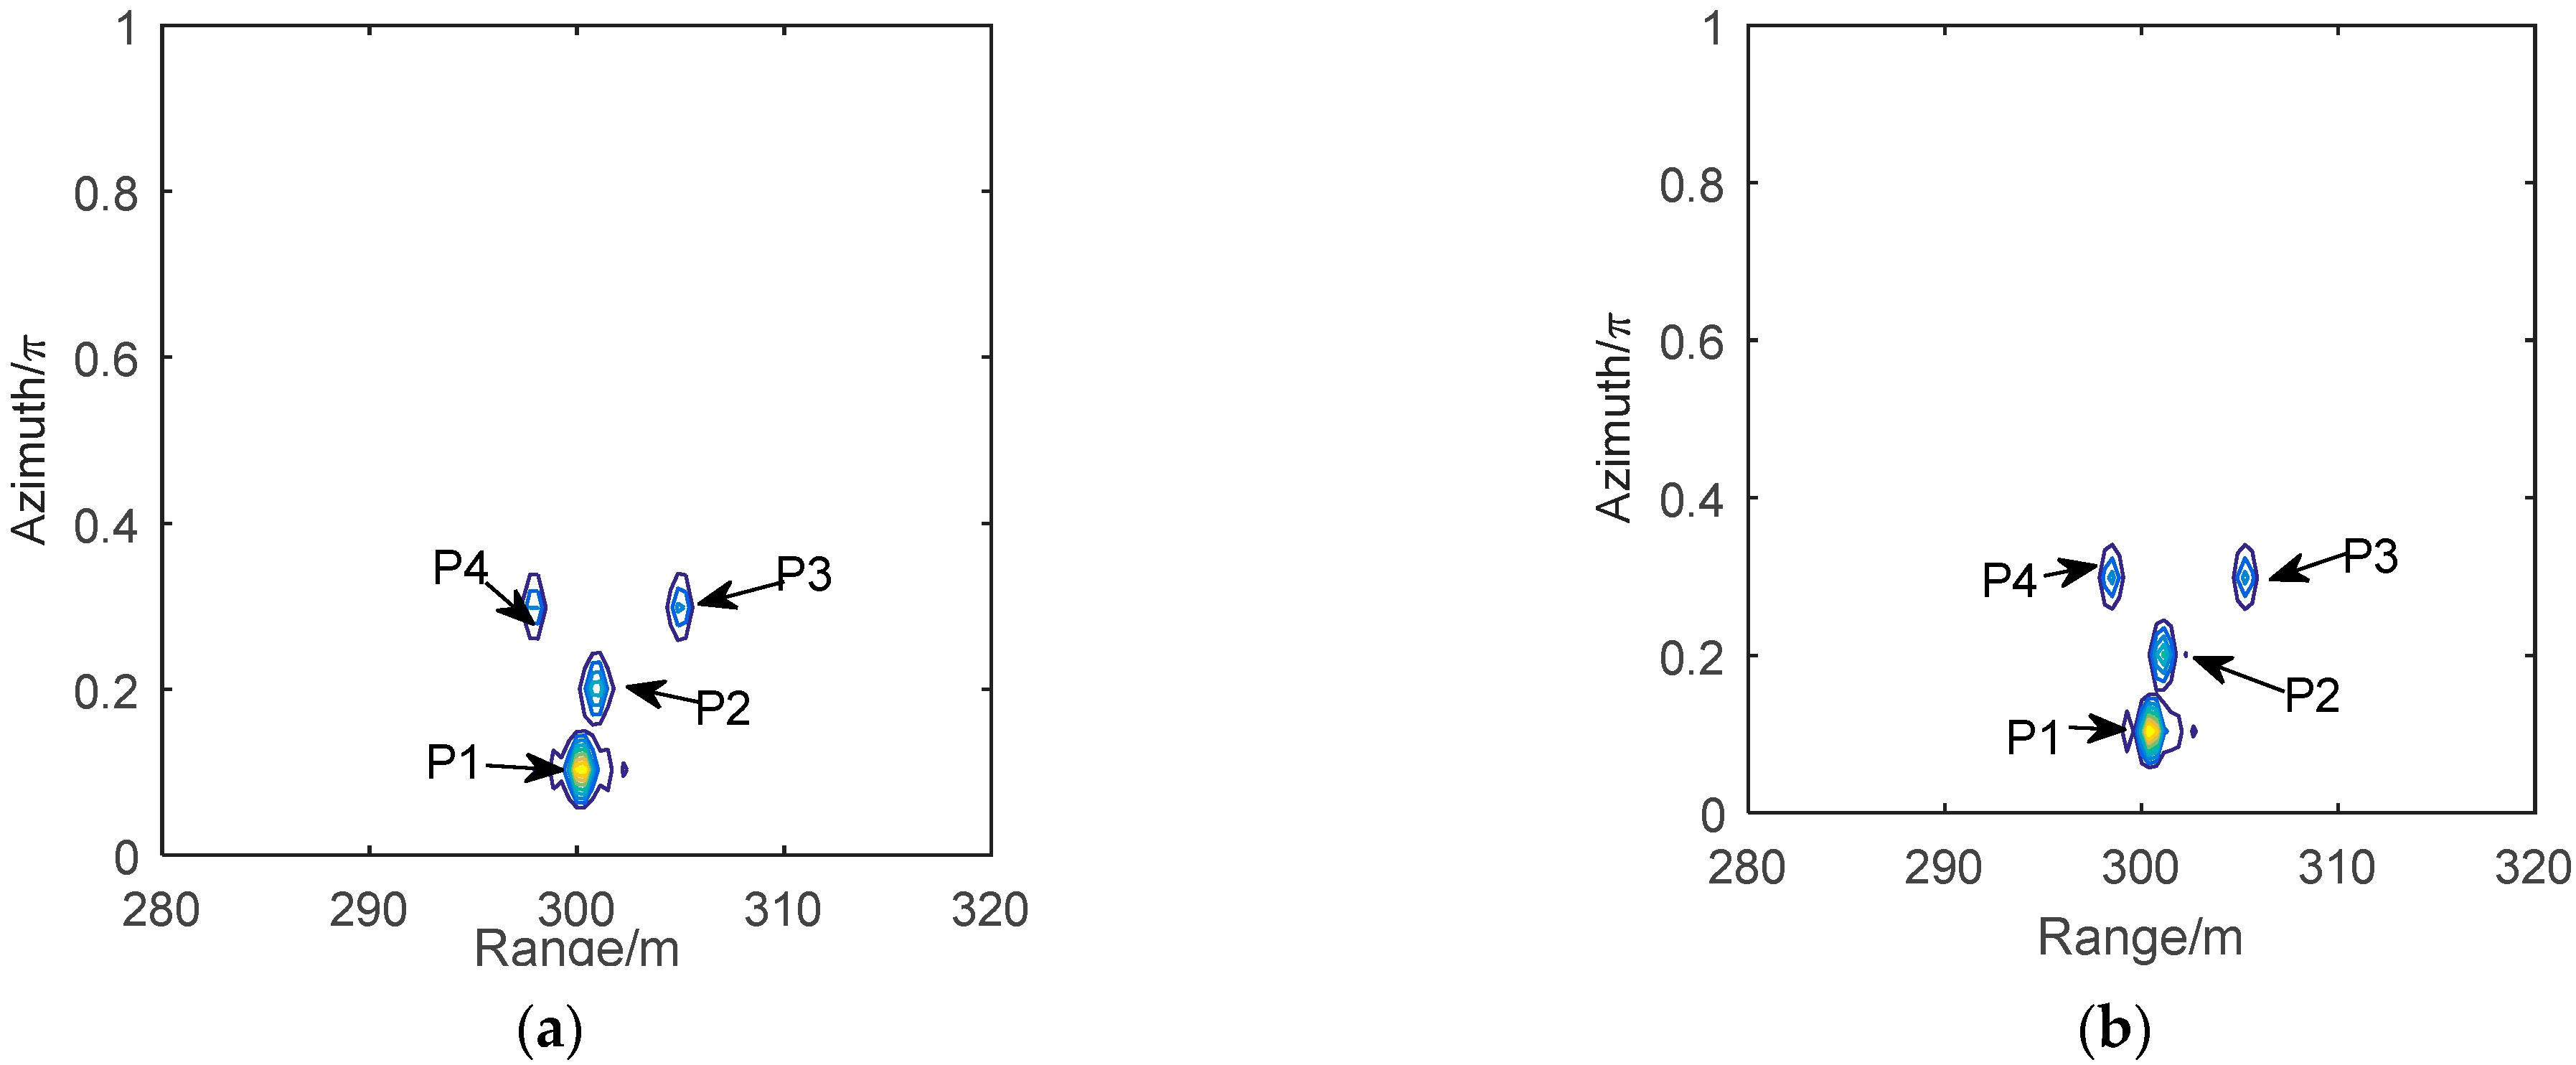
4.2. 2-D Imaging in Bistatic Geometry
After the Hilbert transform and 2-D FFT, the imaging result of the range-azimuth can be obtained in the bistatic geometry as shown in Figure 7. Figure 7a,b shows the result of TR1 and TR2, respectively.
Figure 7.
The 2-D imaging result of range-azimuth in the bistatic geometry. (a) The result of TR1; (b) the result of TR2.
According to the 2-D imaging result of TR1 and TR2, the real range and the elevation of the target can be solved by utilizing (14)–(17). The ideal imaging and the simulation imaging by the proposed method are shown in Figure 8. The red points represent the ideal imaging, and the blue points represent the simulation results, respectively.
Figure 8.
The 2-D imaging result of rang-elevation.
It can be seen that the scatterers , and can be reconstructed accurately, but there is some error between the simulation result and actual position of the scatterer . The bandwidth of signal decides the range resolution. The range result of some scatterers may shift one range unit, thus the maximum error in range dimension by proposed method is 2-unit. Furthermore, taking scatter in Figure 8 for analysis, the range difference between two channels is 0.2668 m in theory, and it corresponds to 8-unit in range. However, the range difference in simulation is 0.2625 m and only corresponds to 7-unit, which causes there to be about elevation difference between the simulation and the true value. Figure 9 shows the average calculation error is no more than when the elevation resolution is high enough.
Figure 9.
The elevation result with different unit error.
It is known that the elevation of , the bandwidth of signal and the range resolution is , 2 GHz and 0.0375 m, respectively. According to (17), the elevation resolution of and range resolution have the relation shown in Figure 10. When is 0.0375 m and elevation is , the elevation error is between . The elevation of is in simulation and the real elevation of is , the error is about , which is consistent with theoretical analysis.
Figure 10.
The relation between elevation calculation error and range resolution.
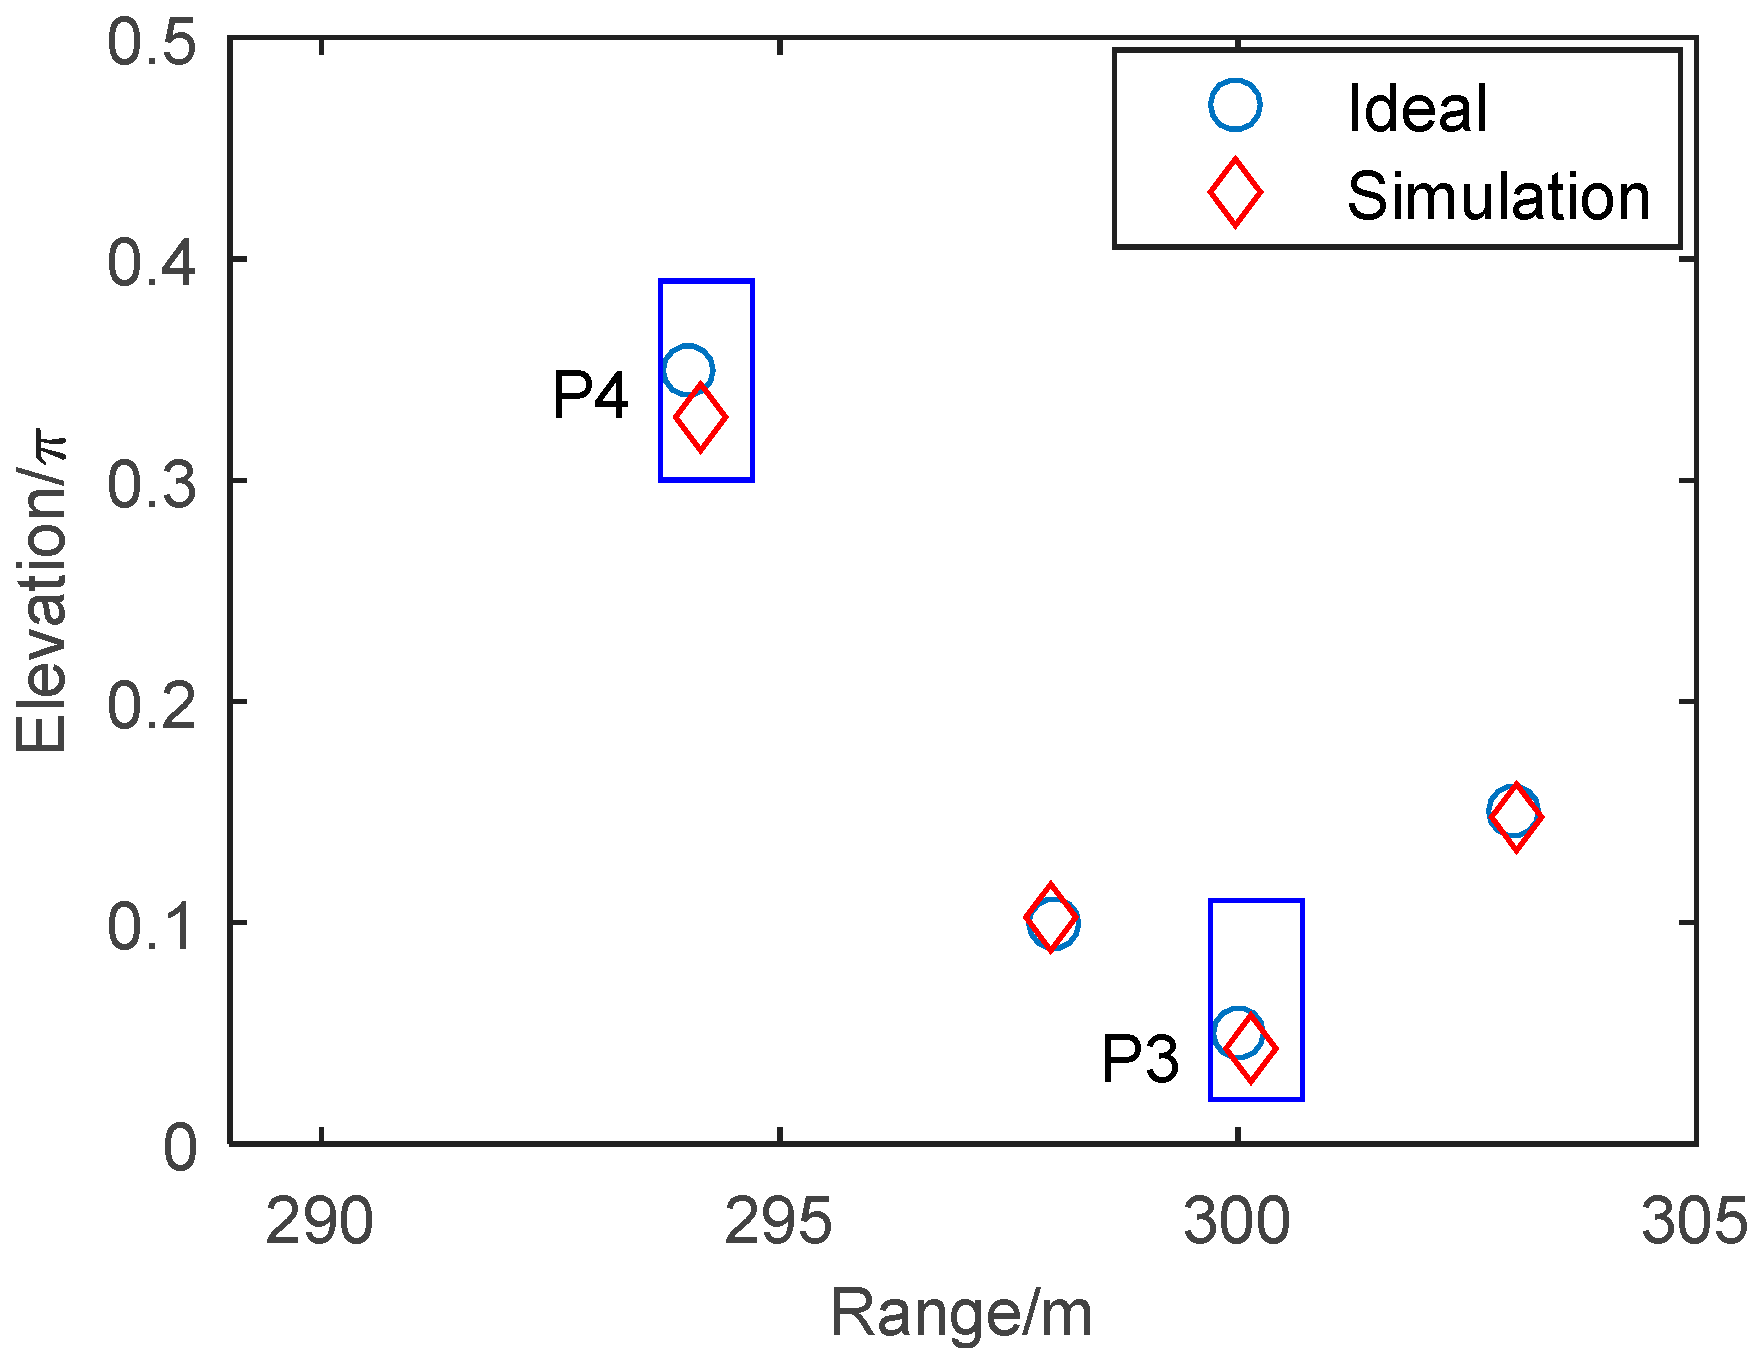
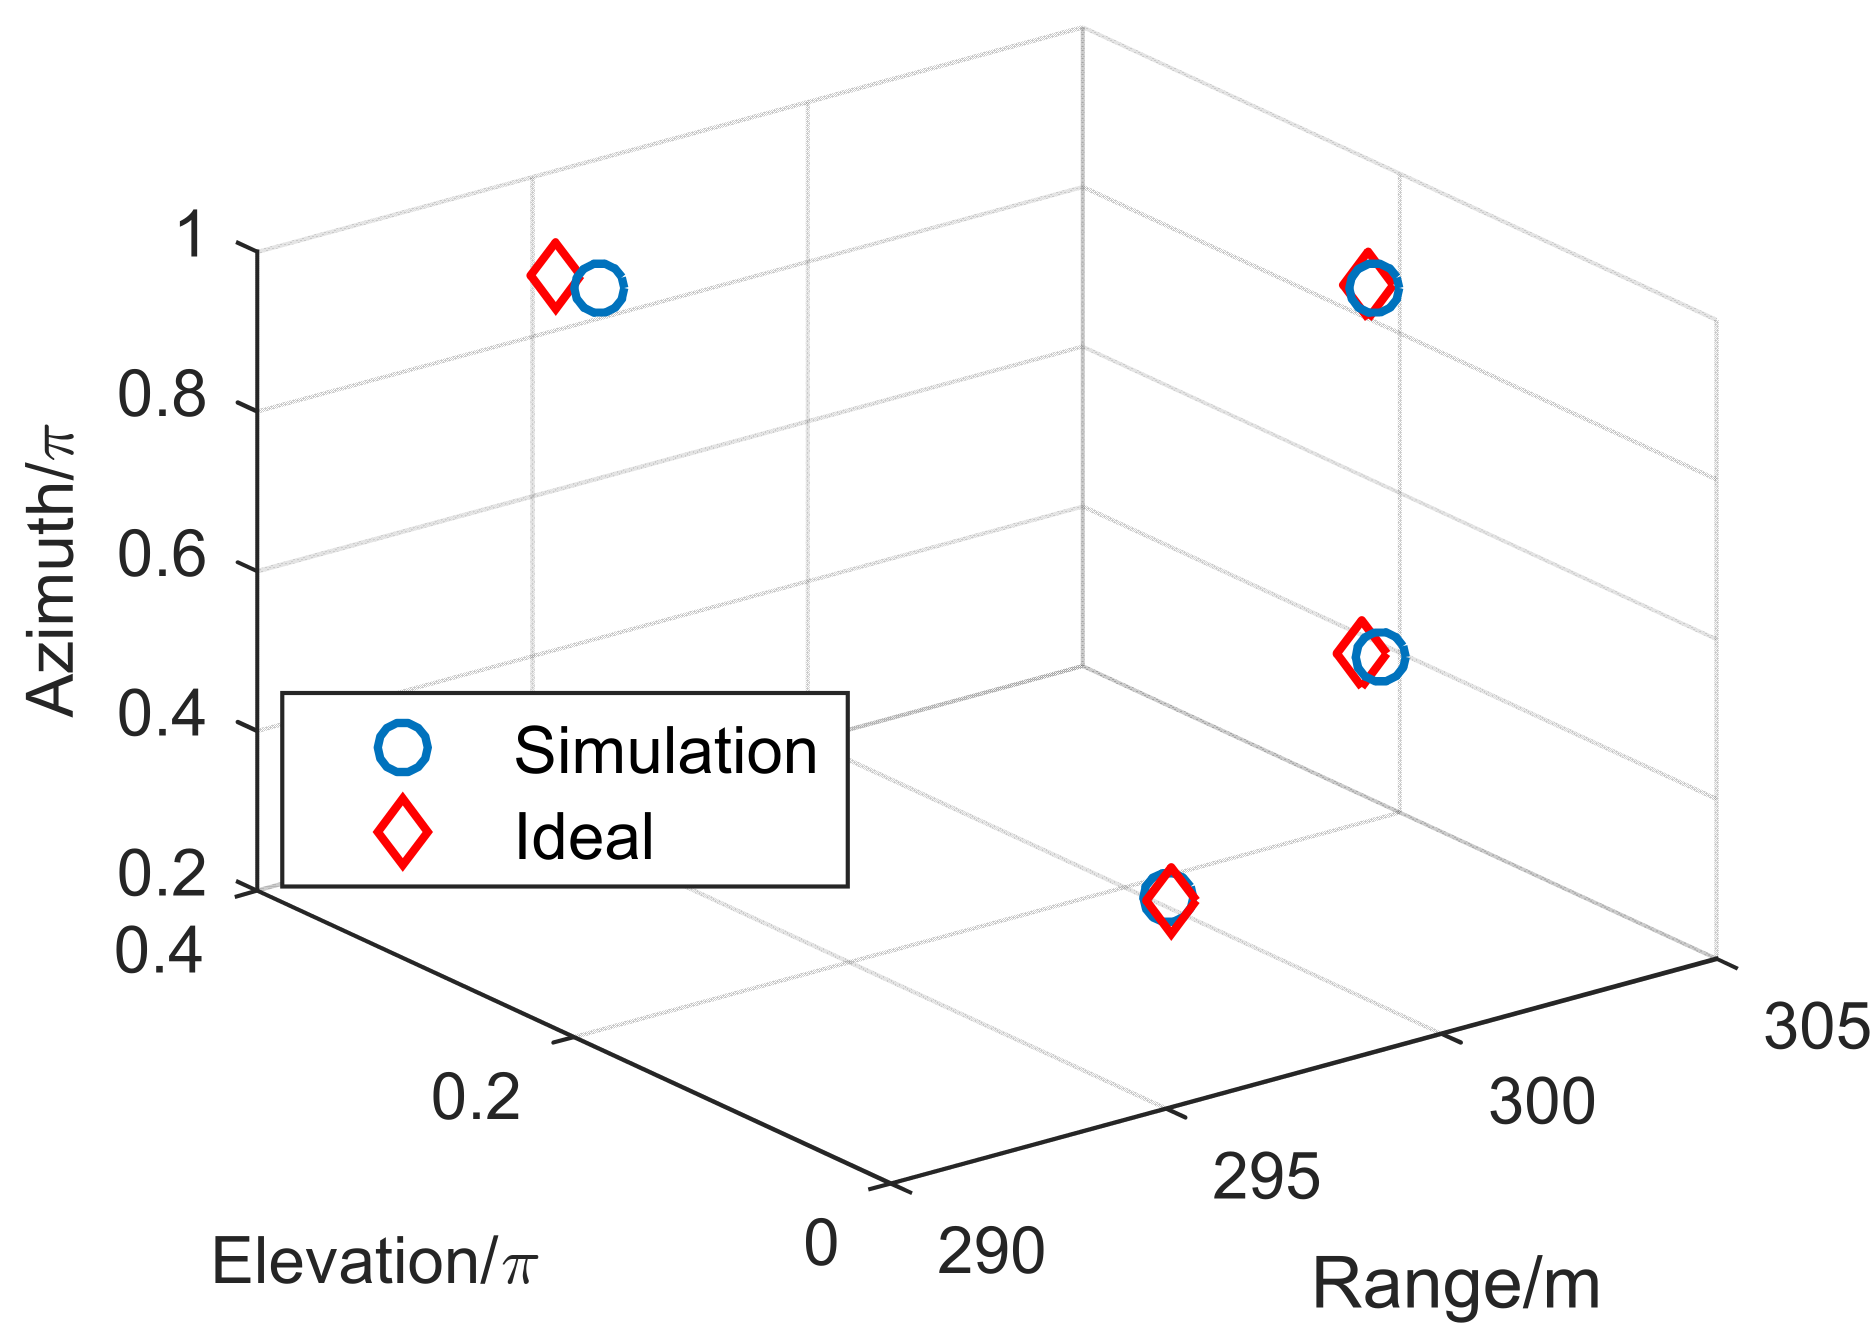
4.3. 3-D Imaging in Bistatic Geometry
The azimuth can be obtained through FFT in terms of the OAM mode, and the real range and elevation can be solved by utilizing (14)–(17). The 3-D imaging result is shown in Figure 11, where the red points are the actual positions, and the blue points are the reconstructed positions. It can be seen that the proposed algorithm can accurately reconstruct the 3-D imaging results of targets.
Figure 11.
The 3-D imaging result.
In the next section, the computational complexity of the proposed algorithm is considered. Ref. [] utilize the MUSIC algorithm through the spatial two-dimensional spectral estimation to distinguish azimuth and elevation of the target. The two-dimensional angular resolution of the algorithm depends on the range of the OAM mode when the signal-noise-ratio (SNR) and the number of snapshots are fixed. Thus, the calculation amount of MUSIC is also decided by the range of the OAM mode. In contrast, the computational complexity of the proposed method is not decided by the number of the mode but by the bandwidth of the transmitted signal. The computational complexity of the proposed method is obviously less than [] with the same azimuth resolution. When the range and azimuth resolution are, respectively, set as 0.0375 m and , the calculation amount of proposed method and MUSIC method with different elevation resolution is shown in Table 2.
Table 2.
The array element number and calculation amount with different elevation resolution.
From Table 2, it can be seen that the proposed method has superiority in the element number and calculation amount especially when the elevation resolution is relatively high. When , the requirement of element of UCA decline to a quarter and the calculation amount of proposed method is just about 1/8 of the MUSIC method.
5. Conclusions
In this paper, a novel method is presented for obtaining the 3-D imaging results with bistatic vortex electromagnetic wave radar. The echo in bistatic vortex electromagnetic wave radar is analyzed and the possibility of elevation resolution is shown. The 3-D imaging method is proposed in order to obtain the spatial information of the target in a spherical coordinate. The simulation results verify the effectiveness and the superiority of the proposed method in array number and computational complexity.
Author Contributions
J.L. and H.Y. proposed the method and designed the experiments; Y.L. and Q.Z. coordinated reading, analyzing and categorizing the articles reviewed in this study; J.L. and Y.C. performed the experiments and wrote the manuscript; J.L. and Y.C. analyzed the data; H.Y. and Y.L. revised the paper. All authors have read and agreed to the published version of the manuscript.
Funding
This research was funded by the National Natural Science Foundation of China under Grant 61971434 and 61871396.
Data Availability Statement
Not applicable.
Acknowledgments
The authors would like to thank the handling editor and the anonymous reviewers for their valuable comments and suggestions for this paper.
Conflicts of Interest
The authors declare no conflict of interest.
References
- Liu, X.-Y.; Zhu, Y.; Xie, W.; Peng, G.-H.; Wang, W. Generation of plane spiral orbital angular momentum waves by microstrip Yagi antenna array. IEEE Access 2020, 8, 175688–175696. [Google Scholar] [CrossRef]
- Liu, K.; Cheng, Y.; Yang, Z.; Wang, H.; Qin, Y.; Li, X. Orbital-Angular-Momentum-Based Electromagnetic Vortex Imaging. IEEE Antennas Wirel. Propag. Lett. 2014, 14, 711–714. [Google Scholar] [CrossRef]
- Liu, K.; Cheng, Y.; Gao, Y.; Li, X.; Qin, Y.; Wang, H. Super-resolution radar imaging based on experimental OAM beams. Appl. Phys. Lett. 2017, 110, 164102. [Google Scholar] [CrossRef]
- Liu, K.; Li, X.; Gao, Y.; Cheng, Y.; Wang, H.; Qin, Y. High-Resolution Electromagnetic Vortex Imaging Based on Sparse Bayesian Learning. IEEE Sens. J. 2017, 17, 6918–6927. [Google Scholar] [CrossRef]
- Yuan, T.; Wang, H.; Qin, Y.; Cheng, Y. Electromagnetic Vortex Imaging Using Uniform Concentric Circular Arrays. IEEE Antennas Wirel. Propag. Lett. 2015, 15, 1024–1027. [Google Scholar] [CrossRef]
- Yuan, T.; Cheng, Y.; Wang, H.; Qin, Y. Beam Steering for Electromagnetic Vortex Imaging Using Uniform Circular Arrays. IEEE Antennas Wirel. Propag. Lett. 2016, 16, 704–707. [Google Scholar] [CrossRef]
- Yuan, H.; Chen, Y.-J.; Luo, Y.; Liang, J.; Wang, Z.-H. A Resolution-Improved Imaging Algorithm Based on Uniform Circular Array. IEEE Antennas Wirel. Propag. Lett. 2021, 21, 461–465. [Google Scholar] [CrossRef]
- Chen, R.; Long, W.-X.; Gao, Y.; Li, J. Orbital Angular Momentum-Based Two-Dimensional Super-Resolution Targets Imaging. In Proceedings of the 2018 IEEE Global Conference on Signal and Information Processing (GlobalSIP), Anaheim, CA, USA, 26–29 November 2018; pp. 1243–1246. [Google Scholar] [CrossRef]
- Zeng, Y.; Wang, Y.; Chen, Z.; Zhang, J.; Zhang, J. Two-dimensional OAM radar imaging using uniform circular antenna arrays. In Proceedings of the 2020 14th European Conference on Antennas and Propagation (EuCAP), Copenhagen, Denmark, 15–20 March 2020; pp. 1–4. [Google Scholar] [CrossRef]
- Liu, Z.; Li, K.; Li, R.; Jiang, G.; Song, Z. Missile-borne Near-field Radar Coincidence Imaging Using a Uniform Circular Array. In Proceedings of the 2020 IEEE 3rd International Conference on Electronic Information and Communication Technology (ICEICT), Shenzhen, China, 13–15 November 2020; pp. 574–578. [Google Scholar] [CrossRef]
- Li, R.; Luo, Y.; Zhang, Q.; Li, B. Time-Varying Bistatic Radar Coincidence Imaging for Rotating Targets. In Proceedings of the 2019 IEEE 2nd International Conference on Electronic Information and Communication Technology (ICEICT), Harbin, China, 20–22 January 2019; pp. 495–498. [Google Scholar] [CrossRef]
- Guo, S.; He, Z.; Fan, Z.; Chen, R. CUCA Based Equivalent Fractional Order OAM Mode for Electromagnetic Vortex Imaging. IEEE Access 2020, 8, 91070–91075. [Google Scholar] [CrossRef]
- Liu, H.; Wang, Y.; Wang, J.; Liu, K.; Wang, H. Electromagnetic Vortex Enhanced Imaging Using Fractional OAM Beams. IEEE Antennas Wirel. Propag. Lett. 2021, 20, 948–952. [Google Scholar] [CrossRef]
- Zhu, Y.; Zhou, Y.; Chen, Y.; Bu, L.; Zhao, H. A Mode Optimization Method for Vortex Electromagnetic Wave Radar Imaging. IEEE Geosci. Remote Sens. Lett. 2022, 19, 4024405. [Google Scholar] [CrossRef]
- Li, R.; Hu, H.; Lei, S.; Lin, Z.; Chen, B. Elevation imaging based on vortex electromagnetic wave. In Proceedings of the 2019 IEEE International Symposium on Antennas and Propagation and USNC-URSI Radio Science Meeting, Atlanta, GA, USA, 7–12 July 2019; pp. 827–828. [Google Scholar]
- Lin, M.; Gao, Y.; Liu, P.; Liu, J. Super-resolution orbital angular momentum based radar targets detection. Electron. Lett. 2016, 52, 1168–1170. [Google Scholar] [CrossRef]
- Zeng, Y.; Wang, Y.; Zhou, C.; Cui, J.; Yi, J.; Zhang, J. Super-resolution Electromagnetic Vortex SAR Imaging Based on Compressed Sensing. In Proceedings of the 2020 IEEE/CIC International Conference on Communications in China (ICCC), Chongqing, China, 9–11 August 2020; pp. 629–633. [Google Scholar] [CrossRef]
- Bu, X.; Zhang, Z.; Chen, L.; Liang, X.; Tang, H.; Wang, X. Implementation of Vortex Electromagnetic Waves High-Resolution Synthetic Aperture Radar Imaging. IEEE Antennas Wirel. Propag. Lett. 2018, 17, 764–767. [Google Scholar] [CrossRef]
- Fang, Y.; Wang, P.; Chen, J. A Novel Imaging Formation Method for Electromagnetic Vortex SAR Based on Orbital-Angular-Momentum. In Proceedings of the 2018 China International SAR Symposium (CISS), Shanghai, China, 10–12 October 2018; pp. 1–3. [Google Scholar] [CrossRef]
- Liu, H.; Liu, K.; Cheng, Y.; Wang, H. Microwave Vortex Imaging Based on Dual Coupled OAM Beams. IEEE Sens. J. 2019, 20, 806–815. [Google Scholar] [CrossRef]
- Jiang, Y.; Liu, K.; Wang, H.; Deng, B.; Zhuang, Z. Orbital-Angular-Momentum-Based ISAR Imaging at Terahertz Frequencies. IEEE Sens. J. 2018, 18, 9230–9235. [Google Scholar] [CrossRef]
- Xu, X.; Liu, Y. Three-dimensional Interferometric MIMO Radar Imaging for Target Scattering Diagnosis. J. Radars 2018, 7, 655–663. [Google Scholar] [CrossRef]
- Wang, J.; Liu, K.; Liu, H.; Cao, K.; Cheng, Y.; Wang, H. 3-D Object Imaging Method with Electromagnetic Vortex. IEEE Trans. Geosci. Remote Sens. 2021, 60, 2000512. [Google Scholar] [CrossRef]
- Wang, J.; Liu, K.; Cheng, Y.; Wang, H. Three-Dimensional Target Imaging Based on Vortex Stripmap SAR. IEEE Sens. J. 2018, 19, 1338–1345. [Google Scholar] [CrossRef]
- Wang, L.; Tao, L.; Li, Z.; Wu, J.; Yang, J. Three Dimensional Electromagnetic Vortex Radar Imaging Based on the Modified RD Algorithm. In Proceedings of the 2020 IEEE Radar Conference (RadarConf20), Florence, Italy, 21–25 September 2020; pp. 1–5. [Google Scholar] [CrossRef]
- Bu, X.-X.; Zhang, Z.; Chen, L.-Y.; Zhu, K.-H.; Zhou, S.; Luo, J.-P.; Cheng, R.; Liang, X.-D. Synthetic Aperture Radar Interferometry Based on Vortex Electromagnetic Waves. IEEE Access 2019, 7, 82693–82700. [Google Scholar] [CrossRef]
- Liang, J.; Li, Y.; Zhang, P.F.; Jiang, X.W.; Cai, B. Three-Dimensional Imaging Method of Vortex Electromagnetic Wave Using MIMO Array. In Proceedings of the International Conference in Communications, Signal Processing, and Systems, Urumqi, China, 20–22 July 2019; Springer: Singapore, 2019; pp. 2350–2356. [Google Scholar]
- Yan, F.; Jin, M.; Qiao, X. Low-Complexity DOA Estimation Based on Compressed MUSIC and Its Performance Analysis. IEEE Trans. Signal Process. 2013, 61, 1915–1930. [Google Scholar] [CrossRef]
Publisher’s Note: MDPI stays neutral with regard to jurisdictional claims in published maps and institutional affiliations. |
© 2022 by the authors. Licensee MDPI, Basel, Switzerland. This article is an open access article distributed under the terms and conditions of the Creative Commons Attribution (CC BY) license (https://creativecommons.org/licenses/by/4.0/).