Article

The Outburst of a Lake and Its Impacts on Redistribution of Surface Water Bodies in High-Altitude Permafrost Region

1
State Key Laboratory of Frozen Soil Engineering, Northwest Institute of Eco-Environment and Resources, Chinese Academy of Sciences, Lanzhou 730000, China
2
University of Chinese Academy of Sciences, Beijing 100049, China
3
School of Civil and Hydraulic Engineering, Ningxia University, Yinchuan 750021, China
4
Engineering Research Center for Efficient Utilization of Modern Agricultural Water Resources in Arid Regions, Ministry of Education, Ningxia University, Yinchuan 750021, China
5
School of Science, Key Laboratory of Disaster Prevention and Mitigation in Civil Engineering of Gansu Province, Lanzhou University of Technology, Lanzhou 730000, China
*
Author to whom correspondence should be addressed.
Remote Sens. 2022, 14(12), 2918; https://doi.org/10.3390/rs14122918
Submission received: 12 May 2022 / Revised: 11 June 2022 / Accepted: 15 June 2022 / Published: 18 June 2022
(This article belongs to the Topic Natural Hazards and Disaster Risks Reduction)

Abstract

:
The lakes distributed in permafrost areas on the Tibetan Plateau (TP) have been experiencing significant changes during the past few decades as a result of the climate warming and regional wetting. In September 2011, an outburst occurred on an endorheic lake (Zonag Lake) in the interior of the TP, which caused the spatial expansion of three downstream lakes (Kusai Lake, Haidingnor Lake and Salt Lake) and modified the four independent lake catchments to one basin. In this study, we investigate the changes in surficial areas and water volumes of the outburst lake and related downstream water bodies 10 years after the outburst. Based on the meteorological and satellite data, the reasons for the expansion of downstream lakes were analyzed. Additionally, the importance of the permafrost layer in determining hydrological process on the TP and the influence of from lake expansion on engineering infrastructures were discussed. The results in this study showed the downstream lakes increased both in area and volume after the outburst of the headwater. Meanwhile, we hope to provide a reference about surface water changes and permafrost degradation for the management of lake overflow and flood on the TP in the background of climate warming and wetting.

Graphical Abstract

1. Introduction

The IPCC AR6 showed that the climate warming in the past 50 years is unprecedented compared to the past 2000 years [1,2,3]. Along with the climate warming, the globally averaged precipitation over land increased since 1950 and has accelerated at an increasing rate since the 1980s [4,5,6]. The increasing global warming also related to the occurrence of extreme events, including extreme heat events and heavy precipitation [7,8,9,10]. In Arctic and high-altitude regions, the effects of global climate warming on the regional climate system are generally amplified [11,12,13,14].
The Tibetan Plateau (TP) with an average elevation exceeding 4000 m above sea level (a.s.l) is known as the “Third Pole” on the earth. It is also called as “Asia’s Water Tower”. Many large rivers in Asia originate here, including the Yellow River, Yangtze River, Indus River, Ganges River, Irrawaddy River, Brahmapura River, Mekong River and Salween River. Additionally, a great number of glaciers and lakes are distributed here [15]. The lakes located on the TP account for 39.2% in number and 51.4% in area among all lakes in China [16]. The TP has the largest distribution of high-altitude permafrost on Earth, covering 1.4 × 10⁶ km2 [17]. During the past 50 years, climate warming and wetting is speeding up on the TP [4]. From 1961 to 2020, the increasing rate in mean annual air temperature (MAAT) on the TP reached 0.35 °C/10a, which is about two times the global average rate at the same time, and the annual precipitation had an increase rate about 7.9 mm/10a [18,19]. From 2016 to 2020, the mean annual precipitation reached 540 mm on the TP, which is about 13% more compared to the period of 1961–1990 [19]. Because of the warming and the wetting in regional climate, the cryosphere components, including glaciers, permafrost and snow cover have been degrading extensively and continuously over the past 50 years [19].
As a connection linking the atmosphere, biosphere and cryosphere in hydrological cycle, lakes on the TP were rarely disturbed directly by anthropogenic activities, and therefore are sensitive indicators of regional climate changes [20]. Driven by the continuous climate and cryosphere changes, these lakes have experienced rapid changes in areas, water levels and volumes during the past century [21,22,23]. The lakes on the TP showed a slightly decrease in the total area between the 1970s and 1990, but increased rapidly from 2000 to 2010 [24]. The variations in alpine lakes from 1986 to 2019 in the headwater area of the Yellow River, northeastern TP, was studied, and the results indicated that lake variations in this region are related to the increased net precipitation and the declined aridity [25]. A rapid expansion of lakes in the endorheic basin on the TP since 2000 was investigated, and the potential driving factors, including climate change, glacier melting and permafrost degradation, were discussed [26]. Additionally, the impacts from lake changes on hydrological cycles, periglacial environments, eco environments and future climate change have been investigated [27,28,29]. However, few studies have focused on the impacts of occasional extreme events on periglacial components in permafrost regions. In the continuous permafrost area on the TP, lakes are distributed above and surrounded by the permafrost layer, which acts as an isolation layer between the lakes and the surrounding areas [25,30,31]. Therefore, the overflooding or the outburst of permafrost area TP lakes upstream will cause changes in water bodies in the downstream area and create further threats to communities and engineering infrastructure in the drainage basin.
In September 2011, an outburst of Zonag Lake occurred in the continuous permafrost region on the TP [32]. This event was paid great attention by scientific communities and governments because it is historically the first record of a lake outburst event outside the glacial regions on the TP [32,33,34,35,36,37]. Because of this outburst, three downstream lakes named Kusai Lake, Haidingnor Lake and Salt Lake experienced a series of changes hereafter, and the hydrological connection among these four lakes was triggered. To avoid the damage from potential overflow of Salt Lake to the engineering infrastructures nearby, a channel was excavated for the drainage. Focusing on this event, Yao et al. [38] analyzed the area variation of Salt Lake downstream and its overflowing condition and probability. Lu et al. [36] presented the ground displacement around Salt Lake and concluded that the outburst of Zonag Lake might accelerate the permafrost degradation around Salt Lake. Xie et al. [37] pointed out that the outburst of Zonag Lake amplified the desertification disaster around the lake and proposed that the possible outburst mode of Salt Lake would be similar to that of the Zonag Lake. However, the surface connection among the four lakes after the outburst has not been investigated. Additionally, few research focus on the potential damage to transportation infrastructure in the downstream area.
Due to the high altitude and the harsh environment conditions, the data and information from in situ investigation around the lakes are very limited. The technology of remote sensing, however, has played an important role in obtaining the reliable information, and has been applied in research on the process of lake changes on the TP [39,40,41]. In this study, the water area of the basin and the number of small lakes and ponds (>1000 m2) were extracted from Joint Research Centre (JRC) global surface water dataset by Google Earth Engine (GEE) from 2000 to 2020. In addition, the hydraulic connection of the four lakes was analyzed using Landsat TM/ETM+/OLI data based on the enhanced water index (EWI). The results illustrated the changes in the area and the amount of surface water bodies in this region after the headwater lake outburst, and are hoped to provide a reference for management of lake overflow and flood on the TP in the context of climate warming and wetting.

2. Materials and Methods

2.1. Study Region

The study region (Figure 1a), is located in the northeastern TP. Administratively, it belongs to Zhidoi County, Qinghai Province. The topography is high in the west and low in the east, with an average elevation of about 4785 m a.s.l. In the region, four lakes, including Zonag Lake, Kusai Lake, Haidingnor Lake and Salt Lake, are distributed from west to east. The division of the catchments are shown in Figure 1b. The soil is not fully developed in this area and is mainly composed of stone and sand. The main forms of vegetation in the study region are alpine meadow, alpine steppe and alpine desert [35].
This area is part of the Hoh Xil National Nature Reserve, which is defined as one of the world heritages by the United Nations Educational, Scientific and Cultural Organization. Human activities in this area are very rare due to the harsh climate and very thin oxygen conditions [42]. It is characterized by a semiarid continental and cold climate, with the MAAT of −10~−4.1 °C, annual precipitation of 173~494.9 mm (mainly in warm season), and annual average wind speed of 4.4 m/s [43,44].
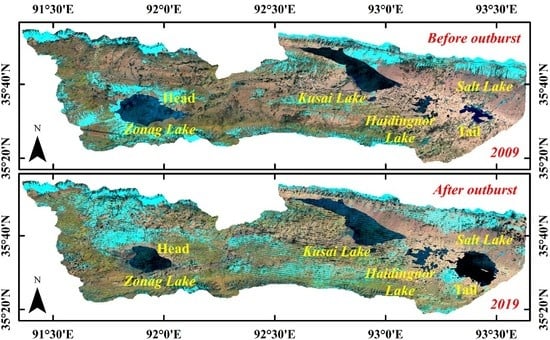
Before 2011, the four lakes had their own catchments. In late August and early September 2011, due to continuous rainfall, the water level of the Zonag Lake rose sharply and an outburst occurred in the eastern part of the lake. After that, the flood flowed into Kusai Lake and caused an overflow in late September 2011. Then, the overflowing water of Kusai lake entered into Haidinuoer Lake and eventually converged to the lowest Salt Lake of the drainage basin. Although historically, these lakes were united, the four lakes remained independent before the outburst. The outburst in 2011 connected these lakes by eroding the historical channels. Therefore, the catchments of Zonag Lake, Kusai Lake as well as Haidingnor Lake became a part of the Salt Lake catchment, referred hereinafter as Zonag-Salt Lake Basin (ZSLB).

2.2. Climate Data

The air temperature and precipitation data since 1965 were collected from Wudaoliang meteorological observation station (35.21°N, 93.08°E, 4612 m a.s.l), which is the nearest national station to the study region. The data were downloaded from China Meteorological Administration (CMA) (http://cdc.cma.gov.cn, accessed on 27 October 2020).

2.3. Remote Sensing Data

In order to analyze the hydraulic connection between the four lakes, a total of 42 scenes Landsat images (http://glovis.usgs.gov, accessed on 10 October 2020) were collected, of which 22 scenes were from Landsat-5 TM, 4 scenes were from Landsat-7 ETM+ and 16 scenes were from Landsat-8 OLI with the world reference system (WRS) path 137/138 and row 35, spanning from 2000 to 2020. Due to the sensor failure, the Landsat-5 datasets have been missing since 2011. Additionally, the scan line corrector of Landsat-7 was broken in May 2003, and the images were affected by striping afterwards [45]. Compared with Landsat-5 TM and Landsat-7 ETM+, the Landsat 8-OLI has still provided high-quality images since 2013. The main parameters of Landsat sensors are listed in Table 1.
To extract the annual distribution of water body in ZSLB, we used the JRC Monthly Water History dataset from GEE platform as the source data. The dataset was generated by using 4,453,989 scenes from Landsat 5, 7 and 8 images between 16 March 1984 and 31 December 2020 [46]. Each pixel was interpreted into either water or non-water using an expert system and the results were collated into a monthly dataset with two epochs, from 1984 to 1999, and from 2000 to 2020. To extract the stream in ZSLB, the SRTM DEM data were downloaded from the geospatial data cloud site (http://www.gscloud.cn, accessed on 6 July 2021).

2.4. Lake Volume Data

The volume data of the four lakes in ZSLB were obtained from the dataset “Lake volume changes on the Tibetan Plateau during 1976–2019 (>1 km2)”, downloaded from National Tibetan Plateau/Third Pole Environment Data Center (https://data.tpdc.ac.cn/, accessed on 7 October 2021) [29]. This dataset provided the water volume of 1132 lakes on the TP between 1976 and 2019 using the Landsat images and SRTM DEMs. Lakes in the dataset are classified into different categories and are well coded. In this study, the volume data of Zonag Lake (Code L49), Kusai Lake (Code L47), Haidngnor Lake (Code L243 and L476) and Salt Lake (Code L227) were used to investigate the volume change before and after the outburst.

2.5. Methods

The Normalized Difference Water Index (NDWI) uses the reflected near-infrared radiation (TM band 4) and visible green light spectrum (TM band 2) to enhance the open water feature while depressing the vegetation feature [47,48]. The Modified Normalized Difference Water Index (MNDWI) uses TM band 5 to replace the NIR band in NDWI, which can enhance the open water features while efficiently suppressing built-up land noise, as well as vegetation and soil noise [49]. The enhanced water index (EWI) can clearly distinguish the semidry watercourse from the noise by using TM band 2, band 4 and band 5 [50]. By taking advantage of the higher reflection in blue light and the higher absorption in TM band 7 of the water body, the new water index (NWI) uses the TM band 1, band 4, band 5 and band 7 to extract the water body [51]. The equations of water indices and the involved spectrum sections are shown in Table 2.
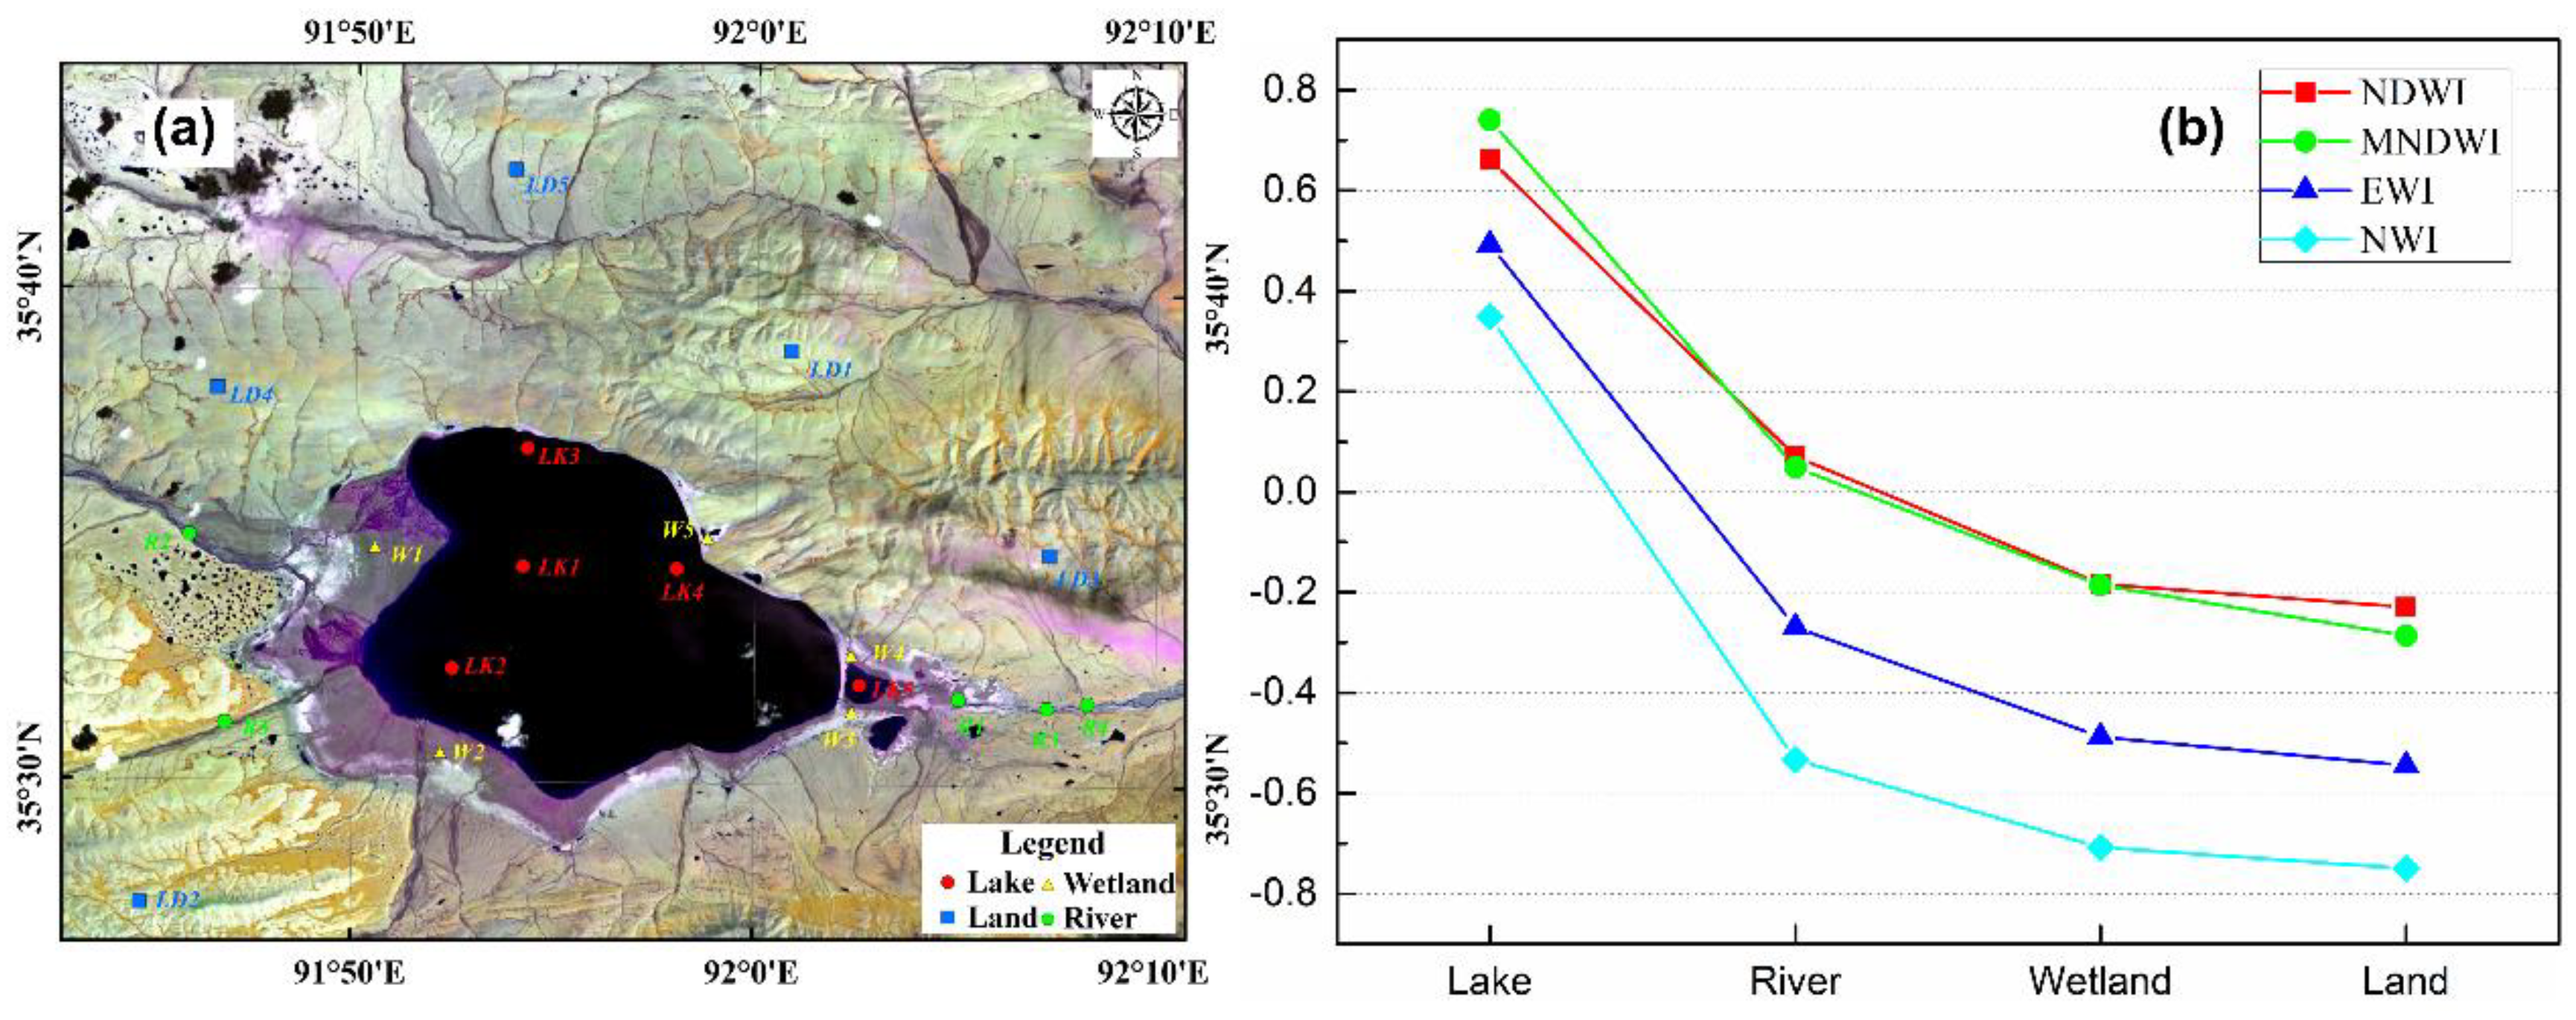
In order to determine the most suitable index for this research purpose, four water indexes were calculated based on the spectrum bands of Landsat images. Four types of landcovers in and around the lake were selected, and five locations of each type of landcover were interpreted (Table 3 and Figure 2). The table and figure show that the index value of NDWI and MNDWI are quite similar and the value of NWI is the smallest in water, river, land and wetland among the four indexes. Considering that the study area is a semiarid region, the EWI has a better performance in suppressing the background noise and was chosen and used to obtain the surficial water routes.
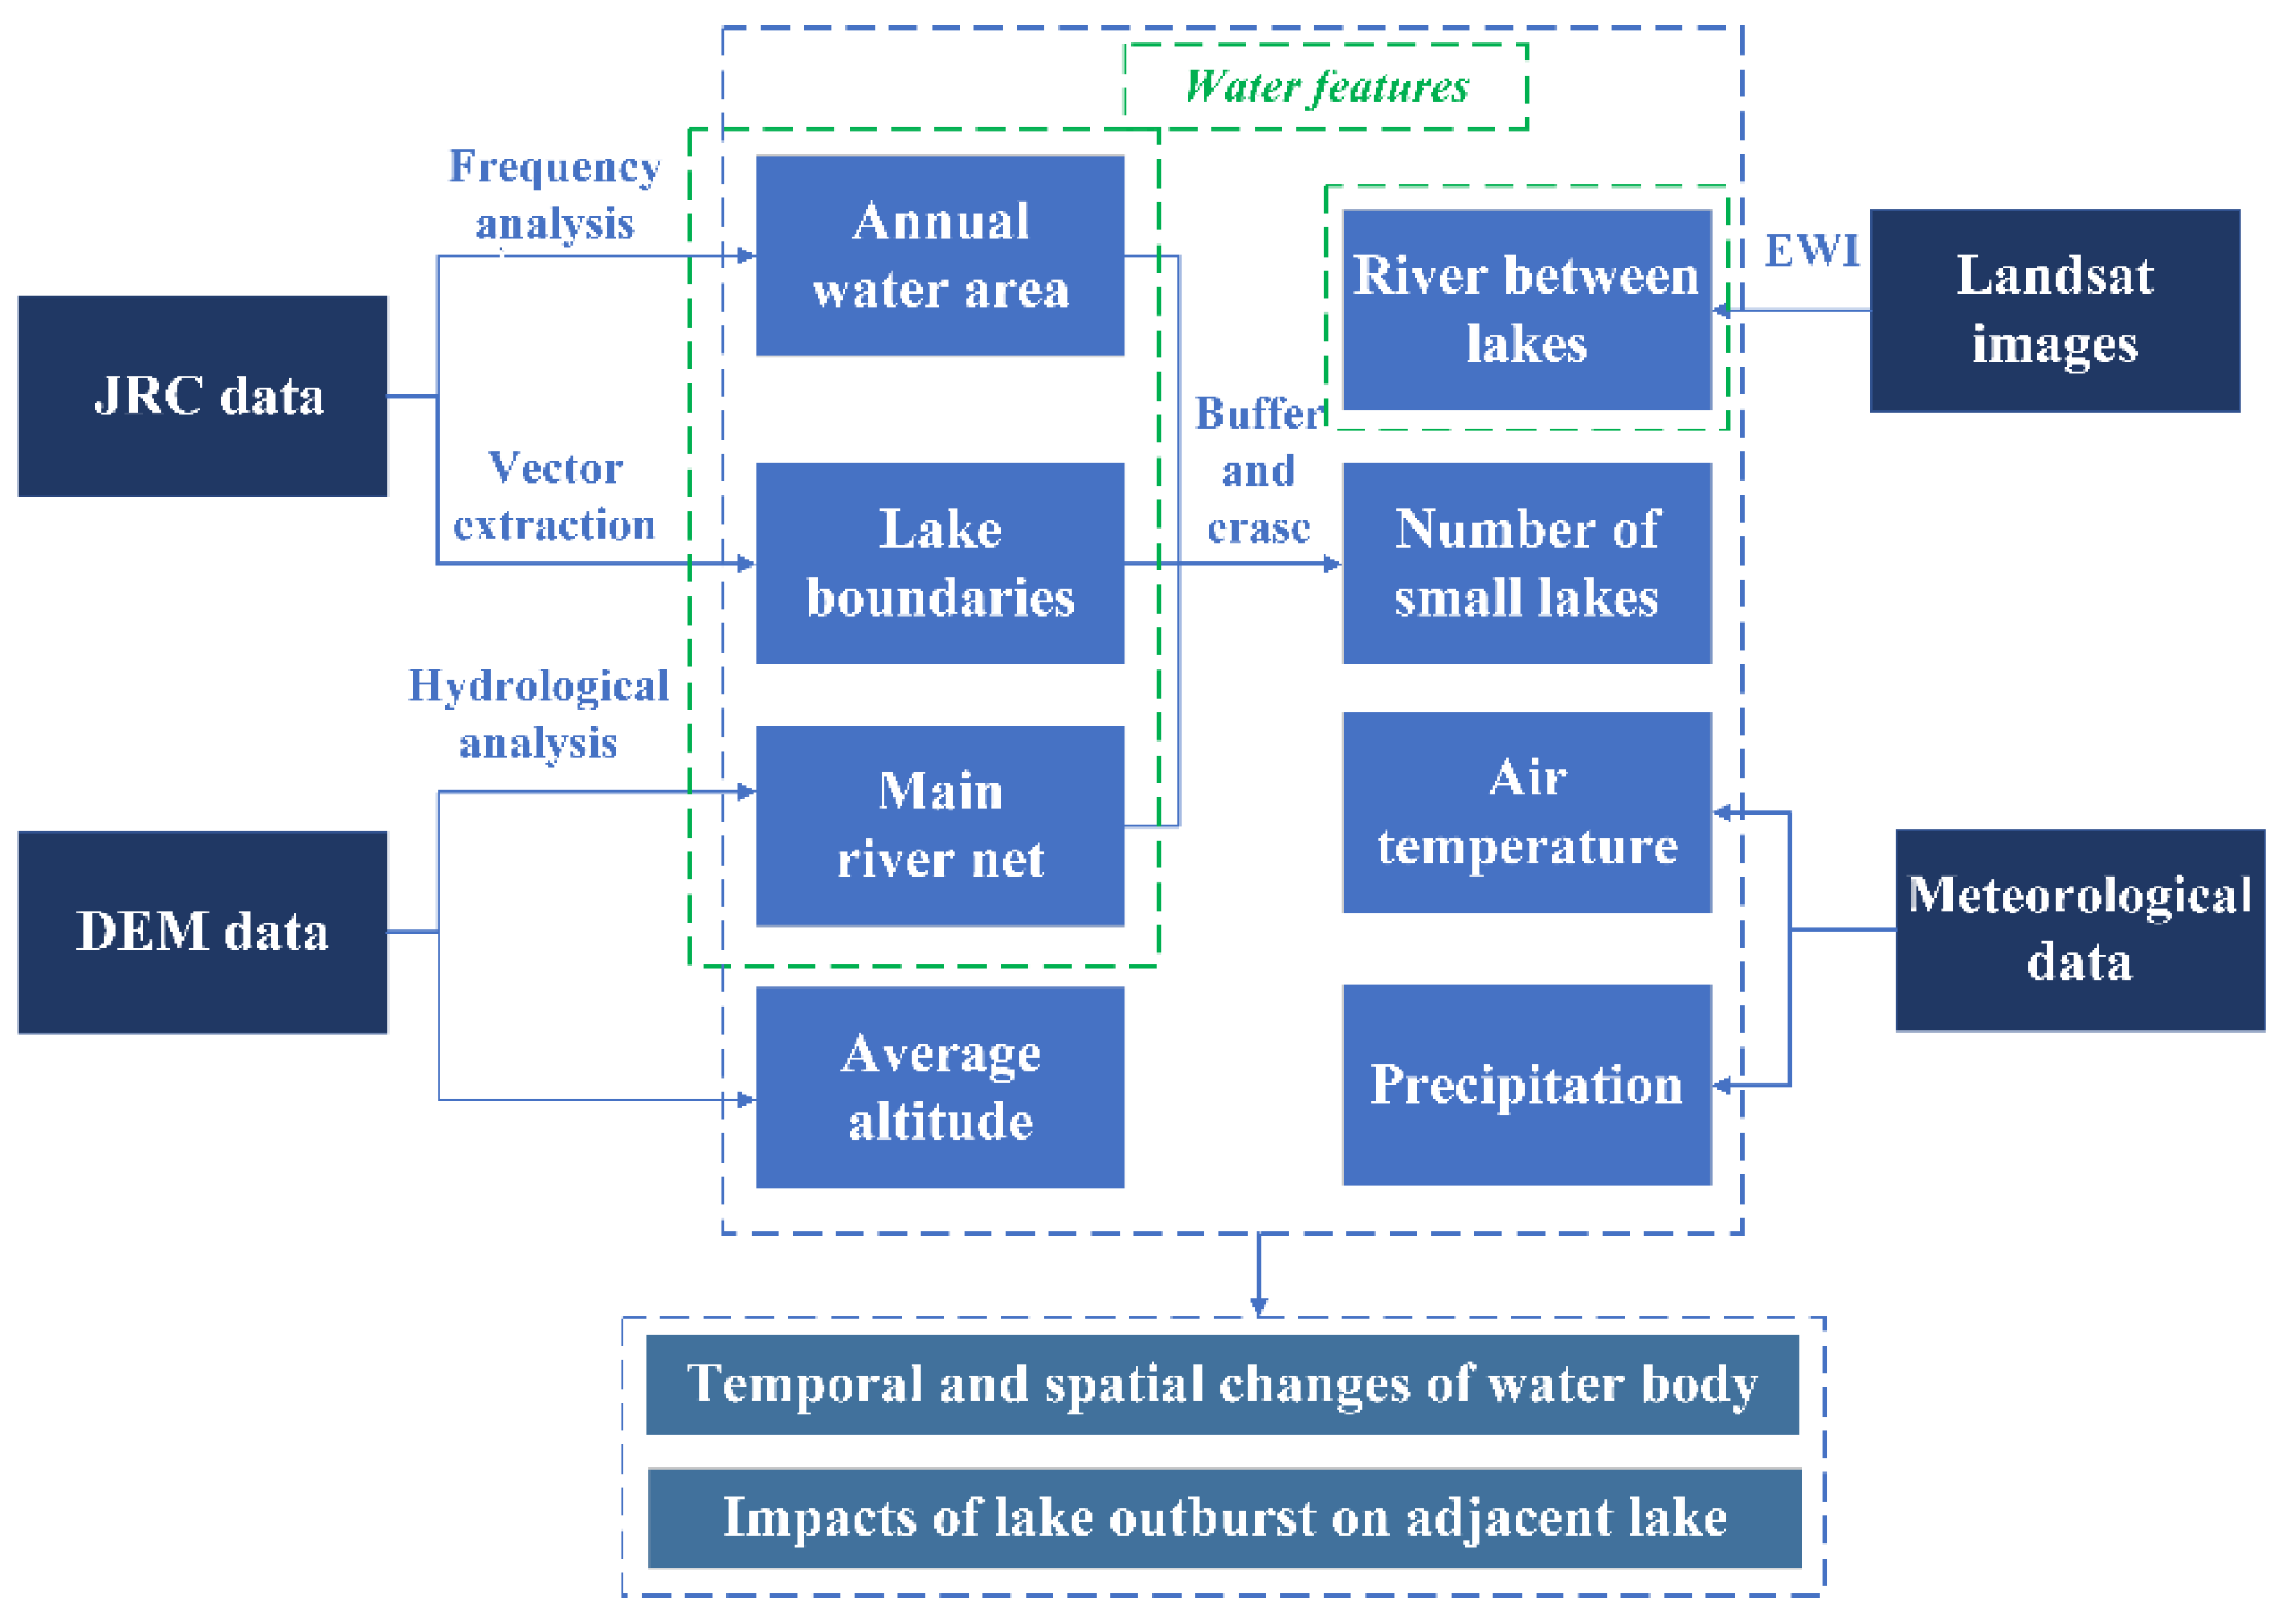
To identify the water area of the study area and analyze the distribution of the water body, the annual water distribution of ZSLB was extracted and calculated from JRC Monthly Water History v1.3 dataset from 2000 to 2020 using GEE. Then, with the river network of ZSLB built by DEM, the vector data of small lakes and ponds in ZSLB between 2000 and 2020 was obtained. Considering that the resolution of the raster image was 30 m, in order to reduce the impact of the noise, only lakes and ponds larger than 1000 m2 were calculated. The analysis procedure for the changes of water body and impacts of lake outburst on adjacent lakes in ZSLB is shown in Figure 3.

3. Results

3.1. Changes in Total Surface Water Area in ZSLB

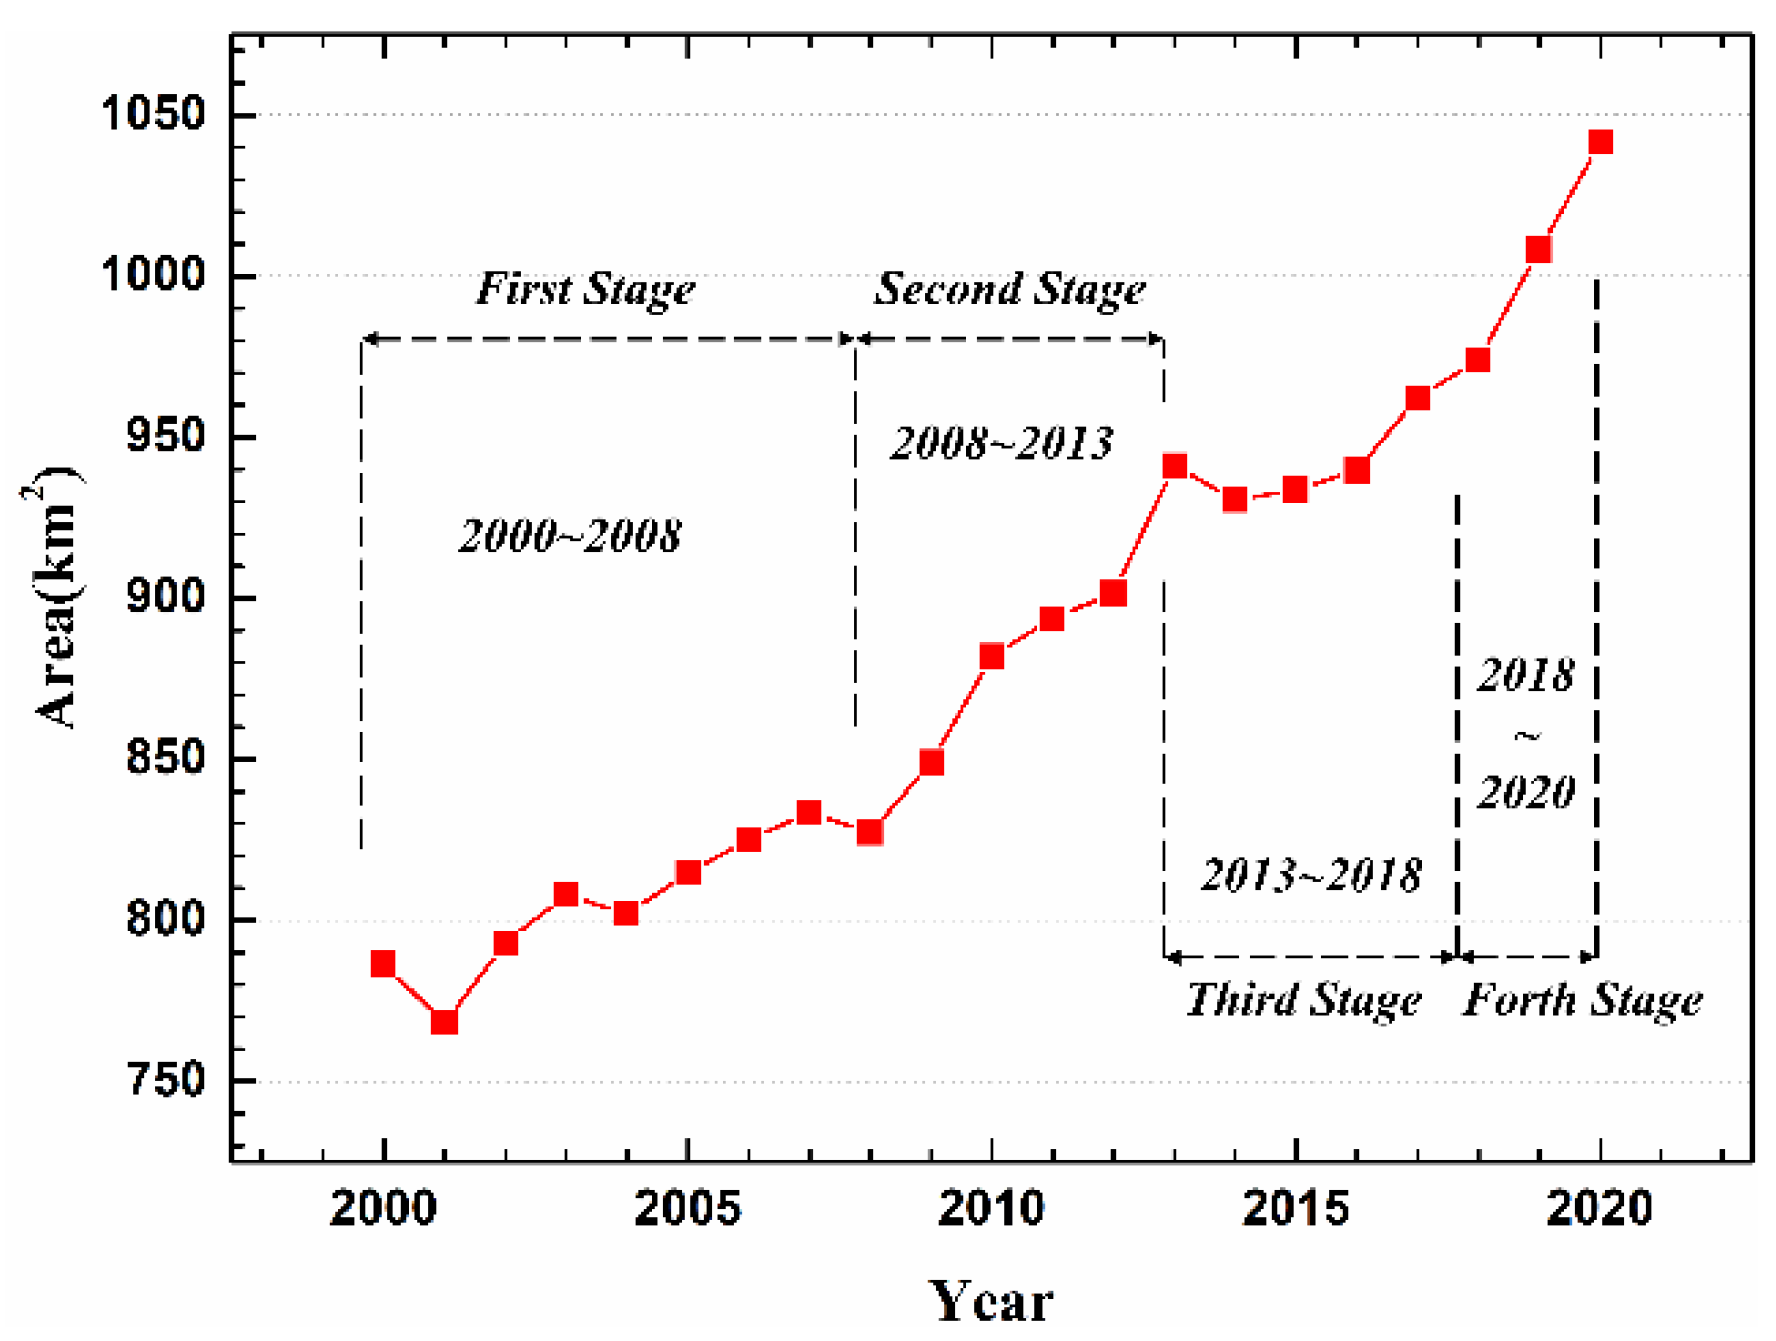
The total surface water area in the ZSLB increased from 786.5 km2 to 1041.6 km2 from 2000 to 2020, with an average increase rate of 12.1 km2/a, and this period can be roughly divided into four stages: 2000–2008, 2008–2013, 2013–2018, and 2018–2020, according to the different increase rate (Figure 4). A slow and steady increase was presented in the first stage, with an average rate of 5.1 km2/a. A quick and sharp increase occurred from 2008 to 2013 with a rate of 22.8 km2/a, and the outburst of Zonag Lake occurred in this stage. Afterwards, the increase in the surface water area slowed down, with a rate of 6.6 km2/a from 2013 to 2018. In the fourth stage, however, the fastest increase in the water area in the ZSLB was shown, with an average rate of 33.8 km2/a

3.2. Changes in the Area of the Four Lakes

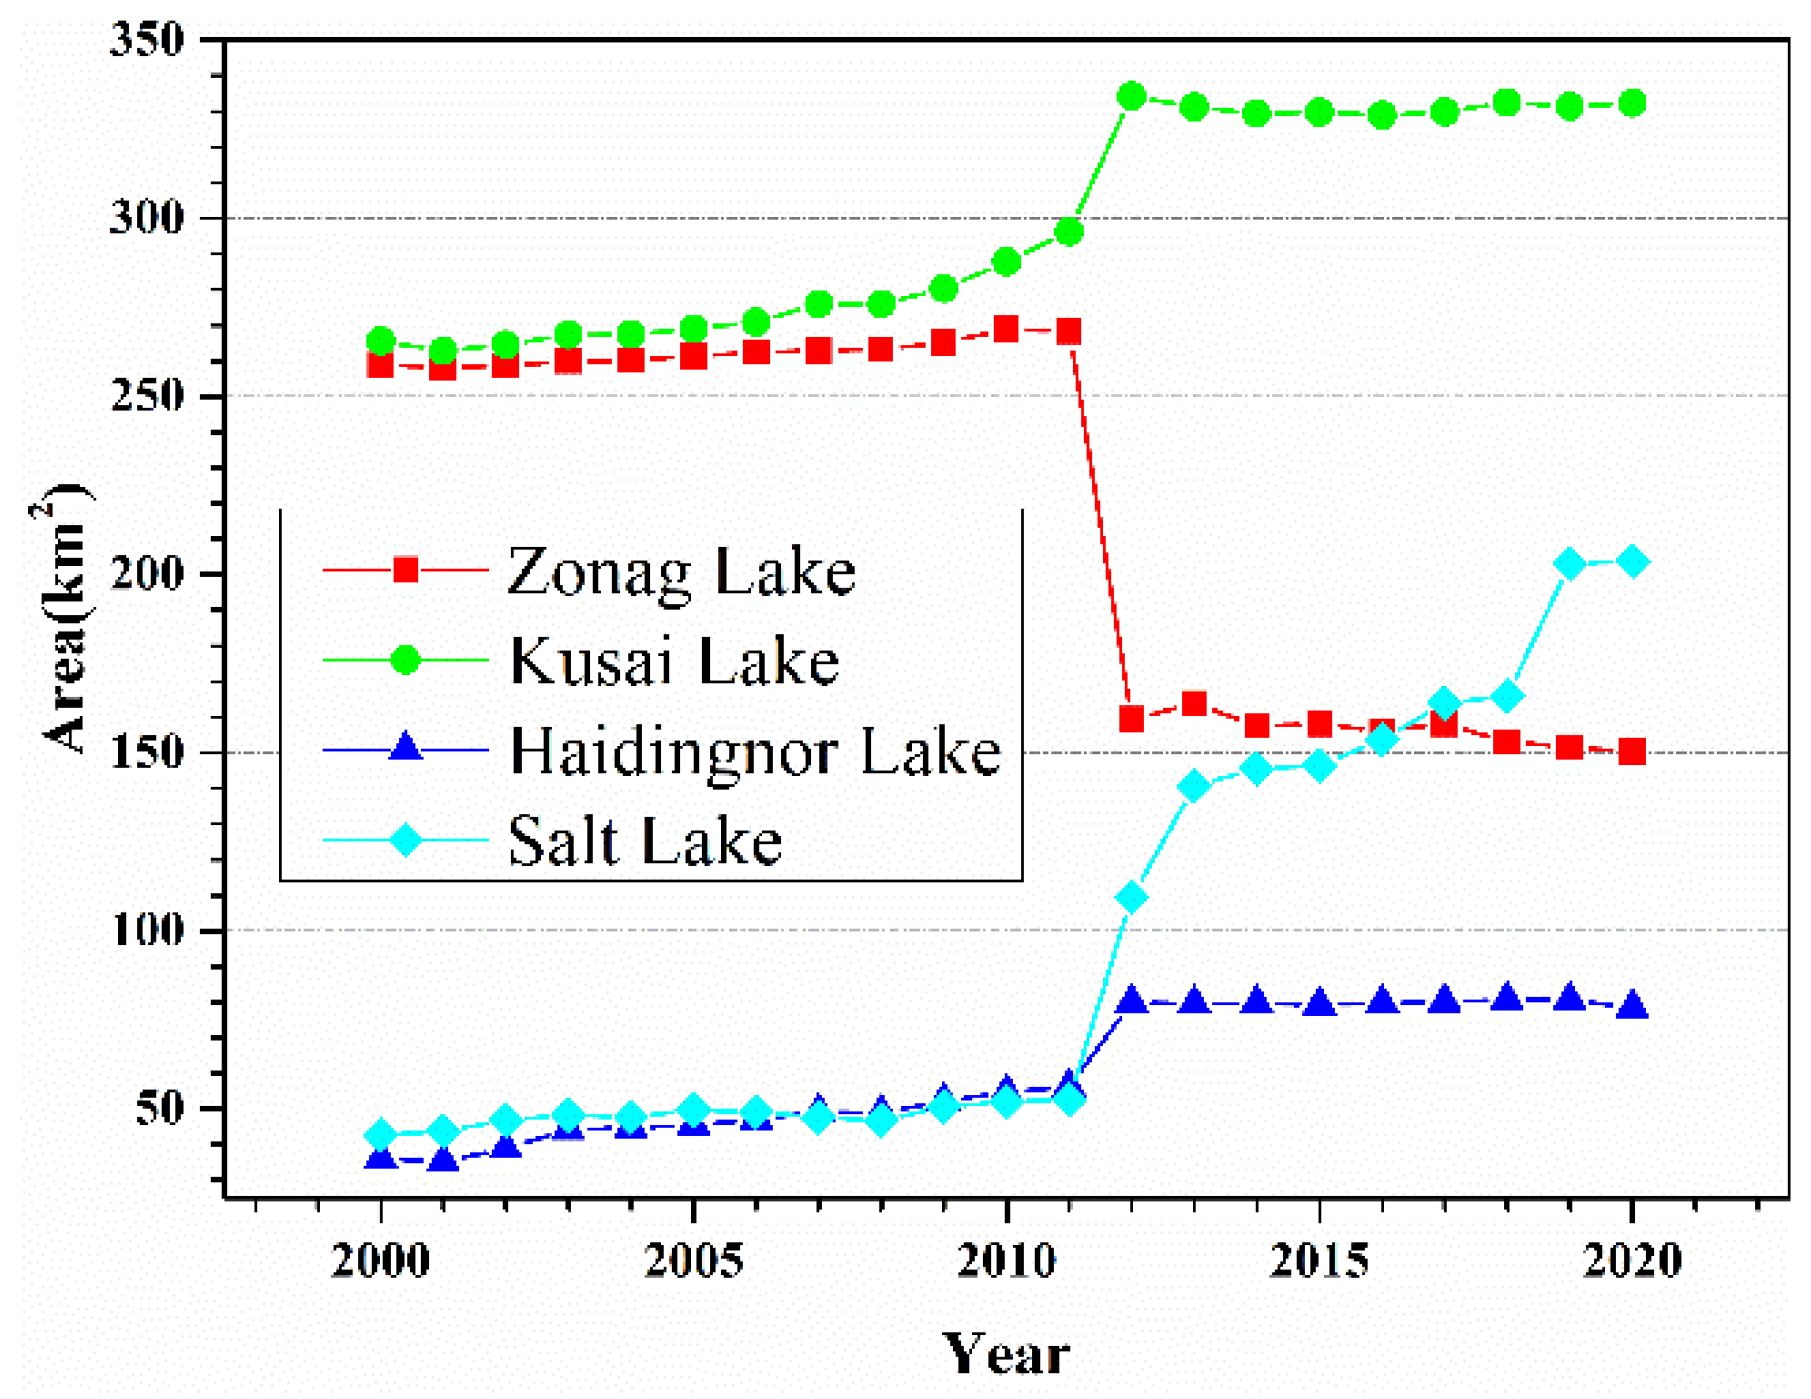
Figure 5 presents the changes in the four lakes in areas between 2000 and 2020. Obviously, the outburst of the Zonag Lake in 2011 was a huge change. Before 2011, the areas of the four lakes increased slowly but steadily. Specifically, the Zonag Lake had an increase in the area of 9.5 km2 (3.7%) from 2000 to 2011, with an annual rate of 0.9 km2 and Kusai Lake increased in the area of 30.7 km2 (11.5%) with a rate of 2.8 km2/a. The Haidingnor Lake increased by 20.2 km2 (55.9%) with a rate of 1.8 km2/a, while Salt Lake increased in its area of 9.91 km2 (23.2%) with a rate of 0.9 km2. After the outburst, the area of Zonag Lake declined from 268.3 km2 to 163.8 km2, ending in 2020, while the other three downstream lakes experienced the areal expanding spatially as the result of the water from the Zonag Lake flowing in. The areas of Kusai Lake and Haidingnor Lake increased by 34.9 km2 and 23.3 km2, respectively. As the tail-end lake of the watershed, Salt Lake received the most overflowing water from the three lakes upstream, and the area spatially increased from 52.6 km2 in 2011 to 140.6 km2 in 2013. After 2013, the area changes of the four lakes returned to normal, although Zonag Lake had an area decrease slightly after that; it decreased to approximately 150 km2 in 2020. The area of Haidingnor Lake increased 1.12 km2 during seven following years. Similar to Haidingnor Lake, Kusai Lake has not experienced an obvious change in area since 2013. Salt Lake, however, experienced a considerable increase in the area between 2013 and 2020, with an increase rate of 9.0 km2/a on average. Before 2018, the increase rate was relatively small, with a magnitude of 5.1 km2/a. Meanwhile, between 2018 and 2019, there was a sharp increase in the area of Salt Lake. Until 2020, the area of Salt Lake reached 204 km2, which is about 4.7 times that in 2000.

3.3. Changes in Shorelines of the Four Lakes in ZSLB

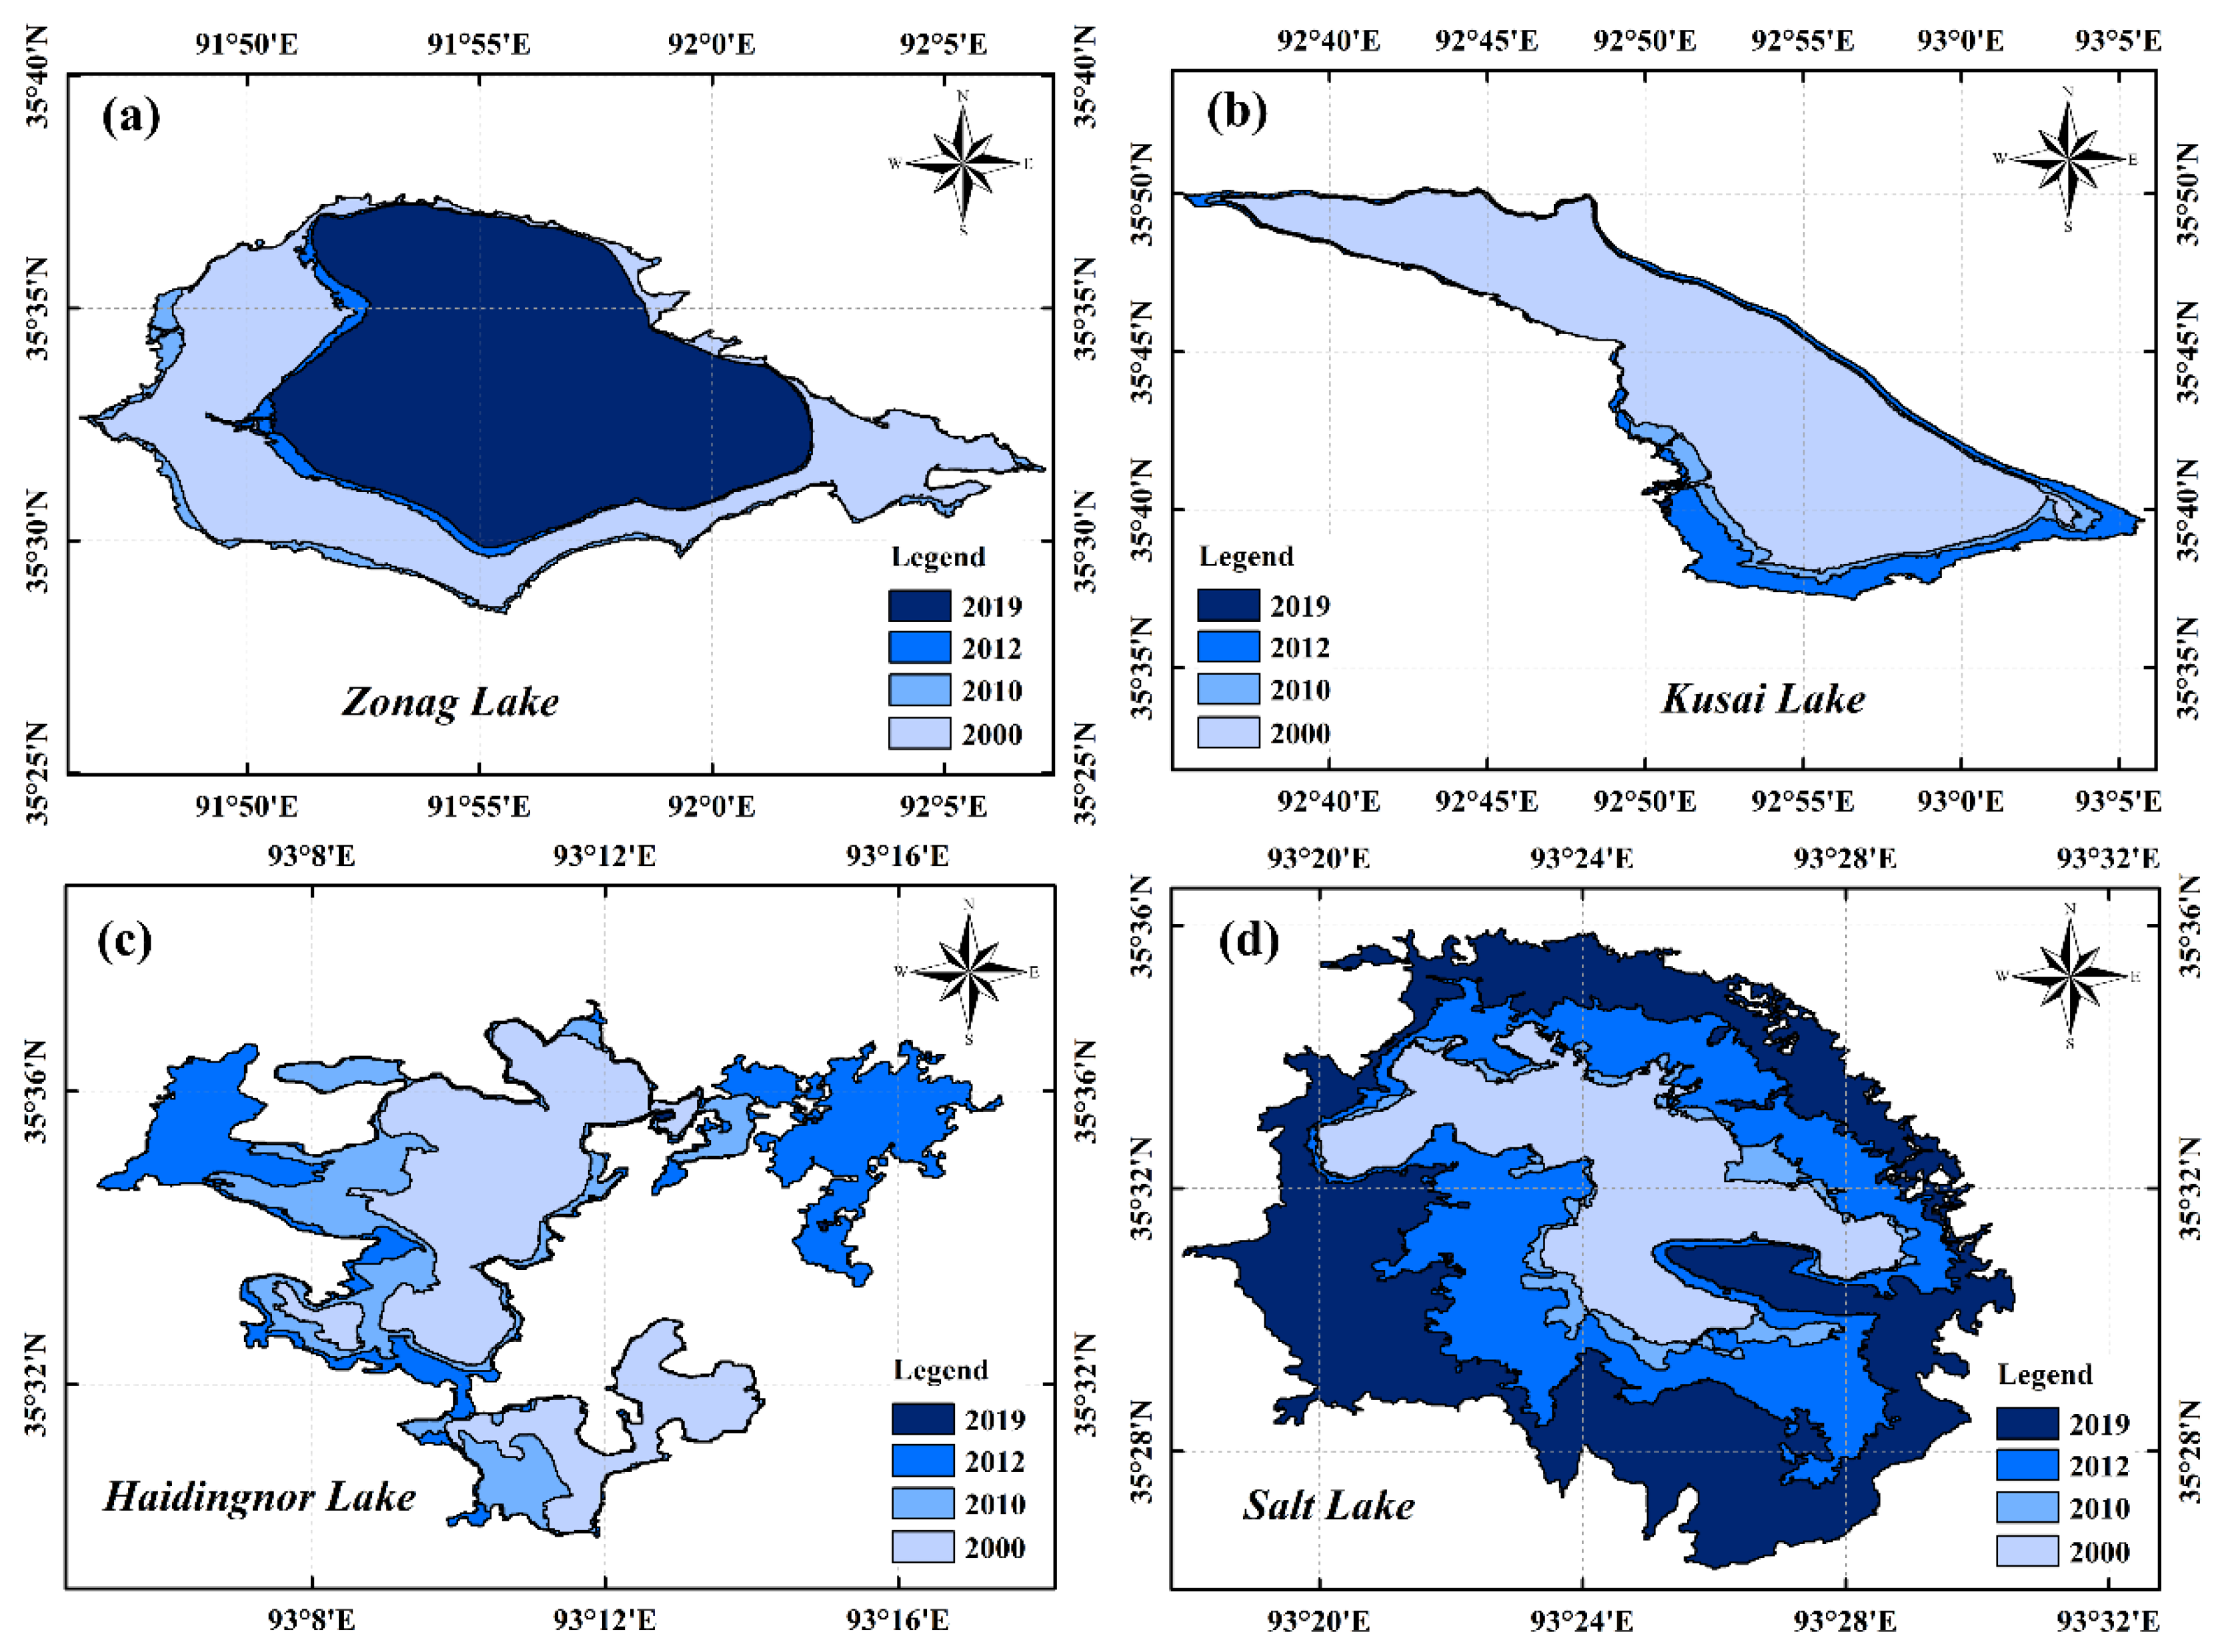
The shorelines and areas of the four lakes have changed with varying degrees in the past 20 years. Figure 6 shows the shape changes in the shorelines of the four lakes in selected years, namely 2000, 2010, 2012 and 2019. The shoreline of Zonag Lake mainly changed in late 2011 and 2012, and along the east–west direction after the outburst occurred. After 2012, however, the shoreline of Zonag lake did not change much. Similarly, the shoreline of Kusai Lake mainly changed in 2012, and expanded along its southeast direction as a result of the outburst. After 2012, the shoreline of Kusai Lake did not change much.
Compared with the former two, the shoreline changes of Haidingnor Lake were complicated during the study period. Within the catchment of Haidingnor Lake, there were two relatively large lakes in the north–south direction and a group of small lakes and ponds or swampy wetlands in the east. After the outburst of Zonag Lake, the two large lakes in the north–south direction connected together and expanded rapidly in both west and east directions, merging with small lakes and ponds originally scattered in the east. Since 2012, the shoreline of Haidingnor lake remained relatively stable.
Changes in the Salt Lake shoreline were obviously different from the former three, and could be divided into three periods. In the first period, from 2000 to 2010, Salt Lake expanded slightly, and its shoreline remained relatively stable. The second period is directly related to the outburst of Zonag Lake. From 2010 to 2012, Salt Lake expanded rapidly almost in all directions expect for its northwest part. After that, Salt Lake showed a rapid expansion trend until 2019.

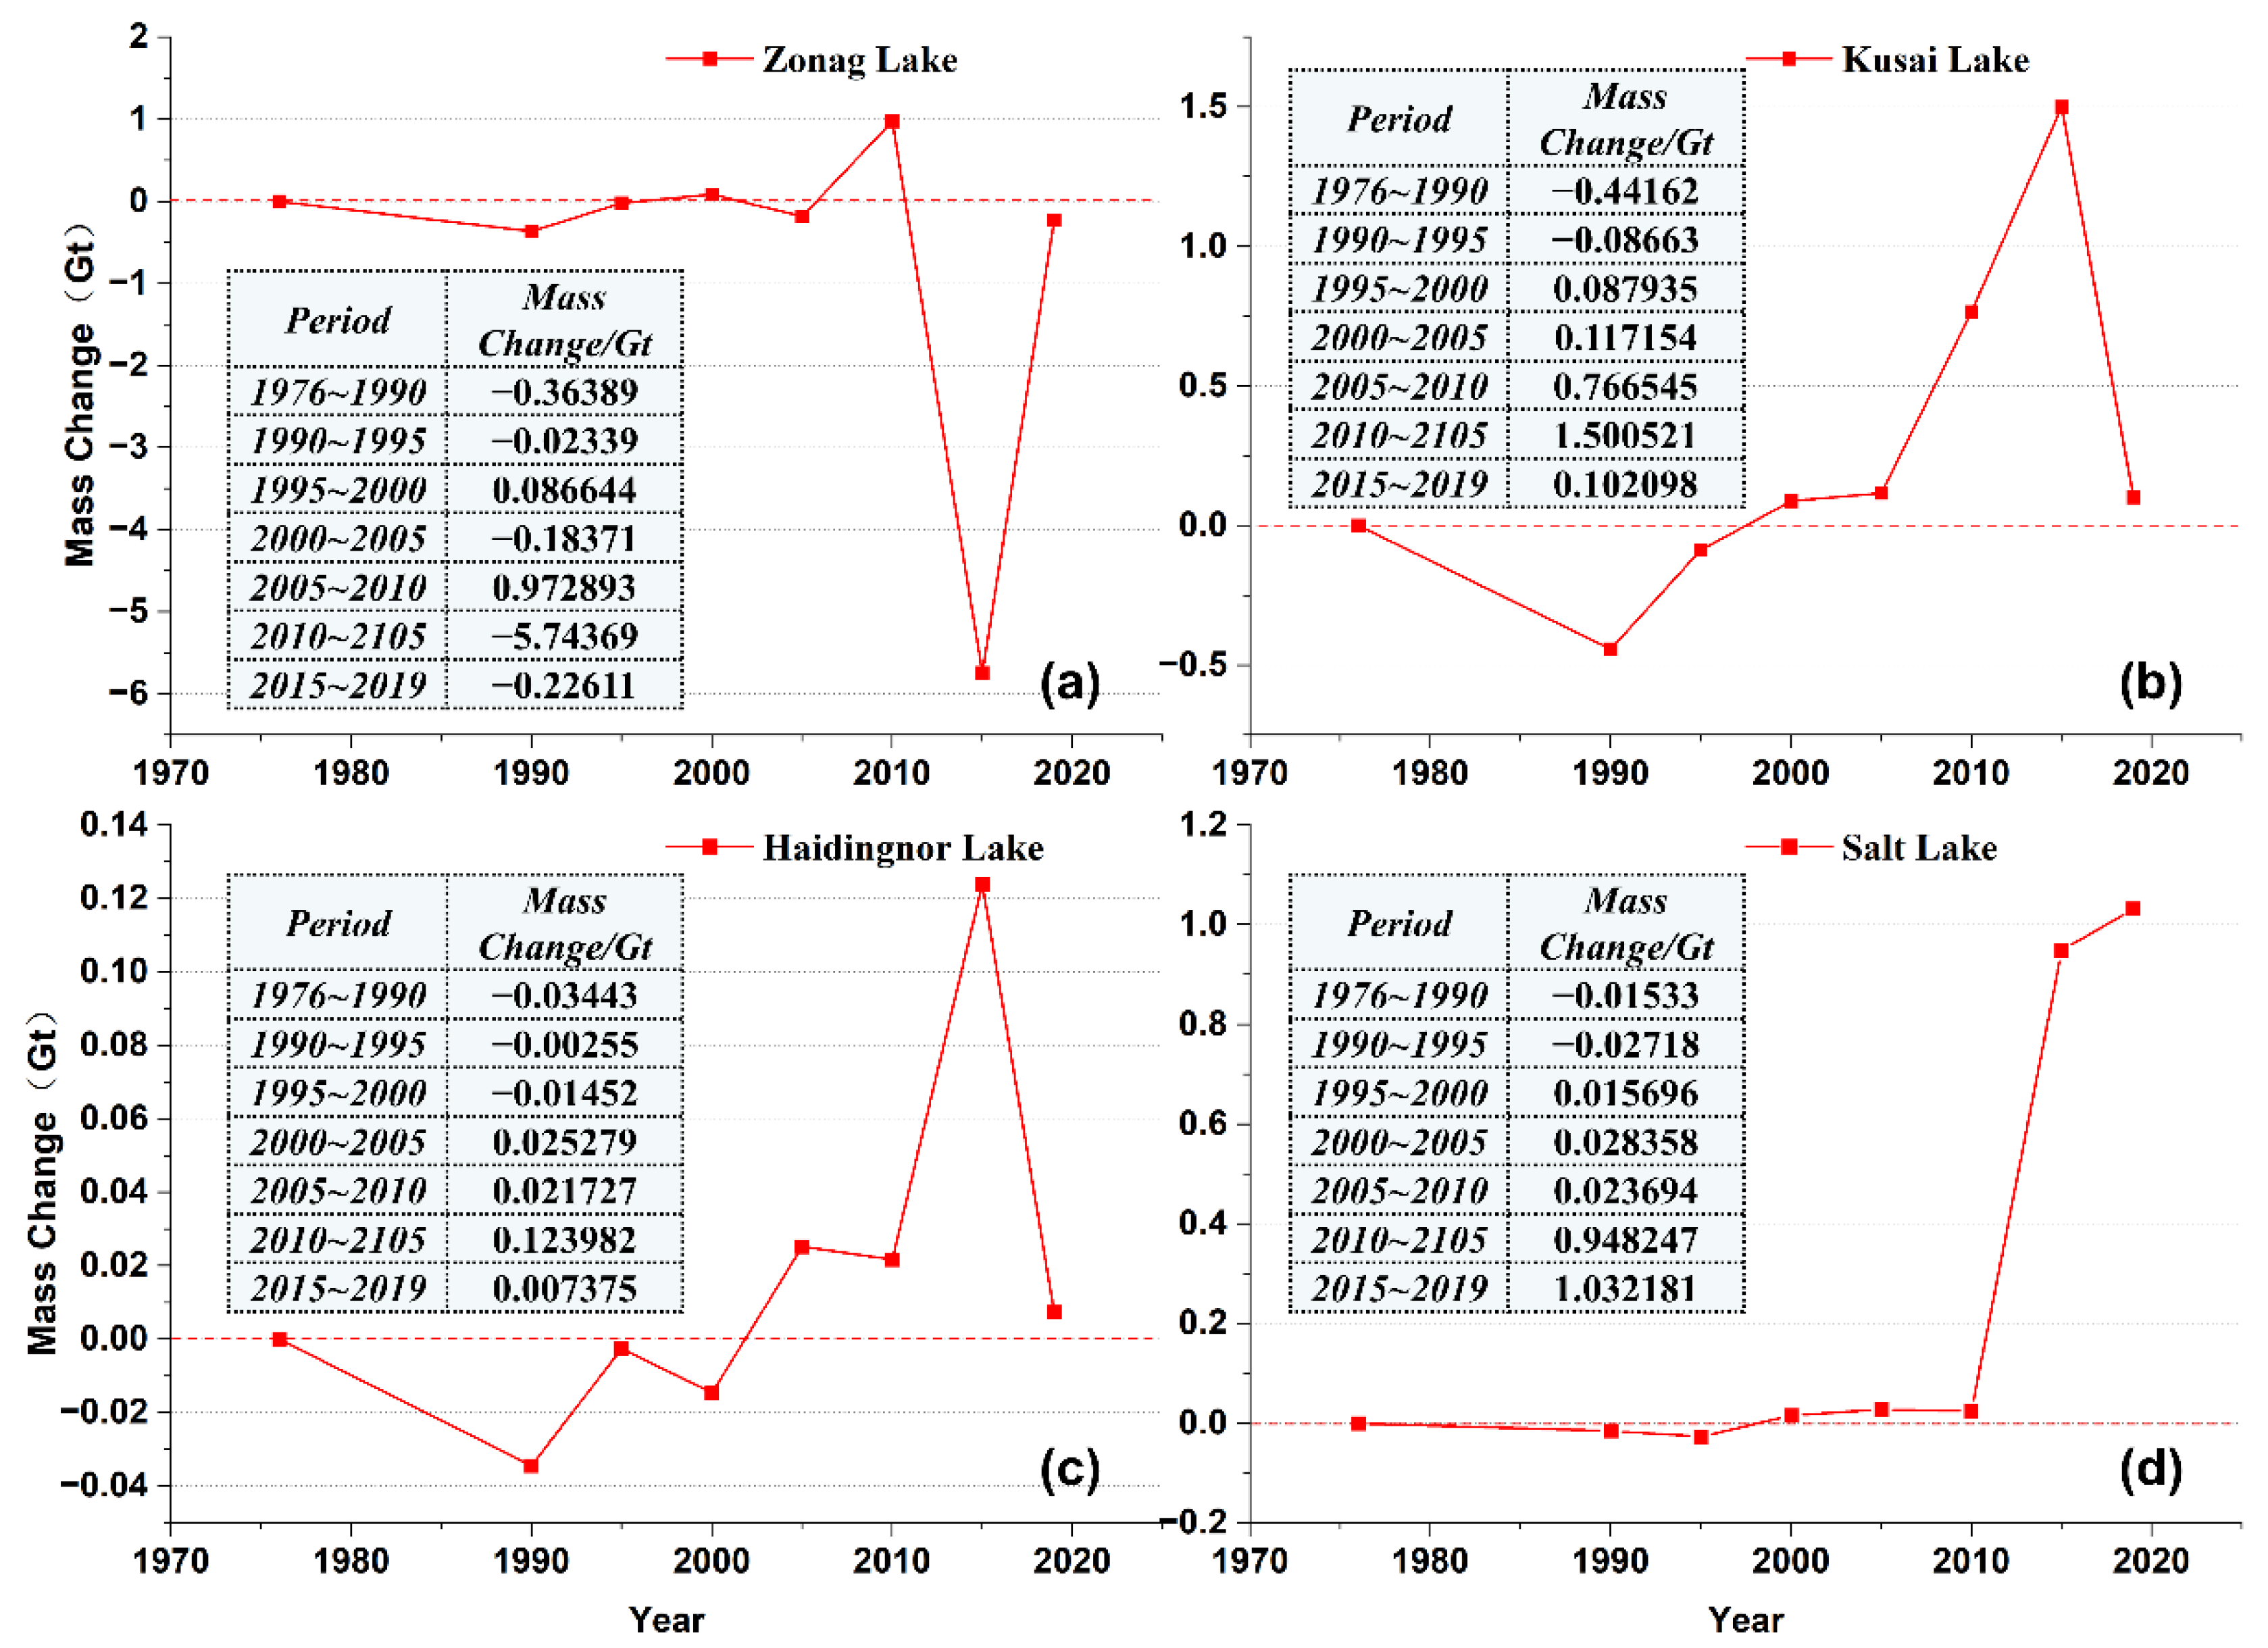
3.4. Changes in Water Volumes of the Four Lakes in ZLSB

The water volume changes of four lakes also presented a sudden change around 2011 (Figure 7). During 1976 and 1990, the volume of four lakes showed a trend of decline in varying degrees. From 1990 to 2010, the volume of Zonag Lake experienced a small reduction first and then shifted to an increase between 2005 and 2010, while the water volume change of Kusai Lake switched from negative to positive between 1995 and 2000. The water volume of Haidingnor also showed a positive change after 2000. Meanwhile, the volume of Salt Lake remained quite stable from 1990 to 2010.
However, between 2010 and 2015, with the outburst of Zonag Lake, the volume of the four lakes showed a big change. From 2010 to 2015, the water volume of Zonag Lake decreased by 5.74 Gt, while the water volumes of Kusai Lake, Haidingnor and Salt Lake downstream increased by 1.5 Gt, 0.12 Gt and 0.94 Gt, respectively, from 2015 to 2019. During this period, the trend of the decreasing water volume of Zonag Lake slowed down with a reduction of 0.23 Gt, while the increase in Kusai Lake and Haidingnor Lake slowed down in comparison, with an increase of 0.1 Gt and 0.0073 Gt, respectively. The water volume of Salt Lake increased by 1.03 Gt over the four-year period, surpassing the period from 2010 to 2015, making it the lake with the largest increasement in water volume after the Zonag Lake outburst.
From the aspect of the water volume changes and the hydraulic connection between the four lakes, it can be seen that after the outburst of Zonag Lake, Kusai Lake and Salt Lake received most of the incoming water from upstream. Meanwhile, Haidingnor Lake, limited by its area and topography, served more as a water passage to bring water to Salt Lake. However, until 2015, Kusai Lake was the main intake lake of the overflowing water. After that, with the gradual formation of a relatively stable river channel between the four lakes, the volume of Kusai Lake tended to stabilize, while the volume of Salt Lake still increased at the same time.

3.5. Hydraulic Connection of the Four Lakes in ZSLB

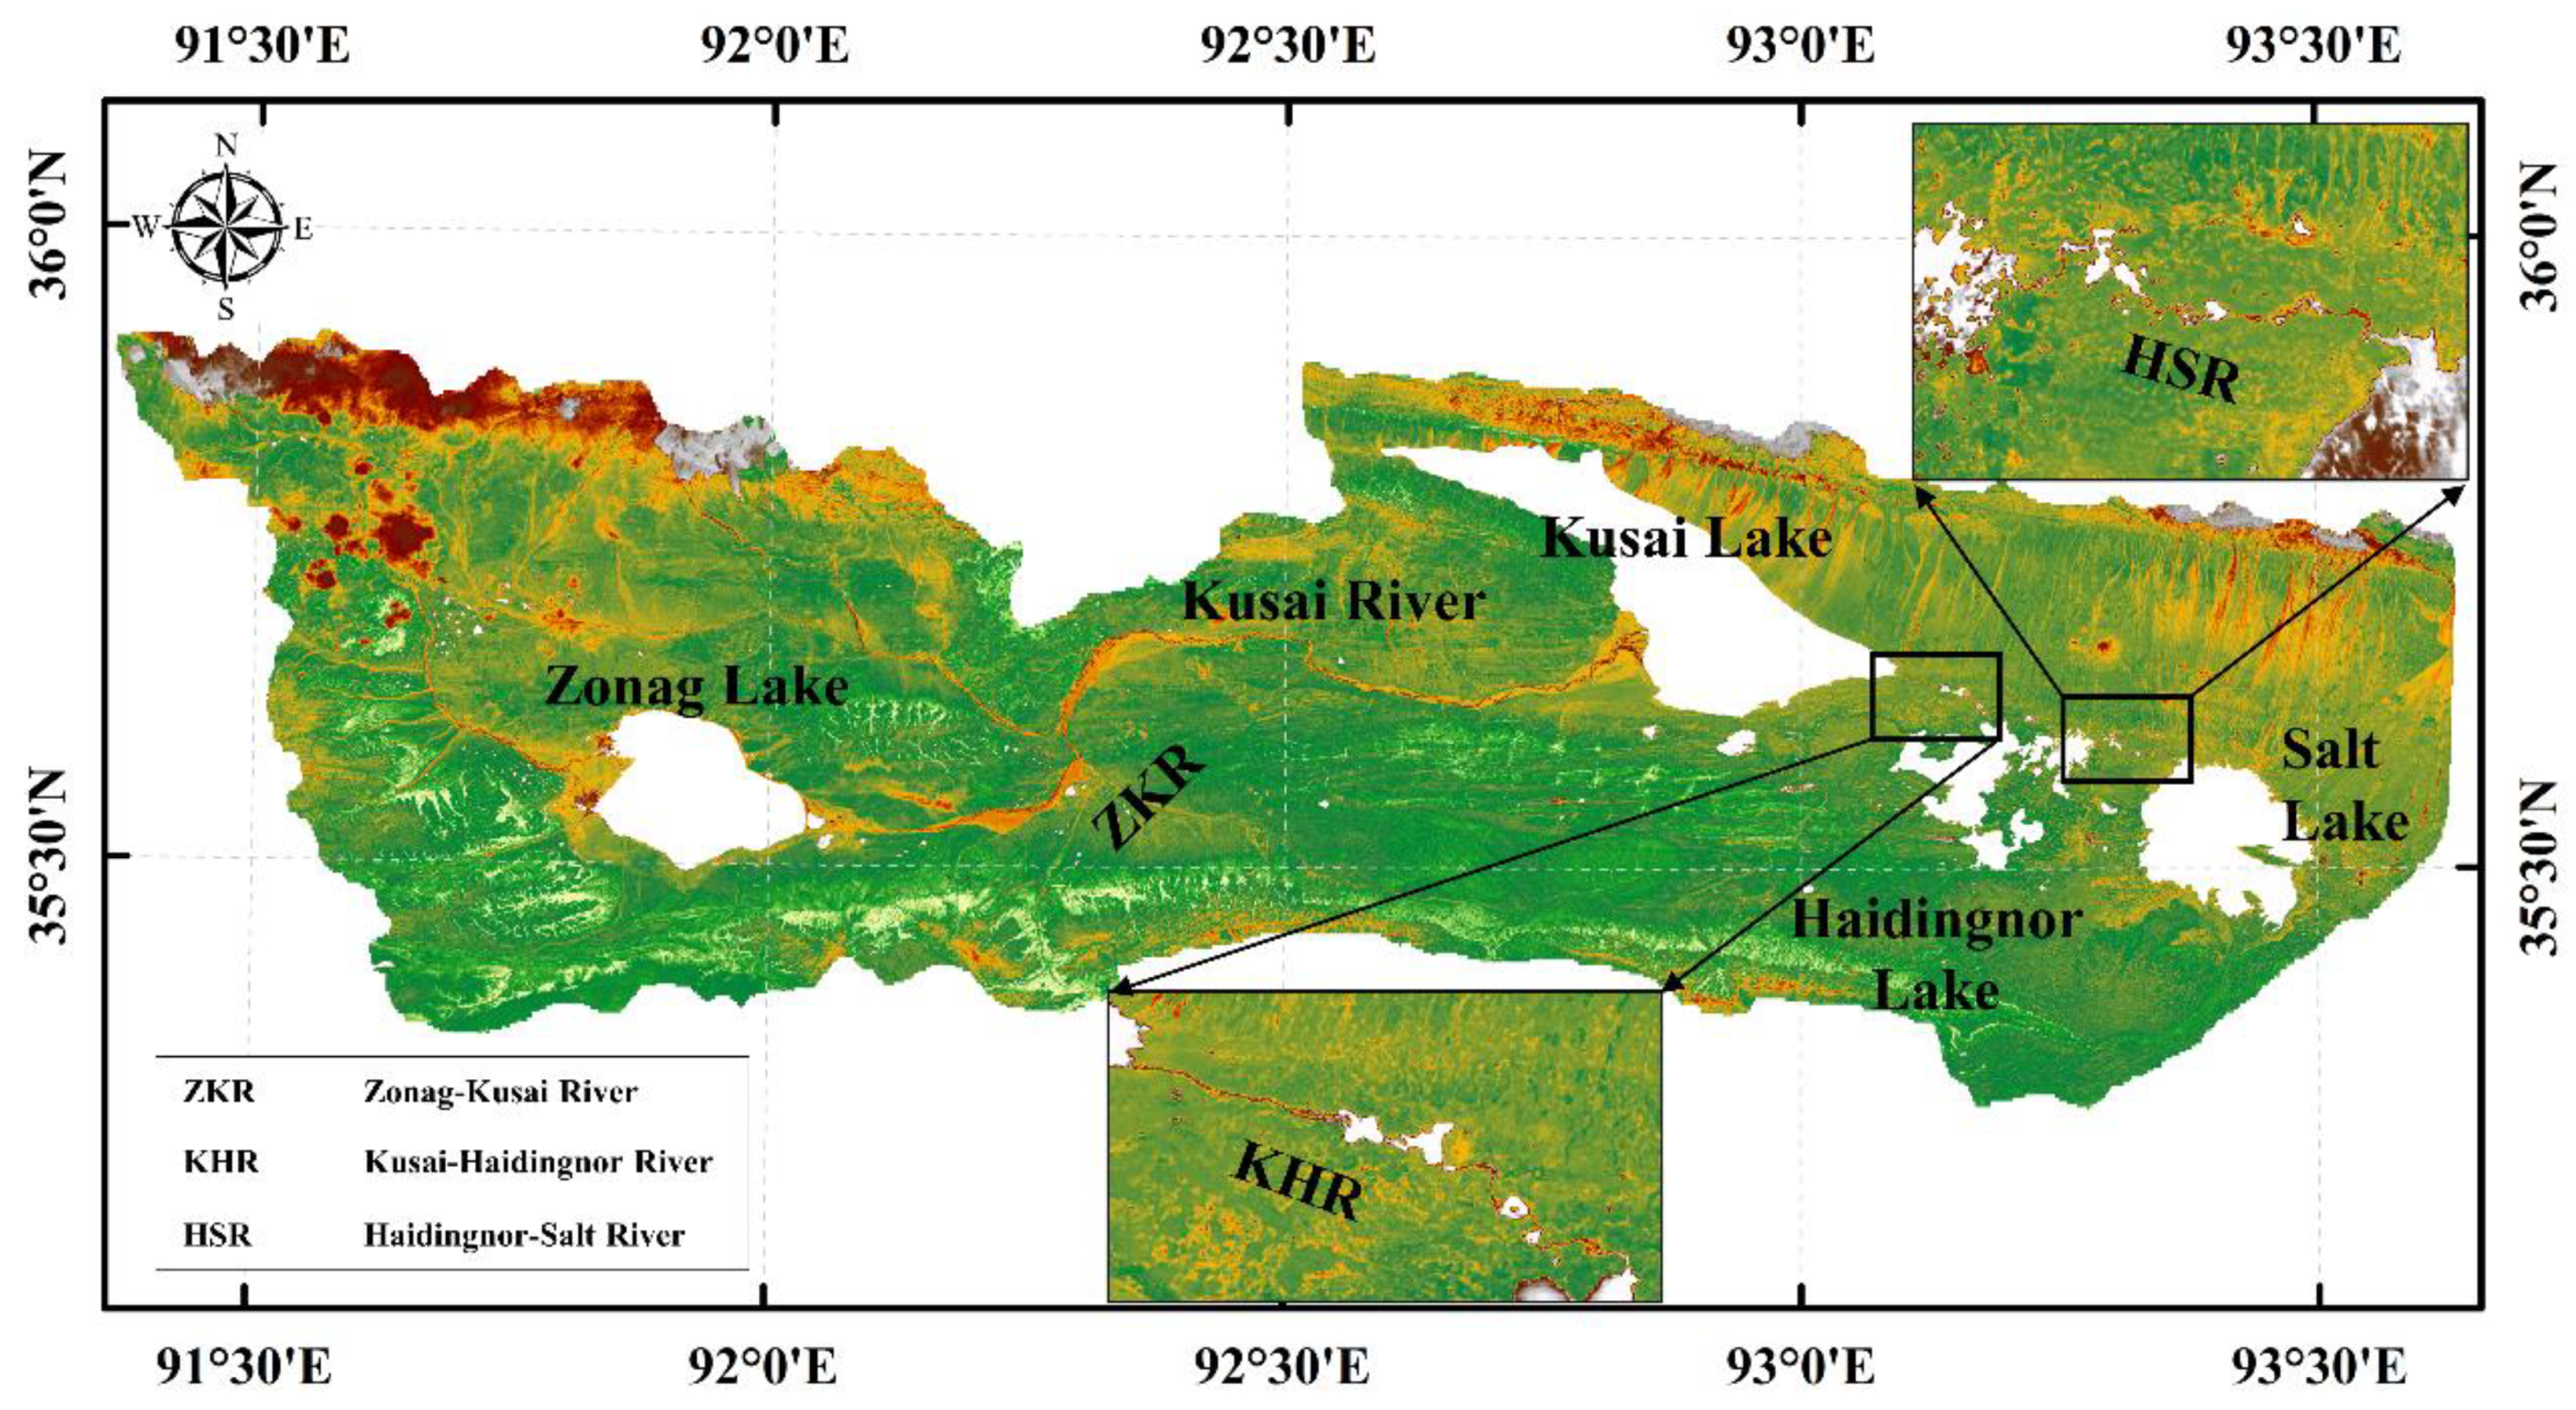
Before the outburst of Zonag Lake, the four lakes in ZSLB had their own catchments and there were almost no connections between each of them. After the outburst of Zonag Lake in September 2011, a gully which was about 100 m wide and 6–7 m deep was formed on the east side of the lake in a very short time because of the sudden and large overflowing water from the lake. [35]. The flood water first flowed into Kusai Lake through Zonag-Kusai River (ZKR) and triggered the overflow of Kusai Lake between September 20 and 30, 2011. The overflowing water widened and downcut the relict river channel and formed the Kusai–Haidingnor River (KHR). Afterwards, Haidingnor Lake, downstream of Kusai Lake, was filled up and the overflowing water made the lake expand to the west, which occupied the historical river channel and formed the Haidingnor–Salt River (HSR) [32] (Figure 8).
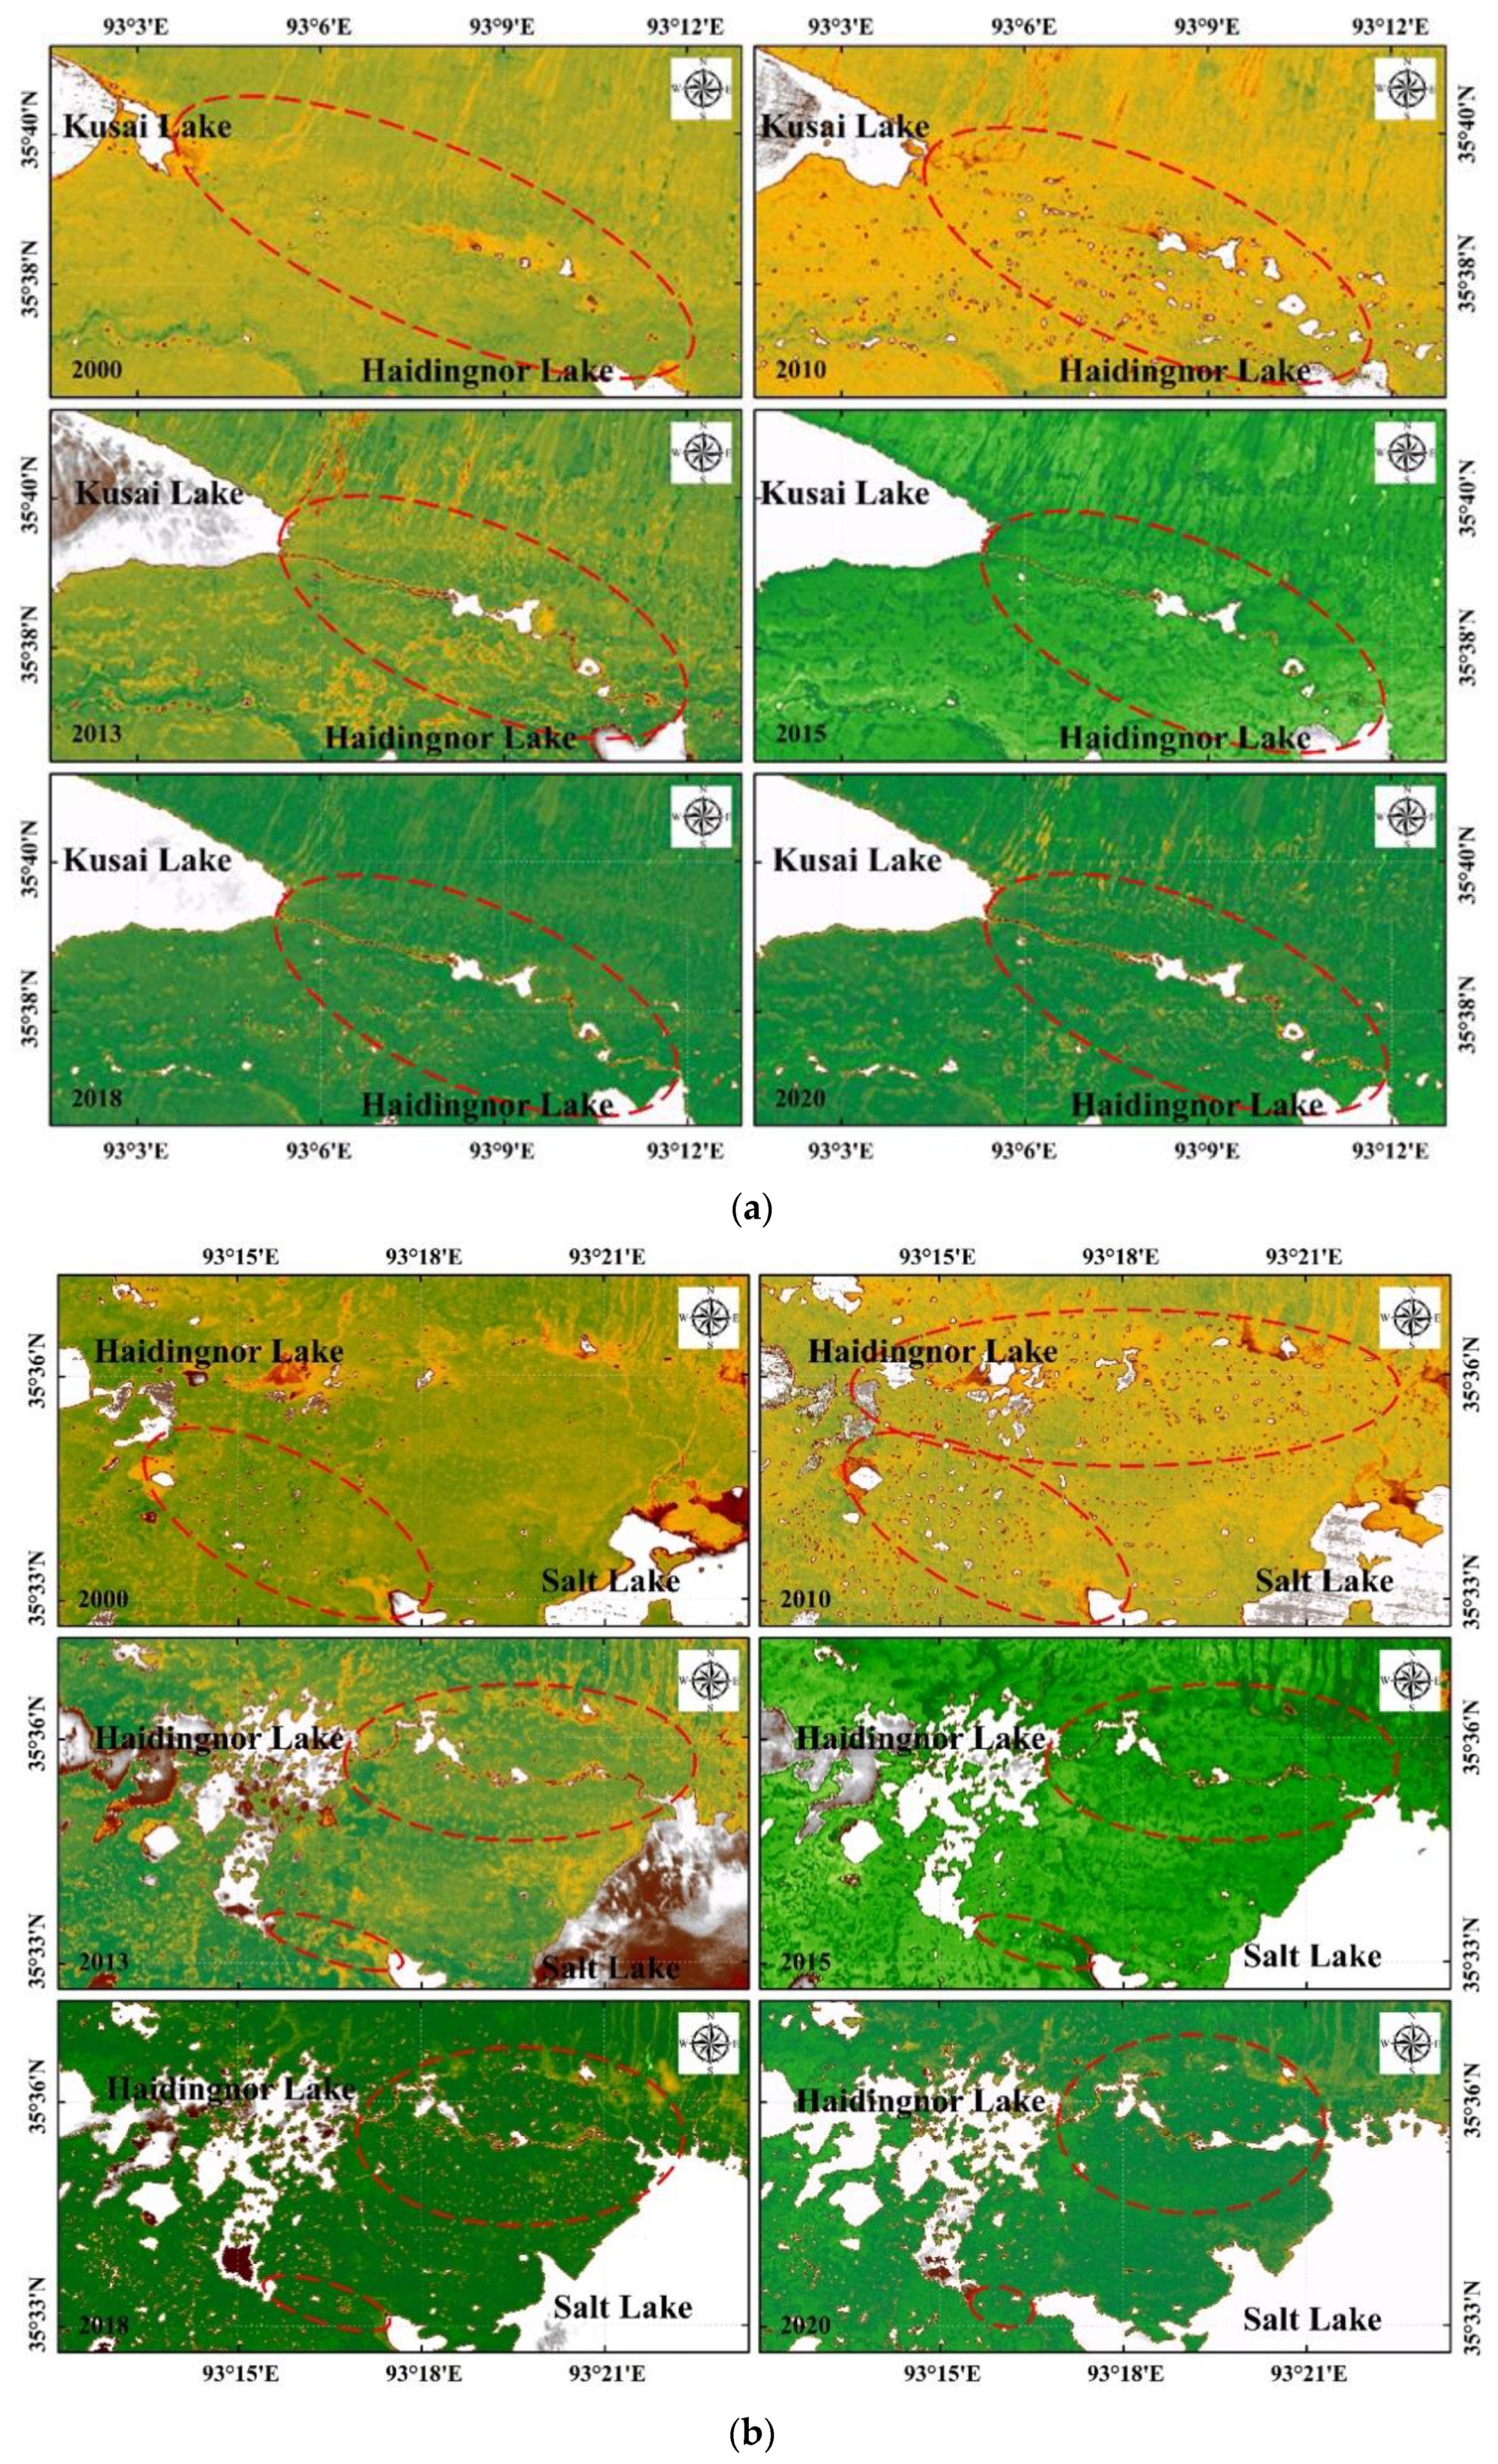
From the EWI results during 2000 and 2020, the changes in water distribution between Kusai Lake and Haidingnor Lake, and between Haidingnor Lake and Salt Lake, were captured. In the 2000s, water distribution in the regions between Kusai Lake and Haidingnor Lake remained quite stable. However, since 2010, the area of Kusai Lake has expanded in the east, and some small lakes can be spotted on the map. By 2013, after KHR formed, the eastern side of Kusai Lake experienced a significant expansion compared to 2010. In the following years, KHR and the area of the eastern Kusai Lake and the western Haidingnor Lake remained relatively stable (Figure 9a). As for the region between Haidingnor Lake and Salt Lake, the expansion of water body can be observed from 2010 onwards, when several small lakes appeared between Haidingnor Lake and Salt Lake. After HSR was formed in late 2011 and remained stable in the following years, a significant expansion of the inlet channel of Salt Lake can be observed. The water area both in eastern Haidingnor and western Salt Lake had an obvious expansion, resulting in the distance between two lakes becoming closer than ever before in 2020 (Figure 9b).

3.6. Variations in the Number of Small Lakes and Ponds in ZSLB

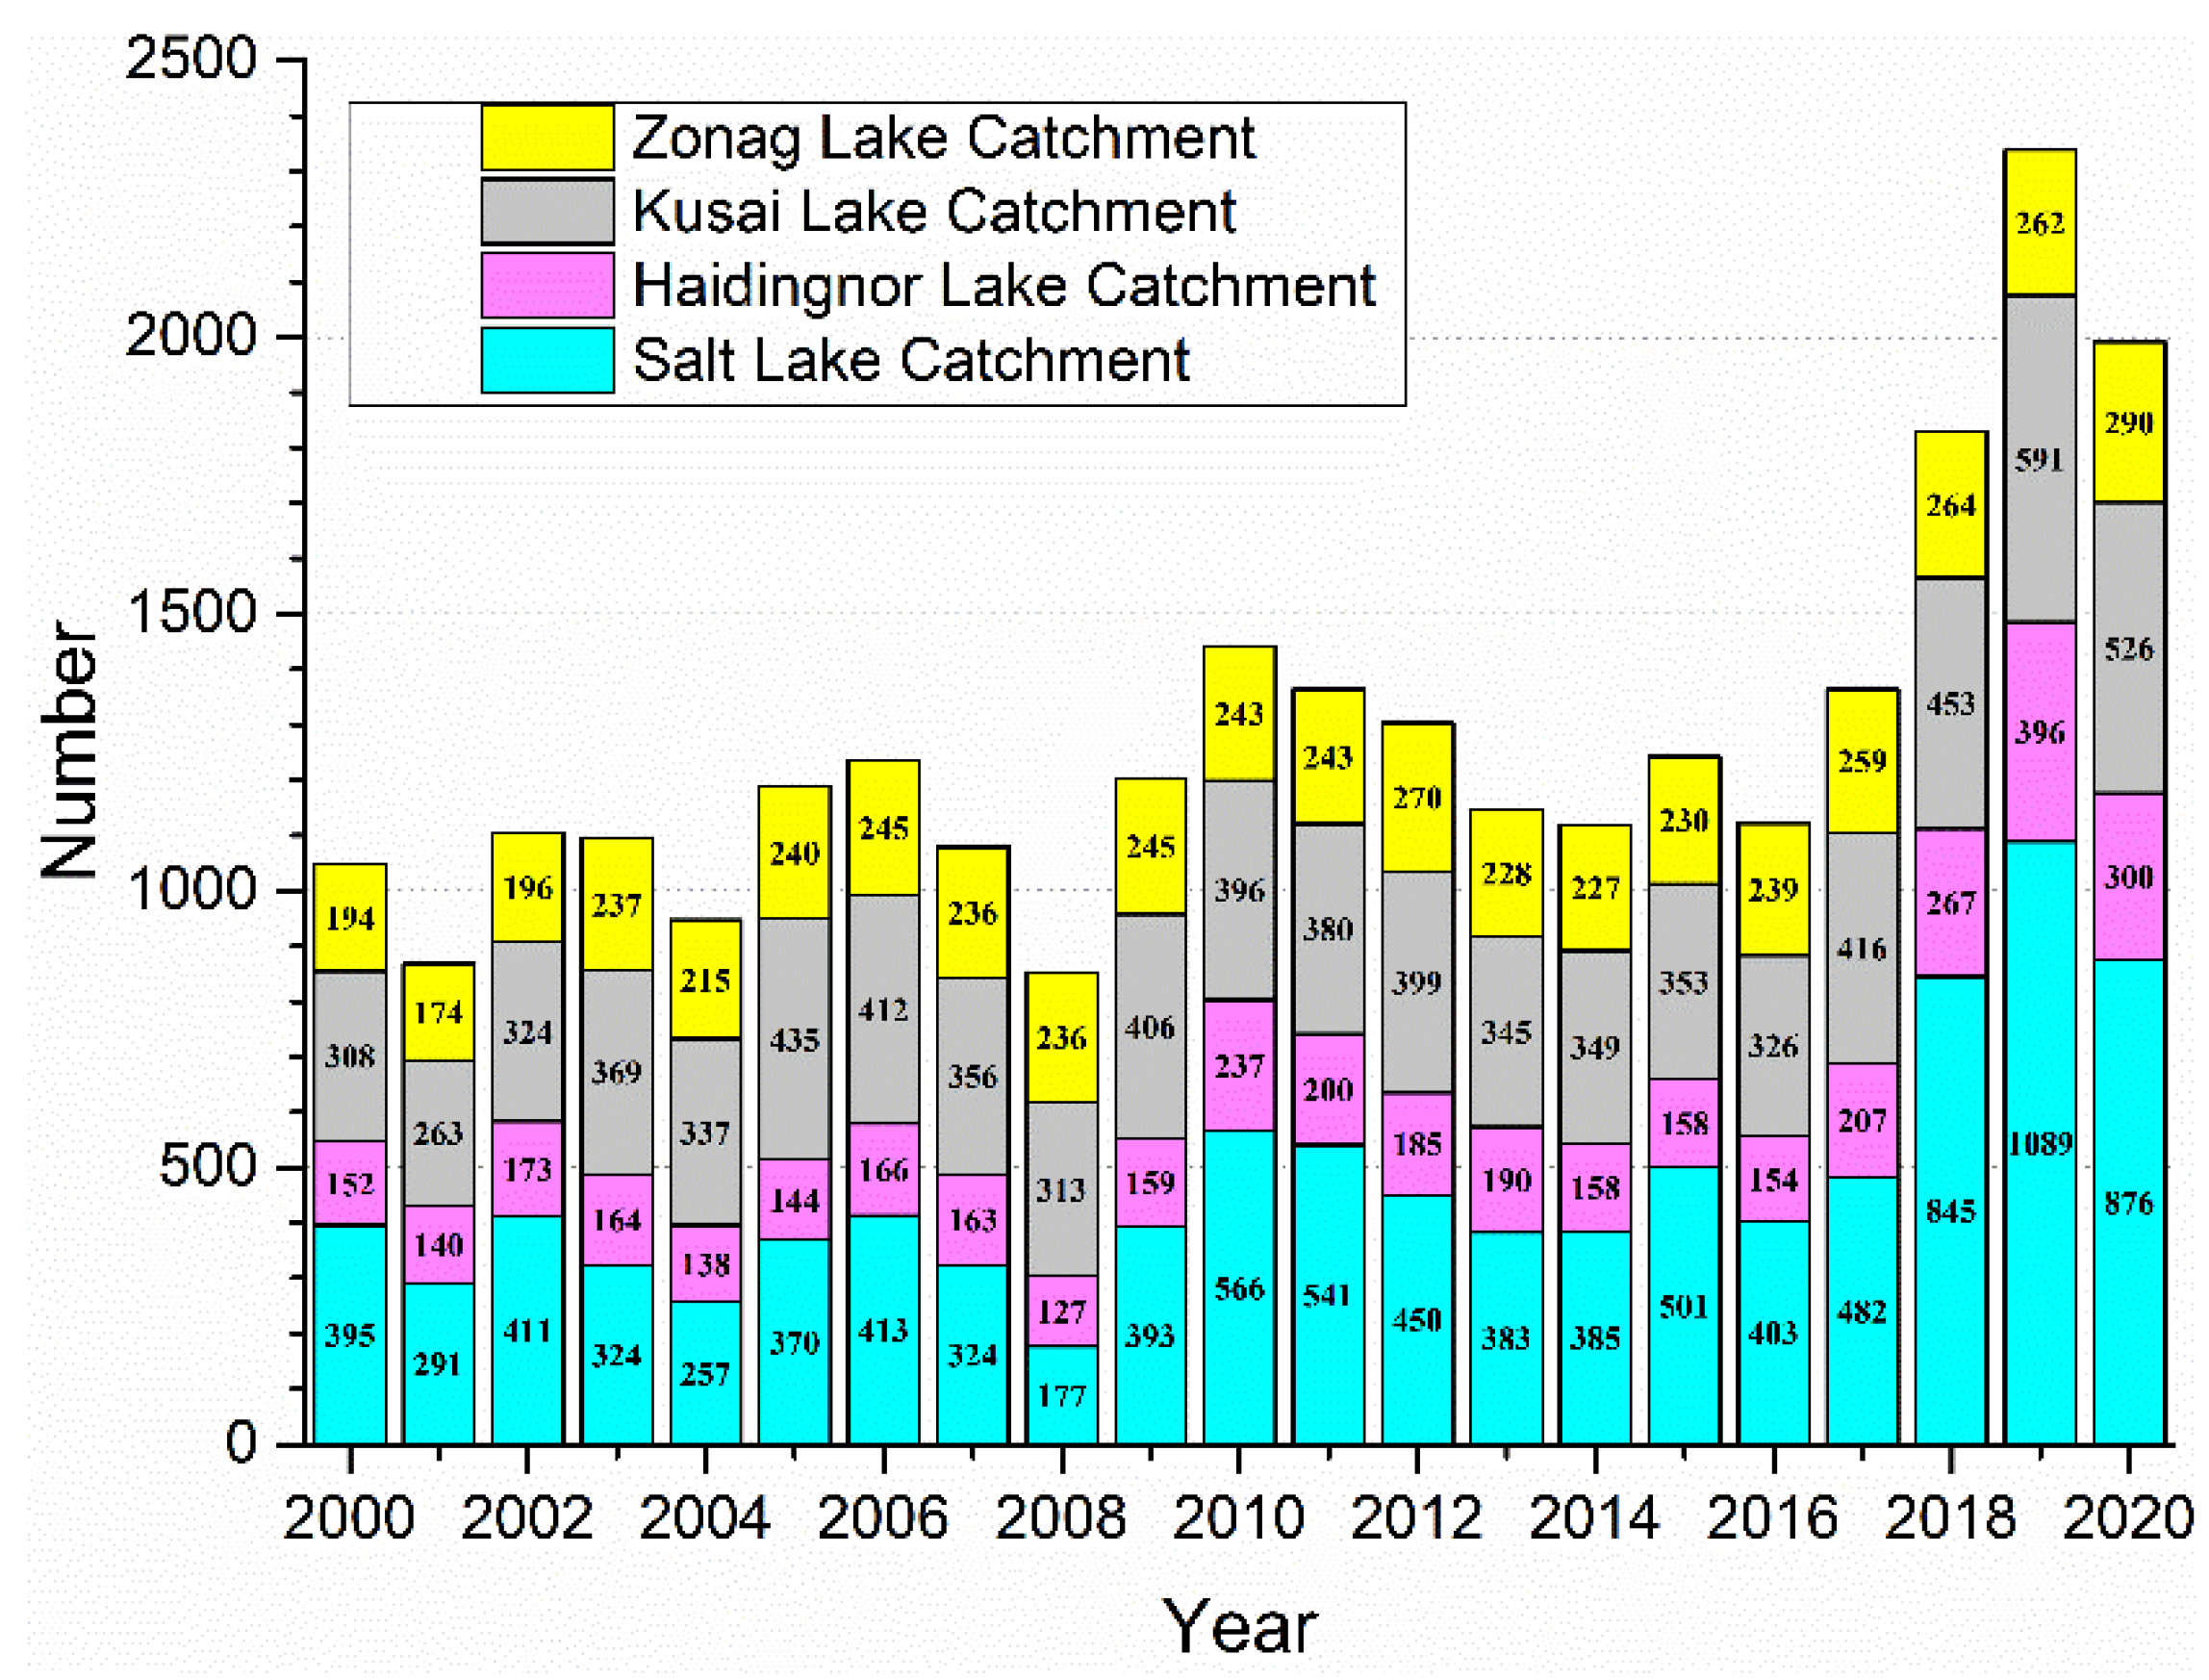
The total number of small lakes and ponds larger than 1000 m2 in area in ZSLB did not change too much before 2010. However, between 2010 and 2012, the total number of lakes and ponds increased by 26% during the period in which the outburst occurred. After 2012, several rivers formed between the four lakes to carry most of the overflowing water from the upstream lakes, and the number of lakes and ponds gradually returned to the level before the outburst. However, after 2017, the number of lakes and ponds in the basin once again saw an increase, rising to 2388 lakes and ponds in 2019, and reaching a 20-year historical high.
Considering the changes of small lakes and ponds within each catchment of the four lakes individually, the number of small lakes and ponds within each catchment of the four lakes fluctuated and increased during the decade from 2000 to 2010. In the catchment of Haidingnor Lake, the number of small lakes and ponds decreased by about 16% from 2000 to 2008, but nearly doubled between 2008 and 2010, reaching 237. Within two years of the outburst of the Zonag Lake in 2011, the number of small lakes and ponds within the catchment first jumped to 270 and then gradually decreased. However, the number of small lakes and ponds rose again after 2016, with an increase of about 19%, reaching 290 in 2020. The number of small lakes and ponds in the former Kusai Lake basin and Haidingnor Lake basin underwent an increase–decrease–increase cycle after 2011, eventually reaching 1.45 and 1.67 times the number of lakes and ponds in 2010, respectively. The number of small lakes and ponds in the Salt Lake catchment increased significantly after 2016, and finally reached 876 lakes and ponds in 2020, which was 1.5 times the number of lakes and ponds in 2010. This is the largest increase in the number of small lakes and ponds among the four catchments (Figure 10).

4. Discussion

4.1. Causes of Lake Expansion in the ZSLB

Observations showed that lakes on the TP have undergone obvious expansion over the past few decades [35,52]. Between the 1970s and 2010s, the mass of lake water on the TP increased by approximately 110 Gt [39]. From 2003 to 2018, lake water increased more rapidly and reached a rate of 14 Gt/a in this period [39]. The possible reasons for the increase in lake water on the TP include net precipitation onto the lake area, melting of snow, permafrost degradation, glacier melt water and precipitation-induced runoff from upstream catchments, of which the increase in the net precipitation on the TP was believed to be the dominant contributor [25,31,53,54,55]. In detail, the proportion of net precipitation, glacier melt and ground ice melt due to permafrost degradation to the increase in lake water were estimated as 74%, 13% and 12%, respectively [15]. At different regions of the TP, however, the contributions of these drivers differed considerably. Qiao et al. [56] divided the TP into five regions and estimated that the contributions of glacier melt water to increasing lake water storage in these five regions varied from 20% to 100%. In the northeast part of the TP, where the ZSLB is located, the glacier melt water was estimated to contribute nearly 40% of the mass increase in lake water [56].
It is believed that increased precipitation, decreased evaporation, increased glacier meltwater and ground ice meltwater, along with permafrost degradation, all attributed to the lake expansion in the ZSLB [22,25,31,32]. Additionally, the increased precipitation is considered the dominant contributor of the lake expansion in the basin [22,32]. From 1965 to 2019, the air temperature and precipitation data from Wudaoliang meteorological station showed a continuous and significant increase (Figure 11). After 2000, the increase rate of both the air temperature and precipitation accelerated. The air temperature reached a peak of −3.68 °C in 2016, while the precipitation reached peak of 480.3 mm in 2018. This indicated that before the outburst event, the air temperature and precipitation in the basin underwent a long-term increasing period. The overflow and outburst event of Zonag Lake was triggered directly by continuous and heavy precipitations in August and September, 2011. Data from the meteorological station showed that heavy precipitations occurred a few days before and after the outburst event, including days from 14 August to 21 August, 31 August to 5 September, and 16 September and 17 September. On two days of 17 and 21 August, the daily precipitations reached 20.5 mm and 19.4 mm, respectively.
Due to limited in situ observations and data on glaciers and permafrost in the ZSLB, the contributions of each driver to lake expansion in the ZLSB have not been estimated clearly to date. In Yao et al. [32] and Liu et al. [35], glacier retreated in the catchments of Zonag Lake, Kusai Lake and Salt Lake were introduced and its contribution to lake expansion in the basin was confirmed. In these studies, the contributions from glacier meltwater were qualitatively analyzed.
The contributions of the permafrost degradation and consequential ground ice meltwater increase are more difficult to estimate. The volume of ground ice within permafrost layer and its distribution with depth generally cannot be detected directly or indirectly [57]. At present, the ground ice volume in permafrost regions is generally estimated with water content measurement during boreholes drilling. Zhao et al. [57] estimated the ground ice volume of permafrost regions on the TP based on 697 boreholes along the Qinghai–Tibet engineering corridor. Wang et al. [58] and Wang et al. [59] estimated ground ice volume in permafrost at the source area of the Yellow River and Datong River. The number of boreholes used in the two studies was 105 and 74. However, the distribution of ground ice was influenced by many factors, including liquid water supply, soil texture and frost susceptibility, active layer history, ground thermal gradients, hydraulic conductivity, vapor deposition and sublimations. Some factors interact in variable and site-specific ways; therefore, each permafrost site should be considered individually. In ZLSB, however, boreholes of permafrost were very limited. The existing boreholes showed that the permafrost in the basin was characterized as high temperature (>−1.0 °C) (Figure 12) and ice rich. Thus, the rapid permafrost degradation and consequential melt of near-surface ground ice would definitely contribute to the lake expansion in the basin. To quantify this contribution, more boreholes are needed in future.

4.2. Roles of Permafrost Layer in Hydrology Process in Periglacial Environments

In a periglacial environment, the permafrost layer plays an important role in affecting the surface water balance, the interaction between surface water and underground water and the runoff regime. In a continuous permafrost region, the process of downward infiltration and the interaction between the surface water and ground water are limited because of the existence of the permafrost layer, which contributed to a larger surface runoff from the precipitation and snow-melt water in the spring and summer time (Figure 13a). In addition, melting of near-surface ground ice contributes to the expansion of lakes. By analyzing the stable isotopes of thermokarst lakes on the TP, Yang et al. [60] suggested that the lakes mainly recharged using rain and snowmelt/permafrost thaw in the ice-free season, while melting of the surrounding permafrost dominated the hydrology of thermokarst lakes in the ice covered season. Due to the climate warming and wetting accelerated the melting of permafrost in the past few decades, rapid lake expansion in continuous permafrost regions has been observed and reported widely [40,56].
On the contrary, as stable aquicludes are unable to form in island or discontinuous permafrost regions, the hydrological connectivity between surface water and groundwater is enhanced compared to the continuous permafrost region. Based on the satellite imagery between the 1970s and the 2000s, Smith [61] concluded the development of permafrost lakes involves two periods: (1) initial permafrost warming leads to development of lake expansion, (2) followed by lake drainage as the permafrost continues degrading. As permafrost degradation accelerates, the thinning of permafrost layer and the formation and expansion of taliks in the continuous permafrost region provides a major pathway to connect surface water and groundwater systems. A large amount of surface water and supra-permafrost groundwater was infiltrated, and the lake area was transformed from expansion to continuous shrinkage (Figure 13b). In Western Siberia, Northwest Canada, and northern Alaska, lake shrinkage and drainage events have been reported and observed [62,63].

4.3. Influences of Lake Expansion and Outburst on Engineering

From an engineering viewpoint, the bearing capacity and deformation behavior of permafrost subgrade are closely related to its thermal regime. As an excellent heat carrier, the surface water can bring a large amount of heat and cause rapid deepening of the active layer, warming of permafrost layer and even development of taliks. These processes will lead to a decrease in the bearing capacity of permafrost subgrade and an increase in (differential) thaw settlement of foundation built on permafrost. Based on in situ monitoring, Mu. et al. [64] concluded that water ponds near the foot of a railway embankment can significantly affect the thermal regime of permafrost subgrade and cause excessive settlement of the railway embankment. Lin et al. [65] and Wen et al. [66] investigated impacts of thermokarst lakes near the roadway embankment through numerical simulations. The simulated results showed that the thermokarst lakes can result in local permafrost warming and thawing beneath the roadway embankment. Compared with water ponds or a thermokarst lake, surface water flow would lead to more rapid and severe permafrost warming and thawing due to convection heat transfer between the flowing water and shallow ground.
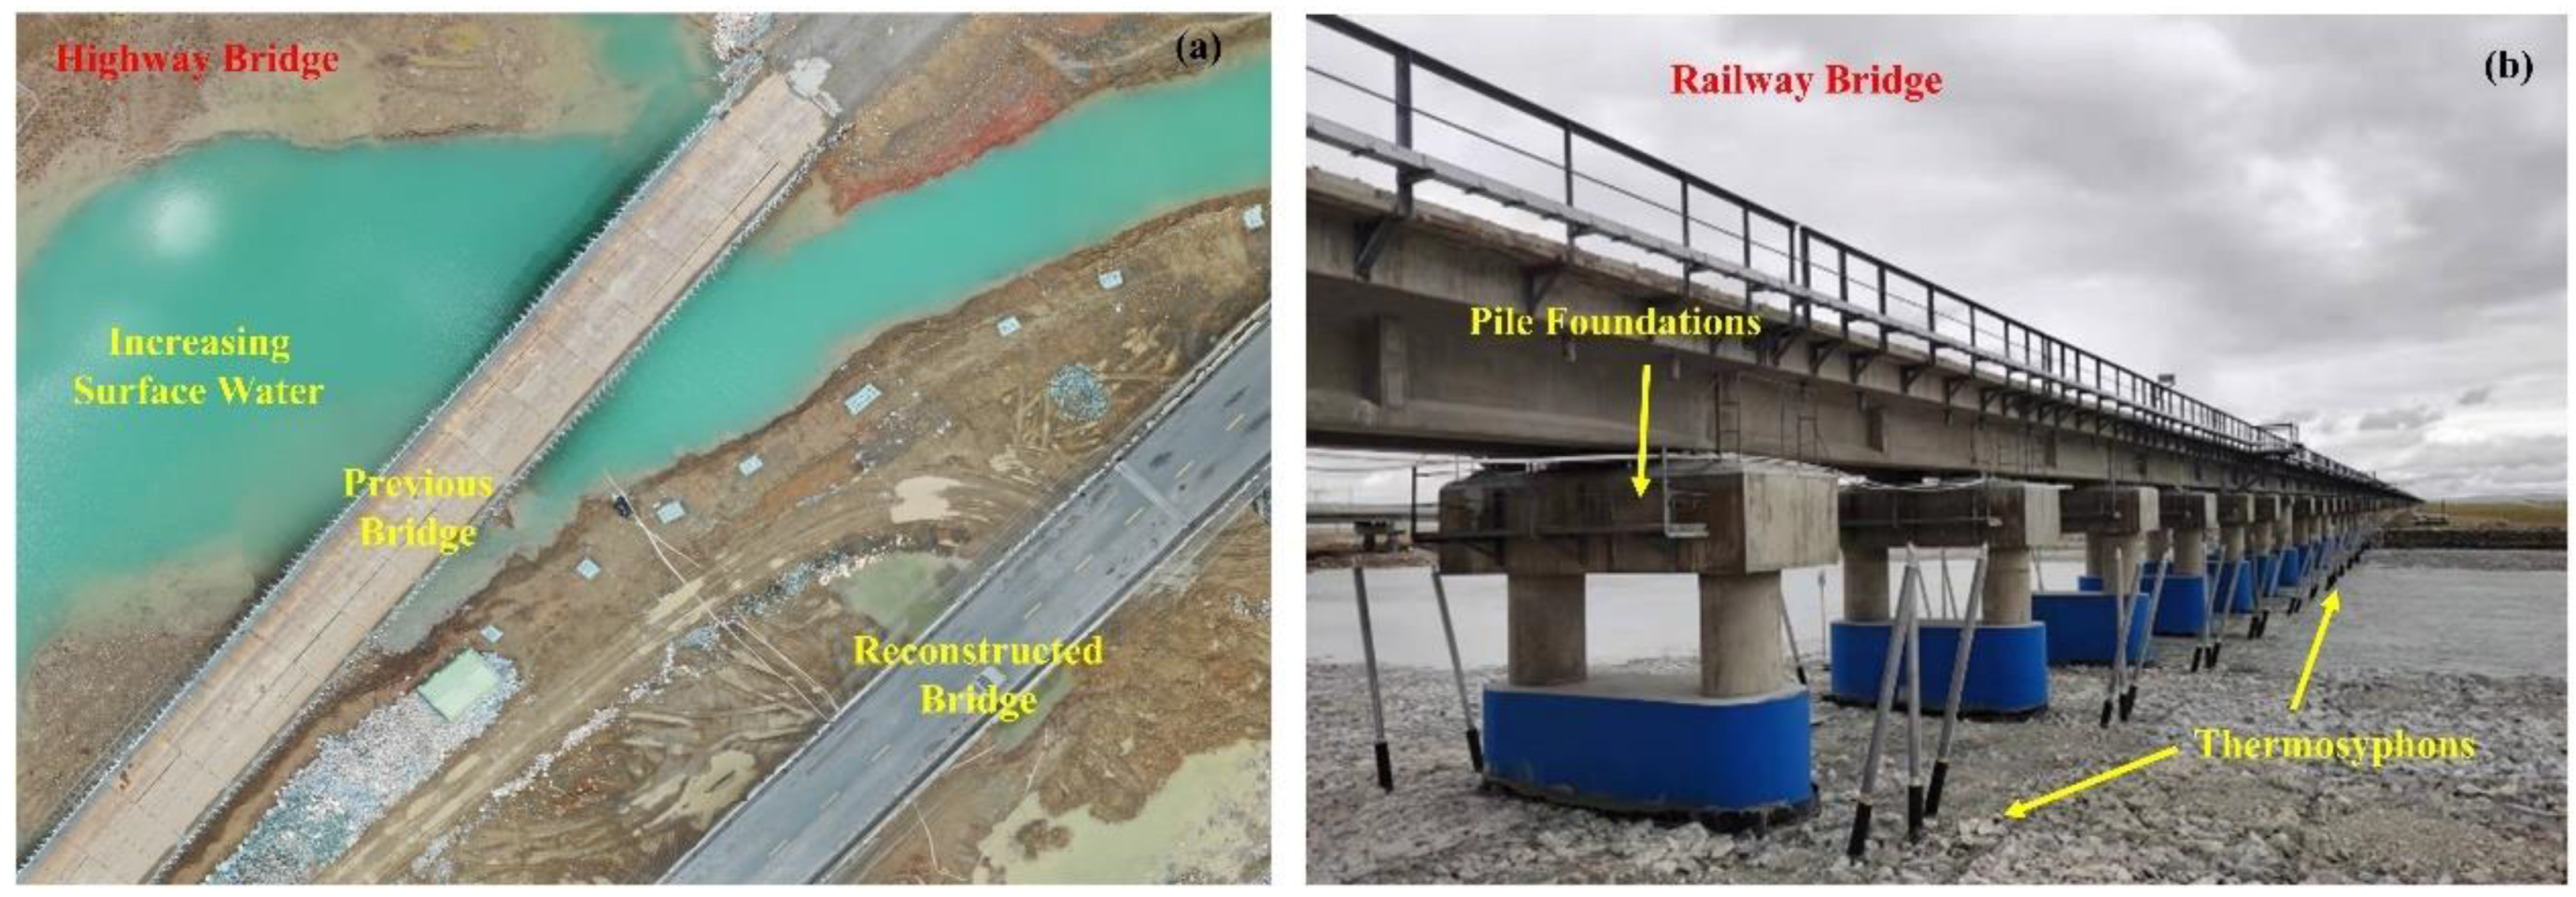
Important linear infrastructures extend downstream of Salt Lake in a narrow corridor. To prevent overflow or outburst of Salt Lake, a channel was excavated to drainage the water from Salt Lake into Qingshui River. To solve the problem of the rising water level in the Qingshui River caused by this drainage project, the highway reconstructed a longer bridge across the Qingshui River (Figure 14a). The railway at this section was originally built with a 14 km-long dry bridge to cross thermal unstable permafrost. Before the channel was excavated, the water flow only crossed 1~2 spans of the bridge. However, after the drainage project, the water flow covers about 10 spans of the bridge in warm seasons and 5~6 spans in cold seasons. For pile foundations of the bridge, the surface water flow and the consequential permafrost warming and thawing can result in considerable decline in their bearing capacity. The deepening of active layer will decrease the effective length of pile and exert negative friction force on it. To mitigate these detrimental effects induced by increased flowing water, thermosyphons were installed around the pile foundations (Figure 14b). It is hoped that, with thermosyphons cooling, the increased heat gains of permafrost foundation provided by flowing water can dissipate, and the thermal stability of permafrost around the pile can be ensured. Before installation of the thermosyphons, waterproof materials were placed at the riverbed to prohibit infiltration of surface water into active layer. Meanwhile, a coupled heat transfer simulation among flowing water, permafrost subgrade and thermosyphons is needed, which will help to determine of the numbers of the thermosyphons used for each pile. In the simulation, factors including the velocity, temperature and depth of the flowing water are important, as well as their seasonal variations.

5. Conclusions

The outburst of Zonag Lake is an extreme event of lake expansion on the TP in the context of climate warming and wetting. This event induced expansion of three lakes downstream and significant changes in the surface water distribution in the ZSLB basin. An artificial channel was constructed to drain the water of the tail-end lake of the basin, i.e., Salt Lake, to the Qingshui River. Then, the ZSLB changed from an endorheic drainage basin to part of the source area of the Yangze River. In this study, changes in surface water bodies in the basin 10 years before and 10 years after the outburst of Zonag Lake were investigated. The main conclusions are as follows:
(1) The total surface water area in the ZSLB showed a continuous and significant increasing trend during the period from 2000 to 2020. The average increase rate in 20 years was as much as 12.1 km2/a. Before the outburst of Zonag Lake, the areas of the four lakes in the basin increased, with the rates ranging from 0.9 km2/a to 2.8 km2/a. After the outburst, the area of the Zonag lake declined from 268.3 km2 to 163.8 km2.The areas of Kusai Lake, Haidingnor Lake and Salt Lake increased by 11.8% and 41.5%, and 117% from 2011 to 2013, respectively. In the following 7 years, the area of Zonag lake shrank slightly, and the areas of Kusai Lake and Haidingnor Lake remained almost the same, while the area of Salt Lake still increased considerably with a rate of approximately 9.0 km2/a.
(2) According to the changes in shoreline and water volume of the four lakes, the outburst of Zonag Lake caused a redistribution of surface water in ZSLB. After 2011, the Zonag Lake experienced a quick shrinkage in west and east direction. The volume of the Zonage Lake decreased by 5.96 Gt. With the water continuously flowing into Kusai Lake, the water volume of Kusai Lake increased around 1.60 Gt, and the shoreline expanded mainly along the southeast direction. When the upstream water flowed into Haidingnor lake, its shoreline expanded rapidly and a connection was built with Salt Lake in a short time. As a tailwater lake in ZSLB, Salt Lake received the most overflowing water from Zonag, and its water volume increased by 1.98 Gt, with the shoreline expanding in every direction.
(3) The total number of small lakes and ponds with an area larger than 1000 m2 in the ZSLB did not change much before 2010. However, this number increased significantly within two years after the outburst of Zonag Lake. After 2012, as the streams and channels formed gradually and connected the four lakes, the total number of lakes and ponds gradually decreased to the level before the outburst. Since 2017, however, the number of lakes and ponds in the basin once again increased and reached a peak in the past 20 years.
(4) The increase in surface water and lake expansion in the ZSLB are primarily attributed to the increased precipitation, and secondly by glacier retreat and ground ice melt from underground permafrost degradation. The contribution of each factor has not been estimated so far because of the limited data on glacier and permafrost in the area; also, the difficulty in the estimation of ground ice volume in permafrost region. The permafrost layer, acting as an impermeable layer, played an important role in affecting the surface hydrological process.
(5) From an engineering viewpoint, flowing water could induce rapid warming and thawing of underlying permafrost, and then could create a threat to the engineering infrastructure above. To mitigate the thermal effects caused by flowing water to permafrost embankment, active cooling methods such as thermosyphons were used. However, the infiltration of surface water to the ground should be avoided by setting up the waterproof materials above the permafrost layer. Meanwhile, a system evaluation should be carried out to determine the numbers of thermosyphons used for permafrost foundations.

Author Contributions

Conceptualization, Y.M., M.C. and F.N.; methodology, Z.D.; software, Z.D. and M.C.; validation, Y.M., M.C., F.N. and G.L., formal analysis, Z.D., M.C. and Y.M.; investigation, Y.M. and Z.D.; resources, Y.M. and F.N., data curation, P.H., G.L.; writing—original draft preparation, Z.D.; writing—review and editing: Y.M., F.N. and M.C.; visualization, Z.D.; supervision, Y.M. and F.N.; project administration, Y.M. and F.N.; funding acquisition, F.N. and Y.M. All authors have read and agreed to the published version of the manuscript.

Funding

This research was funded by the National Natural Science Foundation of China, grant number 41730640; the Second Tibetan Plateau Scientific Expedition and Research (STEP) program, grant number 2019QZKK0905; the Strategic Priority Research Program of the Chinese Academy of Sciences, grant number XDA19070504.

Conflicts of Interest

The authors declare no conflict of interest.

References

  1. Wang, L.; Zhou, Z. Dahe Qin: Time is limited to curb global warming. Natl. Sci. Rev. 2016, 3, 144–147. [Google Scholar] [CrossRef] [Green Version]
  2. Jiang, D.; Wang, N. Water cycle changes: Interpretation of IPCC AR6. Progress. Inquisitiones Mutat. Clim. 2021, 17, 699–704. [Google Scholar]
  3. Zhou, B.; Qian, J. Changes of weather and climate extremes in the IPCC AR6. Progress. Inquisitiones Mutat. Clim. 2021, 17, 713–718. [Google Scholar]
  4. Li, L.; Yang, S.; Wang, Z.; Zhu, X.; Tang, H. Evidence of Warming and Wetting Climate over the Qinghai-Tibet Plateau. Arct. Antarct. Alp. Res. 2010, 42, 449–457. [Google Scholar] [CrossRef]
  5. O’Gorman, P.A. Precipitation Extremes Under Climate Change. Curr. Clim. Chang. Rep. 2015, 1, 49–59. [Google Scholar] [CrossRef] [PubMed] [Green Version]
  6. Liu, Q.; Guo, W.; Nie, Y.; Liu, S.; Xu, J. Recent glacier and glacial lake changes and their interactions in the Bugyai Kangri, southeast Tibet. Ann. Glaciol. 2016, 57, 61–69. [Google Scholar] [CrossRef] [Green Version]
  7. Yuan, X.; Jiao, Y.; Yang, D.; Lei, H. Reconciling the Attribution of Changes in Streamflow Extremes from a Hydroclimate Perspective. Water Resour. Res. 2018, 54, 3886–3895. [Google Scholar] [CrossRef]
  8. Liu, M.; Shen, Y.; Qi, Y.; Wang, Y.; Geng, X. Changes in Precipitation and Drought Extremes over the Past Half Century in China. Atmosphere 2019, 10, 203. [Google Scholar] [CrossRef] [Green Version]
  9. Kang, S.; Guo, W.; Wu, T.; Zhong, X.; Chen, R.; Xu, M.; Chen, J.; Yang, R. Cryospheric Changes and Their Impacts onWater Resources in the Belt and Road Regions. Adv. Earth Sci. 2020, 35, 1–17. [Google Scholar]
  10. Wu, X.; Hao, Z.; Tang, Q.; Singh, V.P.; Zhang, X.; Hao, F. Projected increase in compound dry and hot events over global land areas. Int. J. Climatol. 2021, 41, 393–403. [Google Scholar] [CrossRef]
  11. Wang, B.L.; French, H.M. Climate controls and high-altitude permafrost, Qinghai-Xizang (Tibet) Plateau, China. Permafr. Periglac. Processes 1994, 5, 87–100. [Google Scholar] [CrossRef]
  12. Liao, C.; Zhuang, Q. Quantifying the Role of Snowmelt in Stream Discharge in an Alaskan Watershed: An Analysis Using a Spatially Distributed Surface Hydrology Model. J. Geophys. Res.-Earth Surf. 2017, 122, 2183–2195. [Google Scholar] [CrossRef]
  13. Wang, T.; Yang, D.; Yang, Y.; Piao, S.; Li, X.; Cheng, G.; Fu, B. Permafrost thawing puts the frozen carbon at risk over the Tibetan Plateau. Sci. Adv. 2020, 6, eaaz3513. [Google Scholar] [CrossRef] [PubMed]
  14. You, Q.; Wu, T.; Shen, L.; Pepin, N.; Zhang, L.; Jiang, Z.; Wu, Z.; Kang, S.; AghaKouchak, A. Review of snow cover variation over the Tibetan Plateau and its influence on the broad climate system. Earth Sci. Rev. 2020, 201, 103043. [Google Scholar] [CrossRef]
  15. Zhang, G.; Yao, T.; Shum, C.K.; Yi, S.; Yang, K.; Xie, H.; Feng, W.; Bolch, T.; Wang, L.; Behrangi, A.; et al. Lake volume and groundwater storage variations in Tibetan Plateau’s endorheic basin. Geophys. Res. Lett. 2017, 44, 5550–5560. [Google Scholar] [CrossRef]
  16. Ma, R.; Yang, G.; Duan, H.; Jiang, J.; Wang, S.; Feng, X.; Li, A.; Kong, F.; Xue, B.; Wu, J.; et al. China’s lakes at present: Number, area and spatial distribution. Sci. China-Earth Sci. 2011, 54, 283–289. [Google Scholar] [CrossRef]
  17. Chen, G.; Zhao, L. The problems associated with permafrost in the development of the Qinghai-Xizang plateau. Quat. Sci. 2000, 20, 521. [Google Scholar]
  18. Chen, D.; Xu, B.; Yao, T.; Guo, Z.; Cui, P.; Chen, F.; Zhang, R.; Zhang, X.; Zhang, Y.; Fan, J.; et al. Assessment of past, present and future environmental changes on the Tibetan Plateau. Chin. Sci. Bull. 2015, 60, 3025–3035. [Google Scholar]
  19. Chen, F.; Wang, Y.; Zhen, X.; Sun, J. Environmental impacts and response strategies on the Qinghai-Tibet Plateau under global change. China Tibetol. 2021, 4, 21–28. [Google Scholar]
  20. Zhang, G.; Li, J.; Zheng, G. Lake-area mapping in the Tibetan Plateau: An evaluation of data and methods. Int. J. Remote Sens. 2017, 38, 742–772. [Google Scholar] [CrossRef]
  21. Wang, H.; Ma, M.; Geng, L. Monitoring the recent trend of aeolian desertification using Landsat TM and Landsat 8 imagery on the north-east Qinghai-Tibet Plateau in the Qinghai Lake basin. Nat. Hazards 2015, 79, 1753–1772. [Google Scholar] [CrossRef]
  22. Liu, B.; Li, L.; Du Yu, E.; Liang, T.; Duan, S.; Hou, F.; Ren, J. Causes of the outburst of Zonag Lake in Hoh Xil, Tibetan Plateau, and its impact on surrounding environment. J. Glaciol. Geocryol. 2016, 38, 305–311. [Google Scholar]
  23. Wang, X.; Jin, R.; Lin, J.; Zeng, X.; Zhao, Z. Automatic Algorithm for Extracting Lake Boundaries in Qinghai- Tibet Plateau based on Cloudy Landsat TM/OLI Image and DEM. Remote Sens. Technol. Appl. 2020, 35, 882–892. [Google Scholar]
  24. Zhang, G.; Luo, W.; Chen, W.; Zheng, G. A robust but variable lake expansion on the Tibetan Plateau. Sci. Bull. 2019, 64, 1306–1309. [Google Scholar] [CrossRef] [Green Version]
  25. Luo, D.L.; Jin, H.J.; Du, H.Q.; Li, C.; Ma, Q.; Duan, S.Q.; Li, G.S. Variation of alpine lakes from 1986 to 2019 in the Headwater Area of the Yellow River, Tibetan Plateau using Google Earth Engine. Adv. Clim. Chang. Res. 2020, 11, 11–21. [Google Scholar] [CrossRef]
  26. Liu, W.; Xie, C.; Wang, W.; Yang, G.; Zhang, Y.; Wu, T.; Liu, G.; Pang, Q.; Zou, D.; Liu, H. The Impact of Permafrost Degradation on Lake Changes in the Endorheic Basin on the Qinghai-Tibet Plateau. Water 2020, 12, 1287. [Google Scholar] [CrossRef]
  27. Zhang, Y.S.; Ohata, T.; Kadota, T. Land-surface hydrological processes in the permafrost region of the eastern Tibetan Plateau. J. Hydrol. 2003, 283, 41–56. [Google Scholar] [CrossRef]
  28. Yao, T.; Thompson, L.; Yang, W.; Yu, W.; Gao, Y.; Guo, X.; Yang, X.; Duan, K.; Zhao, H.; Xu, B.; et al. Different glacier status with atmospheric circulations in Tibetan Plateau and surroundings. Nat. Clim. Chang. 2012, 2, 663–667. [Google Scholar] [CrossRef]
  29. Zhang, G.; Bolch, T.; Chen, W.; Cretaux, J.-F. Comprehensive estimation of lake volume changes on the Tibetan Plateau during 1976-2019 and basin-wide glacier contribution. Sci. Total Environ. 2021, 772, 145463. [Google Scholar] [CrossRef]
  30. Cheng, G.; Jin, H. Groundwater in the permafrost regions on the Qinghai-Tibet Plateau and it changes. Hydrogeol. Eng. Geol. 2013, 40, 1–11. [Google Scholar]
  31. Luo, D.; Jin, H.; Bense, V.F.; Jin, X.; Li, X. Hydrothermal processes of near-surface warm permafrost in response to strong precipitation events in the Headwater Area of the Yellow River, Tibetan Plateau. Geoderma 2020, 376, 114531. [Google Scholar] [CrossRef]
  32. Yao, X.; Liu, S.; Sun, M.; Guo, W.; Zhang, X. Changes of Kusai Lake in Hoh Xil Region and Causes of Its Water Overflowing. Acta Geogr. Sin. 2012, 67, 689–698. [Google Scholar]
  33. Zhang, Y.; Xie, C.; Zhao, L.; Wu, T.; Pang, Q.; Liu, G.; Wang, W.; Liu, W. The formation of permafrost in the bottom of the Zonag Lake in Hoh Xil on the Qinghai-Tibet Plateau after an outburst: Monitoring and simulation. J. Glaciol. Geocryol. 2017, 39, 949–956. [Google Scholar]
  34. Du, Y.e.; Liu, B.; He, W.; Duan, S.; Hou, F.; Wang, Z. Dynamic change and cause analysis of Salt Lake area in Hoh Xil on Qinghai-Tibet Plateau during 1976–2017. J. Glaciol. Geocryol. 2018, 40, 47–54. [Google Scholar]
  35. Liu, W.h.; Xie, C.w.; Zhao, L.; Wu, T.h.; Wang, W.; Zhang, Y.x.; Yang, G.q.; Zhu, X.f.; Yue, G.y. Dynamic changes in lakes in the Hoh Xil region before and after the 2011 outburst of Zonag Lake. J. Mt. Sci. 2019, 16, 1098–1110. [Google Scholar] [CrossRef]
  36. Lu, P.; Han, J.; Li, Z.; Xu, R.; Li, R.; Hao, T.; Qiao, G. Lake outburst accelerated permafrost degradation on Qinghai-Tibet Plateau. Remote Sens. Environ. 2020, 249, 112011. [Google Scholar] [CrossRef]
  37. Xie, C.; Zhang, Y.; Liu, W.; Wu, J.; Yang, G.; Wang, W.; Liu, G. Environmental changes caused by the outburst of Zonag Lake and the possible outburst mode of Yanhu Lake in the Hoh Xil region. J. Glaciol. Geocryol. 2020, 42, 1344–1352. [Google Scholar]
  38. Yao, X.; Sun, M.; Gong, P.; Liu, B.; Li, X.; An, L.; Ma, C. Overflow probability of the Salt Lake in Hoh Xil Region. Acta Geogr. Sin. 2016, 71, 1520–1527. [Google Scholar] [CrossRef] [Green Version]
  39. Zhang, G.; Chen, W.; Xie, H. Tibetan Plateau’s Lake Level and Volume Changes from NASA’s ICESat/ICESat-2 and Landsat Missions. Geophys. Res. Lett. 2019, 46, 13107–13118. [Google Scholar] [CrossRef]
  40. Zhang, G.; Ran, Y.; Wan, W.; Luo, W.; Chen, W.; Xu, F.; Li, X. 100 years of lake evolution over the Qinghai-Tibet Plateau. Earth Syst. Sci. Data 2021, 13, 3951–3966. [Google Scholar] [CrossRef]
  41. Li, H.; Mao, D.; Li, X.; Wang, Z.; Wang, C. Monitoring 40-Year Lake Area Changes of the Qaidam Basin, Tibetan Plateau, Using Landsat Time Series. Remote Sens. 2019, 11, 343. [Google Scholar] [CrossRef] [Green Version]
  42. Sha, J. Characteristics of stratigraphy and palaeontology of HohXil, Qinghai: Geographic significance. Acta Palaeontol. Sin. 1998, 37, 85–96. [Google Scholar]
  43. Shude, L.; Shijie, L. Permafrost and Periglacial Landforms in Kekexili Area of Qinghai Province. J. Glaciol. Geocryol. 1993, 15, 77–82. [Google Scholar]
  44. Chen, Y.; Liu, X.; He, L.; Ye, L.; Chen, H.; Li, K. Micro-Area Analysis and Mechanism of Varves from Lake Kusai in the Hoh Xil Area, Northern Tibetan Plateau. Acta Geol. Sin. 2016, 90, 1006–1015. [Google Scholar]
  45. Markham, B.L.; Storey, J.C.; Williams, D.L.; Irons, J.R. Landsat sensor performance: History and current status. IEEE Trans. Geosci. Remote Sens. 2004, 42, 2691–2694. [Google Scholar] [CrossRef]
  46. Pekel, J.-F.; Cottam, A.; Gorelick, N.; Belward, A.S. High-resolution mapping of global surface water and its long-term changes. Nature 2016, 540, 418–422. [Google Scholar] [CrossRef]
  47. Gao, B.C. NDWI—A normalized difference water index for remote sensing of vegetation liquid water from space. Remote Sens. Environ. 1996, 58, 257–266. [Google Scholar] [CrossRef]
  48. McFeeters, S.K. The use of the normalized difference water index (NDWI) in the delineation of open water features. Int. J. Remote Sens. 1996, 17, 1425–1432. [Google Scholar] [CrossRef]
  49. Xu, H. Modification of normalised difference water index (NDWI) to enhance open water features in remotely sensed imagery. Int. J. Remote Sens. 2006, 27, 3025–3033. [Google Scholar] [CrossRef]
  50. Pci, Y.A.N.; Youjing, Z.; Yuan, Z. A Study on Information Extraction of Water Enhanced Water Index (EWI) and GIS System in Semi-arid Regions with the Based Noise Remove Techniques. Remote Sens. Inf. 2007, 6, 62–67. [Google Scholar]
  51. Feng, D. Study on information extraction of water body with a new water index (NWI). Sci. Surv. Mapp. 2009, 34, 155–157. [Google Scholar]
  52. Zhang, G.; Yao, T.; Xie, H.; Zhang, K.; Zhu, F. Lakes’ state and abundance across the Tibetan Plateau. Chin. Sci. Bull. 2014, 59, 3010–3021. [Google Scholar] [CrossRef]
  53. Song, C.; Huang, B.; Richards, K.; Ke, L.; Vu Hien, P. Accelerated lake expansion on the Tibetan Plateau in the 2000s: Induced by glacial melting or other processes? Water Resour. Res. 2014, 50, 3170–3186. [Google Scholar] [CrossRef] [Green Version]
  54. Zhang, G.; Yao, T.; Piao, S.; Bolch, T.; Xie, H.; Chen, D.; Gao, Y.; O’Reilly, C.M.; Shum, C.K.; Yang, K.; et al. Extensive and drastically different alpine lake changes on Asia’s high plateaus during the past four decades. Geophys. Res. Lett. 2017, 44, 252–260. [Google Scholar] [CrossRef] [Green Version]
  55. Yang, K.; Lu, H.; Yue, S.Y.; Zhang, G.Q.; Lei, Y.B.; La, Z.; Wang, W. Quantifying recent precipitation change and predicting lake expansion in the Inner Tibetan Plateau. Clim. Chang. 2018, 147, 149–163. [Google Scholar] [CrossRef]
  56. Qiao, B.; Zhu, L.; Yang, R. Temporal-spatial differences in lake water storage changes and their links to climate change throughout the Tibetan Plateau. Remote Sens. Environ. 2019, 222, 232–243. [Google Scholar] [CrossRef]
  57. Zhao, L.; Ding, Y.J.; Liu, G.Y.; Wang, S.L.; Jin, H.J. Estimates of the Reserves of Ground Ice in Permafrost Regions on the Tibetan Plateau. J. Glaciol. Geocryol. 2010, 32, 1–9. [Google Scholar]
  58. Wang, S.; Sheng, Y.; Cao, W.; Li, J.; Ma, S.; Hu, X. Estimation of permafrost ice reserves in the source area of the Yellow River using landform classification. Adv. Water Sci. 2017, 28, 801–810. [Google Scholar]
  59. Wang, S.; Sheng, Y.; Wu, J.; Li, J.; Huang, L. Based on geomorphic classification to estimate the permafrost ground ice reserves in the source area of the Datong River, Qilian Mountains. J. Glaciol. Geocryol. 2020, 42, 1186–1194. [Google Scholar]
  60. Yang, Y.Z.; Wu, Q.B.; Zhang, P.; Jiang, G.L. Stable isotopic evolutions of ground ice in permafrost of the Hoh Xil regions on the Qinghai-Tibet Plateau. Quat. Int. 2017, 444, 182–190. [Google Scholar] [CrossRef]
  61. Smith, L.C.; Sheng, Y.; MacDonald, G.M.; Hinzman, L.D. Disappearing Arctic lakes. Science 2005, 308, 1429. [Google Scholar] [CrossRef] [PubMed] [Green Version]
  62. Yoshikawa, K.; Hinzman, L.D. Shrinking thermokarst ponds and groundwater dynamics in discontinuous permafrost near Council, Alaska. Permafr. Periglac. Processes 2003, 14, 151–160. [Google Scholar] [CrossRef]
  63. Riordan, B.; Verbyla, D.; McGuire, A.D. Shrinking ponds in subarctic Alaska based on 1950-2002 remotely sensed images. J. Geophys. Res. Biogeosci. 2006, 111. [Google Scholar] [CrossRef]
  64. Mu, Y.; Ma, W.; Li, G.; Niu, F.; Liu, Y.; Mao, Y. Impacts of supra-permafrost water ponding and drainage on a railway embankment in continuous permafrost zone, the interior of the Qinghai-Tibet Plateau. Cold Reg. Sci. Technol. 2018, 154, 23–31. [Google Scholar] [CrossRef]
  65. Lin, Z.; Niu, F.; Luo, J.; Liu, M.; Yin, G. Thermal Regime at Bottom of Thermokarst Lakes along Qinghai-Tibet Engineering Corridor. Earth Sci. 2015, 40, 179–188. [Google Scholar]
  66. Wen, Z.; Zhelezniak, M.; Wang, D.; Ma, W.; Wu, Q.; Zhirkov, Z.A.; Gao, Q. Thermal interaction between a thermokarst lake and a nearby embankment in permafrost regions. Cold Reg. Sci. Technol. 2018, 155, 214–224. [Google Scholar] [CrossRef]
Figure 1. Overview of the study area: (a) the permafrost on the TP; (b) the topography and lake distribution of the study area.
Remotesensing 14 02918 g001
Figure 2. Comparison of several water body indices around Zonag Lake: (a) Selection of different features and (b) comparison of different water index.
Remotesensing 14 02918 g002
Figure 3. Flowchart of the acquisition of water body changes and impacts of lake outburst on adjacent lake on ZSLB.
Remotesensing 14 02918 g003
Figure 4. Total surface water area in the ZSLB from 2000 to 2020.
Remotesensing 14 02918 g004
Figure 5. Areas of four lakes in ZSLB between 2000 and 2020.
Remotesensing 14 02918 g005
Figure 6. Changes in shorelines in 2000, 2010, 2012 and 2019 of the (a) Zoang Lake; (b) Kusai Lake; (c) Haidingnor Lake and (d) Salt Lake.
Remotesensing 14 02918 g006
Figure 7. Mass changes of (a) Zonag Lake; (b) Kusai Lake; (c) Haidingnor Lake; and (d) Salt Lake between 1976 and 2019.
Remotesensing 14 02918 g007
Figure 8. The EWI results of hydraulic connection in ZSLB (2013).
Remotesensing 14 02918 g008
Figure 9. The EWI results of hydraulic connection between 2000 and 2020: (a) region between Kusai Lake and Haidingnor Lake; (b) region between Haidingnor and Salt Lake.
Remotesensing 14 02918 g009
Figure 10. Number of small lakes and ponds in ZSLB during the period from 2000 to 2020.
Remotesensing 14 02918 g010
Figure 11. The mean annual air temperature and annual precipitation at Wudaoliang meteorological station.
Remotesensing 14 02918 g011
Figure 12. Ground temperature around (a) Zonag Lake (from Liu. et al. [35]) and (b) Salt Lake.
Remotesensing 14 02918 g012
Figure 13. Changes of lakes in (a) continuous permafrost region and (b) discontinuous permafrost.
Remotesensing 14 02918 g013
Figure 14. Countermeasures used by the (a) highway and (b) railway downstream to cope with flowing water drained from Salt Lake.
Remotesensing 14 02918 g014
Table 1. Main parameters of the Landsat sensors.
Landsat-5 TMLandsat-7 ETM+Landsat-8 OLI
BandsWavelength
(μm)
Resolution
(m)
BandsWavelength
(μm)
Resolution
(m)
BandsWavelength
(μm)
Resolution
(m)
1-Blue0.45–0.52301-Blue0.45–0.52301-Coastal aerosol0.43–0.4530
2-Green0.52–0.60302-Green0.52–0.60302-Blue0.45–0.5130
3-Red0.63–0.69303-Red0.63–0.69303-Green0.53–0.5930
4-NIR 10.76–0.90304-NIR0.77–0.90304-Red0.64–0.6730
5-SWIR1 21.55–1.75305-SWIR11.55–1.75305-NIR0.85–0.8830
6-Thermal10.40–12.51206-Thermal10.40–12.5606-SWIR11.57–1.6530
7-SWIR22.08–2.35307-SWIR22.08–2.35307-SWIR22.11–2.2930
8-Panchromatic0.52–0.9158-Panchromatic0.50–0.6815
9-Cirrus1.36–1.3830
1 NIR—near infrared; 2 SWIR—short-wave infrared.
Table 2. Required bands and the equation of each water indices.
TM/ETM+ BandsOLI BandsEquations
NDWIb2, b4b3, b5 N D W I = ρ G r e e n ρ N I R ρ G r e e n + ρ N I R
MNDWIb2, b5b3, b6 M N D W I = ρ G r e e n ρ S W I R 1 ρ G r e e n + ρ S W I R 1
EWIb2, b4, b5b2, b4, b6 E W I = ρ G r e e n ( ρ N I R + ρ S W I R 1 ) ρ G r e e n + ( ρ N I R + ρ S W I R 1 )
NWIb1, b4, b5, b7b2, b5, b6, b7 N W I = ρ B l u e ( ρ N I R + ρ S W I R 1 + ρ S W I R 2 ) ρ B l u e + ( ρ N I R + ρ S W I R 1 + ρ S W I R 2 )
ρ G r e e n : the reflectance of the green band; ρ b l u e : the reflectance of the blue band; ρ N I R : the reflectance of the near-infrared radiation; ρ S W I R 1 and ρ S W I R 2 : the reflectance of the blue band short wavelength infrared radiation.
Table 3. Numerical value of different features selected.
PointsNDWIMNDWIEWINWIPointsNDWIMNDWIEWINWI
LK 110.8320.8930.7420.672R 31−0.010.025−0.327−0.563
LK20.7850.8570.670.569R20.3460.4410.067−0.281
LK30.7040.7970.5540.473R30.061−0.088−0.35−0.629
LK40.410.4930.1380.004R40.0770.062−0.27−0.503
LK50.5770.6630.360.03R5−0.119−0.194−0.467−0.692
Average0.6620.7410.4930.35Average0.0710.049−0.269−0.534
LD 21−0.295 −0.345 −0.591 −0.792 W 41−0.150 −0.185 −0.475 −0.715
LD2−0.288 −0.361 −0.595 −0.794 W2−0.233 −0.180 −0.506 −0.712
LD3−0.211 −0.215 −0.510 −0.700 W3−0.246 −0.281 −0.549 −0.767
LD4−0.189 −0.261 −0.521 −0.729 W4−0.161 −0.085 −0.440 −0.630
LD5−0.167 −0.250 −0.508 −0.732 W5−0.125 −0.199 −0.471 −0.714
Average−0.230 −0.286 −0.545 −0.749 Average−0.183 −0.186 −0.488 −0.708
1 LK—lake points; 2 LD—land points; 3 R—river points; 4 W—wetland points.
Publisher’s Note: MDPI stays neutral with regard to jurisdictional claims in published maps and institutional affiliations.