Article

Introducing Two Fixed Platforms in the Yellow Sea and East China Sea Supporting Long-Term Satellite Ocean Color Validation: Preliminary Data and Results

1
National Satellite Ocean Application Service, Ministry of Natural Resources of the People’s Republic of China, Beijing 100081, China
2
Key Laboratory of Space Ocean Remote Sensing and Application, Ministry of Natural Resources of the People’s Republic of China, Beijing 100081, China
3
College of Marine Technology, Ocean University of China, Qingdao 266100, China
4
Sanya Oceanographic Institution, Ocean University of China, Sanya 572024, China
5
Laboratory for Regional Oceanography and Numerical Modeling, Pilot National Laboratory for Marine Science and Technology (Qingdao), Qingdao 266237, China
*
Author to whom correspondence should be addressed.
Remote Sens. 2022, 14(12), 2894; https://doi.org/10.3390/rs14122894
Submission received: 8 May 2022 / Revised: 11 June 2022 / Accepted: 14 June 2022 / Published: 17 June 2022
(This article belongs to the Section Ocean Remote Sensing)

Abstract

:
Following the Aerosol Robotic Network-Ocean Color (AERONET-OC) network scheme and instrument deployment protocols, two fixed platforms (Muping and Dong’ou) in the Yellow Sea and East China Sea were implemented with the support of the China National Satellite Ocean Application Service. Optical radiometry instruments were established at the two sites to autonomously determine remote sensing reflectance (Rrs) and aerosol optical depth (AOD). Details about location selection, platform design, instrument deployment, and the associated data processing procedure are reported in this study. Rrs and AOD measured by independent instruments at the Muping site were compared and results showed that they were consistent, with a median relative percentage difference (MRPD) < 0.6% for AOD and <10% for Rrs. The spectral feature and temporal pattern of Rrs and AOD at the two sites were examined and compared with data from 14 AERONET-OC sites. Rrs and AOD data measured at the two sites were used to evaluate ocean color operational products of MODIS/Aqua (MODISA), OLCI/Sentinel-3A (OLCI-3A), and OLCI/Sentinel-3B (OLCI-3B). Comparison showed that the three satellite sensor-derived Rrs agreed well with in situ measurements, with an MRPD < 25% for MODISA, <30% for OLCI-3A, and <40% for OLCI-3B, respectively. Large uncertainties were observed in the blue bands for the three satellite sensors, particularly for OLCI-3B at 400 nm. AOD at 865 nm derived from the three satellite sensors also agreed well with in situ measurements, with an MRPD of 28.1% for MODISA, 30.6% for OLCI-3A, and 39.9% for OLCI-3B. Two commonly used atmospheric correction (AC) processors, the ACOLITE and SeaDAS, were also evaluated using in situ measurements at two sites and 20 m-resolution MSI/Sentinel-2A data. Close agreements were achieved for both AC processors, while the SeaDAS performed slightly better than ACOLITE. The optimal band selection in the AC models embedded in two AC processors was a combination of one near-infrared and one short-wave infrared band such as 865 and 1609 nm, shedding light on MSI data applications in the aquatic environment.

Graphical Abstract

1. Introduction

Ocean color radiometry is an essential ocean variable and essential climate variable, as defined by the Global Climate Observing System. The color of the ocean contains information about water and its constituents, and helps evaluate the health of an ecosystem, water quality, and algal blooms [1,2,3,4,5]. To efficiently use ocean color data, it is critical to understand the limitations and uncertainties of ocean color products, such as remote sensing reflectance (Rrs, ratio of upwelling radiance to downwelling irradiance just above the sea surface). For Rrs in oligotrophic waters, an uncertainty of less than 5% was achieved by implementing a system vicarious calibration process with high-quality in situ measurements made by marine optical buoy (MOBY) off the coast of Lanai, Hawaii [6,7,8]. However, larger uncertainty was observed in coastal waters [9,10,11], where the optical properties of water and aerosols were influenced by river discharges and human activities that varied with the MOBY site. To ensure climate-quality products and consistent data records, ocean color products, particularly in coastal waters, need to be routinely validated against in situ observations.
Substantial efforts have been made to validate on-orbit ocean color sensors using high-quality in situ data. For example, one of the goals of the Sensor Inter-comparison and Merger for Biological and Interdisciplinary Oceanic Studies program, initially launched in 1997, was to validate the accuracy of the products from the Sea-viewing Wide Field-of-view Sensor (SeaWiFS) and Moderate Resolution Imaging Spectroradiometer (MODIS) missions at a global scale [12]. To facilitate the assembly of a global in situ dataset, the SeaWiFS Bio-optical Archive and Storage System (SeaBASS) was developed to provide a local repository of in situ data regularly used in ocean communities [13]. These in situ data are commonly collected during research cruises [14,15]. However, the match-ups between the in situ measurements and satellite products are usually limited, primarily due to cloud cover. In 2002, the Aerosol Robotic Network-Ocean Color (AERONET-OC) project was established to support long-term validation of satellite ocean color products through accurate in situ measurements collected by autonomous radiometer systems deployed on offshore fixed platforms [16,17]. By 2006, six AERONET-OC sites were deployed along the Atlantic coast of the United States of America, Adriatic Sea, Baltic proper, Persian Gulf, and Gulf of Finland (blue dots in Figure 1). The network had expanded to 32 sites by the end of 2020, encompassing more distinct coastal waters (blue and red dots in Figure 1). The Yellow Sea (YS) and East China Sea (ECS) are two marginal seas off the coast of China and their optical properties are largely influenced by the discharge of large rivers and seasonal monsoons [18,19]. For example, the Yangtze River delivers approximately 400 million tons of sediment to the estuary annually, forming turbid plumes and extending to the center of the ECS [19,20]. The concentration of total suspended matter (TSM) varies from less than 1 mg/L offshore to more than 100 mg/L in nearshore waters in the ECS [21]. Driven by the northeast monsoon in the winter and southeast monsoon in the summer, TSM concentrations showed seasonal variations, as observed by satellite [22]. The special features of the ECS and YS require the fixed sites to continually collect in situ data to routinely validate the satellite ocean color data products.
Aiming to establish validation capabilities in novel regional seas complementary to those currently included in AERONET-OC, the China National Satellite Ocean Application Service (NSOAS) is scheduled to deploy 10 AERONET-OC type sites along the coast of China (Figure 2a). Two sites in the YS and ECS, i.e., the Muping and Dong’ou sites (black dots in Figure 2a), have been completed and the other eight sites are under construction. Note that the Muping and Dong’ou sites currently are not included in the AERONET-OC network, but follow the requirements of AERONET-OC site selection and instrument deployment. When instrument deployments at all sites are completed and the data are well evaluated, we intend to integrate them or parts of them into the AERONET-OC network. The objectives of this study are four-fold: (1) introduce two fixed sites in the YS and ECS supporting long-term satellite ocean color data validation; (2) highlight spectral feature and temporal patterns of optical properties of atmosphere and water in coastal waters of China; (3) validate operational ocean color data products; and (4) evaluate the performance of two atmospheric correction software packages using high spatial resolution data.

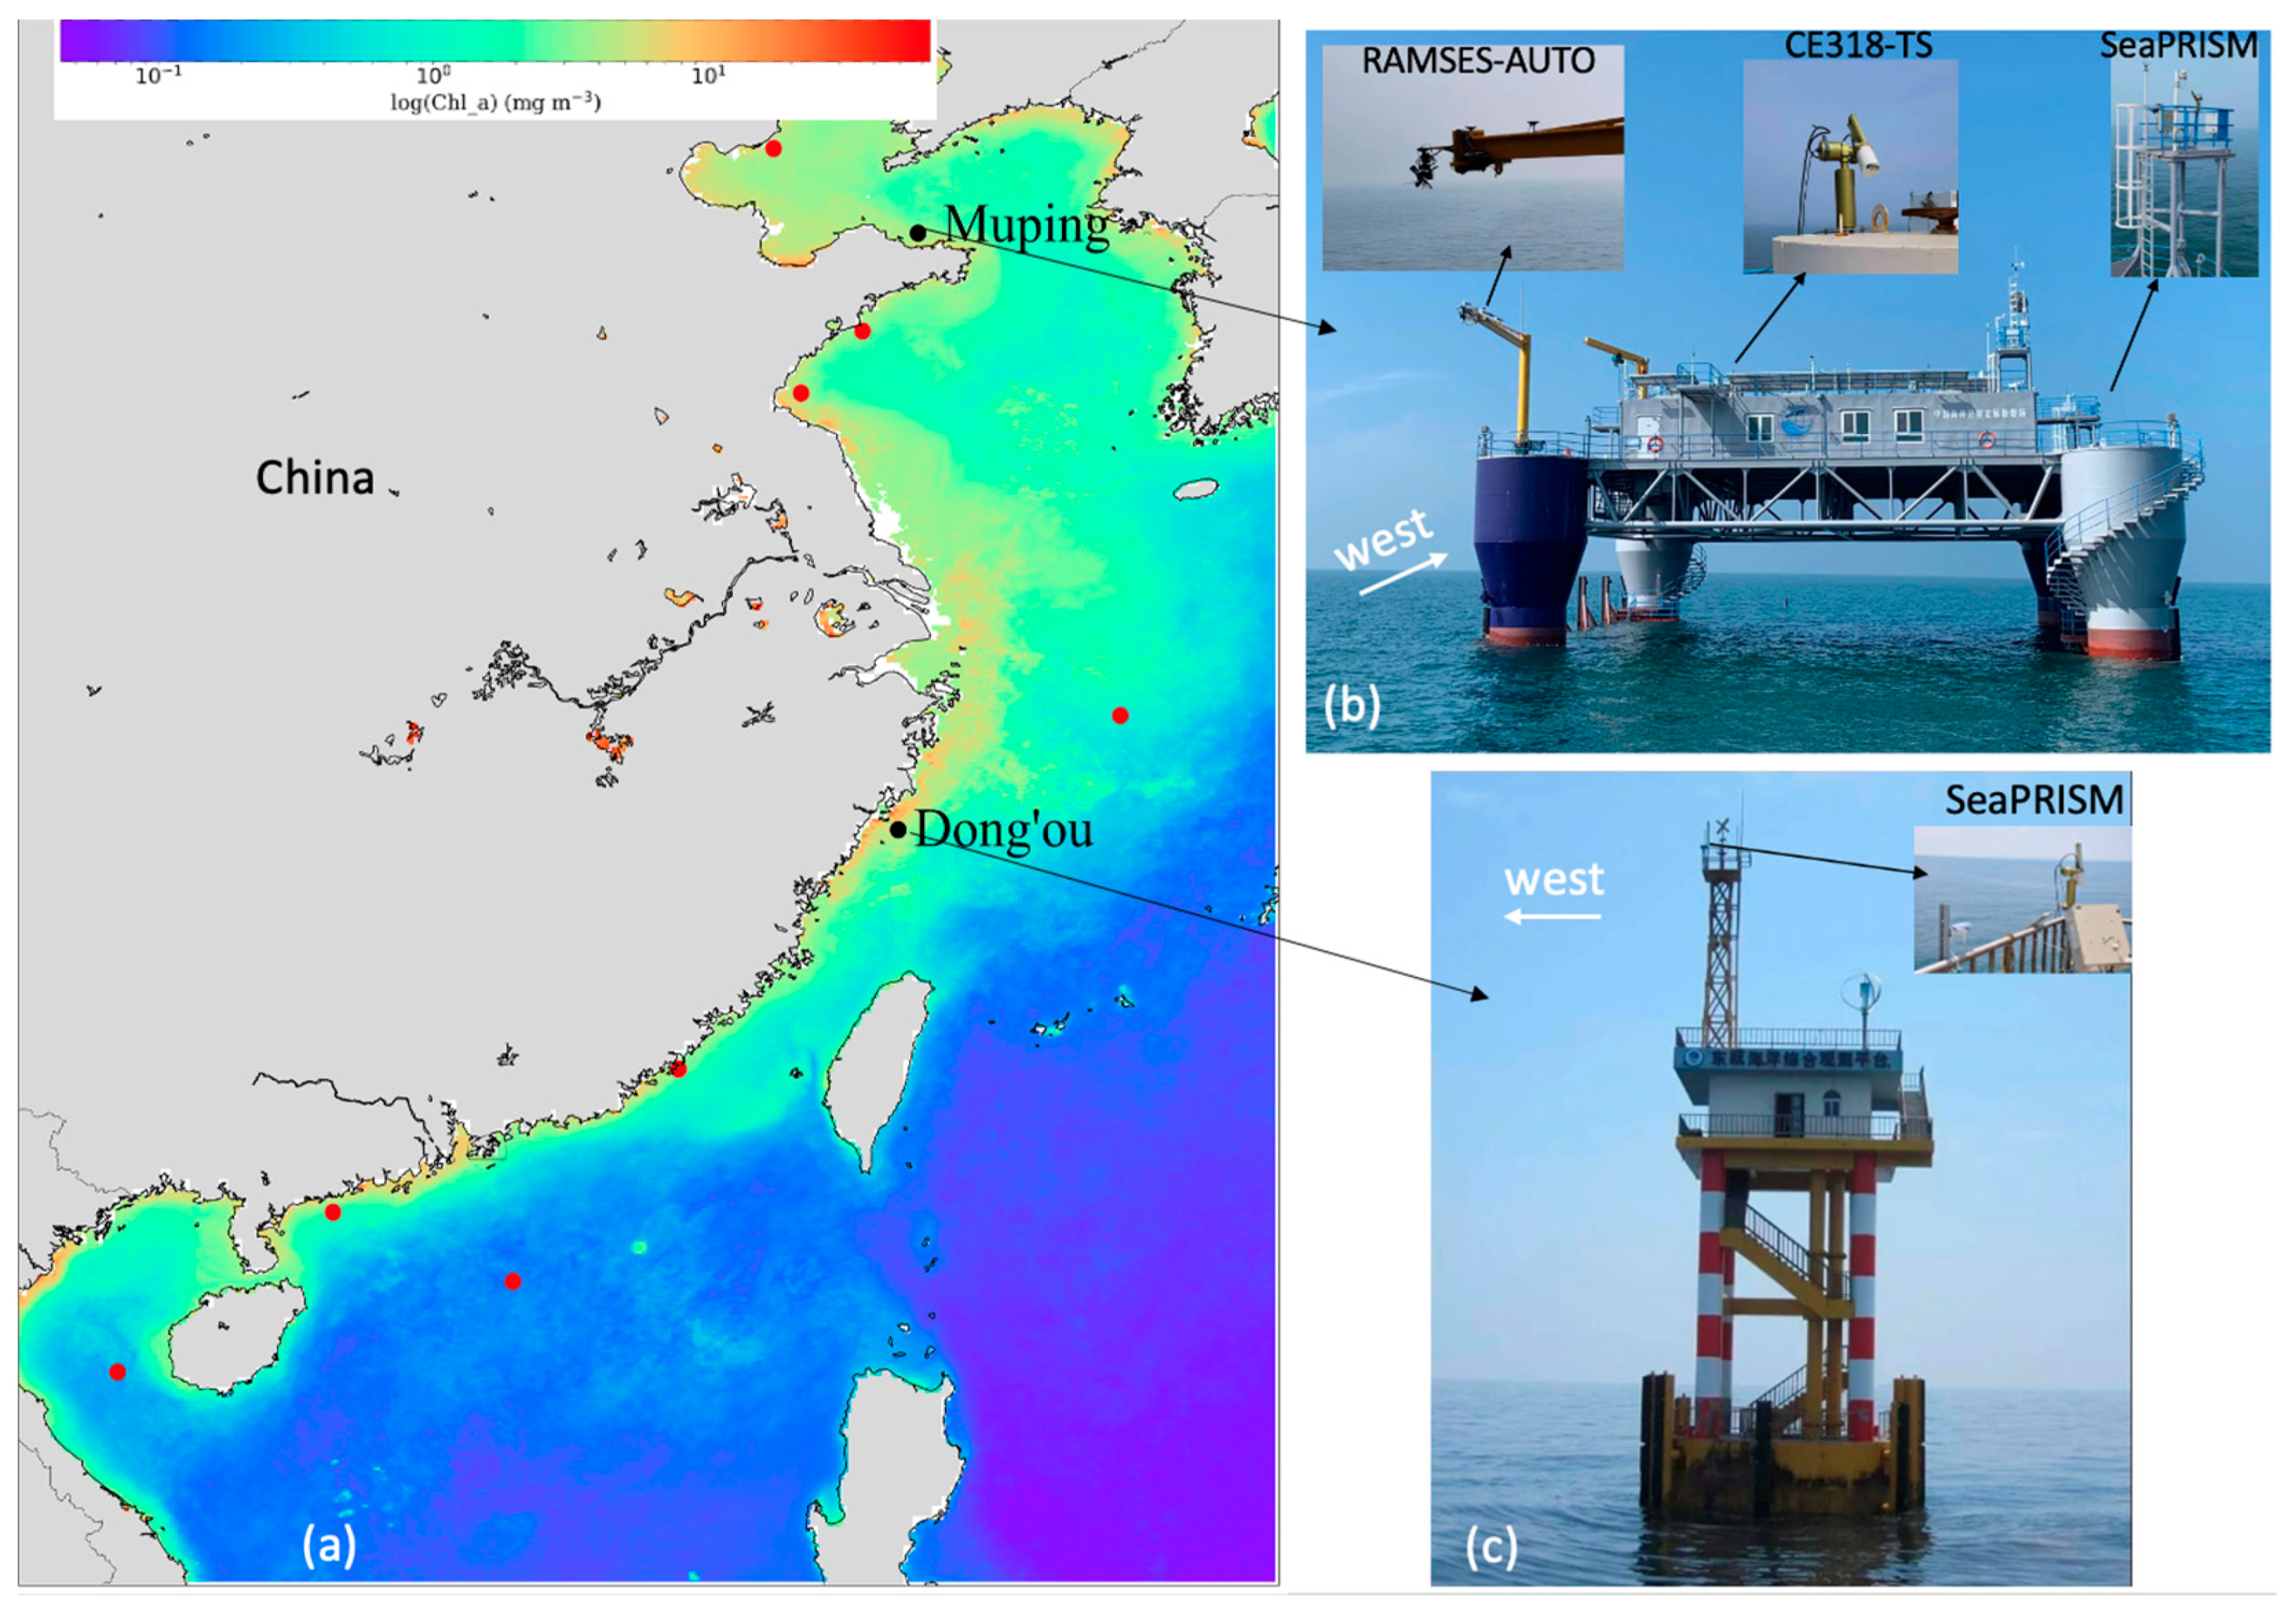
2. Location Selection, Platform Design, and Instrument Deployment

The location selection for a fixed platform is constrained by factors that minimize the potential effects of the platform and the surrounding environment on the measurements to obtain high-quality in situ data. Zibordi et al. [17] listed specific requirements for AERONET-OC site selection and instrument deployment: (i) distance between the location and the mainland should be greater than 5–10 nautical miles (approximately 10–20 km) to minimize the adjacency effects resulting from the difference in reflectance between the surface of the mainland and the water body; (ii) water should be optically deep to avoid the effect of the water bottom on the water leaving radiance; (iii) water should be spatially relatively homogenous to minimize the patchy effects when validating satellite data; (iv) the platform should be a grounded structure allowing for accurate sun-tracking during direct sun radiance measurement; and (v) the platform should have a certain height to minimize contamination from sea spray. The same requirements were followed by NSOAS to determine the appropriate locations and platforms in the YS and ECS. Two fixed sites (i.e., Muping and Dong’ou) were selected by NSOAS to represent the coastal waters in the YS and ECS (Figure 2a). The parameters of the Muping and Dong’ou sites are listed in Table 1. Both sites are >20 km away from the coast of the mainland and have a water depth > 18 m. The absorption and backscattering coefficients were measured by ACS and BB9 (Sea-Bird Scientific, Washington, DC, USA) at two sites (Figure 3) to examine the bottom contribution. In both sites, the water transmittance window is around 560 nm, with an attenuation coefficient of about 0.2 m−1 for the Muping site and 0.6 m−1 for the Dong’ou site. The bottom contribution can be estimated using the semi-analytical model [23] with in situ-measured absorption and backscattering coefficients, water depth, and bottom type (dark mud). The estimated bottom contribution to Rrs is <10−3 in the Muping site and <10−17 in the Dong’ou site. Thereby, waters at both sites can be safely regarded as optically deep.
The Muping site was specifically designed and built to validate ocean satellite data, with a size of 25 × 25 m and a height of 7 m above the sea surface (Figure 2b). The platform is tightly attached to four anchors under the sea bottom to ensure that it remains stable. The pitch and roll angles of the platform were measured with maximum tilt of about 5° in extreme conditions, such as wave height > 5 m or wind speed > 30 m/s, and were <1° in most cases. In the following data processing procedure, measurements under high wind speed (>15 m/s) will be automatically ruled out and therefore the tilt of the platform has no impacts on further data analysis. The platform at the Dong’ou site is a 10 m-heigh marine observatory, initially designed to measure meteorological and marine dynamic parameters such as water temperature and salinity (Figure 2c).
The main optical instruments deployed at the Muping site include two CE318-T radiometers (CE318-TS and CE318-TV12-OC) manufactured by Cimel Electronique (Paris, France) and three hyperspectral RAMSES radiometers developed by TriOS Mess-und Datentechnik GmbH (Rastede, Germany). The CE318-TS is a nine-channel radiometer only for atmospheric measurements [24], while the CE318-TV12-OC is a modified twelve-channel version with capability for above-water measurements specialized for marine/lake measurements [25,26], which is also called SeaPRISM. The CE318-TS was deployed on the top level of the platform to avoid perturbation by superstructures. On 10 June 2020, the CE318-TS was replaced by a SeaPRISM with serial number (SN) 1590, but the sea water measurement ability was disabled and the instrument functioned as a CE318-TS. Another SeaPRISM with SN 1589 was deployed on a specifically built steel structure with a height of 13 m above sea surface to measure the above-water radiance from sea [27]. The specific steel structure was located in the uppermost western part of the platform following the instructions of the AERONET-OC site instrument deployment (Figure 2b). To avoid ambiguity, we differentiate the SeaPRISMs with their serial number such as SeaPRISM (1589) and SeaPRISM (1590). Three RAMSES radiometers simultaneously measure the downward irradiance and sky and water radiance in a spectral range of 330 to 900 nm in 1 nm intervals, and were deployed in the eastern part of the platform through a 7 m long steel arm outside the main structure to minimize the perturbation of the platform on radiometric measurements (Figure 2b). The RAMSES radiometers were installed on a customer-developed rotating frame capable of automatically adjusting the azimuth angle relative to the sun position to minimize the reflected sky radiance from the sea surface. The initial relative azimuth angle between the sensors and the sun is calculated from time, location of the site, and the orientation of instrument, and turns 135° relative to the sun by a stepping motor. This autonomous measuring system with RAMSES radiometers is called RAMSES-AUTO in this study. Only one SeaPRISM with SN 1562 was deployed in the uppermost western part of the observation facility in the Dong’ou site in 2018 (Figure 2c). Similarly, SeaPRISM (1562) sequentially measures the direct sun radiance and sky and water radiance for retrieving the AOD and Rrs values.
The CE318-TS, SeaPRISM, and RAMSES-AUTO radiometers were routinely calibrated twice a year. The radiometric calibration of RAMSES-AUTO sensors was performed at the Ocean University of China (OUC) using an integrated sphere (HELIOS USLR-D20F-NDNN, Labsphere Inc., North Sutton, NH, USA) for radiance sensor calibration and a spectral irradiance lamp standard (FEL-C, Optronic Laborites, Orlando, FL, USA) for irradiance sensors calibration. The direct sun radiance channel of CE318-TS and SeaPRISM was calibrated at Mountain Ling with elevation of 2303 m in Beijing by a master CT318 radiometer, which was routinely calibrated at Izana Observatory on the island of Tenerife, Spain, every 3 months. The sky radiance channels of CE318-TS and SeaPRISM were calibrated at OUC using the integrated sphere. No significant changes were found for CE318-TS, SeaPRISM, and RAMSES-AUTO radiometers after the deployment. The updated calibration coefficient was applied to each sensor in the next data processing.
The observation strategy of each instrument at the Muping and Dong’ou sites was scheduled as follows: CE318-TS measurements between 7:00 and 17:00 in 15 min intervals, SeaPRISM measurements between 8:00 and 16:00 every 15 min, and RAMSES-AUTO measurements between 8:00 and 16:00 every 30 min. Note the measurement time of each instrument mentioned in this study is Beijing time (UTC + 8.0). The measurements were saved in the local storage device and transferred to the NSOAS data center through a dedicated network line at the end of each day.

3. Data and Methods

3.1. In Situ Data

In situ data collected at the Muping and Dong’ou site were acquired from NSOAS. The SeaPRISM (1562) started measuring data from 11 September 2019 at the Dong’ou site, and CE318-TS and SeaPRISM (1589) from 1 January 2020 at the Muping site. Direct sun radiance measurements of CE318-TS, SeaPRISM (1589), and SeaPRISM (1590) were processed to determine the total optical depth ( τ ) following the procedure developed by Giles et al. [28]. This procedure, called Version 3 of the AERONET sun-sky radiometer data processing algorithm, provides fully automatic cloud screening and instrument anomaly quality control. It should be noted that τ was only calculated at the center wavelengths of 440, 500, 675, 870, and 1020 nm for CE318-TS and 400, 412, 442, 490, 510, 560, 620, 667, 779, 865, and 1020 nm for SeaPRISM. Data at other wavelengths were either used for ozone (e.g., 340 and 380 nm) or water vapor (e.g., 937 nm) concentration calculation and discarded from further analysis. The AOD ( τ a ) was separated from τ by subtracting the Rayleigh optical depth ( τ r ) [29].
τ a ( λ ) = τ ( λ ) τ r ( λ )
The sky and total water radiance measured by SeaPRISM were further processed to remote sensing reflectance following the method described by Zibordi et al. [16].
R r s ( λ , θ , φ ) = L T ( λ , θ , φ ) ρ ( λ , θ 0 , φ , W ) L i ( λ , θ , φ ) E s ( λ )
where λ is the wavelength; L T and L i are the SeaPRISM-measured total water radiance and sky radiance at the viewing zenith angles θ and θ , respectively; φ is the relative azimuth angle, and ρ is the reflectance of the sea surface, which is a function of the sun zenith angle θ 0 and wind speed W. The value of ρ for each measurement with different observation geometries and wind speeds was interpolated from look-up tables theoretically simulated by Mobley [30]. E s is the downwelling irradiance just above the sea surface and was calculated as follows:
E s ( λ ) = F 0 D 2 c o s θ 0 t d ( λ )
where F0 is the mean extra-atmospheric solar irradiance constant [31] and D accounts for the variation in the sun–earth distance as a function of the day of the year. t d is atmospheric diffuse transmittance and was computed using the following equation [32].
t d ( λ ) = exp [ ( 0.52 τ r ( λ ) + 0.16 τ a ( λ ) ) / c o s θ 0 ]
The R r s ( λ , θ , φ ) computed from Equation (2) depends on sun-sensor viewing geometry and the angular variation (i.e., bidirectional reflectance distribution function, BRDF). BRDF effects have to be removed when comparing with other measurements in different viewing geometries. The BRDF conversion factors were first simulated by Morel and Gentili [33] for optically deep waters with different viewing geometries and chlorophyll concentrations, which were adopted by the SeaWIFS Data Analysis System (SeaDAS) to operationally process ocean color satellite data. However, these conversion factors may not be suitable for turbid coastal water. Subsequently, Lee et al. [34] developed an alternative BRDF correction system based on simulations of oceanic and coastal waters. Briefly, R r s is expressed as a function of inherent optical properties (IOPs) and model parameters (G), which vary with sun-sensor observing geometry ( Ω ), and were pre-calculated and stored in a look-up table (Equation (5)). For a measured R r s , IOPs are first calculated using the quasi-analytical algorithm (QAA) strategy [35] with the parameters G at the given measuring geometry. Then Equation (5) is used to calculate the BRDF-corrected R r s by the derived IOPs and model parameters at the nadir viewing of sun and sensor. As both the Muping and Dong’ou sites are located in coastal waters, the Lee et al. [34] method was applied to correct BRDF effects in this study.
R r s ( λ , Ω ) = G ( λ , Ω ) Fun ( IOP ( Ω ) )
The RAMSES-AUTO also follows the above-water measurement procedure, but directly measures the downwelling irradiance ( E s ). The value of R r s ( λ , θ , φ ) was calculated using Equation (2), followed by the application of the BRDF correction scheme [34] to remove the angular effects.
Quality control is critical for above-water radiance measurements because of possible perturbation of reflected sky or sunlight by the rough sea surface, particularly for SeaPRISM, which performs spectrally asynchronous measurements of the water leaving radiance. In this study, a similar quality-control approach to that suggested by Zibordi et al. [16] was applied to the SeaPRISM sea water radiance measurements to minimize the perturbation of sea surface. Specifically, (i) there are no missing data, (ii) measurements are within the optimal observing geometry, (iii) AOD data are available, (iv) wind speed is lower than 15 m s−1, (v) the average of two lowest radiance measurements is used, and (vi) Rrs (412) < Rrs (443) and Rrs (490) < Rrs (510). Finally, the spectral Rrs was visually examined to further discard the questionable measurements.

3.2. Satellite Data

MODIS/Aqua (MODISA), OLCI/Sentinel-3A (OLCI-3A), and OLCI/Sentinel-3B (OLCI-3B) Level 2 Rrs and τ (865) data covering Muping and Dong’ou sites in cloud-free days were acquired from NASA ocean color website (https://oceancolor.gsfc.nasa.gov (accessed on 18 December 2021)). The acquisition date was from 11 September 2019 to 30 September 2021 for Muping site and from 1 January 2020 to 30 September 2021 for Dong’ou site to match the available in situ data. The Rrs values were extracted at the visible bands for MODIS and OLCI.
High spatial resolution MSI/Sentinel-2A Level 1C data covering Muping and Dong’ou sites in cloud-free days were acquired from the United States Geological Survey (https://earthexplorer.usgs.gov (accessed on 8 January 2022)). The MSI has 13 spectral bands spanning from the visible to the shortwave-infrared bands and variable spatial resolution from 10 to 60 m. Because of the absence of Level 2 data, MSI Level 1C data were processed using two commonly used atmospheric correction software packages: ACOLITE (version 20210802.0) [36,37,38] and SeaDAS (version 8.1.0). ACOLITE supports two atmospheric correction models: dark spectrum fitting (DSF) and exponential extrapolation (EXP). DSF is the default atmospheric correction model in ACOLITE, and computes τ (865) based on multiple dark targets in the scene or subscene. The EXP model uses Rayleigh corrected reflectance in two bands to estimate aerosol reflectance, which is then extrapolated to the visible and near-infrared bands. Different band sets were selected in the EXP model, including 779/865, 865/1609, 865/2201, and 1609/2201, to evaluate the performance of band selection in the Muping and Dong’ou sites. SeaDAS implements the standard atmospheric correction scheme developed by Gordon and Wang [39] using a two-band multi-scattering algorithm and iterative NIR correction [40]. By applying ACOLITE and SeaDAS to MSI Level 1C data, Rrs at 443, 492, 560, and 665 nm and the associated AOD were computed and resampled to 20 m for further validation.

3.3. Data Matchup

The following metrics were adopted to match in situ measurements and MODIS or OLCI observations. The spatial and temporal windows for the matchups are 3 × 3 pixels and ±30 min, respectively. Specifically, the pixel in the satellite image is first identified centered on the location of Muping and Dong’ou sites. Then data within a 3 × 3 window in the satellite image are examined. Only when all data are valid are the mean value and standard deviation calculated as satellite-derived Rrs and AOD. Otherwise, the satellite observations are discarded. Once the satellite observation is available, the matched in situ data are searched for measurements made within ±30 min of satellite overpass time. If more than one in situ measurements are available, the mean and standard deviation are computed. The same procedure was used to match MSI data and in situ measurements, but window size was increased to 50 × 50, approximately 1 km. The exact requirements for accepting a given matchup are empirical and vary under different oceanic conditions. In this study, a stricter 30 min window was applied to consider the rapid changes in the optical properties of coastal waters.

3.4. Data Comparison

The SeaPRISM is a multi-spectral radiometer with bandwidth of approximately 10 nm. When compared with hyperspectral data such as that measured by RAMSES-AUTO radiometers, the relative spectral response function (SRF) of SeaPRISM can be directly applied to hyperspectral data to compute the SRF weighted quantities (Equations (6) and (7)).
E s ( λ i ) = λ i , min λ i , max E s ( λ ) SRF ( λ i ) λ i , min λ i , max SRF ( λ i )
R r s ( λ i ) = λ i , min λ i , max L w ( λ ) SRF ( λ i ) λ i , min λ i , max E s ( λ ) SRF ( λ i )
where λ i is the ith nominal wavelength of SeaPRISM and SRF is the relative spectral response function of SeaPRISM with two cutoff wavelengths λ i , min and λ i , max . E s ( λ ) and L w ( λ ) are RAMSES-AUTO-measured hyperspectral downwelling irradiance and water leaving radiance.
However, when comparing with multi-spectral datasets such as SeaPRISM vs. MODIS or MSI, the relative SRF at each nominal wavelength might quite different. The nominal wavelengths of each sensor are listed in Table 2 and their relative SRFs are shown in Figure 4. Except for SeaPRISM provided by the manufacturer, relative SRFs for other sensors are obtained from the NASA portal (https://oceancolor.gsfc.nasa.gov/docs/rsr/rsr_tables/ (accessed on 10 March 2022)). Apparently, the nominal wavelength and SRF of SeaPRISM and OLCI are nearly identical and their measurements can be directly compared. The nominal wavelengths of SeaPRISM and MSI are nearly the same, while their SRFs deviate significantly (Figure 4). For SeaPRISM and MODIS, both nominal wavelengths and SRFs are different (Table 2 and Figure 4). Mélin and Sclep [41] proposed a band shifting method for comparing multi-spectral data with different nominal wavelengths. This method reduces the noticeable uncertainty from direct comparison in the closest bands or linear interpolation. In this study, band shifting scheme developed by Mélin and Sclep was applied to SeaPRISM Rrs measurements to match MODIS data.

3.5. Statistics

Statistics used in this study include the Pearson correlation coefficient (r), root mean square error (RMSE), mean relative percentage difference (MRPD), mean ratio (mR), and mean bias (mB). These parameters are calculated as follows:
r = i = 1 N ( x i x ¯ ) ( y i y ¯ ) i = 1 N ( x i x ¯ ) 2 i = 1 N ( y i y ¯ ) 2 ,
RMSE = i = 1 N ( y i x i ) 2 N ,
MRPD = 100 %   × | y i x i | x i ,
mR = 1 N i = 1 N y i x i ,
mB = 1 N i = 1 N ( y i x i ) ,
where x and y represent in situ-measured and satellite-derived quantities (e.g., Rrs), respectively.

4. Result

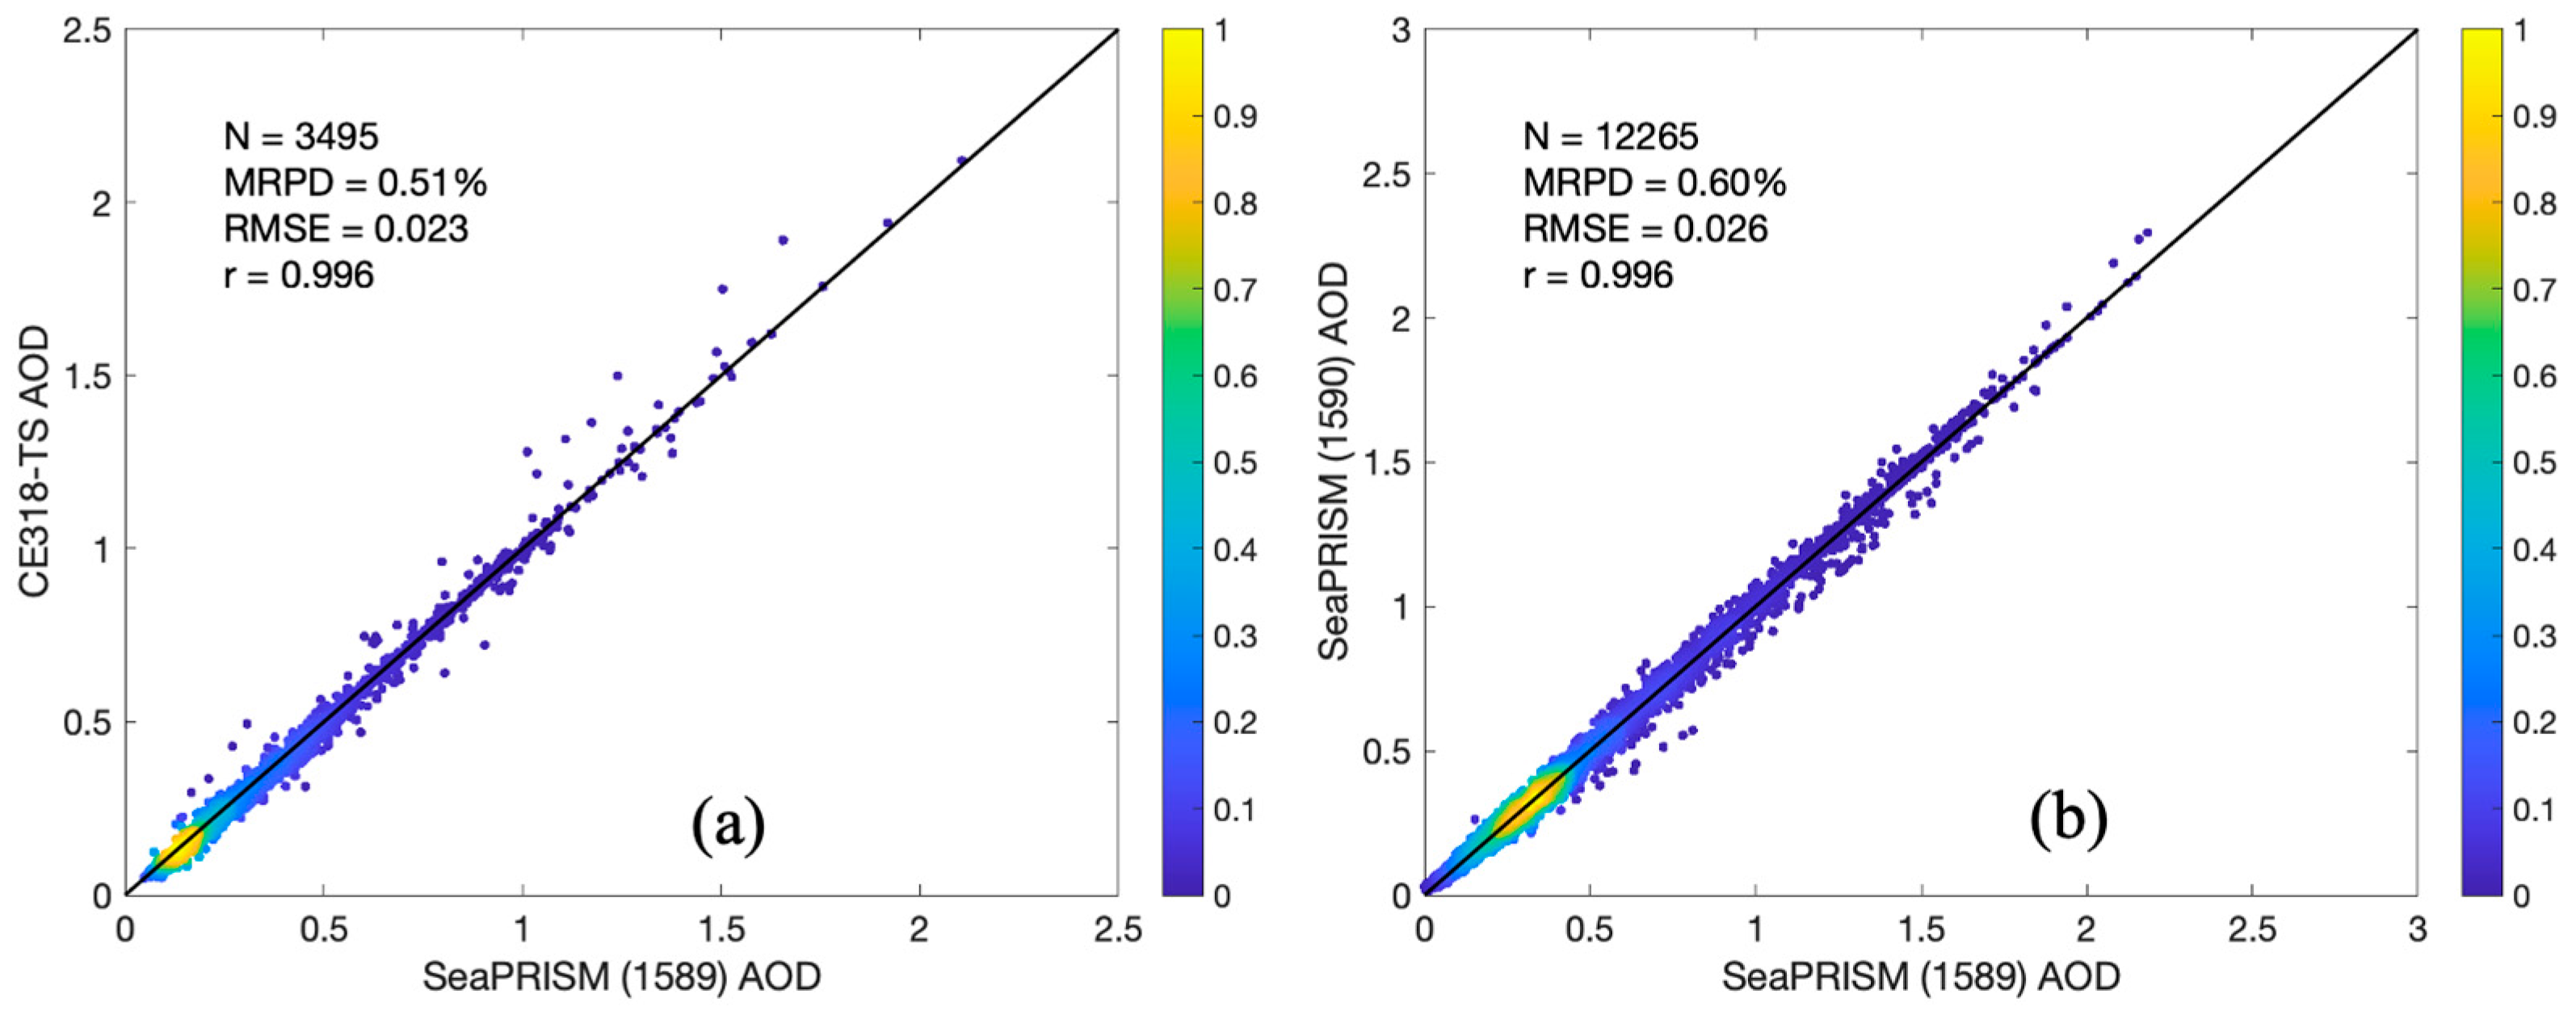
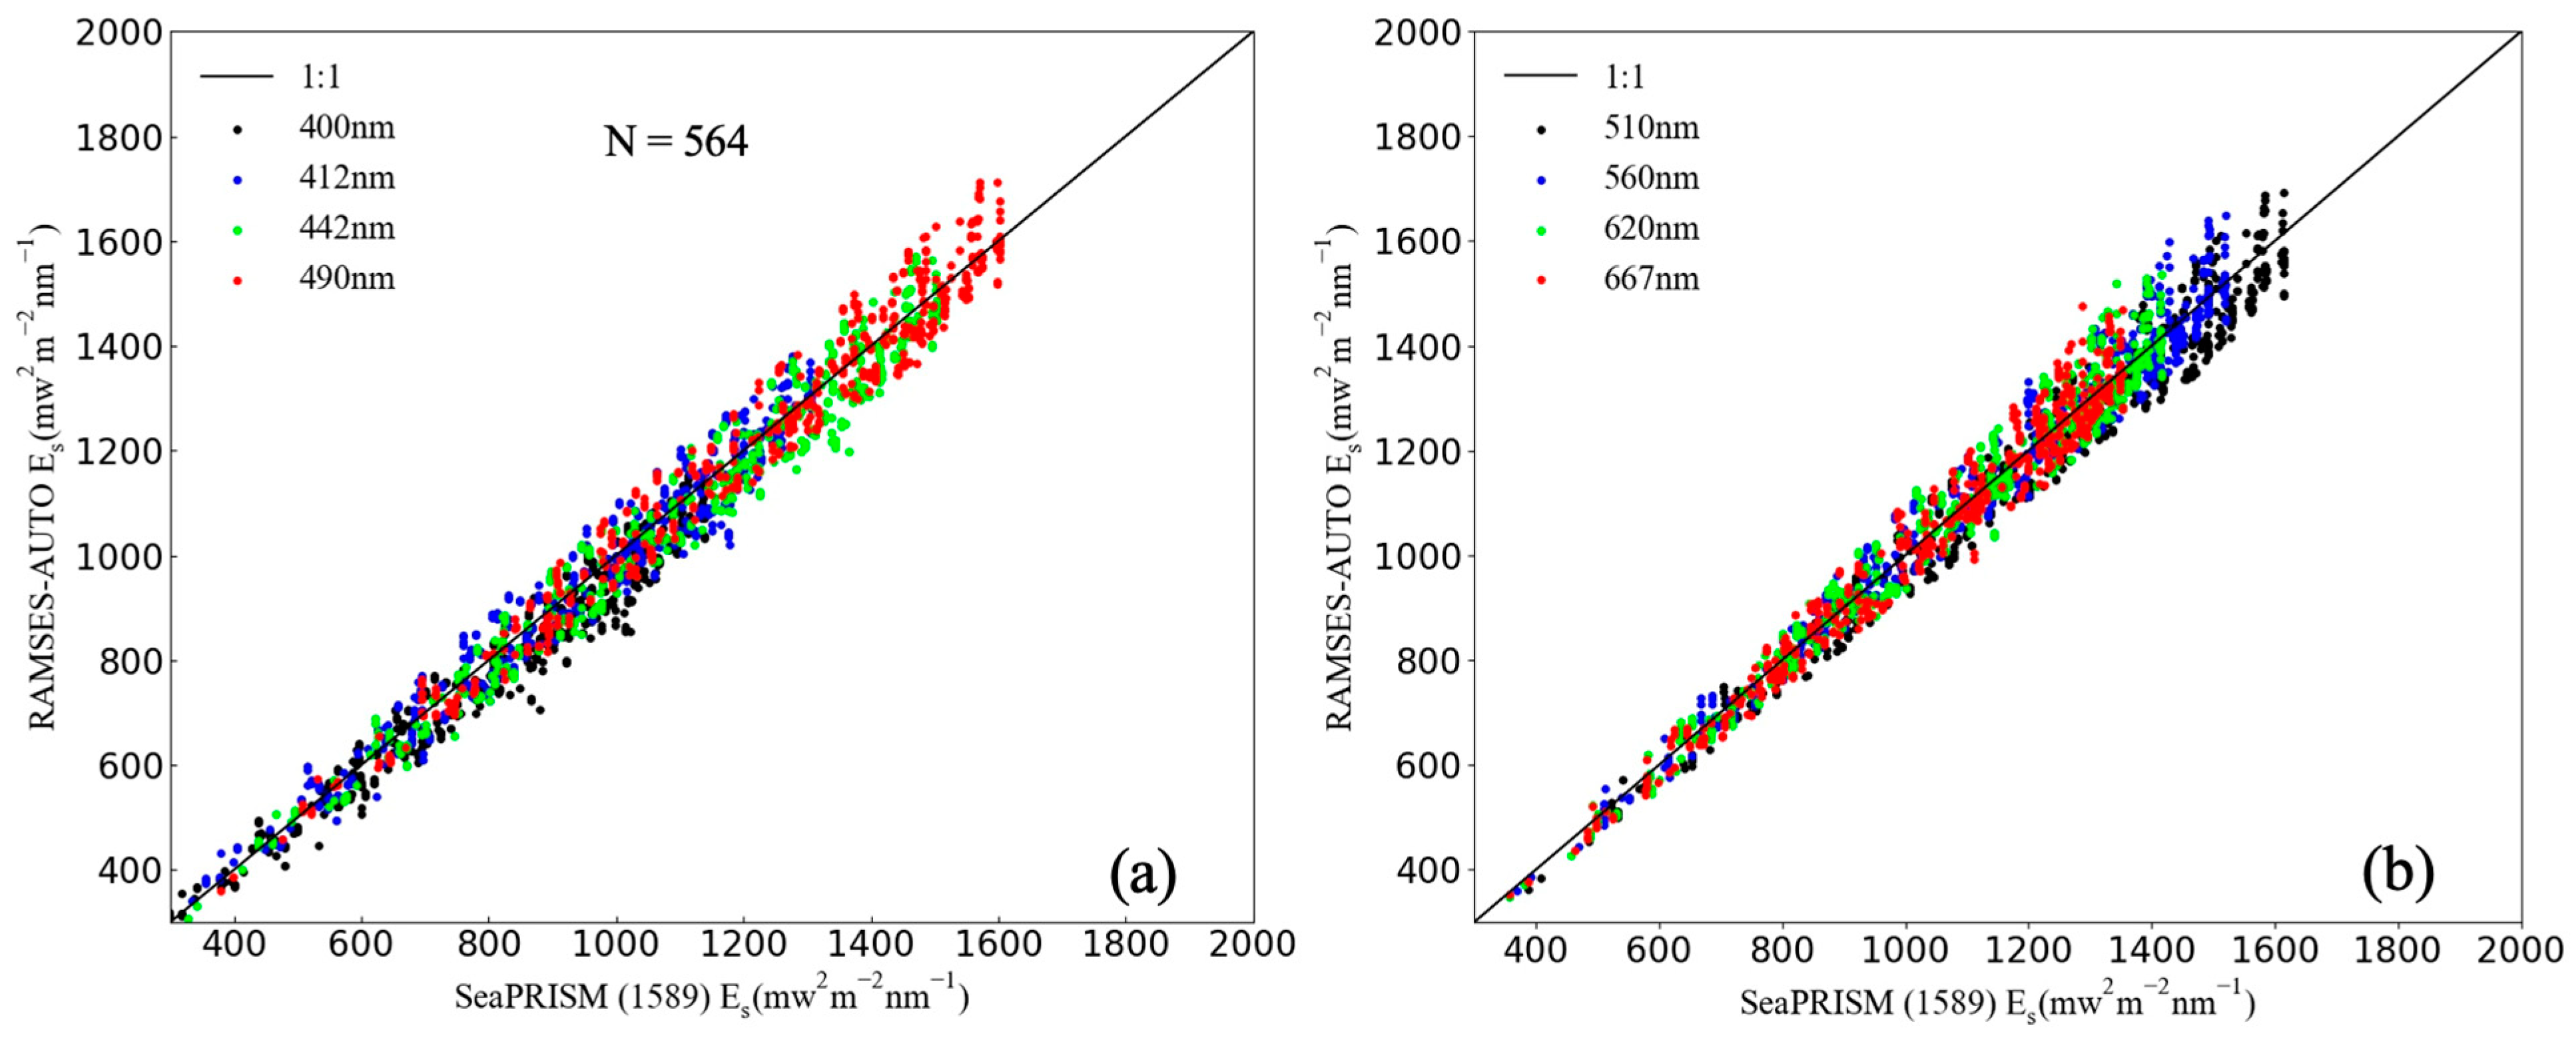
4.1. Inter-Comparison AOD, Es, and Rrs at the Muping Site

AOD, Es, and Rrs data at the Muping site determined by CE318-TS, SeaPRISM (1590), and SeaPRISM (1589) were compared to evaluate data consistency. Because of the different band configurations, comparisons of AOD between SeaPRISM and CE318-TS and two SeaPRISMs were made separately. Though the measurement time interval (15 min) was same for CE318-TS and SeaPRISM, the observation times were not exact the same. For comparison, data measured by each instrument were temporally binned every 0.5 h. For each bin size (±0.25 h), the median value was calculated and regarded as the AOD at that bin time if multiple measurements were available. The density scatter plots of AOD are shown in Figure 5a,b for SeaPRISM (1589) vs. CE318-TS and SeaPRISM (1589) vs. SeaPRISM (1590), respectively. Data shown in Figure 5a were measured before 10 June 2020 and compared at their closest wavelengths: 442, 510, 667, 865, and 1020 nm. Data shown in Figure 5b were measured after 10 June 2020 and compared at 400, 412, 442, 490, 510, 560, 620, 667, 779, 865, and 1020 nm. Overall, AOD determined by the CE318-TS and two SeaPRISMs agree well with each other, with a MRPD < 0.6% and an RMSE < 0.026. The correlation coefficient (r) > 0.99 in two comparisons. AOD measurement uncertainty mainly comes from the instrument calibration as well as the uncertainty of optical depth calculated for other components such as water vapor or ozone. Giles et al. [28] estimated the uncertainty of AOD derived from SeaPRISMs deployed on the AERONET-OC sites to be from 0.01 to 0.02, with the maximum uncertainty in the ultraviolet channels (i.e., 340 and 380 nm). Nevertheless, the small MRPD and RMSE shown in Figure 5 indicate that data processing and quality control procedure for AOD data calculated from CE318-TS and two SeaPRISMs are reliable.
Downwelling irradiance just above sea surface (Es) is a prerequisite in computing Rrs. However, this quantity is not directly measured by SeaPRISM, but is calculated from Equations (3) and (4) using derived AOD and assumed forward scattering probability (Equation (4)). On the other hand, RAMSES-ATUO directly measured Es with an irradiance radiometer. Figure 6 shows the comparison of Es measured by RAMSES-ATUO and inferred by SeaPRISM (1589) at the Muping site. For comparison, RAMSES-AUTO-measured hyperspectral Es was weighted with the relative SRF of SeaPRISM (1589) using Equation (6). Overall, the Es measured by RAMSES-AUTO and calculated by SeaPRISM agree well, with a MRPD < 5% in the visible region (Table 3). Relatively small uncertainty is observed in the longer wavelength (e.g., 667 nm) and large uncertainty occurs in the shorter wavelength (e.g., 400 nm). The mean ratio (mR) and Pearson correlation coefficient (r) are very close to unity, indicating the excellent agreement between measured and calculated Es. Tilstone et al. compared the Es measured or inferred by 12 radiometers performing in-water or above-water measurement in a field inter-comparison experiment at the Acqua Alta Oceanographic Tower in the northern Adriatic Sea [42]. Results showed that Es agreed well with each other, with a MRPD < 5% with two exceptions. Similar inter-comparisons were conducted by Zibordi et al. [43] using both in- and above-water measuring systems. Good agreement was achieved for Es determined by SeaPRISM and measured by TriOS sensors, with a MPRD < 3% and RMSE < 50 mw−2 m−2 nm−1 [43], consistent with results in this study.
A comparison of Rrs calculated by SeaPRISM and RAMSE-AUTO is shown in Figure 7. Similar to the Es comparison, RAMSES-AUTO-measured hyperspectral Rrs were weighted with the relative SRF of SeaPRISM using Equations (6) and (7) to derive Rrs at the nominal wavelengths of SeaPRISM. Furthermore, close agreement was reached for Rrs measured by RAMSES-AUTO and calculated by SeaPRISM (1589), with the MRPD < 10% in the visible bands and RMSE < 0.0013 sr−1 (Table 4). The overall difference of Rrs calculated by the two instruments is approximately of 5% higher than the Es comparison (Table 3 and Table 4) that is expected. The mean ratio is >1.05 at two blue and green bands (e.g., 400 and 510 nm), but close to unity in the other bands. Considering the different measuring mechanisms, band configurations, and deployments between SeaPRISM and RAMSES-AUTO, the agreements of Rrs are acceptable.

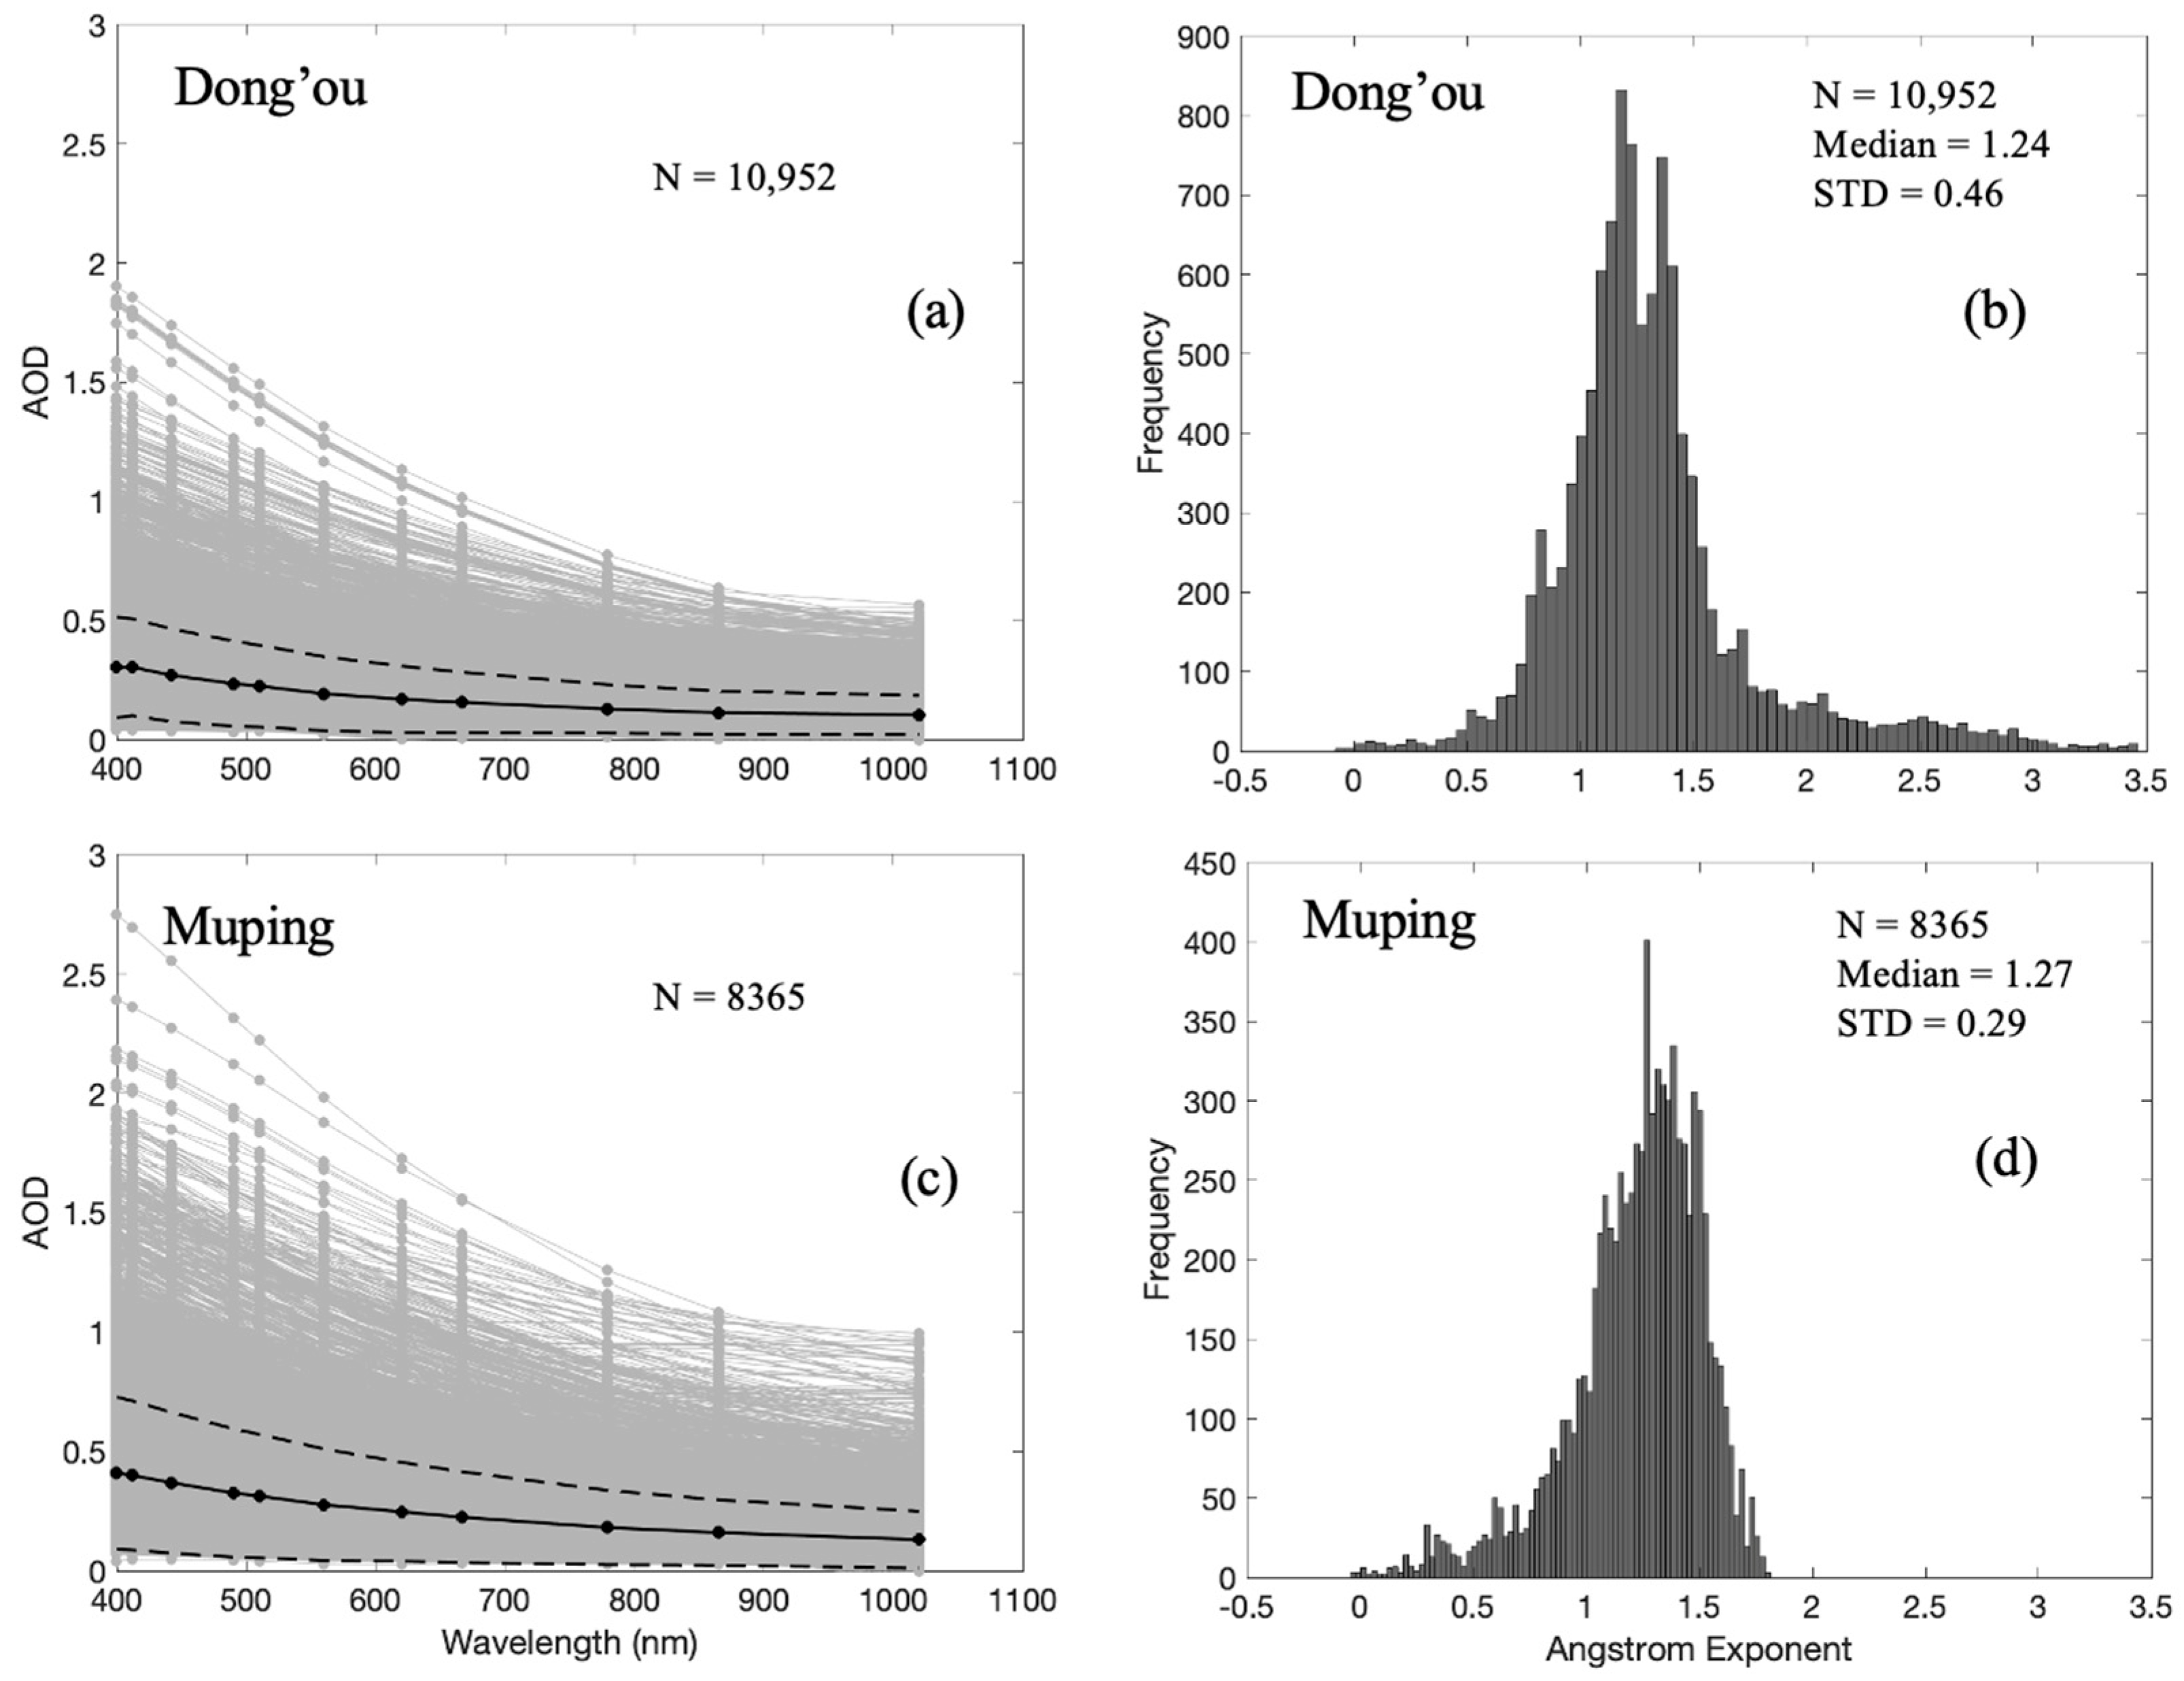
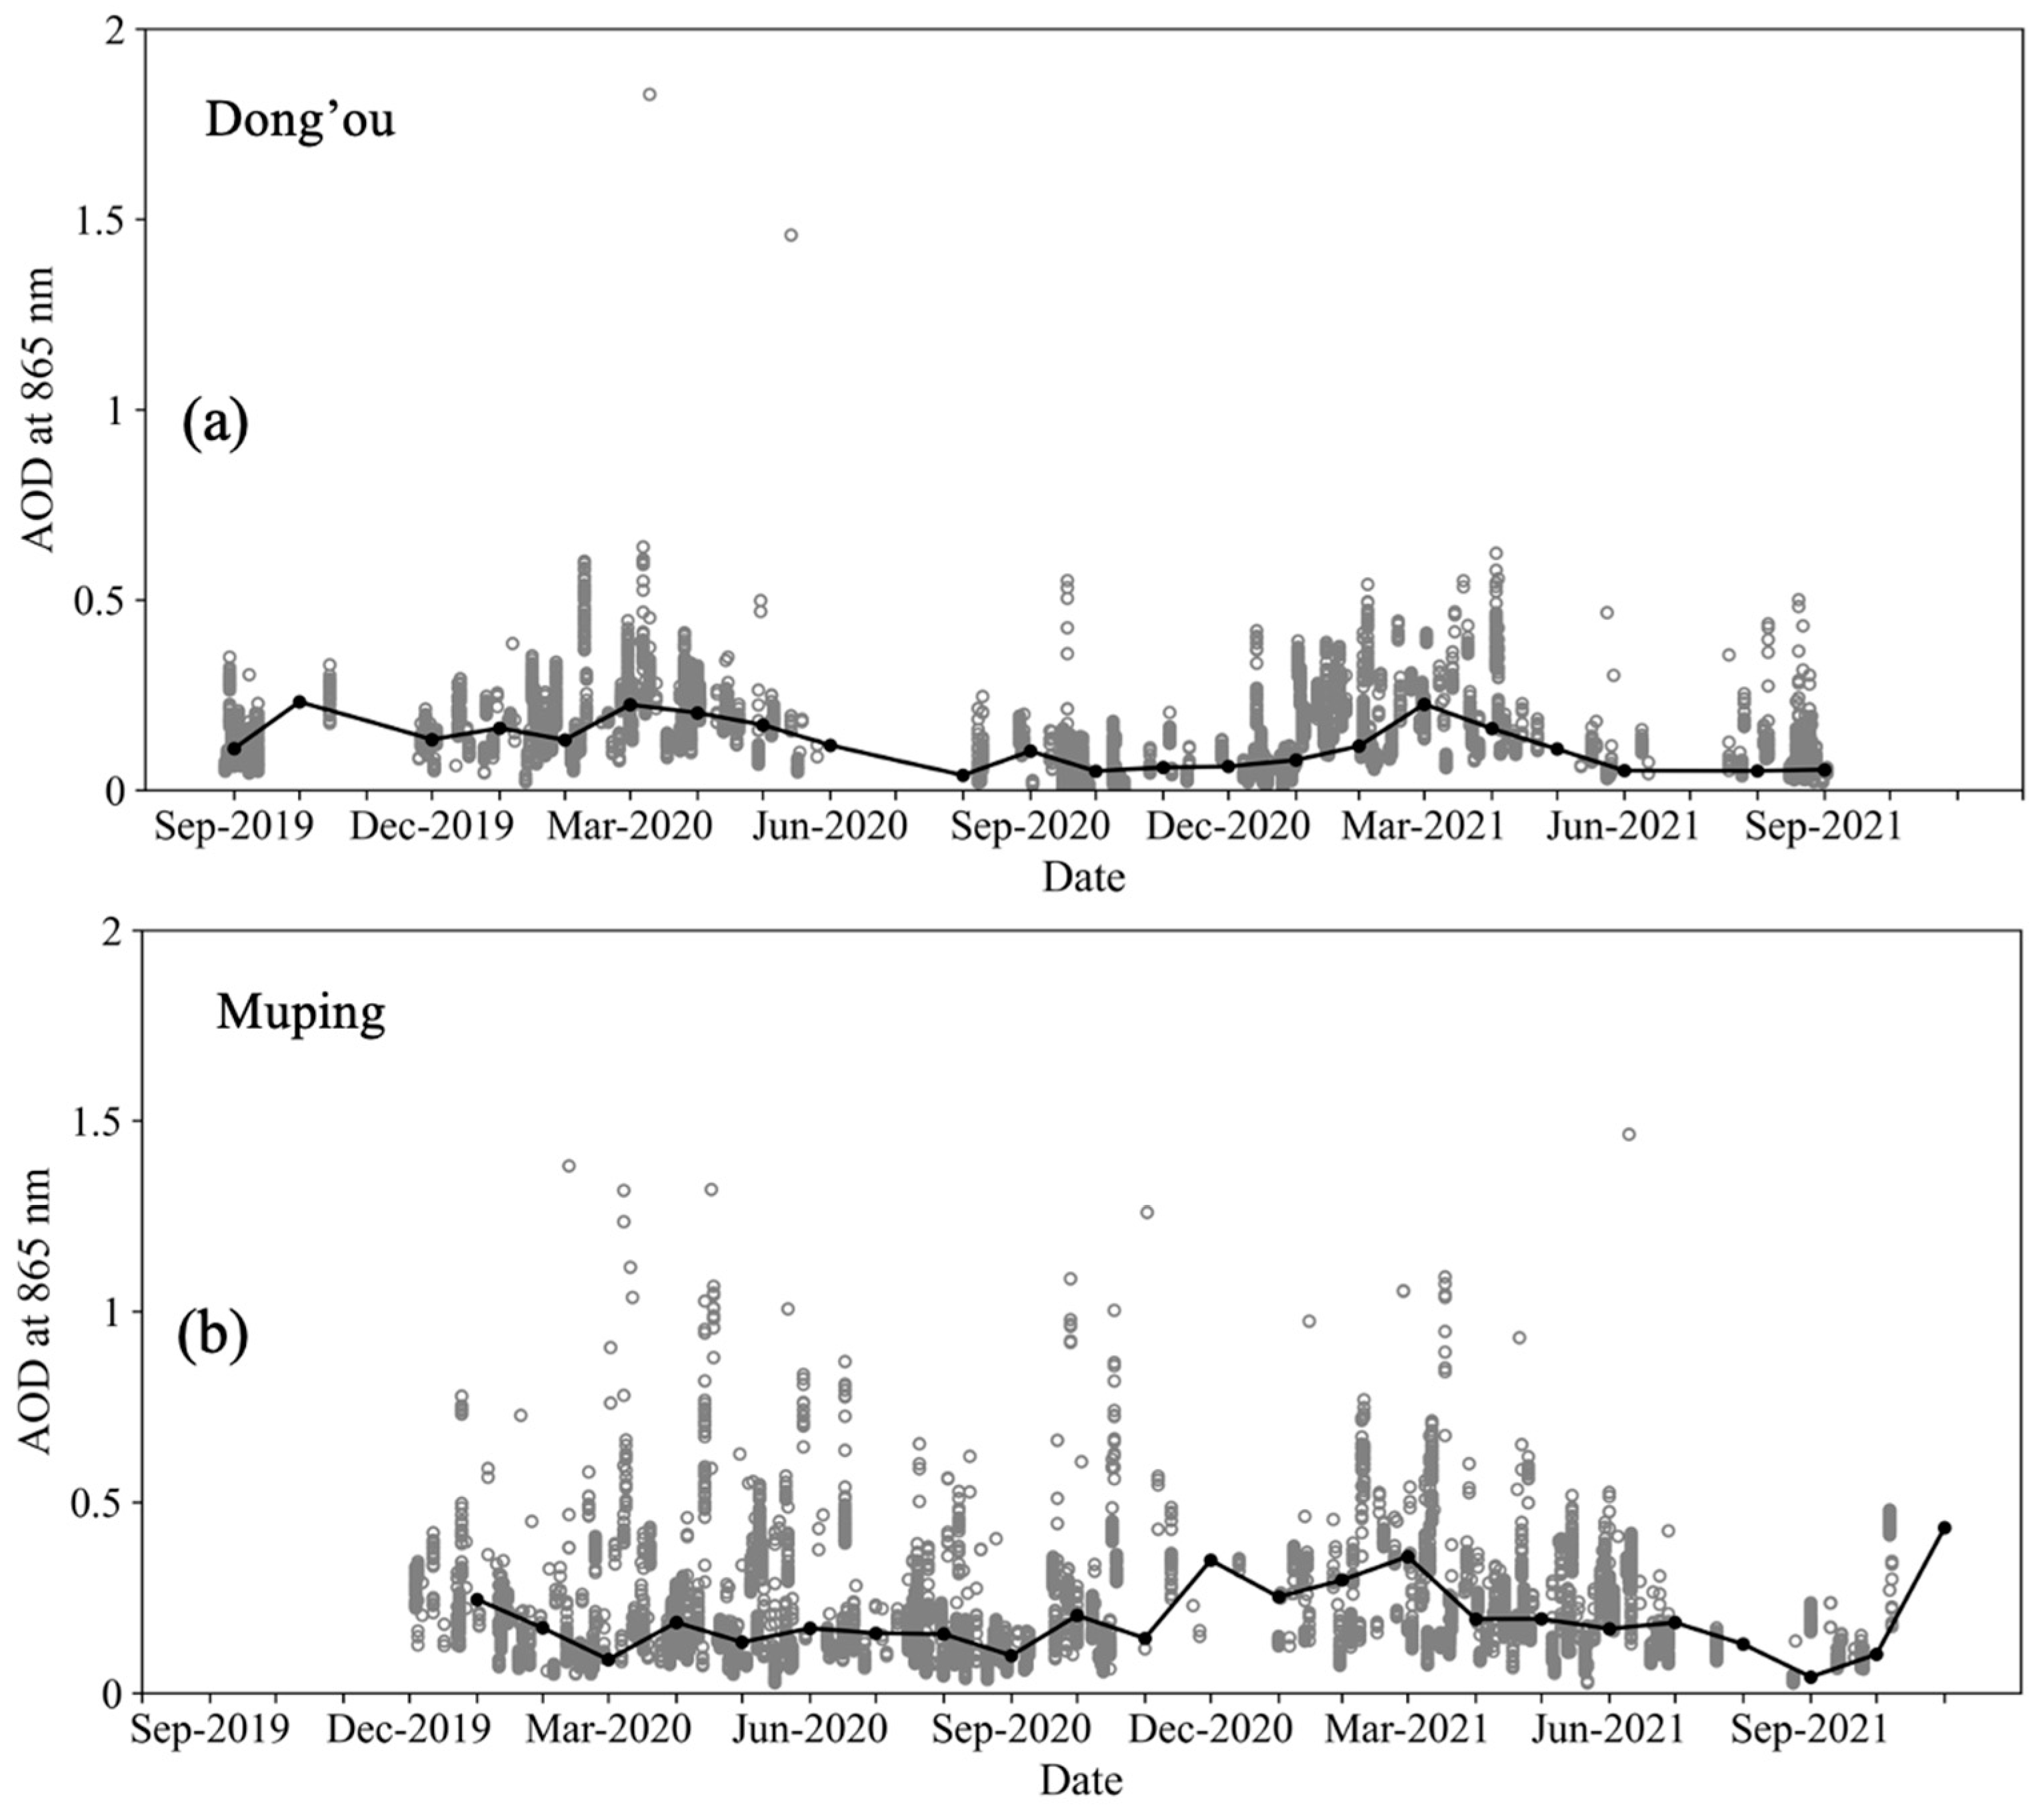
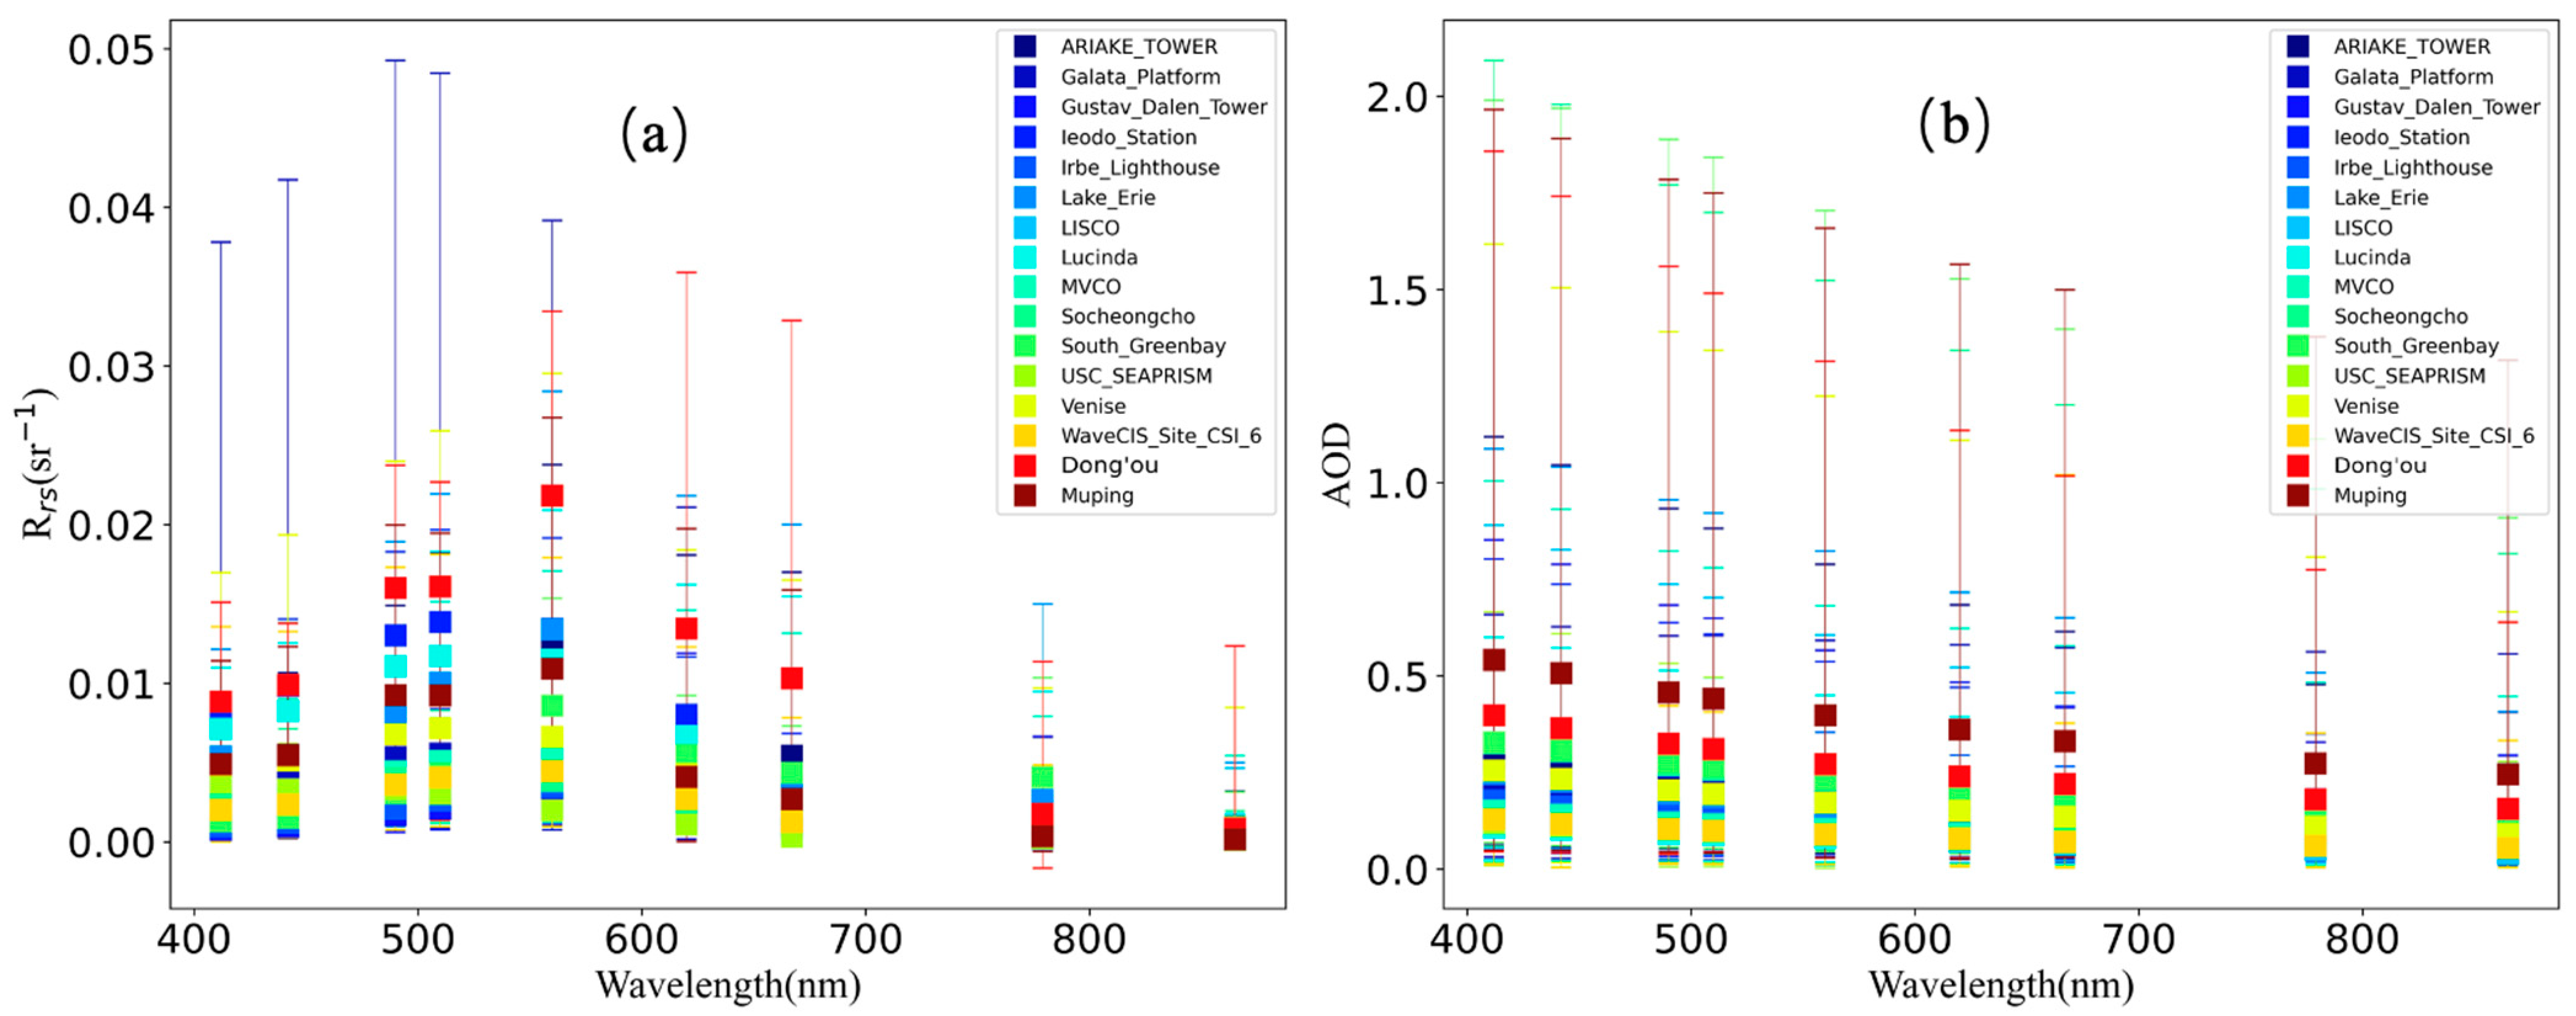
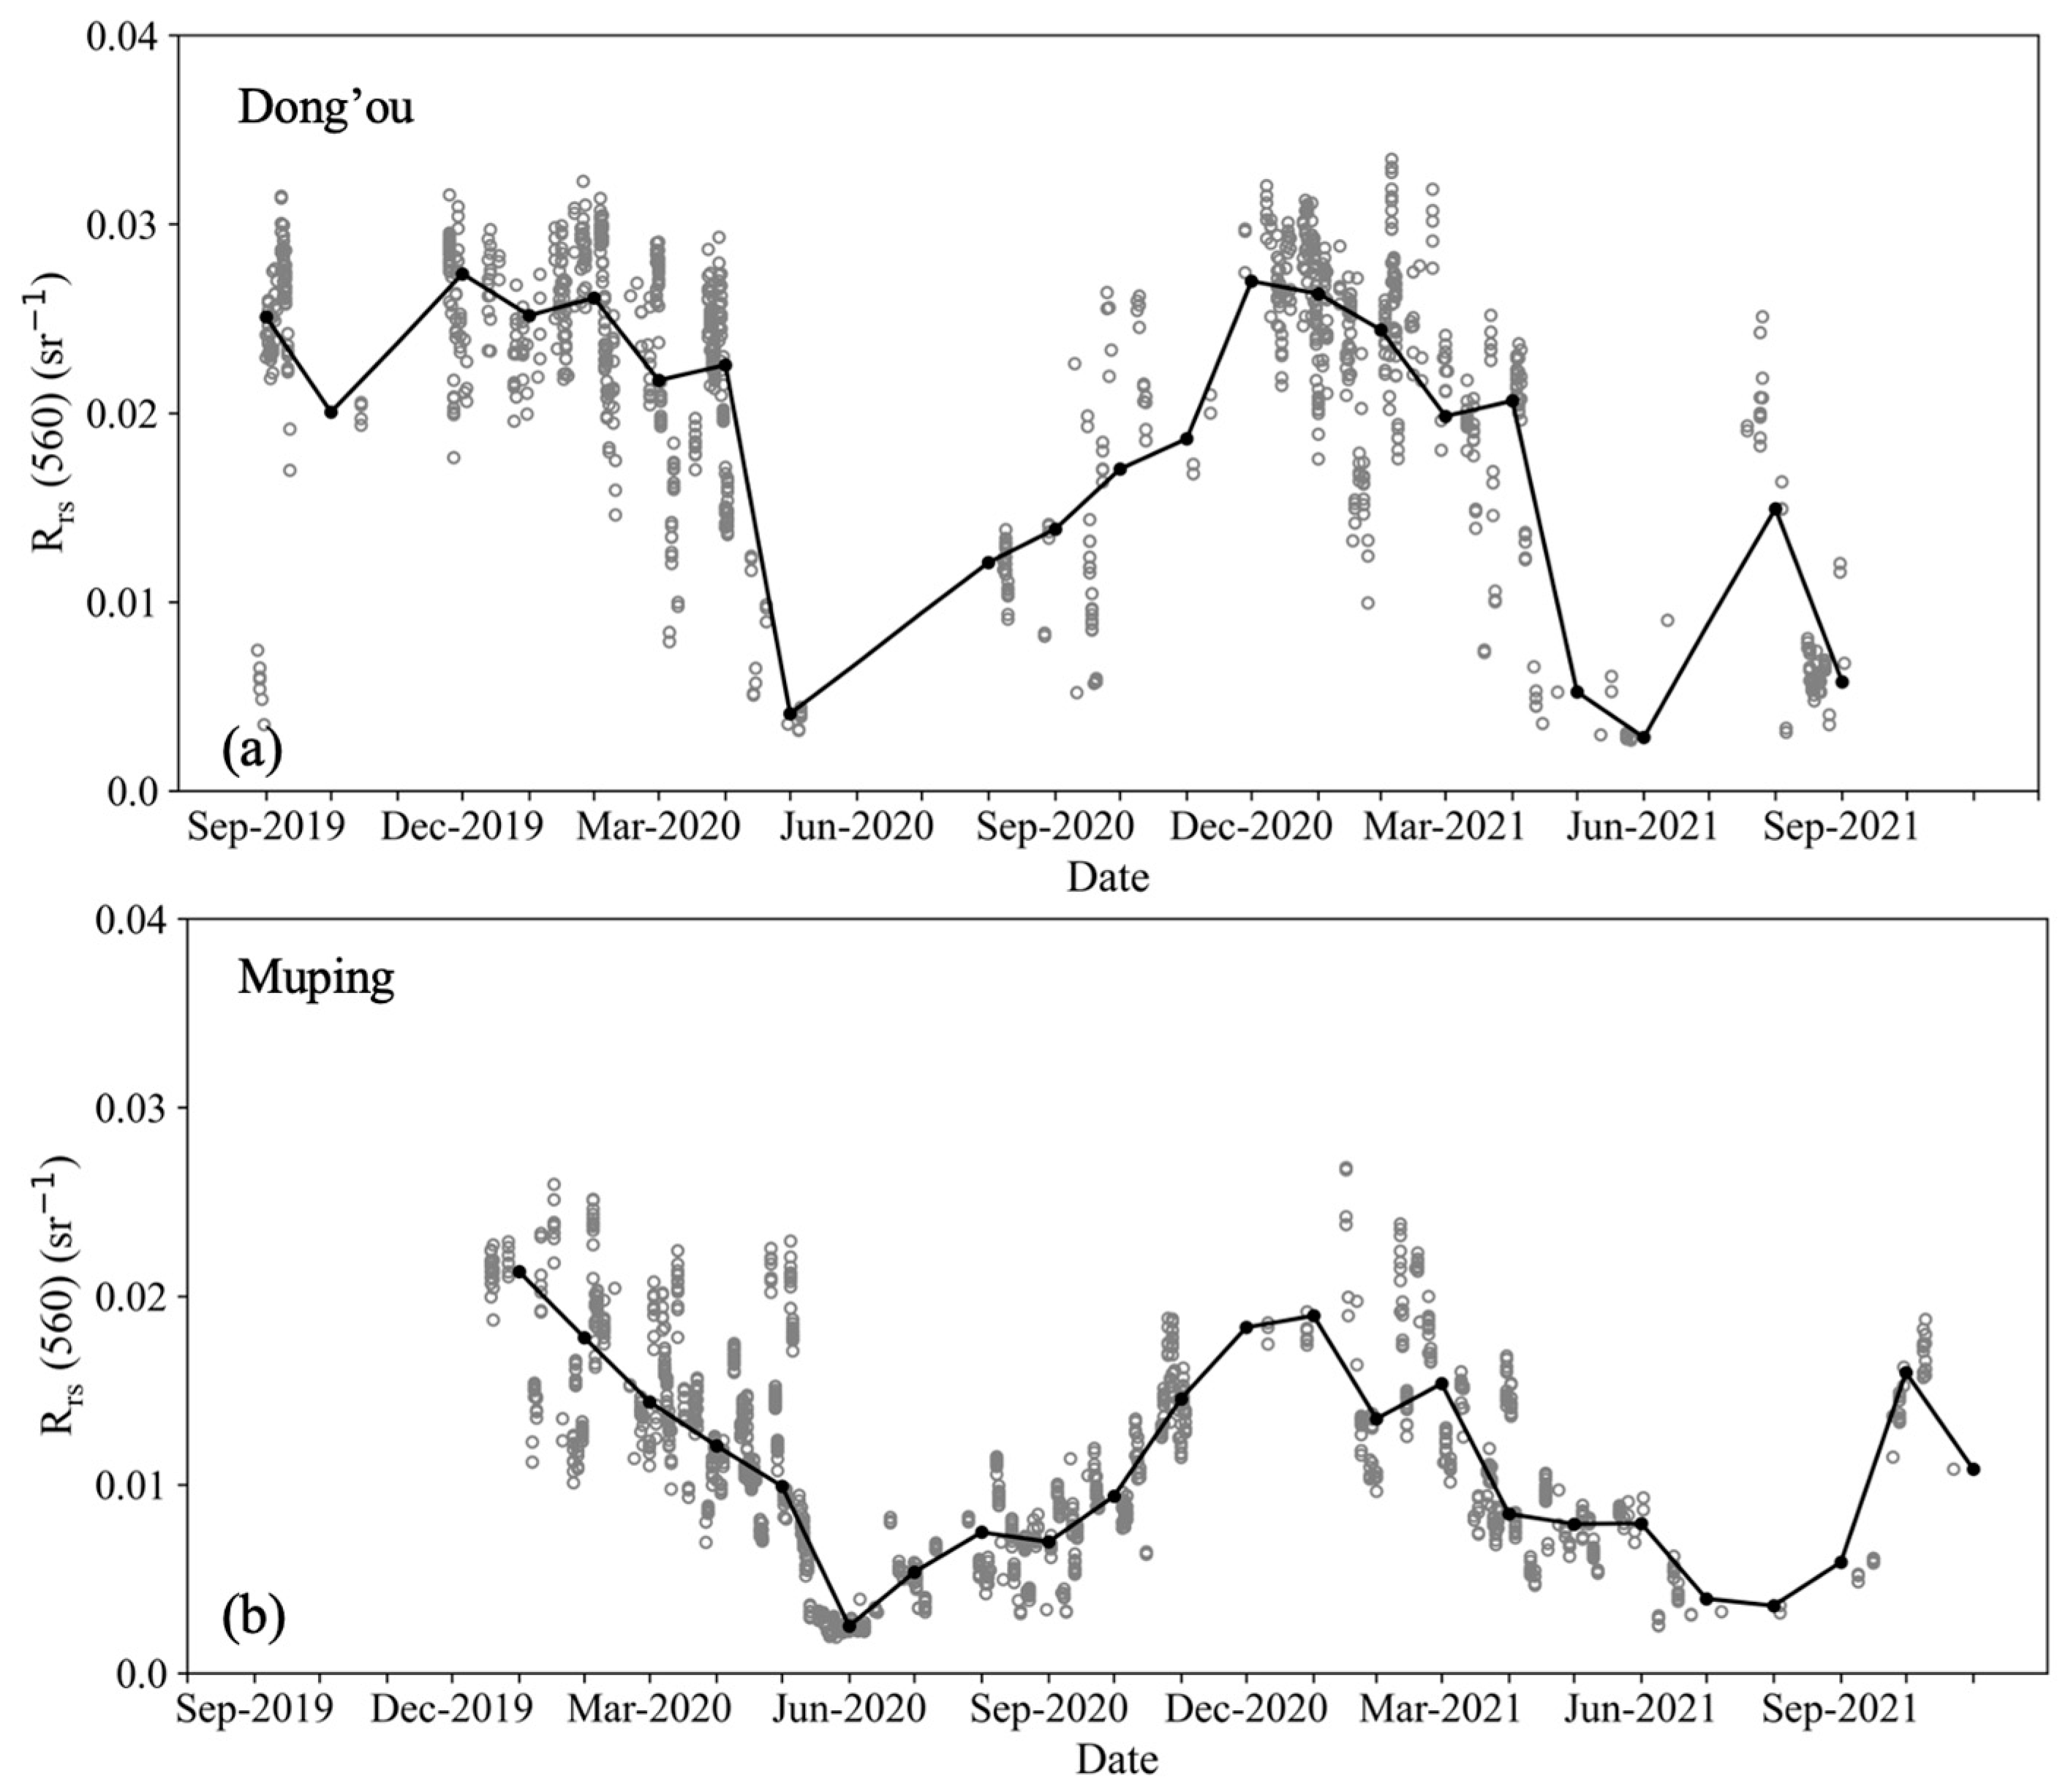
4.2. The Spectral and Temporal Feature of AOD and Rrs

The spectral distributions of AOD at the Dong’ou and Muping sites are shown in Figure 8a,c, respectively. At both sites, AOD generally decreases with as the wavelength increases, and changes rapidly towards shorter wavelengths, but slowly towards longer wavelengths. The values of AOD are approximately of 50% higher at the Muping site than those at the Dong’ou site. For example, AOD at 865 nm ranges from 0.008 to 0.63 with a median value of 0.11 at the Dong’ou site, while it ranges from 0.03 to 1.08 with a median value of 0.16 at Muping site. The Ångström Exponent (AE) of AOD over the visible region was calculated using AOD from 412 to 865 nm as a function of AOD at 560 nm. The histogram distributions of AE at the two sites are shown in Figure 8b,d. At the Dong’ou site, AE varies from 0 to 3.5 with a median value of 1.24, while AE varies from 0 to 1.8 with a median value of 1.27 at the Muping site. The steep AOD spectral slope at the Dong’ou site implies that small size aerosol particles were present.
The temporal changes of AOD at 865 nm are shown in Figure 9a,b for SeaPRISM measurements at the Dong’ou and Muping sites, respectively. Generally, daily AOD varies significantly throughout the year at each site. The monthly mean AOD shows a slight seasonal variation with a relatively higher aerosol load in spring and a lower aerosol load in summer.
The spectral distributions of Rrs at the Dong’ou and Muping sites are shown in Figure 10a,b, respectively. At both sites, the peak reflectance is observed at 560 nm, exhibiting the spectral characteristics of coastal water. However, the values of Rrs (560) at the Dong’ou site are approximately three times those at the Muping site. The former varies from 0.014 to 0.037 sr−1 with a median value of 0.029 sr−1, while the latter varies from 0.004 to 0.03 sr−1 with a median value of 0.009 sr−1, suggesting that waters at the Dong’ou site are more turbid than those at the Muping site, consistent with in situ IOP measurements (Figure 3). With the development of AERONET-OC project, more than 30 sites have been deployed in the coastal waters globally to support validation for on-orbit ocean color satellite data. Ideally, AERONET-OC sites are globally distributed, encompassing distinct water types with different marine bio-optical properties. The YS and ECS are largely influenced by the Yellow and Yangtze rivers and might have distinct features compared to coastal waters in the current AERONET-OC sites. By the end of 2021, 14 AERONET-OC sites had provided Level 2.0 AOD and Rrs data (https://aeronet.gsfc.nasa.gov/cgi-bin/draw_map_display_seaprism_v3 (accessed on 8 January 2022)). Figure 11 shows a comparison of the mean and standard deviation of Rrs and AOD at the Dong’ou and Muping sites, as well as the 14 AERONET-OC sites. Clearly, relatively higher values of Rrs and AOD are observed at the Dong’ou and Muping site, indicating the complex water and atmosphere in the YS and ECS.
The temporal changes of Rrs (560) are shown in Figure 12a,b at the Dong’ou and Muping sites, respectively. Unlike the temporal changes of AOD (Figure 9), time-series Rrs at two sites show a strong seasonal trend, with larger Rrs (560) in the winter-spring and smaller Rrs (560) in the summer, coinciding with monsoon season. Meanwhile, large variations are also observed in the winter–spring season and small variations in the summer season. For example, the values of Rrs (560) vary from 0.01 to 0.03 sr−1 in January at the Dong’ou site, while they are almost unchanged in June. The average Rrs (560) at the Dong’ou site between January and March is approximately 0.025 sr−1, 10 times higher than that between June and August.

4.3. Validation Rrs and AOD of MODIS and OLCI

Comparisons of Rrs derived from MODISA, OLCI-3A, OLCI-3B, and in situ measurements by SeaPRISMs are shown in Figure 13a–c. The Dong’ou site provided 86 matched Rrs, approximately 27% of quality-controlled measurements (Figure 10a), while the Muping site provided 123 matched Rrs, approximately 34% of quality-controlled measurements (Figure 10b), indicating that more clear-days were present at the Muping site. Overall, operational Rrs data products derived from MODISA, OLCI-3A, and OLCI-3B agree well with in situ measurements in the visible bands, with a MRPD < 25% for MODISA, <30% for OLCI-3A, and <40% for OLCI-3Bn (Table 5). For the three satellite sensors, large uncertainties are observed in the blue bands (i.e., from 400 to 443 nm), with MRPD > 20%, while close agreements are observed in other bands, with MRPD approximately or <10%. Because of different nominal wavelength configuration between SeaPRISM and MODISA (Table 2), a band shifting scheme developed by Mélin and Sclep was applied to SeaPRISM Rrs data to compute equivalent Rrs at MODISA nominal bands. By applying a band shifting scheme, the agreements between in situ-measured and satellite-derived Rrs are noticeably improved, particularly for data with a large spectral difference. For example, MRPD reduces 1.7% for MODISA band 442 nm (1 nm difference with SeaPRISM) and 7.6% for MODISA band 555 nm (5 nm difference with SeaPRISM; data not shown). Note that no band shifting was applied to in situ measurements when comparing them with OLCI data due to the nearly identical nominal wavelengths between SeaPRISM and OLCI (Table 2). The discrepancy between satellite-derived and SeaPRISM-measured Rrs increases towards shorter wavelengths and reaches its maximum at 400 nm, with MRPD of up to 40% for OLCI-3B. The reason currently is not very clear, but we suspect it is caused by the existence of absorbing aerosol over the YS and ECS, leading to the failure of standard atmospheric correction in the blue bands. Similarly, close agreements of AOD at 865 nm, τ ( 865 ) between satellite and in situ measurements were observed, with MRPD of 28.1%, 30.6%, and 39.9% for MODISA, OLCI-3A, and OLCI-3B, respectively (Figure 13d).

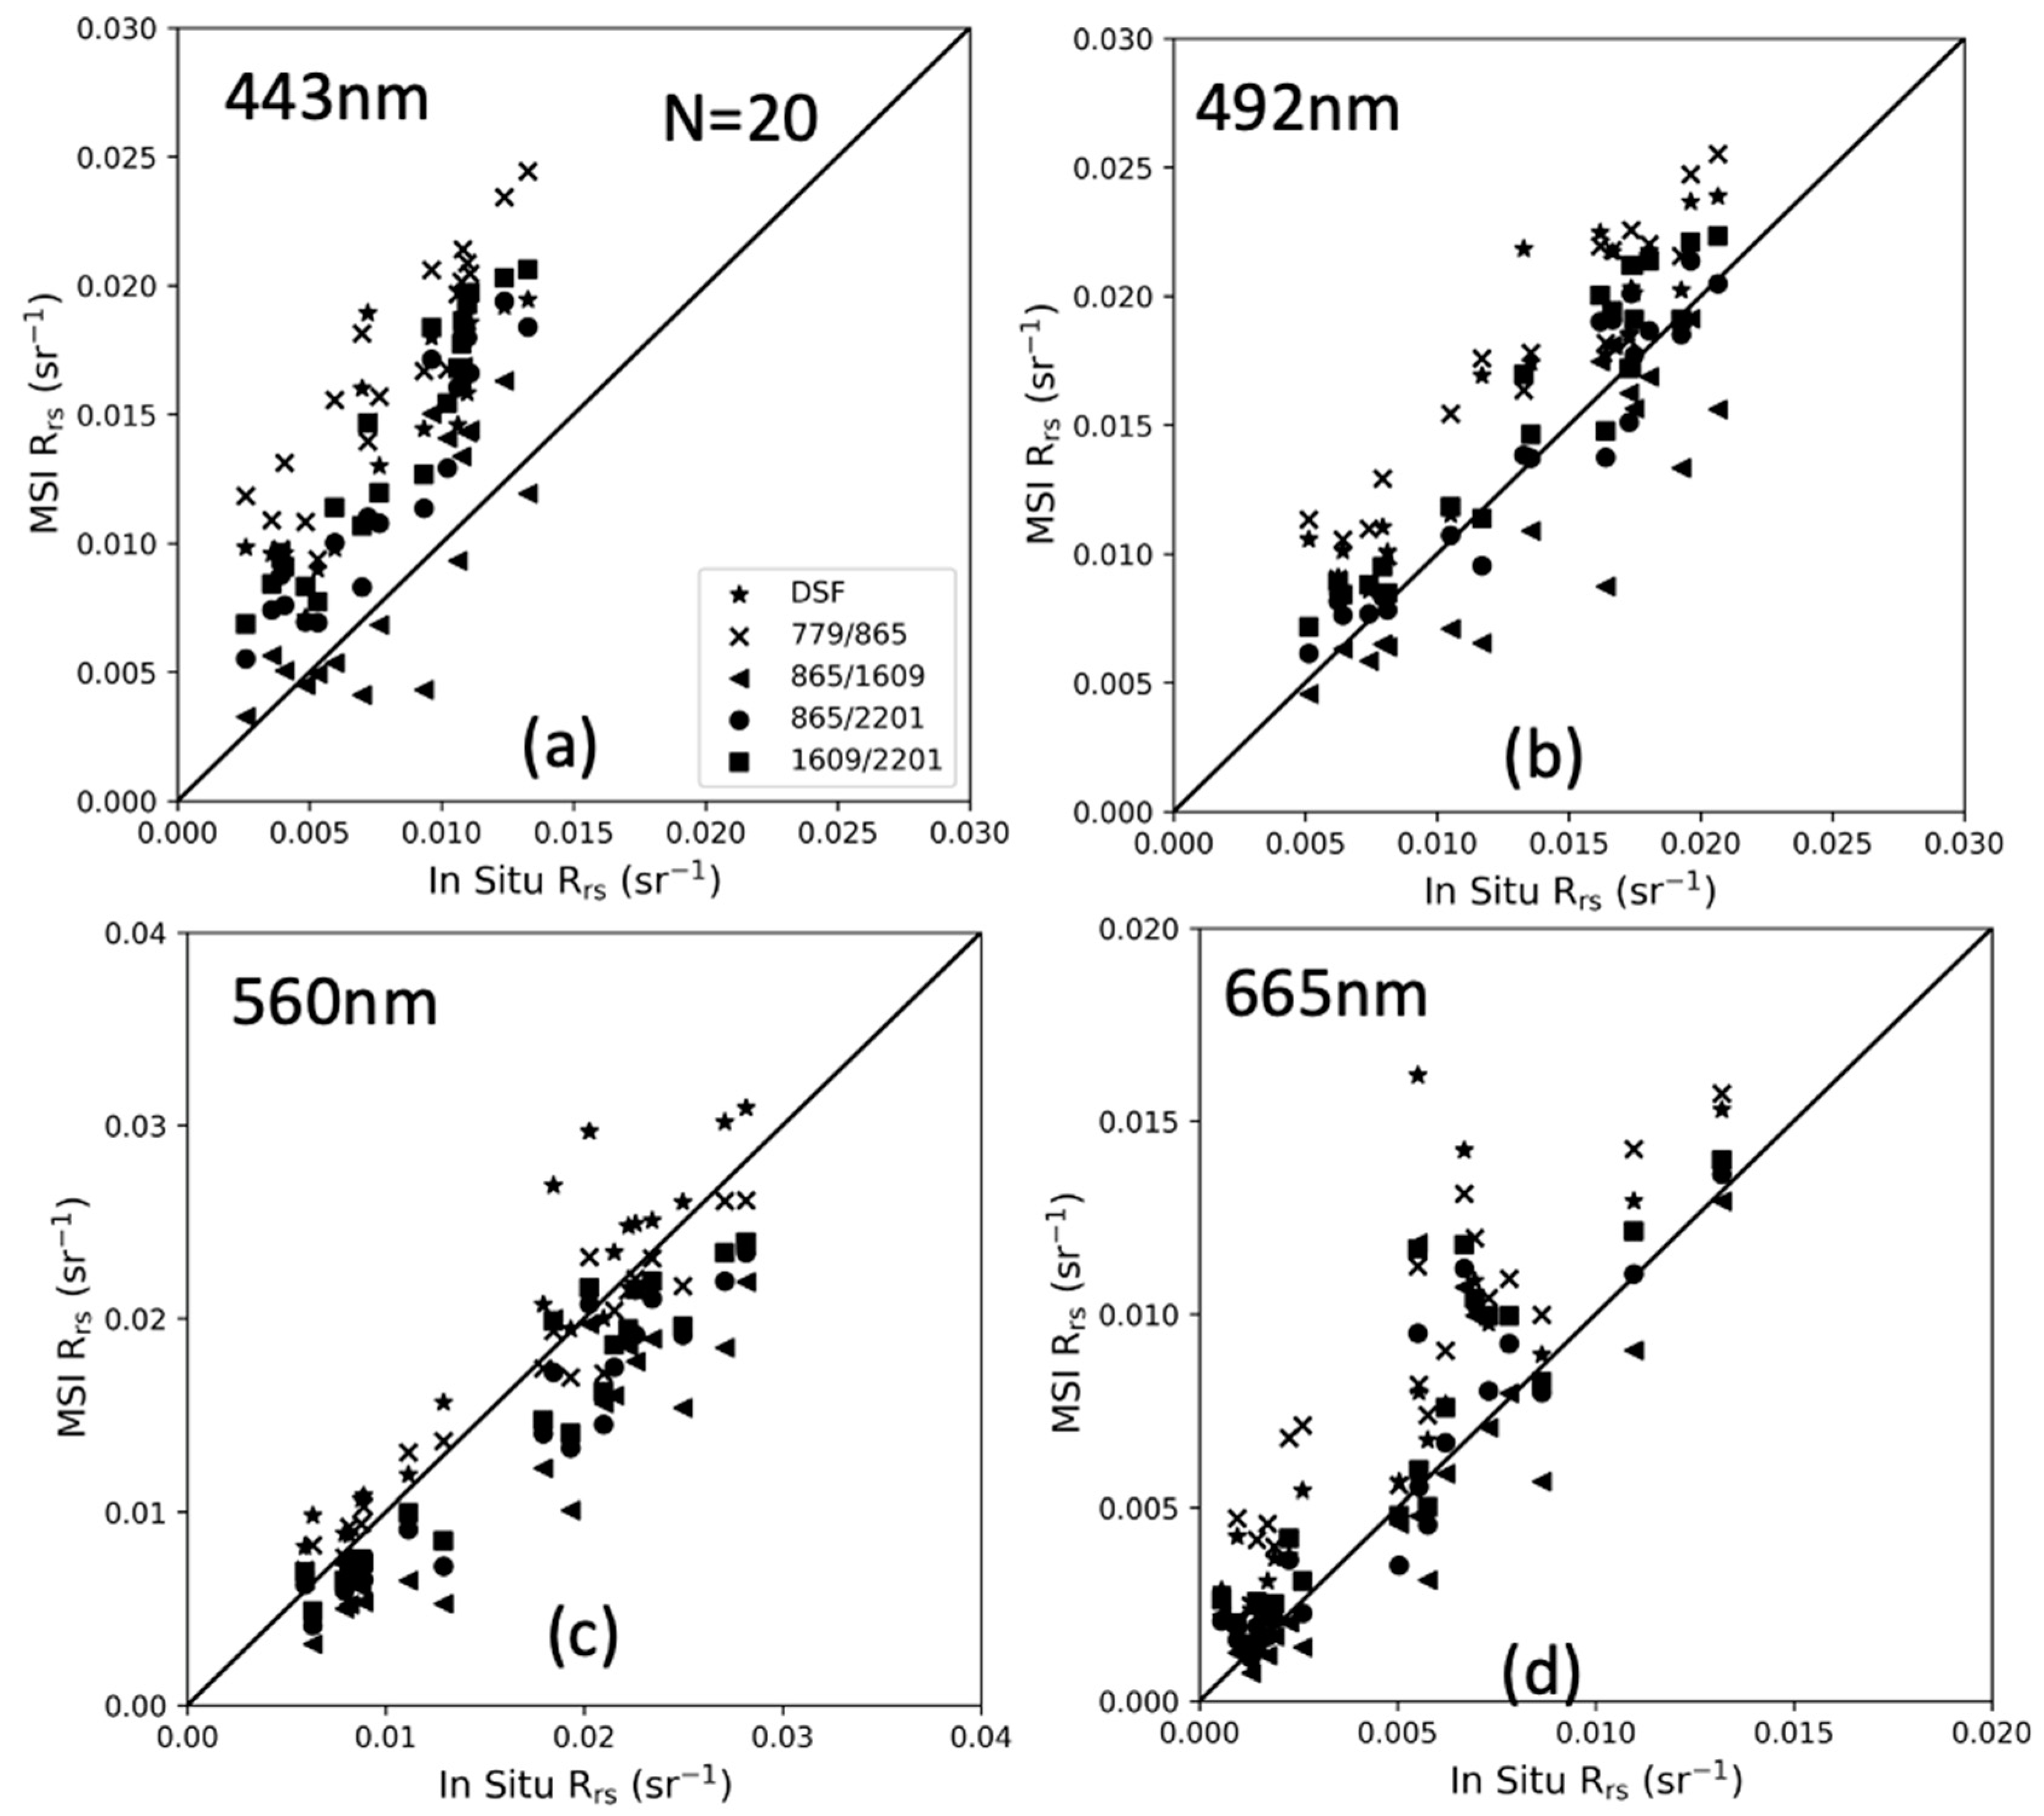
4.4. Evaluation the ACOLITE and SeaDAS

The comparison of MSI-derived Rrs using the ACOLITE and SeaDAS atmospheric correction AC processor with in situ measurements at nominal wavelengths of 443, 492, 560, and 665 nm is shown in Figure 14 and Figure 15, respectively. Reasonable agreements are reached between in situ-measured and MSI-derived Rrs using the ACOLITE AC processor and two distinct atmospheric correction models (i.e., DSF and EXP), as shown in Figure 14. In general, the EXP model performs better than the DSF model, and the optimal band selections are one near-infrared (NIR) and one short-wave infrared (SWIR) band, such as 865/1609 nm or 865/2201 nm (Table 6). Larger discrepancies are observed for two short-wave infrared band selections (i.e., 1609/2201 nm), with MRPD > 100% at 443 and 665 nm. Relatively closer agreements are reached between in situ-measured and MSI-derived Rrs using the SeaDAS processor (Figure 15). Similar to the ACOLITE, the optimal band selections for the SeaDAS are NIR/SWIR band combinations such as 865/1609 nm or 865/2201 nm with MRPD < 18% (Table 5). Comparisons of AOD measured by SeaPRISM and derived from MSI using the ACOLITE and SeaDAS are shown in Figure 16. As expected, MSI-derived AOD using the SeaDAS agree very well with in situ measurements, with a MRPD < 15% using 865/1609 and 865/2201 nm band selections, and up to 30% if using two NIR or SWIR bands such as 779/865 nm.

5. Discussion

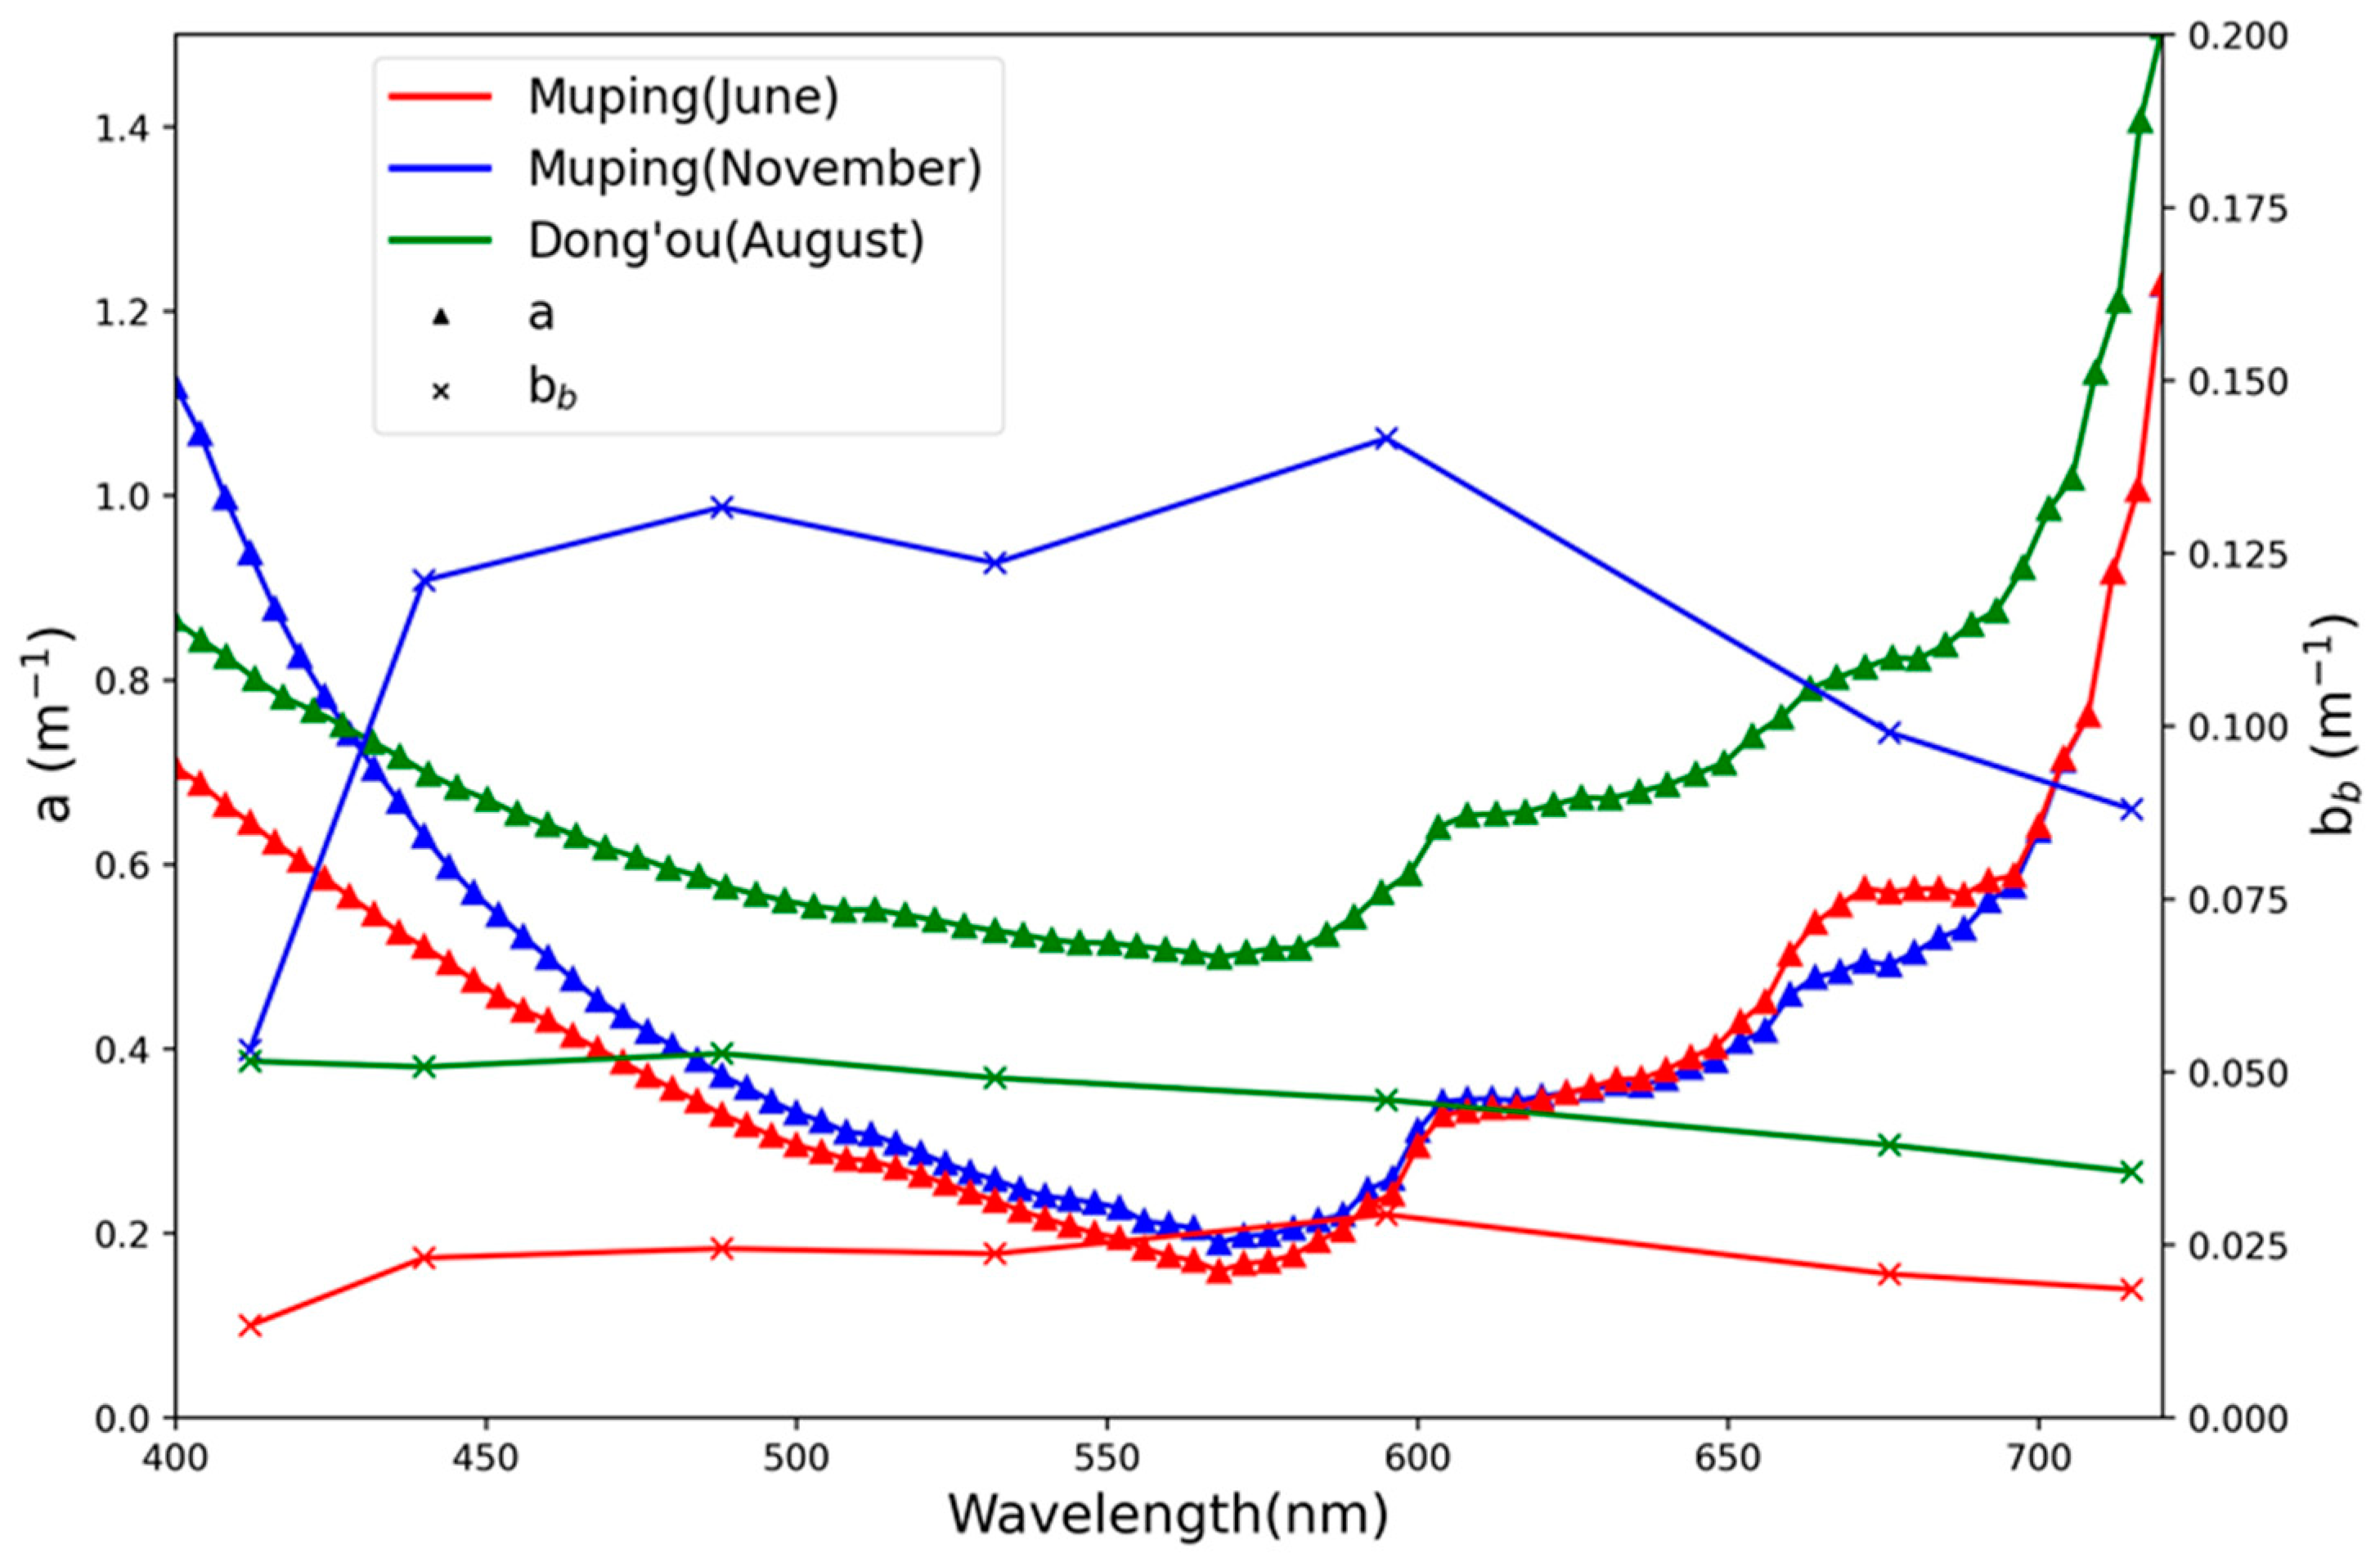
5.1. Spatial Homogeneity of Water at Two Sites

Spatial homogeneity of water is a critical factor in selecting fixed sites to support long-term ocean color data validation, which affects comparability between satellite and in situ measurement with different spatial resolution. The spatial homogeneity of water at the Dong’ou and Muping sites were assessed with coefficients of variation (CV) of Rrs derived from 20 m-resolution MSI data (Section 3.2). There were 23 cloud-free MSI images covering the Dong’ou site and 21 images covering the Muping site. In each image, the target pixel corresponding to the Dong’ou or Muping site was first identified; then, the CV of Rrs at each band was computed within 50 × 50 window (approximately 1 km) centered at the target pixel. Because of limited observations, all MSI images were grouped into spring, summer, autumn, and winter seasons. The histograms of CV of Rrs in each band at the Dong’ou and Muping sites are shown in Figure 17. In general, the mean values of CV at the Dong’ou and Muping sites are comparable, implying that waters at both sites have similar homogeneity. Relatively, the values of CV in summer and autumn are larger than those in spring and winter, which can be attributed to strong winds in spring and winter, which well mix the sea waters. However, the values of CV in different bands diverge significantly. For example, the mean CV is up to 0.14 at 665 nm, while it is only up to 0.035 at 443 nm. Keep in mind that the CV not only indicates the variations of sea water, but also includes variations of atmosphere, atmospheric correction models, waves, and noise of the satellite sensor. To estimate the effects of these factors, a MSI image acquired on 27 February 2021 covering the South China Sea, where sea water can be assumed to be homogenous, was downloaded and processed to Rrs using the SeaDAS. The values of CV were 0.011, 0.043, 0.088 and 0.16 at 443, 492, 560, and 665 nm, respectively. At 443 and 492 nm, the values of CV at the Dong’ou and Muping sites are slightly higher than those in the South China Sea, while they are comparable at 560 and 665 nm. Regarding this, waters at the Dong’ou and Muping site can be assumed to be spatially homogenous and suitable for establishing a fixed site for long-term ocean color data validation.

5.2. Satellite-Derived Rrs in the Blue Bands

When validating satellite-derived Rrs products, large uncertainties were observed in the blue bands (Table 5 and Table 6), while close agreements were achieved in other bands. A similar phenomenon has been reported in the literature. For example, Qin et al. showed that six atmospheric correction processors of MERIS had the lowest accuracy at shorter wavebands (e.g., 412 and 443 nm) [44]. Hlaing et al. found that the percent error between VIIRS-SNPP and in situ measurement is the highest at 412 nm, with up to ~50% [10]. The poor performance at blue bands, especially at 412 nm, can be mostly attributed to retrieval uncertainties resulted from the atmospheric correction procedures. Strongly absorbing aerosols, for instance, can be prominent in the coastal waters near anthropogenic sources of fossil-burning products, soot, and smog, or under the influence of dust transport. Weakly or strongly absorbing aerosols are hardly discriminable from radiance measurements in the NIR/SWIR domain, but are quite distinctive at short blue wavelengths. The standard atmospheric correction scheme cannot correctly estimate the strongly absorbing aerosols and often fails to yield robust Rrs products at the blue band in many coastal regions due to the lack of aerosol vertical distribution information. Because of this, satellite-derived Rrs (412) and Rrs (443) products are prone to large uncertainties in coastal waters [10,14,15,44,45]. With more aerosol optical properties such as particle size and optical depth inferred from CE318-TS and SeaPRISM at the two sites, absorbing aerosol models could be improved in the future.

6. Conclusions

Routinely evaluating the accuracy of ocean color data products is essential in global coastal waters. Recently, the China National Satellite Ocean Application Service has deployed two AERONET-OC type sites in the Yellow Sea and East China Sea. In this study, we described details about the location selection, platform design, instrument deployment, and the associated data processing procedure at the Muping and Dong’ou sites.
Inter-comparisons were conducted for aerosol optical depth (AOD) and remote sensing reflectance (Rrs) measured by independent instruments at the Muping site. AOD measured by CE318-TS and two SeaPRISMs agreed well with each other, with an MRPD < 0.6%. Close agreement was also achieved for downwelling irradiance (Es) and Rrs determined by SeaPRISM and RAMSES-AUTO, with an MRPD < 5% and <10% in the visible bands, respectively.
Rrs and AOD data measured at the two sites were used to evaluate the performance of MODIS/Aqua (MODISA), OLCI/Sentinel-3A (OLCI-3A), and OLCI/Sentinel-3B (OLCI-3B) operational ocean color products. Results showed that the Rrs derived from the three satellite sensors agree well with in situ measurements, with a MRPD < 25% for MODISA and <30% for OLCI-3A, and <40% for OLCI-3B, respectively (Table 5). Because of the difference in nominal wavelengths between SeaPRISM and MODISA (Table 2), a band shifting scheme developed by Mélin and Sclep [41] was applied to in situ Rrs data to compute equivalent Rrs at MODIS nominal bands. By applying the band shifting scheme, the between in situ-measured and satellite-derived Rrs were noticeably improved, particularly for data with large spectral differences. For the three satellite sensors, large uncertainties were observed in the blue bands (i.e., from 400 to 443 nm). The reason for this is currently not very clear, but we suspect it was caused by the existence of absorbing aerosol over the YS and ECS leading to the failure of standard atmospheric correction in the blue bands. Similarly, close agreements of AOD at 865 nm between satellite and in situ-measured were observed, with MRPDs of 28.1%, 30.6%, and 39.9% for MODISA, OLCI-3A, and OLCI-3B, respectively.
In situ measurements were also used to evaluate the performance of two commonly used atmospheric correction processors (i.e., ACOLITE and SeaDAS) by applying them to high spatial resolution MSI/Sentinel-2 data. Overall, close agreements were achieved for both AC processors, with SeaDAS performing slightly better than ACOLITE. The optimum band selections for AC models imbedded in the two AC processors are one near-infrared band and one short-wave infrared band, such as 865/1609 nm. The development of two long-term fixed sites providing high-quality Rrs and AOD data will be helpful to routinely validate satellite ocean color data products in the coastal waters of China.

Author Contributions

S.C. conceived and reviewed the manuscript. Q.S., S.C. and L.H. wrote the draft. X.W. and X.S. analyzed the data. X.L. and L.D. drew the figures. C.M. reviewed the manuscript. All authors have read and agreed to the published version of the manuscript.

Funding

This research was funded by the National Key R&D Program of China (2018YFB0504900) and the National Natural Science Foundation of China (No. 42176183).

Data Availability Statement

Data underlying the results presented in this paper are not publicly available at this time, but may be obtained from the authors upon reasonable request.

Acknowledgments

We thank the NASA Ocean Biology Processing Group for providing MODIS and OLCI products, and the United States Geological Survey for providing MSI data products. We also thank the entire AERONET team for their effort to maintain the instruments and sustain the ocean color component in the AERONET observational network. We appreciate Giuseppe Zibordi from the Joint Research Centre of the European Commission for their valuable comments that greatly improved this paper.

Conflicts of Interest

The authors declare no conflict of interest.

References

  1. Gregg, W.W.; Casey, N.W. Global and regional evaluation of the SeaWiFS chlorophyll data set. Remote Sens. Environ. 2004, 93, 463–479. [Google Scholar] [CrossRef]
  2. Hu, C.; Lee, Z.; Franz, B. Chlorophyll a algorithms for oligotrophic oceans: A novel approach based on three-band reflectance difference. J. Geophys. Res. 2012, 117, C01011. [Google Scholar] [CrossRef] [Green Version]
  3. Blondeau-Patissier, D.; Gower, J.F.R.; Dekker, A.G.; Phinn, S.R.; Brando, V.E. A review of ocean color remote sensing methods and statistical techniques for the detection, mapping and analysis of phytoplankton blooms in coastal and open oceans. Prog. Oceanogr. 2014, 123, 123–144. [Google Scholar] [CrossRef] [Green Version]
  4. Lahet, F.; Stramski, D. MODIS imagery of turbid plumes in San Diego coastal waters during rainstorm events. Remote Sens. Environ. 2010, 114, 332–344. [Google Scholar] [CrossRef]
  5. Wang, M.; Hu, C.; Barnes, B.B.; Mitchum, G.; Lapointe, B.; Montoya, J.P. The great Atlantic Sargassum belt. Science 2019, 365, 83–87. [Google Scholar] [CrossRef]
  6. Franz, B.A.; Bailey, S.W.; Werdell, P.J.; McClain, C.R. Sensor-independent approach to the vicarious calibration of satellite ocean color radiometry. Appl. Opt. 2007, 46, 5068–5082. [Google Scholar] [CrossRef]
  7. Eplee, R.E.; Robinson, W.D.; Bailey, S.W.; Clark, D.K.; Werdell, P.J.; Wang, M.; Barnes, R.A.; McClain, C.R. Calibration of SeaWiFS. II. Vicarious techniques. Appl. Opt. 2001, 40, 6701–6718. [Google Scholar] [CrossRef]
  8. Song, Q.; Chen, S.; Xue, C.; Lin, M.; Du, K.; Li, S.; Ma, C.; Tang, J.; Liu, J.; Zhang, T.; et al. Vicarious calibration of COCTS-HY1C at visible and near-infrared bands for ocean color application. Opt. Express 2019, 27, A1615–A1626. [Google Scholar] [CrossRef]
  9. Barnes, B.B.; Cannizzaro, J.P.; English, D.C.; Hu, C. Validation of VIIRS and MODIS reflectance data in coastal and oceanic waters: An assessment of methods. Remote Sens. Environ. 2019, 220, 110–123. [Google Scholar] [CrossRef] [Green Version]
  10. Hlaing, S.; Harmel, T.; Gilerson, A.; Foster, R.; Weidemann, A.; Arnone, R.; Wang, M.; Ahmed, S. Evaluation of the VIIRS ocean color monitoring performance in coastal regions. Remote Sens. Environ. 2013, 139, 398–414. [Google Scholar] [CrossRef]
  11. Wang, M.; Tang, J.; Shi, W. MODIS-derived ocean color products along the China east coastal region. Geophys. Res. Lett. 2007, 34, L06611. [Google Scholar] [CrossRef]
  12. Fargion, G.; McClain, C.; Fukushima, H.; Nicolas, J.; Barnes, R. Ocean Color Instrument Intercomparisons and Cross-Calibrations by the SIMBIOS Project. In Proceedings of the Remote Sensing, Florence, Italy, 20–23 September 1999; Volume 3870. [Google Scholar]
  13. Werdell, P.; Bailey, S. The SeaWiFS Bio-optical Archive and Storage System (SeaBASS): Current Architecture and Implementation; Technical Report; NASA Goddard Space Flight Center: Greenbelt, MD, USA, 2002.
  14. Zibordi, G.; Berthon, J.-F.; Mélin, F.; D’Alimonte, D.; Kaitala, S. Validation of satellite ocean color primary products at optically complex coastal sites: Northern Adriatic Sea, Northern Baltic Proper and Gulf of Finland. Remote Sens. Environ. 2009, 113, 2574–2591. [Google Scholar] [CrossRef]
  15. Antoine, D.; d’Ortenzio, F.; Hooker, S.B.; Bécu, G.; Gentili, B.; Tailliez, D.; Scott, A.J. Assessment of uncertainty in the ocean reflectance determined by three satellite ocean color sensors (MERIS, SeaWiFS and MODIS-A) at an offshore site in the Mediterranean Sea (BOUSSOLE project). J. Geophys. Res. Ocean. 2008, 113, C07013. [Google Scholar] [CrossRef]
  16. Zibordi, G.; Mélin, F.; Berthon, J.-F.; Holben, B.; Slutsker, I.; Giles, D.; D’Alimonte, D.; Vandemark, D.; Feng, H.; Schuster, G.; et al. AERONET-OC: A Network for the Validation of Ocean Color Primary Products. J. Atmos. Ocean. Technol. 2009, 26, 1634–1651. [Google Scholar] [CrossRef]
  17. Zibordi, G.; Holben, B.; Mélin, F.; D’Alimonte, D.; Berthon, J.F.; Slutsker, I.; Giles, D. AERONET-OC: An overview. Can. J. Remote Sens. 2010, 36, 488–497. [Google Scholar] [CrossRef]
  18. Zhang, G.; Yang, S.; Yu, Z. Temporal and spatial changes of suspended sediment concentration and resuspension in the Yangtze River Estuary and its adjacent waters. Acta Geogr. Sin. 2004, 59, 260–266. [Google Scholar]
  19. Lou, S.; Russell, L.M.; Yang, Y.; Xu, L.; Lamjiri, M.A.; DeFlorio, M.J.; Miller, A.J.; Ghan, S.J.; Liu, Y.; Singh, B. Impacts of the East Asian Monsoon on springtime dust concentrations over China. J. Geophys. Res. (Atmos.) 2016, 121, 8137–8152. [Google Scholar] [CrossRef]
  20. Shen, F.; Verhoef, W.; Zhou, Y.; Salama, M.S.; Liu, X. Satellite Estimates of Wide-Range Suspended Sediment Concentrations in Changjiang (Yangtze) Estuary Using MERIS Data. Estuaries Coasts 2010, 33, 1420–1429. [Google Scholar] [CrossRef]
  21. Zhang, M.; Tang, J.; Dong, Q.; Song, Q.; Ding, J. Retrieval of total suspended matter concentration in the Yellow and East China Seas from MODIS imagery. Remote Sens. Environ. 2010, 114, 392–403. [Google Scholar] [CrossRef]
  22. Shen, F.; Zhou, Y.; Li, J.; He, Q.; Verhoef, W. Remotely sensed variability of the suspended sediment concentration and its response to decreased river discharge in the Yangtze estuary and adjacent coast. Cont. Shelf Res. 2013, 69, 52–61. [Google Scholar] [CrossRef]
  23. Lee, Z.; Carder, K.L.; Mobley, C.D.; Steward, R.G.; Patch, J.S. Hyperspectral Remote Sensing for Shallow Waters. I. A Semianalytical Model. Appl. Opt. 1998, 37, 6329–6338. [Google Scholar] [CrossRef]
  24. Holben, B.N.; Eck, T.F.; Slutsker, I.; Tanré, D.; Buis, J.P.; Setzer, A.; Vermote, E.; Reagan, J.A.; Kaufman, Y.J.; Nakajima, T.; et al. AERONET—A Federated Instrument Network and Data Archive for Aerosol Characterization. Remote Sens. Environ. 1998, 66, 1–16. [Google Scholar] [CrossRef]
  25. Zibordi, G.; Melin, F.; Hooker, S.B.; Alimonte, D.D.; Holben, B. An autonomous above-water system for the validation of ocean color radiance data. IEEE Trans. Geosci. Remote Sens. 2004, 42, 401–415. [Google Scholar] [CrossRef]
  26. Zibordi, G.; Holben, B.; Hooker, S.; Mélin, F.; Berthon, J.-F.; Slutsker, I.; Giles, D.; Vandemark, D.; Feng, H.; Rutledge, K.; et al. A Network for Standardized OceanColor Validation Measurements. Eos Trans. Am. Geophys. Union 2006, 87, 293–297. [Google Scholar] [CrossRef] [Green Version]
  27. Hooker, S.B.; Zibordi, G. Platform perturbations in above-water radiometry. Appl. Opt. 2005, 44, 553–567. [Google Scholar] [CrossRef]
  28. Giles, D.M.; Sinyuk, A.; Sorokin, M.G.; Schafer, J.S.; Smirnov, A.; Slutsker, I.; Eck, T.F.; Holben, B.N.; Lewis, J.R.; Campbell, J.R.; et al. Advancements in the Aerosol Robotic Network (AERONET) Version 3 database-automated near-real-time quality control algorithm with improved cloud screening for Sun photometer aerosol optical depth (AOD) measurements. Atmos. Meas. Tech. 2019, 12, 169–209. [Google Scholar] [CrossRef] [Green Version]
  29. Bodhaine, B.A.; Wood, N.B.; Dutton, E.G.; Slusser, J.R. On Rayleigh Optical Depth Calculations. J. Atmos. Ocean. Technol. 1999, 16, 1854–1861. [Google Scholar] [CrossRef]
  30. Mobley, C.D. Estimation of the remote-sensing reflectance from above-surface measurements. Appl. Opt. 1999, 38, 7442–7455. [Google Scholar] [CrossRef]
  31. Thuillier, G.; Hersé, M.; Labs, D.; Foujols, T.; Peetermans, W.; Gillotay, D.; Simon, P.C.; Mandel, H. The Solar Spectral Irradiance from 200 to 2400 nm as Measured by the SOLSPEC Spectrometer from the Atlas and Eureca Missions. Sol. Phys. 2003, 214, 1–22. [Google Scholar] [CrossRef]
  32. Deschamps, P.-Y.; Fougnie, B.; Frouin, R.; Lecomte, P.; Verwaerde, C. SIMBAD: A field radiometer for satellite ocean-color validation. Appl. Opt. 2004, 43, 4055–4069. [Google Scholar] [CrossRef]
  33. Morel, A.; Gentili, B. Diffuse reflectance of oceanic waters. II Bidirectional aspects. Appl. Opt. 1993, 32, 6864–6879. [Google Scholar] [CrossRef]
  34. Lee, Z.P.; Du, K.; Voss, K.J.; Zibordi, G.; Lubac, B.; Arnone, R.; Weidemann, A. An inherent-optical-property-centered approach to correct the angular effects in water-leaving radiance. Appl. Opt. 2011, 50, 3155–3167. [Google Scholar] [CrossRef]
  35. Lee, Z.; Carder, K.L.; Arnone, R.A. Deriving Inherent Optical Properties from Water Color: A Multiband Quasi-Analytical Algorithm for Optically Deep Waters. Appl. Opt. 2002, 41, 5755–5772. [Google Scholar] [CrossRef]
  36. Vanhellemont, Q.; Ruddick, K. Turbid wakes associated with offshore wind turbines observed with Landsat 8. Remote Sens. Environ. 2014, 145, 105–115. [Google Scholar] [CrossRef] [Green Version]
  37. Vanhellemont, Q.; Ruddick, K. Atmospheric correction of metre-scale optical satellite data for inland and coastal water applications. Remote Sens. Environ. 2018, 216, 586–597. [Google Scholar] [CrossRef]
  38. Vanhellemont, Q. Adaptation of the dark spectrum fitting atmospheric correction for aquatic applications of the Landsat and Sentinel-2 archives. Remote Sens. Environ. 2019, 225, 175–192. [Google Scholar] [CrossRef]
  39. Gordon, H.R.; Wang, M. Retrieval of water-leaving radiance and aerosol optical thickness over the oceans with SeaWiFS: A preliminary algorithm. Appl. Opt. 1994, 33, 443–452. [Google Scholar] [CrossRef]
  40. Bailey, S.W.; Franz, B.A.; Werdell, P.J. Estimation of near-infrared water-leaving reflectance for satellite ocean color data processing. Opt. Express 2010, 18, 7521–7527. [Google Scholar] [CrossRef]
  41. Mélin, F.; Sclep, G. Band shifting for ocean color multi-spectral reflectance data. Opt. Express 2015, 23, 2262–2279. [Google Scholar] [CrossRef]
  42. Tilstone, G.; Dall’Olmo, G.; Hieronymi, M.; Ruddick, K.; Beck, M.; Ligi, M.; Costa, M.; D’Alimonte, D.; Vellucci, V.; Vansteenwegen, D.; et al. Field Intercomparison of Radiometer Measurements for Ocean Colour Validation. Remote Sens. 2020, 12, 1587. [Google Scholar] [CrossRef]
  43. Zibordi, G.; Ruddick, A.; Ansko, I.; Moore, G.; Kratzer, S.; Icely, S.; Noorma, A. In situ determination of the remote sensing reflectance: An inter-comparison. Ocean Sci. 2012, 8, 567–586. [Google Scholar] [CrossRef] [Green Version]
  44. Qin, P.; Simis, S.G.H.; Tilstone, G.H. Radiometric validation of atmospheric correction for MERIS in the Baltic Sea based on continuous observations from ships and AERONET-OC. Remote Sens. Environ. 2017, 200, 263–280. [Google Scholar] [CrossRef] [Green Version]
  45. Feng, H.; Vandemark, D.; Campbell, J.W.; Holben, B.N. Evaluation of MODIS ocean colour products at a northeast United States coast site near the Martha’s Vineyard Coastal Observatory. Int. J. Remote Sens. 2008, 29, 4479–4497. [Google Scholar] [CrossRef]
Figure 1. Locations of the initial six AERONET-OC sites (blue dots), expanded twenty-six sites (red dots), and the two fixed platforms, i.e., Muping and Dong’ou (black dots), in the Yellow Sea and East China Sea, respectively.
Remotesensing 14 02894 g001
Figure 2. (a) Location of ten AERONET-OC type sites along the China coast. The black dots are the Muping and Dong’ou sites and the red dots are the eight sites under construction. The background is the annual mean chlorophyll concentration derived from MODIS/Aqua in 2021. (b,c) are photographs of platforms at the Muping and Dong’ou sites. The inserts are the instruments (SeaPRISM, CE318-TS, and RAMSES-AUTO) deployed on each platform.
Remotesensing 14 02894 g002
Figure 3. In situ-measured absorption coefficient (triangle, left y-axis) and backscattering coefficient (star, right y-axis) in June (red line) and November (blue line) at the Muping site and in August (green line) at the Dong’ou site.
Remotesensing 14 02894 g003
Figure 4. The relative spectral response function (SRF) of SeaPRISM, MODISA, OLCI-3A&3B, and MSI.
Remotesensing 14 02894 g004
Figure 5. Density scatter plot of aerosol optical depth (AOD) between (a) SeaPRISM (1589) vs. CE318-TS and (b) SeaPRISM (1589) vs. SeaPRISM (1590). Data in (a) were measured before 10 June 2020 and compared at 442, 510, 667, 865, and 1020 nm. Data in (b) were measured after 10 June 2020 and compared at 400, 412, 442, 490, 510, 560, 620, 667, 779, 865, and 1020 nm. The statistic parameters, including the total number of matched measurements (N), median relative percentage difference (MRPD), root mean square error (RMSE), and Pearson correlation coefficient (r), are overlaid.
Remotesensing 14 02894 g005
Figure 6. Scatter plot of downwelling irradiance (Es) between SeaPRISM (1589) and RAMSES-AUTO at the Muping site at (a) 400, 412, 442, 490 nm, and (b) 510, 560, 620, and 667 nm.
Remotesensing 14 02894 g006
Figure 7. Scatter plots of remote sensing reflectance (Rrs) comparison between the SeaPRISM and RAMSES-AUTO at wavelengths of (a) 400, 412, 442, and 490 nm, and (b) 510, 560, 620 and 667 nm.
Remotesensing 14 02894 g007
Figure 8. SeaPRISM−measured spectral aerosol optical depth (AOD) at the (a) Dong’ou and (c) Muping sites. The grey lines represent all AOD measurements. The black solid and dash lines are the median and one standard deviation of AOD. (b,d) are the histograms of Ångström Exponent at Dong’ou and Muping sites, respectively.
Remotesensing 14 02894 g008
Figure 9. SeaPRISM-measured time-series aerosol optical depth (AOD) at 865 nm at the (a) Dong’ou and (b) Muping sites. The grey dots represent all valid AOD measurements and the black dots are the monthly mean values.
Remotesensing 14 02894 g009
Figure 10. SeaPRISM-measured remote sensing reflectance (Rrs) at the (a) Dong’ou and (b) Muping sites. The grey lines represent all Rrs measurements. The black solid and dashed lines are the median and one standard deviation of Rrs, respectively.
Remotesensing 14 02894 g010
Figure 11. Comparison of mean and standard deviation of (a) Rrs and (b) AOD at 14 AERONET-OC sites, as well as the Dong’ou and Muping sites.
Remotesensing 14 02894 g011
Figure 12. SeaPRISM-measured time-series remote sensing reflectance (Rrs) at 560 nm at the (a) Dong’ou and (b) Muping sites. The grey dots represent all valid Rrs measurements and the black dots are the monthly mean values.
Remotesensing 14 02894 g012
Figure 13. Validation of remote sensing reflectance (Rrs) derived from (a) MODIS/Aqua (MODISA), (b) OLCI/Sentinel-3A (OLCI-3A), (c) OLCI/Sentinel-3B (OLCI-3B) and (d) aerosol optical depth at 865 nm, τ ( 865 ) , with in situ data measured by SeaPRISMs at the Muping and Dong’ou site, respectively.
Remotesensing 14 02894 g013
Figure 14. Validation of MSI-derived remote sensing reflectance (Rrs) with in situ measurements at the Dong’ou and Muping sites at (a) 443 nm, (b) 492 nm, (c) 560 nm, and (d) 665 nm. The MSI Level 1C data were processed to Rrs using the ACOLITE with the dark spectrum fitting (DSF) and exponent extrapolation (EXP) models with four band combinations (779/865, 865/1609, 865/2201, and 1609/2201).
Remotesensing 14 02894 g014
Figure 15. Validation of MSI-derived remote sensing reflectance (Rrs) with in situ measurements at the Dong’ou and Muping sites at (a) 443 nm, (b) 492 nm, (c) 560 nm, and (d) 665 nm. The MSI Level 1C data were processed to Rrs using the SeaDAS with four band combinations (779/865, 865/1609, 865/2201, and 1609/2201).
Remotesensing 14 02894 g015
Figure 16. Validation of MSI-derived aerosol optical depth (a) at 550 nm, τ (550), using ACOLITE and (b) at 865 nm, τ (865), using SeaDAS with four band combinations (779/865, 865/1609, 865/2201, and 1609/2201).
Remotesensing 14 02894 g016
Figure 17. The mean and one standard deviation of coefficient of variation (CV) of remote sensing reflectance (Rrs) at (a) 443, (b) 492, (c) 560, and (d) 665 nm at the Dong’ou (blue bars) and Muping (black bars) sites. The figure on top of the bar indicates the number of images used to compute the mean and standard deviation of CV.
Remotesensing 14 02894 g017
Table 1. Parameters of Muping and Dong’ou platforms. The height refers to SeaPRISM and roof of the platform (number in the parentheses) above the sea surface.
NameLocationTypeDepthBottom ContributionDistanceHeight
Muping121.701°E
37.681°N
Semi-submersible18 m<10−322 km10 (7) m
Dong’ou121.355°E
27.675°N
Bottom-supported30 m<10−1725 km13 (10) m
Table 2. Nominal wavelengths (nm) of SeaPRISM, MODISA, OLCI-3A&3B, and MSI in the visible region.
SeaPRISMMODISAOLCI-3A&3BMSI
400 400
412412412
442443442443
469
490488 492
510 510
531
547
560555560560
620 620
645
667667665665
Table 3. Statistical parameters for the comparison of downwelling irradiance (Es) determined by SeaPRISM and RAMSES_AUTO at the Muping site, including median relative percentage difference (MRPD), root mean square error (RMSE, in mw2 m−2 nm−1), mean ratio (mR), mean bias (mB, in mw2 m−2 nm−1), and Pearson correlation efficient (r).
Wavelength (nm)MRPD (%)RMSE mRmBr
4004.7352.60.97−31.90.98
4123.7046.21.000.30.98
4423.7451.60.99−17.30.99
4903.1450.61.001.10.99
5103.9656.40.98−27.20.99
5602.9049.31.006.60.99
6202.8845.91.002.90.99
6672.8444.11.002.10.98
Table 4. Statistical parameters for the comparison of Rrs determined by SeaPRISM and RAMSES_AUTO at the Muping site including median relative percentage difference (MRPD), root mean square error (RMSE, in sr−1), mean ratio (mR), mean bias (mB, in sr−1), and Pearson correlation efficient (r).
Wavelength (nm)MRPD (%)RMSEmRmBr
4009.670.00081.060.00020.86
4129.480.00091.070.00030.90
4429.290.00081.000.00010.95
4906.330.00131.060.00050.94
5105.300.00121.060.00060.96
5606.920.00130.99−0.00010.96
6206.600.00071.0200.96
6677.920.00051.0100.96
Table 5. The median relative percentage difference (MRPD) and root mean square error (RMSE) of remote sensing reflectance (Rrs) in the visible bands between SeaPRISM-measured and MODIS- or OLCI-derived data at the Muping and Dong’ou sites. * indicates the bands where the shifting scheme developed by Mélin and Sclep [41] was applied.
MODISAOLCI-3AOLCI-3B
λ
(nm)
MRPD (%)RMSE
(sr−1)
λ
(nm)
MRPD (%)RMSE
(sr−1)
MRPD (%)RMSE
(sr−1)
41222.920.003440026.630.002939.470.003
443 *21.950.003341223.280.002734.150.0028
469 *10.450.002944214.860.002223.100.0025
488 *10.990.002851010.490.001810.740.0019
531 *8.150.00265606.620.00178.260.0017
547 *9.710.00276209.030.001613.240.0013
555 *10.160.002466512.860.001613.460.0009
645 *14.190.0018
66710.450.0013
Table 6. The median relative percentage difference of remote sensing reflectance (Rrs) at 443, 492, 560, and 665 nm, and aerosol optical depth at 550 nm, τ (550), and 865 nm, τ (865), between the SeaPRISM and MSI-derived products using the ACOLITE and SeaDAS atmospheric correction software packages at the Muping and Dong’ou sites.
DSFEXP(779/865)EXP(865/1609)EXP(865/2201)EXP(1609/2201)
ACOLITERrs (443)70.0%30.7%50.1%68.5%107.6%
Rrs (492)26.6%21.0%14.3%12.6%32.9%
Rrs (560)16.1%31.7%21.4%14.2%8.2%
Rrs (665)82.2%25.7%19.6%30.1%108.3%
τ (550)46.6%---
SeaDASRrs (443)-42.7%13.1%15.6%48.4%
Rrs (492)-8.5%16.5%17.7%39.6%
Rrs (560)-6.0%11.5%12.6%24.9%
Rrs (665)-28.9%14.6%15.5%47.2%
τ (865)-30.4%14.3%15.1%23.2%
Publisher’s Note: MDPI stays neutral with regard to jurisdictional claims in published maps and institutional affiliations.

