1. Introduction
UAVs have become a valuable platform for obtaining digital images, and are deployed as a measuring instrument for numerous geomatic and geospatial applications [
1]. UAV-DAP, classified as close-range aerial photogrammetry, is a versatile, accessible, and economical topographical method that can be rapidly developed to reconstruct the surface geometry of 3D objects [
2]. Although the equipment was initially used only for military purposes, this method is now more widely used in the world of geomatics [
3]. This technique offers excellent potential for mapping and remote sensing (RS) and satisfies the market’s needs for remote observation data.
UAV-DAP is one of the most widely used RS techniques in small extension studies, due to its flexibility in data acquisition, low operating costs, and high spatial and temporal resolution [
3,
4]. UAV-DAP is based on structure from motion (SfM) algorithms, and uses the high spatial resolution of photographs to recognise textures [
5] and orient the photographs by identifying common points, without the need to know the camera parameters or the grid geometry [
6]. It produces results such as digital surface models (DSM), contour lines and orthomosaics, which are used in a range of studies, such as the inspection and surveillance of natural risks [
7], infrastructures or civil engineering works [
8], calculating earth movements in open mines or quarries, levelling beaches [
9], coastal monitoring [
10], landslides monitoring [
11], subsidence analysis [
12], fire surveillance [
13], precision agriculture [
14], forest inventories [
15], and vegetation monitoring [
16].
Among the main advantages of UAV-DAP is its lower application cost compared to lidar (light detection and ranging) technology [
17], while its results are similar in terms of precision and spatial resolution [
18]. Compared to classic topography (GNSS, total station, tachymetry), one of the most important benefits is the generation of a dense cloud with less fieldwork. The UAV-DAP technique has a higher spatial resolution [
19] than the satellite segment and allows data to be obtained under cloud cover.
There are currently a range of applications for planning and automating flights with UAV and photo processing programmes.
During the flight planning phase, it is necessary to know the legal aspects governing the flight, and to verify whether the study zone is within an urban or rural area and whether it is affected by any restrictions from the civil aviation authority. The regulations in each country (Ref. [
20], for the case of Spain) and the general specifications of the equipment, contained in the manufacturer’s manual, must be followed to operate the UAV. There is usually an obligation to obtain an operating licence in order to avoid accidents and prevent causing harm to third parties.
In regard to technical aspects, the correct location of the ground control points (GCPs), flight time, maximum sensor speed, and the orientation and position of the photographs to be captured must be established, and the programmed flight must be uploaded to the application to be used. It is important to consider the solar height and the GNSS satellite constellation, and to review any meteorological phenomena that directly impact the flight (Regulation (EU) 2019/947). There are also some general recommendations, such as determining the topography of the area using a digital elevation model (DEM), in the case of steep terrain, as this produces a better image cover and a more homogeneous ground sampling distance (GSD) [
21]. On this type of terrain, or when there are occlusions, it is recommended to take oblique photographs to improve the orientation process and obtain more orthogonal shots of the subject.
The aspects that affect the accuracy of the camera orientation, and hence the photogrammetric outputs, include the loss of the GNSS signal and the transformations in the system of coordinates (image-terrain).
The GCPs allow the absolute orientation, transforming the solution to its position on the ground. In absolute orientation, the cartographic product is oriented, levelled, and scaled. In photogrammetric flights, the GCPs must therefore be taken strategically, preferably on the periphery or on the corners of the block for the planimetric component, so that the transmission error is minimal inside the block, in the case of regular surveys. Chains of GCPs located across the block should be used for altimetric control to reduce altimetric error; another option is to make cross strips at the ends of the block or every certain number of models, to minimise altimetric error, or in the case of surveys with several flights. Therefore, the strips are stabilised in the direction of the flight, producing a more stable solution [
22].
The number of GCPs directly influences the model’s accuracy [
23,
24,
25,
26,
27,
28]. In this sense, to increase the accuracy of the bundle block adjustment, it is recommended to understand the behaviour of the planimetric and altimetric errors based on the number of GCPs. For altimetry, the GCPs should be distributed across the flight lines along chains or cross strips on the edges of the block [
2,
23]. However, currently, there is usually no distinction between planimetric control and altimetric control, and surveyors measure full XYZ coordinates. Besides, the absence of GCPs makes it challenging to detect coarse global errors [
23,
29].
The influence of the number of GCPs has been recently studied for UAVs based on the area studied.
Table 1 summarises the error reported in different contributions, showing how a greater density of GCPs per hectare (ha) may not directly increase the accuracy of the photogrammetric bundle block adjustment.
The main aim of this study is to demonstrate how the flight plan influences the results obtained with UAV-DAP by applying aerial triangulation with bundle block adjustment.
2. Materials and Methods
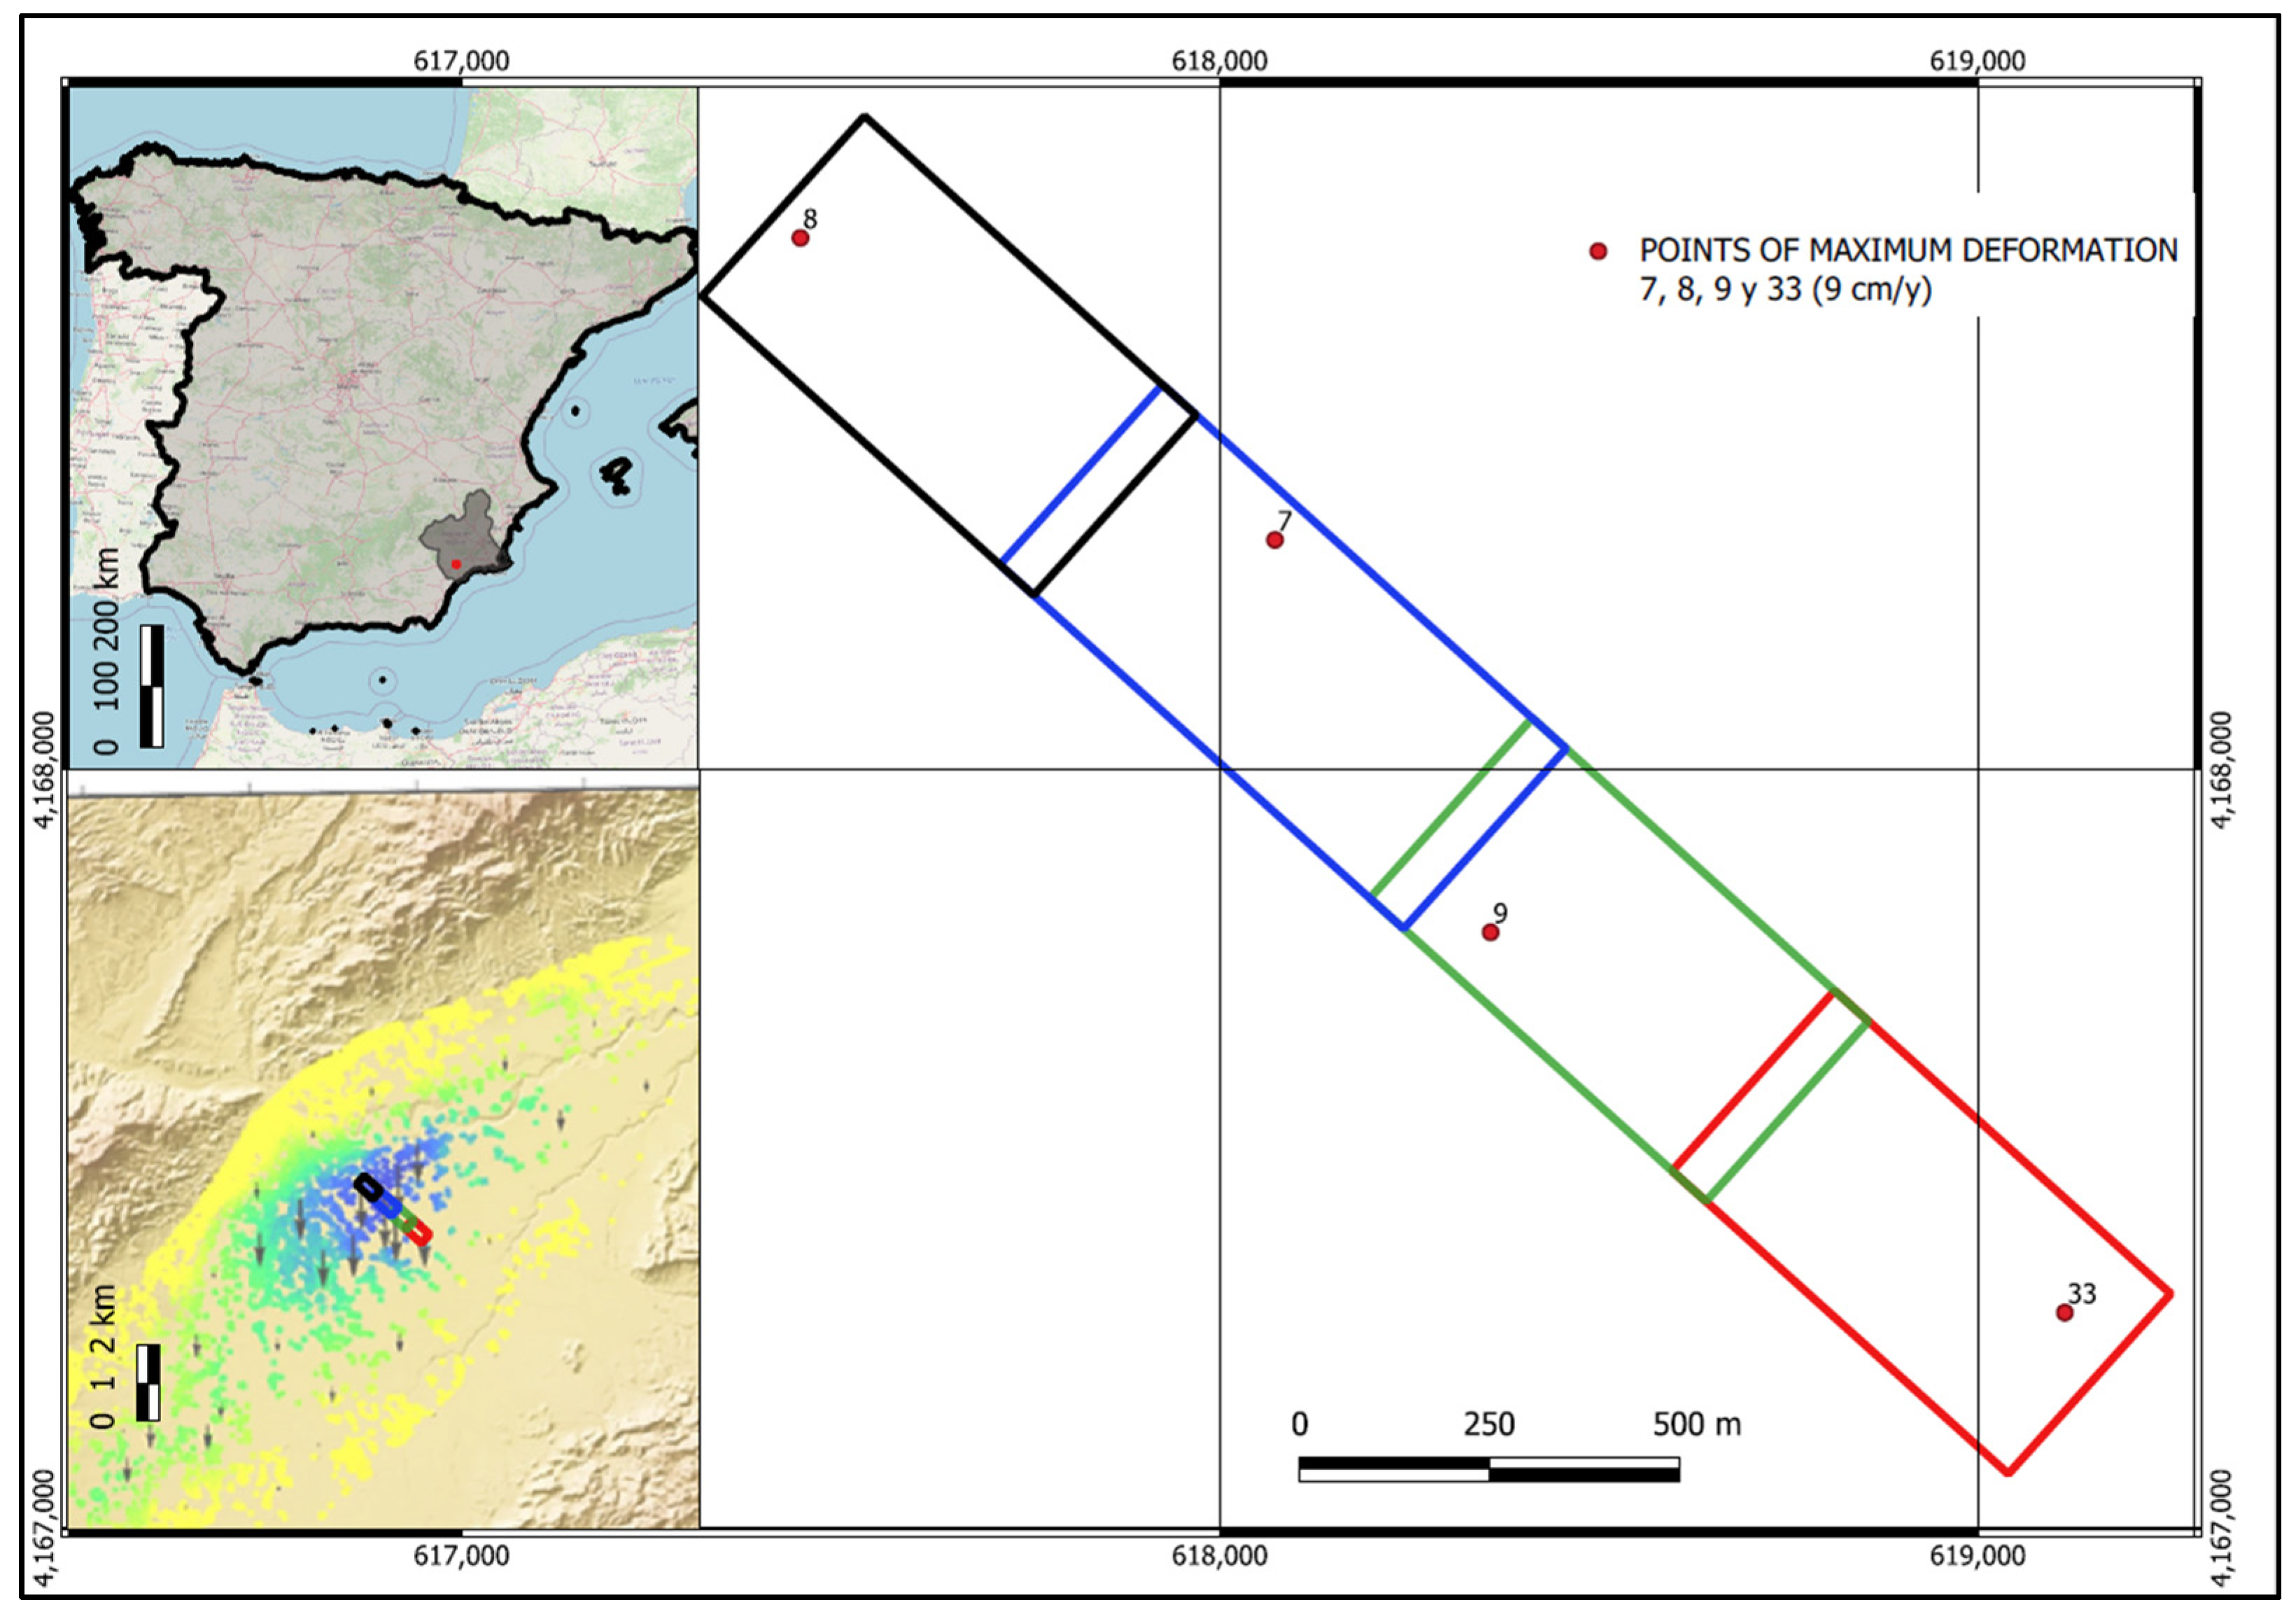
The study was conducted in Lorca (Murcia, Spain). The study zone has been continually monitored for ten years. It presents important subduction of the terrain due to the intensive overexploitation of the local aquifers, which has led to deformations in the vertical and horizontal components of up to 10 cm/year [
35,
36,
37,
38]. Prior to the flights, NOTAM information for the area to be flown was reviewed. The information was consulted on the geoportal dedicated to drone flights of the Spanish Aviation Safety and Security Agency (
https://drones.enaire.es/ accessed on 15 May 2021). A UAV photogrammetric survey was carried out during the field campaign (May 2021), dividing the area of interest into four blocks to cover a total area of 80 ha (
Figure 1); the areas of each block are shown in
Table 2, with the type of UAV used.
During the flights, there was a NOTAM in force in the area affecting Flight Level 100/Flight Level 220, issued by the General Air Academy based in San Javier (Murcia), so we had to coordinate operations with the control tower.
Two multirotor UAVs were used to acquire photogrammetric data: a DJI Phantom 3 Pro (
Figure 2a) and a DJI Inspire 2, equipped with a Zenmuse X5S camera (
Figure 2b). The camera specifications are shown in
Table 3. The flights were made under a VLOS (Visual Line of Sight) operational scenario with the visual scope of the UAV, using the Dronedeploy application for the flight plan [
39]. The meteorological conditions for the flights were optimal: a sunny day with calm winds.
2.1. GNSS Campaign
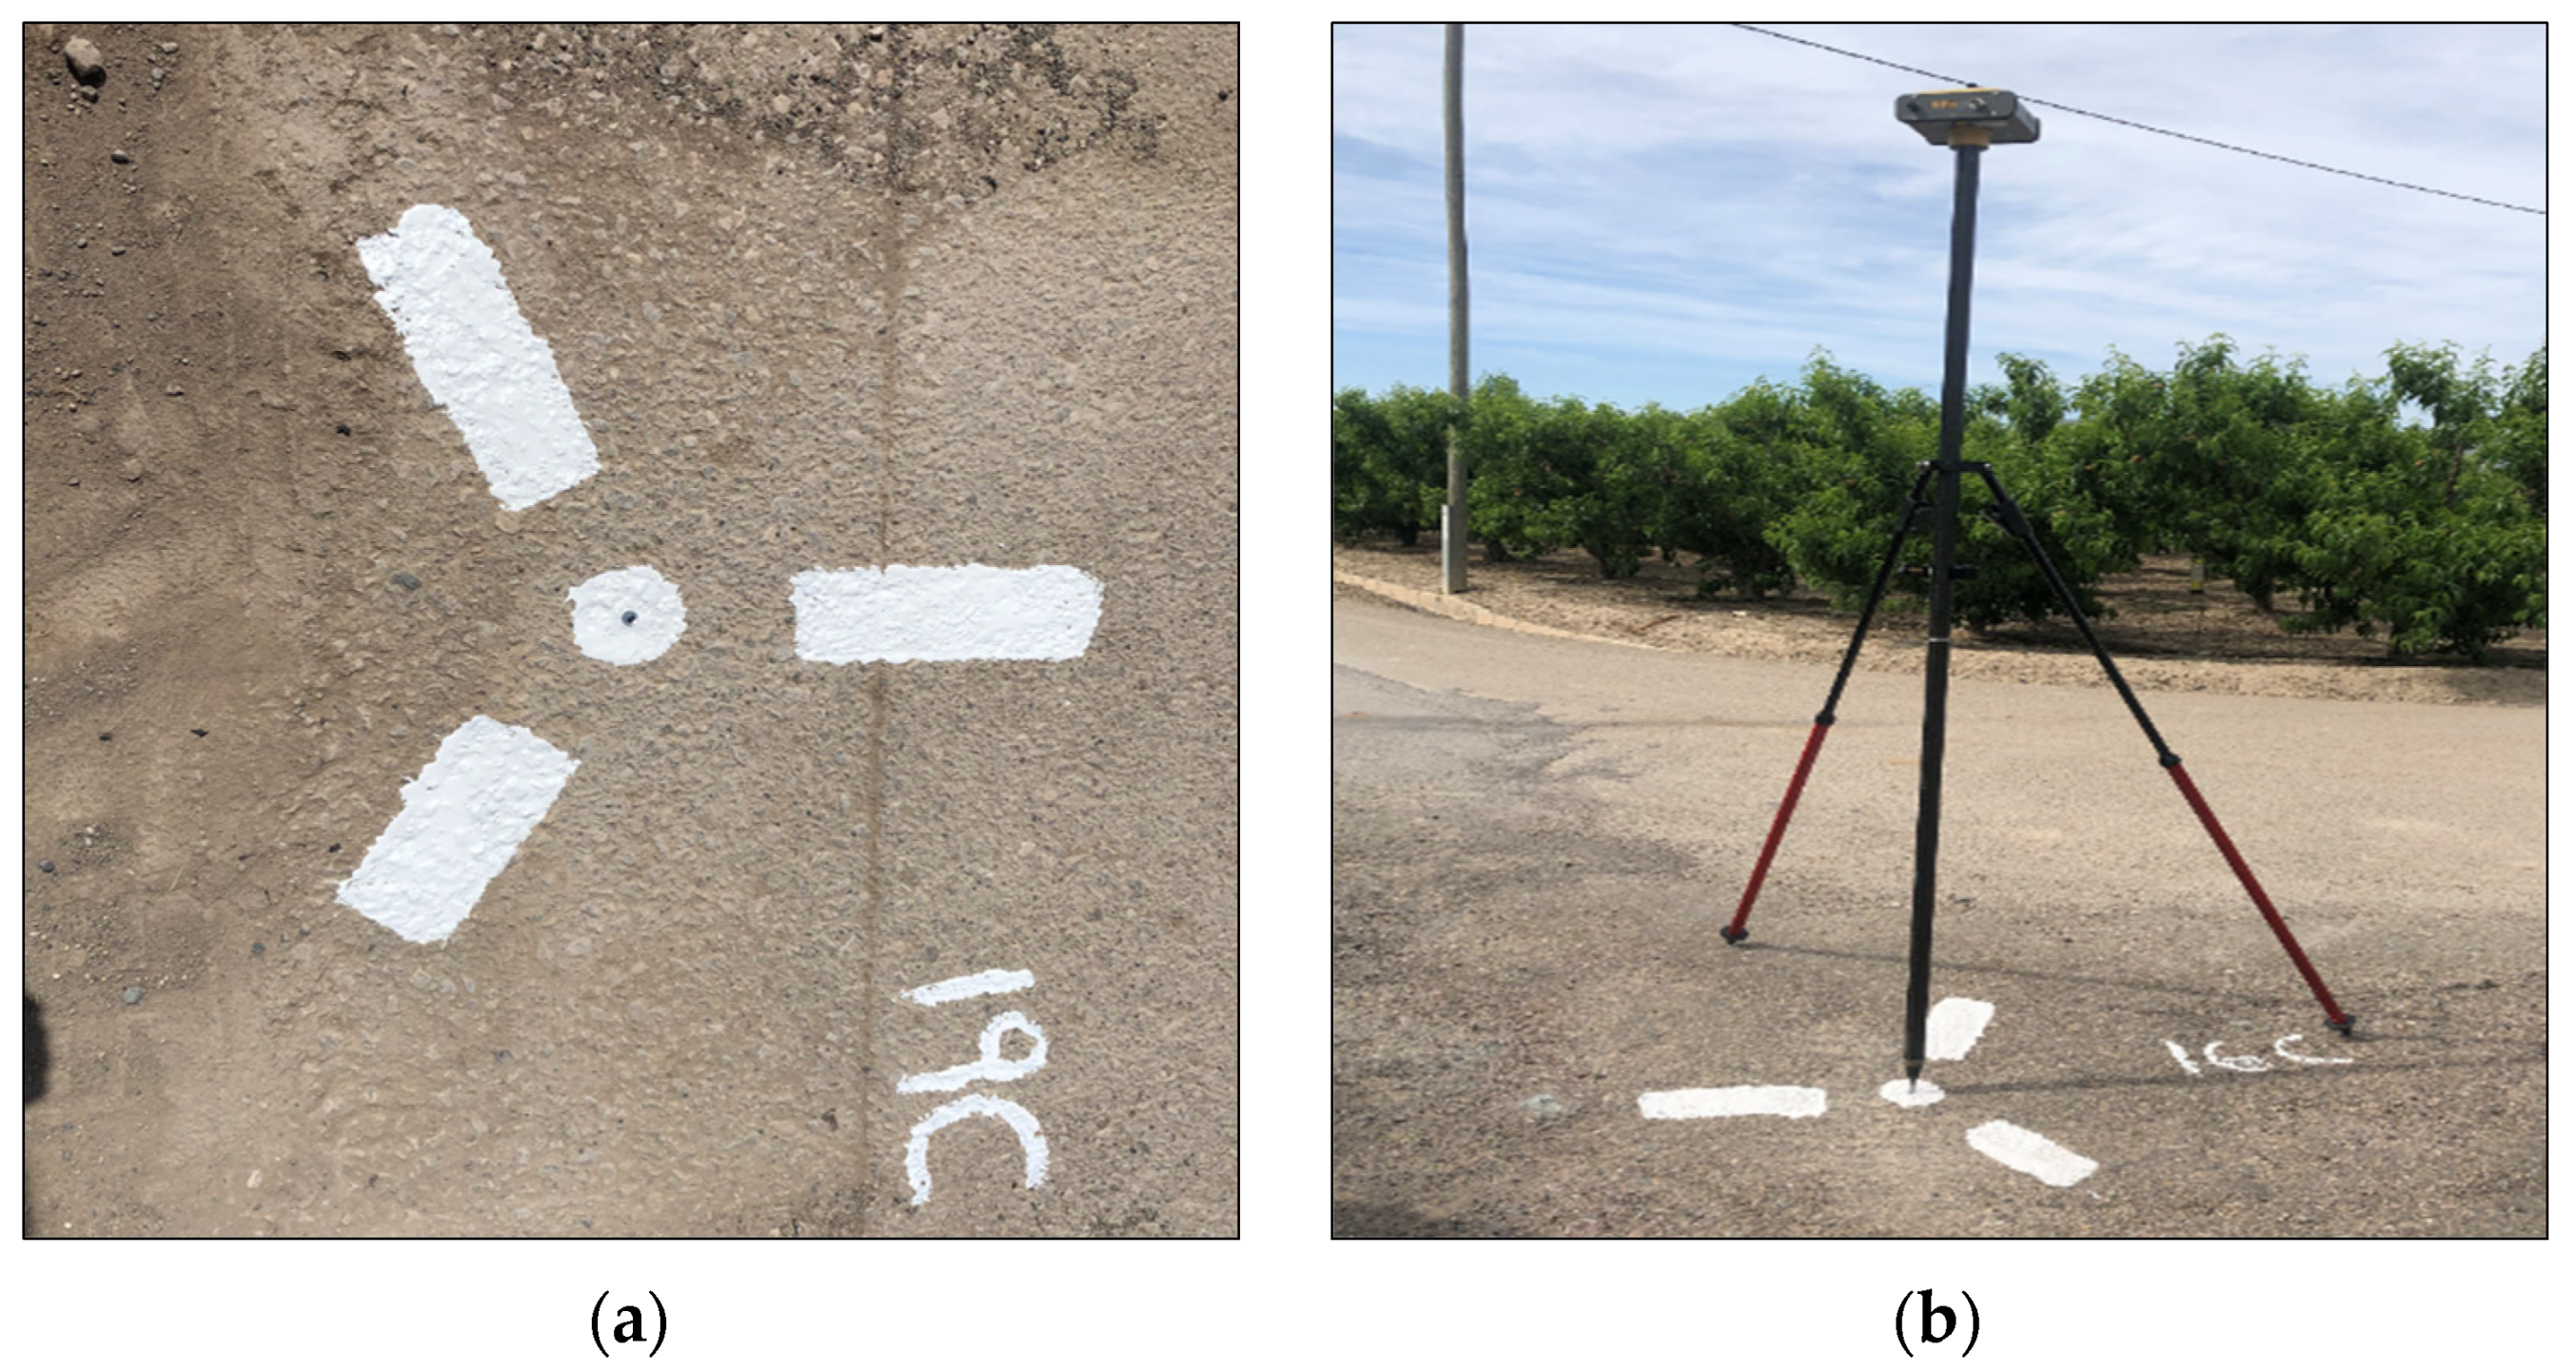
The GCPs and ChPs (check points), also known as ground evaluation points (GEP), were marked before the flight. This was done by creating a cardboard template of a target of 60 cm × 60 cm comprising three blades, each separated by 120°, and a central circle. Each point was marked using reflective white paint, and a survey nail was placed in the centre (
Figure 3a).
All the points (GCPs and ChPs) were measured with dual-frequency GNSS receivers (GPS + GLONASS) on a tripod and centred on the point mark (
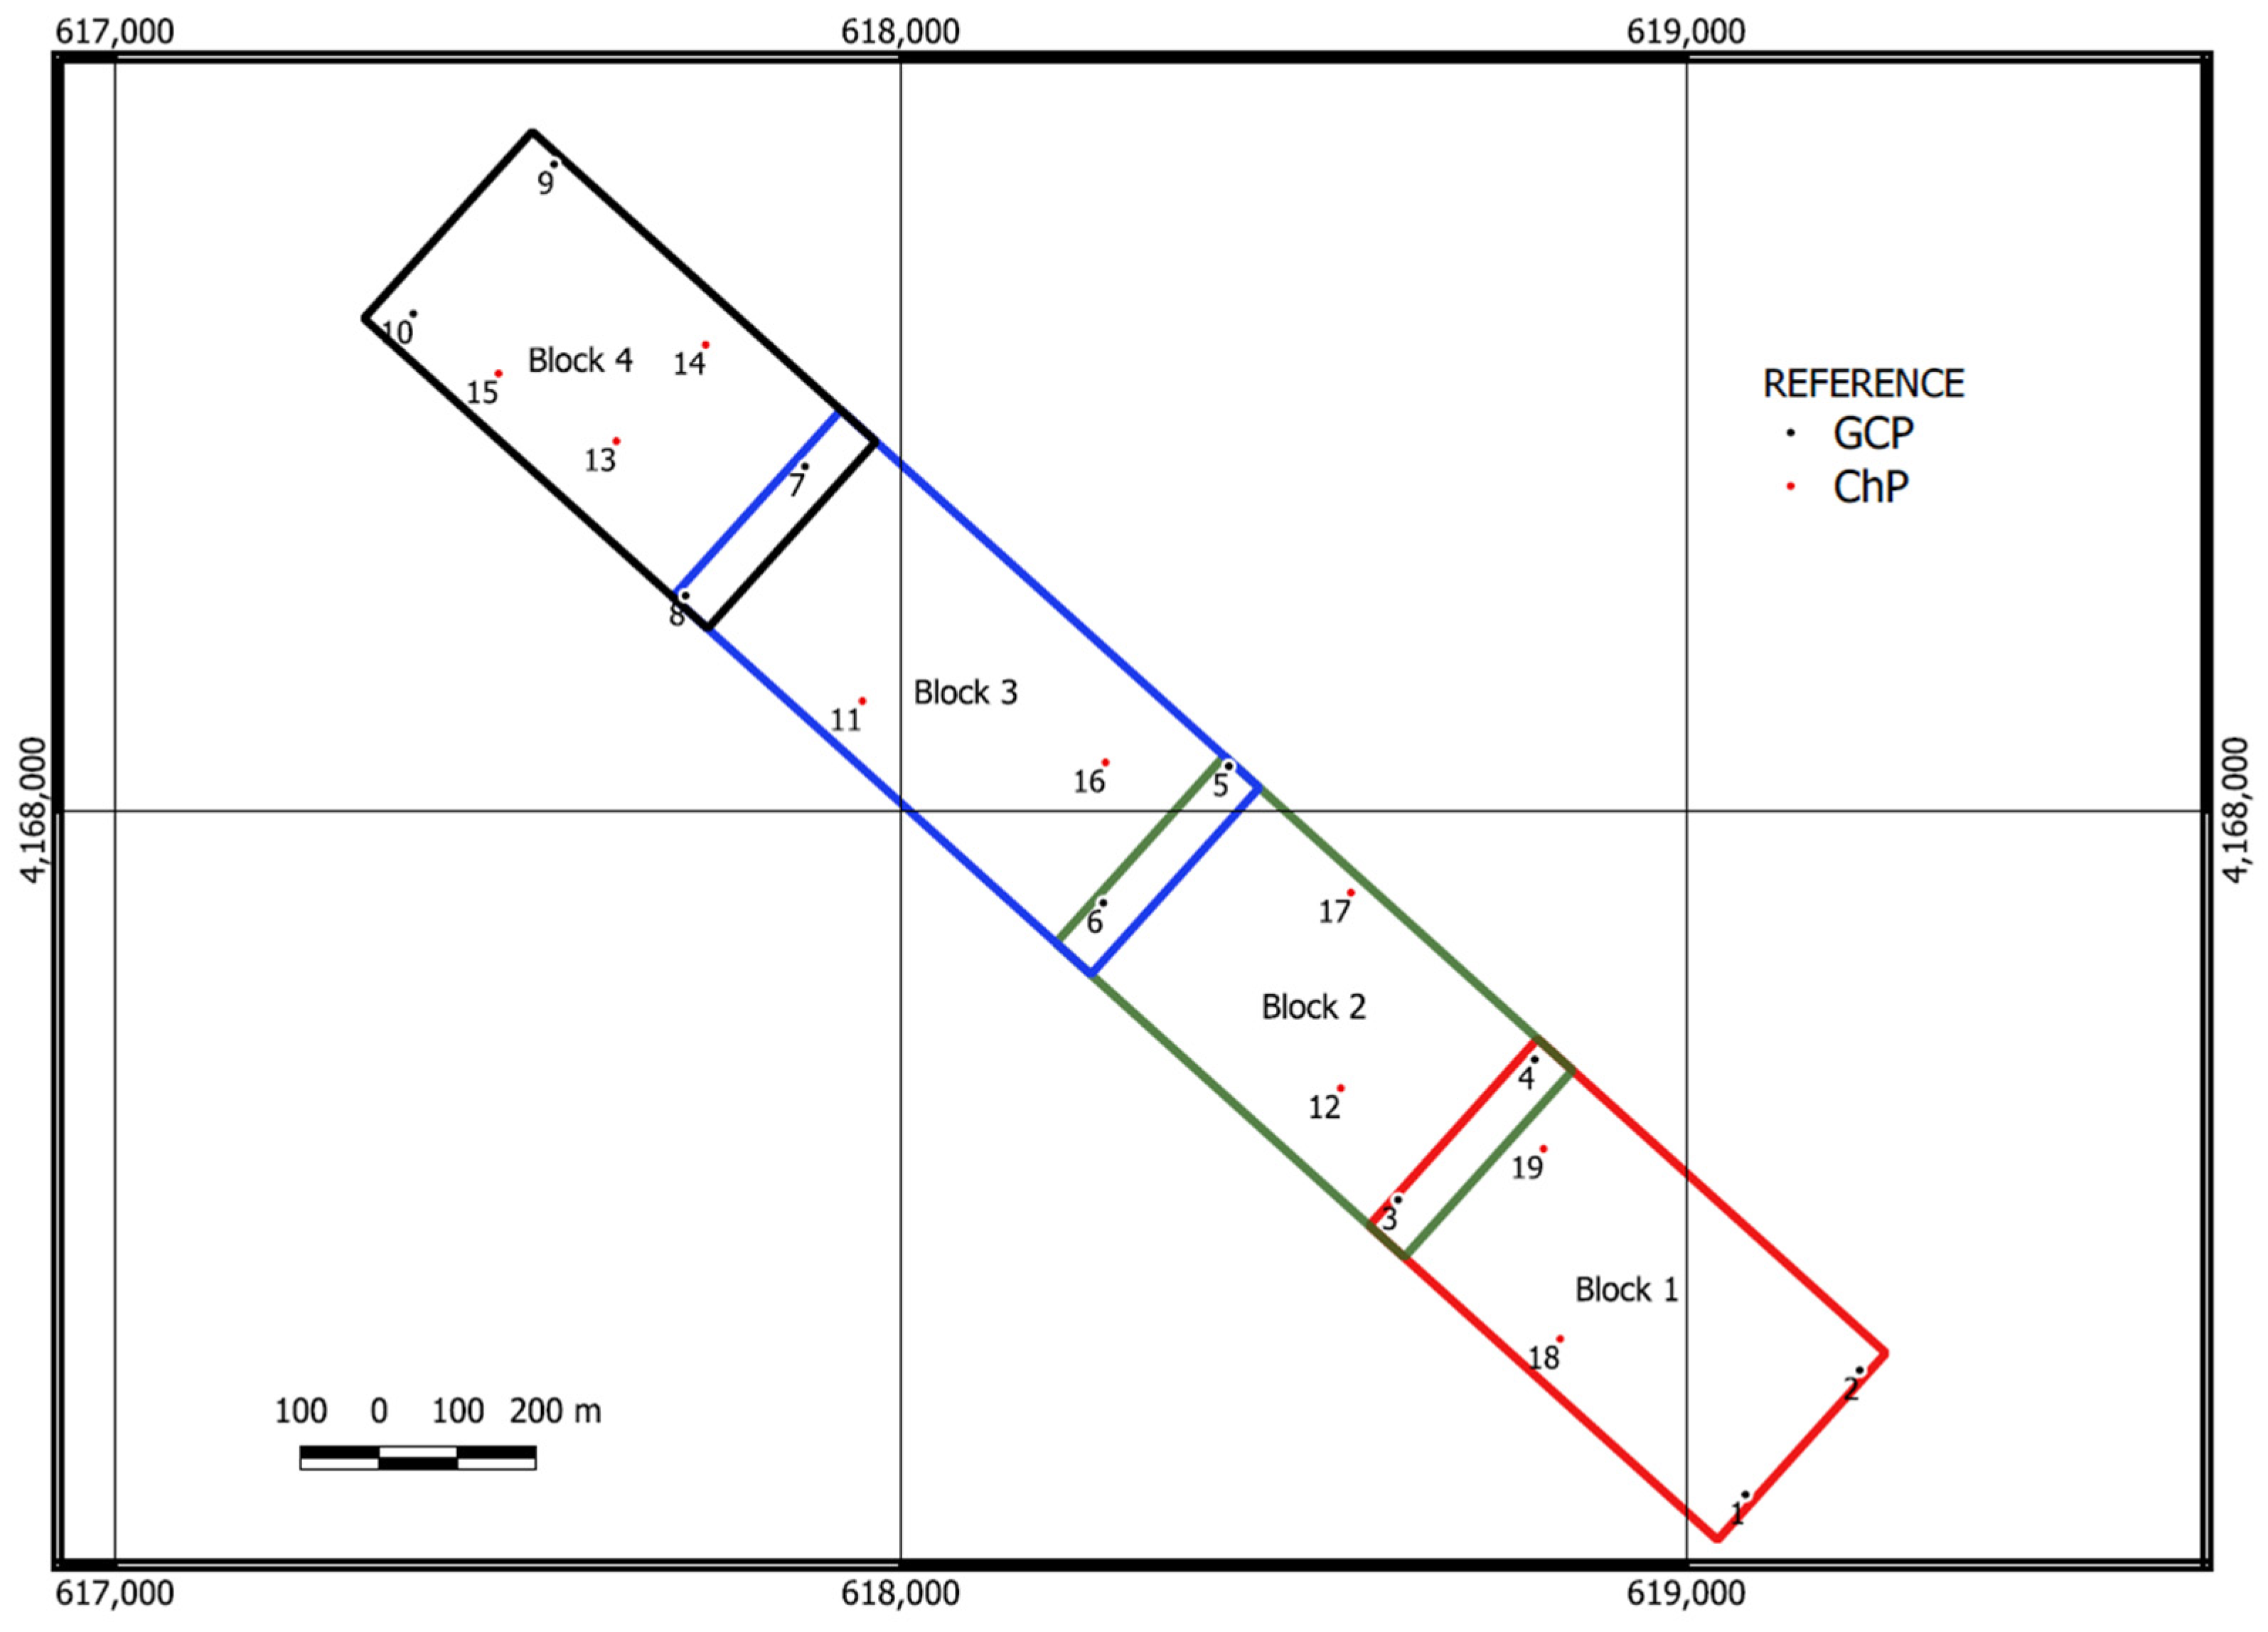
Figure 3b) for at least 15 min. All the points were measured twice with a different constellation and different receivers, which were configured for a static survey. A total of ten GCPs were measured, distributed at the four corners of each block, and nine ChPs were arranged randomly so that there were at least two ChPs in each block. The distribution of the points is shown in
Figure 4. When designing this distribution, priority was given to ensuring that the points were located on the firm ground, such as roadways, and that no nearby elements would impede the satellite signal. The GCPs were positioned in the common areas between the blocks. Short cross flights were made in these same areas to optimise the UAV batteries and reduce the number of GCPs.
The precise geodetic ionospheric correction models of the CODE (Centre for Orbit Determination in Europe [
40]) and the precise ephemerides of the IGS (International GNSS Service) [
41] were used to calculate the GCPs and ChPs coordinates for both constellations. Data from 22 continuous stations were processed to improve the general network configuration and link the local measurements to a regional geodetic reference framework. These stations are located in the southeast of the Iberian Peninsula and are part of the regional networks of the Region of Murcia (REGAM and MERISTEMUM) and the Spanish National ERGNSS-IGN Network (National Geographic Institute), with 24 h and 30 s of observation over ten days. The GNSS vectors in the network were processed using Leica Infinity software, with absolute antenna calibration models and Vienna Mapping Functions (VMF) [
42] for the tropospheric modelling. Subsequently, the vectors previously obtained in the network were combined with their complete variance-covariance matrices using Microsearch GeoLab software. This allows the estimation of the whole set of coordinates of the network points on the ETRS89 system, with an independent weighting strategy based on the quality of the vectors following the methodology used in high-precision networks [
43,
44].
2.2. Image Acquisition
Flights were planned with the DroneDeploy application for PC, which allows the importation of KML (Keyhole Markup Language) or KMZ (Keyhole Markup Language compressed). These formats are based on XML to store geographic data and related content, and are an official standard of the Open Geospatial Consortium (OGC) [
45]. The flights were programmed prior to the data campaign, taking into account the autonomy of the equipment batteries and the study area; the blocks were imported to the DroneDeploy application in the KMZ format.
Three flight missions were carried out with the Phantom 3 Pro following the scheme in
Figure 5a, and one with the Inspire 2 (
Figure 5b) to cover the four blocks. Another five flight missions were completed with the Inspire 2 (
Figure 5c) for the cross strip at the height of 110 m (h
c, cross flight height). The images were acquired orthogonally and with a forward and side overlap of over 60% [
46]. The flight configurations were the following:
- -
Phantom 3 Pro: For Blocks 1,2, and 4, flight height (hf) 120 m (the maximum allowed by Spanish regulation), forward overlap 80%, side overlap 60%, and speed 9 m/s for an area of 19 ha, with a GSD of 5.1 cm. The flight duration was 14′8″, taking 326 images for Block 1, 296 for Block 2, and 310 for Block 4.
- -
Inspire 2: Flight height 120 m (hf), forward overlap 80%, side overlap 60%, speed 10 m/s for an area of 23 ha, with a GSD of 2.1 cm. The flight duration was 14′38″, taking a total of 327 images in Block 3.
- -
Inspire 2: Strip flight height 110 m (hf), forward overlap 80%, side overlap 60%, speed 10 m/s for an area of 0.8 ha, with a GSD of 2.4 cm. The flight duration was 4′39″, taking a total of 74 images for each block.
For measuring 80 ha of the overall study area, it was divided into four areas (
Figure 4) with its corresponding blocks (
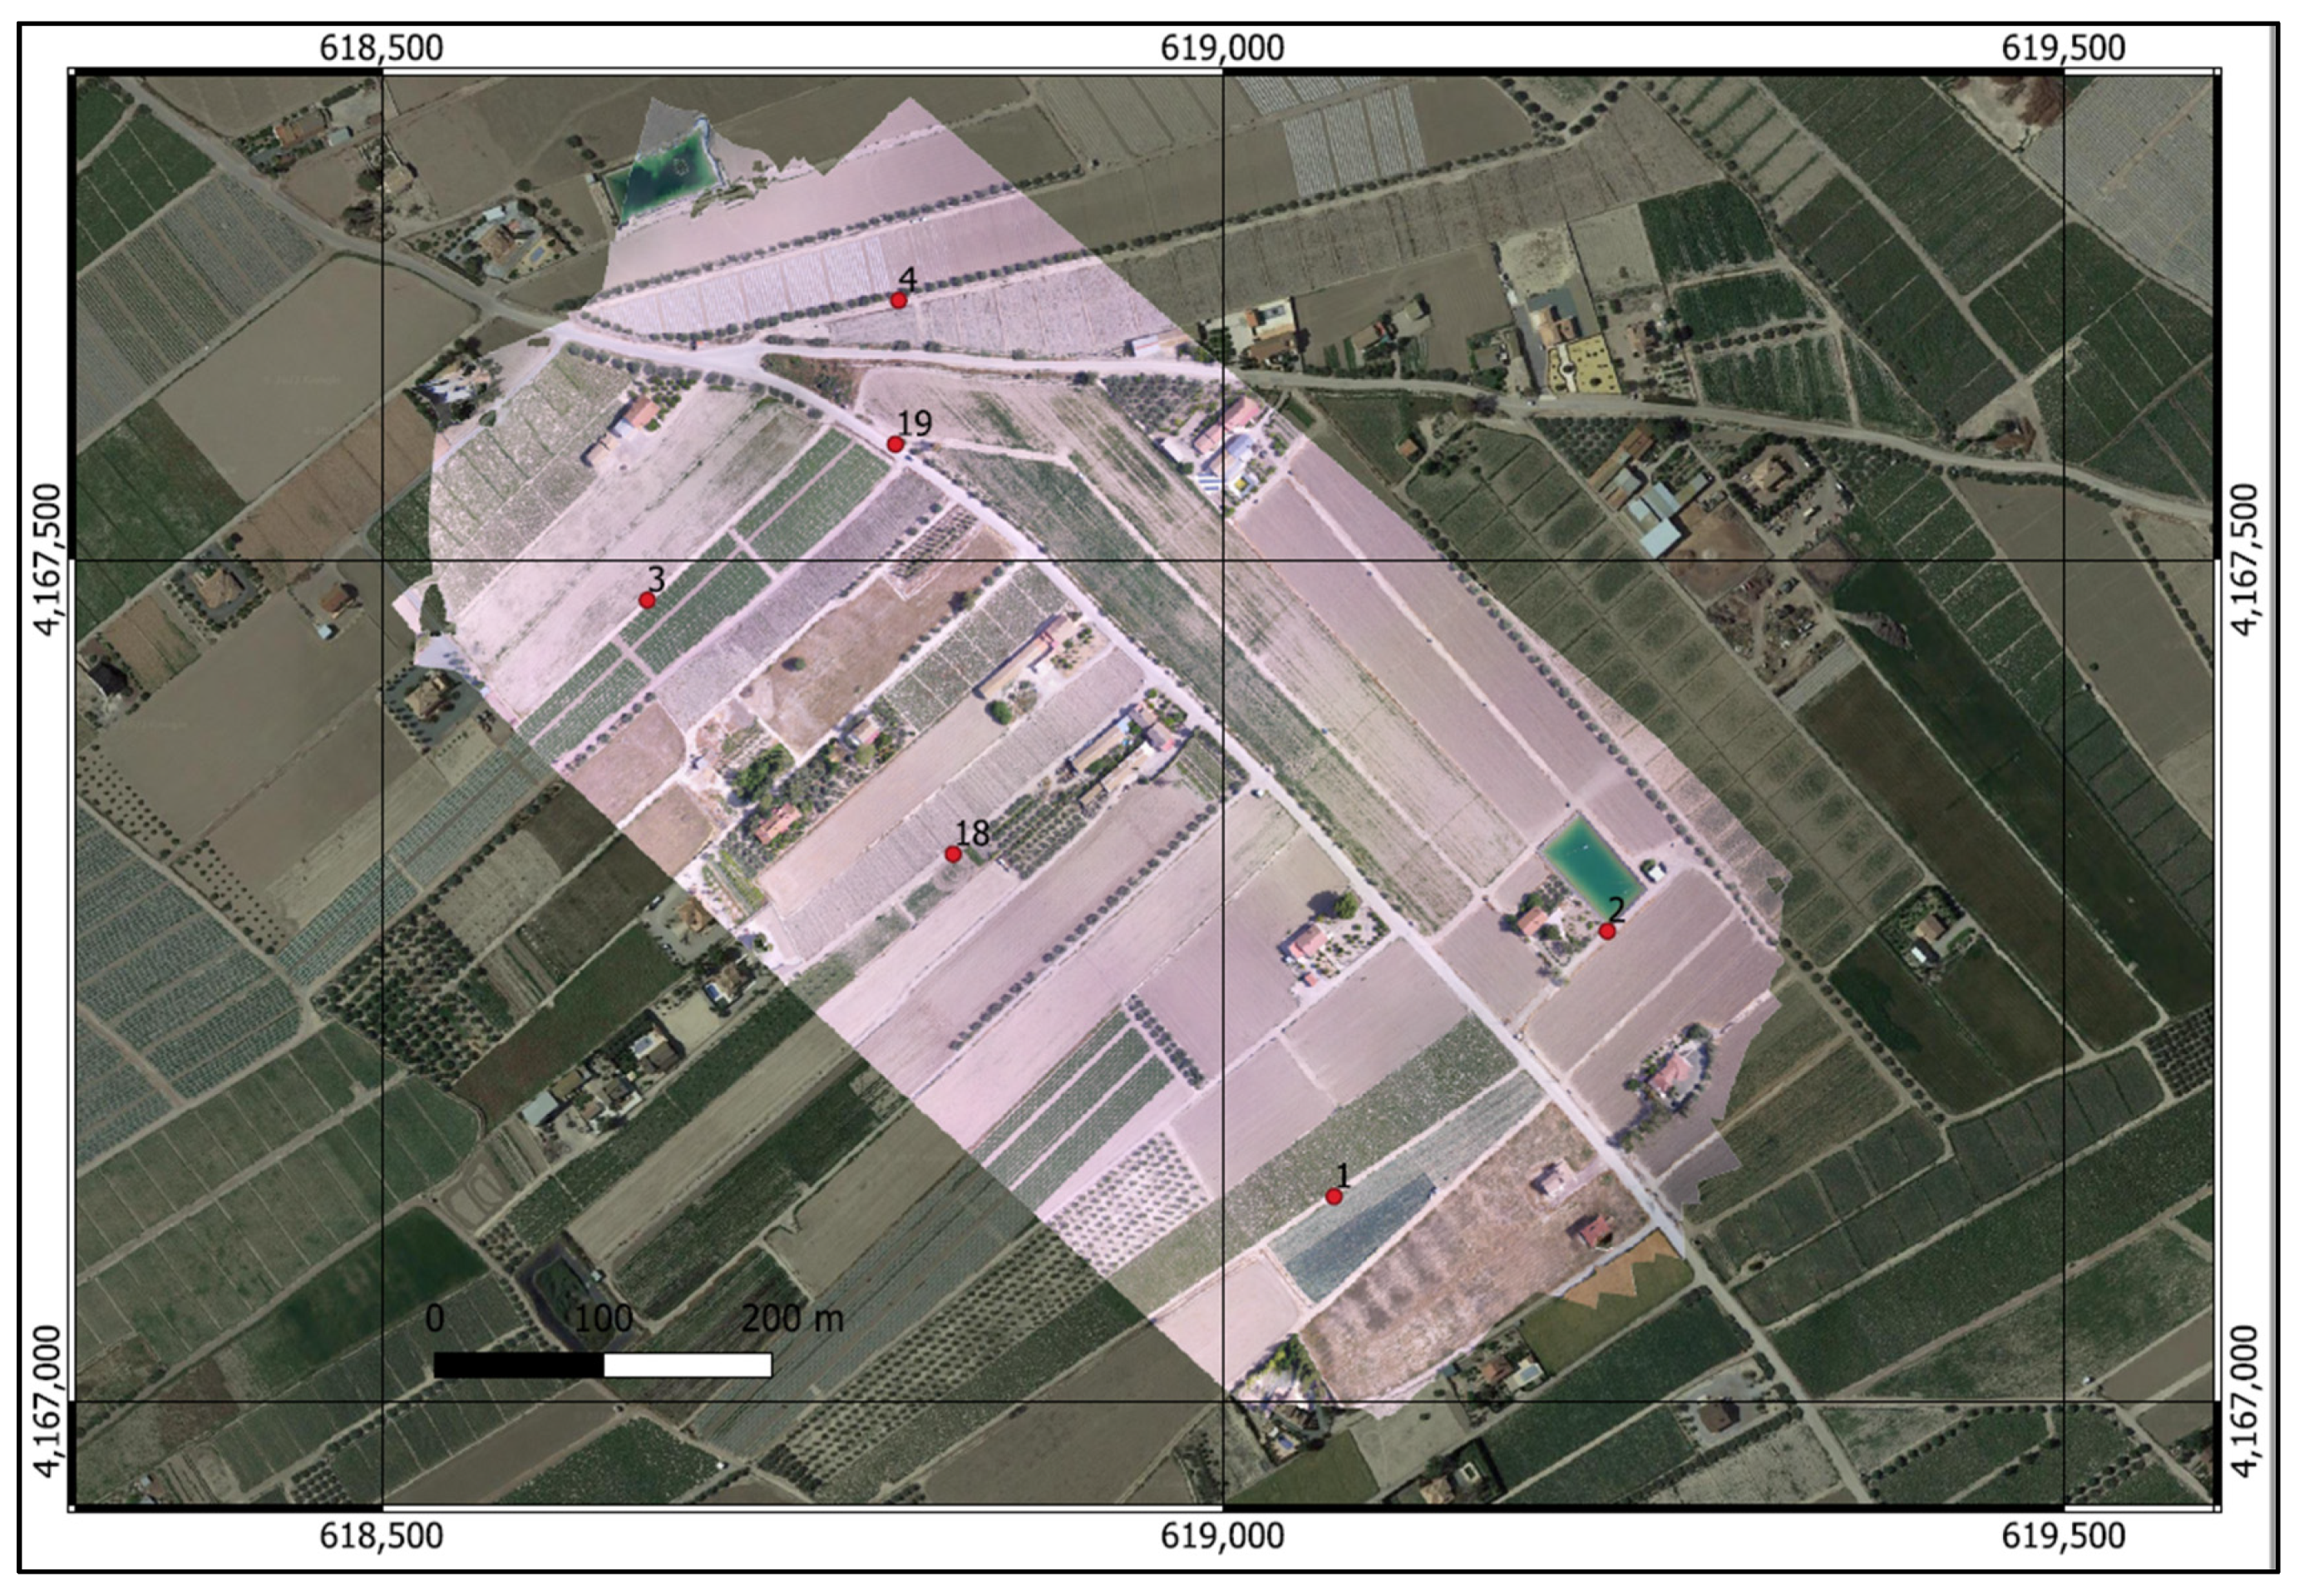
Figure 6), in a way such that a single set of UAV batteries was used for each block.
Figure 6 displays the setup for the overall study area, Scenario C (next section).
2.3. Photogrammetric Processing
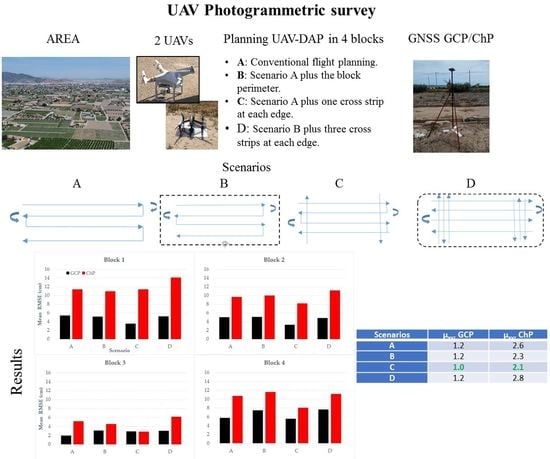
The data was processed using a laptop equipped with an ASUS processor Intel (R) Core (TM) i7 -4210U CPU 1.70 GHz 2.40 GHz, RAM 16 GB and an NVIDIA GEFORCE 820 M graphics card, running under Windows 10 (64 bits). The program used for processing the images was Agisoft Metashape Professional (64 bits), analysing several scenarios to generate the dense point cloud to compare and verify which of the four scenarios obtained the best results:
Scenario A: Flight mission with flight strips, (example Block 1,
Figure 7A).
Scenario B: Flight mission with flight strips, in addition to a flight strip covering the whole perimeter of each block (example Block 1,
Figure 7B).
Scenario C: Flight mission with flight strips; in addition, one cross strip at both ends of each block (example Block 1,
Figure 7C).
Scenario D: Flight mission with flight strips; an additional strip covering the whole perimeter and two cross strips at both ends of each block (example Block 1,
Figure 7D).
Scenarios A, B, and C are image subsets of Scenario D.
2.4. Accuracy of the Results
For the evaluation of the results, two statistics were used: the a priori accuracy of the block and RMSE.
2.4.1. A Priori Accuracy of the Block
The estimation of the a priori planimetric error of the blocks with four GPSs at the edges (Scenario A) uses the next equation:
where:
σB,L = estimated planimetric accuracy of the block (L = XY);
σo = sigma naught of the bundle block adjustment;
ns = number of strips;
σM,L = estimated planimetric accuracy of a single model.
Equation (1) was conceived for aerial photographs measured with analytical stereoplotters [
47]. For digital photogrammetry with digital sensors, we can rewrite Equation (1) as the following:
where:
σo = sigma naught of the bundle block adjustment can be taken as the mean reprojection error of the adjustment.
μxyz = weight coefficients depending on the layout of both the GCP and the image network.
This paper seeks to identify the weight coefficients (μxyz) in Equation (2) for the four scenarios acquired by UAV, A, B, C, and D, in order to determine the best equation for the a priori accuracy estimation valid for the UAV-DAP with absolute GNSS on flat areas. To the authors’ knowledge, no similar equation exists in the literature.
2.4.2. RMSE
The RMSE is calculated to determine the accuracy of the photogrammetric results. The square of the RMSE is equal to the arithmetic mean of the squares of the true errors [
48], defined by the next equation:
where:
XYZ = photogrammetric coordinates;
Control = reference data (GCP and ChP) taken in the field with GNSS;
n = number of verification points.
4. Discussion
The planning of the UAV-DAP flights is key for obtaining the centimetric level of accuracy. One aspect to consider is the accuracy of the GCPs, being recommended to be less than the GSD. The mean in this study was 7 mm, which was less than the GSD. The GCPs and ChPs must also be located in places visible in the photo acquisition and must not impede the GNSS signal.
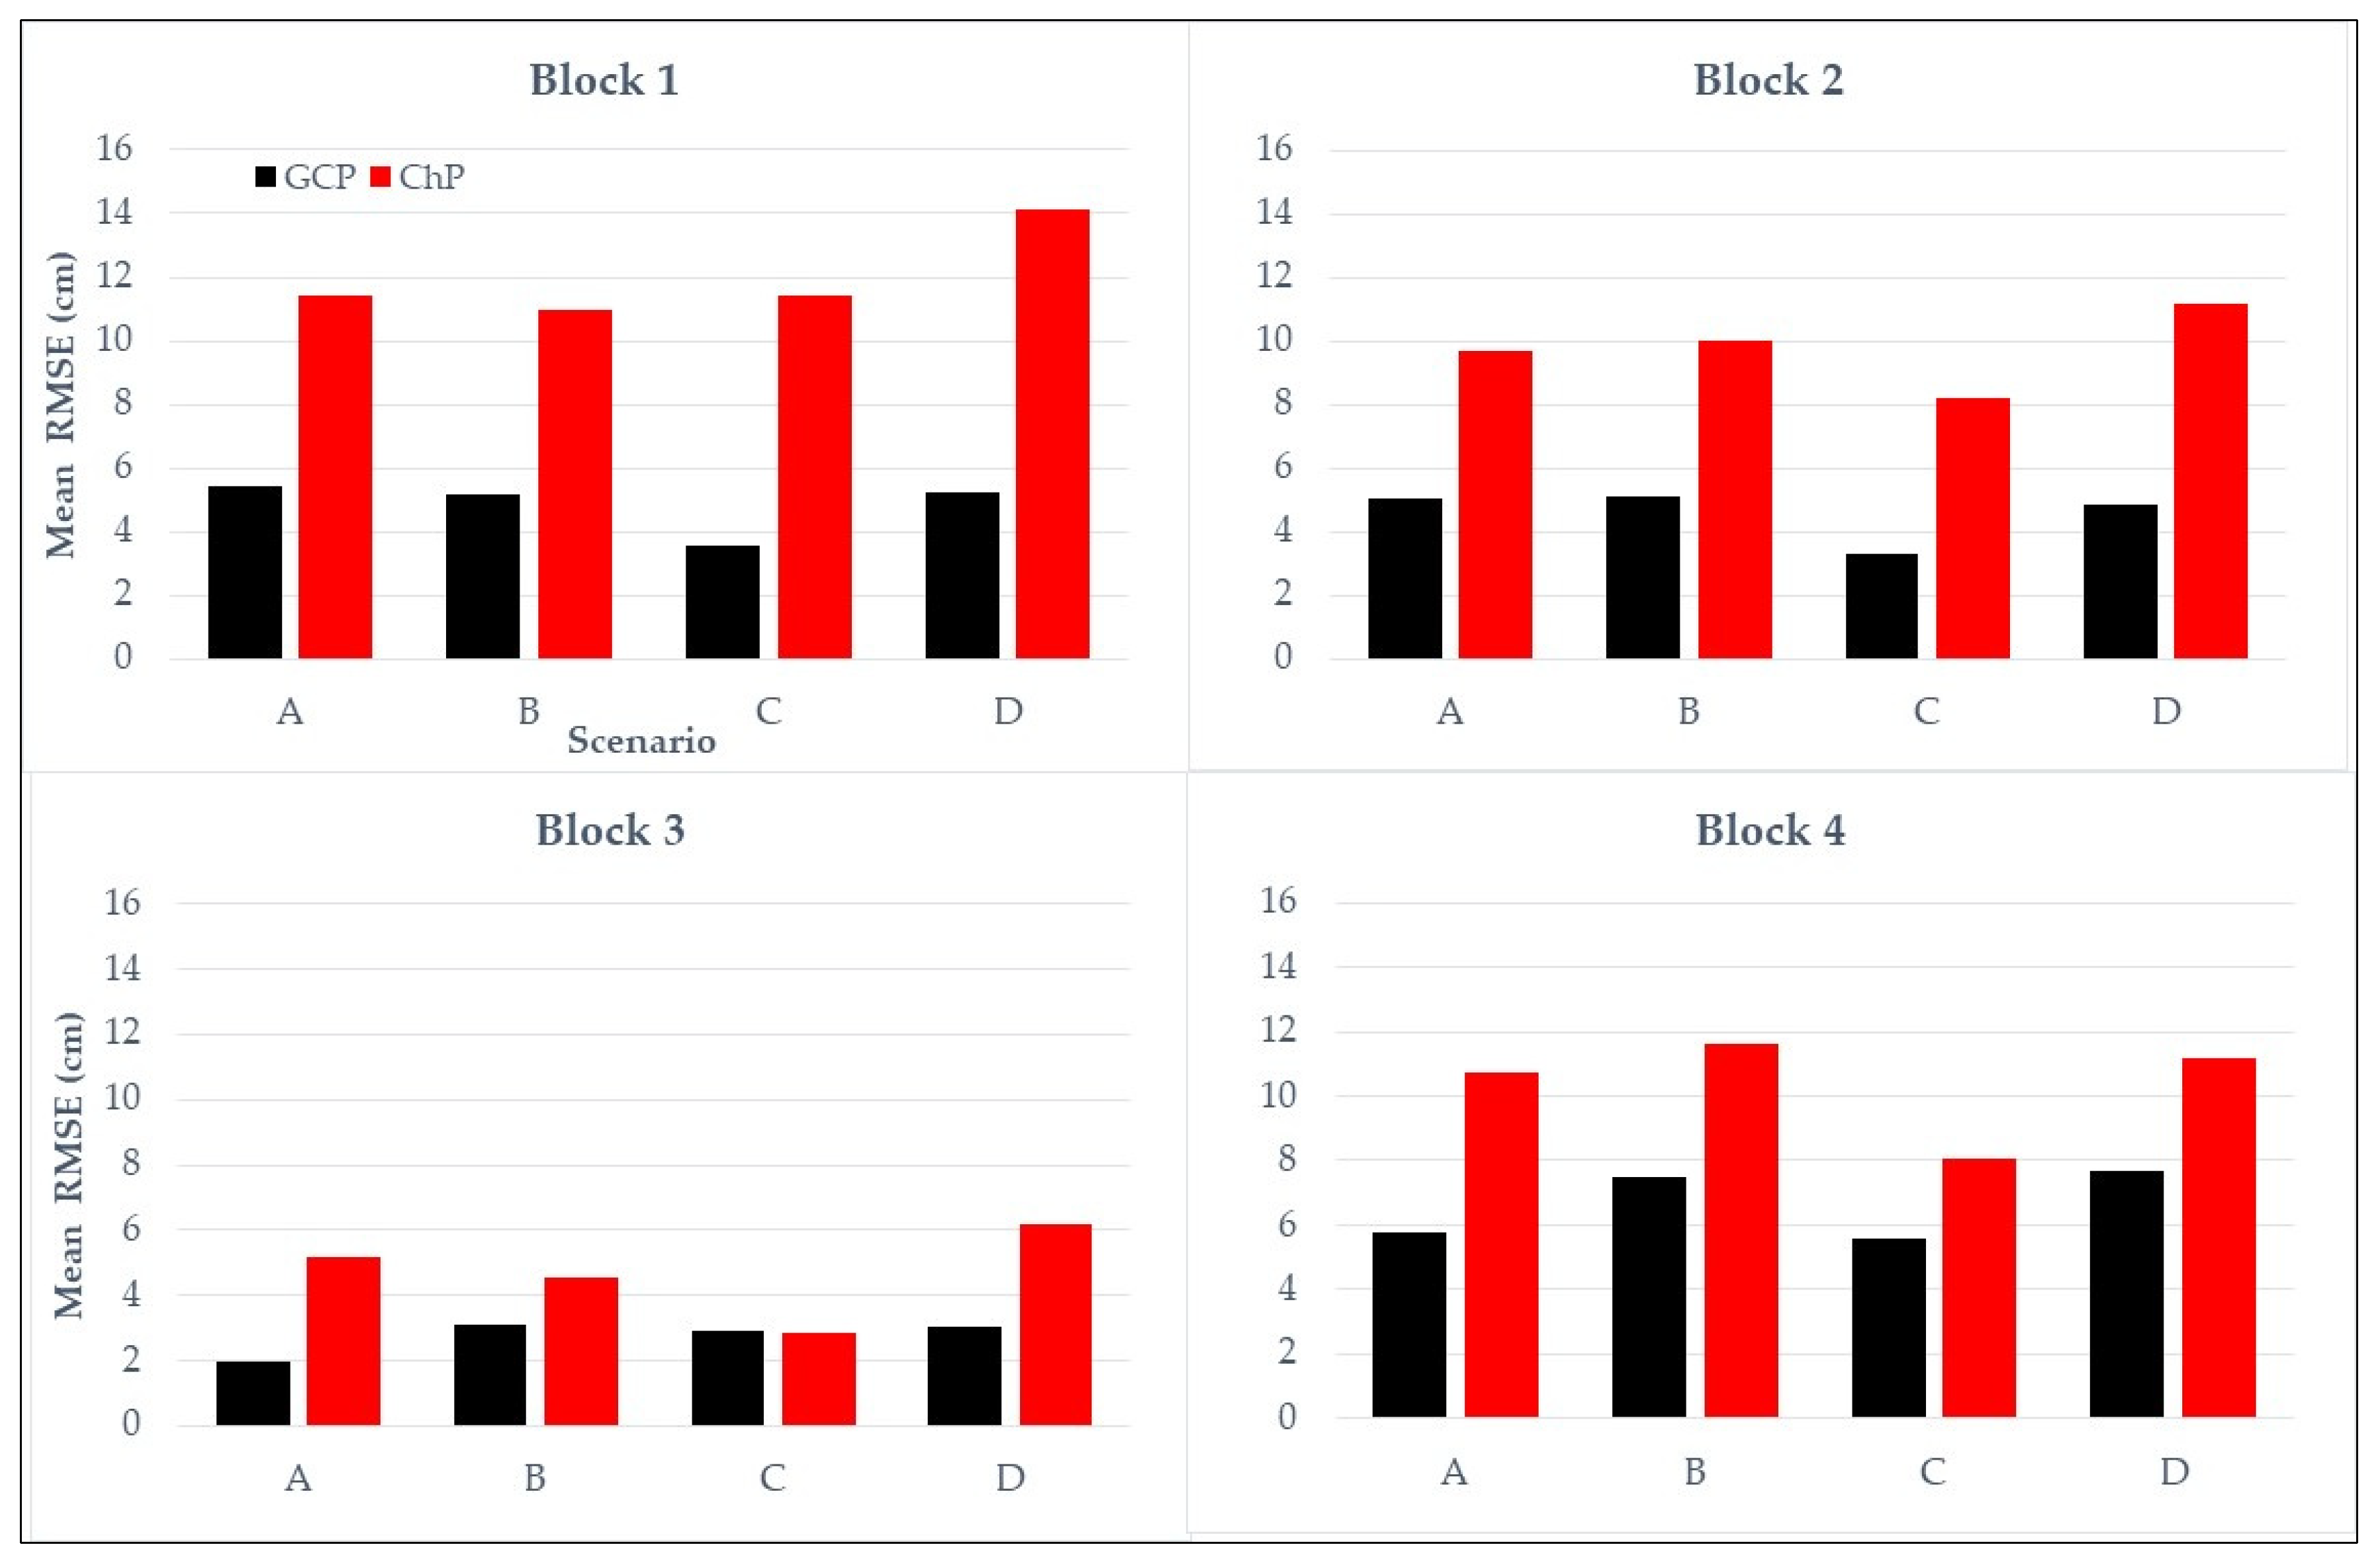
The study area was divided into four blocks, and four different scenarios were analysed. Scenarios A and B generated error results above the GSD. Scenario C, which has cross strips at the edges of the block where the GCP are located, produced the highest accuracy in planimetry and altimetry. These results reveal that option C, with a GCP at each corner and a cross strip at each end of the block at a lower height (less than 10 m), delivered an RMSE below the GSD in the four blocks studied, confirming that the cross strips at the edges of the block increase the accuracy, in aerial triangulation flights with GNSS and INS (Inertial Navigation Systems) [
31], up to 23%, if compared the ChPs using conventional flight planning software (Scenario A vs. Scenario C,
Table 7). Scenario D, which contemplates the sum of all the previous scenarios, did not show any significant improvement, all the way around, due to the excessively high overlap among the three crossing strips. As it has a greater number of photographs with surplus cover in the cross strips, it requires longer for both the data acquisition and processing phases.
It can be confirmed that the RMSE of the ChP is more than two times higher than the GSD and is smallest in Scenario C, where it has a better performance in three of the four cases.
The four scenarios have acceptable accuracies in aerial photogrammetry, as they are within the range of 1–2 GSD in planimetry and 2–3 GSD in altimetry [
28]. This is thanks to the quality of the data collection on the ground, as well as the planning and processing strategies. A comparison of the results in
Table 1 by the authors of [
26], with a ratio of 0.29 GCP/ha, similar to this study with 0.2 GCP/ha, shows a decrease in the value of the RMSE, which falls from 5.9 cm to 2.9 cm for Scenario C; this result can be explained by the improvement obtained when the cross strips are made perpendicular to the block. The study in [
44] also shows that for the best results in planimetry, the GCP must be located at the corners of the study area, and to improve the accuracy in the vertical component, it is necessary to use a well-distributed GCPs density between 0.5–1 GCP/ha; however, the GCPs must be located at the edges of the block, as the points measured in the centre do not produce any significant improvement in the adjustment, as evidenced in the study. The research of [
43,
44] conclude that to improve the vertical and horizontal accuracy, it is advisable to use the GCPs at the ends of the block, as can also be deduced from this research. However, other studies with UAVs [
14,
16] demonstrate that a higher number of images affects the accuracy of the photogrammetric survey.
The objectives, such as the type of information required, must be established before planning the flight to obtain results that comply with the tolerance of the work and avoid unnecessarily exceeding the number of photographs taken with the UAVs, the flight height, or the number of GCPs. Another aspect worth considering is that in the literature on photogrammetry, there is a clear consensus as to the quantity and location of the GCP, where the accuracy can only be compensated with chains of GCPs perpendicular to the flight strips, or by employing cross strips at the ends, while leaving the GCPs at the corners or on the perimeter of the block. This produces better results for RMSE in regards to east, north, and altitude, as shown in Scenario C.
In this investigation, the same calculations were recomputed, adding a 5th GCP in the centre of each block, to check whether or not the incorporation of an additional GCP might have yielded a significant improvement. The
Supplementary Material presents the results achieved in
Tables S1–S4, and their mean values are summarised in
Figure S1. The addition of one additional central GCP in the middle does not yield a significant improvement in the photogrammetric mode, as it can be checked with the RMSE on the GCPs, and it slightly enlarges the RMSE on the ChPs. Thus, including a single GCP in the centre of each block corroborates the error budget for planimetry accuracy [
49]. The authors of [
50] suggest the addition of convergent images to avoid the doming effect in the topographic models derived from UAV; alternatively, they also suggest adding control measurements. In this sense, we can confirm that the addition of transversal strips is also highly recommended, as suggested by the study in [
47]; we confirmed this option for lower flying heights. In fact, the positive effect of including convergent images can also be obtained including lower flying cross strips, to appropriately determine the geometric camera calibration of the UAV-DAP survey (Scenario C).
In regard to the a priori accuracy calculations obtained in
Table 6, it can be seen that Scenario C has the lowest results for the multiplying factor in the GCPs and ChPs, and these are therefore the reference values selected as the best procedure for this type of flight. Better results are obtained when verifying the accuracy of the simple model compared with that used in [
49], so with these new parameters, the accuracy can be estimated using Equation (3), described in the methodology, before conducting the flight, provided that cross strips, or otherwise, dense GCP perpendicular chains, are used at the edges of the block. To verify the accuracy, it is recommended to use the value of μ
xyz ChPs, as these points show the accuracy of the photogrammetric adjustment not in the GCPs but in the ChPs.
This study also demonstrates the influence of the type of camera used, as specified in
Table 3. The Zenmuse X5S camera achieves accuracies below 3 cm in the case of Block 3, and the DJI FC300X camera has an accuracy of 6 cm in the case of Blocks 1, 2, and 4 in Scenarios A, B, and D.
Another important aspect to consider when measuring vast areas is that the flights can be divided into blocks, sharing the same GCPs at the edges and the lower cross strips, thereby reducing the topographic control required and ensuring a lower consumption of batteries, a limiting factor in multirotor UAVs.
5. Conclusions
This article has analysed the accuracy that can be obtained on flat terrains from UAV-DAP. In addition to the classic aerial flight planning setup with near-parallel imaging directions in forwarding strips, three additional scenarios are analysed using only four GCPs, one at each end, plus one additional GCP in the centre (see
Supplementary Material). The research conducted on four blocks confirms that the error achieved in the adjustment of the photogrammetric block is heavily dependent on flight planning. In this case, it is confirmed that the best results are obtained by adding lower flying heights cross strips at both ends, an aspect that is not included in the current flight planning programs (for example, DroneDeploy, PIX4D).
Reinforcing the conventional flights with lower cross strips achieves greater accuracy in the UAV-DAP. A single cross strip at each end, with the GCPs located at the corners of the block, is sufficient to improve the accuracy. When three flight strips are used, together with perimeter strips, as in Scenario D, the error increases significantly by 28.9%, considering the ChPs. Therefore, scenarios with extremely short baselengths, with multiple cross strips, are highly discouraged, even with lower flying heights.
If Scenario C is applied, instead of the one proposed by the DroneDeploy software [
39] (Scenario B), the precision increases by 9.2%, thus guaranteeing better results for the products obtained, namely the DTMs and orthomosaics, with four GCPs and with lower battery consumption on flat terrains. The classic implementation of flight planning, Solution A, is the least advisable, as the RMSE in the ChPs is up to 23% larger than in Scenario C.
Future analyses will study the effect of including oblique flight strips (equivalent to convergent imagery in terrestrial photogrammetry), scenarios with mountainous terrains or larger areas, and different numbers of GCPs under other flying options (e.g., double grid acquisition for urban areas.
