1. Introduction
Demand for agricultural products urges agriculture sectors to accommodate technology to overcome production challenges [
1,
2]. Prominently, population growth creates constant pressure on the agricultural system to supply more food to fulfil global demand, which drives farmers to adopt modern technologies (such as precision agriculture) in food-crop production [
3,
4,
5,
6]. Globally, precision agriculture plays an important role in increasing the quality of crop production, sustaining crop production and making decisions based on analyzing large amounts of data and information about crop status obtained from farms. Moreover, it is used for effective fertilizer management and irrigation as well as for labor reduction [
7,
8,
9]. In practice, remote sensing has been widely used to support precision agriculture in recent years. Sarvia et al., 2021, analyzed the inconsistency between airborne and satellite sensors by using K-means clustering on NDVI map-derived multispectral remote sensing data and found a high correlation for visible bands. Airborne images provide centimeter geometric resolution and 3D measurement potential for precision agriculture [
10]. With the advantages of technology in capturing high-resolution images, particularly by using unnamed aerial vehicle (UAV), large amount of remote sensing data can easily be obtained for analyzing crop yield in precision agriculture.
Through the development of Internet of Things (IoT) and computer vision, sensors and cameras along with machine learning, deep learning and image processing techniques have been getting increasing attention for capturing information and further processing for smart farming to help maintain the sustainability of agricultural production [
11]. Smart farming plays a vital role in the agricultural process based on adjusting various agricultural management measures. It provides suggestions and insights for more efficient and effective agriculture production and to solve the challenges in agriculture systems [
12]. Several studies have discussed smart farming techniques that were practically implemented to reduce fertilizers, pesticides and herbicides [
13] and to estimate optimum crop planting dates [
14]. Moreover, computer vision plays a key role to extract useful information from the collected image dataset for management of smart farming tasks [
11,
15]. In recent agricultural operations, machine learning in computer vision has been applied for various object detection and classification tasks through extracting information from images to significantly promote intelligent agriculture [
16,
17,
18,
19,
20].
As mentioned above, the developments in IoT provide a good platform to collect a large amount of image data with many objects to make meaningful image analysis [
21]. To collect image data in agriculture sectors, UAVs or drones are widely used in precision agriculture and many other fields, such as path planning and design, wildlife rescue, weed classification, harvesting, livestock counting and crop and aquatic products damage assessment [
22,
23,
24,
25,
26,
27]. UAVs can be used to detect potential issues and then obtain high-resolution images to inspect and apply treatments correspondingly. The combination of UAVs and computer vision helps farmers make correct decision by obtaining information from the images [
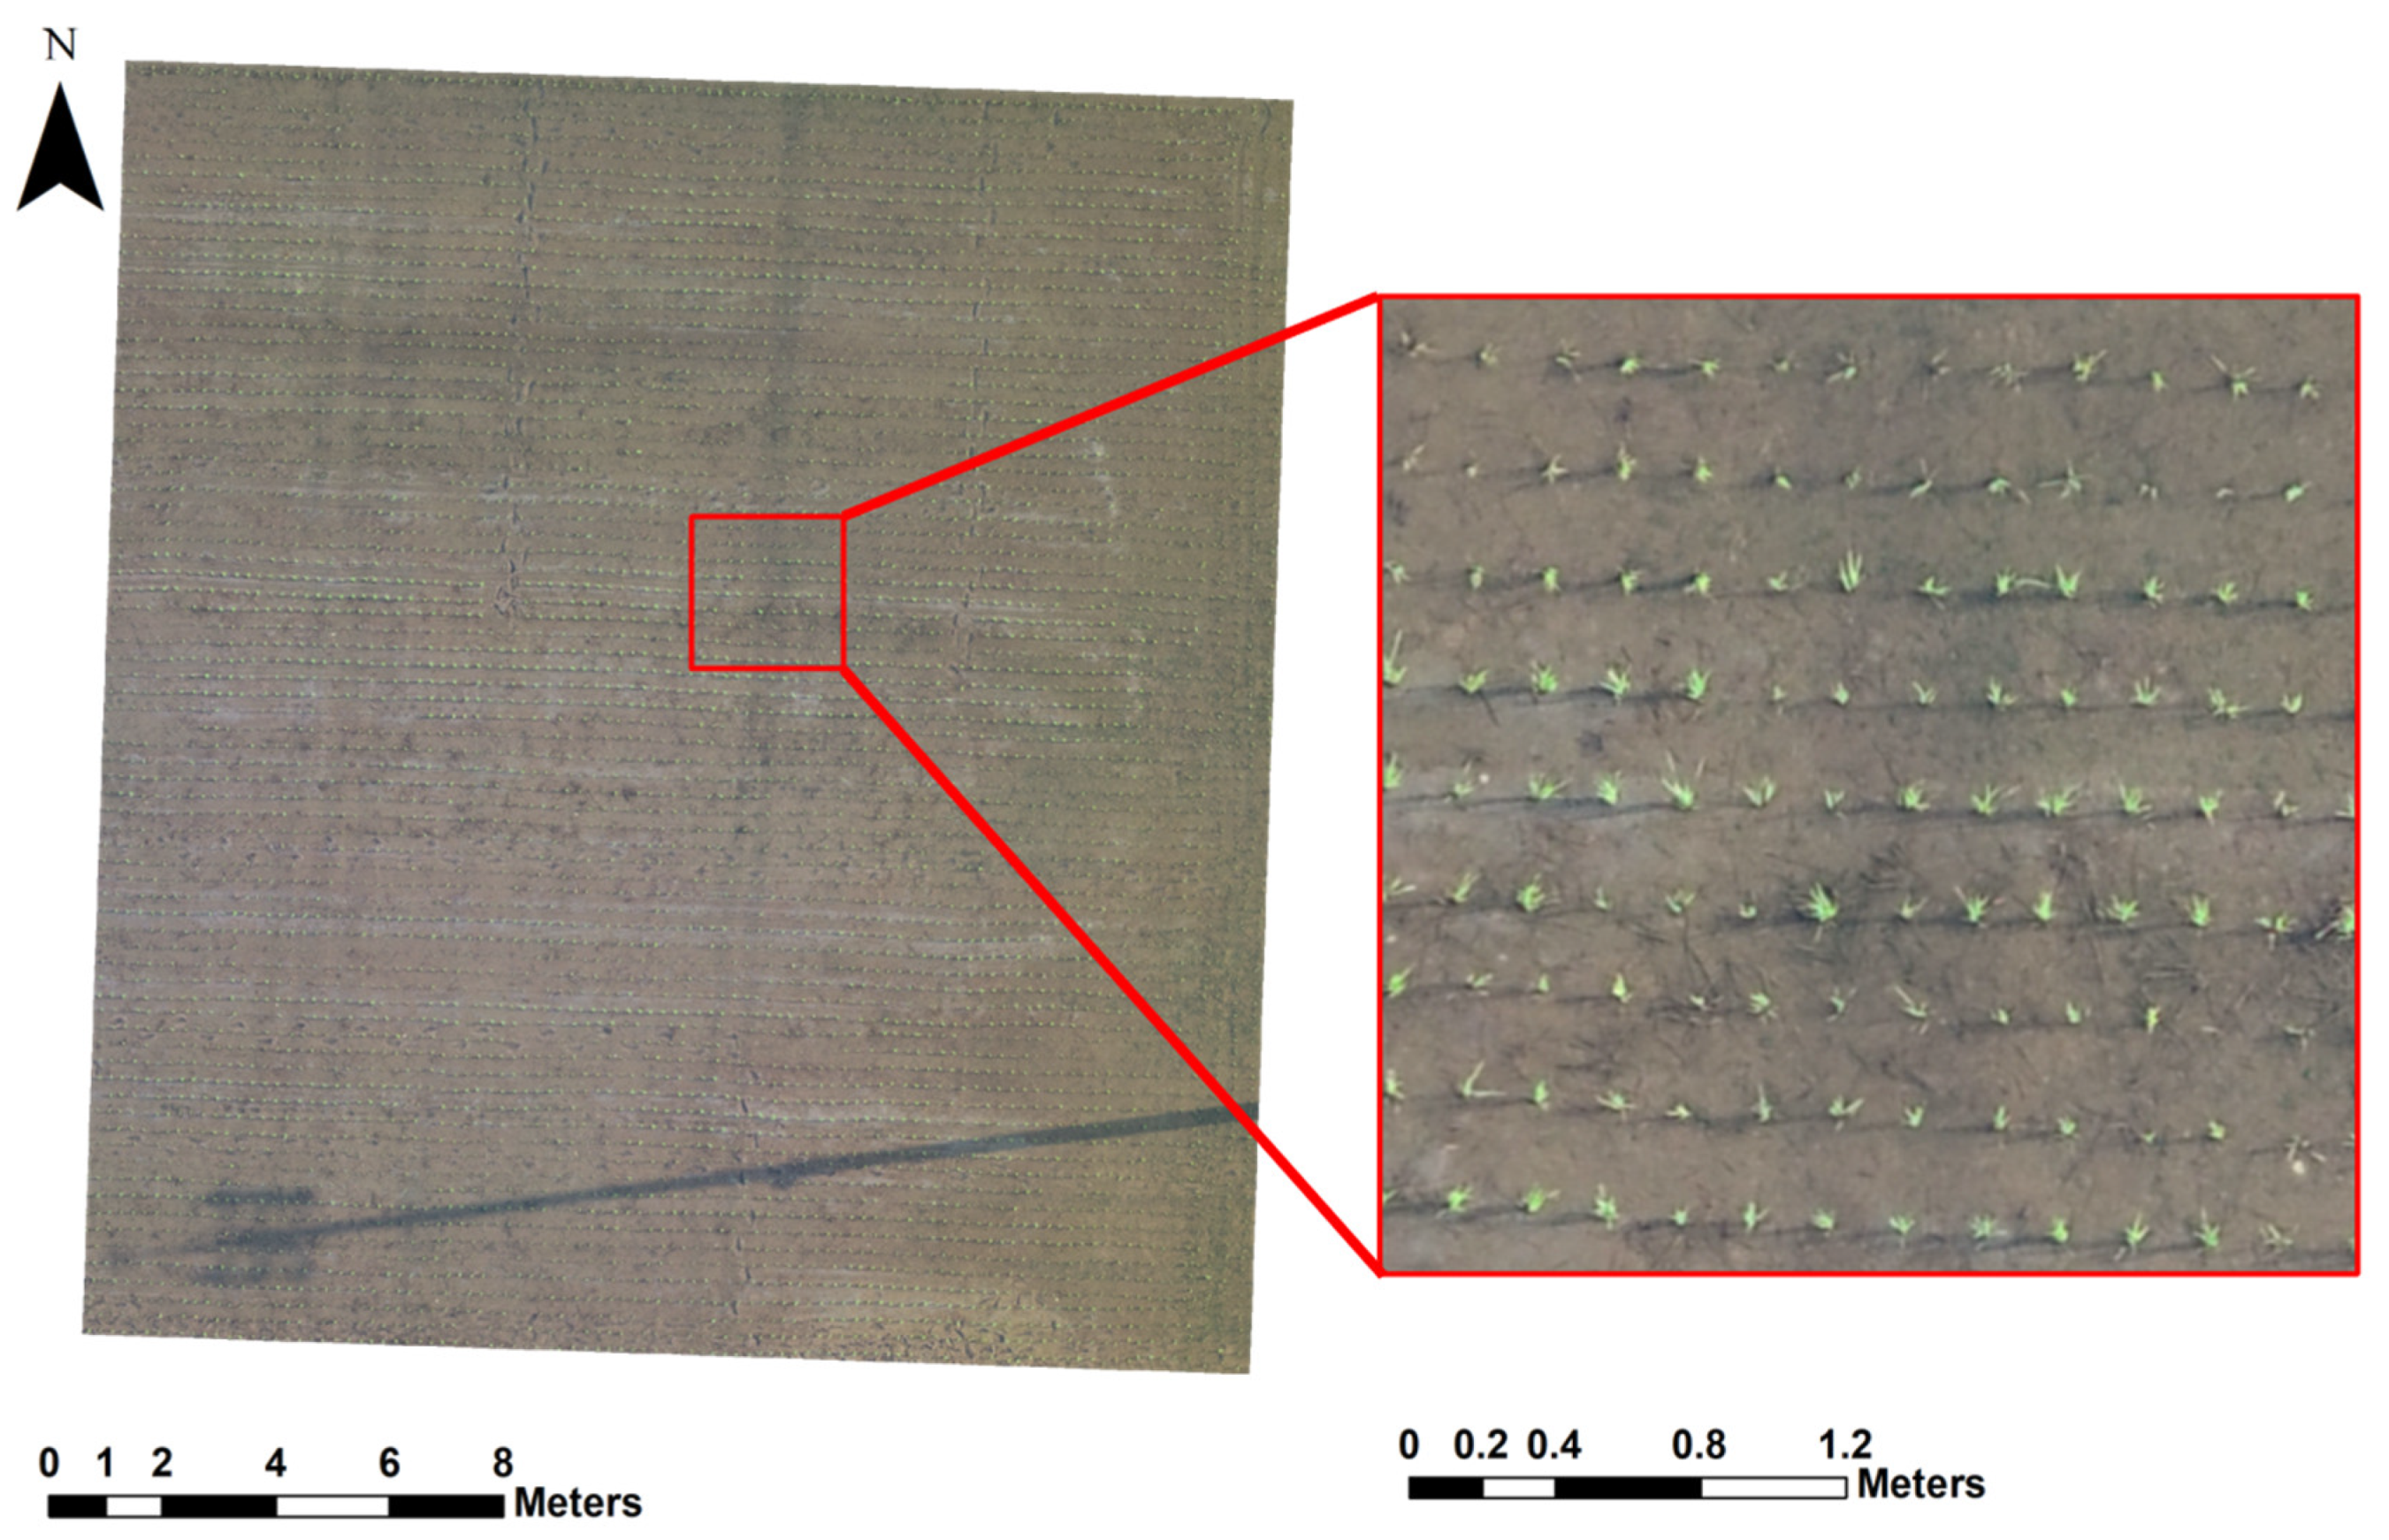
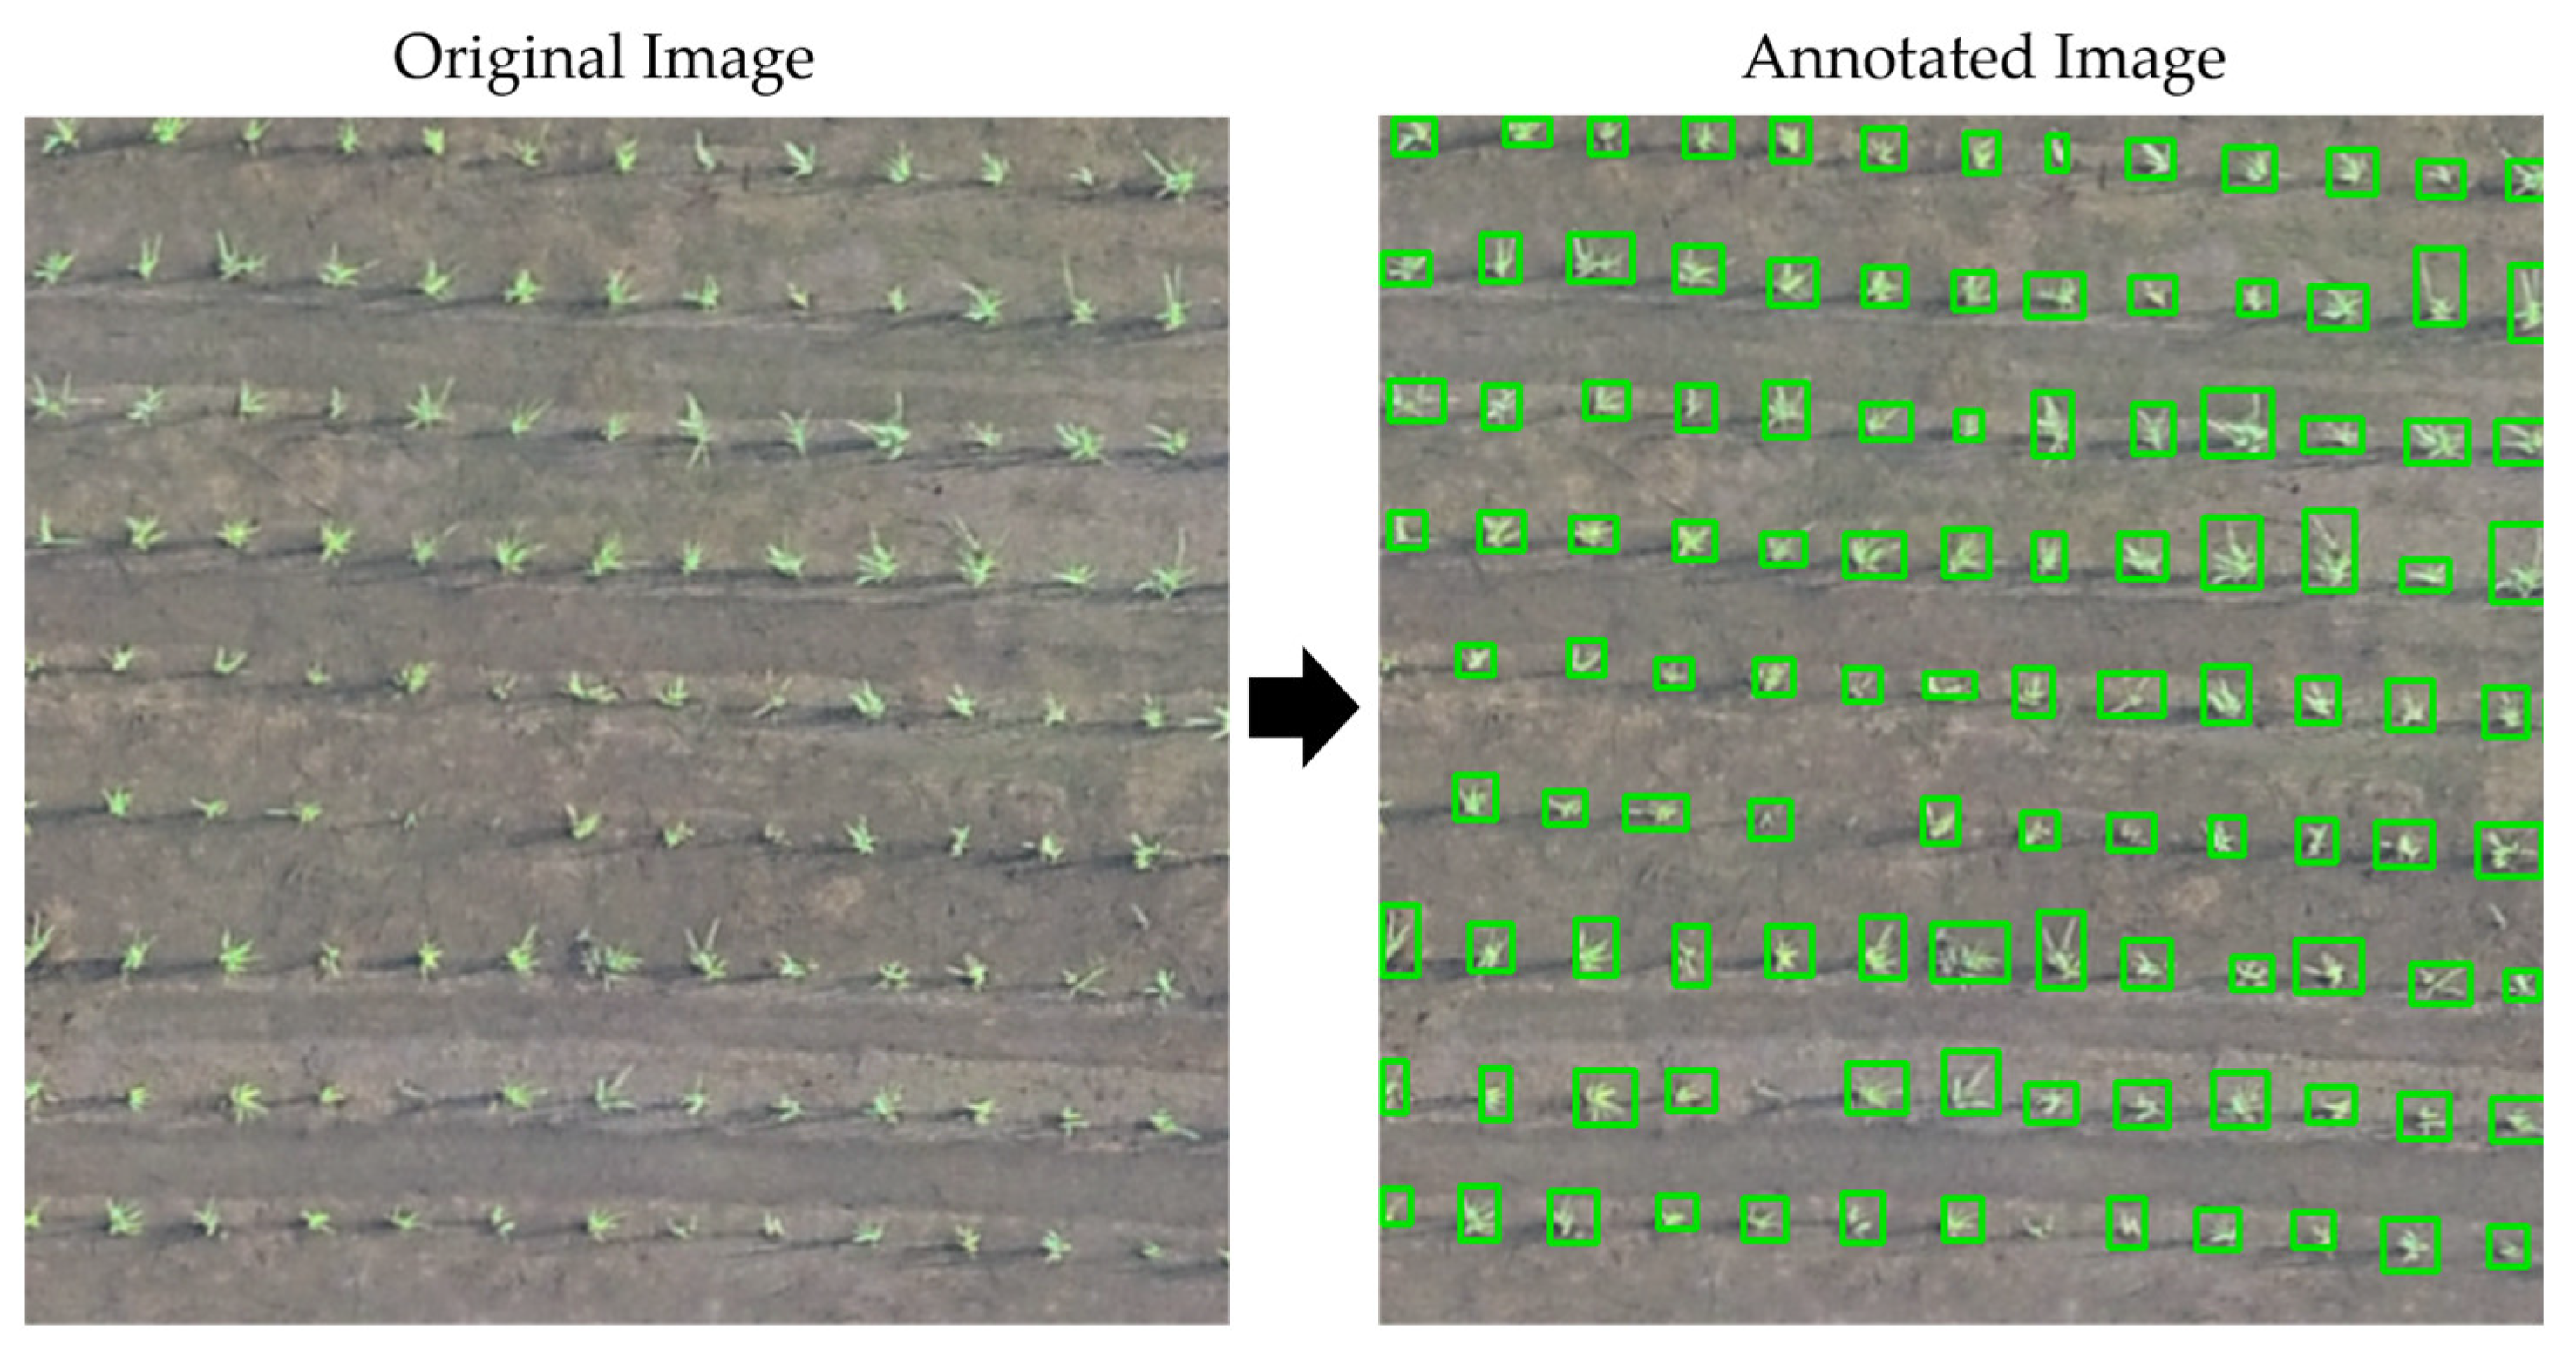
15]. This study focusses on monitoring sowing area via UAVs for identifying rice seedlings and counting them for decision-making regarding the progress of rice seedlings in paddy fields.
Deep learning, which is one branch of machine learning, in object detection can deal with high-density scenes with complex and small objects in images [
28,
29]. Object detection in computer vision is widely used for various applications. By training with large amounts of image data, object detection can accurately identify the targeted objects and their spatial locations in the images, classify objects from the specified varieties, such as human, animals, crops, plants, and vehicles, and mask the objects within bounding boxes by well-developed algorithms [
30,
31,
32,
33,
34]. All existing object detection models can generally perform better to detect either big objects or small objects in the large part of an image. Moreover, the challenging task in computer vision is to detect the small objects in an image that lack appearance information to distinguish them from background and similar categories. The precision requirement is higher for accurately locating small objects. A recent review reported detailed information about the use of convolutional neural networks (CNNs) for small-object detection. Their results, based on popularly existing datasets, showed better performance for detecting small objects in terms of multi-scale feature learning, data augmentation, training strategy, context-based detection and GAN-based detection methods [
35]. Based on this evidence, this study aims to employ an object-detection model to monitor a single small object in paddy fields using UAVs. In particular, this study focusses on the rice seedlings in paddy fields as very tiny objects that can hardly be observed by the human eye to find displacements or missing rice seedlings and count and locate rice seedlings.
Object detection based on machine learning in computer vision has improved enormously in accuracy and speed compared to traditional detection algorithms with feature extraction [
36]. It is used for classifying and locating objects in automatic image detection processes based on statistical and geometric features. Traditionally, object detection consists of two stages: feature extraction and object detection [
33,
37]. Feature extraction models, such as Haar-like feature [
38], scale-invariant feature transform (SIFT) [
39], histogram oriented gradient feature (HOG) [
40], principal components analysis (PCA) [
41], Viola–Jones feature [
31] and local binary patterns, are used to generate regional proposals. Generally, static objects are detected in images using background subtraction algorithms, and dynamic objects are detected by subtracting two adjacent frames with frame difference algorithms. Then, the extracted features are inserted into support vector machine (SVM), logistic regression (LR) and/or random forest (RF) to classify the objects. Several researchers have proposed various object detection models, for example conjugate building feature detection using SIFT [
42], human face detection and moving vehicle detection using Haar–Feature combined with AdaBoost [
38,
43,
44], dangerous animal detection using local binary pattern adopting AdaBoost [
45], HOG with SVM for human detection with high detection accuracy and long detection time [
46,
47,
48] and a deformable parts model based on reducing the dimensions of HOG features with PCA [
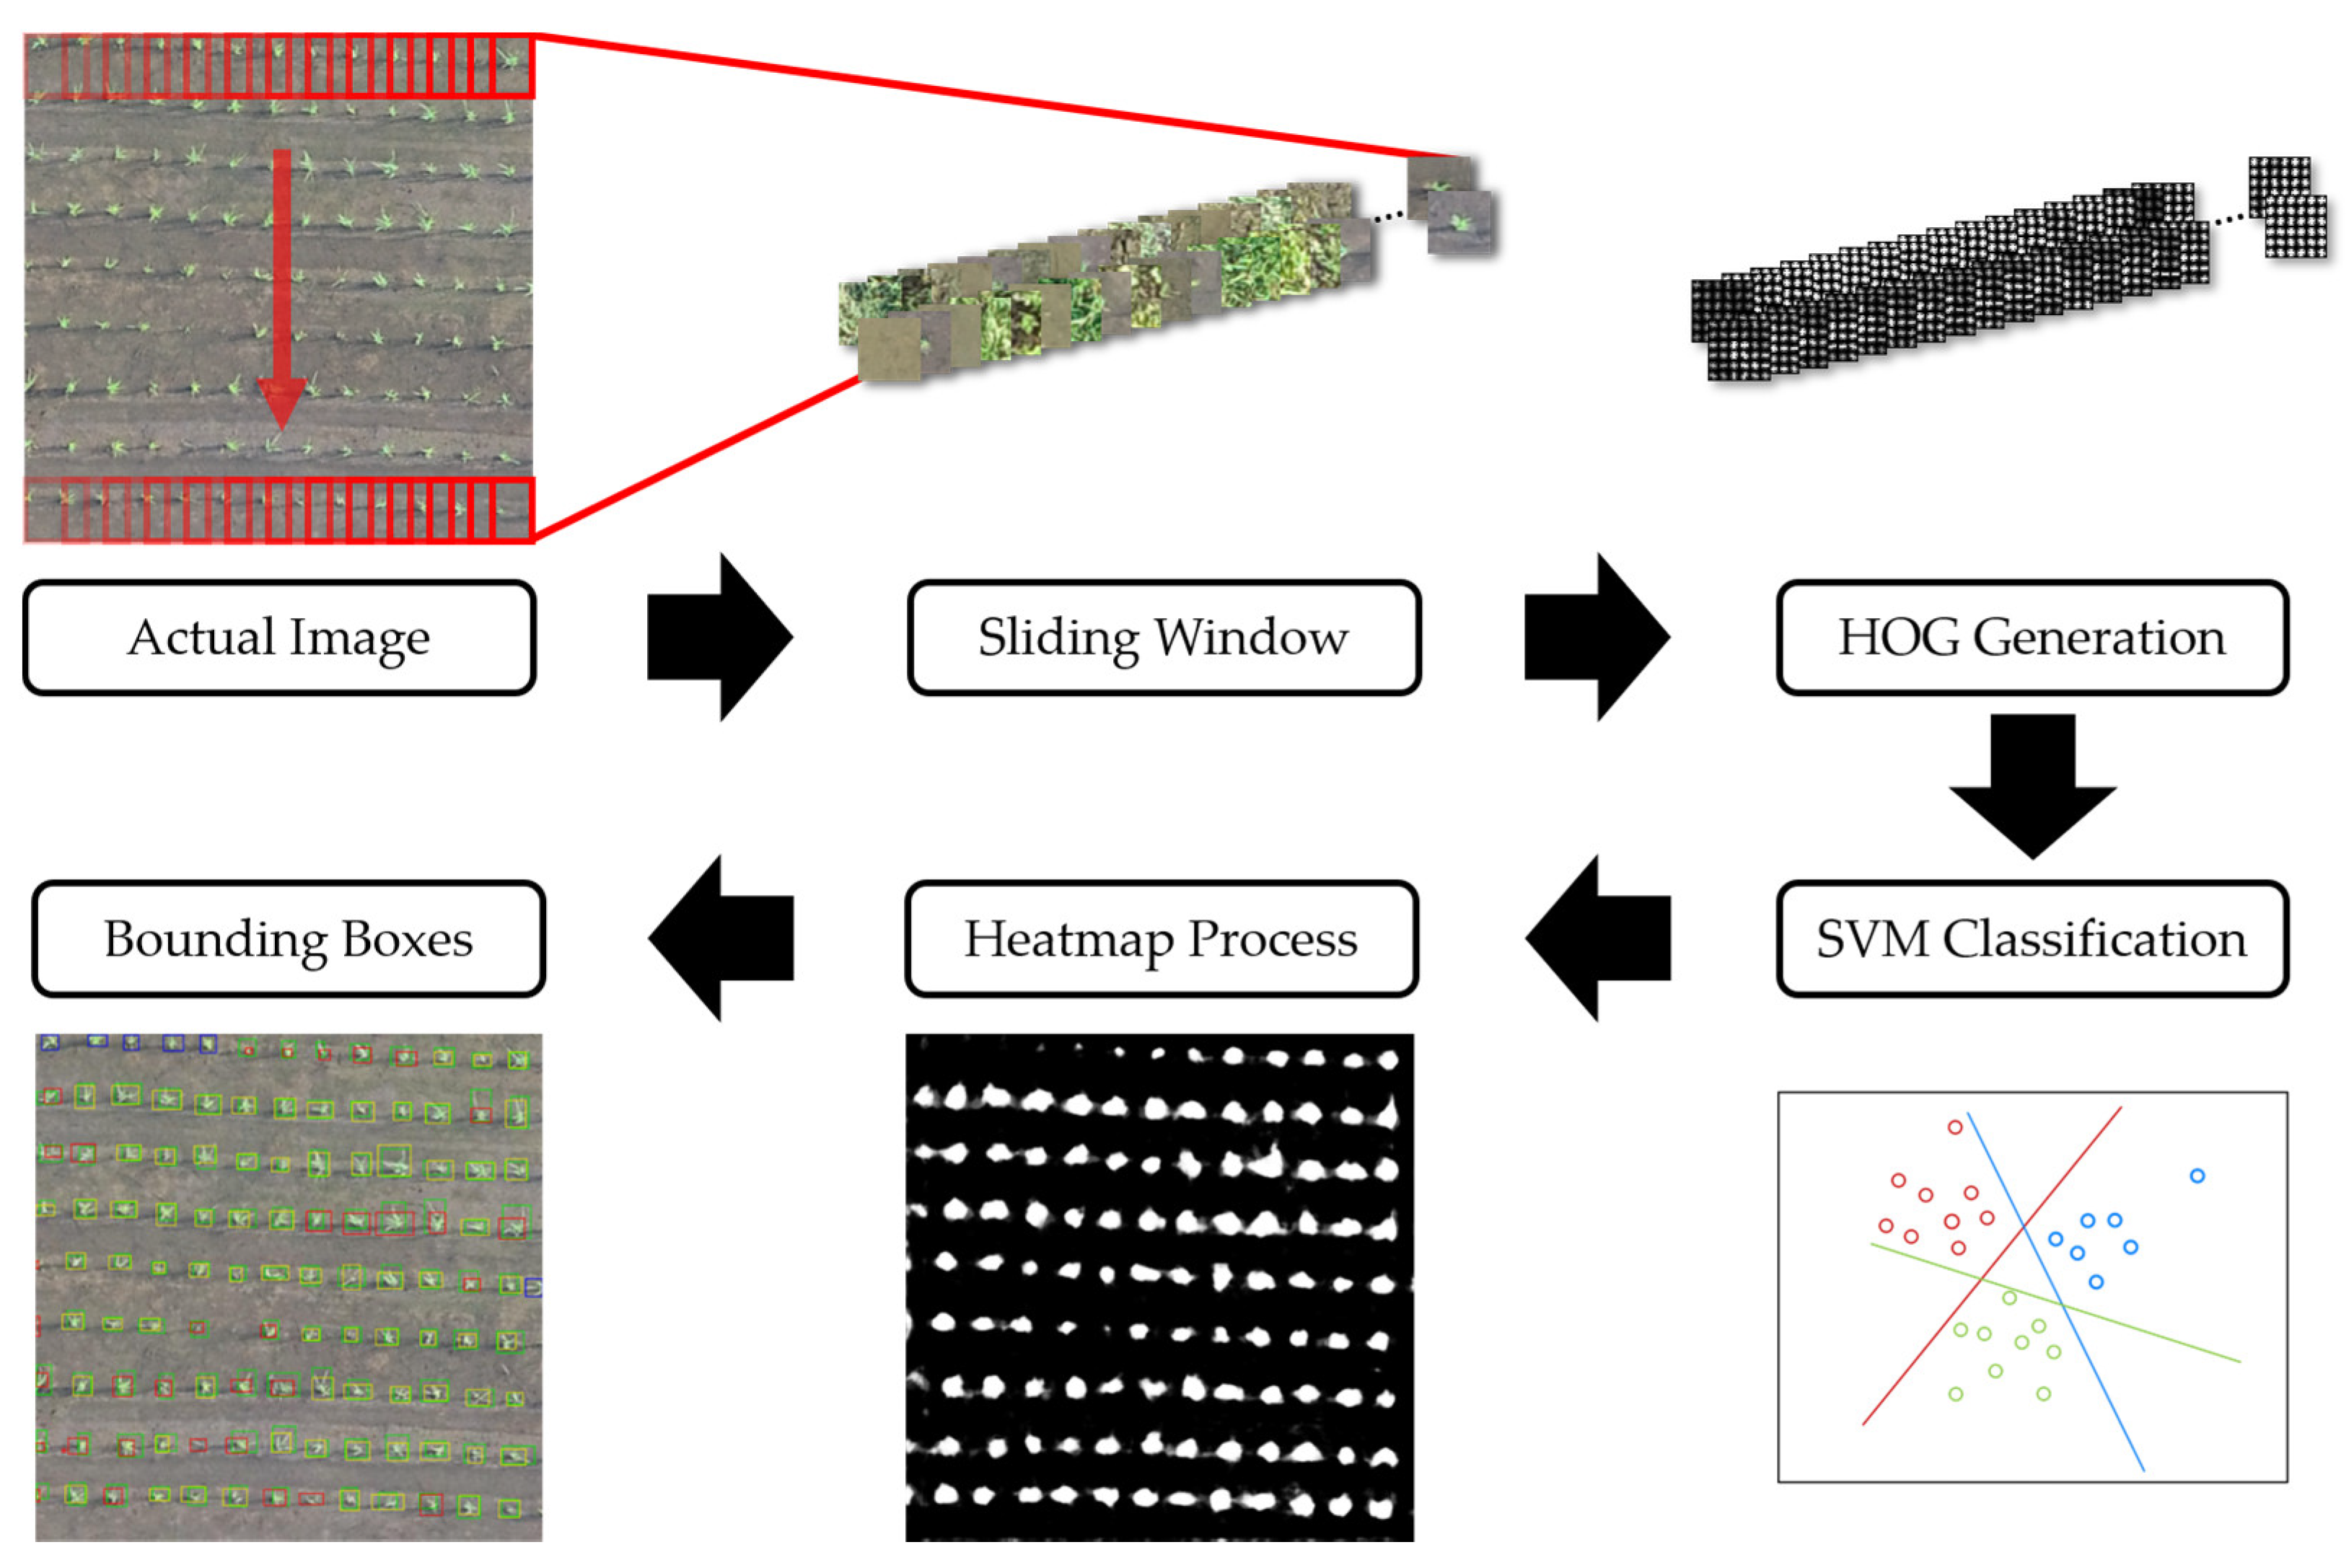
49]. This study adopts HOG features with SVM to build a two-stage model to detect rice seedlings.
The advantage of directly using images in object detection applications is that it allows CNNs to avoid manual feature extraction. In other words, CNNs are one of the most effective algorithms for object detection due to directly extracting features and detecting objects from images. In recent years, impressive improvements have been achieved in CNNs to address the problem of object detection by proposing many algorithms in which the network models are trained by combining local regional perception and feature extraction with a classification process. Tong et al. [
35] and Zhang et al. [
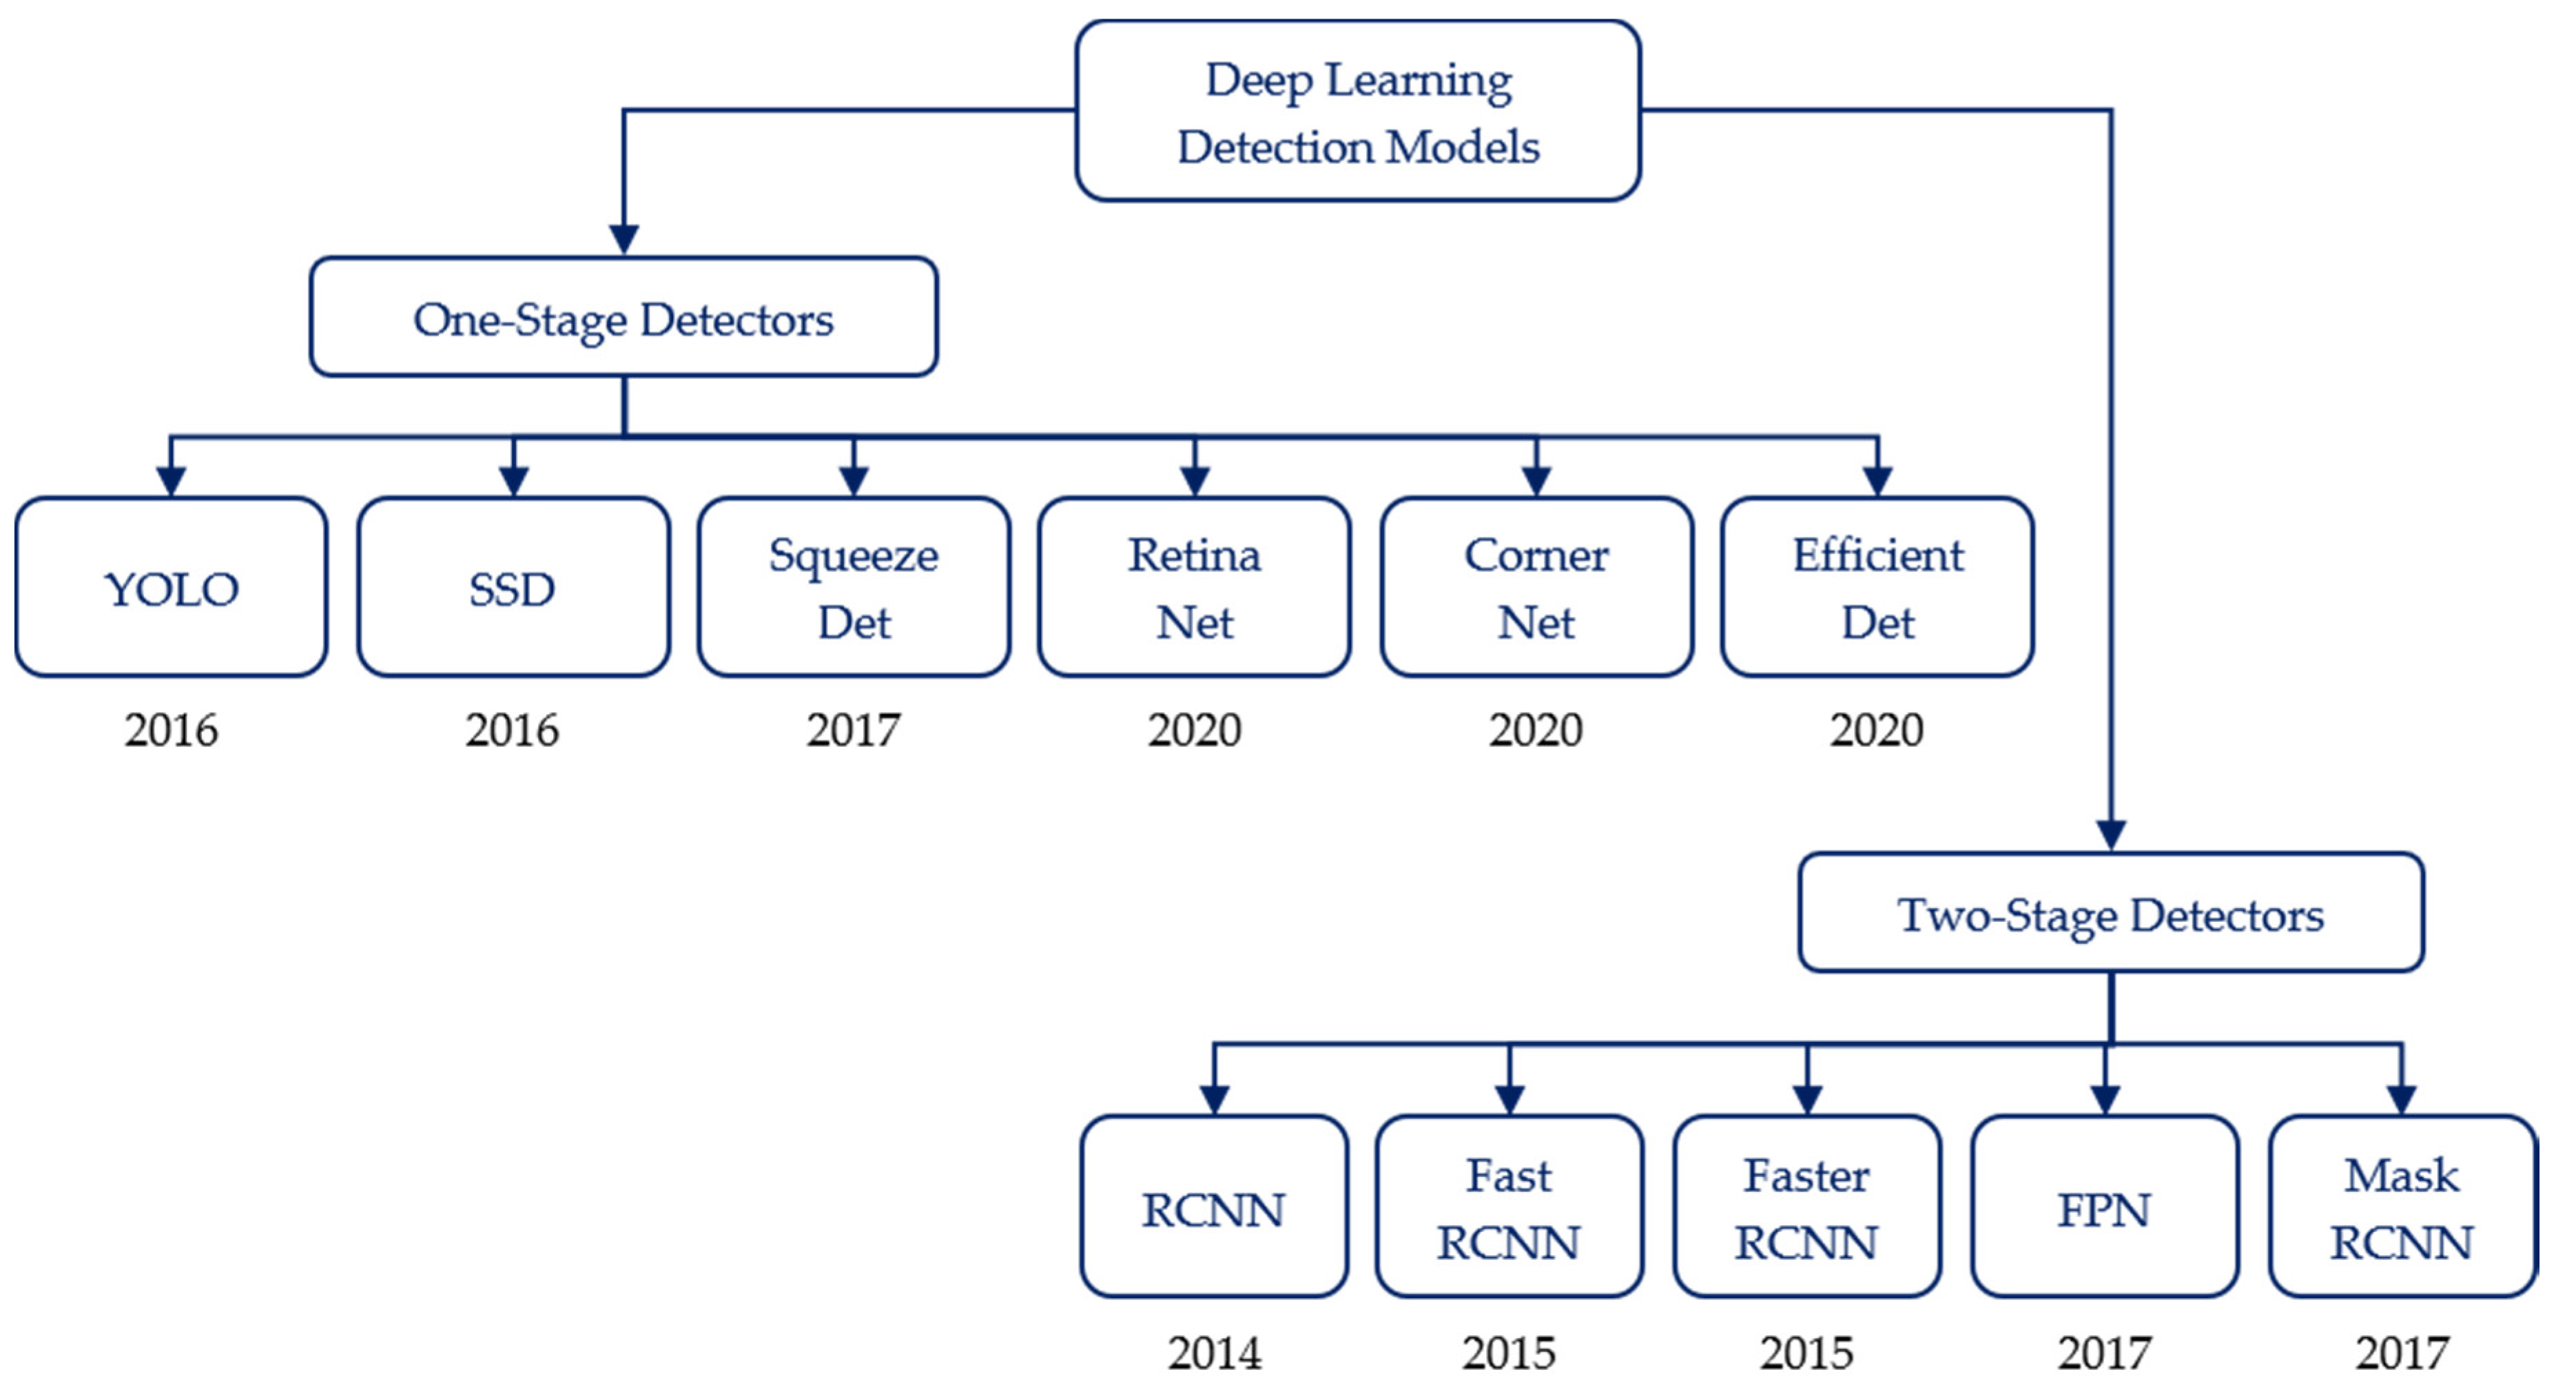
29] provided detailed reviews about the recent progress of CNN algorithms for objection detection. The development stages of CNN-based object detection models are shown in
Figure 1 [
31]. These object detection algorithms based on deep learning are divided into one-stage and two-stage detection algorithms. In one-stage algorithms, features for bounding box regression and class classification are directly extracted by the convolution operations on the output features of backbone networks. Object detection algorithms based on feature map convolution include YOLO [
50], SSD [
51], SqueezeDet [
52], RetinaNet [
53], CornerNet [
54] and EfficientDet [
55]. In two-stage algorithms, regional proposal modules are used to propose targeted object boundary boxes, and features are subsequently extracted from them to predict categories and masking objects. Object detection algorithms based on reginal proposal, such as R-CNN [
56], Fast R-CNN [
57], Faster R-CNN [
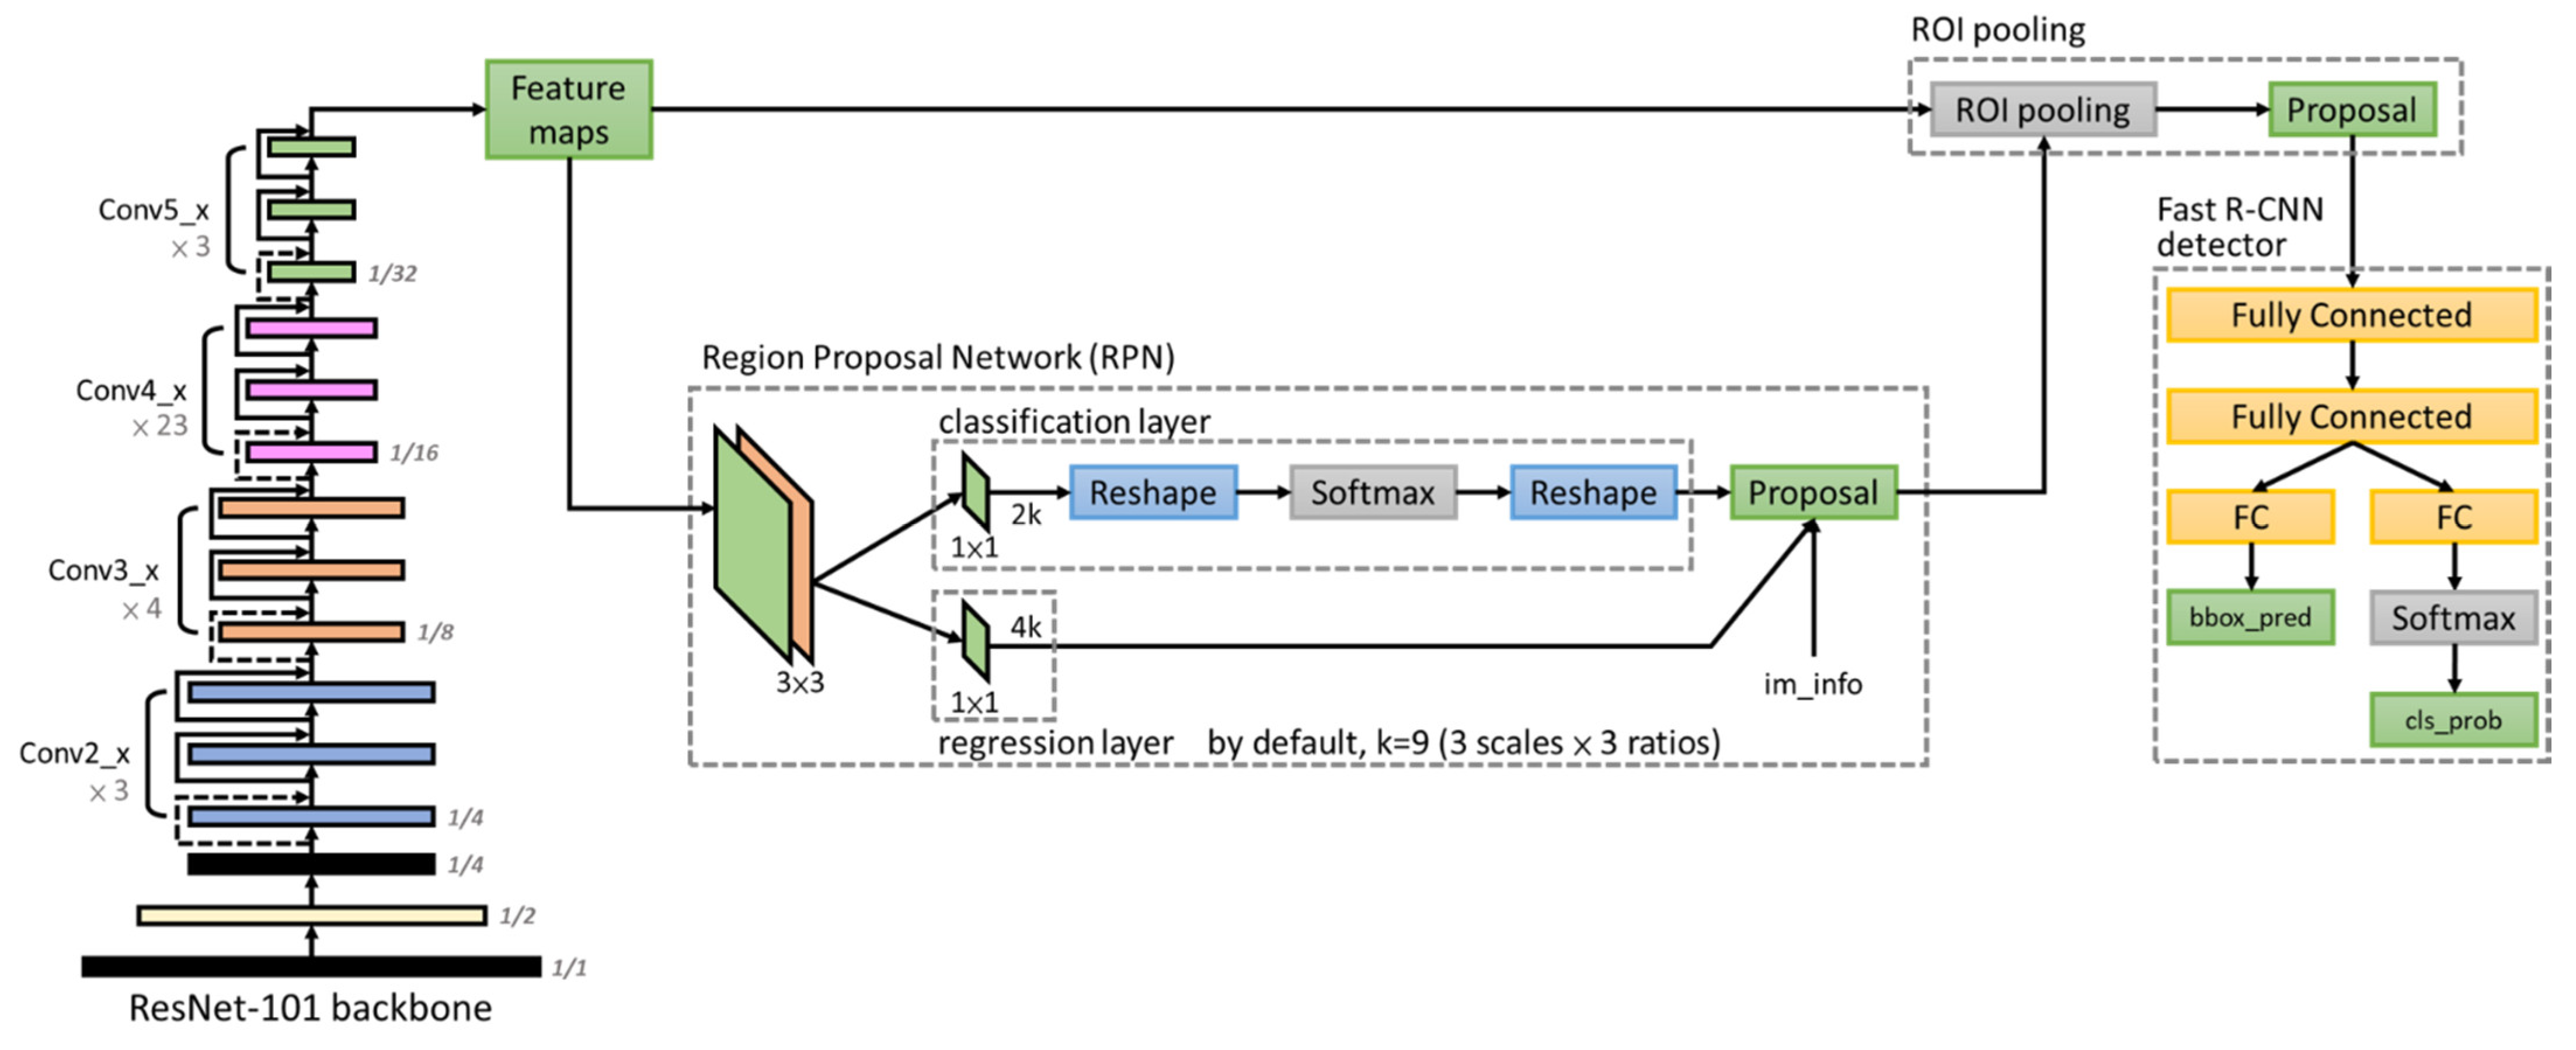
58], Mask R-CNN [
59] and FPN [
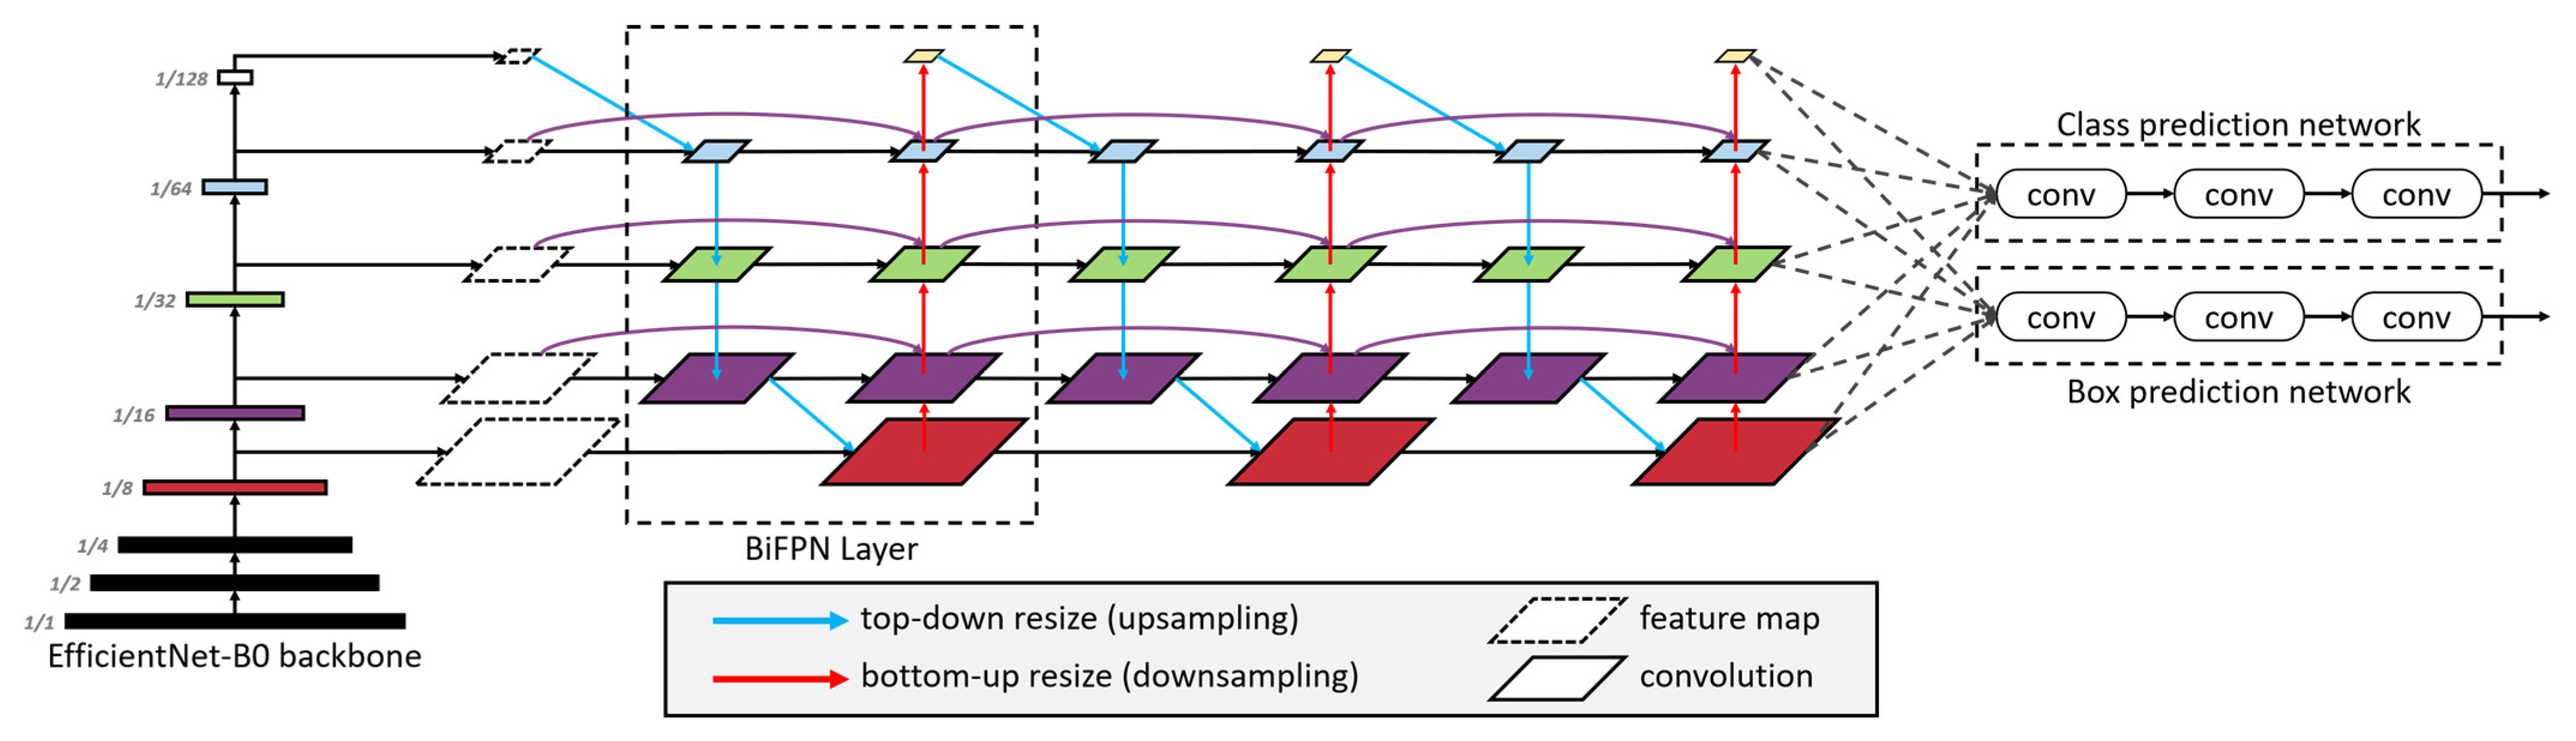
60], perform better and achieved high mean average precision (mAP). Among them, Mask-RCNN could be used to predict an exact mask within the bounding box of objects to detect single objects in images. This study adopts two state-of-the-art models, EfficientDet as a one-stage algorithm and Faster R-CNN as a two-stage algorithm, to detect rice seedlings in paddy fields due to the advantages of high efficiency, high localization and high precision for object detection.
This study overcomes a data scarcity problem with lightweight architecture and transfer learning in deep learning for precision agriculture. Besides, this study chooses EfficientDet and Faster R-CNN due to their architectures being capable of handling huge variations of feature scales for small-object detection. Overall, this study adopts one-stage and two-stage object detection architectures to develop tiny-object detection in UAV images to identify rice seedlings for precision agriculture, which has never been done for traditional rice cultivation, and the legacy HOG-SVM approach was applied for comparison. This study aims to achieve the following purposes:
- (1)
adopting legacy, one-stage and two-stage machine learning algorithms to precisely detect small objects in UAV images,
- (2)
rapidly establishing object detection models from prior knowledge as a transfer learning approach to overcome a data scarcity problem with lightweight architecture and verifying the applicability on the unseen data, and
- (3)
evaluating performance and computation cost of rice seedling detection by three machine learning models to observe rice seedling growth.
4. Conclusions
Tiny-object detection in UAV images is a challenging task in practical applications. Long computation time and slow speed due to memory consumption are the first-priority causes. Complex background and scenes, high density areas and random textures of fields can also decrease the performance of small-object detection. In this study, small rice seedlings are presented in highly noisy environments that influence the detection using deep learning on UAV imagery.
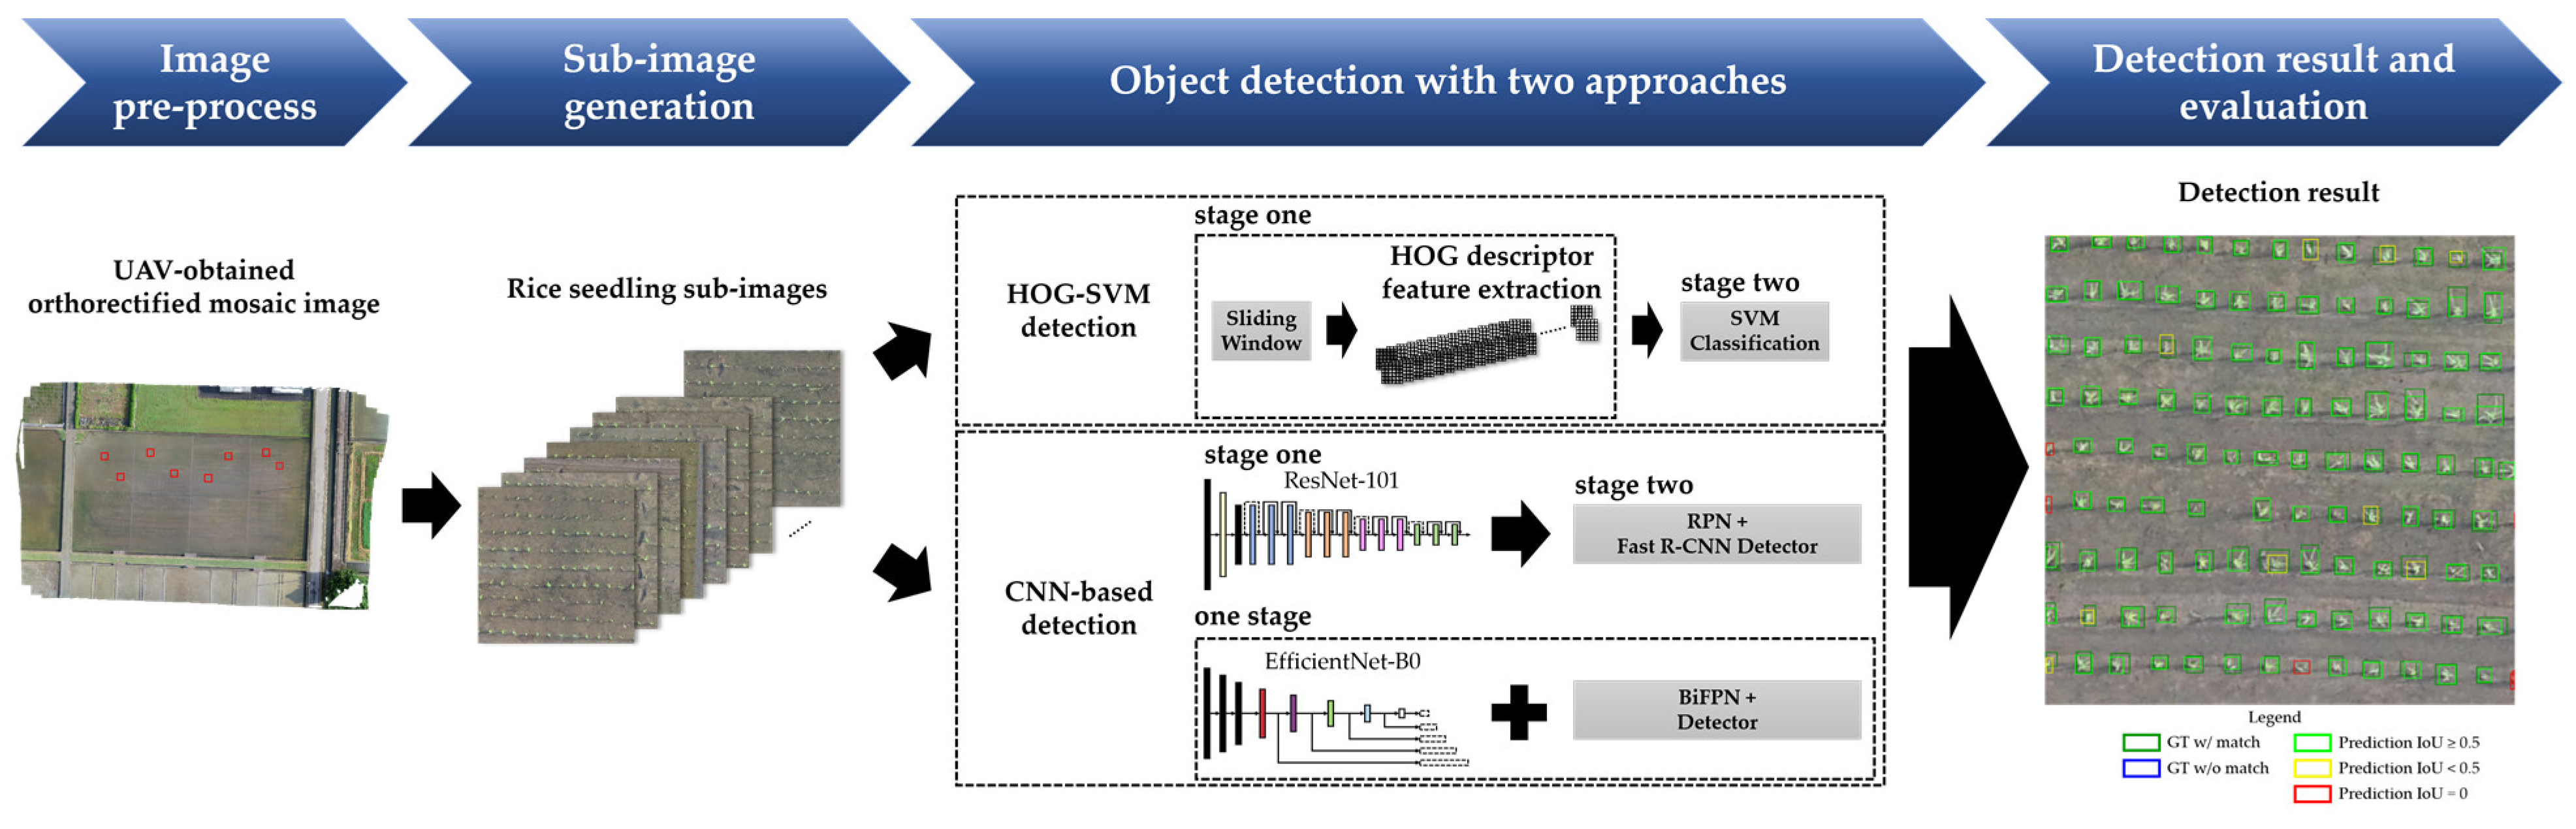
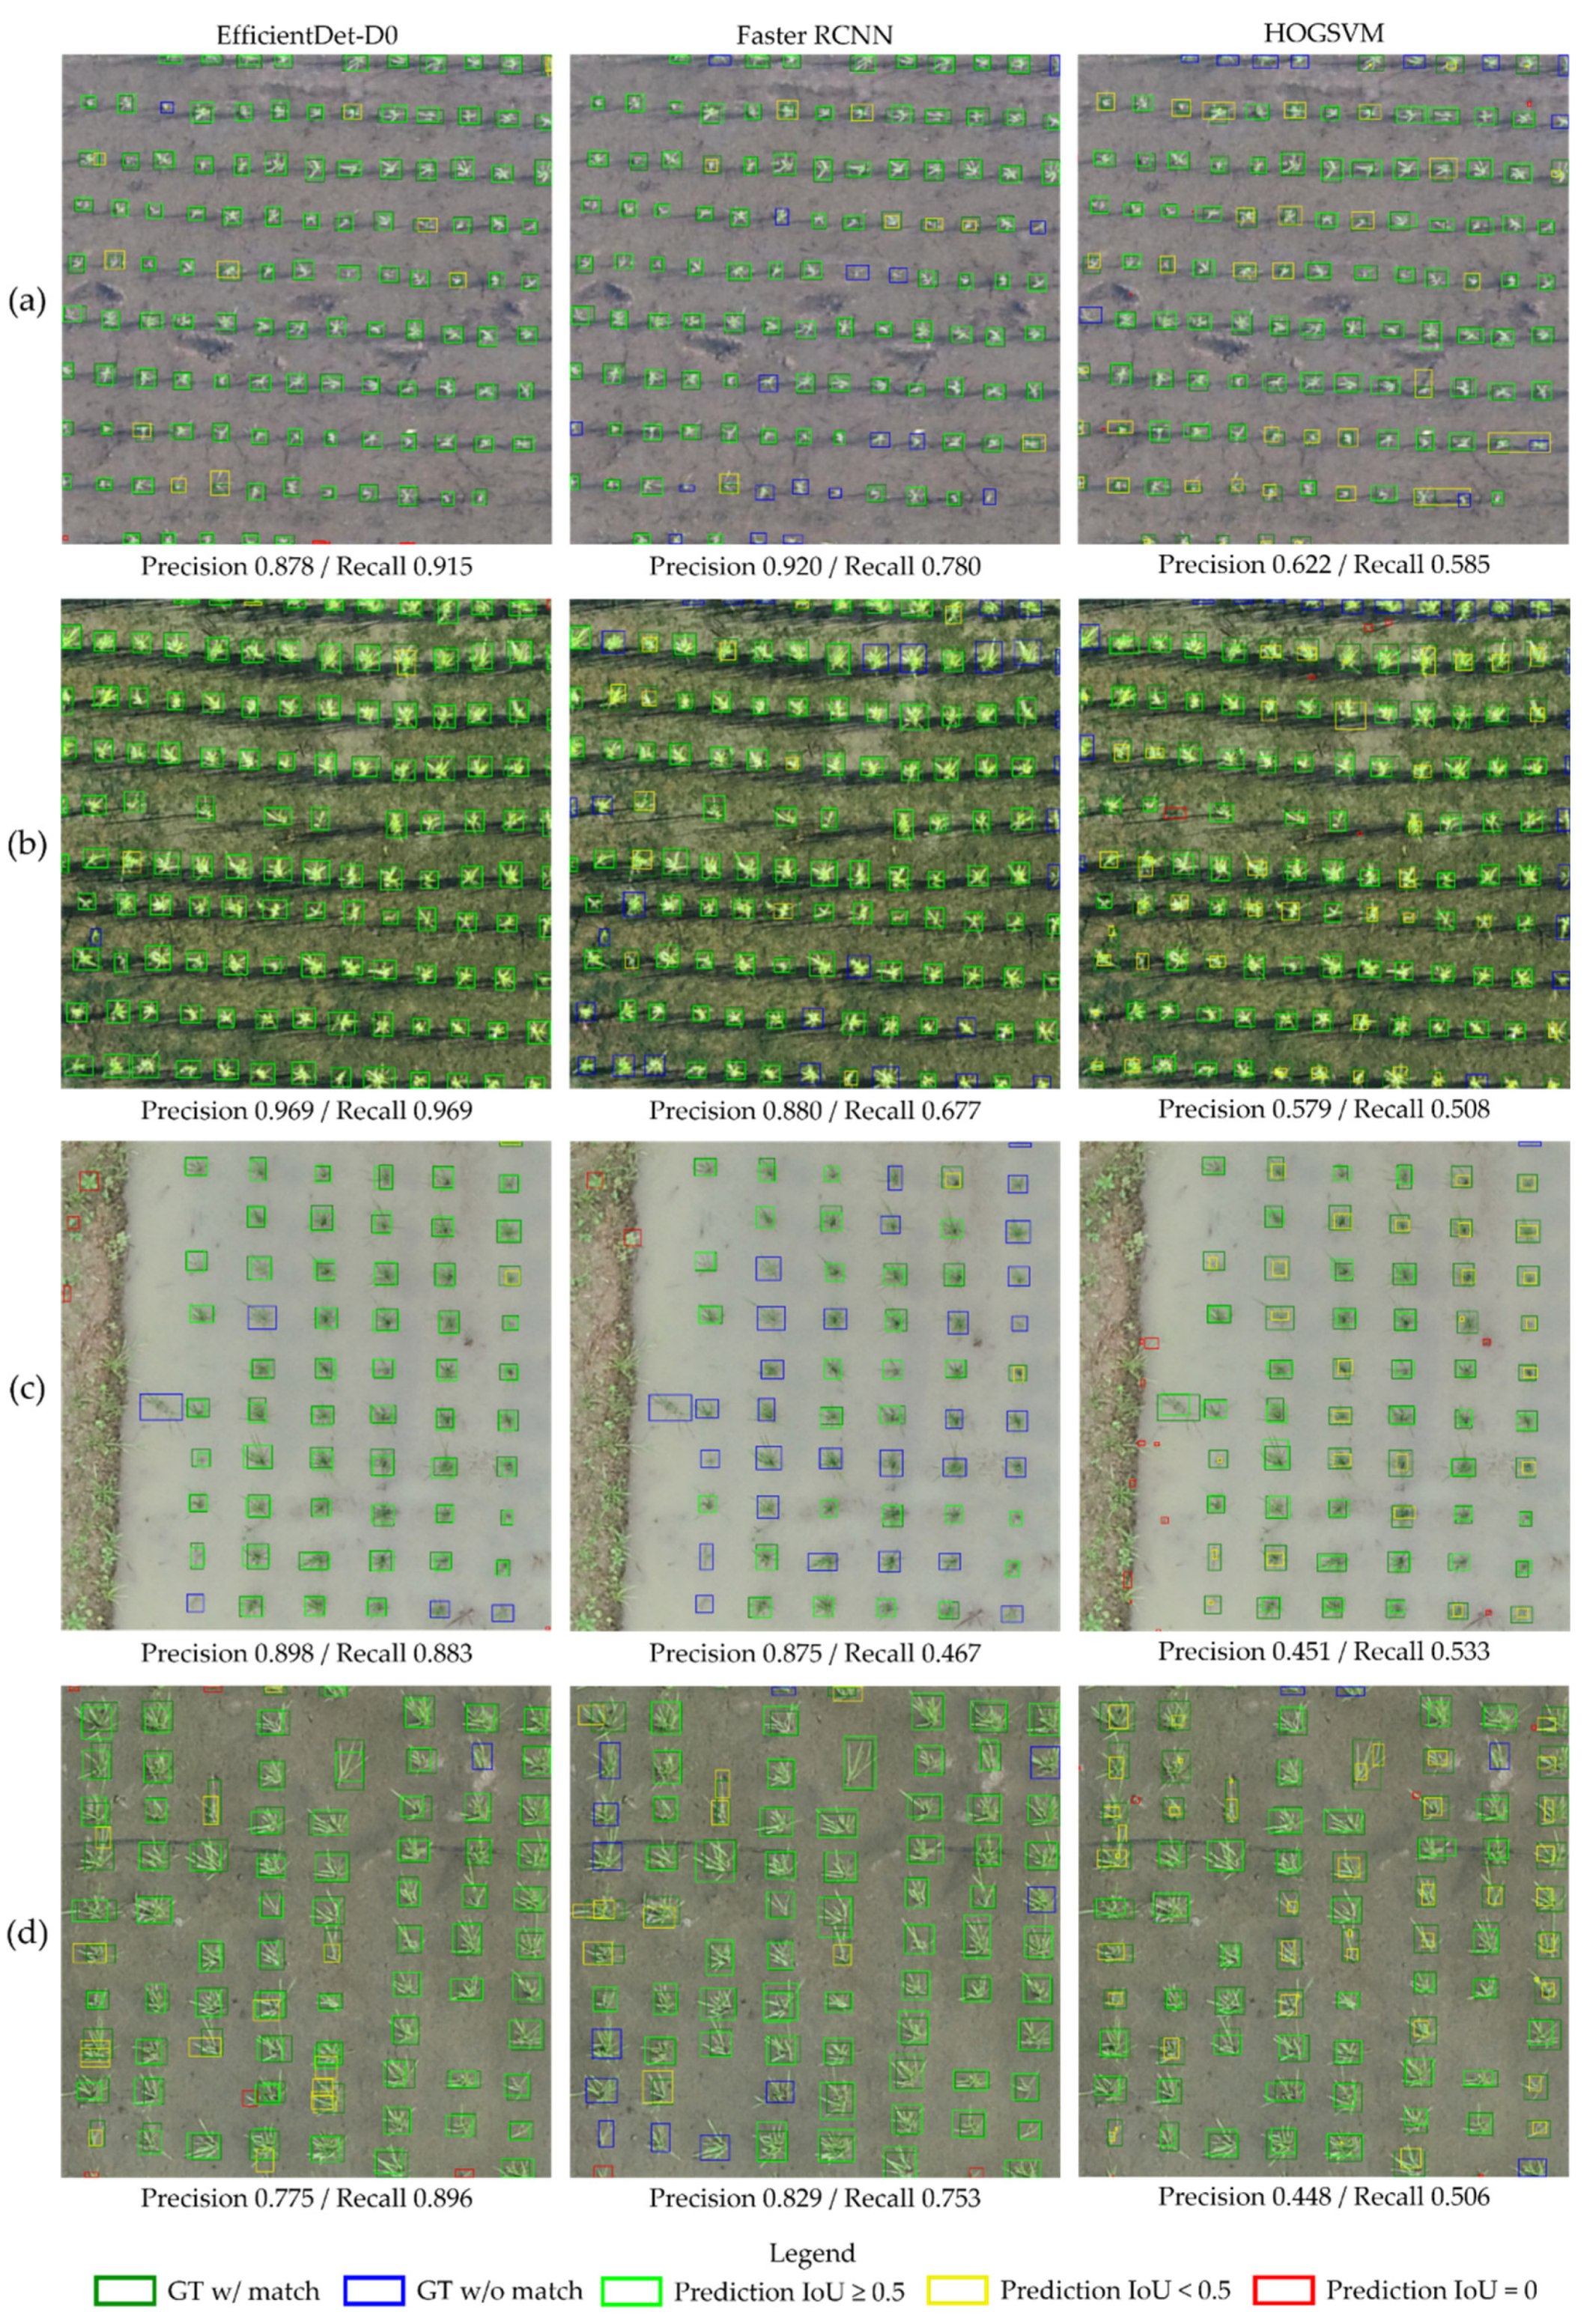
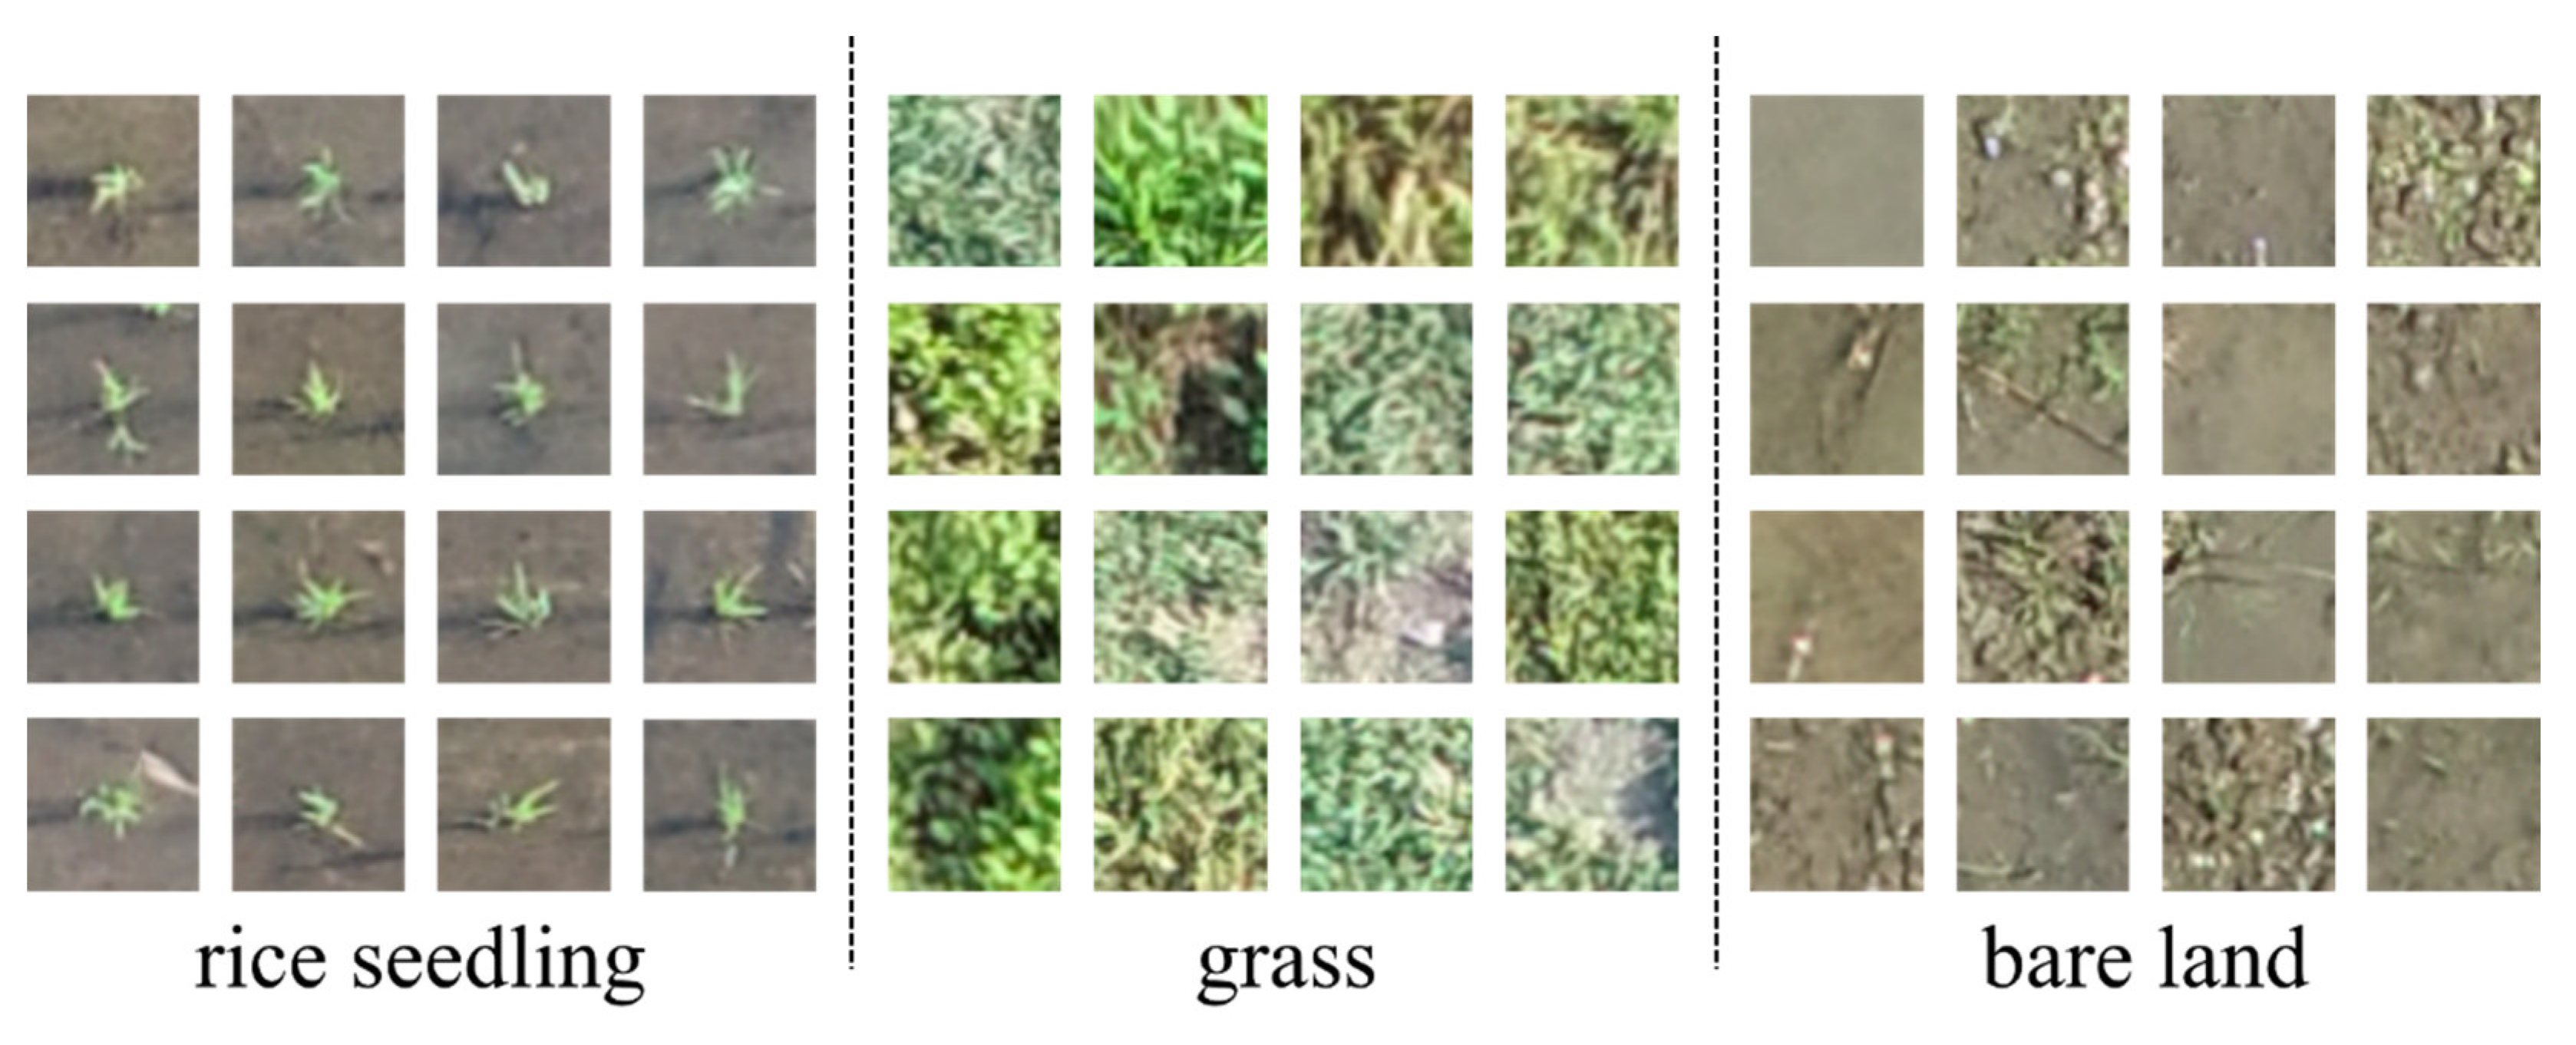
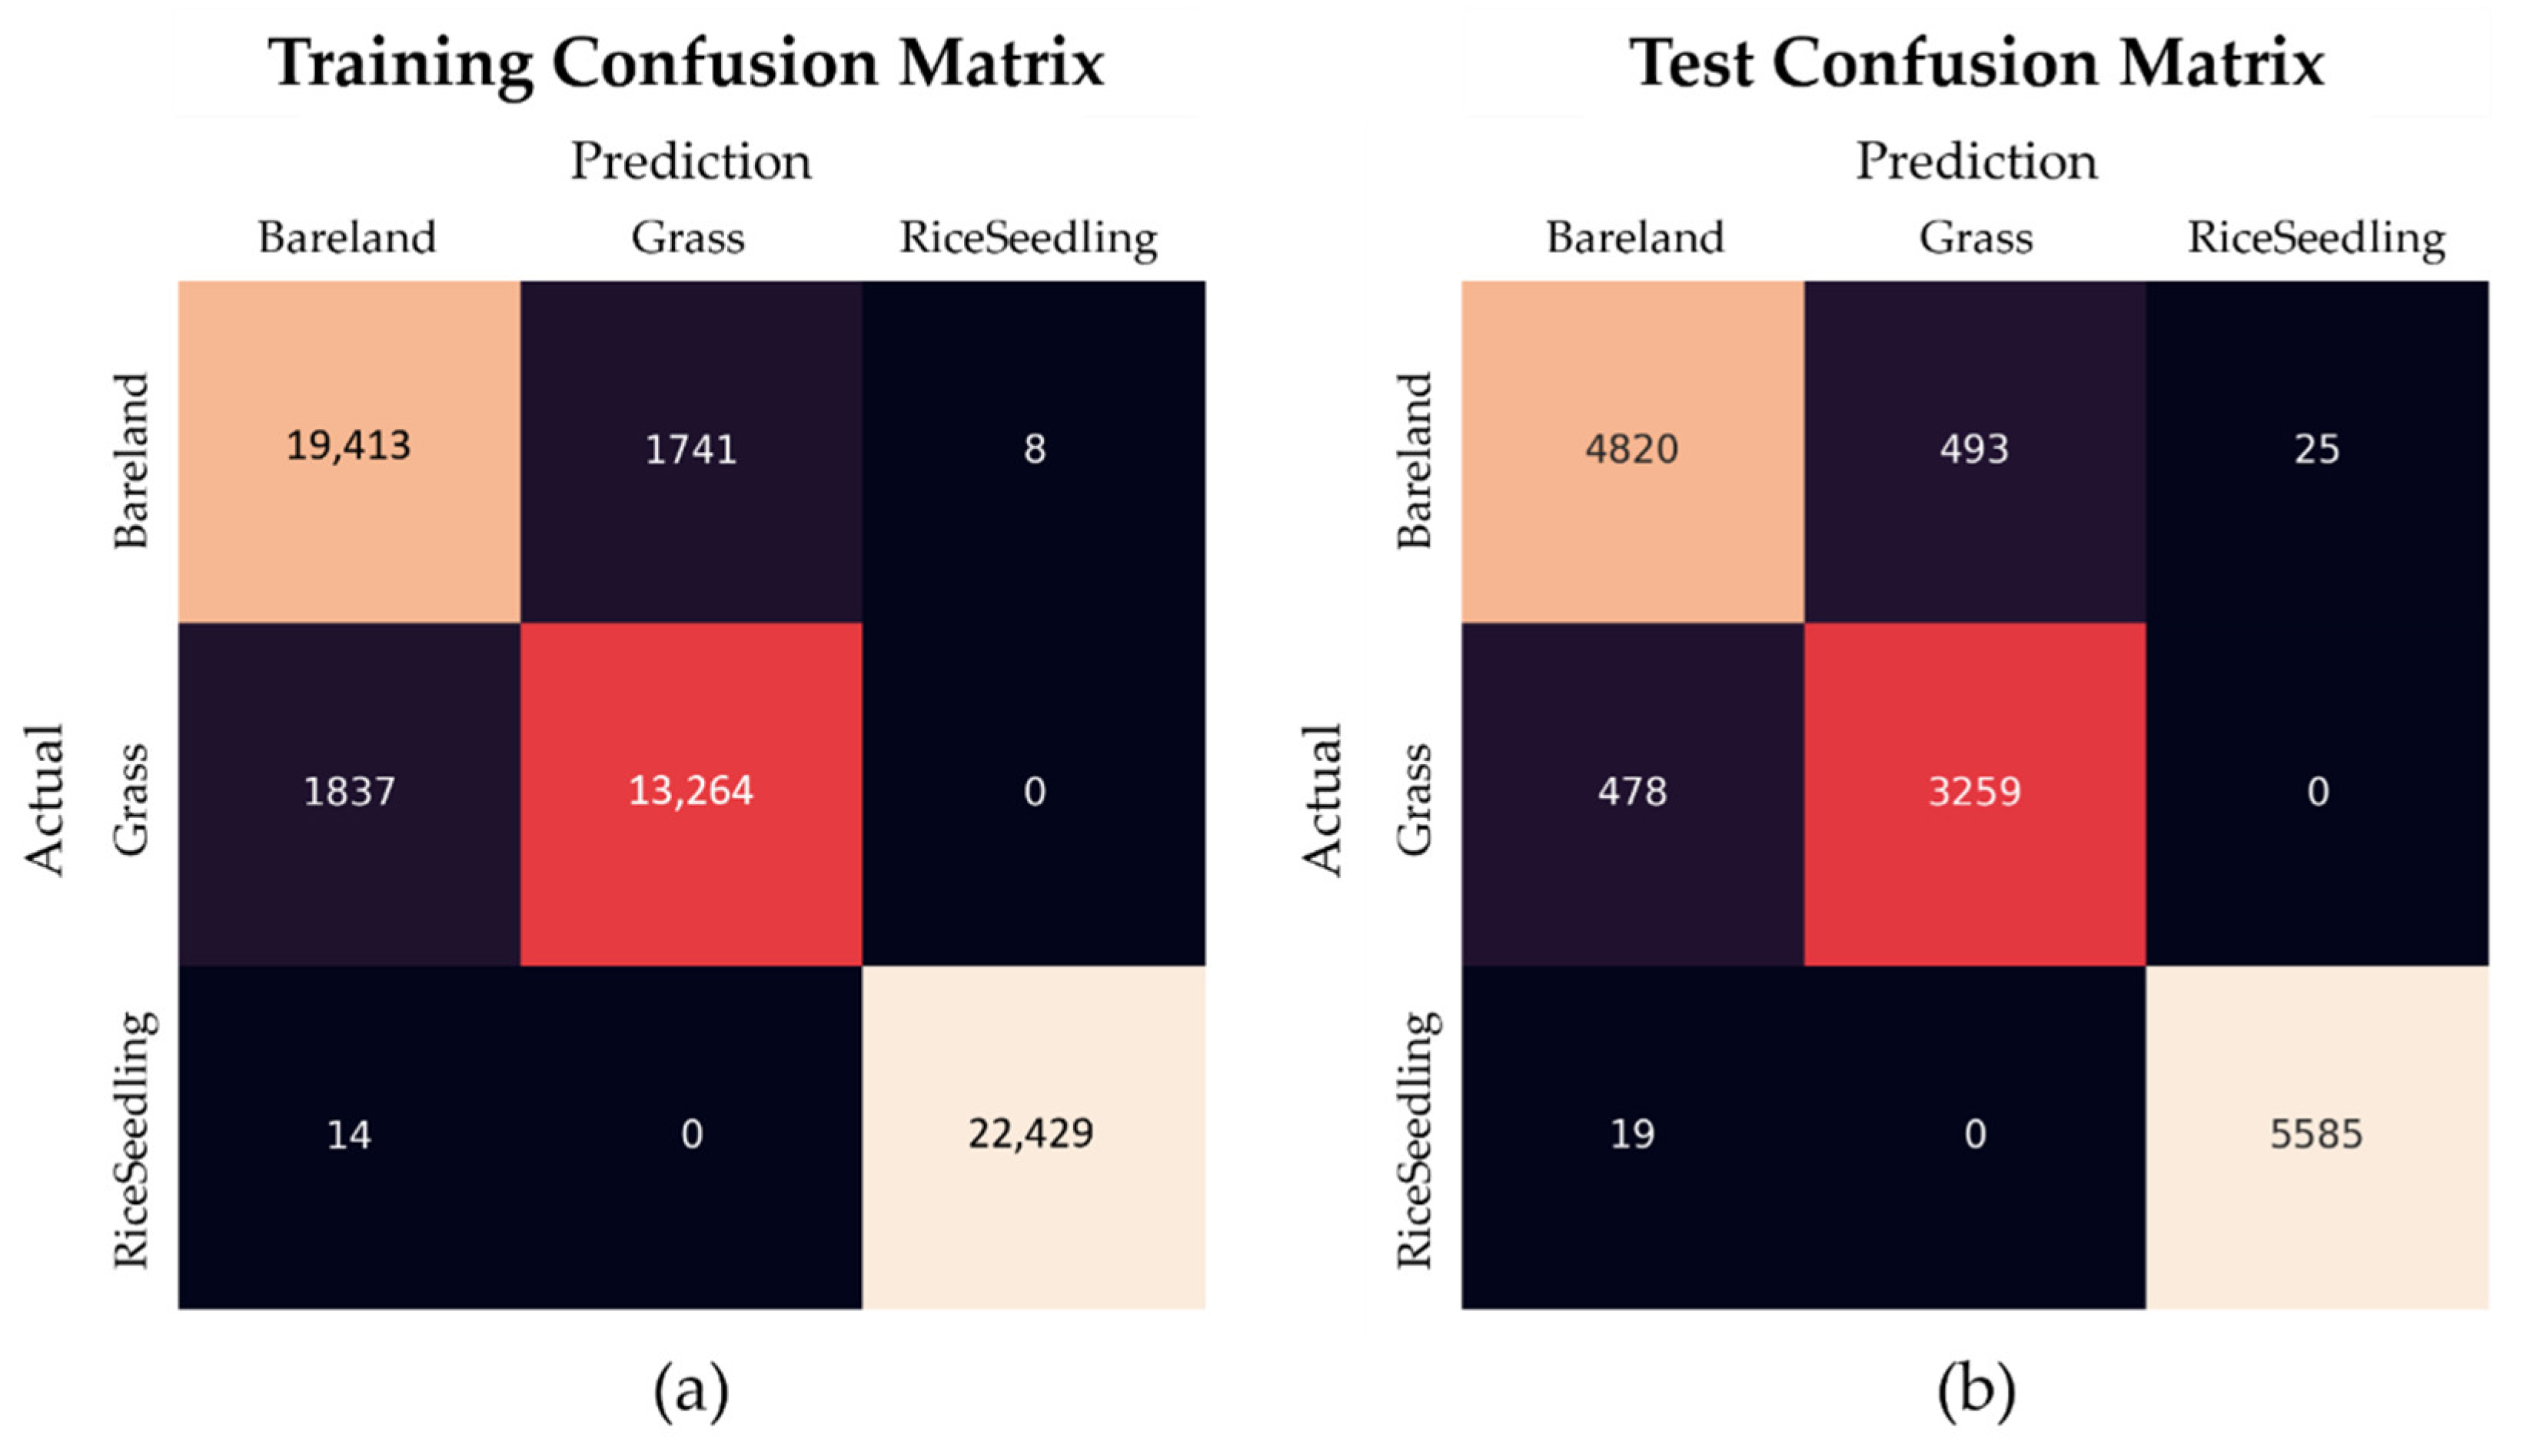
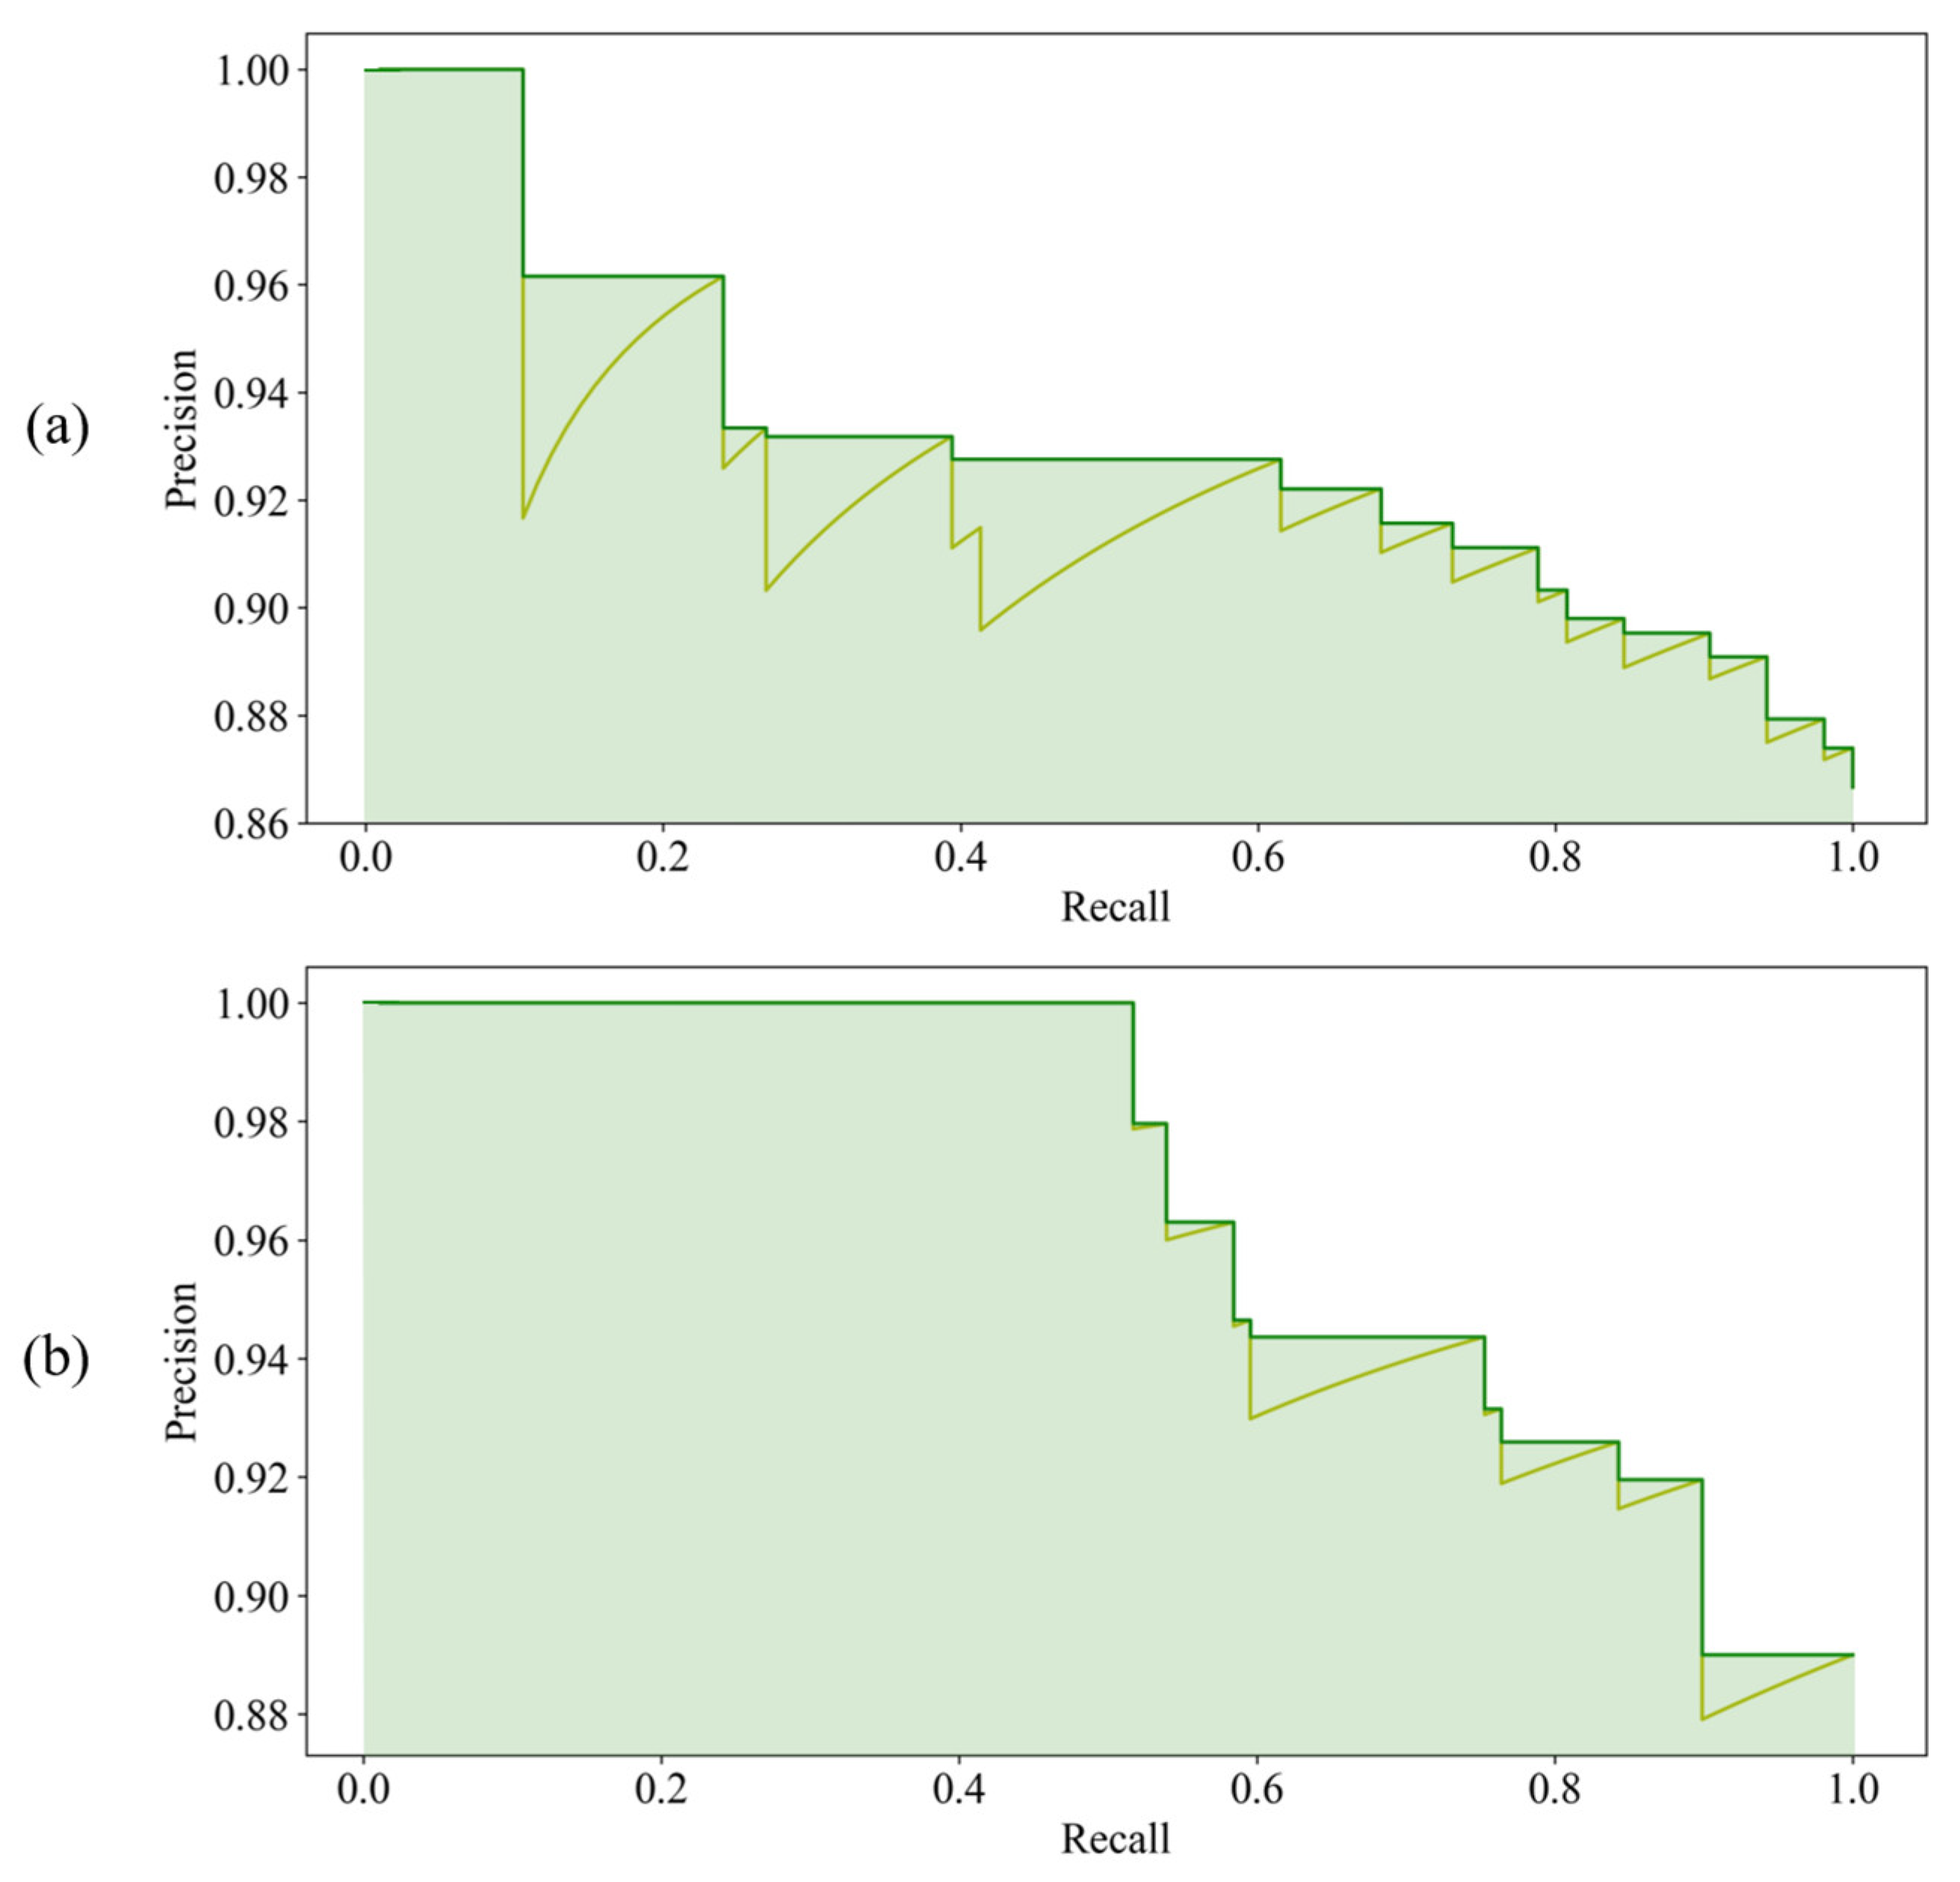
This study presents three machine learning models, HOG-SVM, EfficientDet and Faster R-CNN on UAV images to detect tiny rice seedlings. The datasets are semi-annotated with preprocessing of image processing and manual verification to reduce the cost of labor. This approach is sure to generate usable datasets rapidly. The combination of HOG descriptor and SVM classifier gives a robust result for rice seedling classification, which achieves 99.9% F1-score in training and 99.6% F1-score in testing. The rest of the two classes also achieve above 85% F1-score in both training and testing. However, explosive data growth is one of problems that needs to be solved in practical applications. For SVM classification, computational complexity grows exponentially with sample size. This is a significant drawback for such an algorithm that cannot efficiently process such big data for practical applications. In this study, two CNN models were transferred from pretrained models to develop a well-generalized model with high detection accuracy and rapidity. The pretrained models were well-trained by splitting four paddy images into 297 sub-images (each image sized 512 × 512 × 3) by annotating each rice seedling in every sub-image.
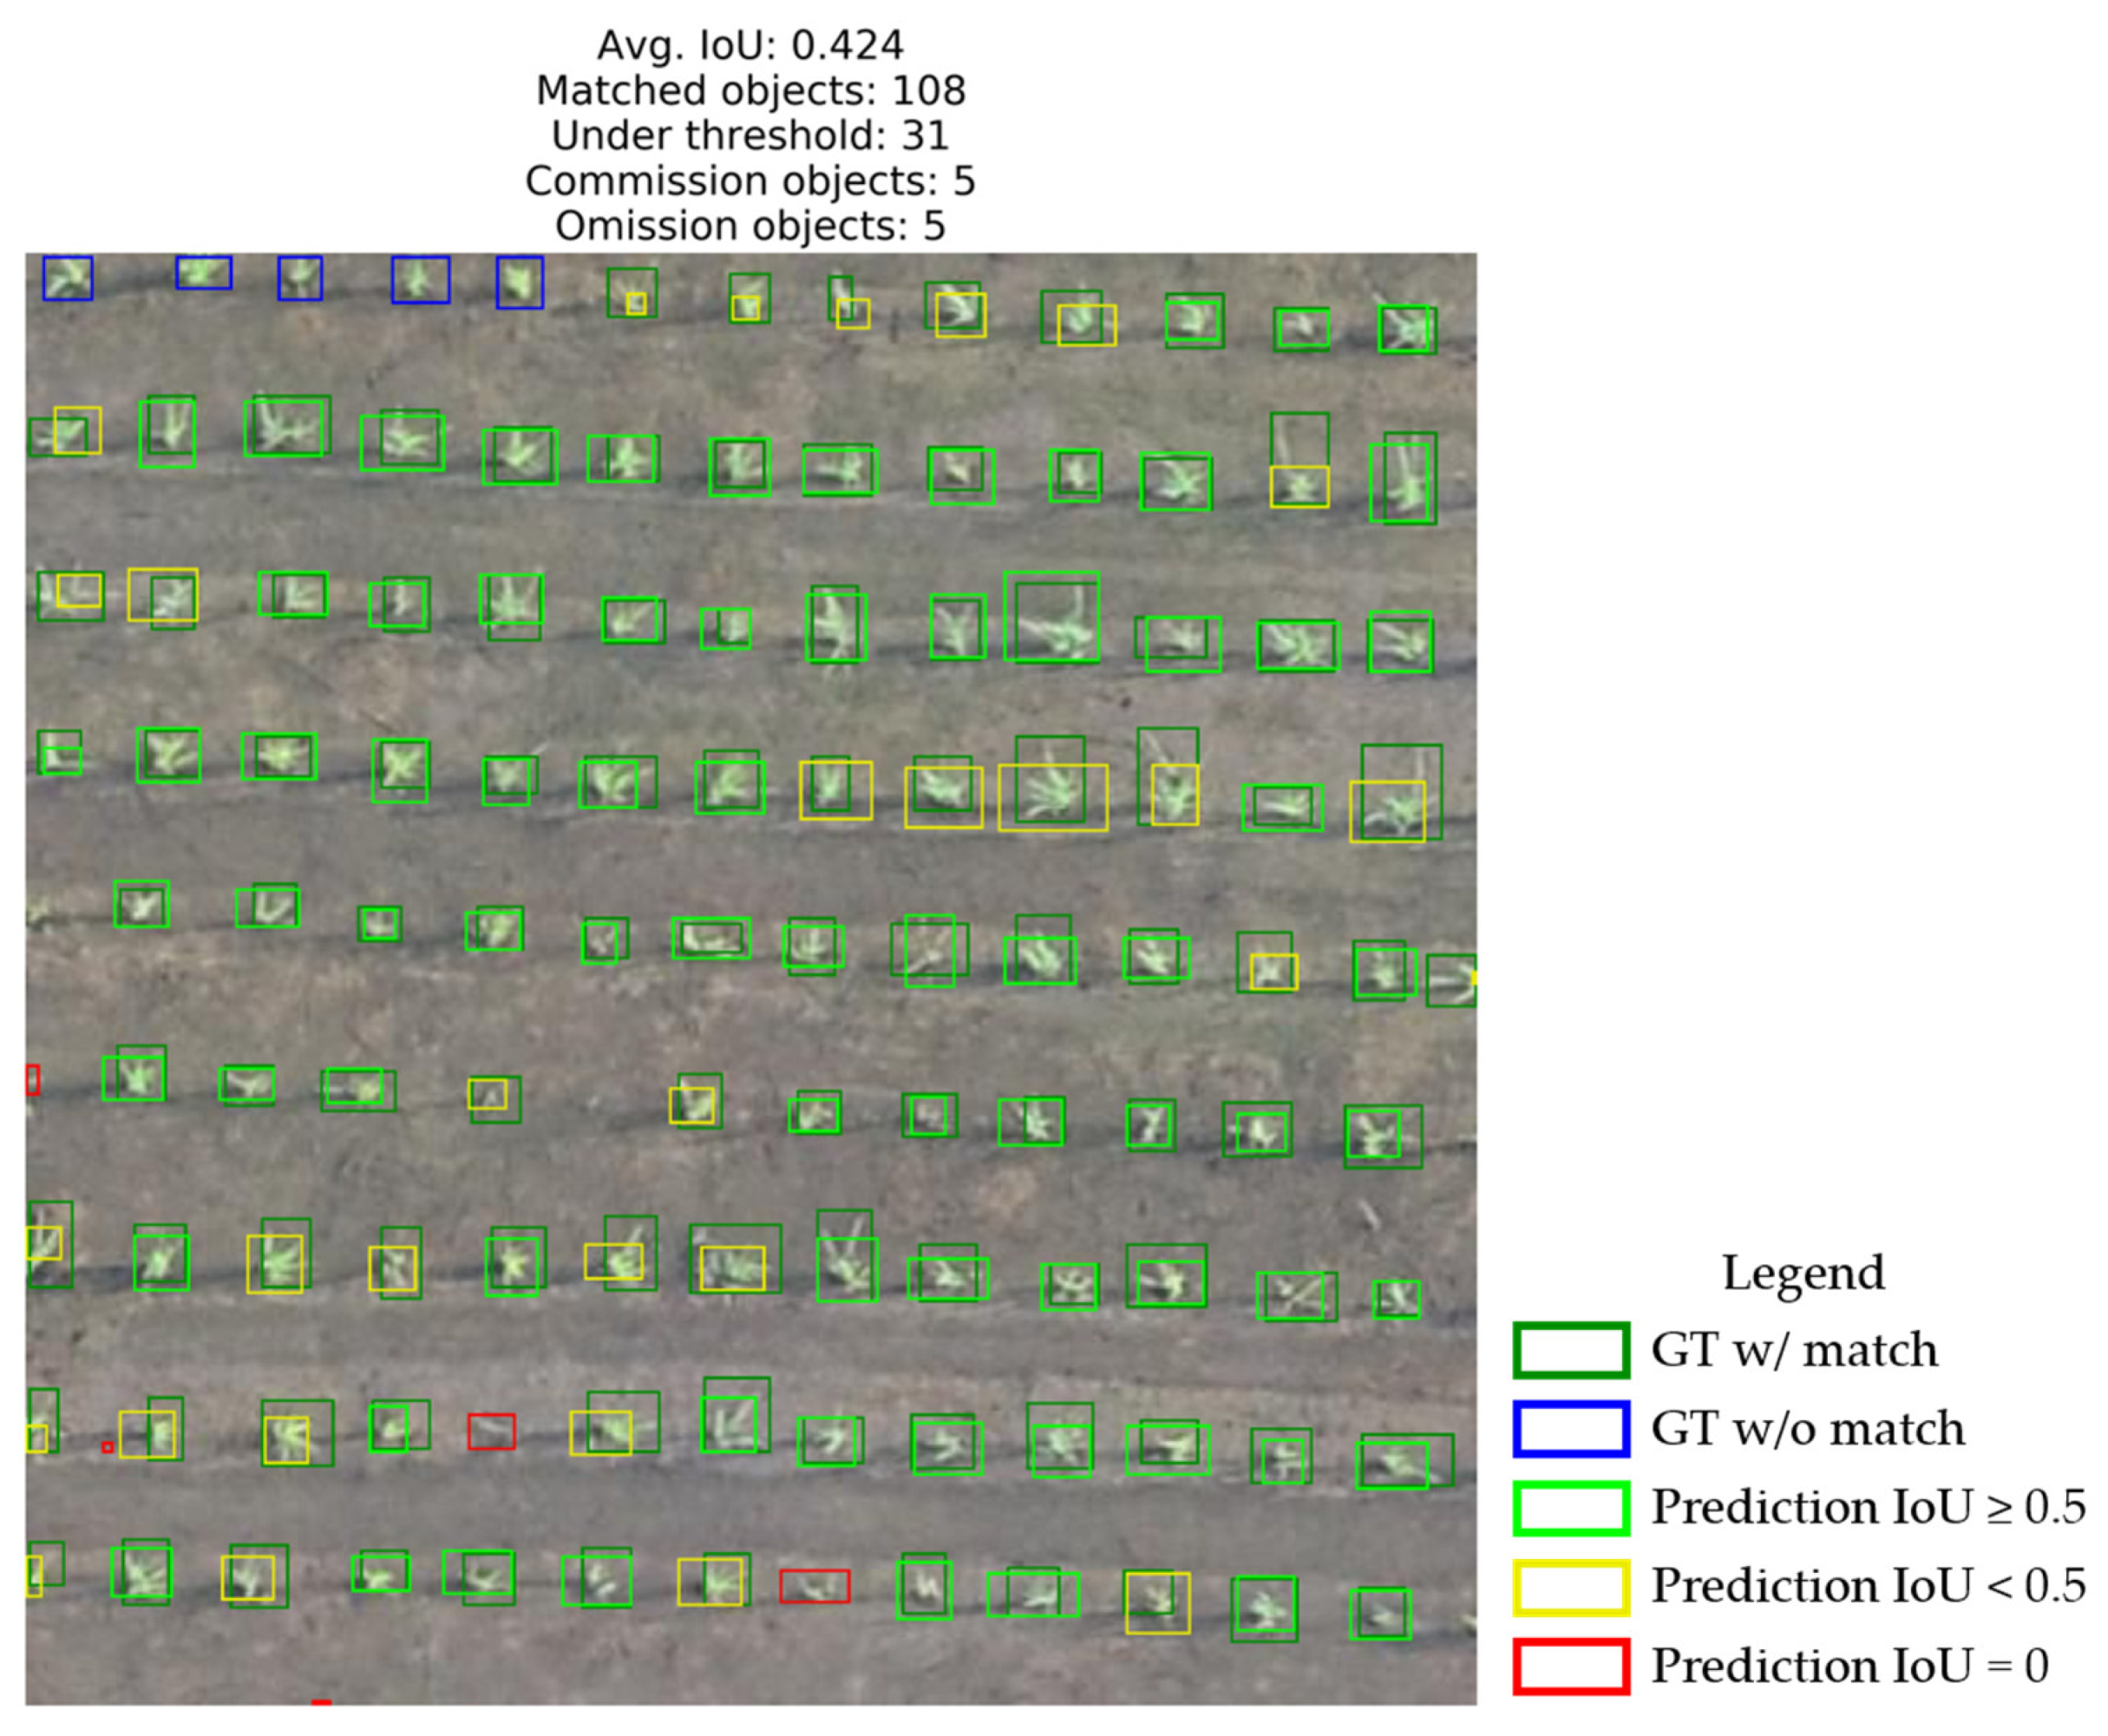
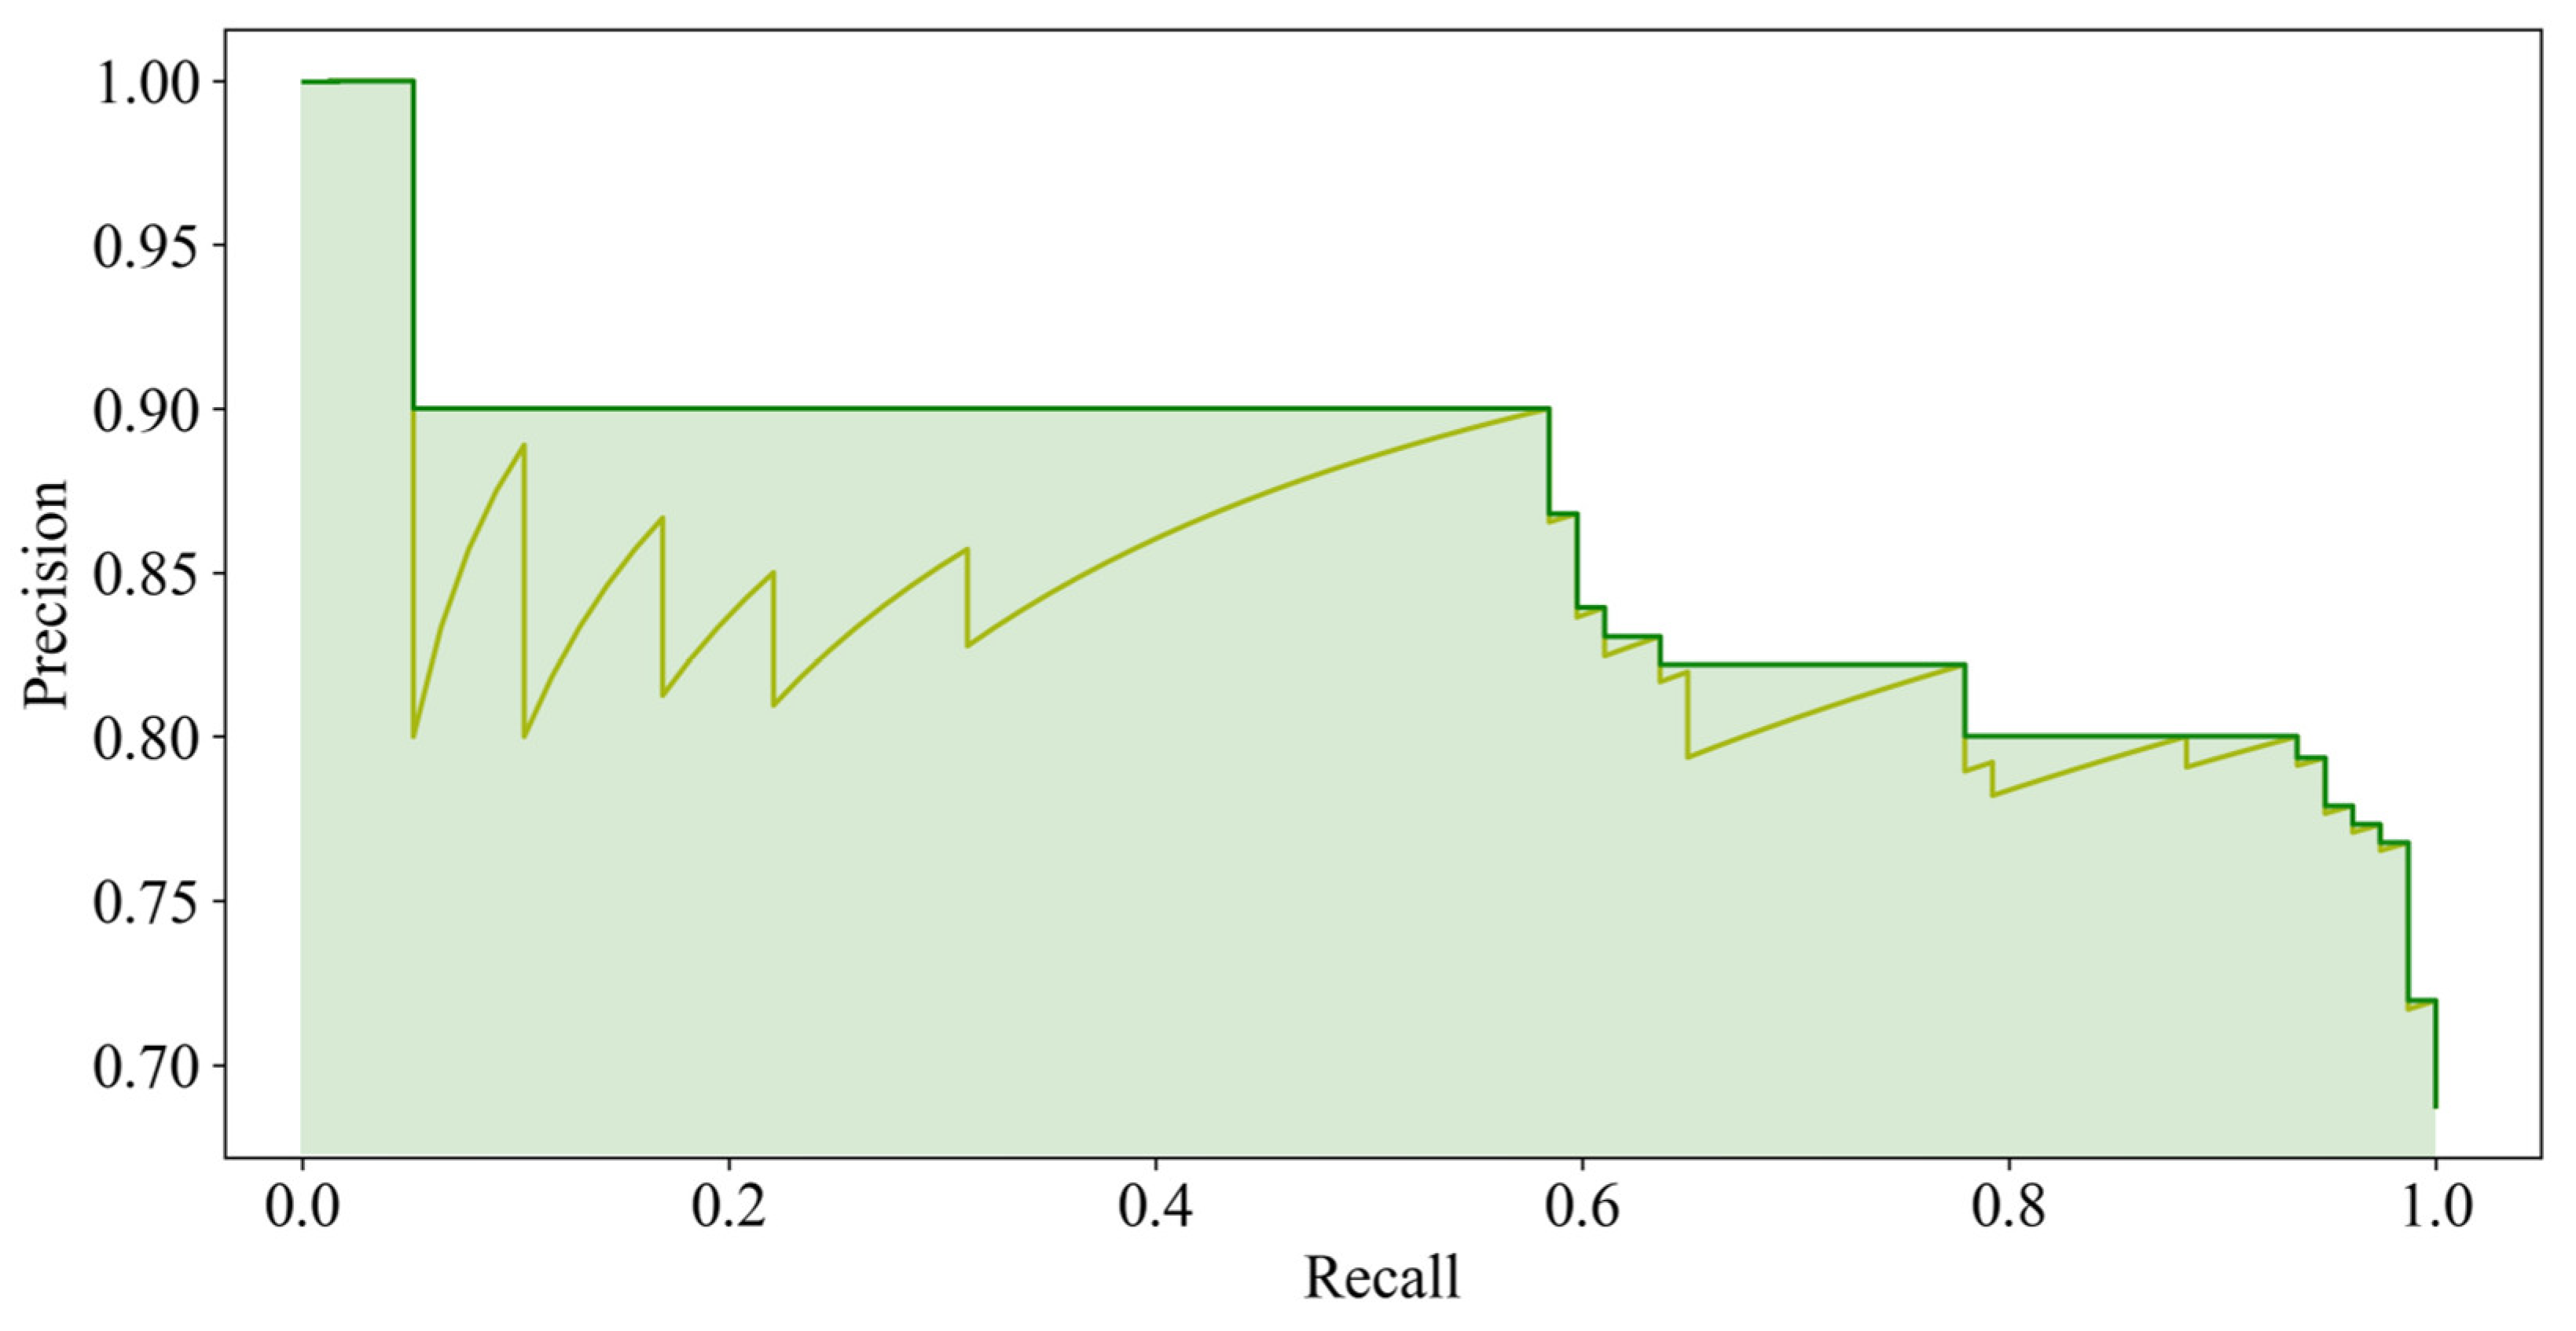
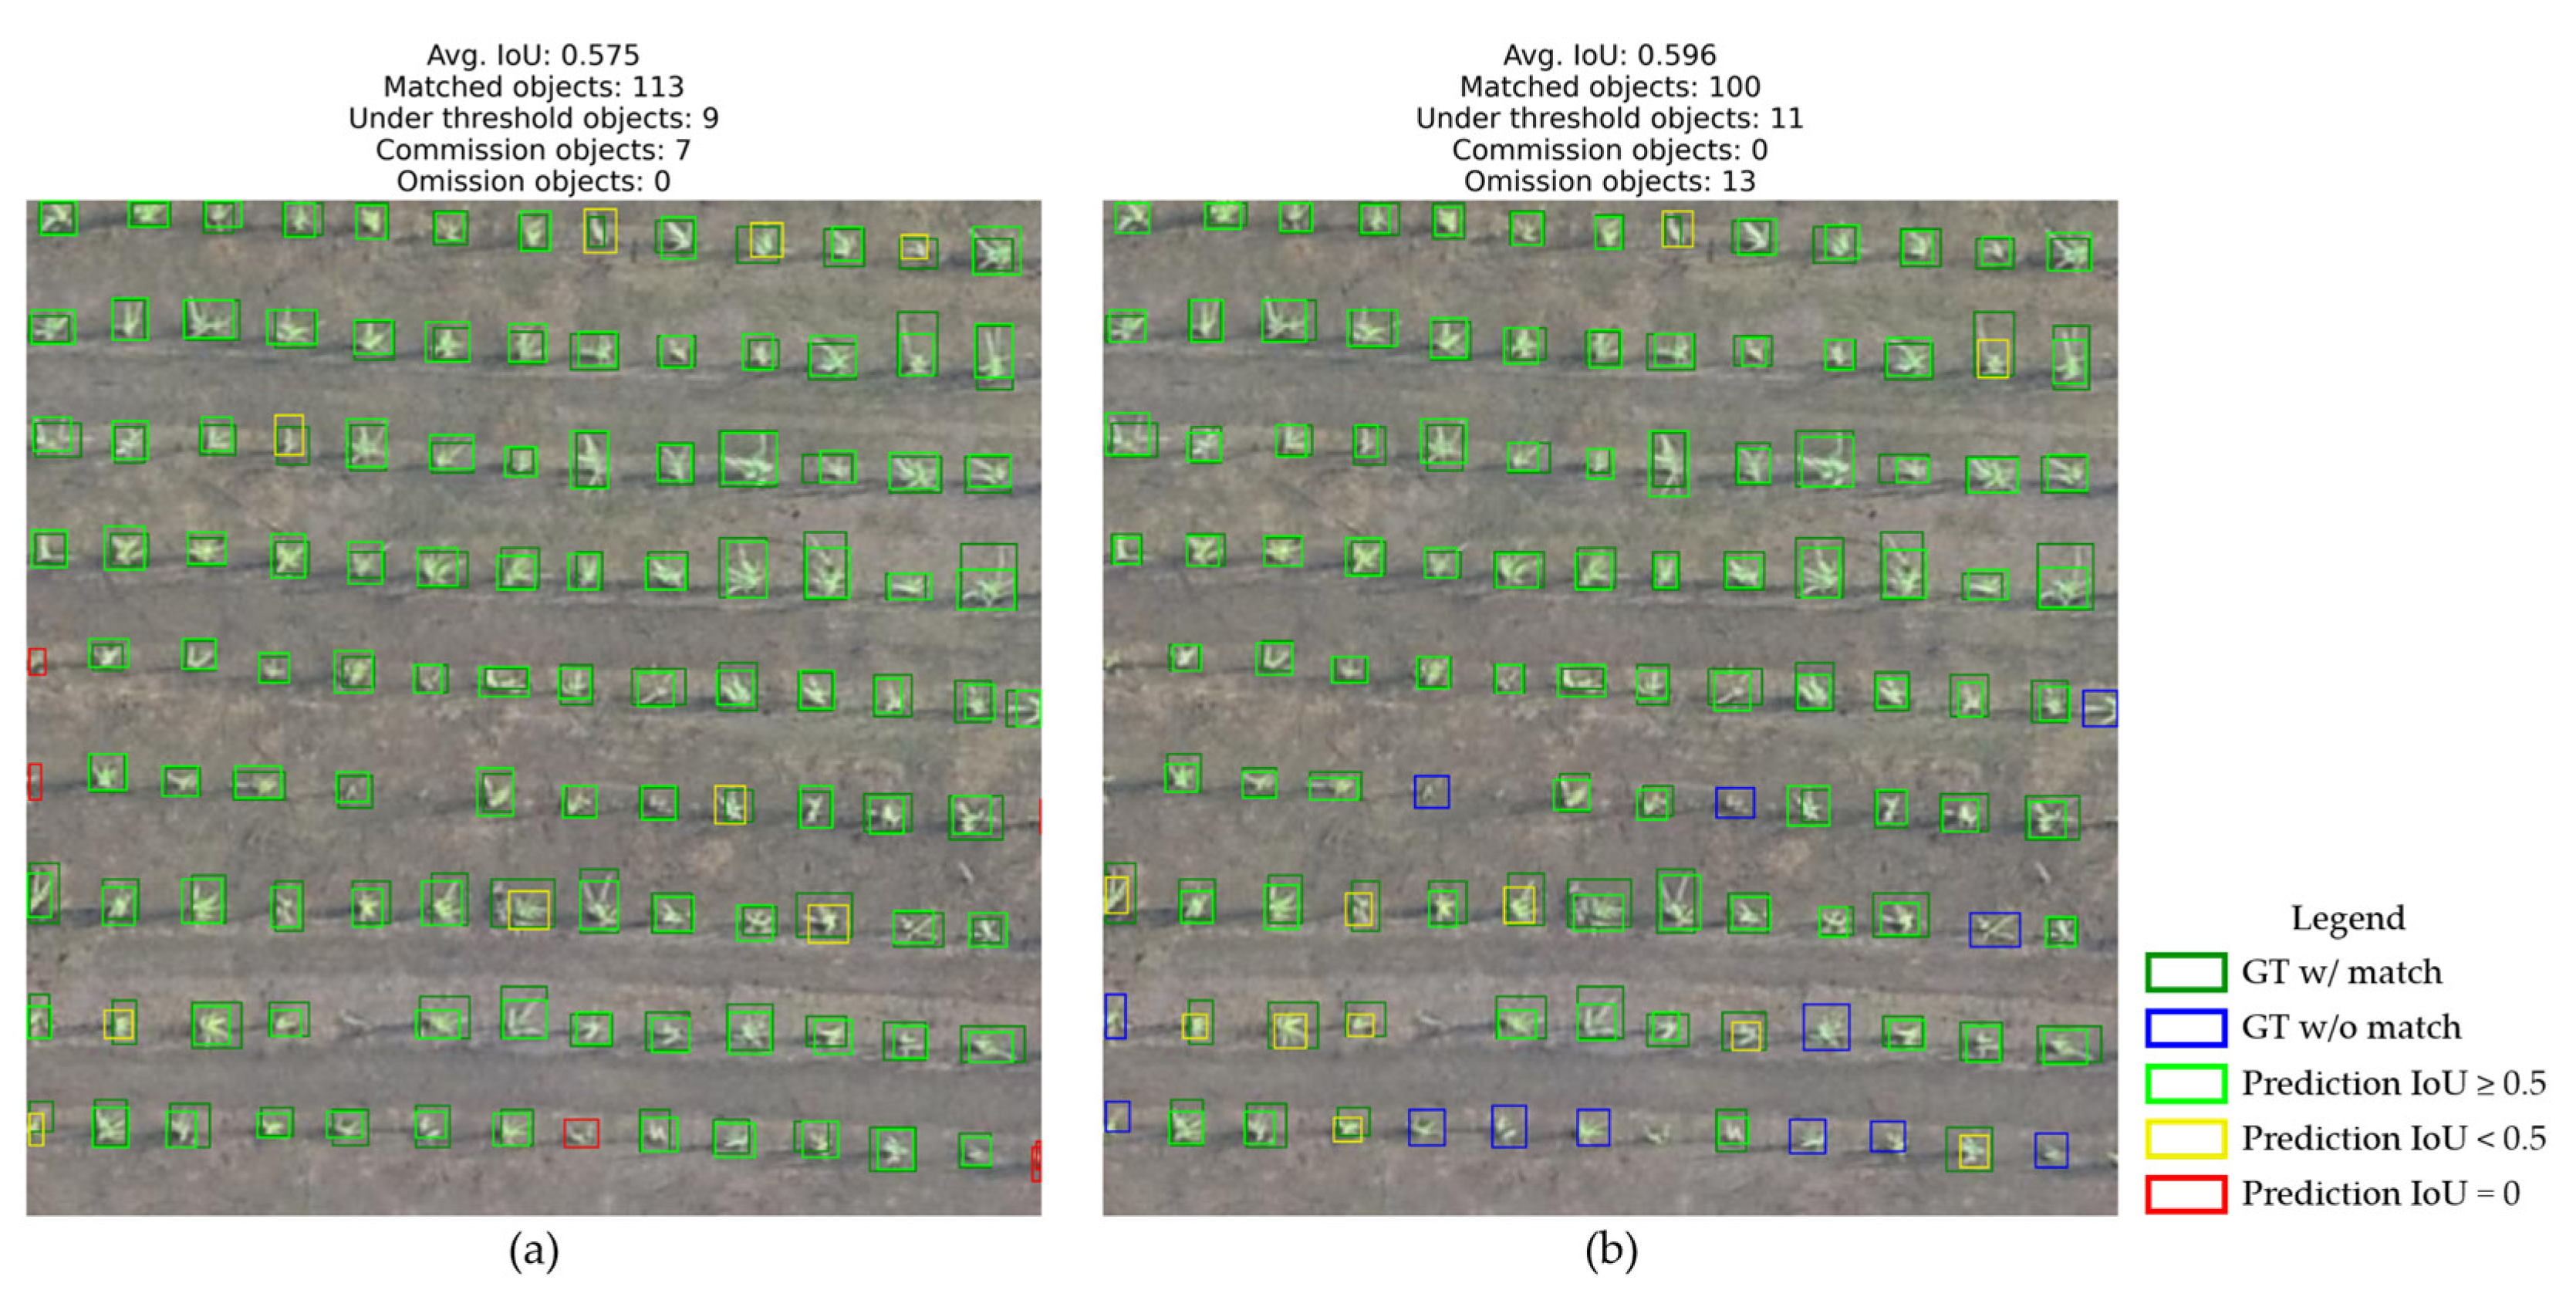
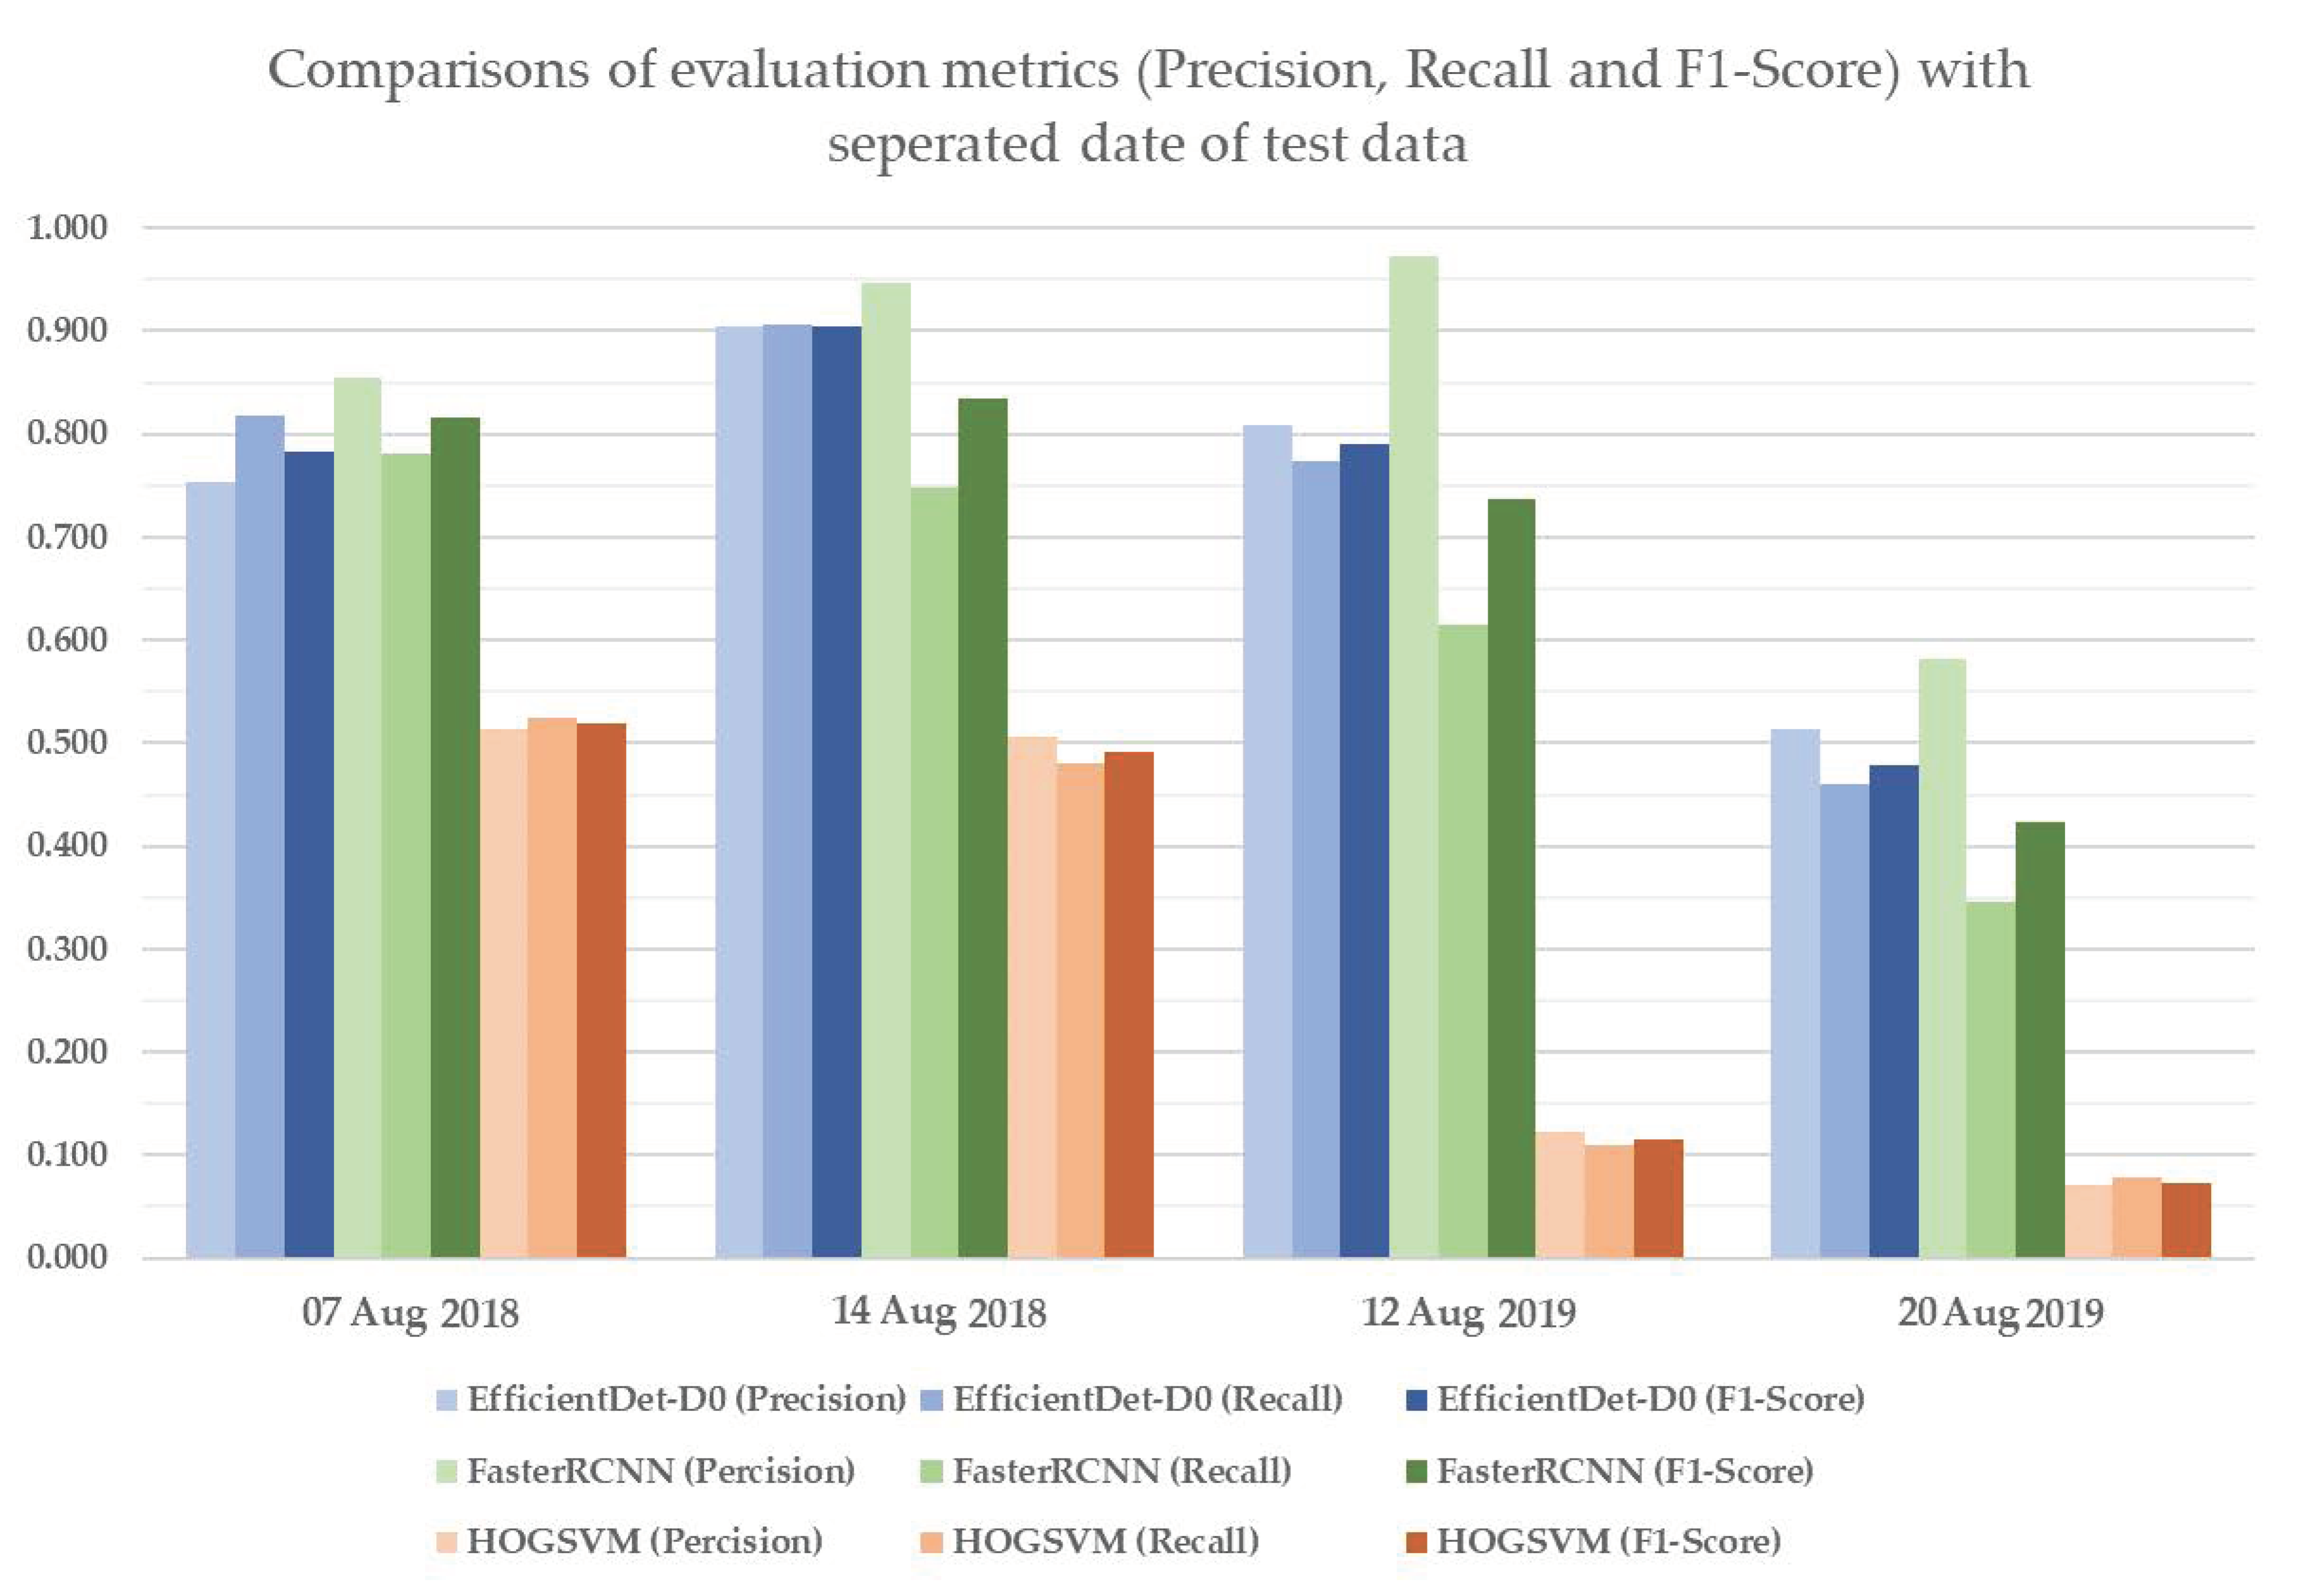
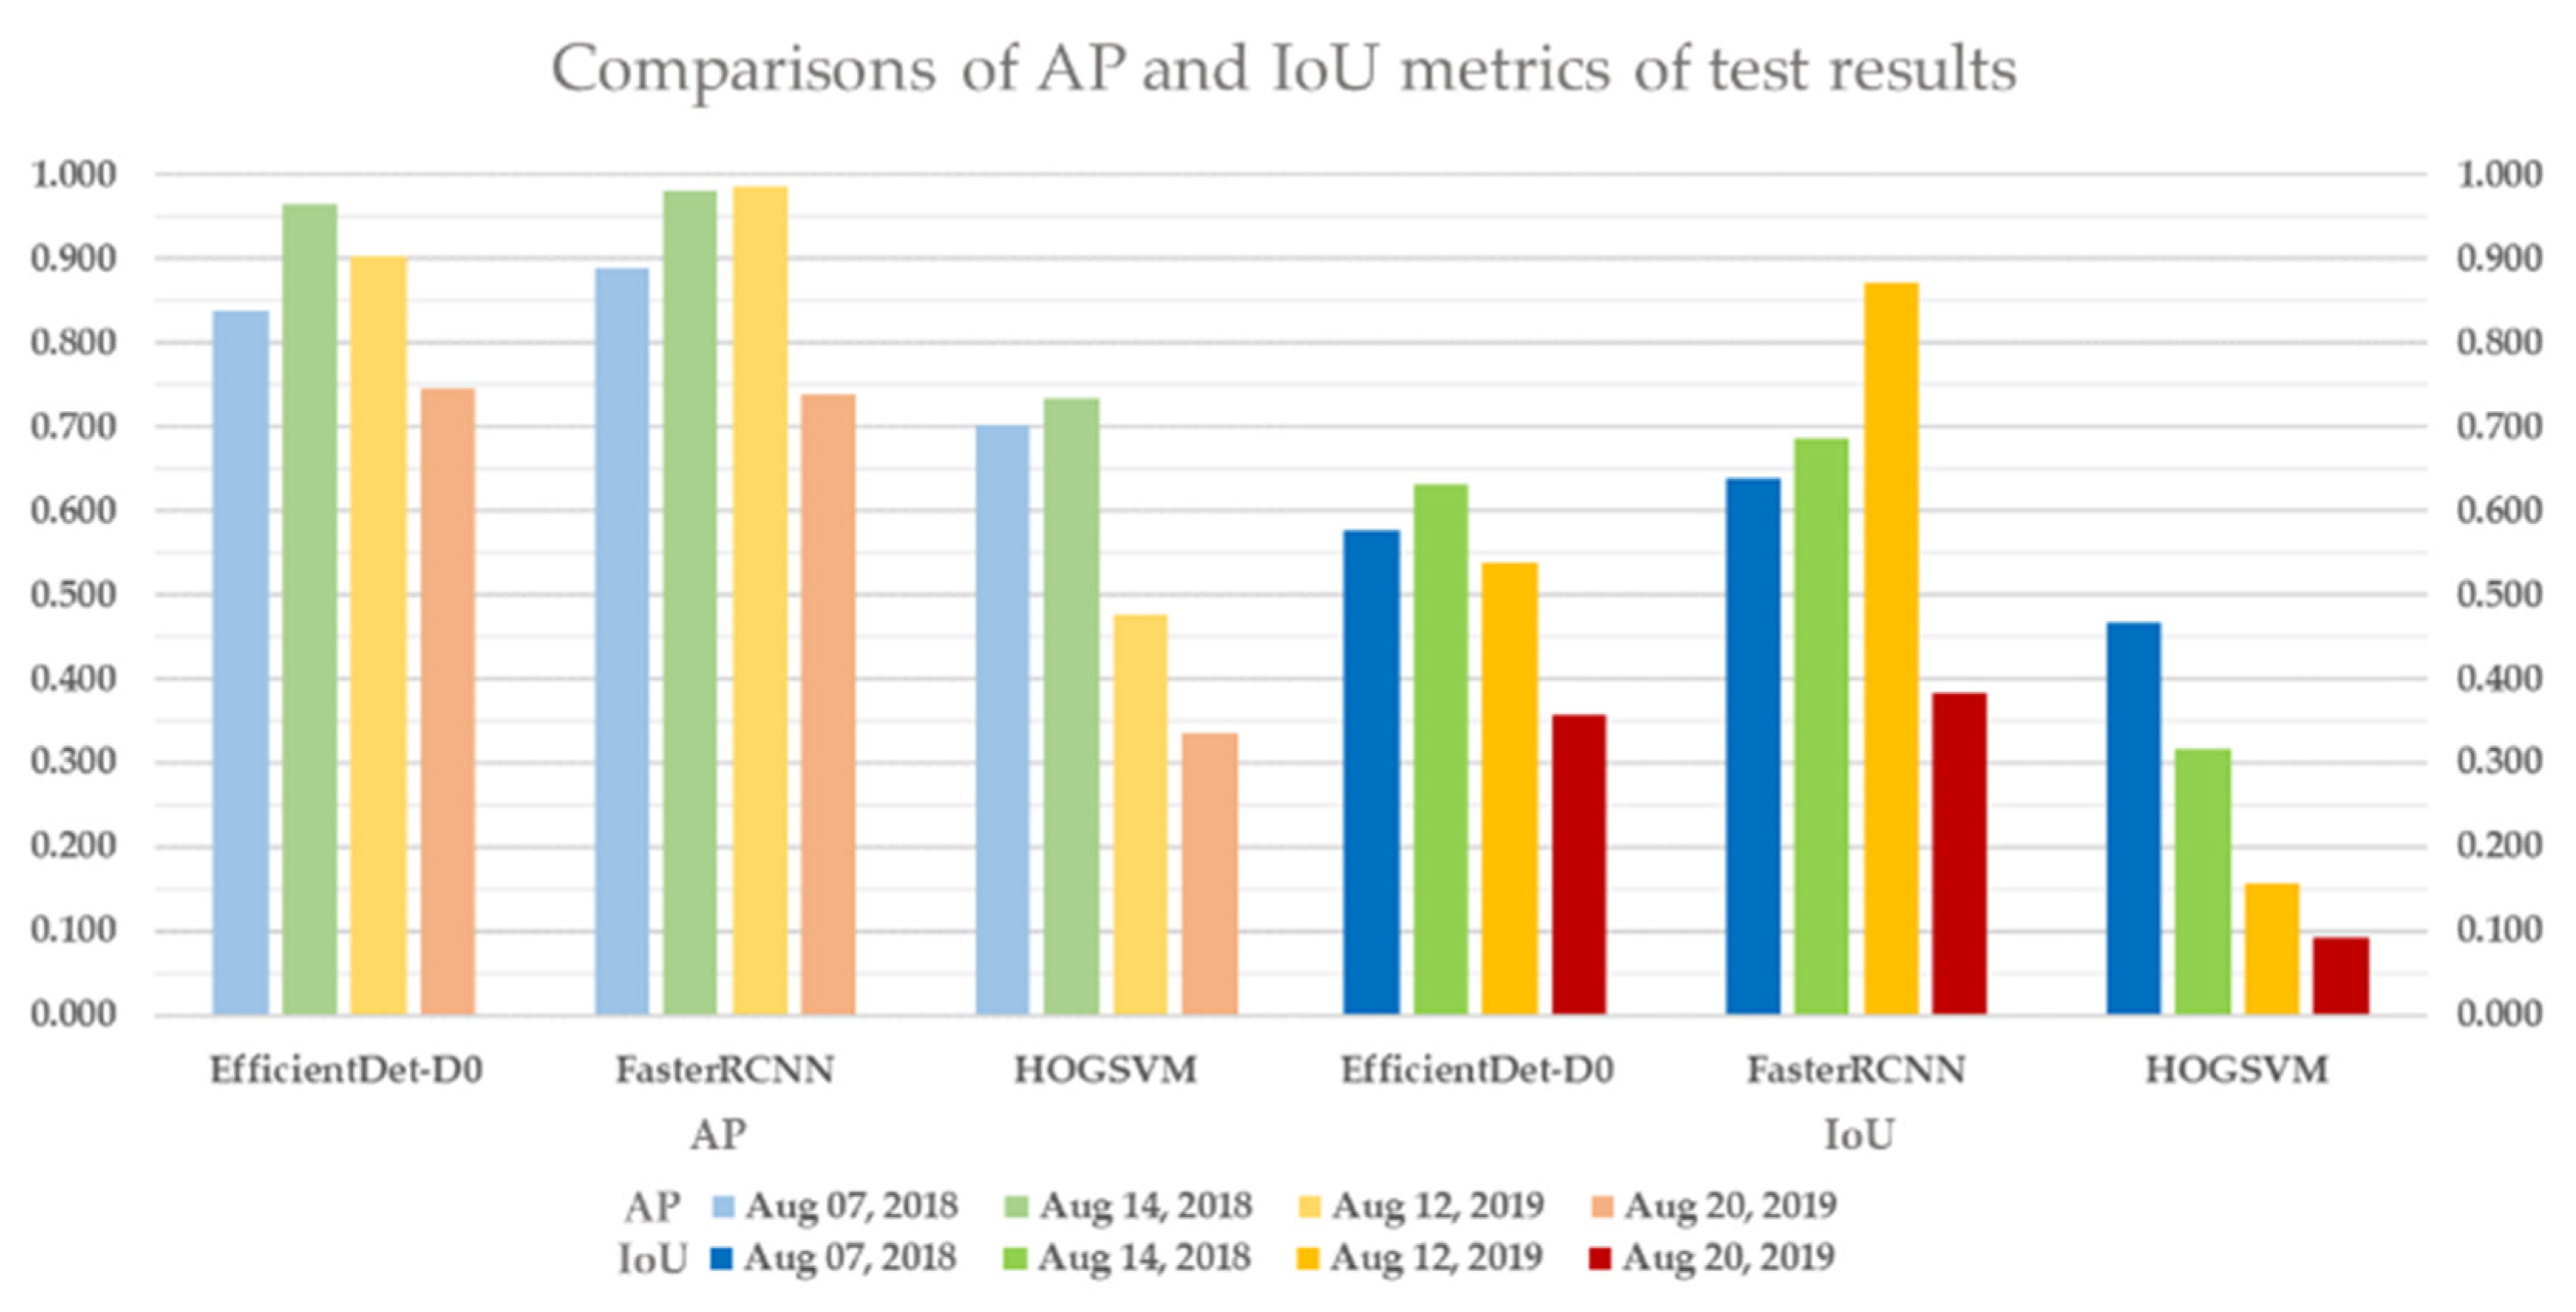
To verify model applicability with various imaging conditions, HOG-SVM, EfficientDet and Faster R-CNN were applied to the rest of the images and three additional datasets acquired on different dates for model testing. The test results of HOG-SVM, EfficientDet and Faster R-CNN to detect rice seedlings showed that Faster R-CNN has the best detection performance, with mAP of 0.888, 0.981 and 0.986 and mIoU of 0.637, 0.686 and 0.871 on the first three test datasets. Further, EfficientDet had promising results, with mAP of 0.837, 0.965 and 0.903 and mIoU of 0.575, 0.631 and 0.537 on the first three test datasets, and it had the fastest computation speed at nearly 30 fps. Moreover, the two CNN-based models had acceptable detection results, with 0.744 mAP and 0.357 mIoU (EfficientDet) and 0.739 mAP and 0.382 mIoU (Faster RCNN) on the fourth dataset, even though huge variances exist between test datasets and training datasets. EfficientDet especially showed the highest robustness to minimize the impact of image variance. Overall, rice seedlings can be well-detected using both CNN-based models with real-time computation performance. In contrast, HOG-SVM gave a merely adequate result with long computation time.
Further study will focus on detecting rice seedlings with more variety in imaging conditions, such as illumination, tone, color temperature, blur and noise. The models can be retrained using these additional images to adapt to more image changes. Further, optimizing model parameters to reduce computational time and increase prediction accuracy is needed to enable models to be deployed in environments with tight resources.


 ,
, 


