Technical Note

Absolute Frequency Readout of Cavity against Atomic Reference

Centre for Gravitational Astrophysics (CGA), Research School of Physics, The Australian National University, Canberra, ACT 2601, Australia
*
Author to whom correspondence should be addressed.
Remote Sens. 2022, 14(11), 2689; https://doi.org/10.3390/rs14112689
Submission received: 2 May 2022 / Revised: 24 May 2022 / Accepted: 25 May 2022 / Published: 3 June 2022

Abstract

:
Future space-based geodesy missions such as the Mass Change Mission and the Next Generation Gravity Mission are expected to rely on laser ranging as their primary instrument. Short-term laser frequency stability has previously been achieved on the GRACE Follow On mission by stabilizing the lasers to an optical cavity. The development of a technique to provide long-term laser frequency stability is expected to be required. We have previously demonstrated a technique to track long-term frequency changes by using measurements of the optical cavity’s free spectral range. In this paper, we calibrate this technique to absolute frequency by using an atomic reference. We have also validated an approach for on-ground calibration to allow the absolute frequency to be determined whilst in orbit.

1. Introduction

The Gravity Recovery and Climate Experiment (GRACE) missions use inter-satellite interferometry to track changes in the Earth’s local gravity, showing seasonal variations as well as larger patterns of change over time. The monthly gravity maps produced by the GRACE missions have been critical for understanding large-scale mass transport processes, principally the movement of water [1]. The GRACE Follow On (GRACE-FO) mission, launched in 2018, included a Laser Ranging Instrument (LRI) as a technological demonstration. Operating with higher precision and lower noise, LRI was able to perform two-orders-of-magnitude better than the equivalent Microwave Instrument (MWI) [2].
Planning is underway for future GRACE-like missions, including NASA’s Mass Change Mission (MCM) [3] and the Next Generation Gravity Mission [4]. These next generation missions are expected to rely on laser interferometry as their primary instrument. The technology roadmap for the Mass Change Mission [3] identified that laser only missions will require a new technique to readout the LRI Scale Correction or “Scale Factor”: a measure of the fractional change in absolute laser frequency about a nominal reference point. The Scale Factor is currently derived by comparing the LRI range measurement to the primary MWI measurement [5]. Corrections for long-term laser frequency drift are then made after the fact in the recorded data; knowledge of the long-term laser frequency calibrates the ranging readout and allows for the subtraction of large static signals over time. In the absence of a MWI, a new space qualified laser frequency readout instrument is essential. The final mission requirement for absolute knowledge of the laser frequency has not yet been decided but is expected to demand fractional sensitivity of the order of 10 ppb ( 10 8 ) or better [3,6].
We have previously demonstrated a technique for measuring laser absolute frequency changes using a dual frequency modulation technique [7], which was first developed at NASA/JPL [3] and based on an extension of a proposal by Devoe and Brewer [8]. Although alternative methods of absolute frequency readout exist—including wavemeters, atomic transitions and frequency comb devices—such approaches face challenges in flight qualification due to the need for additional space hardened hardware components, extra weight and power requirements, and increased control system complexity. The LRI Technology Roadmap [3] considered three techniques (dual frequency modulation, atomic transitions and a frequency comb device). Both the atomic transition and the use of a frequency comb would require significant changes to the existing flight heritage GRACE-FO LRI design. Furthermore, atomic references such as iodine provide worse laser frequency stabilisation than optical cavities at higher frequencies in the science band due to limited signal-to-noise ratios, meaning if an atomic reference was desirable, the LRI would have to carry two frequency references [3]. The dual frequency modulation technique we have demonstrated allows for an absolute frequency readout leveraged off existing flight-qualified (NASA TRL9) optical and signal processing hardware requiring minimal changes to units with flight heritage.
This paper presents the first verification of the proposed technique against an absolute frequency reference, and it documents the relationship to the cavity mode number. Here, we compare the FSR readout technique against two common absolute frequency readout methods: a commercial wavemeter instrument (10 s of MHz accuracy) and a saturation spectroscopy locked laser (iodine hyperfine transition, ∼kHz accuracy). Together, these measurements allow us to span a wide frequency range and precisely compare the scale factor readout method against an accurate frequency reference point: an important step toward standalone operation.
This paper presents three key findings. First, the stability of the readout technique over a 42 h period demonstrated sufficient stability to meet expected GRACE-FO requirements. Second, we verify that the technique tracks cavity absolute length changes, with a temperature step, while referenced to independent absolute frequency readout methods. Third, we verify the linear spacing of the optical cavity longitudinal modes of a flight-like resonant cavity [9] and estimate the mode number using the wavemeter over a 36 GHz bandwidth: validating the assumption of equal mode spacing in the laser’s typical locking range to address concerns about systematic bias induced by the choice of laser locking resonance. Together, these measurements validate performance against known standards, verifying that frequency division, using the mode structure of an optical cavity, is promising for space laser ranging mission requirements.
The paper is set out as follows: in Section 2, we introduce the experimental methods used, providing an outline of the experimental apparatus and method used for probing and locking a laser to an iodine hyper-fine transition; Section 3 presents the results showing a spectrum of the R56(32)-0 iodine transition and the identification of the a10 hyperfine line for comparison. The performance is presented with reference to the two alternative absolute frequency readouts, and results are presented for linearity of cavity mode spacing. Finally, in Section 4, we discuss the results and implications for integration into space-based laser ranging missions.

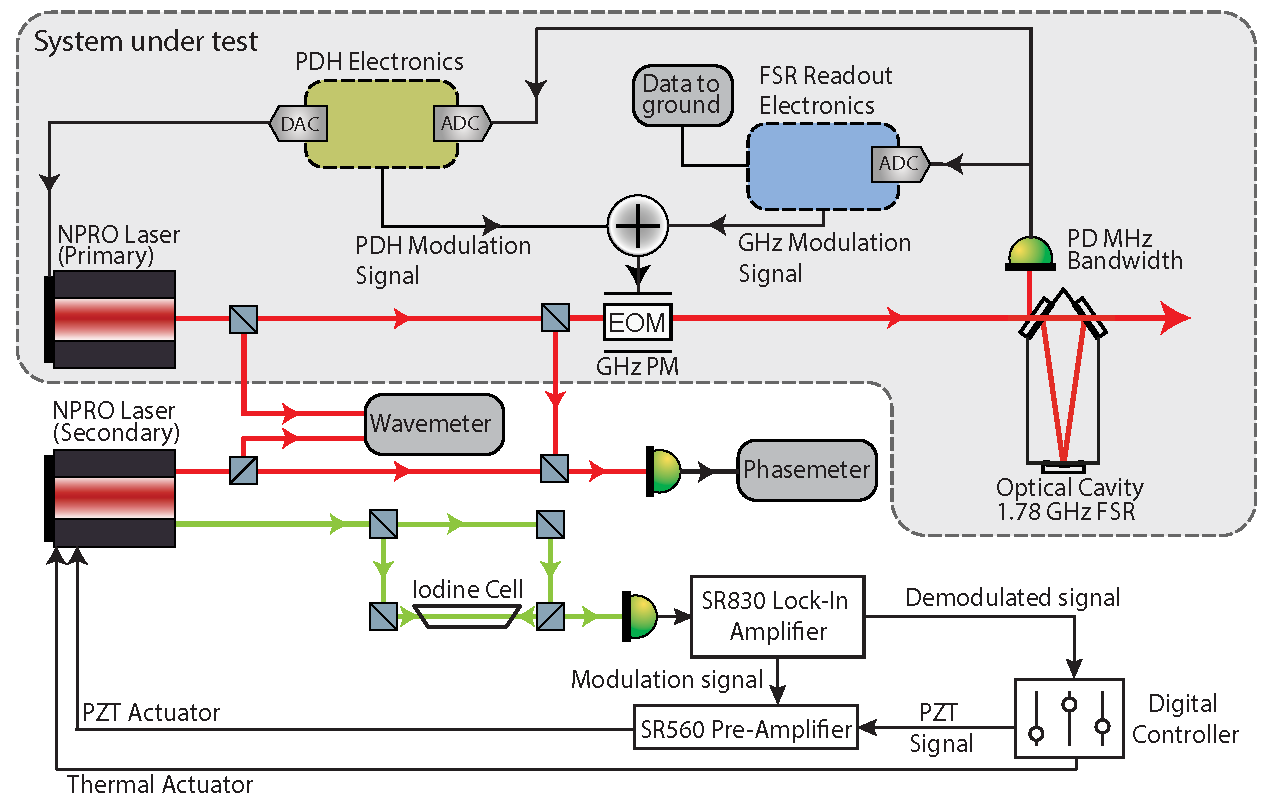
2. Materials and Methods

The experimental setup is shown in Figure 1. Here, the three methods of laser absolute frequency readout are implemented: the double modulation “FSR Readout” technique, a wavemeter (Bristol Instruments 671A), and a heterodyne beat note readout against a second laser locked to spectroscopic line. The primary laser (the upper laser in the schematic) is locked to a resonance of the reference laser cavity using the Pound–Drever–Hall technique (i.e., RF sideband locking) [10]. The reference cavity here is made from all Ultra Low Expansion (ULE) glass and is temperature stabilised. The cavity’s principle parameters are outlined in Table 1 and is expected to have an expansion coefficient of less than 10 ppb/K. Details of the open loop readout of cavity mode spacing using the double modulation technique are provided in [7]. A digital lock-in amplifier (Liquid Instruments Moku:Lab) is used to demodulate and log the FSR readout. The GHz modulation frequency is adjusted to center the readout on the zero-crossing of the error signal. The recorded error signal from that measurement is proportional to changes in the free spectral range of the cavity and, with calibration, is scaled to units of absolute frequency of the incident laser light on the cavity. This laser tracks a resonance of the optical cavity, and two tap offs of the same laser light are used to compare against the wavemeter and the heterodyne beatnote.
To extract a precise measure of absolute laser frequency drift, we compare the primary laser against a laser locked to a spectroscopic line. The lasers used for the GRACE-FO missions have a wavelength of 1064 nm. An established frequency reference for lasers at this wavelength is diatomic iodine (i.e., I 2 gas), having previously been used in sub-orbital experiments [11] and being developed as a frequency reference for space applications [12]. Diatomic iodine has strong absorption lines centered around 532 nm, which can be directly accessed by frequency doubling a 1064 nm laser using Second Harmonic Generation (SHG). In this experiment, we used an Innolight Prometheus Nd:YAG NPRO laser with an in-built single pass frequency doubling crystal that is capable of providing both 1064 nm and 532 nm light. Light from the 532 nm port of the laser was used as the source for Doppler-free saturation spectroscopy of iodine [13].
To access the hyperfine transitions in the presence of Doppler broadening, we implement a double-pass method in which a strong pumping beam was used to saturate optical transitions. A counter-propagating weak probe beam detects an anti-absorption line at the zero velocity of the gas. A 10 cm long quartz iodine cell was used that was not temperature controlled. At 25 °C, the cell pressure was specified as >0.1–1.2 Torr, which is sufficient for our needs. Frequency modulation side bands were added by applying a dither directly to the PZT actuator of the laser. These were cloned directly onto the 532 nm light by the doubling process and were used as reference side bands in interrogating iodine’s R56(32)-0 optical transitions around 563,260 GHz (281,630 GHz/1064 nm). A third harmonic modulation and demodulation scheme was implemented to generate a Doppler-free error signal with a zero-crossing that could be locked, allowing a relatively low direct dither frequency (30 kHz) that can be applied to the laser PZT [14,15]. This modulation approach does not significantly impact on the stability of the laser as the mean laser frequency deviation from the modulation is zero. Additionally, the modulation consists of a single Fourier line that is filtered out or removed in low-pass filtering using digital techniques, and the system performs tracking at a much lower bandwidth than the modulation frequency (tens of Hertz compared with kilohertz). Furthermore, this modulation is applied only to the iodine reference laser and not the FSR laser. An optical frequency uncertainty of 43.4 kHz is listed in Table 2 for the iodine system derived from the data shown in Table 3, and any stability effects of this modulation are included in this number.
Modulation and demodulation were achieved using a Stanford Research Systems SR830 Lock in Amplifier. The 30 kHz modulation signal generated by the SR830 was combined with the PZT feedback control signal from a digitally implemented controller using a Stanford Research Systems SR560 Pre-Amplifier before being fed to the laser PZT actuator. The closed-loop feedback corrected the drift in the second laser, tying the laser’s fundamental 1064 nm frequency to the chosen optical transition at the doubled frequency. Light from both the primary and spectroscopic locked laser then interfered on a high bandwidth photodetector (NewFocus 1611). The evolution of the frequency offset was tracked with a digital phasemeter (Liquid Instruments Moku:Lab) and was simultaneously recorded with the FSR readout.
A simultaneous measurement was made of each laser frequency with the wave meter. A tap-off signal from each laser (at 1064 nm) was directed onto a Bristol Instruments 671A wavemeter for measurements of the absolute frequency of the laser. The wavemeter is specified as having an absolute accuracy of ± 0.2 ppm and a repeatability of ± 0.06 ppm. Measuring 1064 nm light, this provides us with an accuracy of ±≈56 MHz and a repeatability of ±≈17 MHz.
Key experimental parameters are provided in Table 1, and a table of uncertainties is provided in Table 2. The uncertainties in the iodine stabilized system include any temperature/pressure-induced variations as the cell was not actively controlled and offsets of electronic and digital components (lock-in amplifier and ADC). The limiting factors as shown in this table include the iodine system and the aging of clock frequency. In future work, clock frequency aging can be addressed by connection to a GPS reference for improved timing and stability.

3. Results

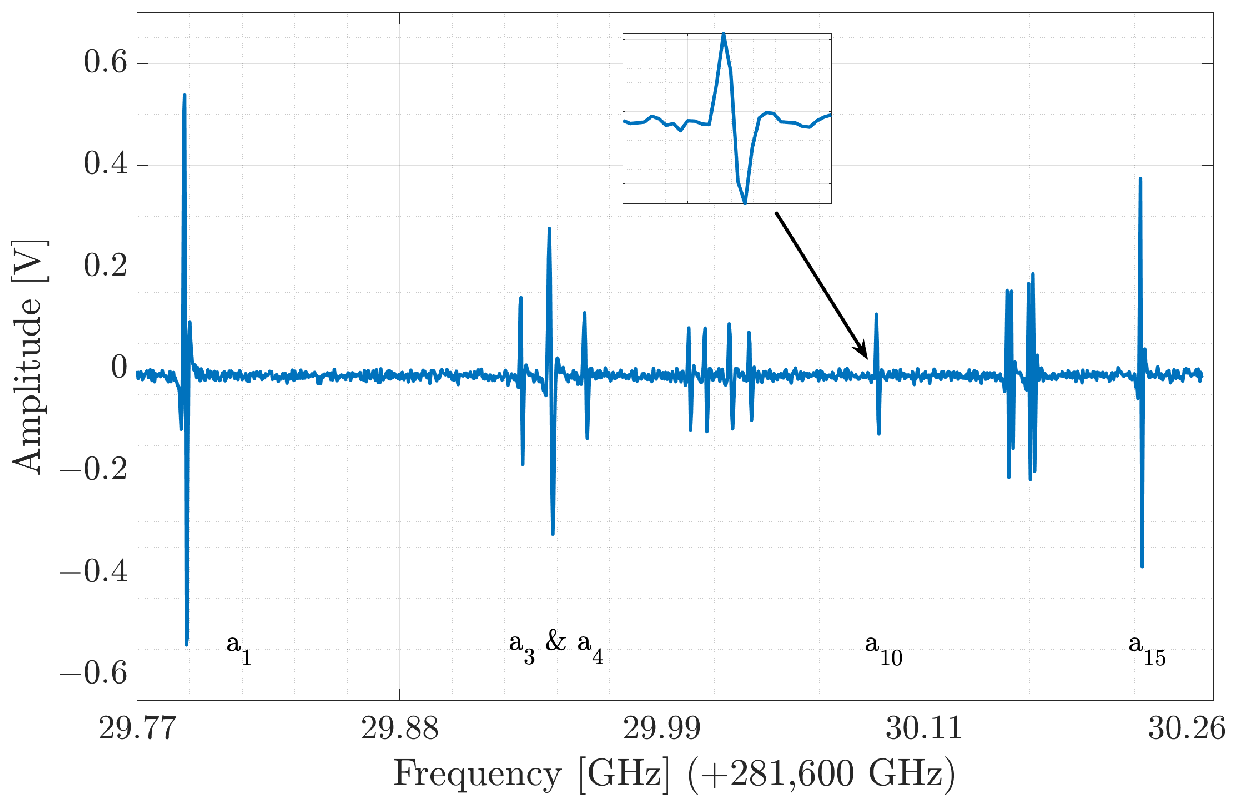
3.1. Identification of Iodine R56(32)-0 A10 Transition

A frequency sweep was conducted to characterize the broad iodine transition. By adjusting the digital thermal feedback signal, the frequency of the laser can be increased to sweep through all the hyperfine components of a transition. A comparison of the absolute frequency readout from the wavemeter with published frequency tables for iodine transitions [19] allowed the specific iodine transition to be determined, and comparisons with other published spectra [20,21] provided the identification of individual hyperfine components. The measured saturated absorption spectra of the iodine line are shown in Figure 2.
The frequency spacing between the hyperfine components of the Doppler-broadened line was then measured with both the wavemeter and phasemeter. With the primary laser stabilized using Pound–Drever–Hall locking, the second laser was locked to consecutive hyperfine components of the R56(32)-0 Doppler-broadened line, and the heterodyne beat frequency of the two lasers at 1064 nm was measured with a photodetector and digital phasemeter (Liquid Instruments Moku:Lab) and cross verified with a spectrum analyzer using a resolution bandwidth of 10 kHz. The frequency of the secondary laser was simultaneously measured with the wavemeter.
These measured hyperfine components are provided in Table 3. The mean and standard deviation of the differences between our measured values and the listed published values are −18.27 kHz and 86.8 kHz respectively, with a maximum deviation of 154 kHz at a wavelength of 532 nm. As the measurements were taken over approximately an hour, it is possible that the optical cavity providing the reference for these measurements drifted with the temperature in the lab. The cavity is temperature controlled, and so while we expect that this drift would be small, it would contribute to a reduced accuracy of the relative hyperfine frequencies.
The values measured using the wavemeter are provided in Table 4. As the absolute frequency of the a10 hyperfine transition is known [22,23,24], the absolute frequencies of the other hyperfine transitions were able to be calculated using published relative frequency values. The wavemeter data was then compared to the calculated absolute frequencies of each hyperfine transition. The mean and standard deviation of the differences between our measured values and the calculated absolute frequencies are 27.0 MHz and 2.1 MHz respectively, with a maximum deviation of 31.9 MHz.
The a10 line has good separation to adjacent lines (>100 MHz), and so it was chosen as the locking point for further measurements.

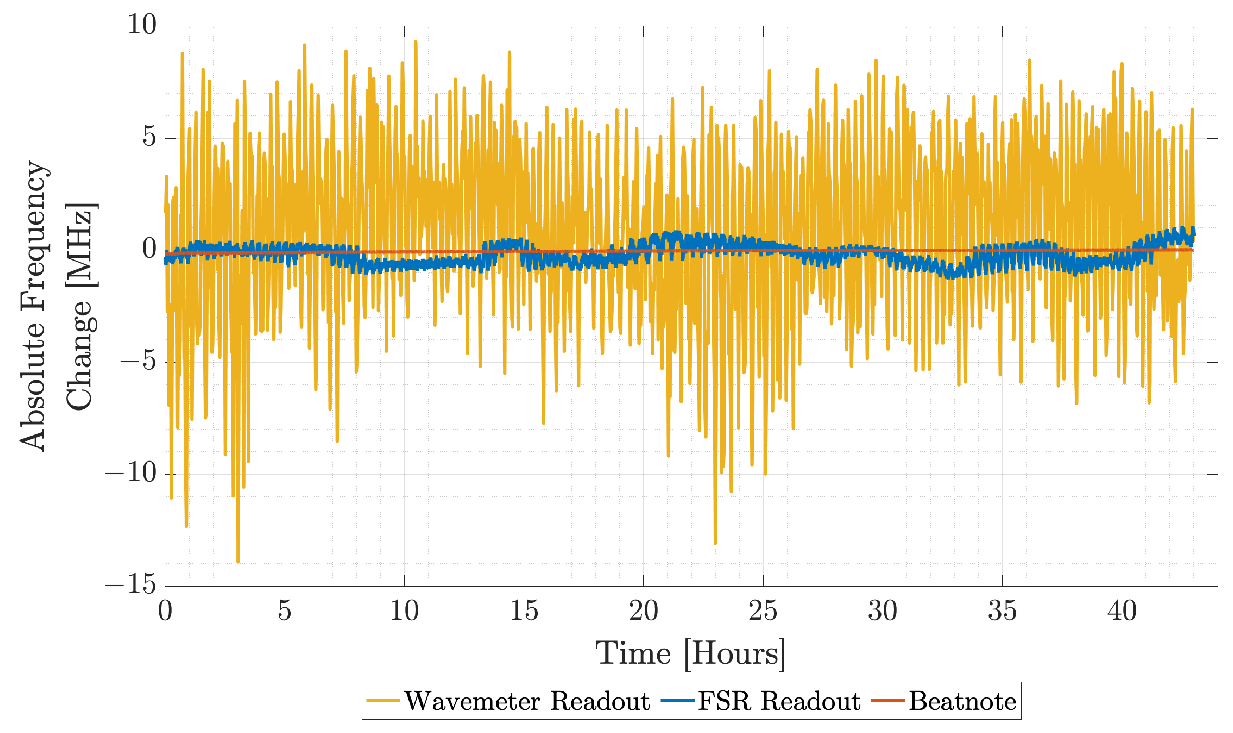
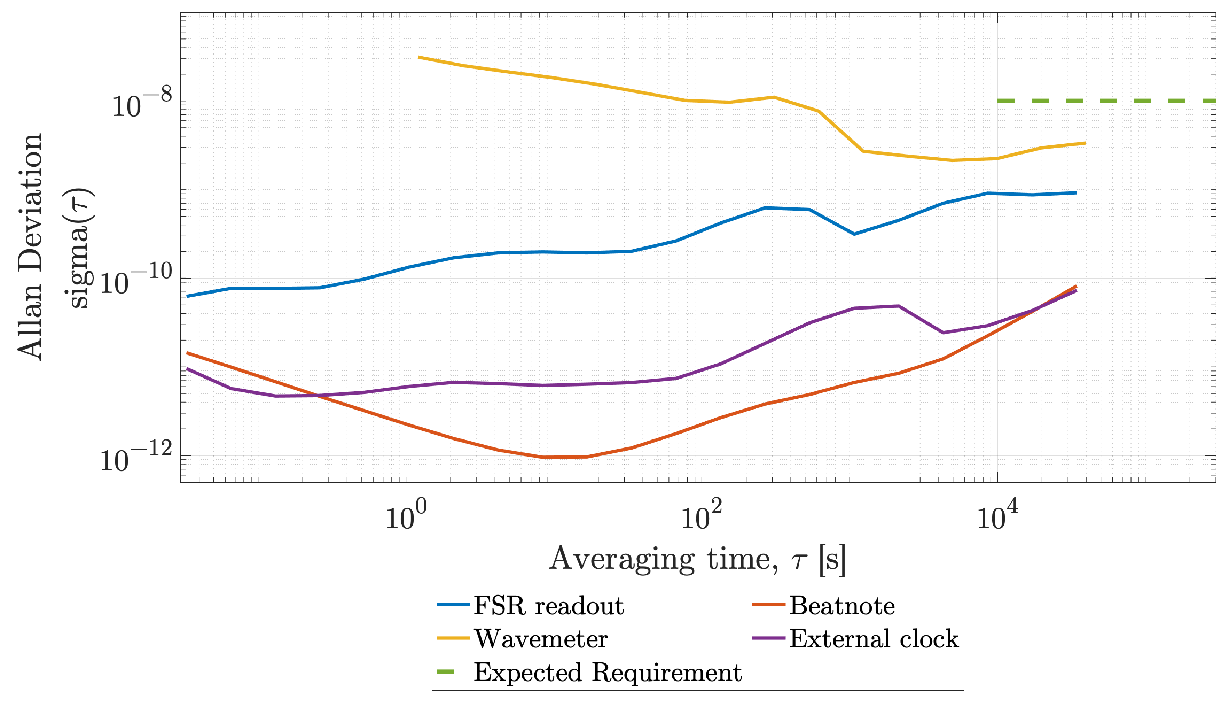
3.2. FSR Readout Results—Static

Figure 3 shows the time series data of the beat frequency between the two lasers (red trace), the FSR readout (blue trace) and the wavemeter readout (yellow trace) for the cavity-locked laser. The secondary laser was locked to the a10 R56(32)-0 hyperfine transition, and the wavemeter measured the frequency of the primary (cavity locked) laser. The absolute frequency change (peak-to-peak) of the FSR readout during this measurement was less than 2.5 MHz at a sampling rate of 0.305 Hz over 42 h, and the absolute frequency change (peak-to-peak) of the heterodyne beatnote was less than 200 kHz, also at a sampling rate of 0.305 Hz over 42 h.
A measurement over two days is indicative of longer term stability, and this supports the results of our previous ∼800 h measurement. A long-term measurement is required to confirm that there are no significant systematic effects.
The performance of the FSR readout is improved compared to our previous results [7], which were collected over an ∼800 h period with only passive thermal shielding. The data presented here were collected over a 42 h period with active cavity temperature control; thus, we would expect to see an improvement in the laser frequency stability.
Figure 4 shows the Allan Deviation of these data. The stability of the beatnote in this plot (red trace) is one-to-two orders of magnitude below FSR performance (blue trace). This is due to the differences in signal to noise ratio of these measurements. While the readout technique for cavity locking and the FSR readout have many similarities and similar noise sources, the FSR readout is measuring the cavity FSR at 1.78 GHz compared to cavity locking which is stabilising the optical frequency at 280 THz, a factor of ∼158,000 larger. The FSR readout is dominated by the same typical limiting factors associated with PDH systems such as residual amplitude modulation, but with poorer signal to noise.
The beatnote trace is most stable at approximately 10 s averaging time, rolling up at both lower and higher frequencies. The bandwidth of the iodine stabilisation system is about 10 Hz; thus, at shorter averaging times, the stability trends toward that of a free-running laser. At longer averaging times, the noise in the system is dominated by cavity noise, which is white in nature and, therefore, continuously integrated, resulting in increased noise at lower frequencies.

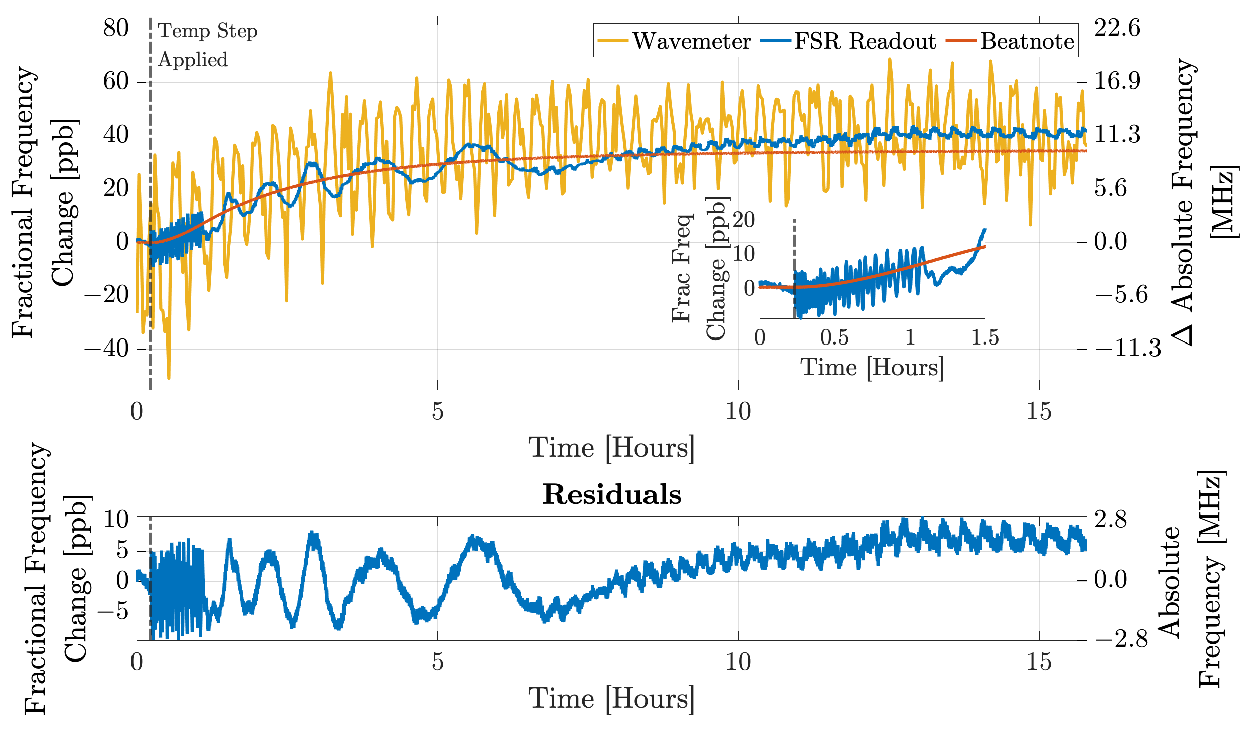
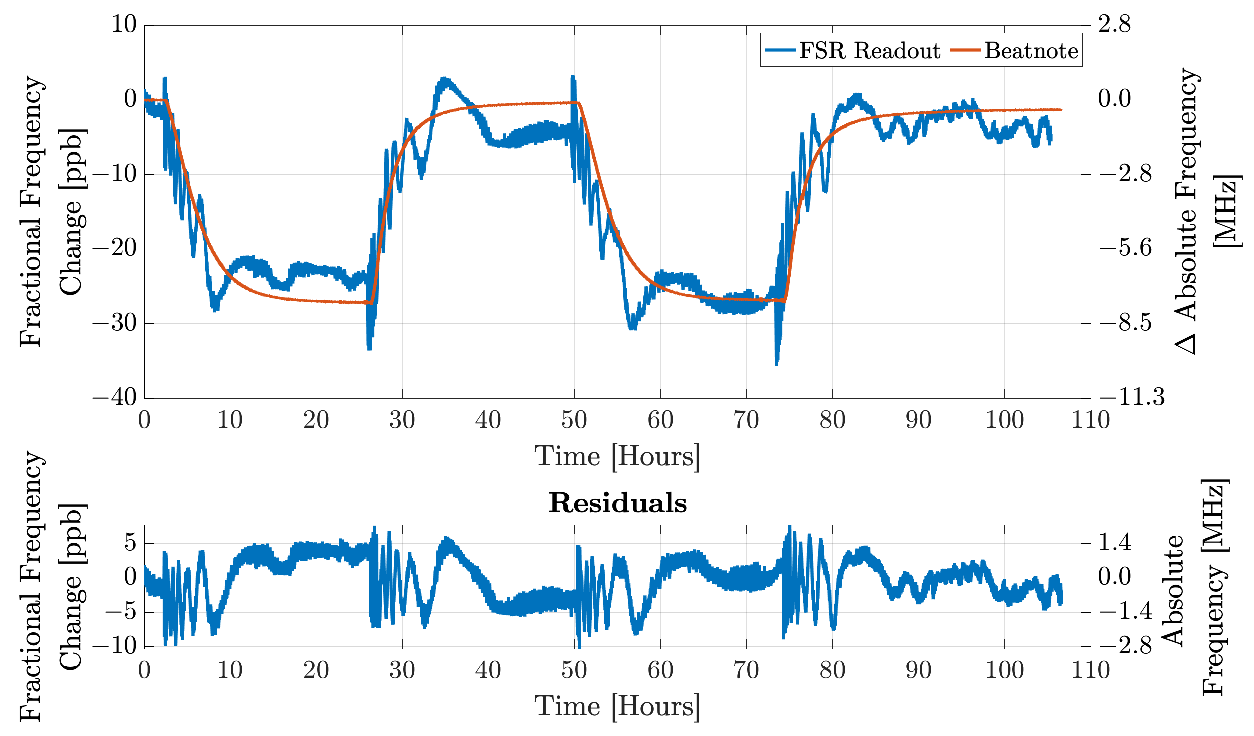
3.3. FSR Readout Results—With Temperature Step

With one laser locked to the optical cavity using PDH and the FSR readout measuring changes in the cavity length, inducing a change in the cavity length induces a distinct change in the FSR readout. The cavity is temperature controlled, so applying a change in the temperature set point changes the length. This change can be seen in both the beatnote and the FSR readout. This measurement has previously been demonstrated in [7] where both lasers were locked to separate optical cavities. The measurement shown here has the second laser locked to the a10 R56(32)-0 hyperfine transition, which should remove any effects from a second cavity drifting.
A 5 °C temperature step was applied to the cavity temperature controller, driving the cavity from 22 °C to 17 °C. Figure 5 shows the agreement of the FSR readout technique compared to both the beat with the iodine-stabilized laser and wavemeter. It is clear that there is a sinusoidal variation of changing frequency in the FSR readout, which is indicative of an etalon. This apparent cyclic or etalon behavior in the FSR readout appears to be the main accuracy limitation to this measurement. Interestingly, the behavior is seen to rapidly evolve with sudden changes to the temperature of the vacuum-can, rather than the space cavity, which takes a longer period of time to stabilize. The authors are investigating the source of this etalon in an effort to remove it in future work.
To understand if repeated temperature cycling would impact the readout, the temperature of the optical cavity was stepped back and forth by 5 °C every 24 h for four days. Figure 6 shows that the FSR readout is able to track the beatnote closely over repeated temperature steps, with the residual between the two measurements averaging −0.3 ppb or 85.7 kHz in absolute frequency.

3.4. Mode Number Determination

The absolute laser frequency is related to the FSR of the cavity by the following equation:
ν F S R = n m o d e + Δ
where n m o d e is the integer longitudinal mode number, and Δ is the sum of all offsets present.
As previously discussed [7], the GRACE-FO LRI link was successfully acquired and locked within the expected tolerances for laser frequency uncertainty. The scan range was 320 MHz, less than the uncertainty of a free spectral range [25]. If we can expect emission and resonant mode frequencies to be within these tolerances, the mode number can be measured before launch and subsequently used to determine the absolute laser frequency during operation.
Reliance on the ground-calibrated mode number will require an investigation of any potential offsets in order to ensure that the absolute frequency is able to be accurately determined.
We expect there to be some phase delay from path length, mirror coatings [26] and Gouy phase [27]. This should be able to be calibrated and subtracted. It is crucial, however, that there are no offsets that vary with some other factor, such as with time, temperature, or wavelength, as such an offset would complicate or prevent the ability to use a one-time on-ground calibration.
Here, we investigate whether there is any wavelength dependent offset in the FSR Readout and, therefore, in the calculation of the mode number. The cavity locked laser was locked to 21 consecutive cavity resonances and the frequency of the laser measured at each resonance using the wavemeter. The FSR was also measured by adjusting the GHz frequency signal generator to center the GHz sidebands on the error signal zero crossing point and, therefore, the cavity resonance. The mode number was then calculated as n m o d e + Δ = ν / F S R . The measured laser frequency (at 1064 nm), the measured FSR frequency and the calculated ratio of these two values for each resonance are provided in Table 5. The data presented in Table 5 show that the measured FSR does not vary between cavity modes and is, therefore, not wavelength dependent over the typical working band.
The mode number calculated from the ratio of the frequency and the FSR is not an integer but rather has some offset. As this mode number offset is stable between cavity modes, we believe that it is likely due to the phase delays previously mentioned, which could be calibrated and subtracted when determining the mode number.
The Gouy Phase is one such phase delay, and we can calculate its contribution as follows [27]:
n m o d e ( G o u y ) = 1 π ψ = 1 π arcos g 1 g 2
where g i = 1 L / R i and L is the length of the cavity, and R i is the radius of curvature of the mirror. The cavity used in this experiment is plano-concave, with L = 84.13 mm and R 2 = 1 m, providing a round-trip Gouy Phase delay ( ψ ) of 0.2943 radians. The Gouy Phase contribution to the fractional part of the mode number is ψ / p i = 0.0937 , with the remaining fractional offset of the mode number contributed by other offsets or phase delays.
The Gouy Phase is dependent on both the cavity length and the radius of curvature of the mirrors; thus, we would expect that any changes to these parameters would change the phase delay. Further understanding the relationships between cavity length, mirror radius of curvature, FSR and absolute frequency, as well as other effects such as coating phase delay, is required to ensure that a one-time on-ground calibration can be relied upon.
To verify the wavemeter measurements, a beatnote measurement was also taken at two of the resonances. The photodetector used in the experiment has a 1 GHz bandwidth, so it did not allow measurements at other resonances. The spectroscopic laser was locked to the a10 line, which is known to within ±5 kHz [22,23,24]. With a beatnote measurement of 784.36 MHz, the primary laser frequency is calculated as 281,630.111757 GHz + 784.36 MHz = 281,630.8961 GHz. The second beatnote was measured as 997.418 MHz. The primary laser frequency is therefore calculated as 281,630.111757 GHz − 997.418 MHz = 281,629.1143 GHz. These calculated optical frequencies are within 10.5 MHz of the frequencies measured with the wavemeter.
Our experimental uncertainties have previously been listed in Table 2. The two measurements used to calculate the mode number used the wavemeter and the FSR Readout signal generator. Of these instruments, the wavemeter has the greatest listed uncertainty at 56 MHz ( 0.2 × 10 6 ), which could change the calculated mode number by 0.03. The wavemeter data presented in Table 4 had a mean difference between the measured and literature values of 27 MHz, and the wavemeter values in Table 5 were within 10.5 MHz of the frequencies verified with beatnote and atomic transitions. Both of these values are less than half of the specified 56 MHz uncertainty; thus, we expect that the uncertainty contributions to the calculated mode number from the wavemeter would be 0.15 or less.
The FSR readout signal generator has a specified clock frequency offset of less than 1 × 10 8 . This uncertainty would only change the calculated mode number by 0.0015.
To investigate whether there is a time-dependent offset, we also measured the FSR ten times over a sixteen week period, and each measurement was taken at least one week apart. The mean FSR value measured was 1.781813194 GHz, with a standard deviation of 6.6 Hz. This is consistent with the data presented in Table 5. Further measurements will be required to identify whether this evolves over longer time scales or with temperature.

4. Discussion

Three key measurements have been presented: the performance of the FSR readout technique was measured over a 42 h period and found to be sufficient for expected next mission requirements; we have verified that the technique tracks cavity absolute length changes using two independent absolute frequency readout methods; we have verified the linear spacing of our cavity longitudinal modes to validate the assumption of equal mode spacing in the typical locking range of the laser.
The two day measurement showed that the FSR readout’s performance was meeting expected mission requirements. The wavemeter, whilst having poorer accuracy, confirmed that the absolute laser frequency remained stable over the measurement. Furthermore, the beatnote also confirmed the stability of the laser frequency as referenced to a second laser stabilized relative to an atomic transition. This measurement does not cover the complete frequency span of the expected mission requirement, and as such, longer measurements will be required to confirm that the FSR readout remains below the requirement at the frequencies of interest. A longer measurement will also assist in verifying robustness and any long-term systematics of this readout scheme.
A demonstration that the FSR readout can track cavity absolute length changes was previously shown by applying a temperature step [7]. Here, we have verified this by confirming that the FSR measurement of length changes with two independent absolute frequency readout methods. The temperature step showed some apparent etalon behavior (Figure 5). A preliminary investigation has suggested that the etalon is likely a result of temperature-induced changes to the vacuum-can rather than the space cavity itself. Further investigation is required to confirm this and to remove the effect in future work.
Finally, we have investigated the linear spacing of the optical cavity longitudinal modes to address concerns about any systematic bias or offset. Our results show that the change in the fractional offset is small for different absolute frequencies. Further investigation will be required to determine whether the offset evolves over time or with different temperatures.
The uncertainties presented in Table 2 show that our measurements are currently limited by iodine stability and the aging of the FSR readout signal generator clock. These uncertainties can be reduced by the active temperature control of the iodine cell, characterizing and reducing electronic and digital offsets and tying our signal generator clock to a GPS reference. With an improved iodine stabilization system, the mode number should also be able to be determined with greater accuracy. Prototype development and testing of an integratable FSR unit is currently underway.

5. Conclusions

Previous work has presented a concept and performance of a readout technique to provide long-term laser frequency stability for future laser-only geodesy missions. This paper has extended that work and verified the FSR readout technique against an absolute frequency reference provided by an atomic reference, and it validated an approach for on-ground calibration to allow absolute frequency determinations whilst in orbit. Further work is required to confirm the size and impact of temperature or time-dependent offsets in the determination of absolute frequency.

Author Contributions

Conceptualization, E.R.R., K.M., A.R.W. and A.J.S.; methodology, E.R.R., K.M., A.R.W. and A.J.S.; formal analysis, E.R.R.; investigation, E.R.R.; resources, K.M.; writing—original draft preparation, E.R.R.; writing—review and editing, K.M., A.R.W. and A.J.S.; visualization, E.R.R.; supervision, K.M. and A.R.W.; project administration, K.M.; funding acquisition, K.M. All authors have read and agreed to the published version of the manuscript.

Funding

This research was supported by the Australian Research Council Centre of Excellence for Gravitational Wave Discovery (OzGrav, CE170100004), the Australian Research Council Centre of Excellence for Engineered Quantum Systems (EQUS, CE170100009) and an Australian Government Research Training Program (RTP) Scholarship. Part of this work was funded through the Australian Government’s Moon to Mars Initiative.

Data Availability Statement

The data presented in this study are available upon request from the corresponding author. The data are not publicly available due to the custom calibrations required based on the specific experimental setup and conditions.

Acknowledgments

The authors would like to express their gratitude to the ANU Applied Metrology Labs for the loan of equipment and to Bob Spero and the LRI team at NASA JPL for their insight and comments.

Conflicts of Interest

The authors declare no conflict of interest.

References

  1. Tapley, B.D.; Bettadpur, S.; Ries, J.C.; Thompson, P.F.; Watkins, M.M. GRACE Measurements of Mass Variability in the Earth System. Science 2004, 305, 503–505. [Google Scholar] [CrossRef] [PubMed] [Green Version]
  2. Ghobadi-Far, K.; Han, S.C.; McCullough, C.M.; Wiese, D.N.; Yuan, D.N.; Landerer, F.W.; Sauber, J.; Watkins, M.M. GRACE Follow-On Laser Ranging Interferometer Measurements Uniquely Distinguish Short-Wavelength Gravitational Perturbations. Geophys. Res. Lett. 2020, 47, e2020GL089445. [Google Scholar] [CrossRef]
  3. Conklin, J.; Yu, T.; Guzman, F.; Klipstein, B.; Lee, J.; Leitch, J.; Numata, K.; Petroy, S.; Spero, R.E.; Ware, B.; et al. LRI Technology Summary and Roadmap for Mass Change Mission; Technical Report; NASA Jet Propulsion Laboratory: Pasadena, CA, USA, May 2020. [Google Scholar]
  4. Nicklaus, K.; Cesare, S.; Massotti, L.; Bonino, L.; Mottini, S.; Pisani, M.; Silvestrin, P. Laser Metrology Concept Consolidation for NGGM. CEAS Space J. 2020, 12, 313–330. [Google Scholar] [CrossRef]
  5. Wen, H.Y.; Kruizinga, G.; Paik, M.; Landerer, F.; Bertiger, W.; Sakumura, C.; Bandikova, T.; Mccullough, C. Gravity Recovery and Climate Experiment Follow-on (GRACE-FO) Level-1 Data Product User Handbook; Technical Report JPL D-56935 (URS270772); NASA Jet Propulsion Laboratory California Institute of Technology: Pasadena, CA, USA, 2019. [Google Scholar]
  6. NASA. ORCLS—Optical-Radio Coherence for Laser Stability; NASA: Pasadena, CA, USA. Available online: https://techport.nasa.gov/view/94040 (accessed on 8 June 2021).
  7. Rees, E.R.; Wade, A.R.; Sutton, A.J.; Spero, R.E.; Shaddock, D.A.; Mckenzie, K. Absolute Frequency Readout Derived from ULE Cavity for next Generation Geodesy Missions. Opt. Express 2021, 29, 26014–26027. [Google Scholar] [CrossRef] [PubMed]
  8. DeVoe, R.G.; Brewer, R.G. Laser-frequency division and stabilization. Phys. Rev. A 1984, 30, 2827–2829. [Google Scholar] [CrossRef]
  9. Thompson, R.; Folkner, W.M.; de Vine, G.; Klipstein, W.; McKenzie, K.; Spero, R.E.; Yu, N.; Stephens, M.; Leitch, J.; Pierce, R.; et al. A Flight-like Optical Reference Cavity for GRACE Follow-on Laser Frequency Stabilization. In Proceedings of the 2011 Joint Conference of the IEEE International Frequency Control and the European Frequency and Time Forum (FCS) Proceedings, San Francisco, CA, USA, 2–5 May 2011; pp. 1–3. [Google Scholar] [CrossRef]
  10. Drever, R.W.P.; Hall, J.L.; Kowalski, F.V.; Hough, J.; Ford, G.M.; Munley, A.J.; Ward, H. Laser Phase and Frequency Stabilization Using an Optical Resonator. Appl. Phys. B 1983, 31, 97–105. [Google Scholar] [CrossRef]
  11. Döringshoff, K.; Gutsch, F.B.; Schkolnik, V.; Kürbis, C.; Oswald, M.; Pröbster, B.; Kovalchuk, E.V.; Bawamia, A.; Smol, R.; Schuldt, T.; et al. Iodine Frequency Reference on a Sounding Rocket. Phys. Rev. Appl. 2019, 11, 054068. [Google Scholar] [CrossRef]
  12. Weise, D.; Schuldt, T.; Döringshoff, K.; Reggentin, M.; Kovalchuk, E.V.; Gohlke, M.; Johann, U.; Peters, A.; Braxmaier, C. A High-Performance Iodine-Based Frequency Reference for Space Applications. In Proceedings of the International Conference on Space Optics—ICSO 2012, SPIE, Ajaccio, Corse, France, 9–12 October 2017; Volume 10564, p. 71. [Google Scholar] [CrossRef] [Green Version]
  13. Schawlow, A.L. Spectroscopy in a New Light. Rev. Mod. Phys. 1982, 54, 697–707. [Google Scholar] [CrossRef]
  14. Wallard, A.J. Frequency Stabilization of the Helium-Neon Laser by Saturated Absorption in Iodine Vapour. J. Phys. E Sci. Instrum. 1972, 5, 926–930. [Google Scholar] [CrossRef]
  15. Hanes, G.R.; Baird, K.M.; DeRemigis, J. Stability, Reproducibility, and Absolute Wavelength of a 633-Nm He–Ne Laser Stabilized to an Iodine Hyperfine Component. Appl. Opt. 1973, 12, 1600. [Google Scholar] [CrossRef] [PubMed]
  16. Bristol Instruments. 671 Series-Laser Wavelength Meter Specifications. Available online: https://www.bristol-inst.com//wp-content/uploads/2020/01/Bristol-671-Series-Laser-Wavelength-Meter-Specifications.pdf (accessed on 31 January 2022).
  17. Liquid Instruments. MokuLab-Specifications. Available online: https://download.liquidinstruments.com/documentation/specs/hardware/mokulab/MokuLab-Specifications.pdf (accessed on 31 January 2022).
  18. Rohde & Schwarz. R&S®SMA100B RF and Microwave Signal Generator Specification; Rohde & Schwarz: Munich, Germany, 2021; Available online: https://scdn.rohde-schwarz.com/ur/pws/dl_downloads/dl_common_library/dl_brochures_and_datasheets/pdf_1/SMA100B_dat-sw_en_5215-1018-22_v0600.pdf (accessed on 31 January 2022).
  19. Gerstenkorn, S.; Luc, P. Atlas Du Spectre d’absorption de La Molecule d’iode 14800-20000 Cm-1; Editions du Centre National de la Recherche Scientifique (CNRS): Paris, France, 1978. [Google Scholar]
  20. Arie, A.; Byer, R.L. Laser Heterodyne Spectroscopy of 127I2 Hyperfine Structure near 532 Nm. J. Opt. Soc. Am. B 1993, 10, 1990. [Google Scholar] [CrossRef]
  21. Fang, H.M.; Wang, S.C.; Liu, L.C.; Cheng, W.Y.; Wu, K.Y.; Shy, J.T. Measurement of Hyperfine Splitting of Molecular Iodine at 532 Nm by Double-Passed Acousto Optic Modulator Frequency Shifter. Jpn. J. Appl. Phys. 2006, 45, 2776. [Google Scholar] [CrossRef] [Green Version]
  22. Nevsky, A.Y.; Holzwarth, R.; Reichert, J.; Udem, T.; Hänsch, T.W.; von Zanthier, J.; Walther, H.; Schnatz, H.; Riehle, F.; Pokasov, P.V.; et al. Frequency Comparison and Absolute Frequency Measurement of I2-stabilized Lasers at 532 Nm. Opt. Commun. 2001, 192, 263–272. [Google Scholar] [CrossRef]
  23. Zhang, Y.; Ishikawa, J.; Hong, F.L. Accurate Frequency Atlas of Molecular Iodine near 532 Nm Measured by an Optical Frequency Comb Generator. Opt. Commun. 2001, 200, 209–215. [Google Scholar] [CrossRef]
  24. Diddams, S.A.; Jones, D.J.; Ye, J.; Cundiff, S.T.; Hall, J.L.; Ranka, J.K.; Windeler, R.S.; Holzwarth, R.; Udem, T.; Hänsch, T.W. Direct Link between Microwave and Optical Frequencies with a 300 THz Femtosecond Laser Comb. Phys. Rev. Lett. 2000, 84, 5102–5105. [Google Scholar] [CrossRef] [PubMed] [Green Version]
  25. Abich, K.; Abramovici, A.; Amparan, B.; Baatzsch, A.; Okihiro, B.B.; Barr, D.C.; Bize, M.P.; Bogan, C.; Braxmaier, C.; Burke, M.J.; et al. In-Orbit Performance of the GRACE Follow-on Laser Ranging Interferometer. Phys. Rev. Lett. 2019, 123, 031101. [Google Scholar] [CrossRef] [PubMed] [Green Version]
  26. Durand, M.; Wang, Y.; Lawall, J. Accurate Gouy Phase Measurement in an Astigmatic Optical Cavity. Appl. Phys. B 2012, 108, 749–753. [Google Scholar] [CrossRef]
  27. Kogelnik, H.; Li, T. Laser Beams and Resonators. Appl. Opt. 1966, 5, 1550–1567. [Google Scholar] [CrossRef] [PubMed]
Figure 1. Experimental setup. An NPRO 1064 nm laser is stabilized relative to an optical cavity using the Pound Drever Hall technique. Additional GHz sidebands are added to enable readout of the optical cavity mode spacing using the FSR readout technique. The phase modulated GHz sidebands are generated using a Rohde & Schwarz SMA100B signal generator. A second NPRO 1064 nm laser is frequency doubled, and the 532 nm light is stabilized to an iodine cell using the Third Harmonic technique. An SR830 Lock in Amplifier provides the modulation and demodulation to achieve this, with anSR560 pre-amplifier used in the signal chain to combine control signals to the PZT actuator from the Lock in Amplifier and the digital controller. A tap-off of each 1064 nm laser is directed onto a Bristol Instruments 671A wavemeter, and a separate tap-off interfered to generate a heterodyne beatnote and is tracked with a digital phasemeter (Liquid Instruments Moku:Lab).
Remotesensing 14 02689 g001
Figure 2. Frequency sweep through R56(32)-0 transition showing the third harmonic demodulated signal (modulation and demodulation provided by an SR830 Lock in Amplifier) in volts through the iodine cell. An approximately linear ramp was applied, and the x-axis has been calibrated using data from the wavemeter. Lines a1, a3 and a4, a10 and a15 are labeled. The insert highlights the a10 hyperfine component, which was used for further measurements.
Remotesensing 14 02689 g002
Figure 3. Time series data of the FSR measurement over 42 h. The absolute frequency change (peak-to-peak) of the FSR readout does not exceed 2.5 MHz, and the absolute frequency change (peak-to-peak) of the beatnote does not exceed 200 kHz, both at a sampling rate of 0.305 Hz over 42 h.
Remotesensing 14 02689 g003
Figure 4. Allan Deviation of the FSR measurement over 42 h. The FSR readout is performing at an order of magnitude below the expected next mission requirement. The beatnote readout is one-to-two orders of magnitude below the FSR readout. The performance of our FSR Readout signal generator’s Oven Controlled Oscillator (OCXO) as previously presented in [7] is also provided, adapted with permission, © The Optical Society. Note there was an error in the calculation of the Allan Deviation for this figure in the previous paper where a second square root was applied, and this has been corrected for the clock line taken from that paper and presented in this figure.
Remotesensing 14 02689 g004
Figure 5. A 5 °C temperature step applied to the cavity temperature controller. There is a corresponding change in the beatnote readout, the wavemeter readout and the FSR readout. The FSR readout shows a 40 ppb change, which is equivalent to 8 ppb/°C of the fractional length change of the cavity. The lower plot shows the residuals, which are calculated by subtracting the beatnote measurement from the FSR readout.
Remotesensing 14 02689 g005
Figure 6. A 5 °C temperature step applied to the cavity temperature controller every 24 h. The lower plot shows the residuals, which are calculated by subtracting the beatnote measurement from the FSR readout.
Remotesensing 14 02689 g006
Table 1. List of Experimental Parameters.
ParameterExperimental Value
Cavity FSR ( ν F S R )1.781813197 GHz 1
Cavity Finesse9400
PDH sidebands4.5131 MHz
PDH sideband modulation depth0.04 rad
FSR carrier tone1.781813197 GHz 1
FSR carrier modulation depth0.75 rad
Scale factor modulation tone2.1 MHz
Scale factor modulation depth0.3 rad
1 Experimental results show that the FSR value has a standard deviation of 7.05 Hz. Refer to Section 3.4 for results.
Table 2. List of experimental uncertainties. Wavemeter, phasemeter, and FSR Readout signal generator clock uncertainties are taken from the respective instrument specification sheets. The iodine system uncertainty is measured from our system and taken from Table 3. These uncertainties are not additive. The limiting uncertainties for the wavemeter measurements include wavemeter accuracy, the beatnote measurements are limited by the phasemeter precision and iodine stability and the FSR readout measurement is limited by iodine stability and the aging of the FSR readout signal generator clock.
ComponentUncertaintyEquivalent Uncertainty
(Optical Frequency—
281,630 GHz) (Hz)
Wavemeter—absolute accuracy [16] ± 0.2 × 10 6 56 × 10 6
Wavemeter—repeatability [16] ± 0.06 × 10 6 17 × 10 6
Phasemeter—frequency set point
precision ( 3.55 × 10 6 ) [17]
-negligible
FSR Readout Signal Generator—
clock frequency offset [18]
< 1 × 10 8 2.82 × 10 6
FSR Readout Signal Generator—clock
frequency ageing (specified) [18]
< 1 × 10 9
per day
< 282 × 10 3 per day
FSR Readout Signal Generator—clock
frequency ageing (measured)
< 0.25 × 10 9
per day
< 71 × 10 3 per day
FSR Readout Signal Generator—
frequency synthesis resolution [18]
8.38 × 10 6
Stabilized Iodine
system (measured)
0.043 × 10 6
Table 3. Measured hyperfine components of R56(32)-0. Measured values were taken using a phasemeter tracking the beatnote of the 1064 nm light. These have been converted to 532 nm, and they are listed as offset to the a1 line. A comparison with values from two published papers has also been included for reference. The values presented as Literature 1 have been reprinted with permission from [20] © The Optical Society, and the values presented as Literature 2 have been adapted from [21]. The standard deviation of the differences between our measured values and the listed published values is 86.8 kHz at a wavelength of 532 nm.
Hyperfine
Transition
Measured
(MHz)
Literature 1
(MHz) [20]
Difference
(kHz)
Literature 2
(MHz) [21]
Difference
(kHz)
a100000
a2259.70259.698−2.33259.7010.67
a3/a4 1285.87285.862−6.02285.88112.98
a5311.37311.360−13.24311.364−9.24
a6401.49401.480−14.85401.490−4.85
a7417.14416.998−137.03417.009−126.03
a8439.58439.62645.97439.62645.97
a9455.36455.341−18.25455.354−5.25
a10571.59571.548−45.67571.556−37.67
a11698.28698.045−233.12698.066−212.12
a12702.82702.774−44.75702.779−39.75
a13725.90726.031126.31726.059154.31
a14732.18732.21130.27732.23857.27
a15857.97857.960−11.81857.98513.19
st. dev. 86.12 87.47
1 Unresolved lines.
Table 4. Measured hyperfine components of R56(32)-0. Measured values were taken using the wavemeter. As the frequency of the a10 line is known to be within 5 kHz [22,23,24], absolute values for each hyperfine transition have been calculated using the absolute frequency of the a10 line and the relative frequencies between lines as provided in two published papers. The values presented as Literature 1 have been adapted with permission from [20] © The Optical Society, and the values presented as Literature 2 have been adapted from [21]. The standard deviation of the differences between our measured values and the calculated absolute frequencies is 2.1 MHz.
Hyperfine
Transition
Measured
(GHz)
Literature 1
(GHz) [20]
Difference
(MHz)
Literature 2
(GHz) [21]
Difference
(MHz)
a1281,629.7965281,629.826029.5281,629.826029.5
a2281,629.9313281,629.955824.6281,629.955824.6
a3/a4 1281,629.9436281,629.968925.4281,629.968925.4
a5281,629.9533281,629.981728.4281,629.981728.4
a6281,630.0015281,630.026725.2281,630.026725.2
a7281,630.0060281,630.034528.5281,630.034528.5
a8281,630.0201281,630.045825.7281,630.045825.7
a9281,630.0279281,630.053725.7281,630.053725.7
a10281,630.0848281,630.111826.9281,630.111826.9
a11281,630.1487281,630.175026.3281,630.175026.3
a12281,630.1454281,630.177431.9281,630.177431.9
a13281,630.1610281,630.189028.0281,630.189028.0
a14281,630.1675281,630.192124.6281,630.192124.6
a15281,630.2279281,630.255027.0281,630.255027.0
st. dev. 2.1 2.1
1 Unresolved lines.
Table 5. Determination of Mode Number. The mean FSR value is 1.781813197 GHz, the standard deviation of the measured FSR is 7.05 Hz and the maximum difference is 24.0 Hz.
Measured Laser
Frequency ( ν )
(Wavemeter) (GHz)
Measured FSR
(FSR Readout Signal
Generator) (GHz)
ν / FSR
281,602.3781.781813193158,042.593
281,604.1621.781813192158,043.595
281,605.9391.781813204158,044.591
281,607.7301.781813198158,045.597
281,609.5101.781813188158,046.597
281,611.2891.781813188158,047.595
281,613.0721.781813200158,048.595
281,614.8531.781813204158,049.594
281,616.6321.781813201158,050.592
281,618.4171.781813197158,051.595
281,620.1971.781813200158,052.593
281,621.9821.781813205158,053.595
281,623.7631.781813209158,054.594
281,625.5441.781813208158,055.594
281,627.2631.781813196158,056.559
281,629.1081.781813188158,057.595
281,630.8901.781813199158,058.595
281,632.6711.781813203158,059.593
281,634.4561.781813190158,060.597
281,636.2391.781813185158,061.598
281,638.0211.781813193158,062.597
Publisher’s Note: MDPI stays neutral with regard to jurisdictional claims in published maps and institutional affiliations.

