Abstract
Landslide extraction is one of the most popular topics in remote sensing. Numerous techniques have been proposed to manage the landslide identification problem. However, most aim to extract landslides that have already occurred or delineate the potential landslide manually. It is greatly important to identify and delineate potential landslides automatically, which has not been investigated. In this paper, we propose an automatic identification and delineation method, i.e., object-based image analysis (OBIA) of potential landslides by integrating optical imagery with a deformation map. We applied a deformation map generated by the interferometric synthetic aperture radar (InSAR) technique, rather than the digital elevation model (DEM) for landslide segmentation. Then, we used a classification and regression tree (CART) model with the spectral, spatial, contextual and deformation characteristics for landslide classification. For accuracy assessment, we implemented the evaluation indicators of recall and precision. The proposed method is verified in both specific landslide-prone regions (Jinpingzi and Shuanglongtan landslides) and a large catchment of the Jinsha River, China. By comparing our results with the ones using purely optical imagery, the precision of the Jinpingzi landslide is improved by 14.12%, and the recall and precision of the Shuanglongtan landslide are improved by 3.1% and 3.6%, respectively, and the recall for the large catchment is improved by 9.95%. Our method can improve delineation of potential landslides significantly, which is crucial for landslide early warning and prevention.
1. Introduction
In China, geological disasters occur frequently, including those triggered by both natural and anthropogenic hazards. Earthquakes, volcanoes and glaciers belong to the former, while landslide, debris flow, collapse and land subsidence belong to the latter, among which landslide is one of the most serious disasters in the mountainous area, causing huge economic losses [1]. For example, on 11 January 2013, a landslide occurred in Zhenxiong County, Yunnan Province, with a deposit length of nearly 800 m, destroyed more than 60 houses and killed 46 people [2]. More seriously, we have little advance knowledge on such a catastrophic landslide. Therefore, it is urgent to detect and delineate landslides, which are missing in the archived inventory map. The traditional identification of landslides is mainly based on conventional field surveys and visual interpretation of aerial imagery [3,4,5], which are not only labor intensive, but quite dependent on expert knowledge [6].
With the development of remote sensing (RS) techniques, landslides can be mapped accurately, rapidly and routinely [7,8,9,10]. In recent research, the object-based image analysis (OBIA) method is one of the most popular approaches to identify landslides. This method is a semiautomated interpretation of Earth observation, which combines pixels with similar spectra, texture and shape in the image to obtain homogeneous pixel sets (i.e., objects). Then, the classification scheme is established to extract image information based on the specific features [11]. Martha et al. [12] combined the spectral, shape and contextual information to detect landslides with recognition accuracy up to 76.4%. Rau et al. [13] developed a scheme using multilevel segmentation and a hierarchical semantic network for landslide recognition. Pradhan et al. [14] identified the locations of landslides by integrating high-resolution airborne laser scanning data (LiDAR) with high-resolution QuickBird satellite imagery using a wavelet transform technique. Chen et al. [15] mapped landslides in the Three Gorges Reservoir area, China, based on random forests and mathematical morphology. Karantanellis et al. [16] proposed a study to detect and provide detailed characterization of individual landslide objects based on OBIA. Han et al. [17] extracted a landslide in Shuicheng, China, with OBIA and analyzed the causes of the landslide. However, all of this research is only applicable to the identification of landslides that had occurred.
On the other hand, radar satellite data have been used for potential landslide detection and landslide deformation monitoring owing to its capability for sensing surface displacement over large areas with centimeter-to-millimeter accuracy under all-weather conditions and day-and-night operation [18,19,20,21]. The proposal and development of the interferometric synthetic aperture radar (InSAR) technology provides solid support for the application of radar remote sensing in landslide monitoring [22,23,24,25,26]. Kang et al. [19] detected 12 landslides in Guanling region, China, with the stacking InSAR technique, which has high consistency with the results from optical remote sensing. Rosi et al. [27] updated a landslide inventory of Tuscany with the persistent scatterer interferometry (PSI) technique. Zhao et al. [28] detected 22 active landslides in the Wudongde Reservoir area with the interferometric point target analysis (IPTA) InSAR technique. Necula et al. [29] identified the deformation related to landslides in Iasi Municipality with multitemporal synthetic aperture radar interferometry (MT-InSAR) techniques. Liu et al. [30] mapped landslides in Gongjue County based on four sets of SAR images from different platforms. It is clear that InSAR technology has an extremely important role in identifying landslides on a large scale, which mainly attribute to the surface deformation patterns. However, a landslide is often composed of several subsections, where some of them have no deformation during the SAR acquisition intervals. Additionally, some sections of landslides can hardly be monitored by InSAR technique owing to decorrelation or insensitivity of SAR geometry. As a result, the deformation pattern is often inconsistent with the complete landslide shape. In most cases, professionals determine the landslide boundary manually by considering the deformation pattern and the auxiliary data, which depend greatly on their professional ability. Thus, delineating the shape of potential landslides manually from InSAR-derived deformation maps is subjective and of low reliability.
Subsequently, optical imagery and InSAR products are integrated for the identification of landslides. Hölbling et al. [31] developed a semiautomated object-based approach for landslide detection and classification, in which the persistent scatterer (PS) measurements were used to validate the semiautomated landslide recognition. Plank et al. [32] proposed a change detection method based on post-event polarimetric SAR data and pre-event optical imagery, and successfully implemented it in two different cases. Huang et al. [33] detected earthquake-induced landslides in western China by combining D-InSAR interferograms with high-resolution optical remote sensing images. Bouali et al. [34] measured the incremental and average deformations of the Portuguese Bend landslide complex in southern California by combining SAR, optical and GPS data. Shirvani et al. [35] applied a synergetic analysis of Sentinel-1 and -2 for mapping landslides in northeast Iran based on OBIA. However, all of these methods identify the landslides that occurred or just use the InSAR-derived products to verify the optical results, which manifests that the capacity of InSAR products are not used intensively in terms of landslide identification, especially for potential delineation of landslides.
An important application of landslide identification is landslide sensitivity evaluation, i.e., prediction of the probability of landslide occurrence [36]. Guzzetti et al. [37] present a landslide susceptibility model for the Collazzone area, central Italy, and validate its capacity for predicting the newly triggered landslides. Rossi et al. [38] demonstrated that it can provide “optimal” susceptibility assessments through the combination of landslide susceptibility zonations from four single zonations obtained through linear discriminant analysis (LDA), quadratic discriminant analysis (QDA), logistic regression (LR) and by training a neural network (NN). By assessing the degree of spatial agreement among susceptibility maps, Sterlacchini et al. [39] indicate that these maps with similar predictive power may not have the same meaning in terms of spatial pattern of predicted results. Adnan et al. [40] evaluated the uncertainties of susceptibility maps acquired from four machine-learning algorithms and developed a combined landslide susceptibility map by integrating the four maps to minimize the uncertainties of various methods. Once the landslide inventory mapping is conducted completely, the landslide susceptibility and sensitivity mapping can be generated more accurately.
This study investigates an automated object-based method for potential landslide identification by combining optical imagery with an InSAR-derived deformation map. The deformation map is applied in the segmentation and classification part of the OBIA model to delineate potential landslides, which can provide support for potential landslide identification and monitoring in an unknown region.
2. Materials and Methods
2.1. Study Area
A small region was selected as a study area to evaluate the performance of the proposed method, and a large region was selected as a validation area. Both regions are distributed along the Jinsha River, China. The first small region with two rotational landslides (Jinpingzi (JPZ) landslide, Shuanglongtan (SLT) landslide), is located near Wudongde Hydropower Station in the lower reaches of Jinsha River in southwest China. These two landslides are located at the junction of Luquan County, Yunnan Province, and Huidong County, Sichuan Province, 0.8 and 6 km away from Wudongde Hydropower Station, respectively (Figure 1a). The JPZ landslide is a deep-seated landslide, and is currently in the creep deformation stage [41]. SLT landslide belongs to the debris flow deposit category, and is in a relatively stable state [28,42]. The elevation of this region ranges from 750 to 3290 m. This study area belongs to the Zhongshan landform, which is subject to tectonic erosion, with steep topography and fragmented rock masses. The geology consists mainly of Sinian carbonate rocks and Mesoproterozoic metamorphic rocks [28]. The climate is subtropical monsoon, with long sunshine hours, high evaporation and concentrated rainfall. Heavy rains and storms mainly occur from May to September. Extreme rainfall, broken rock and soil, and steep slopes are highly susceptible to geological hazards.
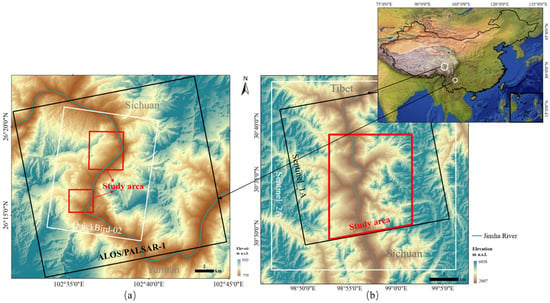
Figure 1.
Location of the study area and validation area. (a) The first small region near Wudongde Hydropower Station in the lower reaches of Jinsha River, China; (b) the second large region in the upper reaches of Jinsha River, China. The black, white and red polygons represent the coverage of SAR, optical images and study area, respectively.
The second large region is located in the upper reaches of Jinsha River, at the junction of Gongjue County, Tibet and Baiyu County, Sichuan, and has an area of approximately 262.2 km2 (Figure 1b). The potential landslides in this region are influenced by the Xiongsong-Suwalong fault, and strong deformation occurs at the foot of the slope. It may develop into retrogressive landslides, forming a landslide–blocked river disaster chain [30,43]. The elevation of the second study area ranges from 2800 to 6000 m, and belongs to the alpine canyon landform. The geology consists mainly of Paleo-Mesoproterozoic, Lower Triassic, Carboniferous–Permian, Silurian, and Late Triassic strata [44]. The climate is continental plateau monsoon, which causes strong weathering on the surface of slope materials. Affected by complex geological conditions, outcomes from geohazards have occurred frequently in recent years. Both study areas are affected by tectonic activity and river erosion, which has triggered hundreds of historical landslides.
2.2. Datasets
To better extract potential landslides, an InSAR-derived deformation map, optical imagery and DEM data are adopted in this study. For SAR datasets, twenty L-band ascending ALOS/PALSAR-1 images acquired from January 2007 to March 2011 were used to generate the InSAR-derived deformation map for the specific landslides in the first small region [28], while fifty-six C-band ascending Sentinel-1A images acquired from August 2016 to October 2018 were used in the second large region [30]. For optical images, QuickBird-02 and Sentinel-2A imagery were employed in first region and second large region, respectively. QuickBird-02 imagery, acquired on 15 November 2009 with a cloud cover of 0% and an off-nadir angle of 22°, contains a panchromatic band with the resolution of 0.61 m and multispectral bands (red, green, blue and near-infrared bands) with 2.44 m resolution. Sentinel-2A imagery, acquired on 22 December 2017, contains B2 (blue), B3 (green), B4 (red) and B8 (near-infrared) bands with 10 m resolution. The detailed parameters of SAR datasets and optical images are shown in Table 1 and Table 2, respectively. Of course, pre-processing of the optical images was executed using ENVI software, including orthographic correction, image registration and data fusion. The fusion results are shown in Figure 2. In addition, a one-arc-second shuttle radar topography mission (SRTM) DEM with 30 m resolution was adopted to rectify the geometric distortion of optical imagery and calculate topographic elements using ArcGIS software, including slope, aspect, hillshade, relief, etc.

Table 1.
Parameters of SAR datasets used in this study.

Table 2.
Parameters of optical imagery used in this study.
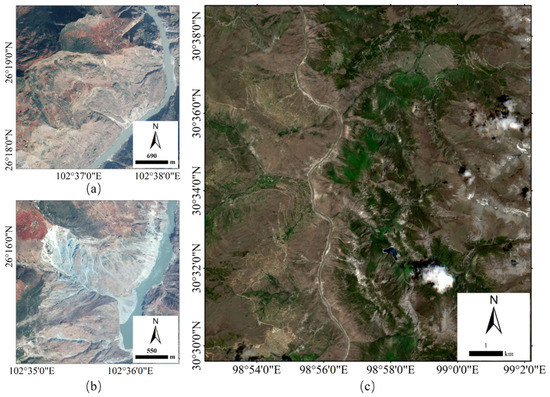
Figure 2.
Optical remote sensing images of the two regions: (a) pan-sharpened image of JPZ landslides; (b) pan-sharpened image of SLT landslides; (c) pan-sharpened image over the second region (validation region).
2.3. Methods
The flowchart for potential landslide extraction by integrating optical remote sensing image with InSAR-derived deformation map is shown in Figure 3. We initially generated the InSAR-derived deformation map. Then, the object-based image analysis (OBIA) method with a deformation layer was employed to delineate the potential landslides.
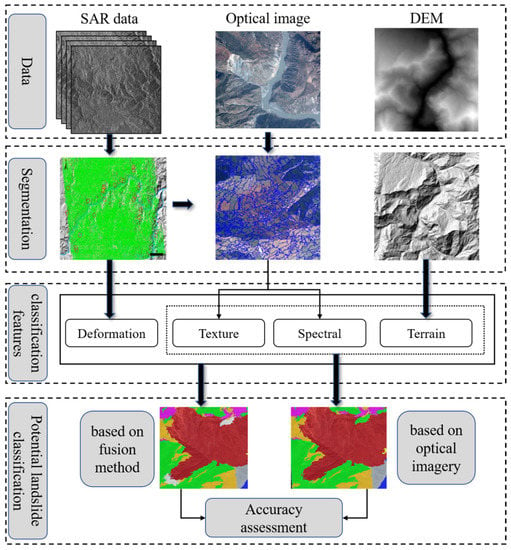
Figure 3.
The flowchart of the proposed method for potential landslide extraction.
2.3.1. InSAR Technique
The interferometric point target analysis (IPTA) and small baseline subsets (SBAS) InSAR techniques were used to generate deformation maps for the two sections. IPTA technique, applied in the first two small regions, was proposed by Werner in 2003, which can effectively overcome the influence of temporal and spatial decoherence and atmospheric delay to obtain high precision surface deformation. SBAS-InSAR technique was applied in the upper reaches of Jinsha River. The details are introduced in [28,30].
2.3.2. Object-Based Landslide Extraction
Object-based image analysis (OBIA), consisting of segmentation and classification, is generally employed to distinguish the landslide from other categories. OBIA, which has been widely used in landslide extraction, classifies different features by fully utilizing the information, including spectral, spatial, structural, contextual and hierarchical properties from the optical imagery.
To automatically extract the potential landslide, we employed the InSAR-derived deformation layer effectively in the process of segmentation and classification. Rulesets for automated classification were acquired from the classification and regression tree (CART) model of eCognition software.
- (a)
- Segmentation
Image segmentation is a key step for extracting landslides with the OBIA method. We adopted multiresolution segmentation strategy and a bottom-up iterative spatial aggregation process to divide images into different patches [45]. As the surface deformation is the main precursor of a potential landslide, we employed deformation rather than DEM during the image segmentation.
As for the segmentation, the input layers including the multispectral layers and deformation layer were equally weighted. Scale parameter, color factor and shape factor were then used to assess the quality of segmentation, where compactness and smoothness are the two key indicators for the shape factor and shape heterogeneity [46], which can be determined by ESP2 tools developed by Dragut et al. [47]. It should be noted that the sum of the weights of shape and color equals one [48] Meanwhile, the sum of the weights of compactness and smoothness also equals to one.
- (b)
- Pre-selection of features
The key of extraction step was to select appropriate object features to distinguish the target feature from others. The object-based image analysis method provided hundreds of object features for classification. In practice, few features affect the accuracy of classification. If there are too many features, it increases the computation burden, rather than improve the accuracy. Therefore, it was important to select landslide features before it occurs. Pre-selected features, comprising a total of 53 indices, were calculated from the input layers, which consisted of multispectral layers (e.g., blue, green, red and near-infrared) and topographic layers (e.g., elevation, slope, aspect, relief and hillshade). The detailed information for these indices is shown in Table 3. Directed by the selection of features, the samples of categories were defined, which is a significant step to establish a ruleset.

Table 3.
Pre-selected features used for classification.
In Table 3, mean refers to the mean value of all pixels included in the image object, while the brightness () of each object is defined as the sum of the mean values in each layer () divided by the number of the layers (), shown as Equation (1). The value denotes the absolute value of the difference in the maximum mean value ()) and the minimum mean value () of each object in all the layers, divided by the object brightness, shown as Equation (2).
Four texture features, including contrast, homogeneity, entropy and correlation, are calculated based on the gray-level co-occurrence matrix (GLCM), which characterizes the image texture by analyzing combinations of gray-level occurrences considering the relationships of two neighboring pixels [49]. The is defined as the sum of the four directions of neighboring pixels at 0° (N–S), 45° (NE–SW), 90° (E–W) and 135° (SW–NE).
The geometry features selected consist of shape index, density, area and number of pixels. The shape index of each object is defined as the ratio of its border length to the square root of its area times four. The density is calculated by the number of pixels forming the image object divided by its radius, based on the covariance matrix. The area of each object is the number of pixels forming the object.
Normalized difference vegetation index (NDVI) and normalized differential water index (NDWI) describe the vegetation and the water information for the research region, respectively [50].
- (c)
- Classification
The classification and regression tree (CART) model, a representative of the decision tree model proposed by Breiman [51], is then used to optimize the classification features and to calculate the corresponding thresholds to extract the different categories automatically. Samples of different categories are defined to train the model. The detection of initial landslide areas is conducted by applying the rulesets with eCognition software [52,53].
The basic principle of the CART model is that the training samples are divided into test variables and target variables, and a classification binomial tree is formed by cyclic analysis of these two variables. is used as a criterion for selecting the best classification features and their corresponding thresholds (feature thresholds), shown as Equations (3) and (4):
where denotes the probability that a sample is randomly selected from the training samples and belongs to class when the value of its test variable is ; denotes the number of samples belonging to class when the value of the test variable is ; denotes the number of samples whose value of the test variable is ; and is the total number of classes.
The decision tree generated by the CART model consists of a root node and a series of leaf nodes, each with only one parent and two children. At each node, the smallest is computationally selected as the next node. The formula for is shown as Equation (5):
where is the number of samples at the time of dividing a feature by a certain value, and is the total number of current samples.
- (d)
- Omissive landslide area extraction
The complexity and diversity of features is a great challenge for landslide classification, especially for the identification of potential landslides. The initial results are incomplete based on the CART model, which means that there are some false negative objects in other categories. Therefore, InSAR-derived deformation rate is considered in the landslide classification, which can describe the microdisplacement of the potential landslides. We adopt a threshold of InSAR-derived deformation rate to extract the omissive regions in the initial results with the objects suffering deformation. The average deformation of all pixels involved in an object is calculated as its deformation value. As a different landslide deformation has a different deformation sign in the InSAR line-of-sight direction, the omissive regions are extracted with a positive or negative threshold. Finally, the potential landslides are extracted by calculating the integration of the initial results and the omissive region.
2.3.3. Accuracy Assessment
The extracted potential landslide areas are validated by error analysis based on the visual interpretation results. The evaluation indicators include recall and precision [54]:
where represents the landslide areas identified by computation, represents the landslide areas identified by visual interpretation and represents the landslide areas correctly identified by computation.
The precision refers to the proportion of correctly extracted landslide areas to the total areas extracted by computation, which reflects the reliability of landslide recognition by computation. The recall refers to the overlap rate between the landslide areas correctly identified by computation and the visually interpreted landslide areas, which represents the possibility that the computer classification technology can correctly identify the landslide areas, which reflects the extent that the actual landslide areas can be recognized automatically.
3. Results
3.1. InSAR-Derived Deformation Map
IPTA InSAR technique and SBAS-InSAR technique are adopted to generate a deformation map for the first small region and the second large region, respectively. Figure 4a shows the deformation rate map in the first region, in which two potential landslides are roughly delineated according to the deformation results [28]. Figure 4b shows the deformation rate map in the first region.
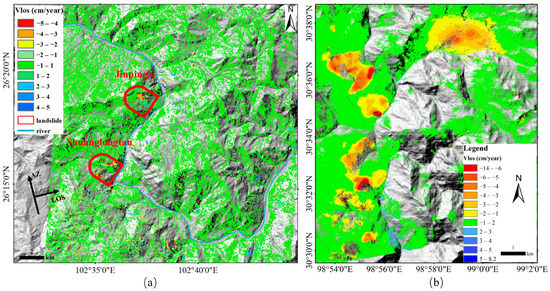
Figure 4.
InSAR−derived deformation rate map. (a) Deformation rate map in the first small region. The red polygons represent the location of the two potential landslides. (b) Deformation rate map in the second large region (validation region).
3.2. Segmentation
The optimal segmentation scale means that the boundary of the object after segmentation can outline the boundary of the ground feature clearly and cannot be too fragmented. If the segmentation scale is too large, it may lead to the inclusion of multiple ground features in one object, which will increase the homogeneity of different categories of objects and affects the classification results. If the segmentation scale is too small, the object will be too fragmented and some information of the ground feature will be lost, which will affect the accuracy of the classification. The following settings for color (0.9), shape (0.1), smoothness (0.5) and compactness (0.5) are accepted through a trial-and-error procedure. Then, the scale parameter value of 110 is determined by ESP2 tools in eCognition software. The settings are appropriate for both regions. The results of segmentation in the SLT landslide are shown in Figure 5. Figure 5a shows the segmentation result using multispectral layers and the DEM layer, while Figure 5b provides the results based on the InSAR-derived deformation layer rather than the DEM layer in this study. The homogeneity for nondeformation pixels mostly depends on the multispectral information, while the homogeneity for deformation pixels is improved with the addition of the deformation layer. It is obvious that the objects shown in Figure 5a are more fragmented, which result in the losses of useful information and decrease the accuracy of classification.
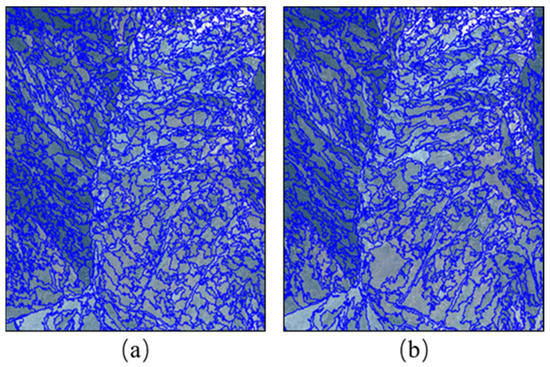
Figure 5.
Comparison of different segmentation layers. (a) Segmentation result derived from the multispectral layers and DEM layer. (b) Segmentation result derived from the multispectral and deformations layer.
3.3. Classification
After segmentation, the categories of ground objects are determined by visual interpretation. Five different nonlandslide categories, including water, shadow, vegetation, bare land and buildings, are determined from the optical imagery for the JPZ landslide, while seven different nonlandslide categories are used for the SLT landslide, including water, sediment, shadow, buildings, bedrock, bare land and vegetation. The pan-sharpened image layer, DEM layer and topographic layers (e.g., slope layer, elevation layer, relief layer and hillshade layer) are selected as the input elements to conduct the classification in eCognition software. The training sample database is created by visual interpretation. Afterward, the ruleset is established. Then, the initial result of a potential landslide, which is delineated by purely optical imagery, is acquired by applying the ruleset. It should be noted that the deformation layer is not involved in this training model.
After the initial classification, the deformation rate of the object is calculated to extract omissive potential landslide areas. Both positive and negative thresholds are set according to the different direction of displacements. The final result of the potential landslide is the union of the omissive potential landslide area and the initial result.
3.3.1. Landslide Identification in Small Regions
Two landslides were successfully extracted using the OBIA method by integrating optical imagery and the InSAR-derived deformation map in the first region (study area). As shown in Figure 6, the area of two potential landslides is about 2.76 km2.
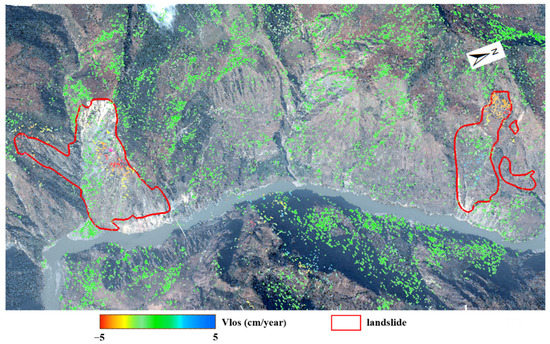
Figure 6.
Landslide detection result (red polygons) using the OBIA method by integrating optical imagery with the InSAR−derived deformation rate map.
- (a)
- JPZ landslide
The extraction result for the JPZ landslide is shown in Figure 7, where Figure 7a shows the potential landslide extracted by the OBIA method using purely optical imagery (initial result), with an area about 0.6 km2. If deformation thresholds are set to extract the omissive area based on the initial result, the area of the potential landslide is increased to 0.97 km2, as shown in Figure 7b (final result), where the white dotted lines indicate the landslide sections based on a site investigation [55]. The recall of both methods is 100%, and the precision increased from 22.9% (initial result) to 37.02% (final result). It can be seen from Figure 7b that the final result covers the whole region of Section II and partial regions of Section I and IV, which is more reasonable than the one shown in Figure 7a. Both of the results have three components with irregular boundaries, which are due to the complex land cover types of the Jinpingzi potential landslide, with features such as buildings, agricultural land and vegetation. These ground features have obvious classification characteristics, and it is difficult to identify these objects as landslides in the process of machine classification. Thus, for this reason, the precision of JPZ is low.
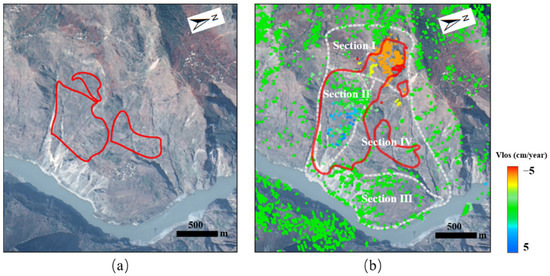
Figure 7.
Identification results (red polygons) of the JPZ landslide with the OBIA method by using a purely optical image (a), and by integrating the optical image with the InSAR−derived deformation map (b). The white polygons in (b) represent five subsections of the JPZ landslide.
- (b)
- SLT landslide
The extraction results of the SLT landslide are shown in Figure 8, where Figure 8a shows the potential landslide extracted by the OBIA method using purely optical imagery (initial result), with an area about 1.73 km2, while the area increases to about 1.79 km2 by integrating optical imagery and the InSAR-derived deformation rate map (final result). The recall and precision of the initial result are 83.4% and 90.5%, respectively, while the two indexes of the final result are 86.5% and 94.1%, respectively.
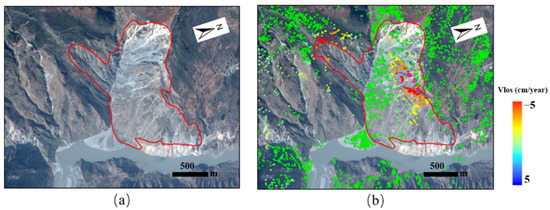
Figure 8.
Identification result (red polygons) of the SLT landslide with the OBIA method by using a purely optical image (a), and by integrating the optical image with the InSAR−derived deformation map (b).
3.3.2. Landslide Identification in the Second Region (Validation Region)
To fully verify the performance of the proposed method, a validation region with an area about 262.2 km2 is tested. Figure 9 shows that five landslides in blue dash polygons, covering an area of about 19.76 km2, are delineated with the OBIA method by using a purely optical image (initial result), while the area increased to 23.22 km2 by integrating the optical image and the InSAR-derived deformation map (final result), shown in red solid polygons. The black solid polygons represent the landslides delineated by visual interpretation [43]. The precision and recall of the initial result are 89.57% and 61.97%, respectively, while the two indexes of the final result are 88.45% and 71.92%, respectively. There is no significant difference in precision between the two methods, but the recall of the final result is 9.95% higher than that of the initial result.
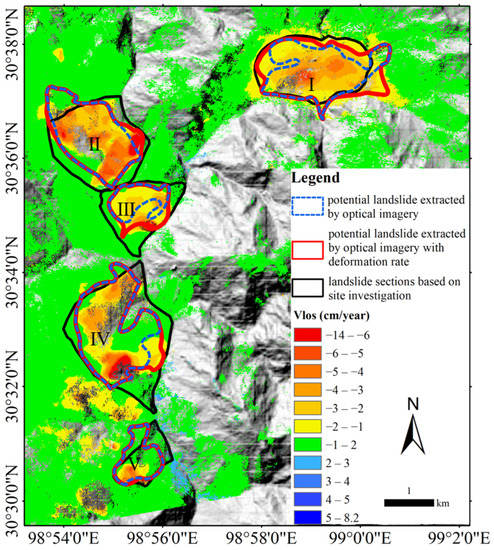
Figure 9.
Potential landslide identification with the OBIA method by using a purely optical image (blue dash polygons), and by integrating the optical image with the InSAR—derived deformation map (red solid polygons).
4. Discussion
4.1. Segmentation
Generally, the segmentation effect is determined by visual judgment. The optimal segmentation effect is defined as the segmentation object can accurately define the boundary of the ground feature. Figure 10 shows the details of the segmentation results with the same segmentation parameters. Figure 10a,b shows the segmentation details with the DEM layer, while Figure 10c,d shows that with the deformation layer. The object in the red rectangle shown in Figure 10a contains both kinds of ground features, while it is divided into two objects in Figure 10c, which is more favorable for classification. Similarly, the bare land in the red ellipse in Figure 10b is divided within multiple objects with broken boundaries, while it is completely segmented into one object in Figure 10d, clearly distinguished from the surrounding objects. It can be concluded that with the same settings of segmentation parameters, the objects segmented from the deformation layer exhibit a better fit with the boundaries of the ground features.
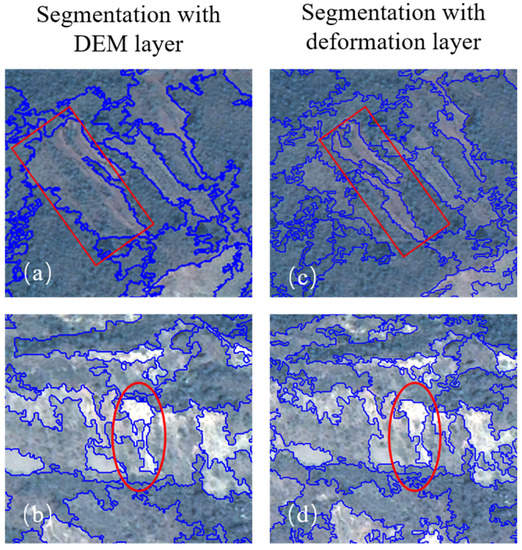
Figure 10.
Details of the segmentation results: (a,b) represent the result derived from the multispectral layers and DEM layer; (c,d) represent the result derived from the multispectral layers and deformation layer. The red rectangle and circle indicate the comparison of the details of the two results.
4.2. Importance of Deformation Features for Identification of a Potential Landslide
In this study, the performance of extraction landslides by integrating optical imagery and InSAR-derived deformation is evaluated. It must be acknowledged that the accurate identification of landslide boundaries is a major challenge in the field of landslide mapping, especially the delineation of potential landslides. However, the results of this study show that object-based image analysis by integrating an InSAR-derived deformation map and optical imagery has a high potential to improve the correct identification area of potential landslides, when compared with classification using only optical imagery. Figure 11 shows the comparison between the initial and final result for the two landslides.
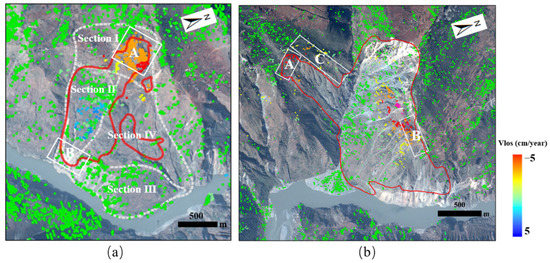
Figure 11.
Comparison between the initial and final result: (a) comparison for the JPZ landslide, the white solid polygons indicate the two different parts between the initial and final result; (b) comparison for the SLT landslide, the white solid polygons indicate the parts with deformation. The red solid polygons indicate the final result. The white dotted line divides the five sections of the Jinpingzi landslide.
The JPZ landslide is divided into five sections, among which section I has the largest magnitude of deformation, with a maximum deformation up to −48 mm/year. Section II has the second largest deformation magnitude, the maximum deformation reaches 37 mm/year, and other sections are relatively stable. The omissive landslide area delineated in the final result is concentrated in these two sections, shown with a white solid rectangle in Figure 11a. In general, the upper part of the Jinpingzi potential landslide is in a state of creeping and slipping deformation, while the lower part is more stable.
For the SLT landslide, the deformation area is mainly concentrated on the right side of the slope, where cracks are developed. It is clear that the two areas labeled A and B in Figure 11b show different patterns by considering the InSAR-derived deformation map, where the localized deformation rate is as large as −5 cm/year. Since the deformation magnitude is small and the deformation points are so sparse, the area labeled C is not identified as a landslide.
The extraction results with the OBIA method by using solely the optical image (initial result) and by integrating the optical image with deformation (final result) are also quantitatively compared to evaluate the importance of the deformation feature. The precision of the JPZ landslide is improved by 14.12%, and the recall and precision of the SLT landslide are improved by 3.1% and 3.6%, respectively. The landslide area detected increased as large as 94% for the JPZ landslide, but only 3.4% for the SLT landslide. Therefore, the deformation map could improve the landslide identification, especially for the potential landslide with obvious surface deformation. The reasons for the slight improvement in SLT landslide identification can be explained as the obvious differences between potential landslide area and nonlandslide features in color and textural factors, which guarantee the high quality of samples with the purely optical image, although the improvement expected occurred in the regions suffering surface deformation. High accuracy of the initial result indicates that deformation provided a minor contribution, which led to the slight improvement for landslide identification. On the contrary, the ground features at the JPZ landslide are complex and it is difficult to distinguish between the potential landslide area and nonlandslide features from the optical image, which results in the low accuracy of classification by using only the optical image. Hence, a great improvement can be expected by using the combined method.
The comparison is also performed for the validation region. The recall for the second region was improved by 9.95%. The area of the whole landslide increased by 17.5%, whereas the area of individual landslides increased by 32.8%, 7.8%, 52.3%, 8.9% and 1.7%. Figure 12 shows the accuracy assessment of the initial and final results in the validation region for the five landslides. It can be seen that there is little difference in precision between the two results, while the recall of the final result is greatly improved compared with the initial result, up to nearly 20%. In other words, correct omissive regions can be extracted by InSAR-derived deformation. It is not accurate to delineate potential landslides from only the optical image if there are no prior accurate samples in terms of landslide classification. However, it can be significantly improved with the addition of InSAR-derived deformation, even for landslide identification in the large area.
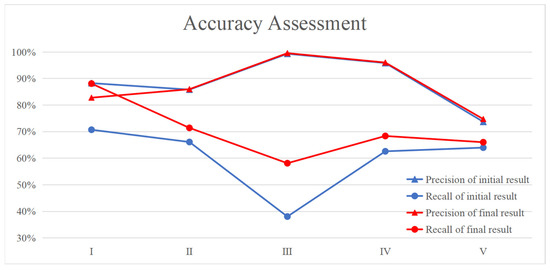
Figure 12.
Accuracy assessment comparison for the initial and final results.
This study demonstrated that the InSAR-derived deformation map can provide valuable support for the potential landslide extraction based on OBIA. This method yields more complete results and higher accuracy than the OBIA method using purely optical imagery. Furthermore, this method is more automated and requires less expertise for the interpreters than using only InSAR deformation to identify landslides. A limitation is the need for high quality deformation data for better segmentation and extraction of omissive regions. Moreover, for the extraction of small potential landslides, optical images and SAR data with higher accuracy resolution are needed.
5. Conclusions
The OBIA method and InSAR technique demonstrate their potential for landslide extraction and monitoring [56,57,58,59,60]; however, the limitations of the two methods are also obvious. An automatic identification method for potential landslides is proposed in this paper by integrating an optical remote sensing image with an InSAR-derived deformation map, which can detect potential landslides automatically, completely and accurately. The InSAR-derived deformation map rather than the DEM data is applied to assist the image segmentation, which increases the completeness of image objects. Additionally, deformation rate calculated by the InSAR technique is used to extract omissive potential landslides after landslide identification using the CART model with an optical image. The comparison between the initial and final result shows that the potential landslide areas extracted with the OBIA method by integrating the optical remote sensing image and the InSAR-derived deformation map can obviously improve the outcome, especially for a complex surface environment, which increases the accuracy and completeness of the potential landslide identification. The application in the second region indicates that the proposed method can not only be used for some specific small region, but also for large-coverage regions, which can improve the geohazard investigation efficiently and provide valuable information for unknown regions in terms of landslide early warning and prevention.
Author Contributions
Conceptualization, C.Z.; methodology, C.Z., Y.K. and Z.X.; validation, C.D.; formal analysis, Z.X. and C.Z.; investigation, Z.X.; resources, Z.X., Y.K. and X.L.; data curation, Z.X. and C.D.; writing—original draft preparation, Z.X.; writing—review and editing, C.Z., Y.L. and Y.K.; visualization, Z.X. and C.D.; supervision, C.Z.; project administration, Z.X.; funding acquisition, C.Z. All authors have read and agreed to the published version of the manuscript.
Funding
This research was funded by the Natural Science Foundation of China (grant numbers 41874005, 41929001).
Data Availability Statement
The one-arc-second SRTM DEM was freely downloaded from the website https://earthexplorer.usgs.gov/ (accessed on 11 February 2000, updated on 2 January 2015) and the Sentinel-1 and Sentintle-2A data were freely downloaded from https://scihub.copernicus.eu/dhus/#/home.
Acknowledgments
We are grateful to the editors for helping to significantly improve the quality of the manuscript.
Conflicts of Interest
The authors declare no conflict of interest.
References
- Wang, Z.-H. Remote Sensing for Landslide Survey, Monitoring and Evaluation. Remote Sens. Land Resour. 2007, 19, 10–15. [Google Scholar] [CrossRef]
- Yin, Y.; Liu, C.; Chen, H.; Ren, J.; Zhu, C. Investigation on Catastrophic Landslide of January 11, 2013 at Zhaojiagou, Zhenxiong County, Yunnan Province. J. Eng. Geol. 2013, 21, 6–15. [Google Scholar]
- Hervás, J.; Bobrowsky, P. Mapping: Inventories, susceptibility, hazard and risk. In Landslides—Disaster Risk Reduction; Sassa, K., Canuti, P., Eds.; Springer: Berlin/Heidelberg, Germany, 2009; pp. 321–349. ISBN 978-3-540-69966-8. [Google Scholar]
- Chigira, M.; Duan, F.; Yagi, H.; Furuya, T. Using an Airborne Laser Scanner for the Identification of Shallow Landslides and Susceptibility Assessment in an Area of Ignimbrite Overlain by Permeable Pyroclastics. Landslides 2004, 1, 203–209. [Google Scholar] [CrossRef]
- Razak, K.A.; Straatsma, M.W.; van Westen, C.J.; Malet, J.-P.; de Jong, S.M. Airborne Laser Scanning of Forested Landslides Characterization: Terrain Model Quality and Visualization. Geomorphology 2011, 126, 186–200. [Google Scholar] [CrossRef]
- Van Den Eeckhaut, M.; Poesen, J.; Verstraeten, G.; Vanacker, V.; Moeyersons, J.; Nyssen, J.; Van Beek, L. The Effectiveness of Hillshade Maps and Expert Knowledge in Mapping Old Deep-Seated Landslides. Geomorphology 2005, 67, 351–363. [Google Scholar] [CrossRef]
- Rosin, P.L.; Hervás, J. Remote Sensing Image Thresholding Methods for Determining Landslide Activity. Int. J. Remote Sens. 2005, 26, 1075–1092. [Google Scholar] [CrossRef] [Green Version]
- Borghuis, A.M.; Chang, K.; Lee, H.Y. Comparison between Automated and Manual Mapping of Typhoon-triggered Landslides from SPOT-5 Imagery. Int. J. Remote Sens. 2007, 28, 1843–1856. [Google Scholar] [CrossRef]
- Yang, X.; Chen, L. Using Multi-Temporal Remote Sensor Imagery to Detect Earthquake-Triggered Landslides. Int. J. Appl. Earth Obs. Geoinf. 2010, 12, 487–495. [Google Scholar] [CrossRef]
- Stumpf, A.; Kerle, N. Object-Oriented Mapping of Landslides Using Random Forests. Remote Sens. Environ. 2011, 115, 2564–2577. [Google Scholar] [CrossRef]
- Bruzzone, L.; Bovolo, F. A Novel Framework for the Design of Change-Detection Systems for Very-High-Resolution Remote Sensing Images. Proc. IEEE 2012, 101, 609–630. [Google Scholar] [CrossRef]
- Martha, T.R.; Kerle, N.; Jetten, V.; van Westen, C.J.; Kumar, K.V. Characterising Spectral, Spatial and Morphometric Properties of Landslides for Semi-Automatic Detection Using Object-Oriented Methods. Geomorphology 2010, 116, 24–36. [Google Scholar] [CrossRef]
- Rau, J.-Y.; Jhan, J.-P.; Rau, R.-J. Semiautomatic Object-Oriented Landslide Recognition Scheme from Multisensor Optical Imagery and DEM. IEEE Trans. Geosci. Remote Sens. 2013, 52, 1336–1349. [Google Scholar] [CrossRef]
- Pradhan, B.; Jebur, M.N.; Shafri, H.Z.M.; Tehrany, M.S. Data Fusion Technique Using Wavelet Transform and Taguchi Methods for Automatic Landslide Detection from Airborne Laser Scanning Data and Quickbird Satellite Imagery. IEEE Trans. Geosci. Remote Sens. 2015, 54, 1610–1622. [Google Scholar] [CrossRef]
- Chen, T.; Trinder, J.C.; Niu, R. Object-Oriented Landslide Mapping Using ZY-3 Satellite Imagery, Random Forest and Mathematical Morphology, for the Three-Gorges Reservoir, China. Remote Sens. 2017, 9, 333. [Google Scholar] [CrossRef] [Green Version]
- Karantanellis, E.; Marinos, V.; Vassilakis, E.; Christaras, B. Object-Based Analysis Using Unmanned Aerial Vehicles (UAVs) for Site-Specific Landslide Assessment. Remote Sens. 2020, 12, 1711. [Google Scholar] [CrossRef]
- Han, Y.; Wang, P.; Zheng, Y.; Yasir, M.; Xu, C.; Nazir, S.; Hossain, M.S.; Ullah, S.; Khan, S. Extraction of Landslide Information Based on Object-Oriented Approach and Cause Analysis in Shuicheng, China. Remote Sens. 2022, 14, 502. [Google Scholar] [CrossRef]
- Hu, X.; Wang, T.; Pierson, T.C.; Lu, Z.; Kim, J.; Cecere, T.H. Detecting Seasonal Landslide Movement within the Cascade Landslide Complex (Washington) Using Time-Series SAR Imagery. Remote Sens. Environ. 2016, 187, 49–61. [Google Scholar] [CrossRef] [Green Version]
- Kang, Y.; Zhao, C.; Zhang, Q.; Lu, Z.; Li, B. Application of InSAR Techniques to an Analysis of the Guanling Landslide. Remote Sens. 2017, 9, 1046. [Google Scholar] [CrossRef] [Green Version]
- Shi, X.; Liao, M.; Li, M.; Zhang, L.; Cunningham, C. Wide-Area Landslide Deformation Mapping with Multi-Path ALOS PALSAR Data Stacks: A Case Study of Three Gorges Area, China. Remote Sens. 2016, 8, 136. [Google Scholar] [CrossRef] [Green Version]
- Liu, X.; Zhao, C.; Zhang, Q.; Peng, J.; Zhu, W.; Lu, Z. Multi-Temporal Loess Landslide Inventory Mapping with C-, X-and L-Band SAR Datasets—A Case Study of Heifangtai Loess Landslides, China. Remote Sens. 2018, 10, 1756. [Google Scholar] [CrossRef] [Green Version]
- Ferretti, A.; Prati, C.; Rocca, F. Permanent Scatterers in SAR Interferometry. IEEE Trans. Geosci. Remote Sens. 2001, 39, 8–20. [Google Scholar] [CrossRef]
- Berardino, P.; Fornaro, G.; Lanari, R.; Sansosti, E. A New Algorithm for Surface Deformation Monitoring Based on Small Baseline Differential SAR Interferograms. IEEE Trans. Geosci. Remote Sens. 2002, 40, 2375–2383. [Google Scholar] [CrossRef] [Green Version]
- Werner, C.; Wegmuller, U.; Strozzi, T.; Wiesmann, A. Interferometric Point Target Analysis for Deformation Mapping. In Proceedings of the IGARSS 2003. 2003 IEEE International Geoscience and Remote Sensing Symposium. In Proceedings of the (IEEE Cat. No.03CH37477), Toulouse, France, 21–25 July 2003; Volume 7, pp. 4362–4364. [Google Scholar]
- Hooper, A.; Zebker, H.; Segall, P.; Kampes, B. A New Method for Measuring Deformation on Volcanoes and Other Natural Terrains Using InSAR Persistent Scatterers: A new persistent Scatterers method. Geophys. Res. Lett. 2004, 31, 10029–10034. [Google Scholar] [CrossRef]
- Zhang, L.; Ding, X.; Lu, Z. Deformation Rate Estimation on Changing Landscapes Using Temporarily Coherent Point InSAR. In Proceedings of the Fringe Conference Proceedings, Vancouver, BC, Canada, 10–12 August 2012. [Google Scholar]
- Rosi, A.; Tofani, V.; Tanteri, L.; Tacconi Stefanelli, C.; Agostini, A.; Catani, F.; Casagli, N. The New Landslide Inventory of Tuscany (Italy) Updated with PS-InSAR: Geomorphological Features and Landslide Distribution. Landslides 2018, 15, 5–19. [Google Scholar] [CrossRef] [Green Version]
- Zhao, C.; Kang, Y.; Zhang, Q.; Lu, Z.; Li, B. Landslide Identification and Monitoring along the Jinsha River Catchment (Wudongde Reservoir Area), China, Using the InSAR Method. Remote Sens. 2018, 10, 993. [Google Scholar] [CrossRef] [Green Version]
- Necula, N.; Niculiță, M.; Fiaschi, S.; Genevois, R.; Riccardi, P.; Floris, M. Assessing Urban Landslide Dynamics through Multi-Temporal InSAR Techniques and Slope Numerical Modeling. Remote Sens. 2021, 13, 3862. [Google Scholar] [CrossRef]
- Liu, X.; Zhao, C.; Zhang, Q.; Yin, Y.; Lu, Z.; Samsonov, S.; Yang, C.; Wang, M.; Tomás, R. Three-Dimensional and Long-Term Landslide Displacement Estimation by Fusing C-and L-Band SAR Observations: A Case Study in Gongjue County, Tibet, China. Remote Sens. Environ. 2021, 267, 112745. [Google Scholar] [CrossRef]
- Hölbling, D.; Füreder, P.; Antolini, F.; Cigna, F.; Casagli, N.; Lang, S. A Semi-Automated Object-Based Approach for Landslide Detection Validated by Persistent Scatterer Interferometry Measures and Landslide Inventories. Remote Sens. 2012, 4, 1310–1336. [Google Scholar] [CrossRef] [Green Version]
- Plank, S.; Twele, A.; Martinis, S. Landslide Mapping in Vegetated Areas Using Change Detection Based on Optical and Polarimetric SAR Data. Remote Sens. 2016, 8, 307. [Google Scholar] [CrossRef] [Green Version]
- Huang, Q.; Wang, Y.; Xu, J.; Nishyirimbere, A.; Li, Z. Geo-Hazard Detection and Monitoring Using SAR and Optical Images in a Snow-Covered Area: The Menyuan (China) Test Site. ISPRS Int. J. Geo-Inf. 2017, 6, 293. [Google Scholar] [CrossRef] [Green Version]
- Bouali, E.H.; Oommen, T.; Escobar-Wolf, R. others Evidence of Instability in Previously-Mapped Landslides as Measured Using Gps, Optical, and Sar Data between 2007 and 2017: A Case Study in the Portuguese Bend Landslide Complex, California. Remote Sens. 2019, 11, 937. [Google Scholar] [CrossRef] [Green Version]
- Shirvani, Z.; Abdi, O.; Buchroithner, M. A Synergetic Analysis of Sentinel-1 and-2 for Mapping Historical Landslides Using Object-Oriented Random Forest in the Hyrcanian Forests. Remote Sens. 2019, 11, 2300. [Google Scholar] [CrossRef] [Green Version]
- Liang, Z.; Wang, C. Comprehensive Application and Study of Machine Learning in Susceptibility Evaluation of Shallow Landslides. Ph.D. Thesis, Jilin University, Changchun, China, 2021. [Google Scholar]
- Guzzetti, F.; Reichenbach, P.; Ardizzone, F.; Cardinali, M.; Galli, M. Estimating the Quality of Landslide Susceptibility Models. Geomorphology 2006, 81, 166–184. [Google Scholar] [CrossRef]
- Rossi, M.; Guzzetti, F.; Reichenbach, P.; Mondini, A.C.; Peruccacci, S. Optimal Landslide Susceptibility Zonation Based on Multiple Forecasts. Geomorphology 2010, 114, 129–142. [Google Scholar] [CrossRef]
- Sterlacchini, S.; Ballabio, C.; Blahut, J.; Masetti, M.; Sorichetta, A. Spatial Agreement of Predicted Patterns in Landslide Susceptibility Maps. Geomorphology 2011, 125, 51–61. [Google Scholar] [CrossRef]
- Adnan, M.S.G.; Rahman, M.S.; Ahmed, N.; Ahmed, B.; Rabbi, M.; Rahman, R.M. Improving Spatial Agreement in Machine Learning-Based Landslide Susceptibility Mapping. Remote Sens. 2020, 12, 3347. [Google Scholar] [CrossRef]
- Peng, S.; Zheng, D.; Duan, G.; Wei, G. Surface Deformation Characteristics and Underground Drainage Effect of Jinpingzi Landslide near Wudongde Hydropower Station. Water Resour. Hydropower Eng. 2021, 52, 146–158. [Google Scholar]
- Varnes, D.J. Landslide Types and Processes. Landslides-Invesitg. Mitig. 1996, 247, 36–75. [Google Scholar]
- Liu, W.; Wang, M.; Zhu, S.; Yu, T.; Huang, X.; Song, B.; Jiang, Y.; Sun, Y. An Analysis on Chain Characteristics of Highstand Geological Disasters in High Mountains and Extremely High Mountains Based on Optical Remote Sensing Technology: A Case Study of Representative Large Landslides in Upper Reach of Jinsha River. Chin. J. Geol. Hazard Control 2021, 32, 29–39. [Google Scholar] [CrossRef]
- Zhu, S.; Yin, Y.; Wang, M.; Zhu, M.; Wang, C.; Wang, W.; Li, J.; Zhao, H. Instability Mechanism and Mitigation Countermeasures of Long Run-out Landslide at High Location in Jinshajiang Suture: A Case Study of the Sela Landslide in Jinsha River, Tibet. Chin. J. Geotech. Eng. 2021, 43, 688–697. [Google Scholar]
- Rahman, R.; Saha, S.K. Multi-Resolution Segmentation for Object-Based Classification and Accuracy Assessment of Land Use/Land Cover Classification Using Remotely Sensed Data. J. Indian Soc. Remote Sens. 2008, 36, 189–201. [Google Scholar] [CrossRef]
- Burnett, C.; Blaschke, T. A Multi-Scale Segmentation/Object Relationship Modelling Methodology for Landscape Analysis. Ecol. Model. 2003, 168, 233–249. [Google Scholar] [CrossRef]
- Drăguţ, L.; Csillik, O.; Eisank, C.; Tiede, D. Automated Parameterisation for Multi-Scale Image Segmentation on Multiple Layers. ISPRS J. Photogramm. Remote Sens. 2014, 88, 119–127. [Google Scholar] [CrossRef] [PubMed] [Green Version]
- Zhang, Q.; Zhao, C. Semiautomatic Object-oriented Loose Landslide Recognition based on High Resolution Remote Sensing Images in Heifangtai, Gansu. J. Catastrophology 2017, 32, 210–215. [Google Scholar] [CrossRef]
- Zhao, H.; Fang, X.; Ding, H.; Josef, S.; Xiong, L.; Na, J.; Tang, G. Extraction of Terraces on the Loess Plateau from High-Resolution DEMs and Imagery Utilizing Object-Based Image Analysis. ISPRS Int. J. Geo-Inf. 2017, 6, 157. [Google Scholar] [CrossRef] [Green Version]
- Ouyang, L.; Mao, D.; Wang, Z.; Li, H.; Man, W.; Jia, M.; Liu, M.; Zhang, M.; Liu, H. Analysis Crops Planting Structure and Yield Based on GF-1 and Landsat8 OLI Images. Trans. Chin. Soc. Agric. Eng. 2017, 33, 147–156. [Google Scholar] [CrossRef]
- Breiman, L.; Friedman, J.; Olshen, R.; Stone, C. Classification and Regression Trees; Routledge: New York, NY, USA, 1984; Volume 37, pp. 237–251. [Google Scholar] [CrossRef]
- Nussbaum, S.; Menz, G. ECognition image analysis software. In Object-Based Image Analysis and Treaty Verification; Springer: Dordrecht, Netherlands, 2008; pp. 29–39. ISBN 978-1-4020-6960-4. [Google Scholar]
- Lemenkova, P. Topology, Homogeneity and Scale Factors for Object Detection: Application of ECognition Software for Urban Mapping Using Multispectral Satellite Image. arXiv 2018, arXiv:1901.00726. [Google Scholar] [CrossRef]
- Zhang, Q. Landslide Recognition Based on High Resolution Remote Sensing Images in Heifangtai. Master’s Thesis, Chang’an University, Xi’an, China, 2017. [Google Scholar]
- Xie, M.; Hu, M.; Wang, L. Landslide Monitoring by Three-Dimensional Laser Scanner-Case Study of the Displacement Detection of the Jinpingzi Landslide (Southwest, China). Chin. J. Geol. Hazard Control 2013, 24, 85–92. [Google Scholar] [CrossRef]
- Sun, W.; Tian, Y.; Mu, X.; Zhai, J.; Gao, P.; Zhao, G. Loess Landslide Inventory Map Based on GF-1 Satellite Imagery. Remote Sens. 2017, 9, 314. [Google Scholar] [CrossRef] [Green Version]
- Moosavi, V.; Talebi, A.; Shirmohammadi, B. Producing a Landslide Inventory Map Using Pixel-Based and Object-Oriented Approaches Optimized by Taguchi Method. Geomorphology 2014, 204, 646–656. [Google Scholar] [CrossRef]
- Blaschke, T.; Feizizadeh, B.; Holbling, D. Object-Based Image Analysis and Digital Terrain Analysis for Locating Landslides in the Urmia Lake Basin, Iran. IEEE J. Sel. Top. Appl. Earth Obs. Remote Sens. 2014, 7, 4806–4817. [Google Scholar] [CrossRef]
- Zhu, W.; Zhang, Q.; Ding, X.; Zhao, C.; Yang, C.; Qu, F.; Qu, W. Landslide Monitoring by Combining of CR-InSAR and GPS Techniques. Adv. Space Res. 2014, 53, 430–439. [Google Scholar] [CrossRef]
- Strozzi, T.; Farina, P.; Corsini, A.; Ambrosi, C.; Thüring, M.; Zilger, J.; Wiesmann, A.; Wegmüller, U.; Werner, C. Survey and Monitoring of Landslide Displacements by Means of L-Band Satellite SAR Interferometry. Landslides 2005, 2, 193–201. [Google Scholar] [CrossRef]
Publisher’s Note: MDPI stays neutral with regard to jurisdictional claims in published maps and institutional affiliations. |
© 2022 by the authors. Licensee MDPI, Basel, Switzerland. This article is an open access article distributed under the terms and conditions of the Creative Commons Attribution (CC BY) license (https://creativecommons.org/licenses/by/4.0/).