1. Introduction
CO
2 is the most important greenhouse gas associated with human activities and the second most important gas in global warming after water vapor. Since the industrial revolution, a notable increase in global CO
2 concentrations has been observed, rising from 280 ppm (parts per million) in the middle of the 19th century to over 400 ppm as of 2015 [
1,
2]. Several atmospheric research centers noted this rise; based on preliminary analysis, the global average atmospheric CO
2 in 2020 was 412.5 ppm [
3], and in 2021, it was 415.7 ppm, based on monthly mean NOAA reports [
4,
5].
CH
4 is a strong greenhouse gas and plays an important role in determining the oxidation capacity of the troposphere, with a global warming potential on a 100-year time-scale 28–34 times that of CO
2 [
6]. According to current observations, in 2015, the globally averaged content of CH
4 was already1845 ppb [
7]. Scientific debate continues in the effort to explain the atmospheric CH
4 trend observed over the past couple of decades. Records from surface sites reveal a plateau from 2000 to 2007 and a resumed increase after 2007 [
8,
9]. Amongst the varied surface sources of CH
4, the largest are natural wetlands, agriculture, livestock, biomass burning, waste, and fossil fuel production; whereas the primary sink is the OH-radical content in the atmosphere [
10,
11]. Various hypotheses have been offered that attempt to attribute the behavior in the global growth rate to a particular component or mechanism [
12,
13,
14,
15], but currently, there is no consensus within the scientific community. Many of these studies have utilized satellite observations of atmospheric CH
4 and have shown the increasing ability of such measurements to characterize global and regional surface CH
4 fluxes [
16].
Greenhouse gases cause environmental and health issues. They cause climate change by trapping heat, which affects flora and fauna. The climate change caused by greenhouse gas emissions also contributes to wildfires, weather, and droughts. In the last decade, CO
2 and CH
4 have increased constantly. Localizing the highest concentrations globally and locally is important to alert particular areas in order to determine solutions through which to reduce the emission of these gases. The pandemic situation caused by COVID-19 forced the world to lock down, and this study and others [
17] show that greenhouse gases did not reduce significantly; therefore, the search for alternatives to these gases is the next step for humanity. Building this scientific understanding to meet the extraordinary climate mitigation challenge requires frequent, robust, transparent, and traceable data sets and methods that can be scrutinized and replicated [
18].
Ground stations, such as TCCON, have been established to accurately measure atmospheric greenhouse gases, such as CO
2, CO, N
2O, and CH
4 [
2,
19]. A significant amount of effort has been expended and measurements of the greenhouse gases CO
2 and CH
4 by TCCON have resulted in an accuracy of 0.25% under clear atmospheric conditions [
20]. However, due to the limited spatial coverage and uneven distribution of TCCON sites, it is not possible to accurately measure CO
2 quantities at subcontinental and regional spatial scales [
21]. The reliability of the results from ground stations needs to be enhanced, while reliable TCCON results are only available in North America and Europe due to a lack of information in South America, Africa, and Antarctica. Studies suggest that satellite observations, with their lower accuracy than ground-based measurements but higher spatial coverage, may help to improve CO
2 measurements [
22,
23,
24]. Current estimates of CO
2 and CH
4 from existing satellite instruments have spatially consistent biases that hinder their use for monitoring carbon–climate feedback [
25]. This paucity of information has hindered the modeling, prediction, and management of air-quality studies.
GOSAT is a Japan Aerospace Exploration Agency (JAXA) mission designed to monitor the CO2 and CH4 on a subcontinental scale more accurately and to assist environmental administrations in evaluating the carbon balance of the land ecosystem and performing assessments of regional emissions and absorptions. By analyzing the GOSAT data, scientists will accumulate new knowledge on the global distribution and temporal variation of greenhouse gases, as well as the global carbon cycle and its influence on the climate. These new findings will be utilized to predict future climate change and assess its impact.
However, GOSAT has experienced many events in past decade. For example, GOSAT has experienced several incidents resulting in instrument anomalies [
26], as follows. In 2014–2015, a solar paddle incident resulted in a temporary instrument shutdown, which caused missing information in December 2014 and January 2015. In 2015 Cryocooler shut down and restarted. In May 2018, there was an incident with and restart of the Command and Data Management System (CDMS). There was a solar-paddle-rotation incident, and a thermal and near-infrared sensor for carbon observation (TANSO) restart, which caused a loss of information, in November 2018. Finally, in May 2020, there was an accelerated zero path difference (ZPD) shift from May 31 until the recovery on June 18. This information was recorded in the report on the GOSAT’s status.
On 23 January 2014, GOSAT/Ibuki had been in orbit for five years. The spacecraft and its payload were operating nominally. With a nominal design life of 5 years and the spacecraft in good health, the mission’s duration was extended (by JAXA, National Institute of Education Sciences (NIES), and Ministry of the Environment (MOE)) for another 4 years [
27,
28]. In September 2013, the first estimates of the global distribution of CO
2 surface fluxes were estimated and published using the total column CO
2 measurements retrieved by the SRON-KIT RemoTeC algorithm from GOSAT. The global source-sink estimates of CO
2 were based on data from over eighteen months, from 1 June 2009 to 1 December 2010.
It is well known that GOSAT L3 products are generated by interpolating, extrapolating, and smoothing the Fourier transform spectrometer (FTS) level 2 column-averaged CO
2 and CH
4 mixing ratios. The GOSAT L3 products still have missing data, even with the processing of L2 products with the kriging interpolation method. This method is limited due to the uncertainty generated by large areas of null information; these areas with a high level of uncertainty are therefore ignored. Given the problem of the loss of relevant information, it is necessary to search for alternative solutions. One potential solution is to apply interpolation on a spatial–temporal matrix of the GOSAT data from 2010 until 2021, to retrieve data using information related to space and time. This methodology can be implemented to obtain a reliable amount of interpolated information to study and anticipate future environmental changes and study their effects in areas that have low levels of information concerning GOSAT L3 product records. The space-based remote sensing of the CO
2 and CH
4 column-averaged dry-air mole fractions XCO
2 and XCH
4 has the potential to provide global observational constraints on CO
2 and CH
4 fluxes across the surface–atmosphere boundary and to offer insights into the related biogeochemical cycles. However, the measurement of XCO
2 and XCH
4 imposes challenging accuracy requirements. The target accuracies for regionally and weekly averaged XCO
2 and XCH
4 are in the order of a few tenths of a percent based on background concentrations of roughly 385 ppm and 1.8 ppm, respectively, and the requirement for XCH
4 is less stringent than for XCO
2 [
29].
Previous studies applying the EOF algorithm to GOSAT products, such as [
30], conclude that the implementation of the EOF-based algorithm for XCO
2 retrievals from GOSAT observations should be considered, and the development of very fast XCO
2 retrieval algorithms to process the huge amounts of current and future satellite observation data remains of interest [
26]. However, separating the relative importance of each factor is often complicated, as some of the influencing factors are interdependent due to scale dependence and other factors. It is important to note that this study should be conducted comprehensively, as it is necessary to analyze more data related to the XCO
2 and XCH
4 values from the satellite, ground stations, and even climate models, since the values obtained in this study are the products of spatial–temporal interpolation, with a high confidence value, of only the pixels covering the areas where the TCCON ground stations were installed. Several methodologies can be applied to the GOSAT L3 dataset, such as the interpolation of data based on a harmonic trend of each pixel in a time series, but it is important to emphasize that not at all of these methodologies use spatial and temporal information to interpolate data. Therefore, future studies related to this methodology will require the analysis of several databases to improve the reliability of the results.
The objectives of this study are to: (1) evaluate the spatial–temporal patterns of greenhouse gases based on the EOF-GOSAT L3 datasets; (2) analyze the feasibility of the EOF-based algorithm applied to the dataset; and (3) provide a possible approach to integrating an additional processing step into the GOSAT L3 products.
2. Materials and Methods
It is generally known that the Fourier-transform spectrometer–shortwave infrared (FTS-SWIR) Level 3 data products are constructed monthly by interpolating, extrapolating, and smoothing the FTS SWIR Level 2 column-averaged CO2 and CH4 mixing ratios. Kriging, a geostatistical calculating approach, is used in L2 products to obtain L3 products. The data are divided into 2.5-degree cells (GOSAT webpage). The standard error is stored in L3 products and almost all missing information is located in the South and North poles. Due to this problem, a series of stages are developed to obtain missing information. (1) The EOF technique is used to fill in missing data from geophysical fields in image reconstruction due to missing information in GOSAT L3 deliverables. (2) Following image reconstruction, correlation analysis utilizing kernel plots is used to evaluate in situ stations with reconstructed images. Next, the temporal and spatial analysis of CO2 and CH4 is assessed, with the most heavily affected places identified and their growth rates indicated.
2.1. Study Area
Due to the variety of climates, types of vegetation cover, and human activity intensity around the world, it is difficult to derive CO2 concentrations using a single metric. To increase the derived accuracy of the CO2 concentration, we divided the world into six regions, according to the following continents: Africa, Asia, Australia, Europa, North America, and South America. The Antarctic continent was removed from this analysis due to the missing GOSAT information. Moreover, the TCCON project does not have in situ stations in this region and the interpolated results are not sufficient to corroborate the results. For each continent, we focus on two greenhouse gas concentrations (CO2 and CH4).
2.2. Data Collection
Two datasets were obtained. GOSAT satellite image data (which are freely available) from January 2010 to May 2021 were downloaded from GOSAT Data Archive Service (GDAS) website. These global data were collected under cloud-free conditions for estimating column-averaged dry-air mole fractions of major greenhouse gases, such as CO2 and methane. TCCON data were also collected. Both datasets are described in the following sections.
2.2.1. GOSAT
The main role of the GOSAT project is to estimate emissions and absorptions of the greenhouse gases on a subcontinental scale and to help ecological organizations to assess the carbon equilibrium of the land biological system and make appraisals of provincial outflows and retentions. GOSAT orbits at an altitude of approximately 666 km, with a 10.5-km spatial resolution and a three-day temporal resolution [
29]. The observation instrument on GOSAT is the thermal and near infrared sensor for carbon observation (TANSO), which is composed of two subunits: the Fourier-transform spectrometer (FTS) and the Cloud and Aerosol Imager (CAI). Thermal and near-infrared sensor for carbon observation–Fourier transform Spectrometer (TANSO-FTS) operates with spectral resolution in three narrow bands in the short-wavelength infrared (SWIR) region (0.76, 1.6, and 2.0 µm) and a wide thermal infrared band (5.5–14.3 µm). Thermal and near-infrared sensor for carbon observation–Cloud and Aerosol Imager (TANSO-CAI) operates with spectral resolution in four narrow bands in the near-ultraviolet-to-near-infrared region (0.38, 0.674, 0.87, and 1.6 µm). TANSO can detect optically thick clouds inside the TANSO-FTS instantaneous field of view (IFOV) and correct the effect of aerosols in the TANSO-FTS spectrum data [
24,
28,
31].
This study used the FTS SWIR Level 3 data products generated from 1 January 2010 to 31 May 2021, freely downloaded from the GOSAT Data Archive Service (GDAS), which was collected under cloud-free conditions for estimating column-averaged dry-air-mole fractions of major greenhouse gases, such as CO2 and methane. GOSAT Level 2 does not have data for January 2015, and GOSAT Level 3 does not have data for June and December 2014 or January and September 2015.
2.2.2. TCCON
The TCCON is a worldwide observation system of ground-based Fourier transform spectrometers (FTSs) that records direct solar spectra in near-infrared. It is associated with the network for the GAW program and the Detection of Atmospheric Composition Change Infrared Working Group (NDACC-IRWG) [
2]. It is a ground-based network of FTSs designed to retrieve precise and accurate column abundances of CO
2, CH
4, N
2O, and CO from near-infrared (NIR) solar absorption spectra. It provides accurate measurements of studied greenhouses (CO
2 and CH
4) at more than a dozen operational sites worldwide. The sites are generally located at low altitudes, where the biosphere/ocean exchange has the most impact on the atmospheric concentrations [
32]. The GGG2014 TCCON [
33] data used in this study can be obtained from the TCCON Data Archive (
http://tccon.ornl.gov/ (accessed on 15 January 2022)) [
34], and the data, provided by the Carbon Dioxide Information Analysis Center (CDIAC), range from 2004 in some stations until 2020. The precision of the latest version has been improved by comparing it with that of GGG2014 by correcting laser-sampling errors and adding more aircraft and AirCore profiles as bias correction data [
35].
TCCON observations are retrieved to provide a long-term, almost continuous time-series to assist vertical verification as a transfer standard between in situ measurements and satellite observations and to help better understand carbon-cycle processes [
36]. The network shares methodologies, technical issues, and membership with the NDACC FTIR Working Group. The network aims to provide temporally dense, globally consistent data coverage network-wide by using a common retrieval technique. The retrieved columns are tied to the ground-based in situ networks by scaling to (in situ) balloon and aircraft profiles [
37].
As shown in
Figure 1, all of the TCCON stations are represented with blue points, and almost all of the stations are located in the northern hemisphere, especially in developed countries. On the other hand, the developing countries do not have sufficient information, and the Antarctica region has many empty gaps in GOSAT L3 product information. Therefore, the results from this region were excluded, since they are the results of interpolation without corroboration.
The total error for a single measurement of XCO
2 at the Lamont site is 0.2 percent or less for SZAs less than 83° [
37]. The largest errors are from instrument alignment errors, assuming a linear spectral continuum across a large spectral band, and a priori profile uncertainties.
In
Figure 1, all the locations that are part of the in-situ stations of the TCCON network are visible, and
Table 1, presents all the coordinates and the names of their respective in situ stations. Furthermore, we estimated the R-squared and b linear slope in order to analyze the variability of results of each in situ station.
2.3. Data Processing
The ideal TCCON–satellite data pair should consist of measurements at the same place during the same time. However, to find a sufficient number of co-located measurements to enable a robust statistical analysis, several spatial–temporal criteria were used in previous validations. Therefore, the statistical analyses were based on the individual data pairs or daily averaged data pairs, and all data pairs were assumed to be of equal weight in this study.
The EOF algorithm was applied to acquire missing greenhouse gas information in GOSAT FTS SWIR Level 3 data. Next, a monthly global mapping of XCO2 and XCH4 was generated based on the reconstructed images, which were validated with TCCON data, as well as density scatter plots to compare the results.
The EOF technique was used to examine the trend of these greenhouse gases over the previous ten years, since CO
2 readings are more consistent than CH
4 values. The temporal and spatial means of the data were eliminated before the original data set was placed in an n-dimensional spatial–temporal matrix. Next, the first EOF mode was calculated using the singular value decomposition (SVD) technique, which was used to infer a new estimate for the missing data. This procedure was repeated until convergence was obtained for the values given to the missing data with the first EOF mode [
27]. Finally, a few charts, such as Hovmöller, power wavelet spectrum, time-series analysis, and decomposition, are shown in
Section 3 to represent temporal variation. The spatial analysis, on the other hand, was organized by continent. Despite this, fewer coherence results for the continent analysis were reported in Antarctica due to the limited information provided by GOSAT; they could not be compared to those of any of the TCCON stations because the network of ground in situ stations did not install a climate observatory in this region.
2.4. Data Interpolation
The geostatistical mapping method applied in this study is based on the EOF algorithm used to fill empty gaps using temporal data, this algorithm has been developed at the Geo-Hydrodynamics and Environmental Research (GHER) [
38].
Concerning spatial resolution, the L3 product was generated for meshes with dimensions of 2.5° in both latitude and longitude. This grid size seems reasonable when considering the GOSAT lattice observation distances and the present rate at which FTS SWIR L2 data are retrieved [
39].
While all interpolation methods have a degree of unreliability, the EOF algorithm exhibits some major advantages compared with many others [
40], including the minimization of errors from iterative processing, parameter-free processing, and speed.
A detailed description of the EOF processing is presented in [
41], and the libraries and repositories to use are available on GitHub and the Comprehensive R Archive Network (CRAN). EOF algorithm is a process that fills gaps in data fields by repeatedly decomposing them using SVD until the optimal answer when compared to a set of reference values (non-gaps) is discovered. This is accomplished by gradually including more EOFs into the gappy location reconstruction until the error minimization converges. We first show the approach using a synthetic example (
Figure 2), in which: (1) a data set is constructed, (2) noise is introduced (based on a noise/signal setting), (3) gaps are made (based on a fraction of gappiness setting), and, lastly, the gaps are interpolated using the DINEOF method.
Figure 3 depicts the iterations used to fill in the gaps as the number of EOFs increases. Using the first six EOFs, an optimal solution was found, whereas adding a seventh EOF did not enhance the root mean squared error (RMSE) [
42].
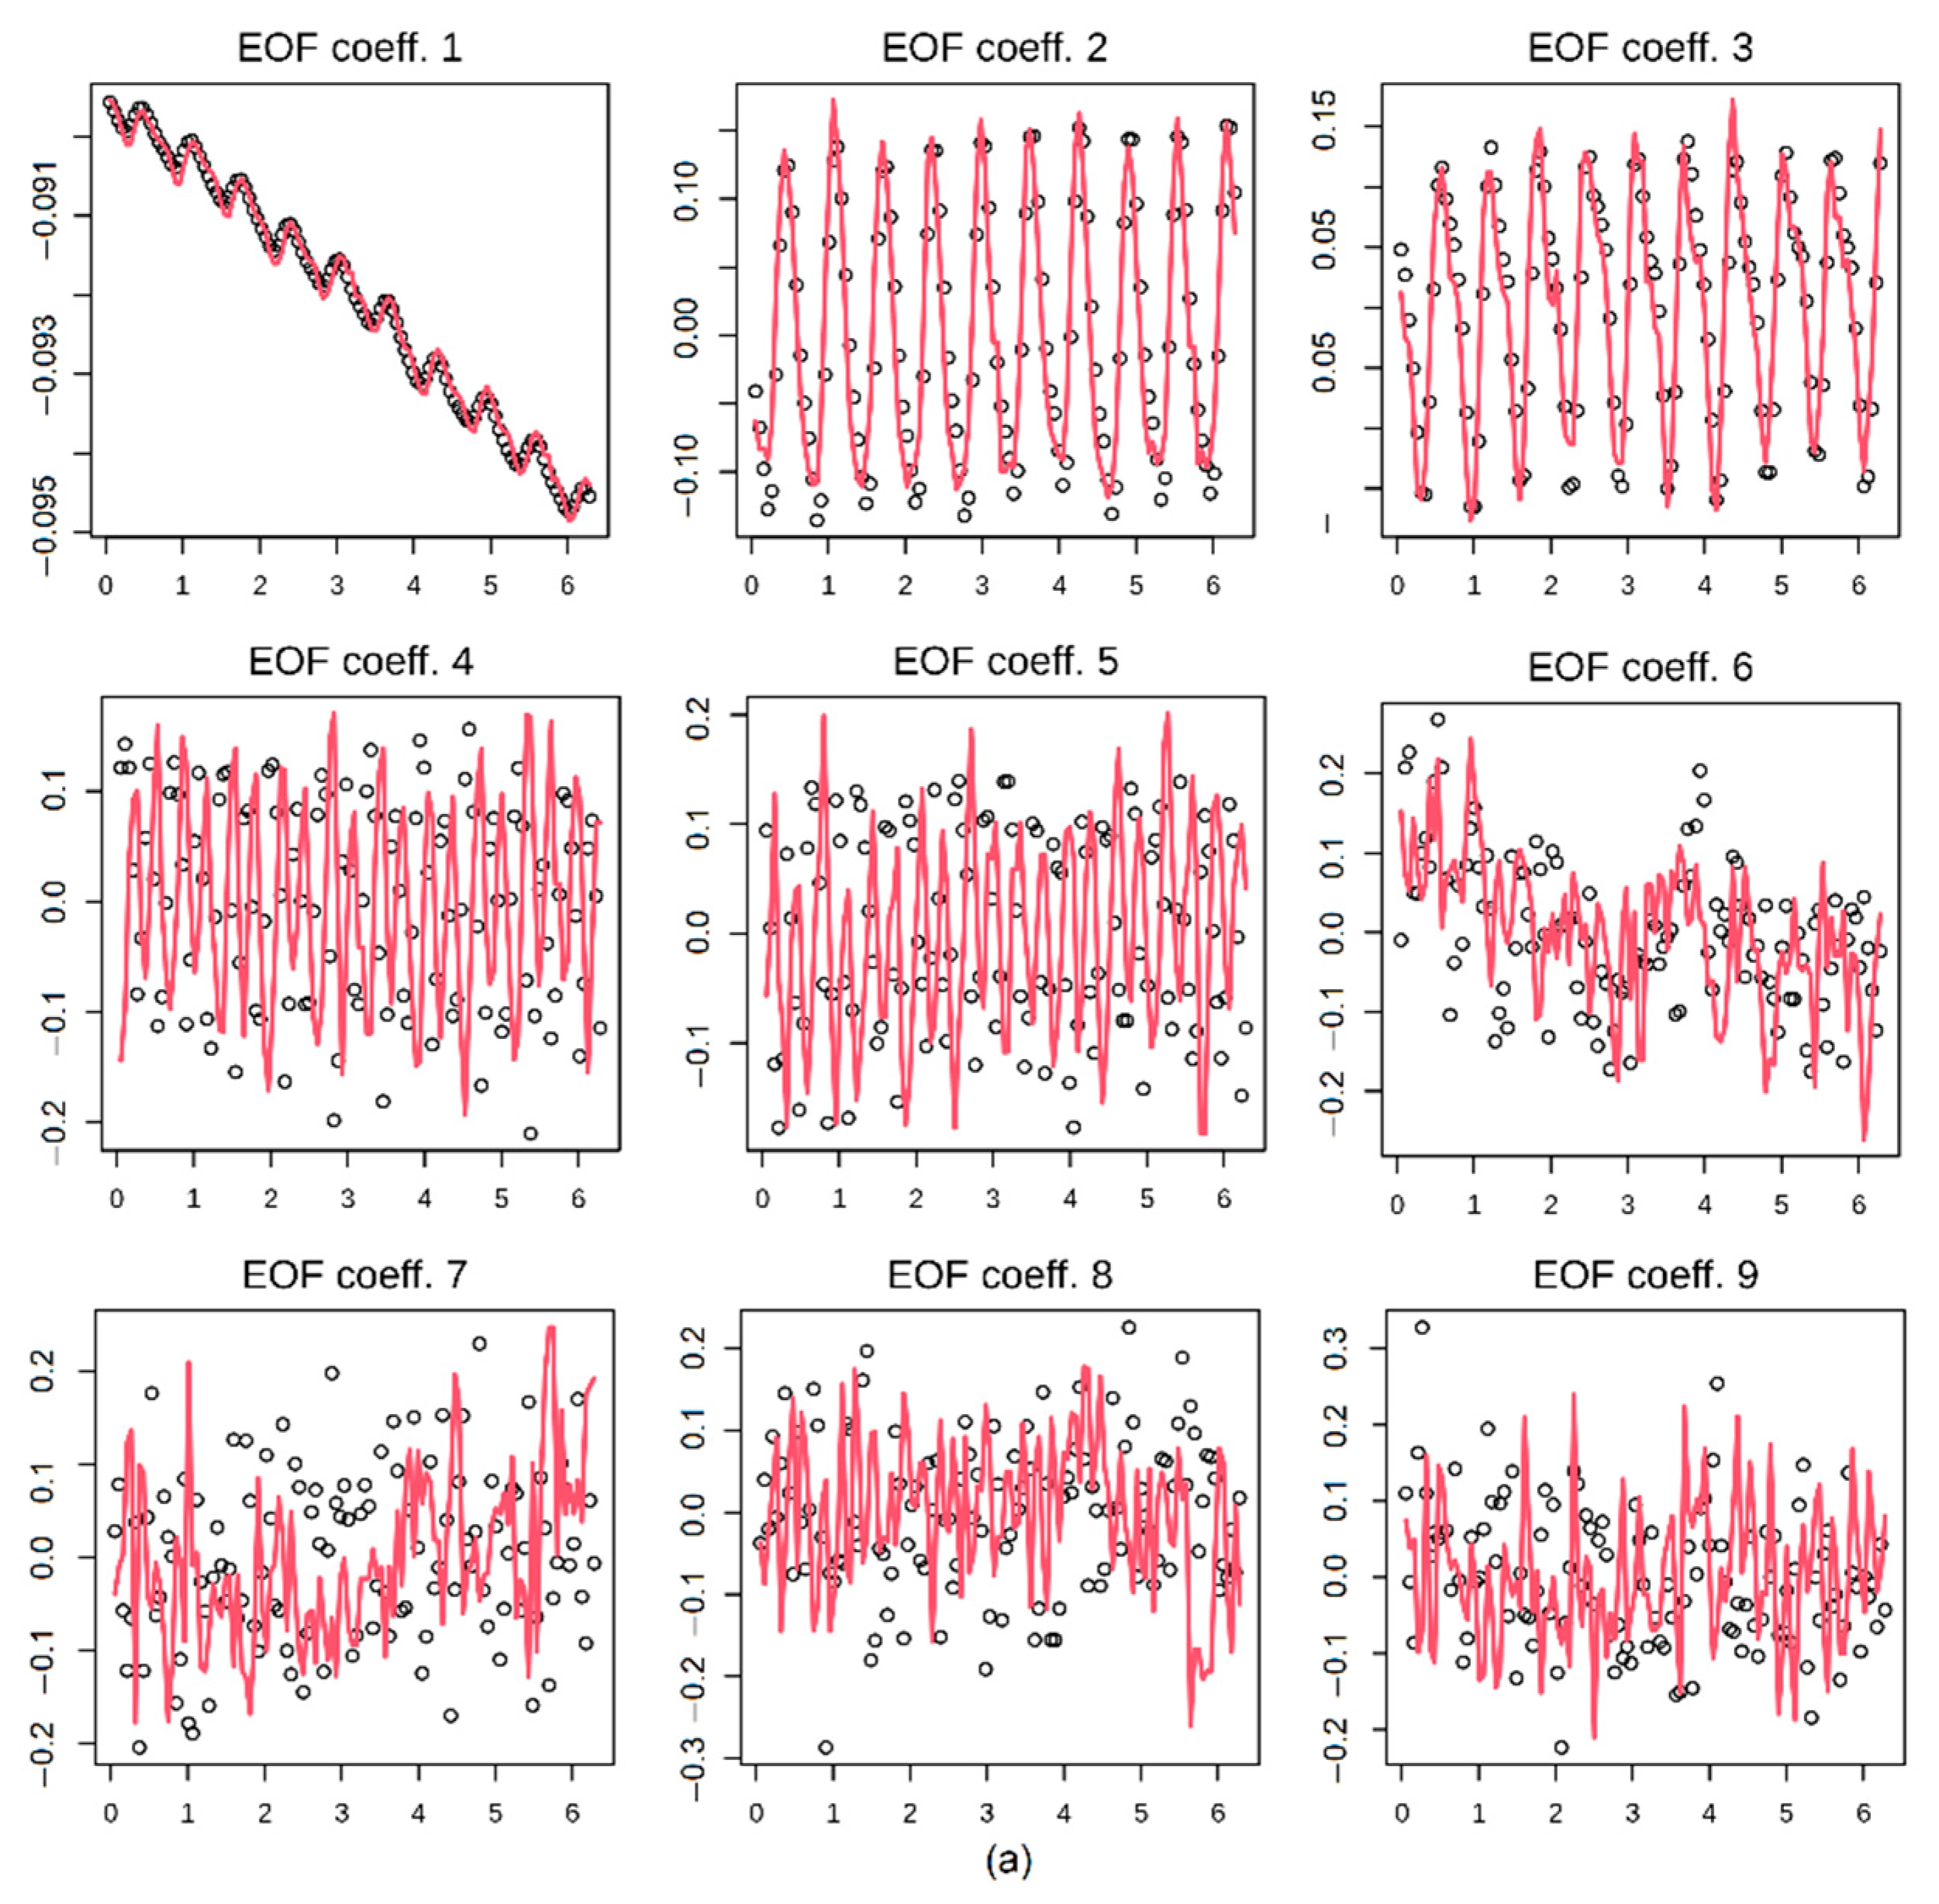
Nine mixed signals were used in the synthetic example. The EOFs of the “true” field (black points) and the optimum solution of the gappy data are shown in
Figure 4 (red lines).
The comparison of TCCON and GOSAT XCO
2 data was based on the same spatially resolved mean monthly data set. The monthly global distributions of TCCON XCO
2 (2.5° × 2.5°) were reproduced based on GOSAT Level 3 SWIR products. The reconstructed monthly global distributions of TCCON XCO
2 were generated by averaging all measurements in each grid corresponding to the in-situ stations for each month. We mainly used the GOSAT SWIR Level 3 products because the spatial coverage of the reconstructed GOSAT Level 2 global monthly XCO
2 distributions (using the same method as TCCON) was smaller than that of the L3 products, as shown in
Figure 2. Moreover, the spatial coverage of GOSAT Level 3 XCO
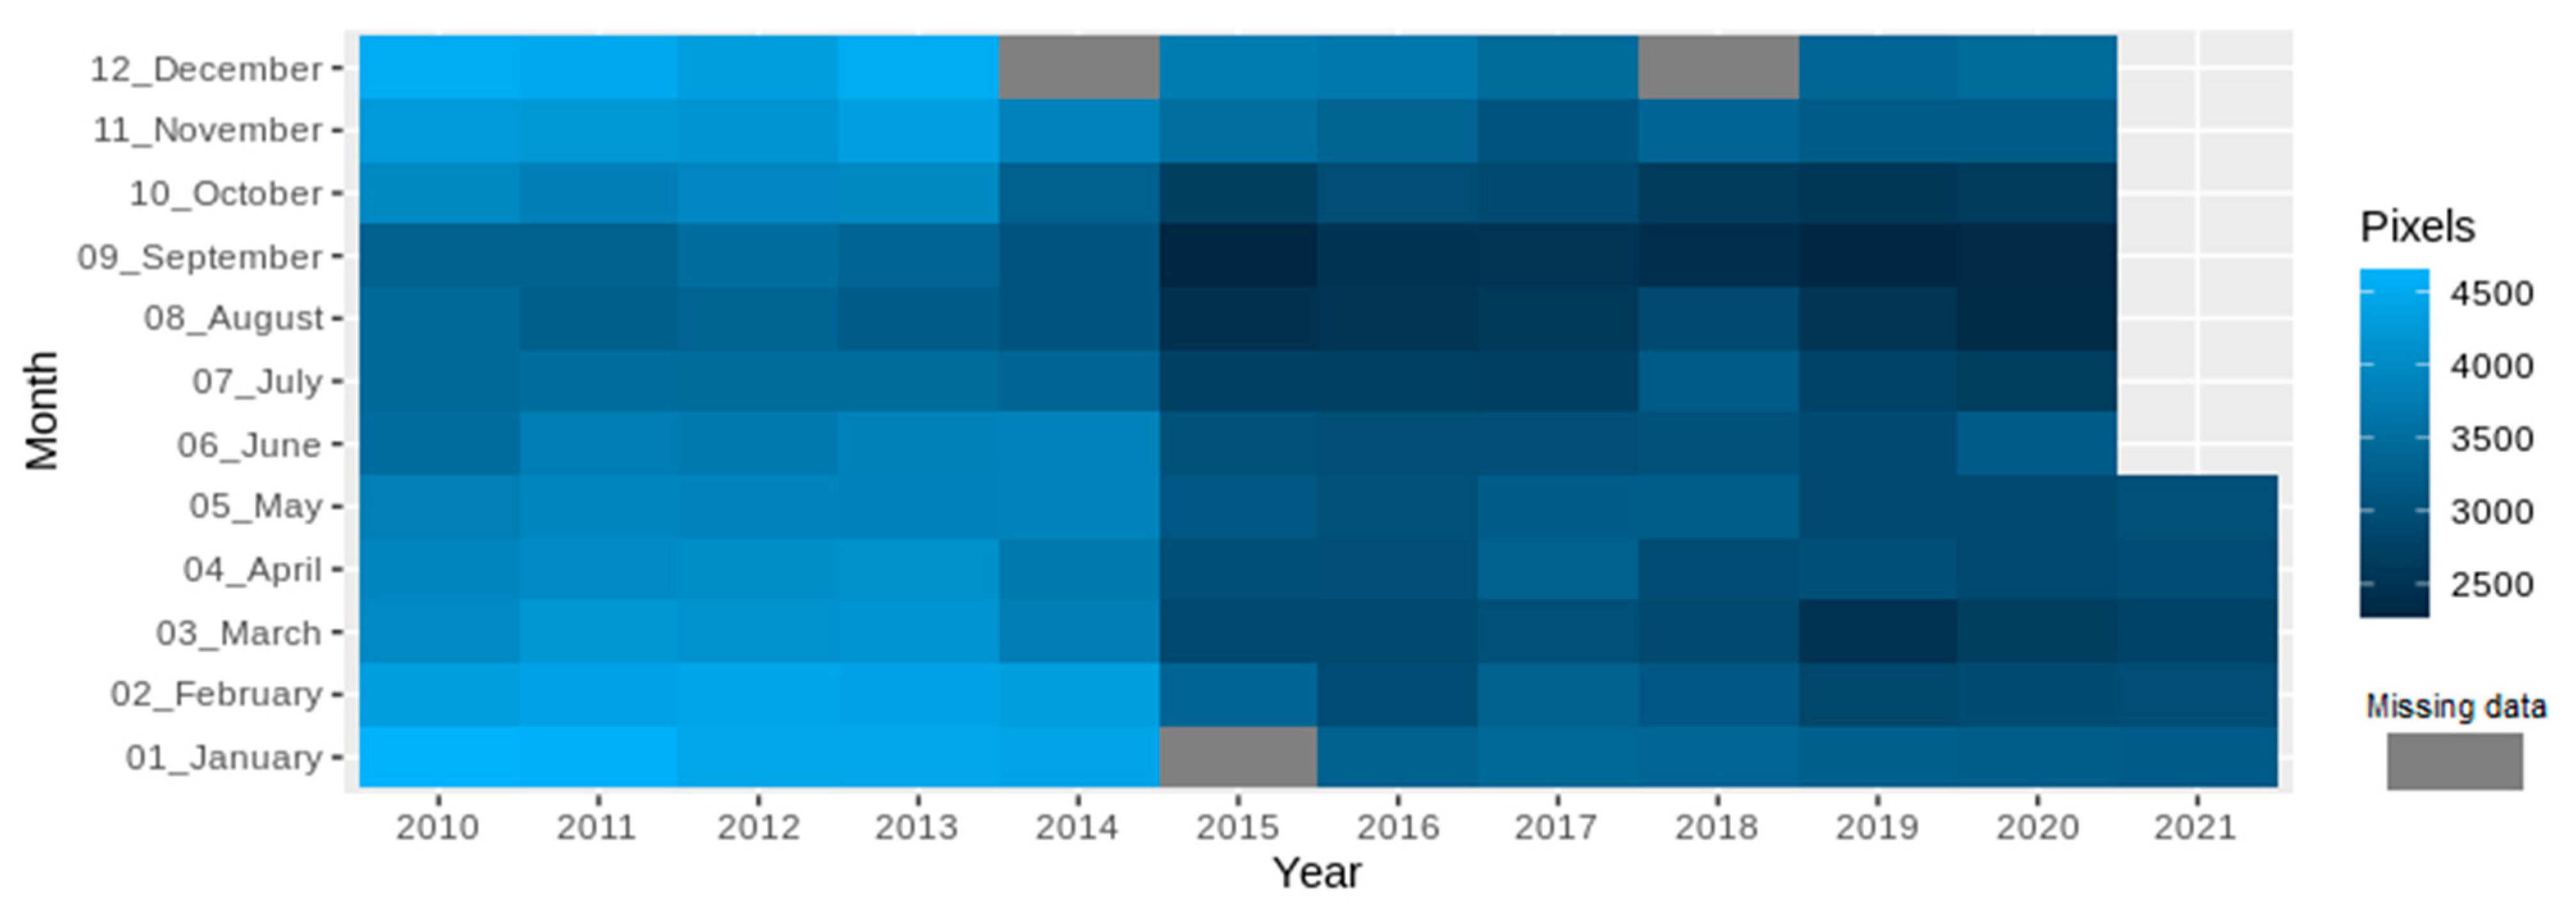
2 when applying the EOF algorithm increased in the number of pixels, as can be seen in
Figure 5, where each pixel has 2.5 × 2.5 grid degrees as a unit. As can be seen, the number of pixels increased from 2500 to approximately 3500 approximately from 2015, which indicates that the number of pixels with missing information has increased in GOSAT L3 products since 2015, and the months with a high amount of information correspond to July to October in almost every year. It is important to note the total number of pixels in each month layer that is equal to 10,368 pixels; in some cases, the number of reconstructed pixels is approximately 4500, especially for the 2010–2014 layers.
3. Results and Discussion
Three analyses are evaluated in this study. First of all, the GOSAT data validation is presented and discussed in
Section 3.1. Next, the data validation is evaluated, comparing the GOSAT interpolated results and the TCCON data; this analysis is discussed in
Section 3.2. Finally, the temporal and spatial analysis is assessed in
Section 3.3 and
Section 3.4.
3.1. Data Validation
We directly compared the monthly mean values of the TCCON in situ station measurements with the L3 products of the GOSAT interpolated data using the EOF algorithm of the XCO
2 and XCH
4 data in this study. To obtain the GOSAT data, we subtracted the temporal variation in the pixel of each station from the stack raster reconstructed data, as shown in
Table 2.
TCCON and GOSAT have different a priori profiles and averaging kernels, which describe the sensitivity of a retrieval algorithm to the true state throughout the atmosphere [
33,
34]. Recent research has demonstrated that the effect of column averaging kernels on GOSAT XCO
2 is relatively negligible when compared with its measurement accuracy, and direct comparison is applicable in the validation of satellite measurements [
4,
35].
To obtain the results of the validation with TCCON data with GOSAT data, we used the in situ information from 31 stations within the data validation analysis. The time range and geolocation are presented in
Table 2, as are the results of the linear fit (linear correlation coefficient k and R-squared coefficient) between the GOSAT L3 XCO
2 and XCH
4 measurements with the application of the EOF algorithm and the TCCON data in each location.
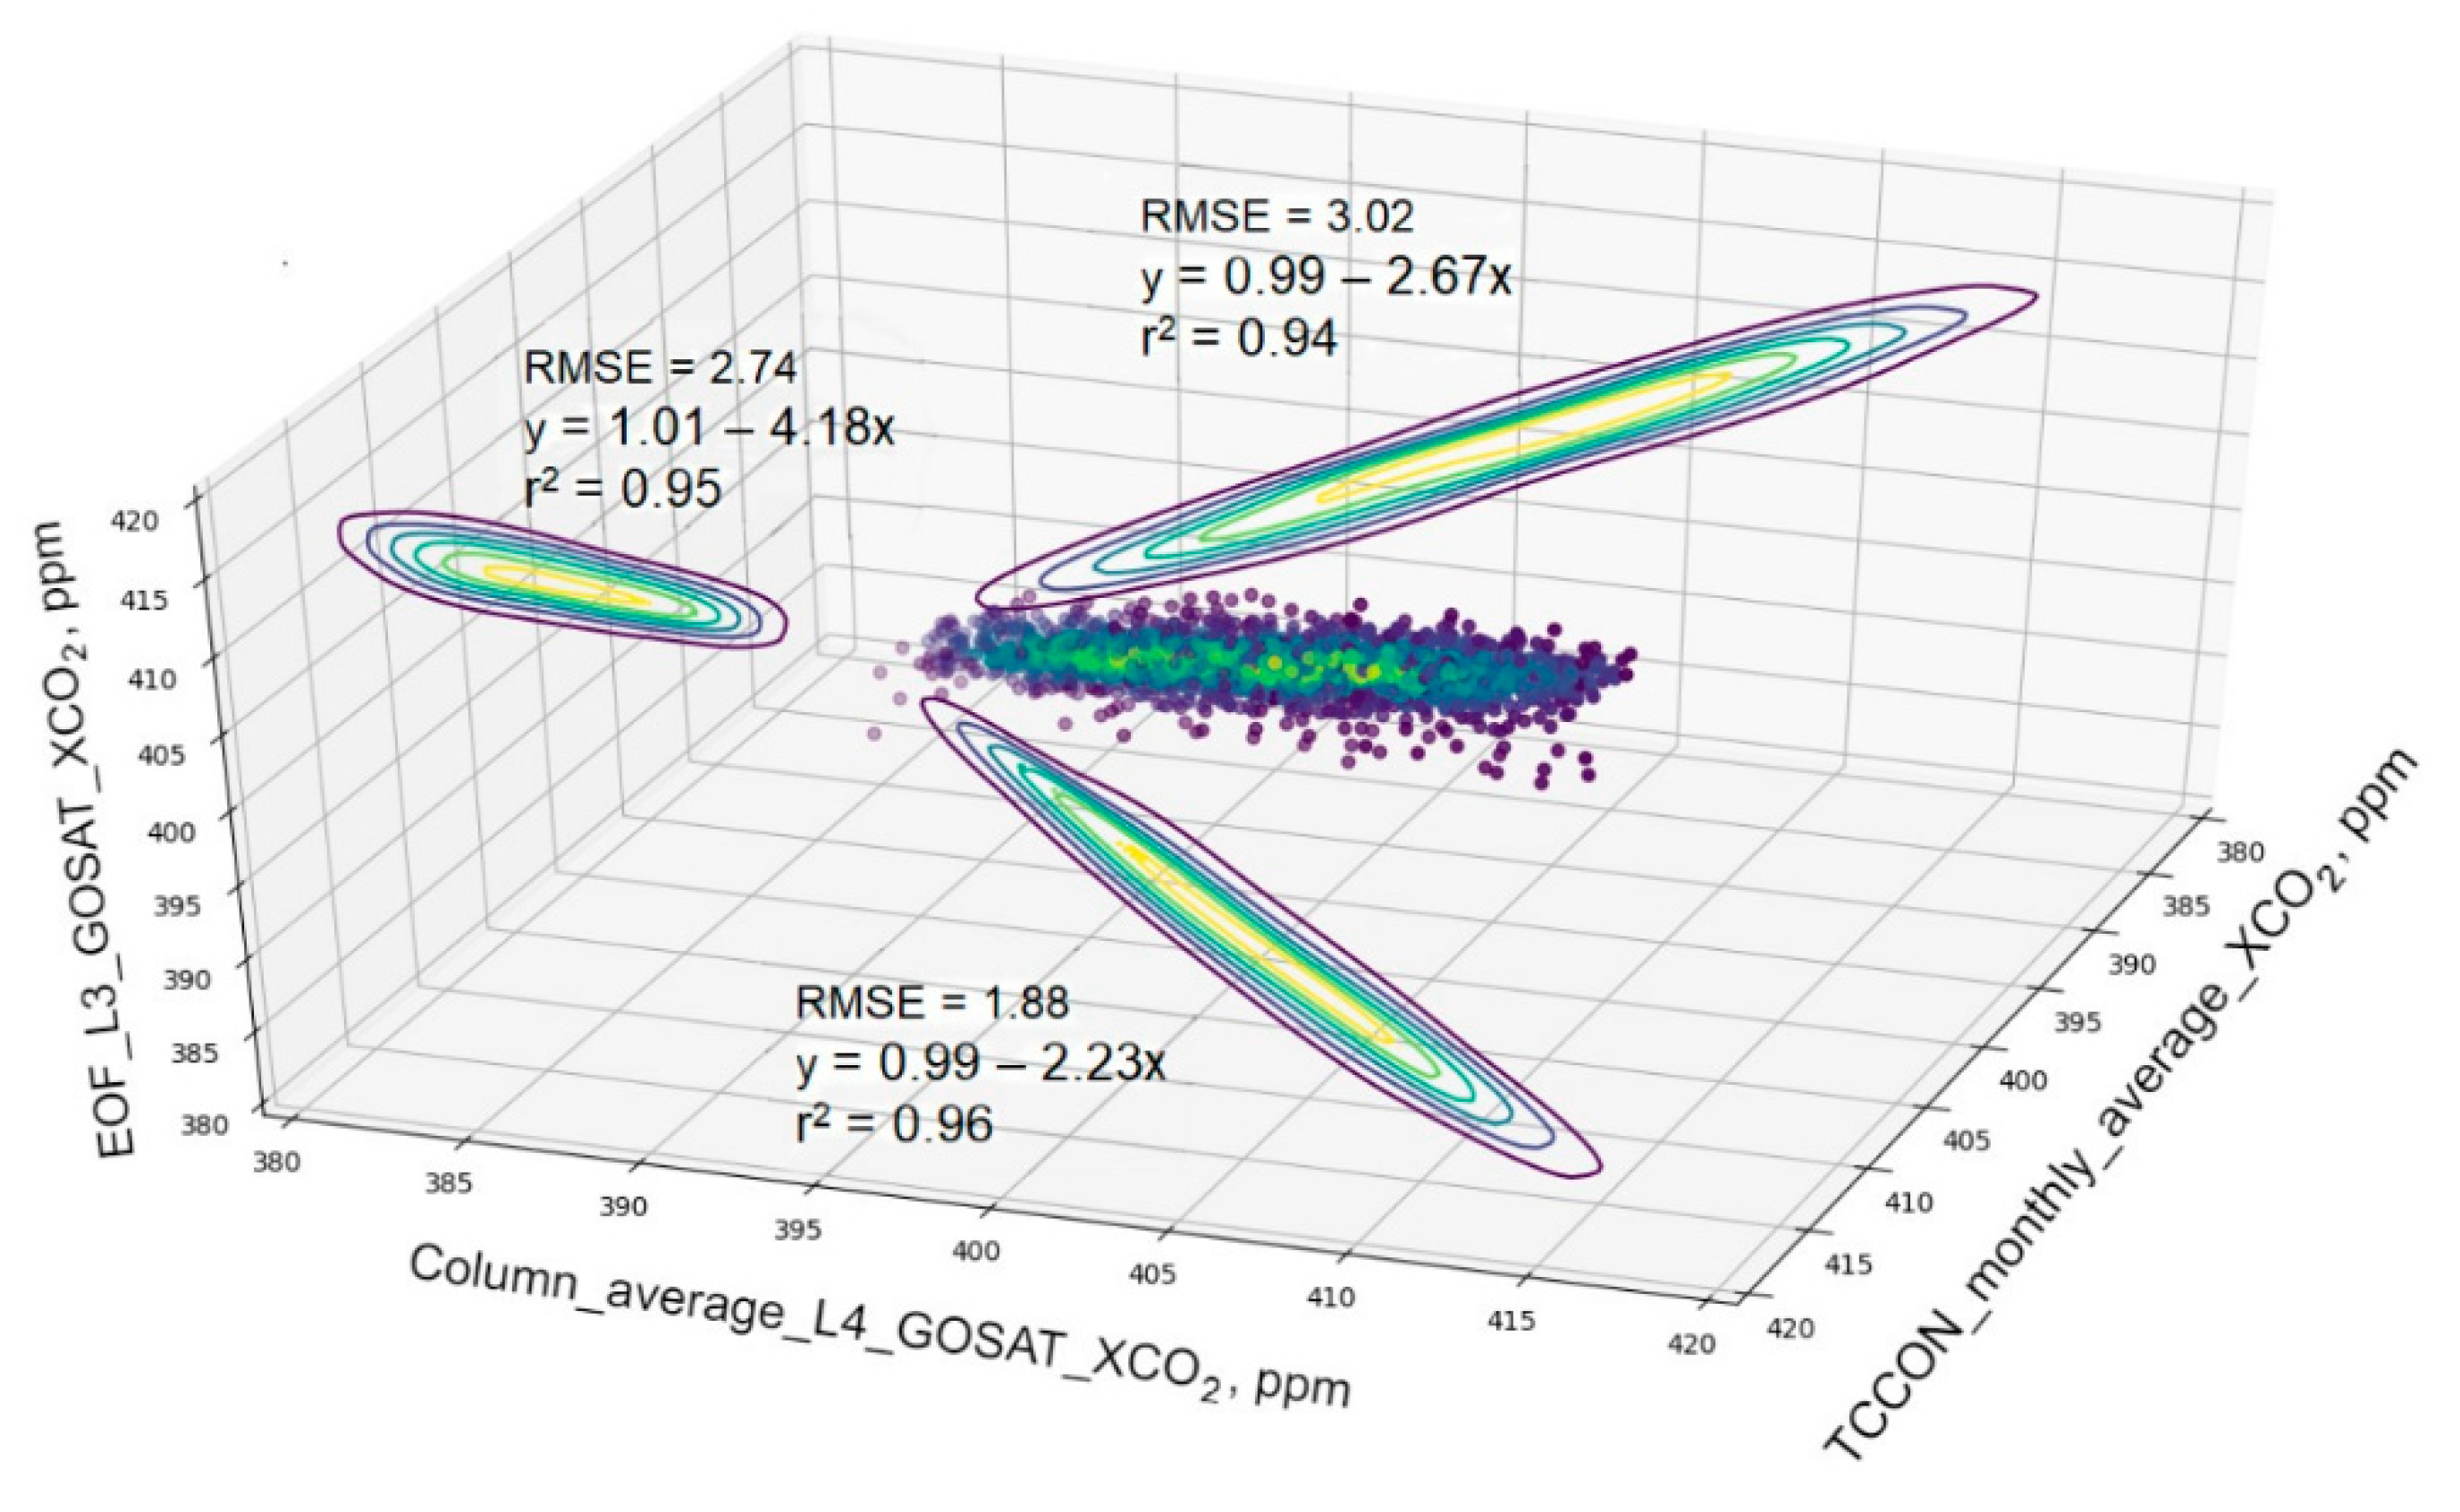
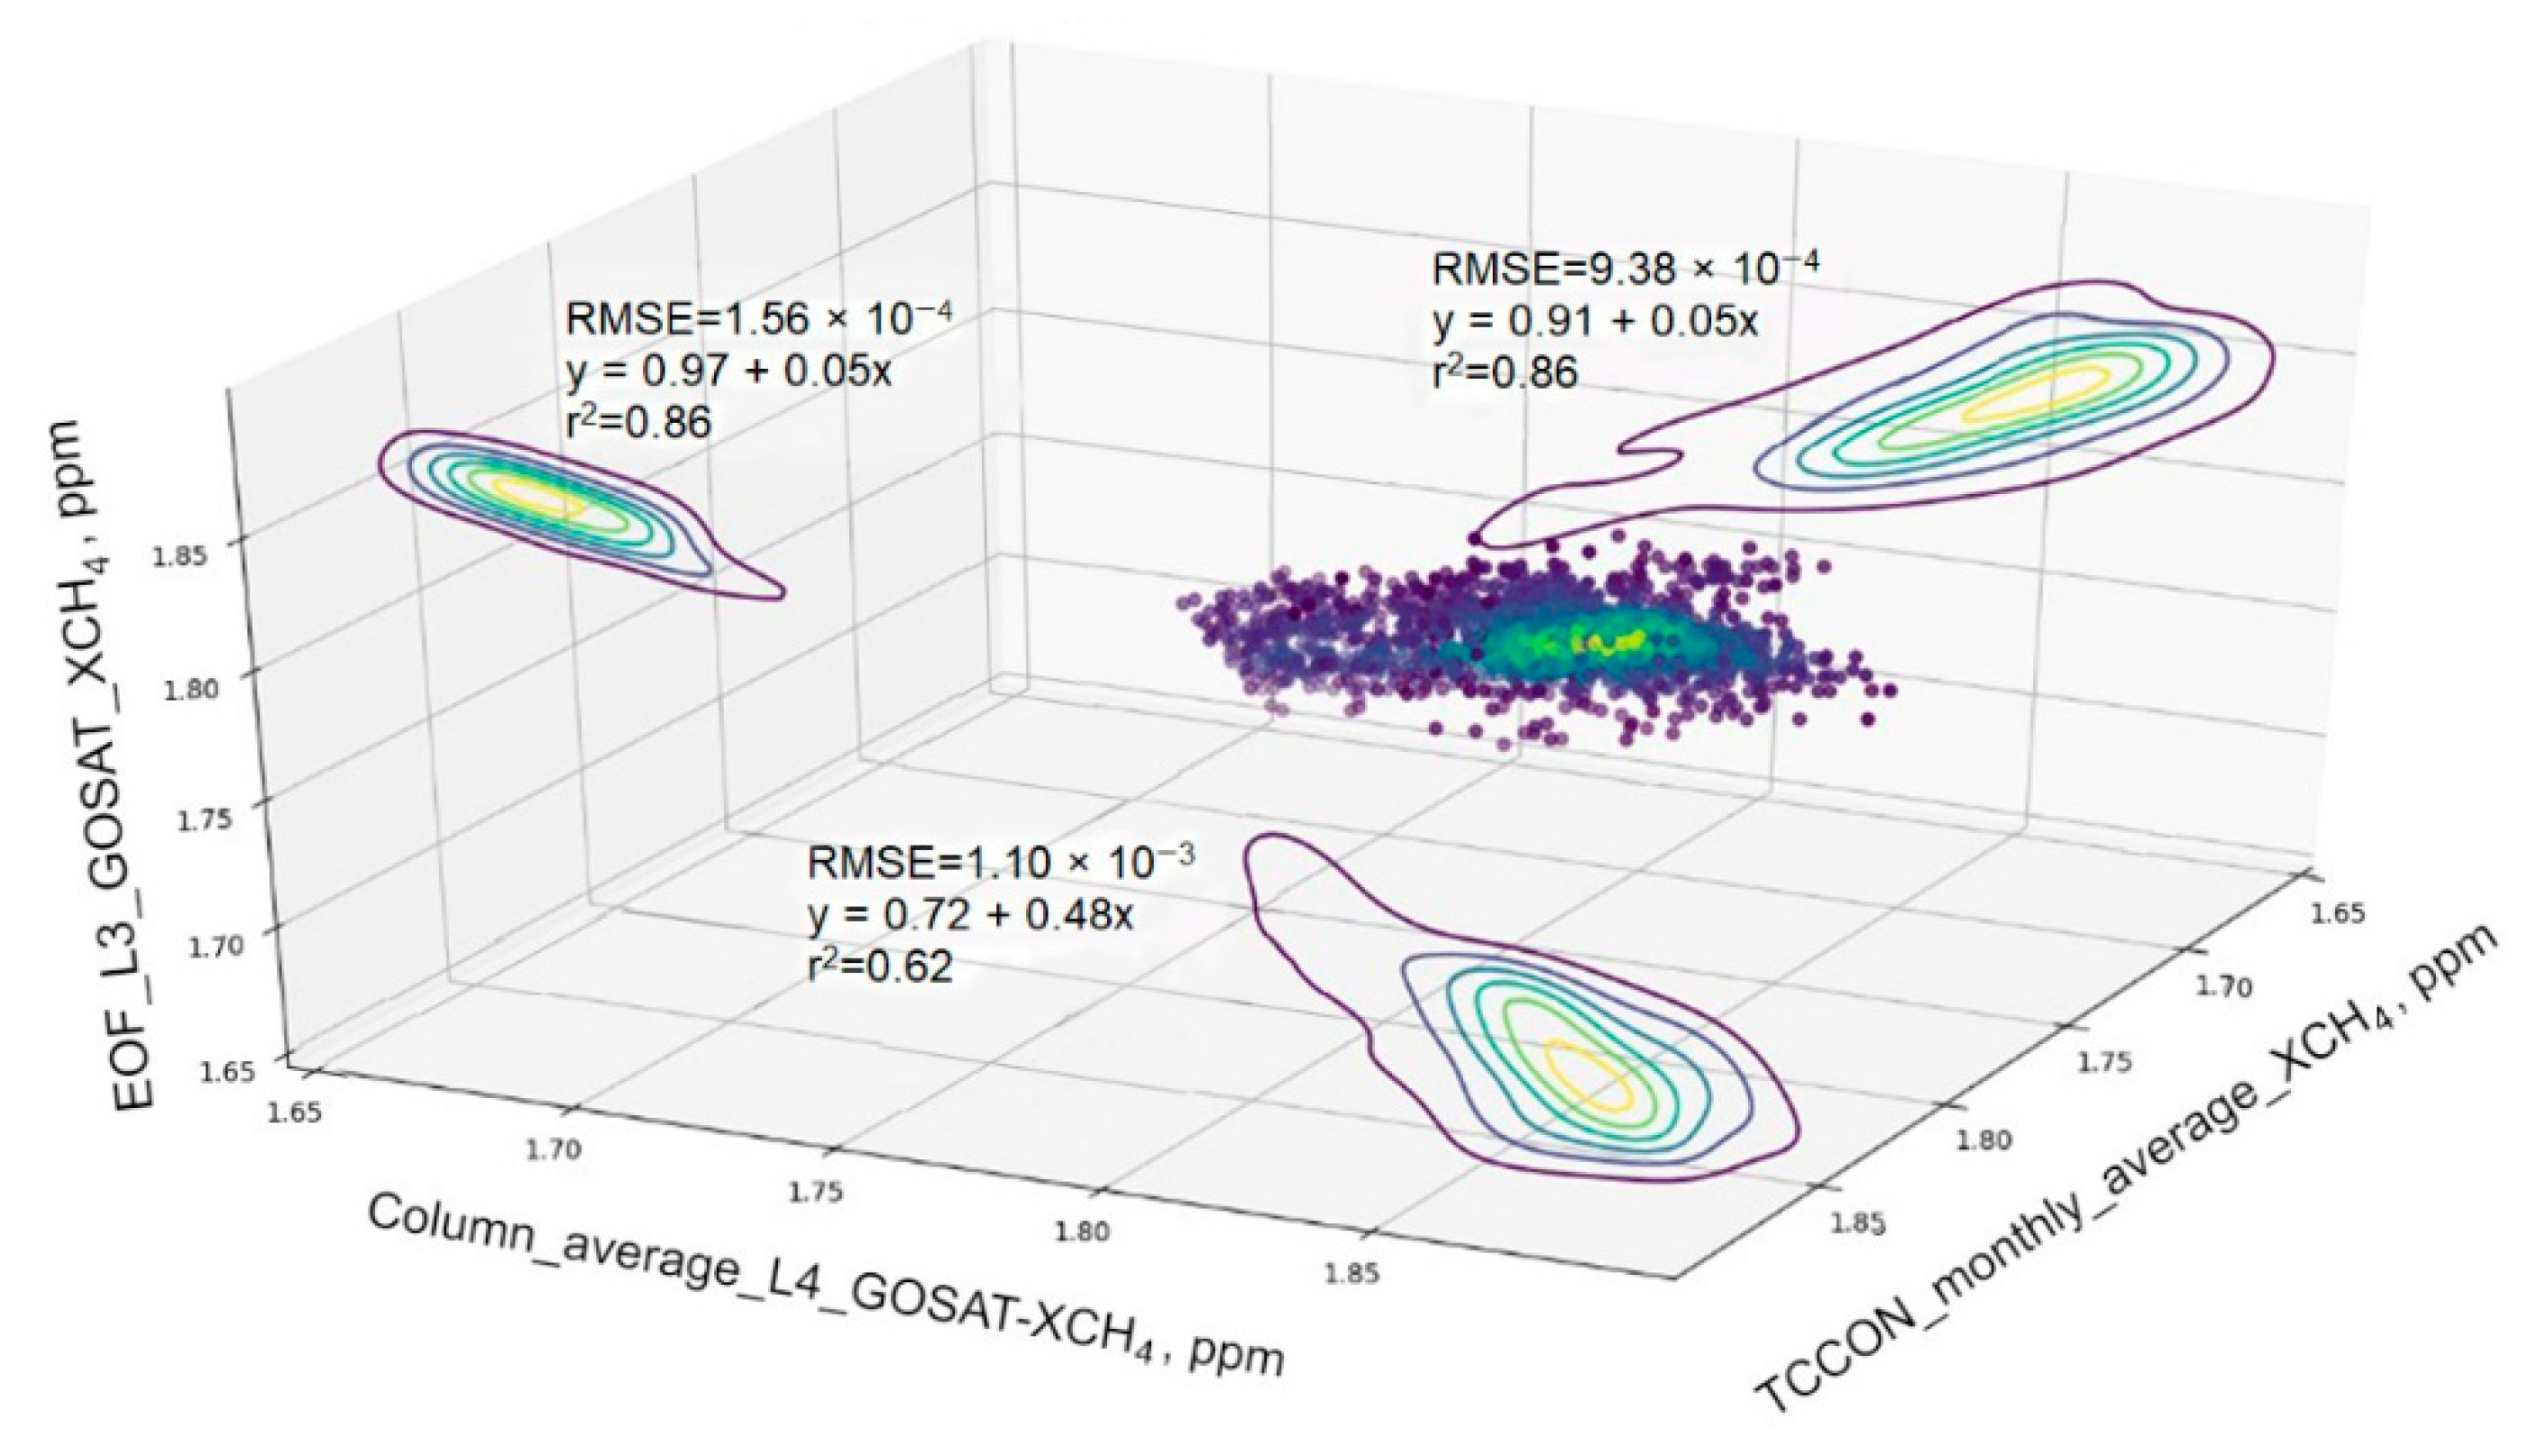
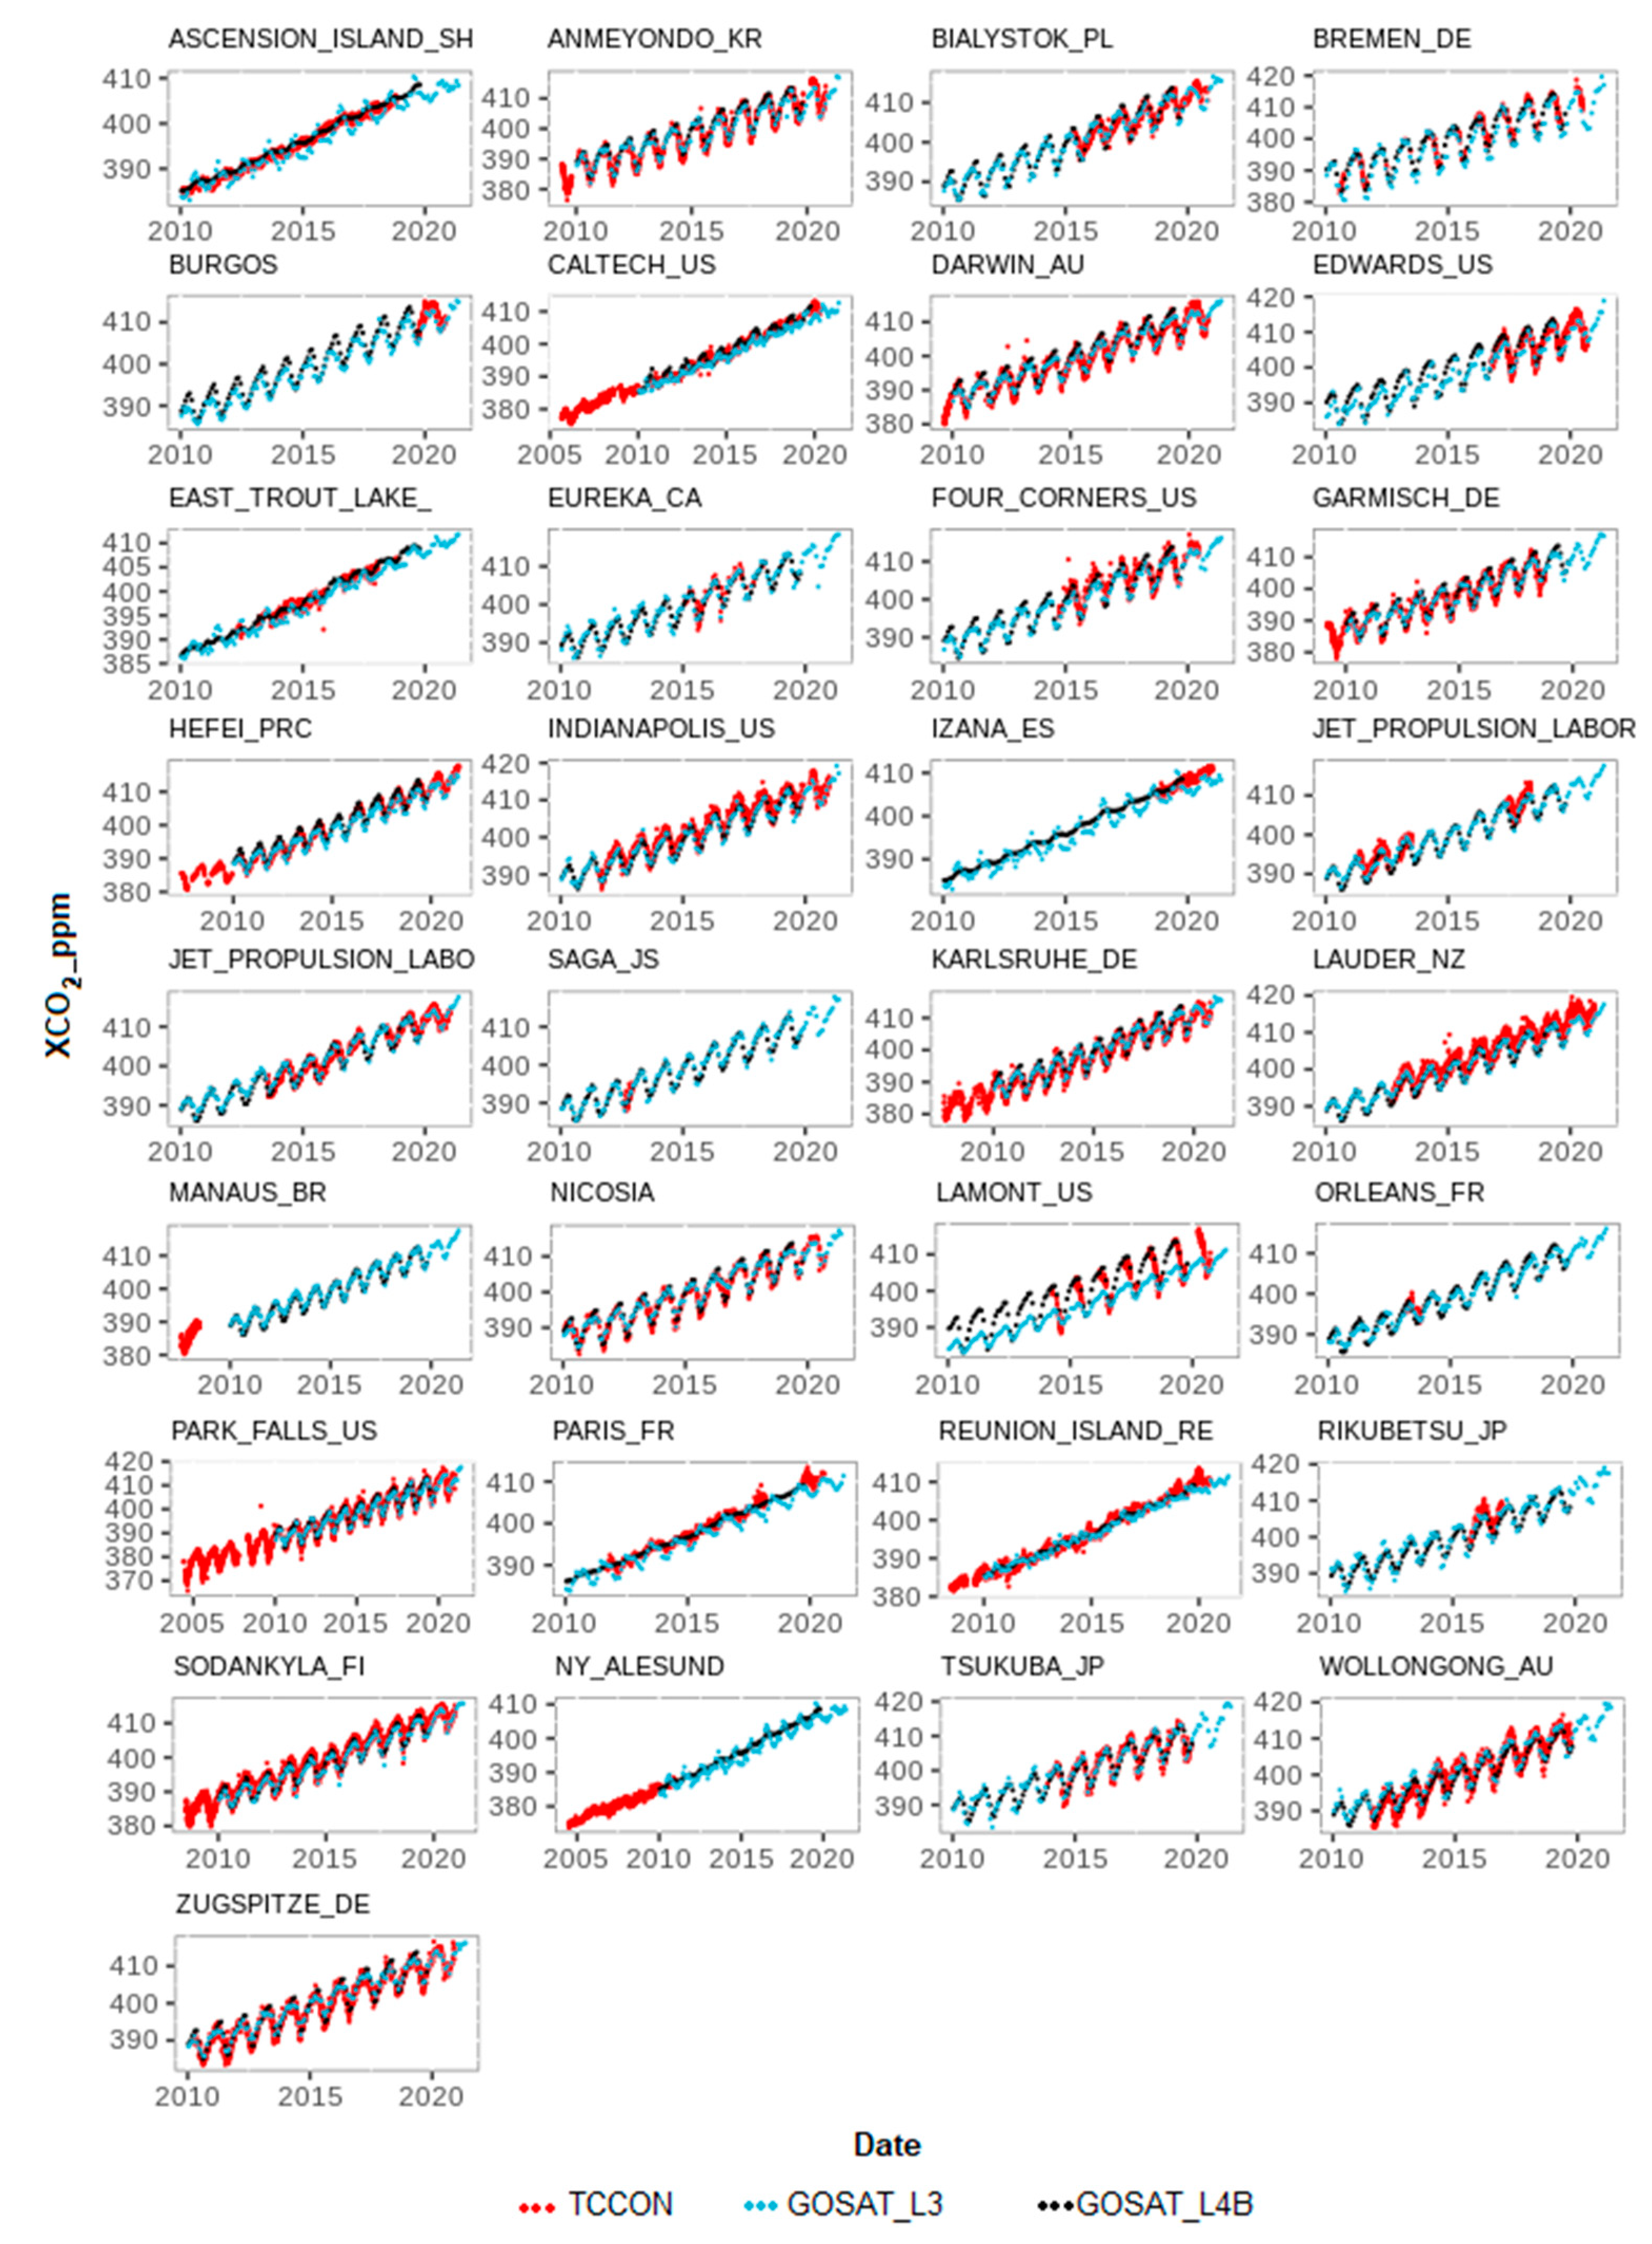
Figure 6 shows the same statistics on the GOSAT measurements as
Figure 7, which compares the data of the TCCON GGG2020, GOSAT L3, and GOSAT L4B column averages of XCO
2 and XCH
4.
Figure 6 shows the data correlation results. The RMSE value for the GOSAT L3 and TCCON was 2.74, and the R-squared value was 0.95. The RMSE for the GOSAT L4 and TCCON was 1.88, and the R-squared was 0.96. The RMSE for the GOSAT L3 and GOSAT L4 was 3.02, and the R-squared was 0.94. This allows a comparison of the results of the application of the EOF algorithm on the L3 products with the TCCON station records. On the other hand,
Figure 7 shows the same comparison, of the results of the application of the EOF algorithm with the TCCON records. The RMSE value for the GOSAT L3 and TCCON was 1.56 × 10
−4, and the R-squared was 0.86. The RMSE for the GOSAT L4 and TCCON was 1.10 × 10
−3, and the R-squared was 0.62. The RMSE for the GOSAT L3 and GOSAT L4 was 9.38 × 10
−4, and the R-squared was 0.86. Other secondary comparison parameters between the average column results of the GOSAT L4B and TCCON products are visible in
Figure 6 and
Figure 7.
The TCCON network comprises ground-based high-resolution Fourier-transform spectrometers that perform direct measurements of solar spectra in near-infrared. There are currently 27 operational sites located across North America, Europe, Asia, and Australia. Only one station in South America is registered, and it only contains information from 2015. Some other stations are in the same situation, including “Alesund”, “Izana”, “Manaus”, “Indianapolis”, “Saga”, “Rikubetsu”, “Lauder”, “Orleans”, which only contain a low quantity of data that can be used to compare ground station measurements with satellite data. In this study, the data from 31 stations were compared with the GOSAT data; the total number of training points was 2602, to assess the density scatter plots. We reduced the TCCON information, obtaining the average value of each month, to compare with the monthly information from the GOSAT. The TCCON stations have many time ranges without values because the stations are not currently operating. On the other hand, all the GOSAT pixels of 2.5-degree resolution that contain the geolocation of each station were extracted from a stack of information by using a bilinear method.
3.1.1. Comparison of XCO2 GOSAT and TCCON Data
To validate the CO2 data used in the generation of the final global mapping, we evaluated the daily mean of the TCCON greenhouse gas readings and faced the data with a series of information extracted from pixels that were near 2.5° of the greenhouse GOSAT information.
We plotted 35 charts of TCCON information and overlays with GOSAT information, as shown in
Figure 8, where the blue dotted line represents the TCCON readings and the red dotted line represents the GOSAT readings. In certain cases, in situ stations did not record for a period of time, which caused the blank spaces in the plotting of the results.
3.1.2. Comparison of XCH4 GOSAT and TCCON Data
There are signs of a potential hemispheric or latitudinal bias against TCCON in the data, although this is not apparent at all sites. For example, Karlsruhe, Lamont, Tsukuba, and Lauder all have negligible biases but span a large latitude range. It should also be noted that the uncertainty on the TCCON CH
4 is approximately 4 (ppb), and for most sites, the GOSAT–TCCON difference is within this range of uncertainty; it is therefore is important to not over-interpret any signals at this scale [
43].
As with the XCO
2 data obtained by the in situ stations, there were some missing XCH
4 readings due to some stations not operating. In the XCH
4 readings, only three stations (Zugspitze, Garmisch, and Izana) registered an appreciable difference in line trends, of approximately 0.03 ppm as can be appreciated in
Figure 9.
3.1.3. XCO2 and XCH4 Difference between GOSAT L3 and TCCON Data
Along with the mission extension, the reprocessing of the L1B products was completed with the v161161 algorithm for all of the GOSAT data to retrieve the XCO
2 and XCH
4 data with high accuracy and precision [
44]. Accuracy can be defined as the degree of closeness between the information on a map and the values in the real world. On the other hand, precision refers to the level of exactness of the description of data, The expected relative accuracies were 1% for the XCO
2 (4 ppm, 3-month average) and 2% for the XCH
4 (34 ppb, 3-month average). The inverse algorithms were continuously optimized [
45]. A validation study showed that the greenhouse gas observation sensor on the GOSAT/Ibuki, “TANSO-FTS”, observes column-averaged CO
2 concentrations (hereafter, “CO
2 concentrations”) with a precision (random error) of 0.5% (approximately 2 ppm) in comparison to the data acquired from ground-based observations. This study investigated the detectability of enhanced CO
2 concentrations due to anthropogenic emissions by using satellite observations [
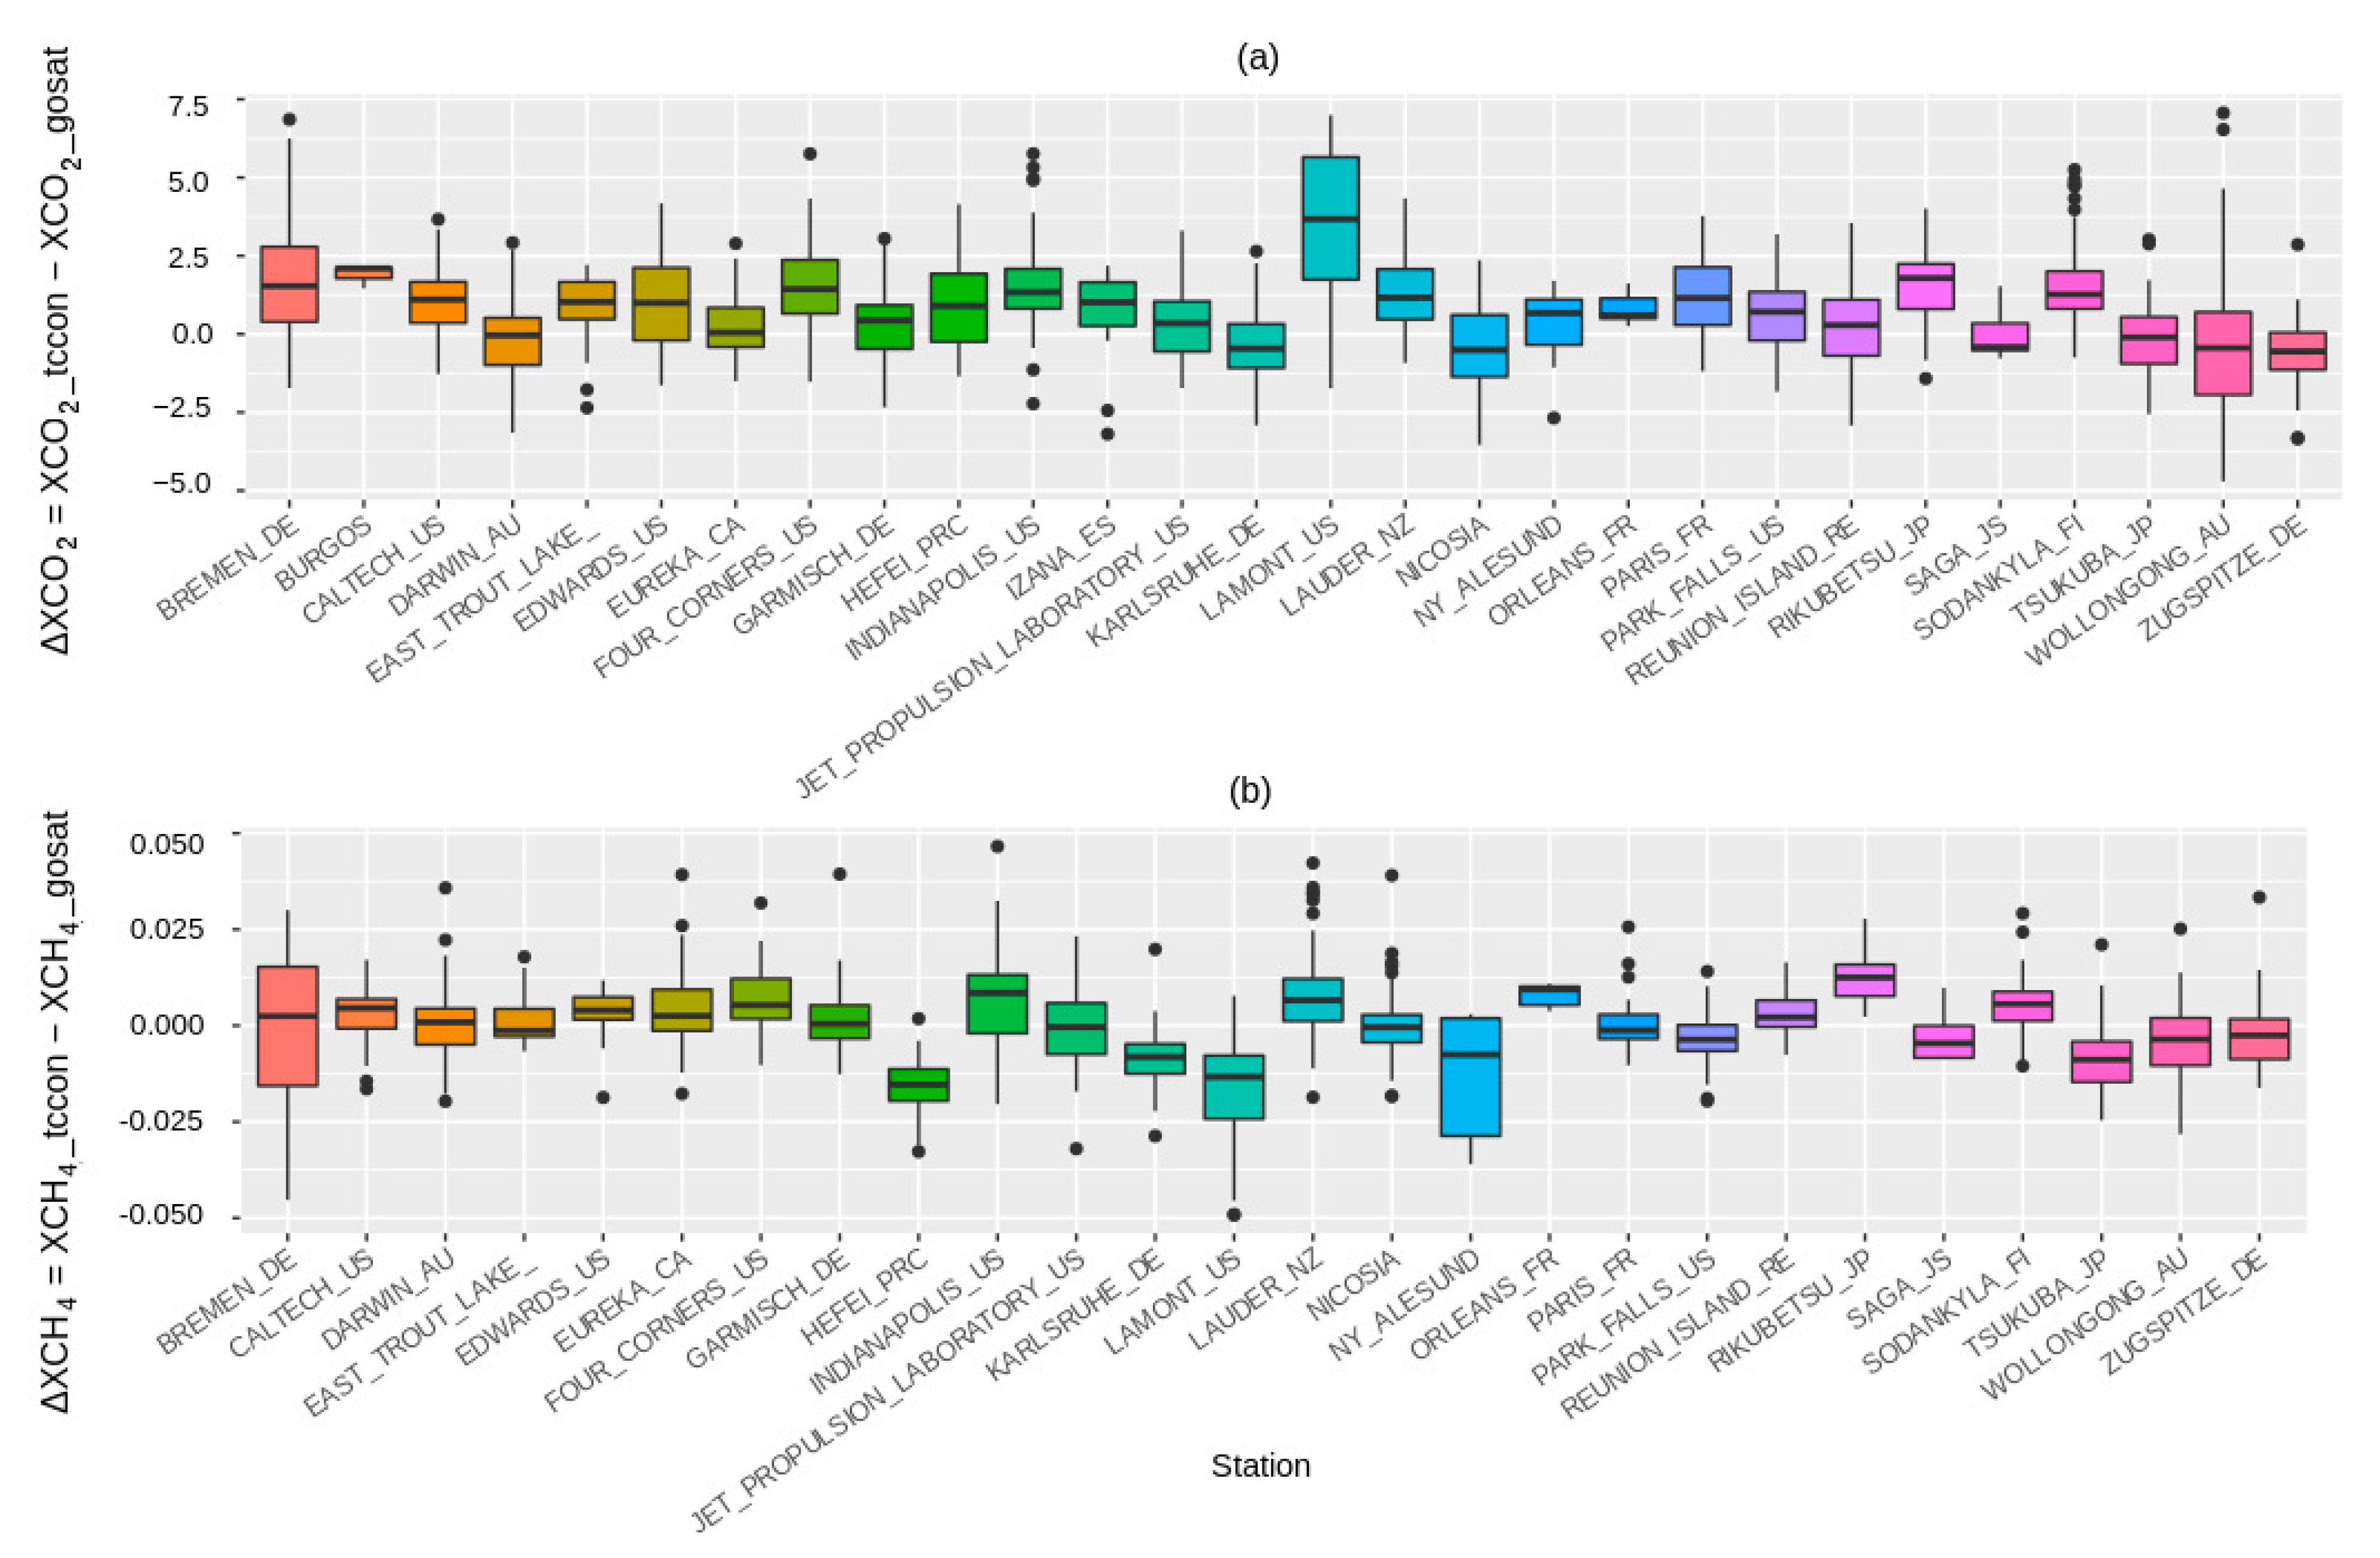
46]. Therefore, when we analyzed the accuracy of the XCO
2 by comparing the TCCON data with the GOSAT L3 by applying the EOF algorithm products, we found that the Bremen, Lamont, Wollongong, and Lamont in situ stations had a difference in values of up to 3 ppm. The difference expressed in
Figure 10a, ΔXCO
2 = XCO
2_TCCON − XCO
2_GOSAT_L3, helps to evaluate the precision and accuracy across both data. Moreover, regarding the difference in the XCH
4, it is visible that the stations of Bremen and Ålesund had a difference in values up to 0.07 ppm. This analysis and the differences across other stations can be observed in
Figure 10b.
3.2. Carbon Dioxide and Methane Growth (Global and Local Analysis)
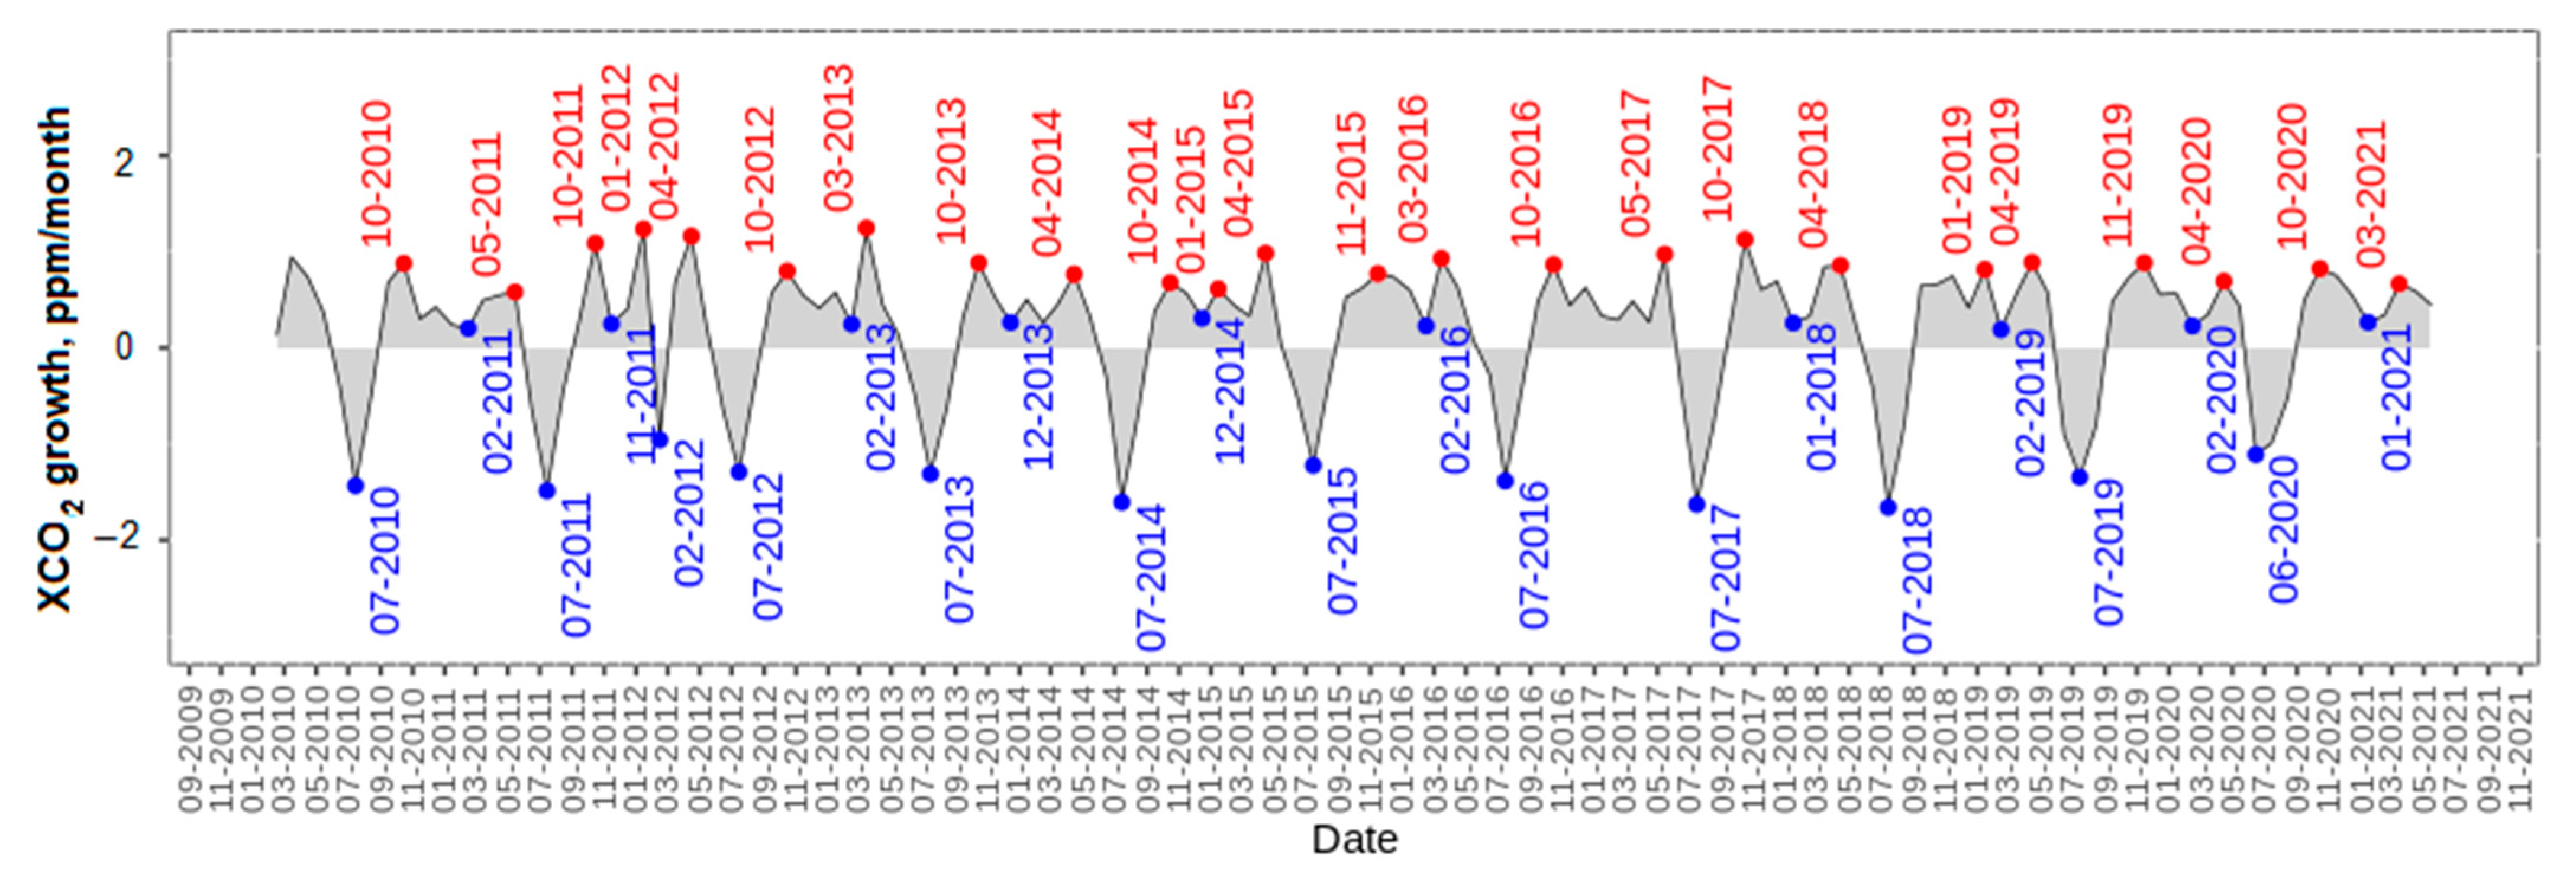
Figure 11 shows low peaks in June–July of each year. These start to increase and reach a high peak in October–November–December, after which the values remain constant until March–April–May. The growth of XCO
2, based on the global average values of the GOSAT L3 products with the application of the EOF algorithm, is determined by the difference of every two consecutive months. The increase in annual averages from 2019 to 2020 (2.5 ppm) was slightly lower than the increase observed between 2018 and 2019, but slightly higher than the average rate of increase over the previous decade (2.40 ppm per year) [
47]. Therefore, the variation in the temporal distribution for each month was minimal; however, it presented a constant increase, especially from January to April and from September to December. In 2019, the lowest growth values of CO
2 were recorded at the beginning of the year and its end. This information shows, once again, that one of the main greenhouse gases, CO
2, continues to increase despite the measures taken worldwide in order to reduce it. This constant increase could cause the effects of global warming and the climatic changes that it entails to become more serious, placing in danger the future of humanity, as well as that of wildlife and flora. Therefore, more measures must be strengthened and implemented to prevent these levels from continuing to rise.
In this case,
Figure 12 shows the growth of the XCH
4, based on the global mean values of the GOSAT L3 products with the application of the EOF algorithm. The monthly growth was calculated by subtracting the current monthly value from the previous monthly value. The global mean XCH
4, calculated from in situ observations, reached a new maximum of 1.889 ± 2 ppm in 2020, an increase of 11 ppm over the value for 2019 [
47]. The low CH
4 growth peak usually occurred in October–November–December and began to increase to a high peak in April–May–June.
On the other hand, in other studies, it is claimed that the most important factors influencing the temporal variability in CH
4 emissions are the presence of mice, the building of burrows, and the connection of reduced-soil regions to aerated regions. Thus, to reduce the CH
4 release from landfill cover soils, it is necessary to avoid any direct connection between the refuse body and the aerated soil sections of the atmosphere, which can be caused not only by animal activities, but also by specific soil-structure-forming processes. Moreover, under the given refuse and climatic conditions, a well-aerated soil cover layer of at least 70 cm is recommended [
48].
From 2010 to 2021, CO
2 and CH
4 significantly increased each year, at rates of approximately 2.50 ppm/year and 0.012 ppm/year respectively. These rate estimations are based on linear arrangements in time-series analyses of median values. Significant changes were found in the Northern and Southern Hemispheres. The CO
2 and CH
4 growth were similar to the value of the global means of 2.4 ppm/year and 8 ppb/year, respectively (for the last decade, 2011–2021), as reported in [
47].
3.3. Global Temporal Analysis
Real-time satellite observations can objectively determine changes in atmospheric CO2 concentrations caused by regional emissions. However, the satellite observation mode, cloud cover, atmospheric aerosols, and surface albedo, cam affect the satellite signal. Therefore, monthly data are discontinuous in time and space. The GOSAT satellite acquisition retrieval data does not have global terrestrial coverage, and it only has a small amount of data in some areas. Overall, the data cover only about half of the high latitudes in the southern hemisphere, and Antarctica lacks observational data. Therefore, we gridded the annual GOSAT satellite CO2 data to obtain global coverage.
Figure 13 and
Figure 14 show the variation in CO
2 and CH
4 from January 2010 to May 2020. The plots are arranged by year and meteorological season, based in the Northern Hemisphere, it can be concluded that the highest concentration of CO
2 is in the Northern Hemisphere. The highest concentration of CH
4 is also in the Northern Hemisphere. The Southern Hemisphere presents lower values in almost all the months.
An important point to highlight is the behavior of greenhouse gases throughout the entire year. Regarding CO
2, higher concentrations are common in spring and winter, while the lowest concentrations occur in autumn. Regarding methane, the highest concentrations occur in winter and the lowest occur in summer; the highest concentrations around the world are in India, the south of China, and the middle part of Africa. Additionally,
Table 3 presents the CO
2 and CH
4 growth rates per year, based on the GOSAT and NOAA reports; the NOAA reports in this table are available from Ed Dlugokencky, at NOAA/GML (
gml.noaa.gov/ccgg/trends_ch4/ (accessed on 20 January 2022)), and the GOSAT monthly reports are available from
www.gosat.nies.go.jp (accessed on 20 January 2022).
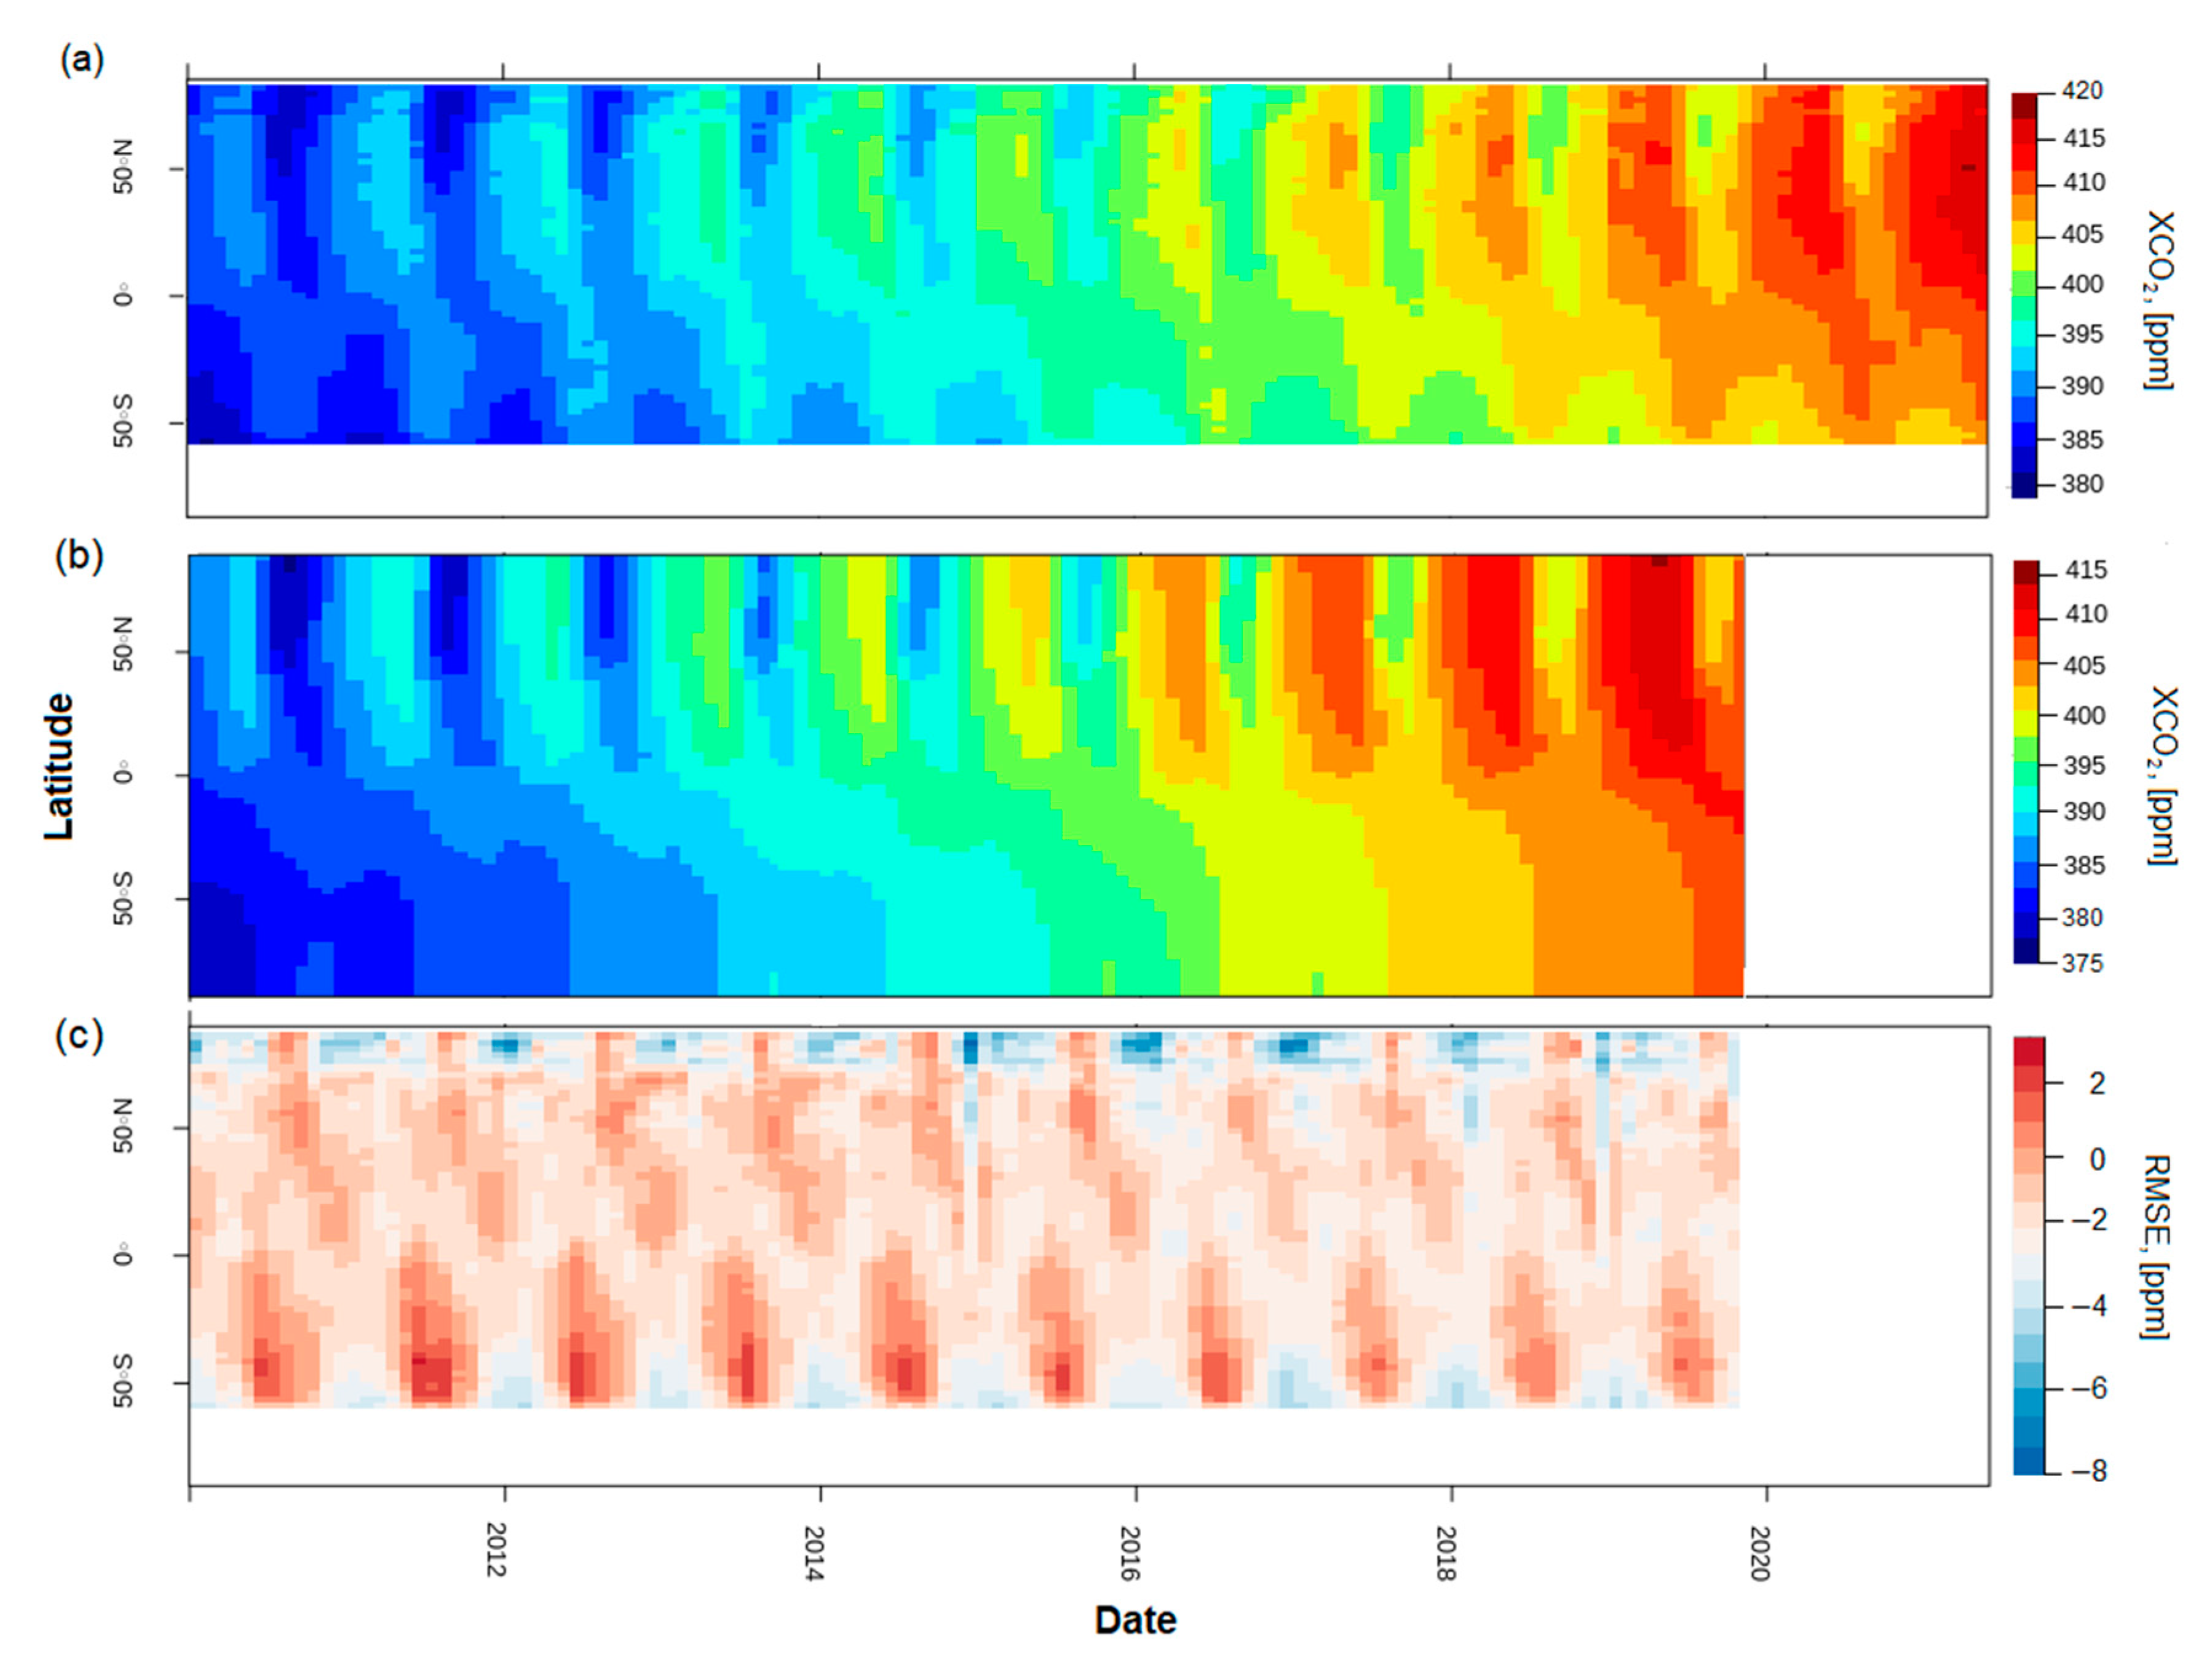
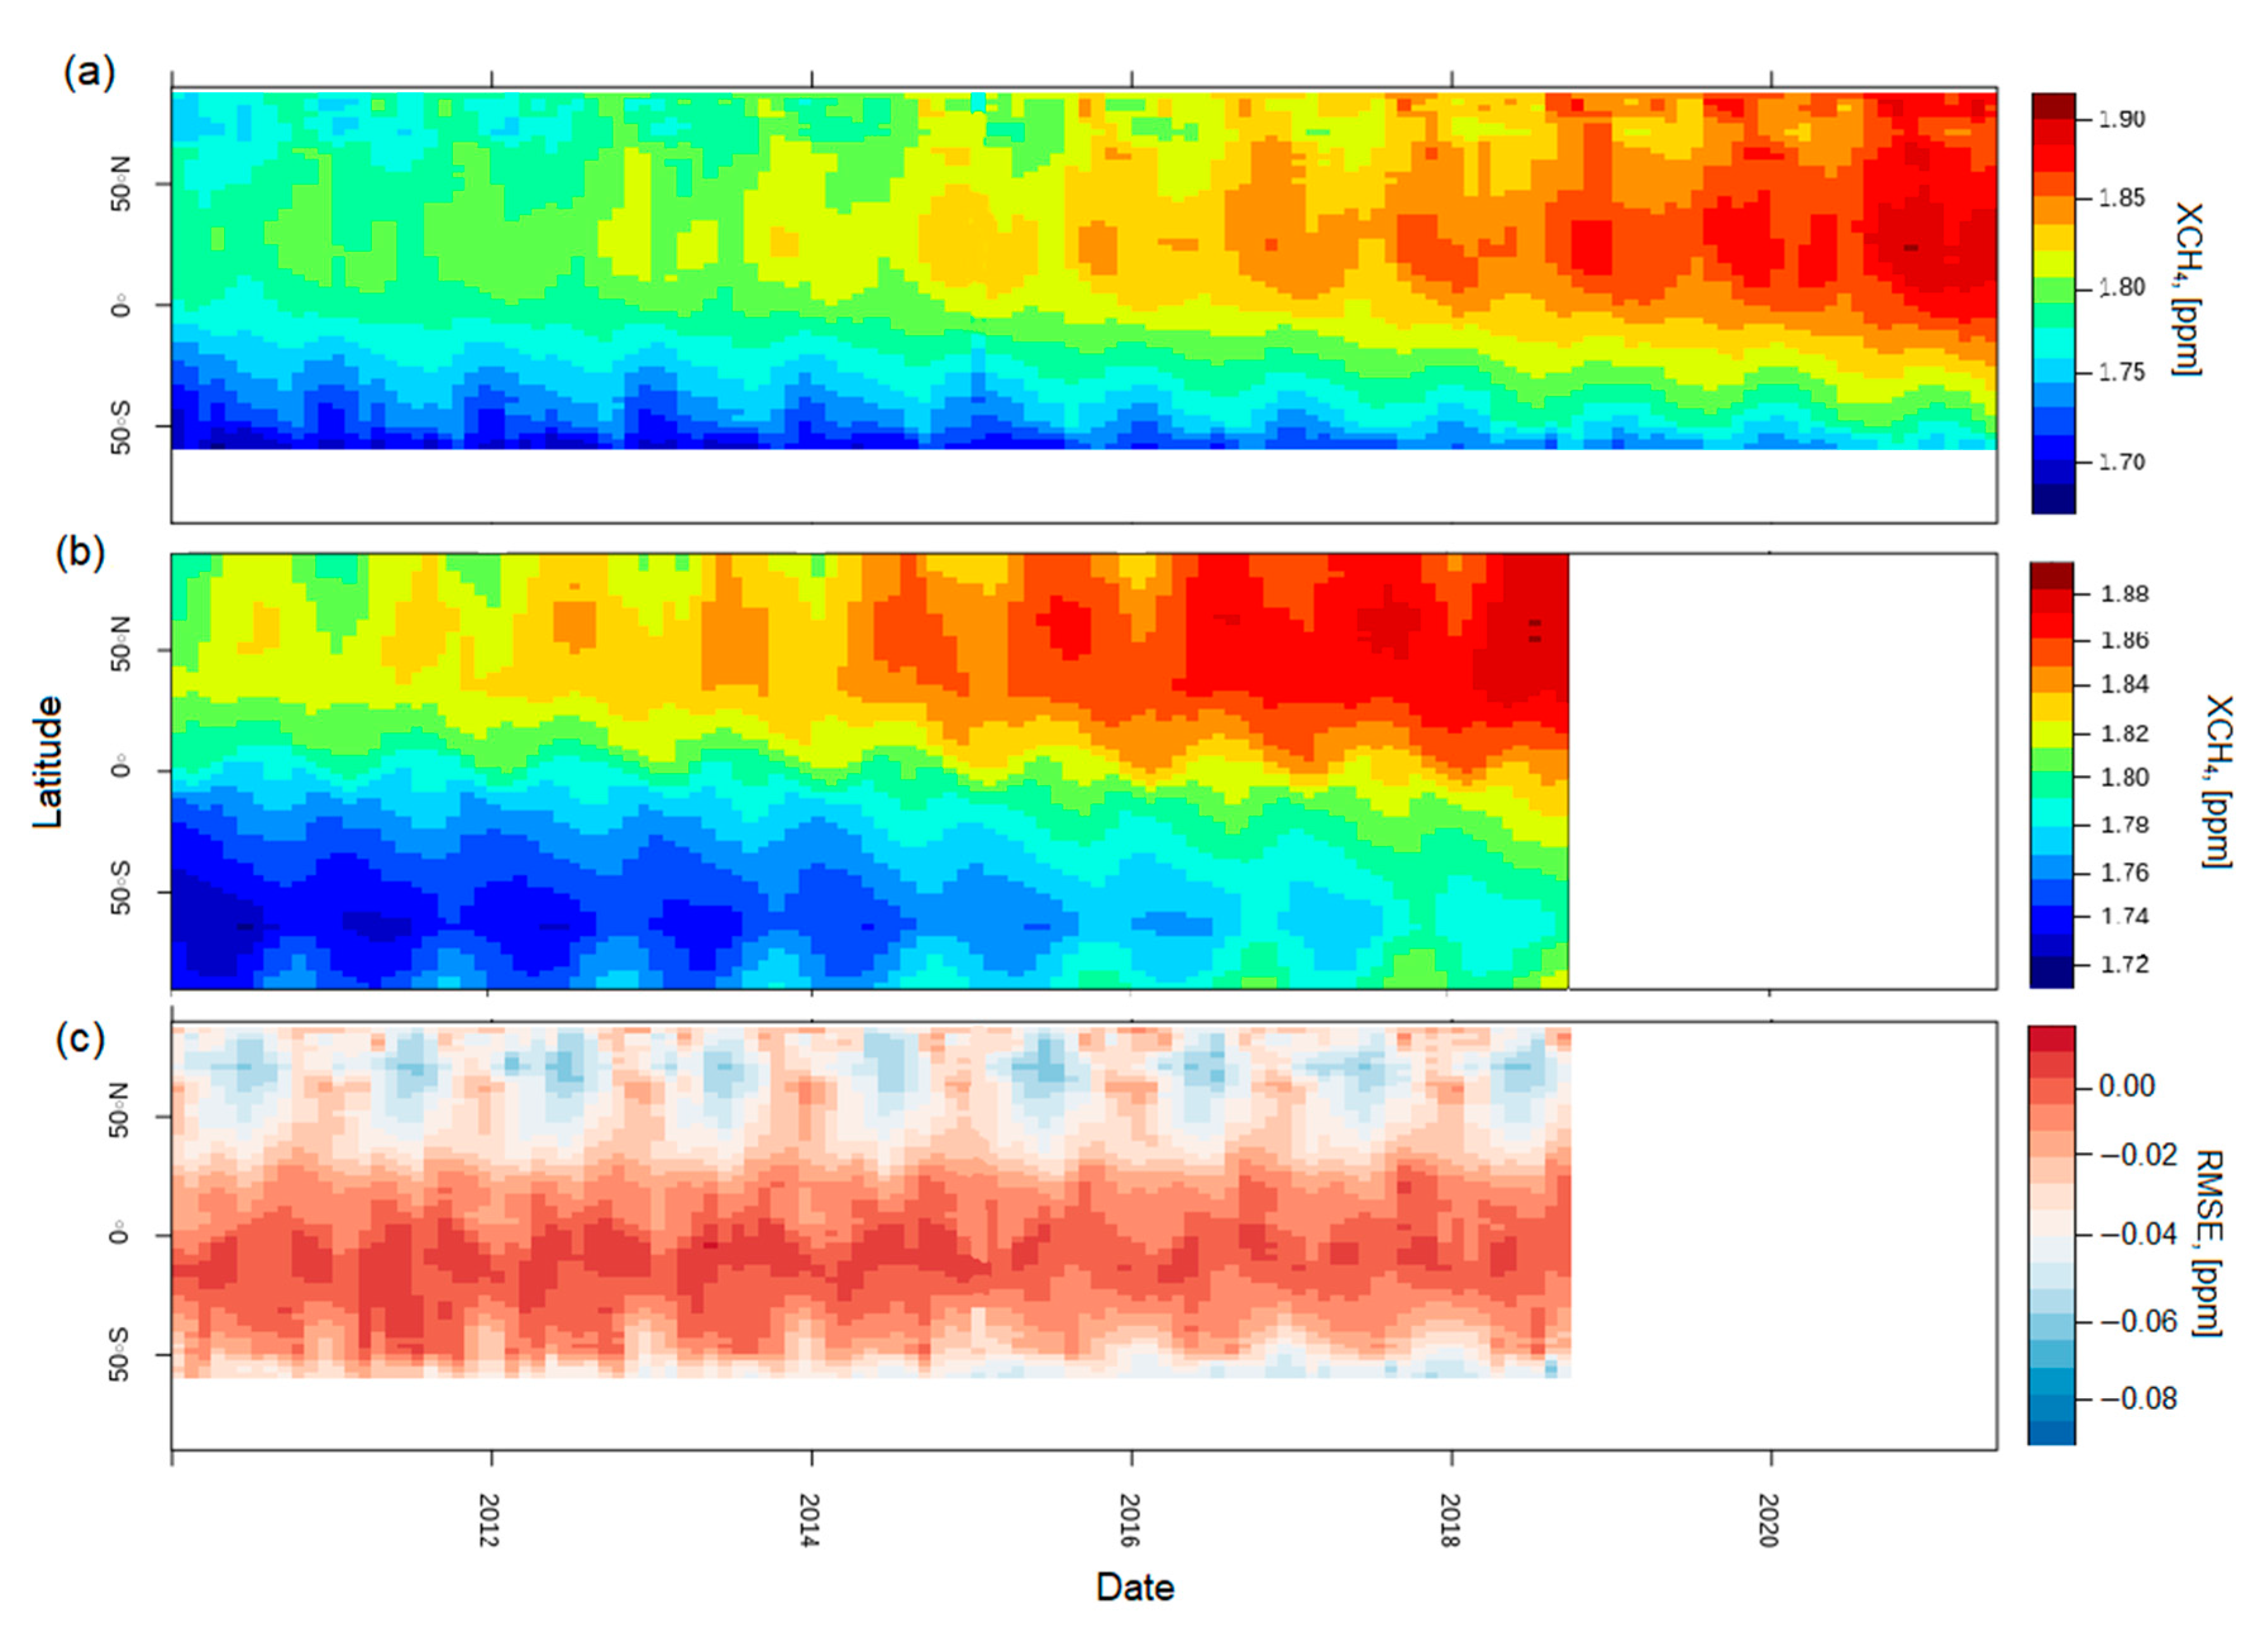
Hovmöller plots (latitudinal mean versus time) clarify the zonal propagation of synoptic-scale waves in a latitude band. Thus, the time–latitude cross-sections are the Hovmöller plot of the climate anomalies. The plots various parameters at the Earth’s surface [
49]. In
Figure 15 and
Figure 16 the “y” axis represents time, covering the period from January 2010 to May 2021, and the “x” axis is the latitude. The study developed in [
20] shows the global average distribution of atmospheric CO
2 with harmonic variation in latitude and highlights that the minimum values of CO
2 concentration are in the Southern Hemisphere, as demonstrated by the Hovmöller plots in
Figure 15a,b.
Figure 15 shows Hovmöller plots of the EOF GOSAT L3–GOSAT L4B XCO
2 total column amount. The GOSAT distribution behaved as expected, showing an increase over time between 2010 and 2019 superimposed over a north–south gradient and a regular seasonal cycle. The simulated results of the L4B products exhibited very similar characteristics and were in very good agreement with the GOSAT data. The difference between the two datasets (lower panel) shows that although there was a small offset between the two, there was very good consistency over time. The GOSAT L3 and L4B data seemed to agree slightly better during the peak of the seasonal cycle, particularly in the tropics; unreliable data were obtained near the 80–90°N latitudinal area, reaching RMSE values of 6 ppm.
On the other hand,
Figure 16 shows the Hovmöller plots (latitude mean versus time, respectively) for the GOSAT CH
4. The GOSAT distribution behaved as expected, showing an increase over time between 2010 and 2021, increasing at the North and South Poles. At very high northern latitudes, the CH
4 concentration was slightly lower at the co-ordinates corresponding to the section 40°S to 90°S; in sections 90°N to 40°S, the higher methane values were concentrated.
The specific area corresponding to Antarctica cannot be analyzed in this section due to missing information in the GOSAT SWIR L3 data, and the EOF temporal interpolation was unable to complete the information from this area because the number of pixels collected from January 2010 to May 2021 was zero.
Figure 16a,b shows the temporal analysis of the mean XCH
4 values of the EOF–GOSAT SWIR L3 and GOSAT L4B data. On the other hand,
Figure 16c shows that the highly reliable data corresponding to the area from the 60°S to 50°N can be used, because the RMSE values are from 0 to 0.02 ppm.
Figure 17 and
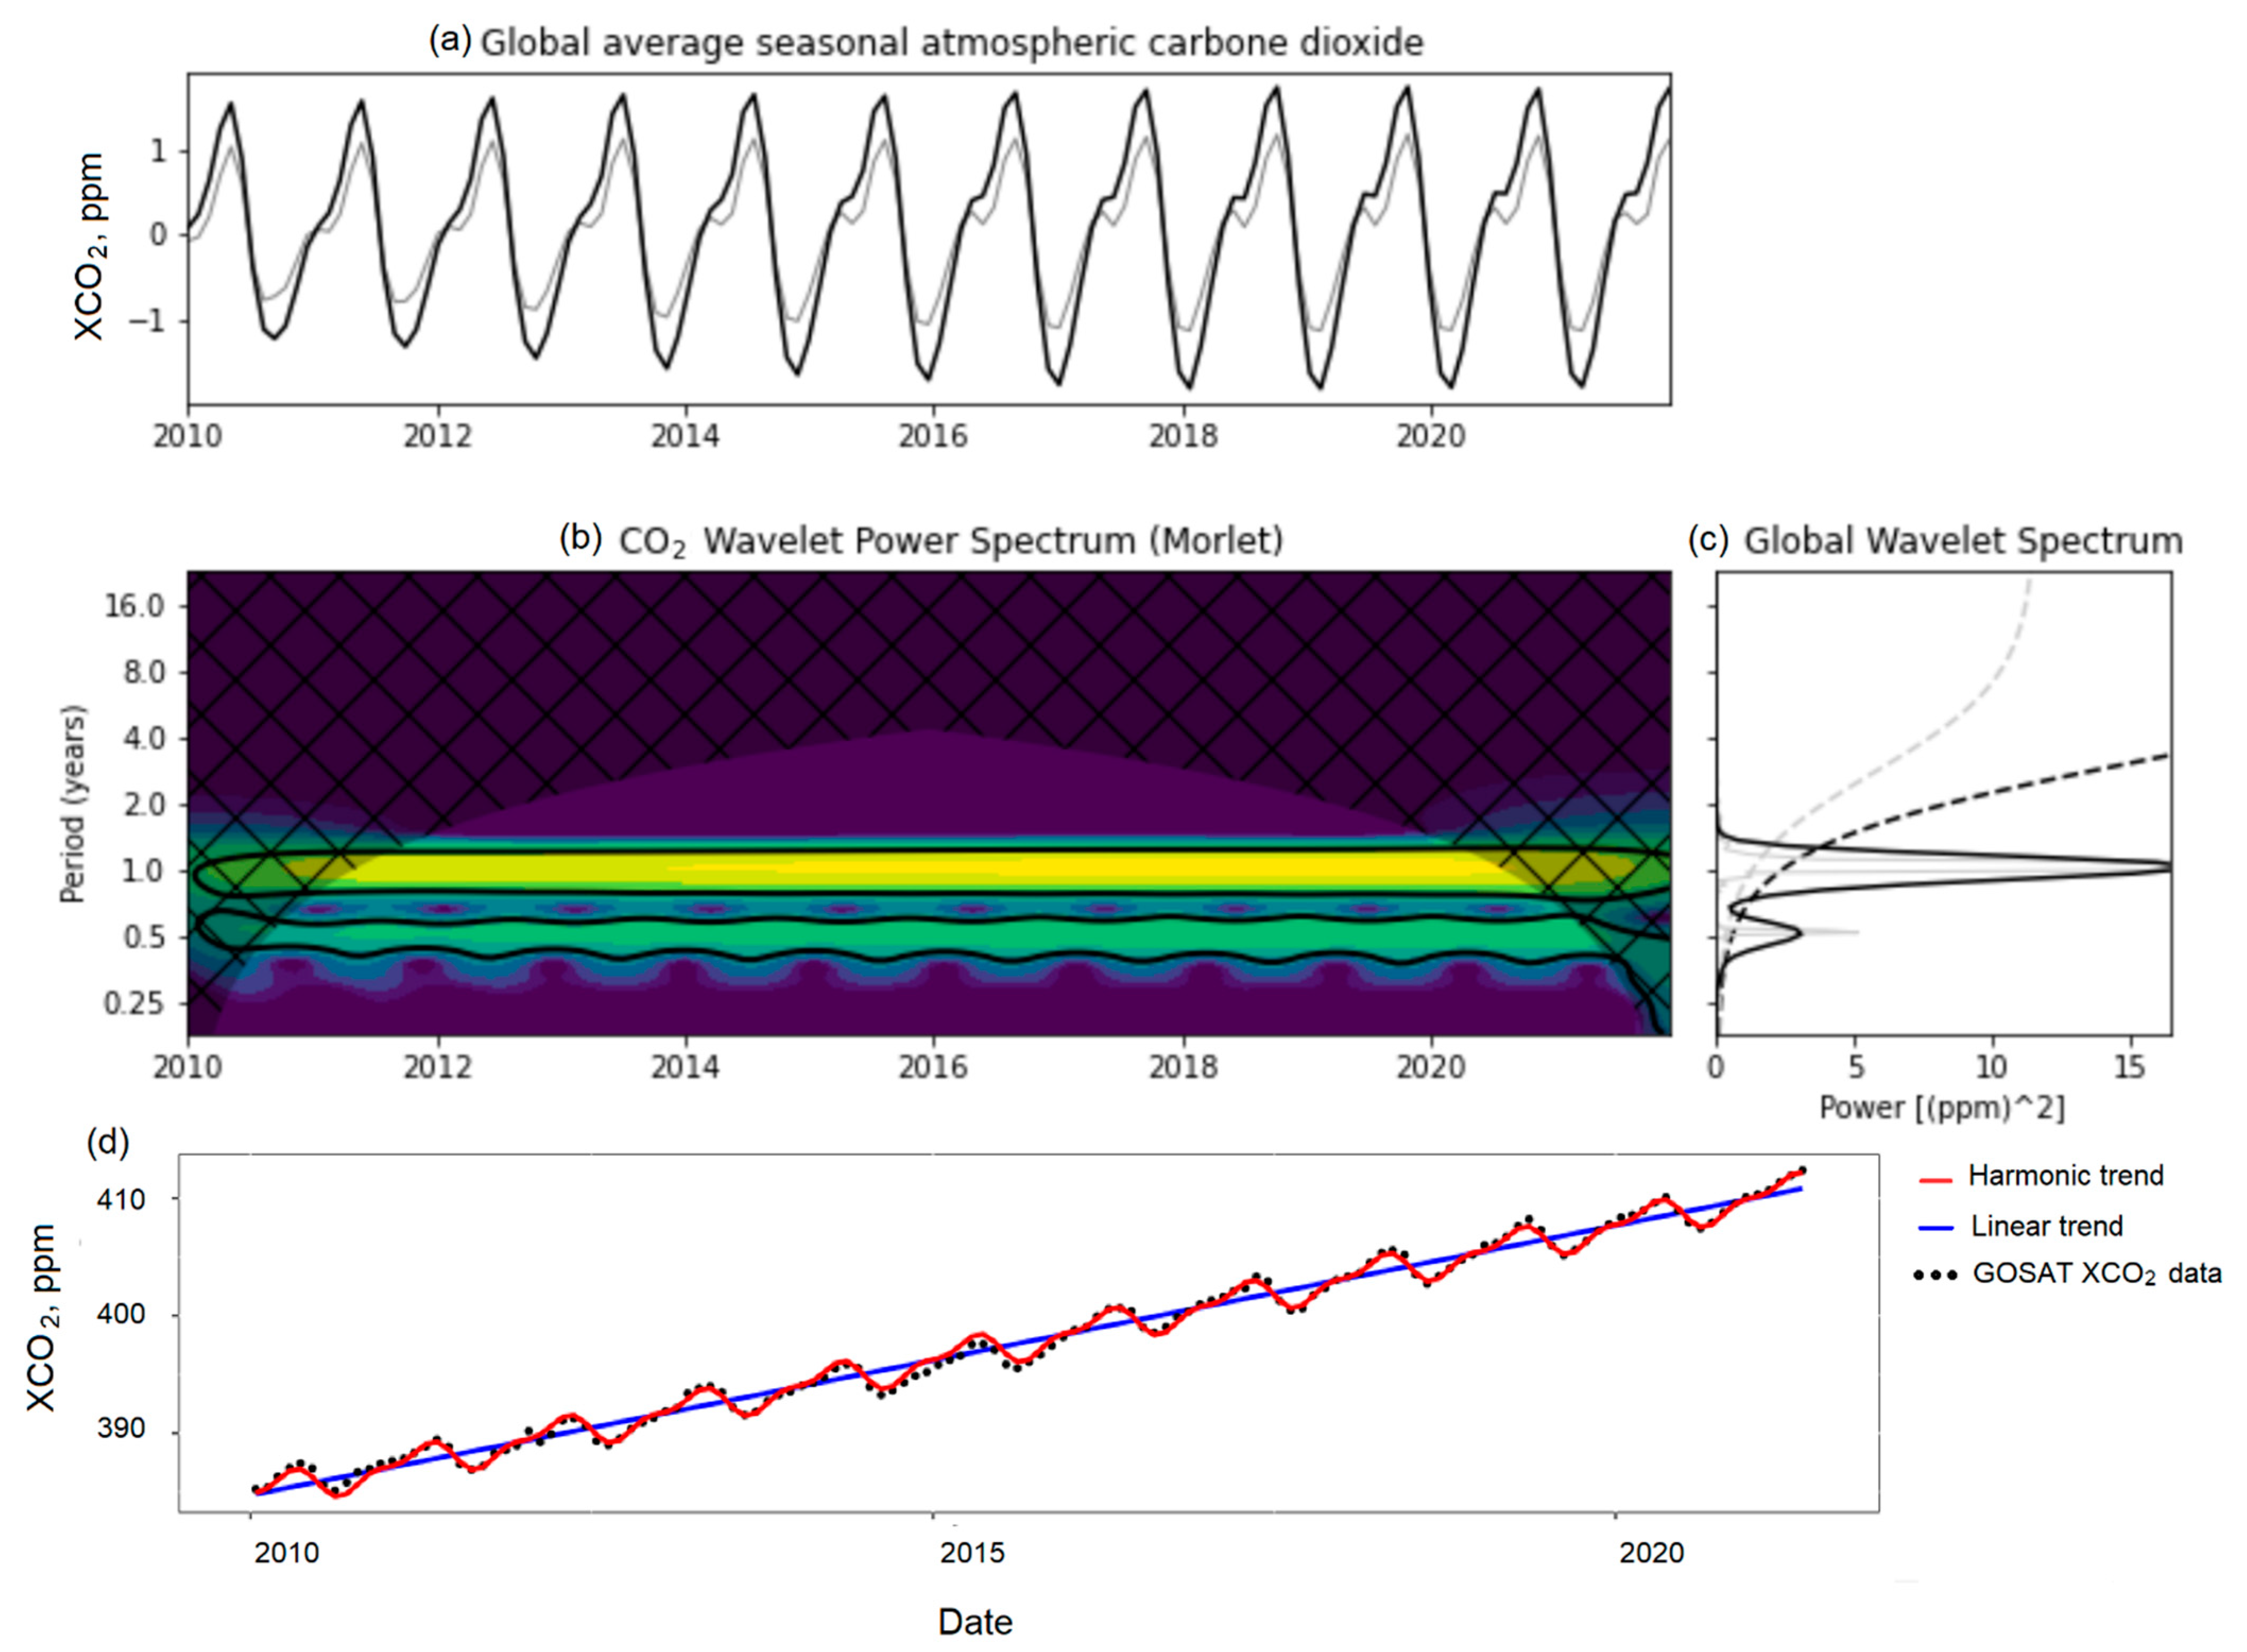
Figure 18 depict the time-frequency decomposition of the data using Morlet wavelet transform, highlighting the frequency of the events and presenting a harmonic and linear fit of XCO
2 and XCH
4 to analyze the trend of these greenhouse gases. To construct the harmonic curve fit of a periodic signal, ordinary least squares regressions using sinusoidal and cosine linked curves on the time series data were used. The underlying algorithm is based on [
50]. Formula (1) shows the harmonic fit used in
Figure 17d and
Figure 18d. The linear fit is based on ordinary least squares (OLS), which is a method that is used to quantify the evaluation of the different regression lines.
where:
t = Time difference in fractal years.
T = Length of the time period.
n = Total number of harmonics.
i = Current harmonic.
= Independent coefficients derived from OLS regression.
The global mean of the XCO
2 during the studied period continuously rose. A seasonal fluctuation in this parameter, visible in
Figure 18a, was extracted from the time series XCO
2 GOSAT data
Figure 18d (black dotted line) to analyze the frequency of these events, which showed a fluctuation between 1.47 to 1.62 ppm. This was evaluated in the Morlet wavelet power spectrum and the global wavelet spectrum
Figure 18b,c. In
Figure 18b, the Morlet wavelet power spectrum shows a decrease and increment in this gas every six months.
Many meteorological organizations, such as the World Meteorological Organization (WMO), have reported that the global monthly mean CO
2 concentration based on data obtained at surface-level monitoring sites has exceeded 400 ppm. However, this was the first time that the whole-atmospheric CO
2 mean exceeded 400 ppm, as monitored by the GOSAT, which can observe CO
2 concentrations from the Earth’s surface to the top of the atmosphere (about 70 km). This means that CO
2 concentrations are increasing not only at the global surface but also in the global atmosphere [
51].
Figure 17.
Wavelet analysis of the XCO2 based on GOSAT data. (a) Time series (solid black line) and inverse wavelet transform (solid gray line). (b) Normalized wavelet power spectrum of the global mean of XCO2 using the Morlet wavelet (ω0 = 6) as a function of time and Fourier equivalent wave period (in years). The black solid contour lines enclose regions of more than 95% confidence relative to a red-noise random process (α = 0.77). The cross-hatched and shaded area indicates the influence of the cone of influence of the mother wavelet. (c) Global wavelet power spectrum (solid black line) and Fourier power spectrum (solid gray line). The dotted line indicates the 95% confidence level. (d) The global mean of XCO2 in time-series harmonic (red line) and linear (blue line) trends.
Figure 18.
Wavelet analysis of the XCH4 based on GOSAT data. (a) Time series (solid black line) and inverse wavelet transform (solid gray line). (b) Normalized wavelet power spectrum of the global mean of XCH4 using the Morlet wavelet (ω0 = 6) as a function of time and Fourier equivalent wave period (in years). The black solid contour lines enclose regions of more than 95% confidence relative to a red-noise random process (α = 0.77). The cross-hatched and shaded area indicates the influence of the cone of influence of the mother wavelet. (c) Global wavelet power spectrum (solid black line) and Fourier power spectrum (solid gray line). The dotted line indicates the 95% confidence level, the wavelet power spectrum of global average seasonal atmospheric methane. (d) Global mean of XCH4 in time-series harmonic (red line) and linear (blue line) trends.
Figure 18a shows the seasonal variation extracted from the global mean XCH
4 GOSAT data measured from January 2010 to May 2021. During the period analyzed, the global mean XCH
4 rose continuously, as shown by the harmonic and linear trends in
Figure 18d. In
Figure 18b, the frequency, increment every six months, and decreased XCH
4 values are visible.
3.4. Greenhouse Gas Growth Analysis by Continent
The temporal variation by continent is visibly divided by columns and rows that represent the years (January 2010 to May 2021) and the seasons (spring, summer, autumn, and winter), based on those of the Northern Hemisphere, and the regions analyzed are South America, Africa, Australia, Europe, Asia, and North America. This local analysis highlights the areas with a high concentration of CO2 and methane.
South America presented a range of CO2 of 30 ppm between January 2010 and May 2021. It showed low levels of CO2 in spring, and its maximum values occurred in summer; the lowest value recorded was 385 ppm, registered in 2010. Over time, this gas increased, reaching values of approximately 415 ppm. The most affected country was Brazil, along with its surrounding countries, such as Bolivia, Uruguay, and Paraguay, as well as the north of Argentina. The epicenter of the heat CO2 concentration was at (10°W, 55°S).
Africa had a variation of 40 ppm over the last decade. The highest concentrations of CO2 occurred in winter, and the lowest in autumn. The lowest value recorded was 380 ppm, registered in 2010. Over time, this gas increased to 420 ppm. An area with remarkably high concentrations of CO2 was (20°E, 20°S), near Congo, Gabon, and Cameron. The second most affected area was located near (0°E, 20°N); the nearest countries to this area are Mali, Algeria, Mauritania, and Morocco, as well as the Western Sahara.
Australia presented a range of CO2 of 35 ppm between January 2010 and May 2021, and showed low levels of CO2 in spring. Its maximum values occurred in winter. The lowest value recorded was 380 ppm, registered in 2010. Over the time, this gas increased, reaching values of 415 ppm. The most affected country was Australia, especially its central region, at coordinates of (140°E, 25°S).
Regarding Europe, typically, the highest concentrations of CO2 were the central region. The highest value of CO2 in parts per million recorded in the last 10 years was approximately 420 ppm. The lowest concentrations occurred in autumn, and the maximum concentrations were observed in winter.
Five representative locations in Asia displayed a high CO2 rate: India, Indonesia, Japan, Beijing and the south-western area of China. The coordinates of the representative increments of CO2 are (75°E, 15°N), (45°E, 80°N), (100°E, 25°N), (125°E, 18°N), and (130°E, 45°N). The north-west area of Russia (near Moscow) also presented a high increment of CO2. This region had a variation of 45 ppm over the last decade, and it is one of the most polluted regions on Earth. The highest concentrations of CO2 occurred in winter, and the lowest in autumn; the lowest value recorded was 380 ppm, registered in 2010. Over the time, this gas increased, reaching values of 425 ppm.
North America presented a range of CO2 of 45 ppm between January 2010 and May 2021. The region showed low levels of CO2 in the autumn, and its maximum values occurred in winter. The lowest value recorded was 380 ppm, registered in 2010. Over time, this gas increased, reaching values of approximately 425 ppm. The most affected countries were United States (the central region of the United States was less affected than the east and west) and Canada.
Previous studies were examined to compare the differences between the source data (e.g., land use) of the carbon inventories and the real atmospheric carbon observations [
52,
53]. The authors of [
54] reported that the Orbiting Carbon Observatory-2 (OCO-2) satellite-based XCO
2 shows a positive correlation with the Open-Source Data Inventory for Anthropogenic CO
2 (ODIAC) for the main pollution regions: the eastern USA, central Europe, and East Asia. There is also literature that features comparisons between ground-based atmospheric observations (eddy flux tower measurements) and the publicly available inventory for urban atmospheric CO
2 on the city scale [
55,
56].
Figure 19 shows the spatial mean tendency of the total columns of CO
2 and CH
4 in the world, as well as for Asia, Australia, Africa, South America, North America, and Europe. Regarding the XCO
2 tendency, Australia shows low variations and an almost linear tendency; Europe, Asia, and North America show variations of approximately 10 ppm per year. However, XCH
4 shows low concentrations in South America and, especially, in Australia; higher concentrations of CH
4 can be observed in North America, Asia, Europe, and Africa.
4. Conclusions
The main objective of this study was to reconstruct the GOSAT L3 product based on the EOF algorithm and validate it through TCCON measurements. The global spatial–temporal pattern of CO2 and CH4 is illustrated better with the application of this algorithm, as can be seen through the results presented in this paper. The southern part of the Earth, about which there is a low amount of information for spring–summer, is illustrated better, and the exact point in the Southern Hemisphere where the levels of these gases have reduced considerably can be observed. Furthermore, the northern part of the Earth, about which there is little information from the GOSAT L3 product for autumn–winter, is represented better, especially in the ocean areas. However, in the Antarctic area, the information could not be reconstructed, since there were no values recorded in the last 10 years.
The monthly time series shows similitude between the in-situ stations TCCON and GOSAT and CO2 in terms of sufficiency. This assertion is difficult to corroborate in the Southern Hemisphere due to the lack of TCCON stations around the world. Moreover, the TCCON manifested higher CO2 concentrations compared with the CO2 recovered from the GOSAT. The kernel density plots presented in the section on the data validation seem to show higher similitude regarding CO2. The CH4 gas data are more unreliable, especially between 2010 and 2012, due to the lack of information from within those years.
The GOSAT CH4 dataset currently contains over a decade of worldwide CH4 behavior. The ability to assess worldwide and territorial CH4 outflows is imperative to develop our understanding of the worldwide level of methane. We started this work by highlighting the wide assortment of aspects of the past forms of this dataset that have contributed towards this understanding, illustrating the utility of this dataset for analyzing and understanding the worldwide behavior of CH4, which is still rising.
Summarizing the results, it can be concluded that the area most affected by greenhouse gases is the Northern Hemisphere. Moreover, both gases have a harmonic variation over time. In the case of CO2, at the beginning and the end of each year, the gas starts to increase rapidly, and in the middle of the year, its levels reduce slightly (less than the increment). On the other hand, the seasonal variation in CH4 is different because the gas starts to increase in the middle of each year and decreases at the end and the beginning of each year. Both have a similar frequency of events, repeating the same event at approximately the same rate over a given year, which suggests that the seasonal behavior of both gases resembles a sinusoidal wave.
In this study, some shortcomings are evident in the data interpolation, especially for the information obtained from the South America, Africa, and Antarctica regions. The results for these regions were unreliable due to the low quantity or absence of TCCON data in these regions; therefore, GOSAT and TCCON data validation analyses could not be performed. To increase the reliability of the results, in a future study, it will be necessary to compare the interpolated results with simulated results using the atmospheric transport model available in the GOSAT L4 products, or compare them with other models or other satellite data. Furthermore, the empirical nature of the data and their relatively high level of uncertainty indicate the need for future satellite sensors to increase data availability and accuracy.
