
Rescaling-Assisted Super-Resolution for Medium-Low Resolution Remote Sensing Ship Detection


Abstract
:1. Introduction
- Inspired by the powerful information embedding ability of the encoder in image rescaling, we propose a rescaling assisted image SR method to better restore the lost information in M-LR images.
- We conduct extensive ablation studies to investigate the effectiveness of RASR. Moreover, we compare our RASR with several SR methods on three public datasets. Comparative results demonstrate the competitive performance of our method.
- Taking RASR as a pre-processing approach, we develop RASR-Det to improve the ship detection performance on M-LR images. Experimental results demonstrate the effectiveness of our RASR-Det in handling the M-LR remote sensing ship detection problem.
2. Related Works
2.1. Image Super Resolution
2.2. Image Rescaling
2.3. SR-Based Detectors
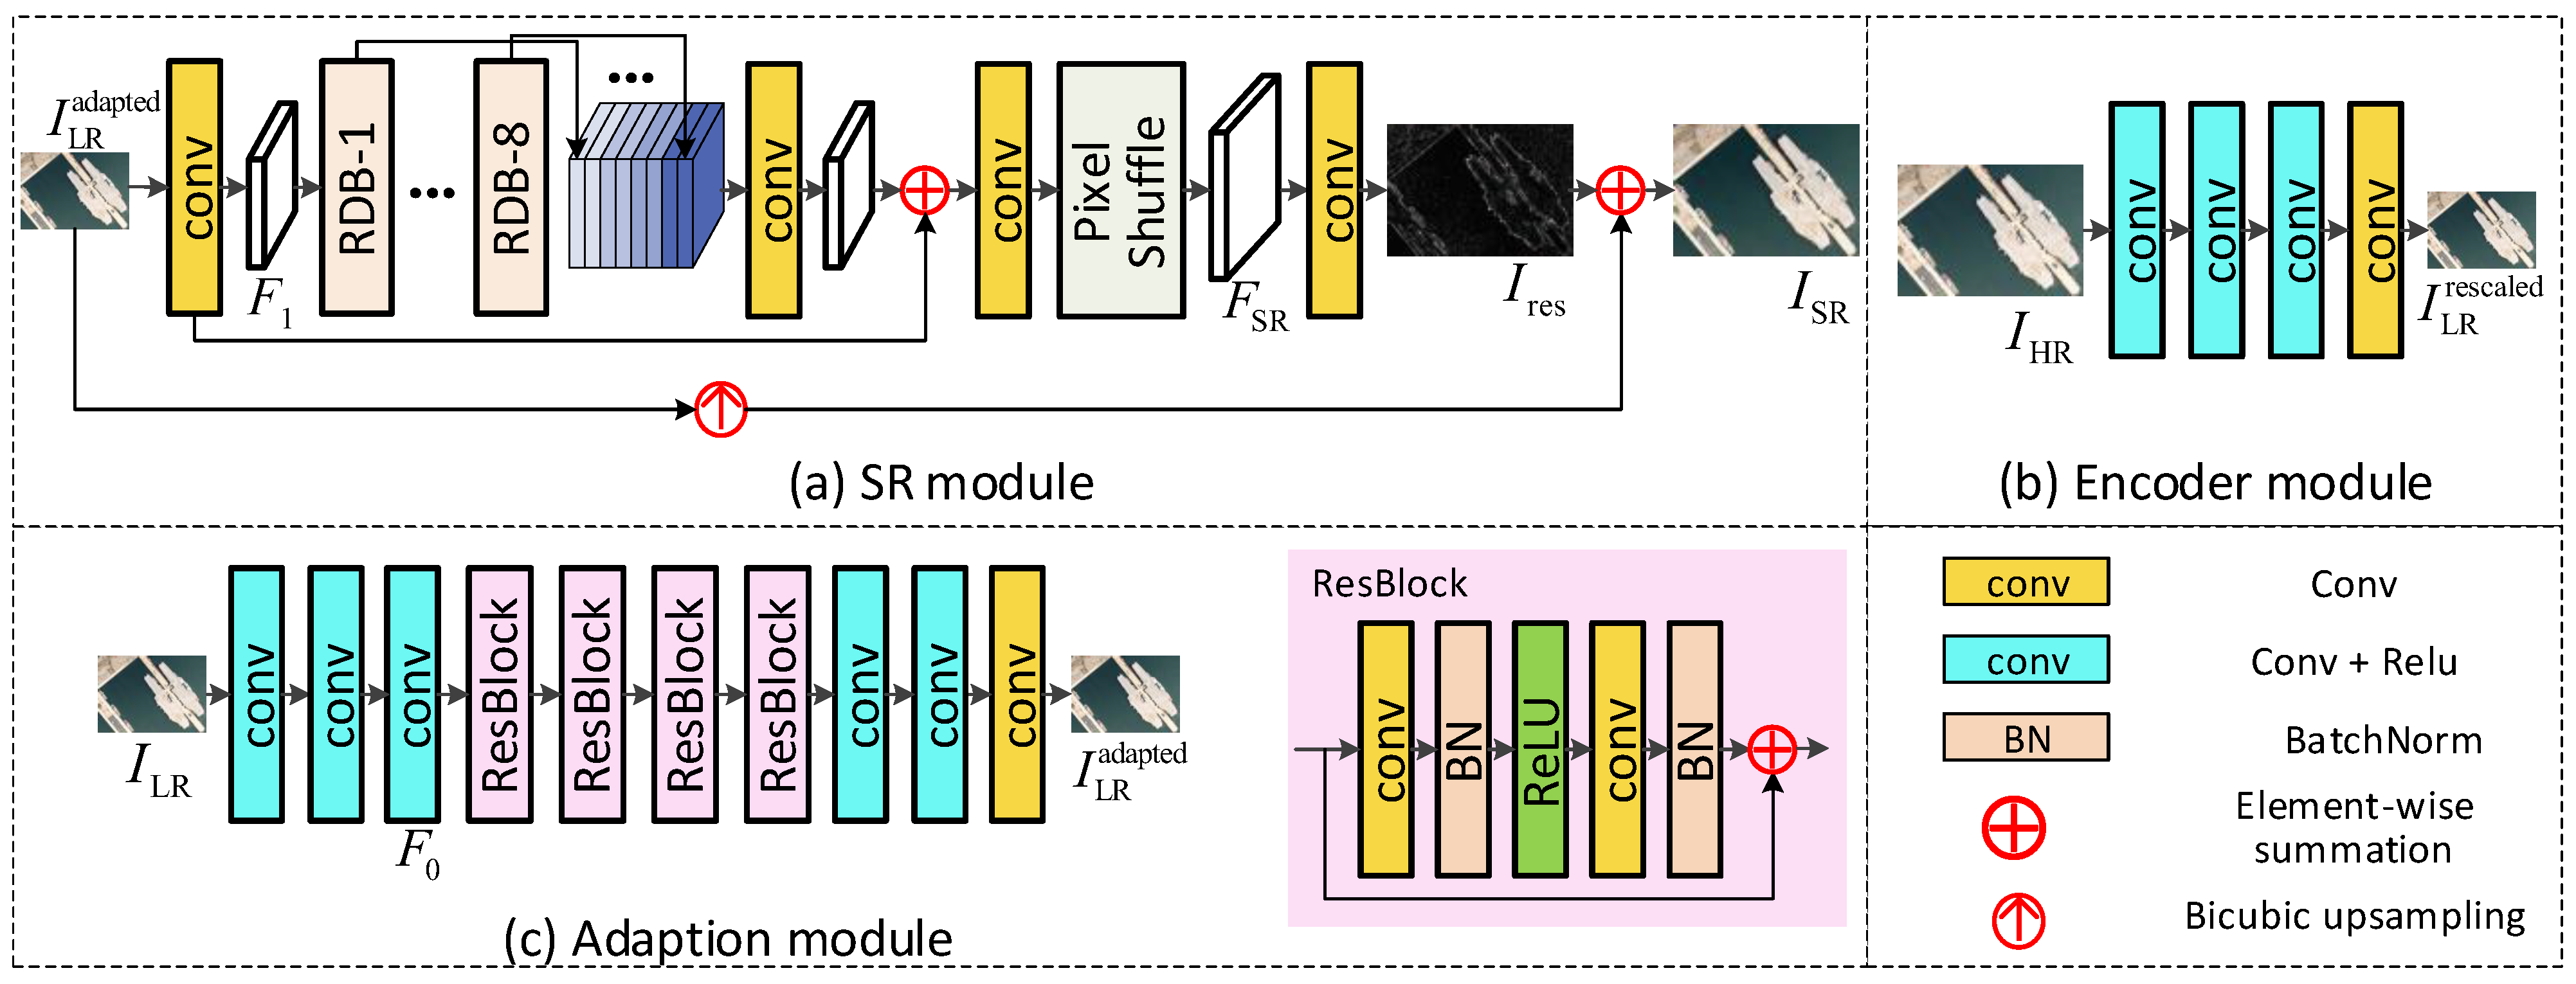
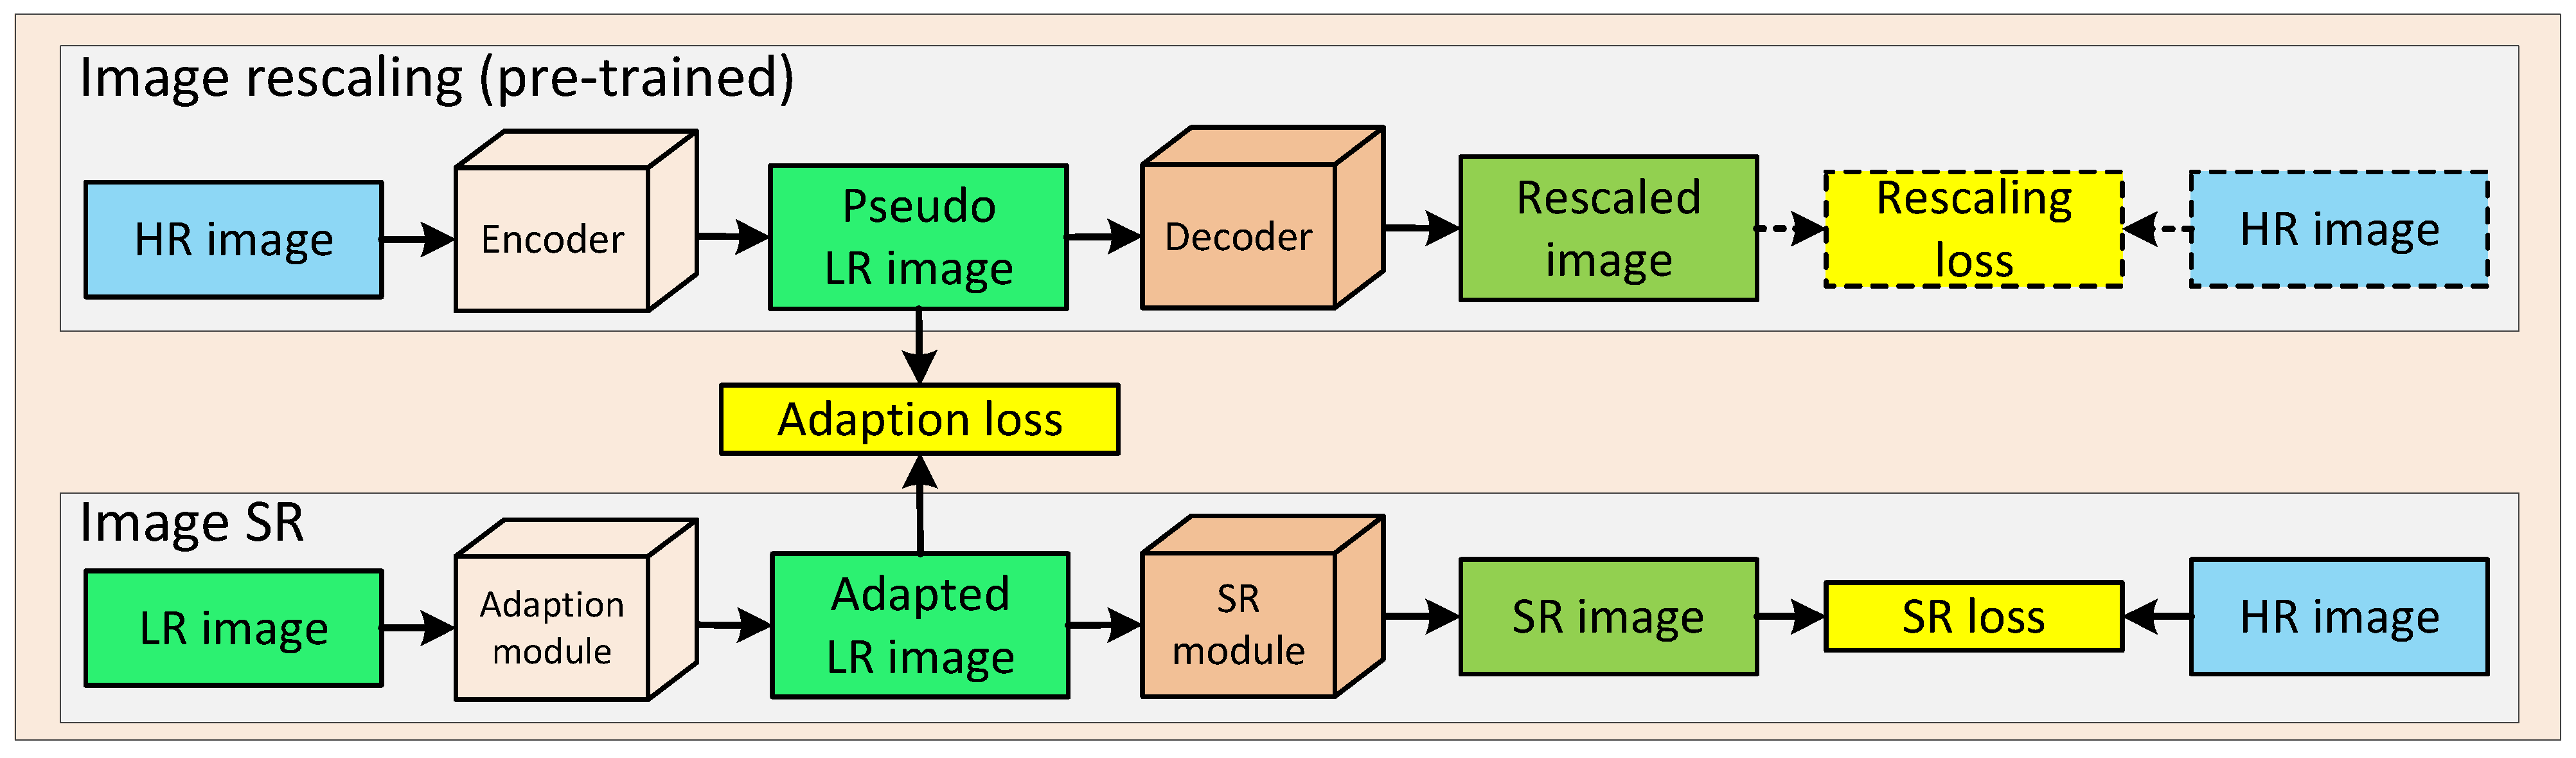
3. Methodology
3.1. Image Rescaling
3.2. Rescaling Assisted Image SR
3.3. Loss Function
4. Experiments
4.1. Datasets and Implementation Details
4.1.1. Datasets
- HRSC2016: HRSC2016 is a public ship dataset in remote sensing images, and contains 436 images for training, 181 images for validation and 438 images for test. In our experiment, we use both the train and validation dataset for training and use the test dataset for test. The GSD of the HRSC2016 dataset is between 0.4 and 2 m/pixel, and the image sizes are between 300 × 300 pixels and 1500 × 900 pixels. As most image sizes are about 1000 × 600, we resized original images to 800 × 512 as the ground-truth HR images.
- DOTA: DOTA is a large-scale dataset used for multi-class object detection in remote sensing images. The sizes of images are between 800 × 800 and 4000 × 4000 pixels. Objects in the dataset have various proportions, directions and shapes. In our experiment, the large-scale images are cropped to patches of 512 × 512 pixels for training and validation. For the ship detection task, we discarded patches without ship targets and retained 4163 patches for training and 1411 patches for test.
- NWPU VHR-10: NWPU VHR-10 dataset is a multi-class object detection dataset with GSD smaller than 2 m/pixel. We performed the same operations as in DOTA dataset to generate training and validation samples. The image sizes are from 533 × 358 to 1728 × 1028 pixels. In our experiment, we cropped the original images into patches of 512 × 512 pixels and discarded patches without ship targets. Our customized NWPU VHR-10 dataset contains 249 images for training and 52 images for test.
4.1.2. Implementation Details
4.1.3. Evaluation Metrics
4.2. Ablation Study
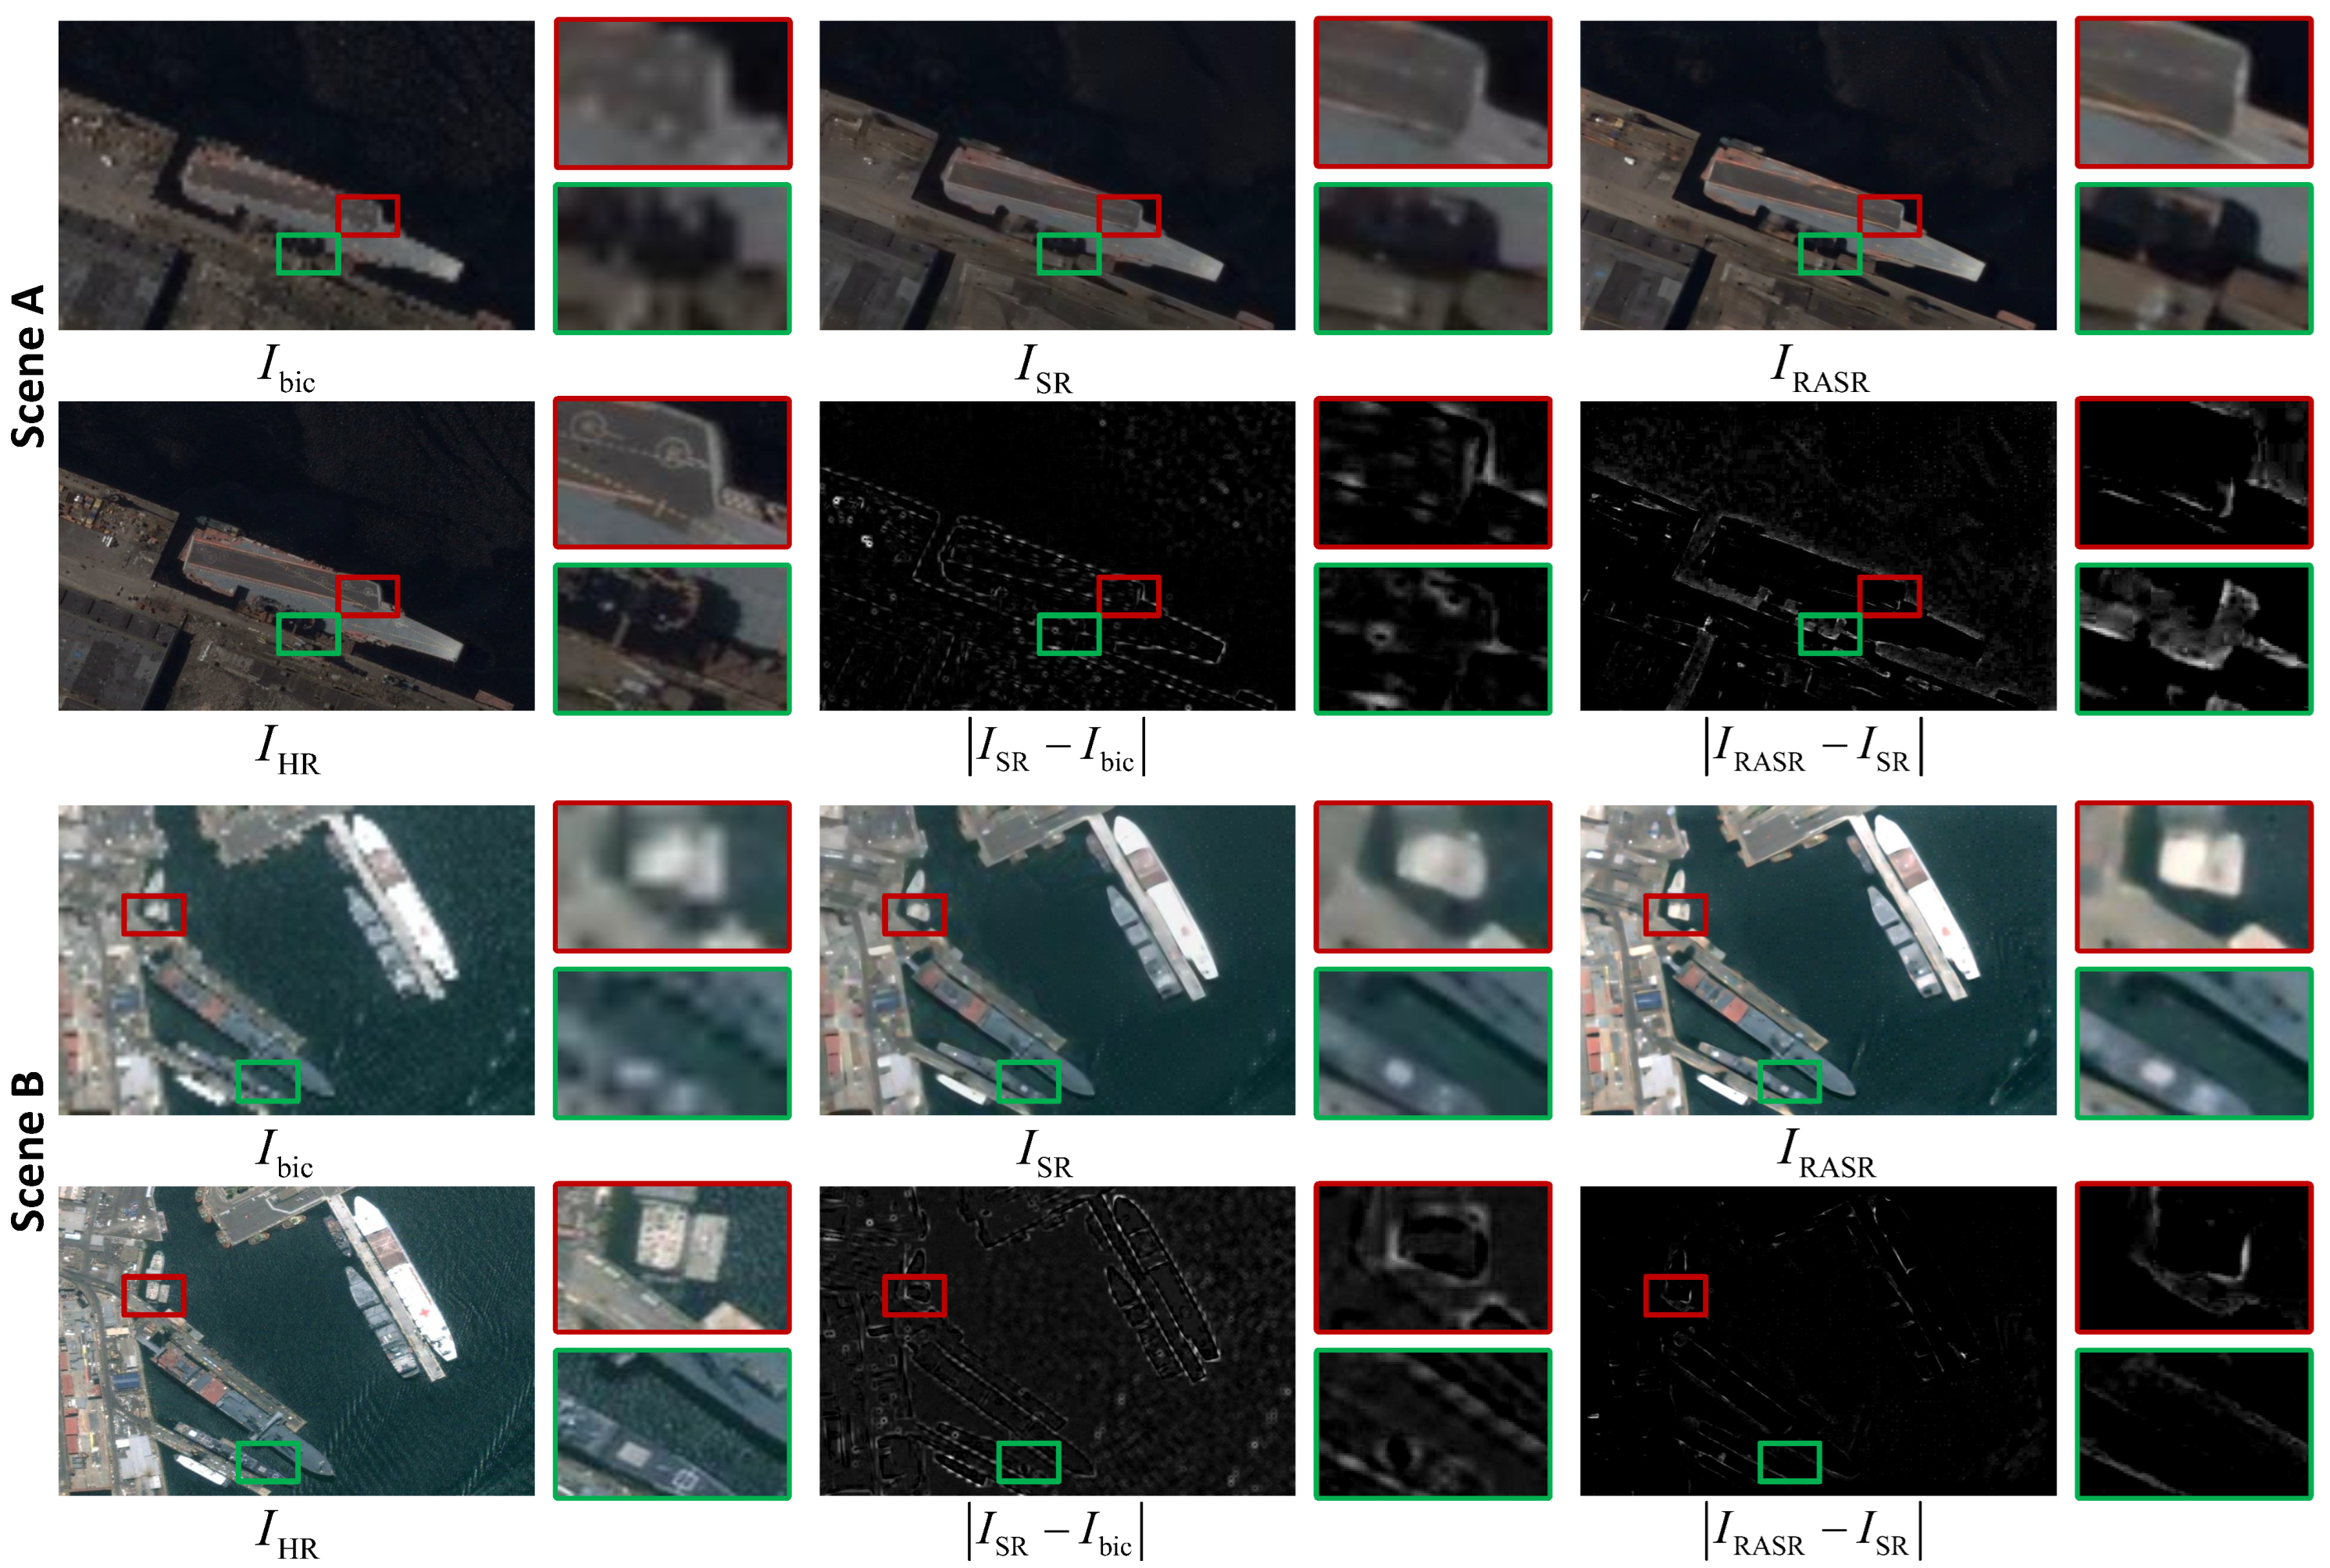
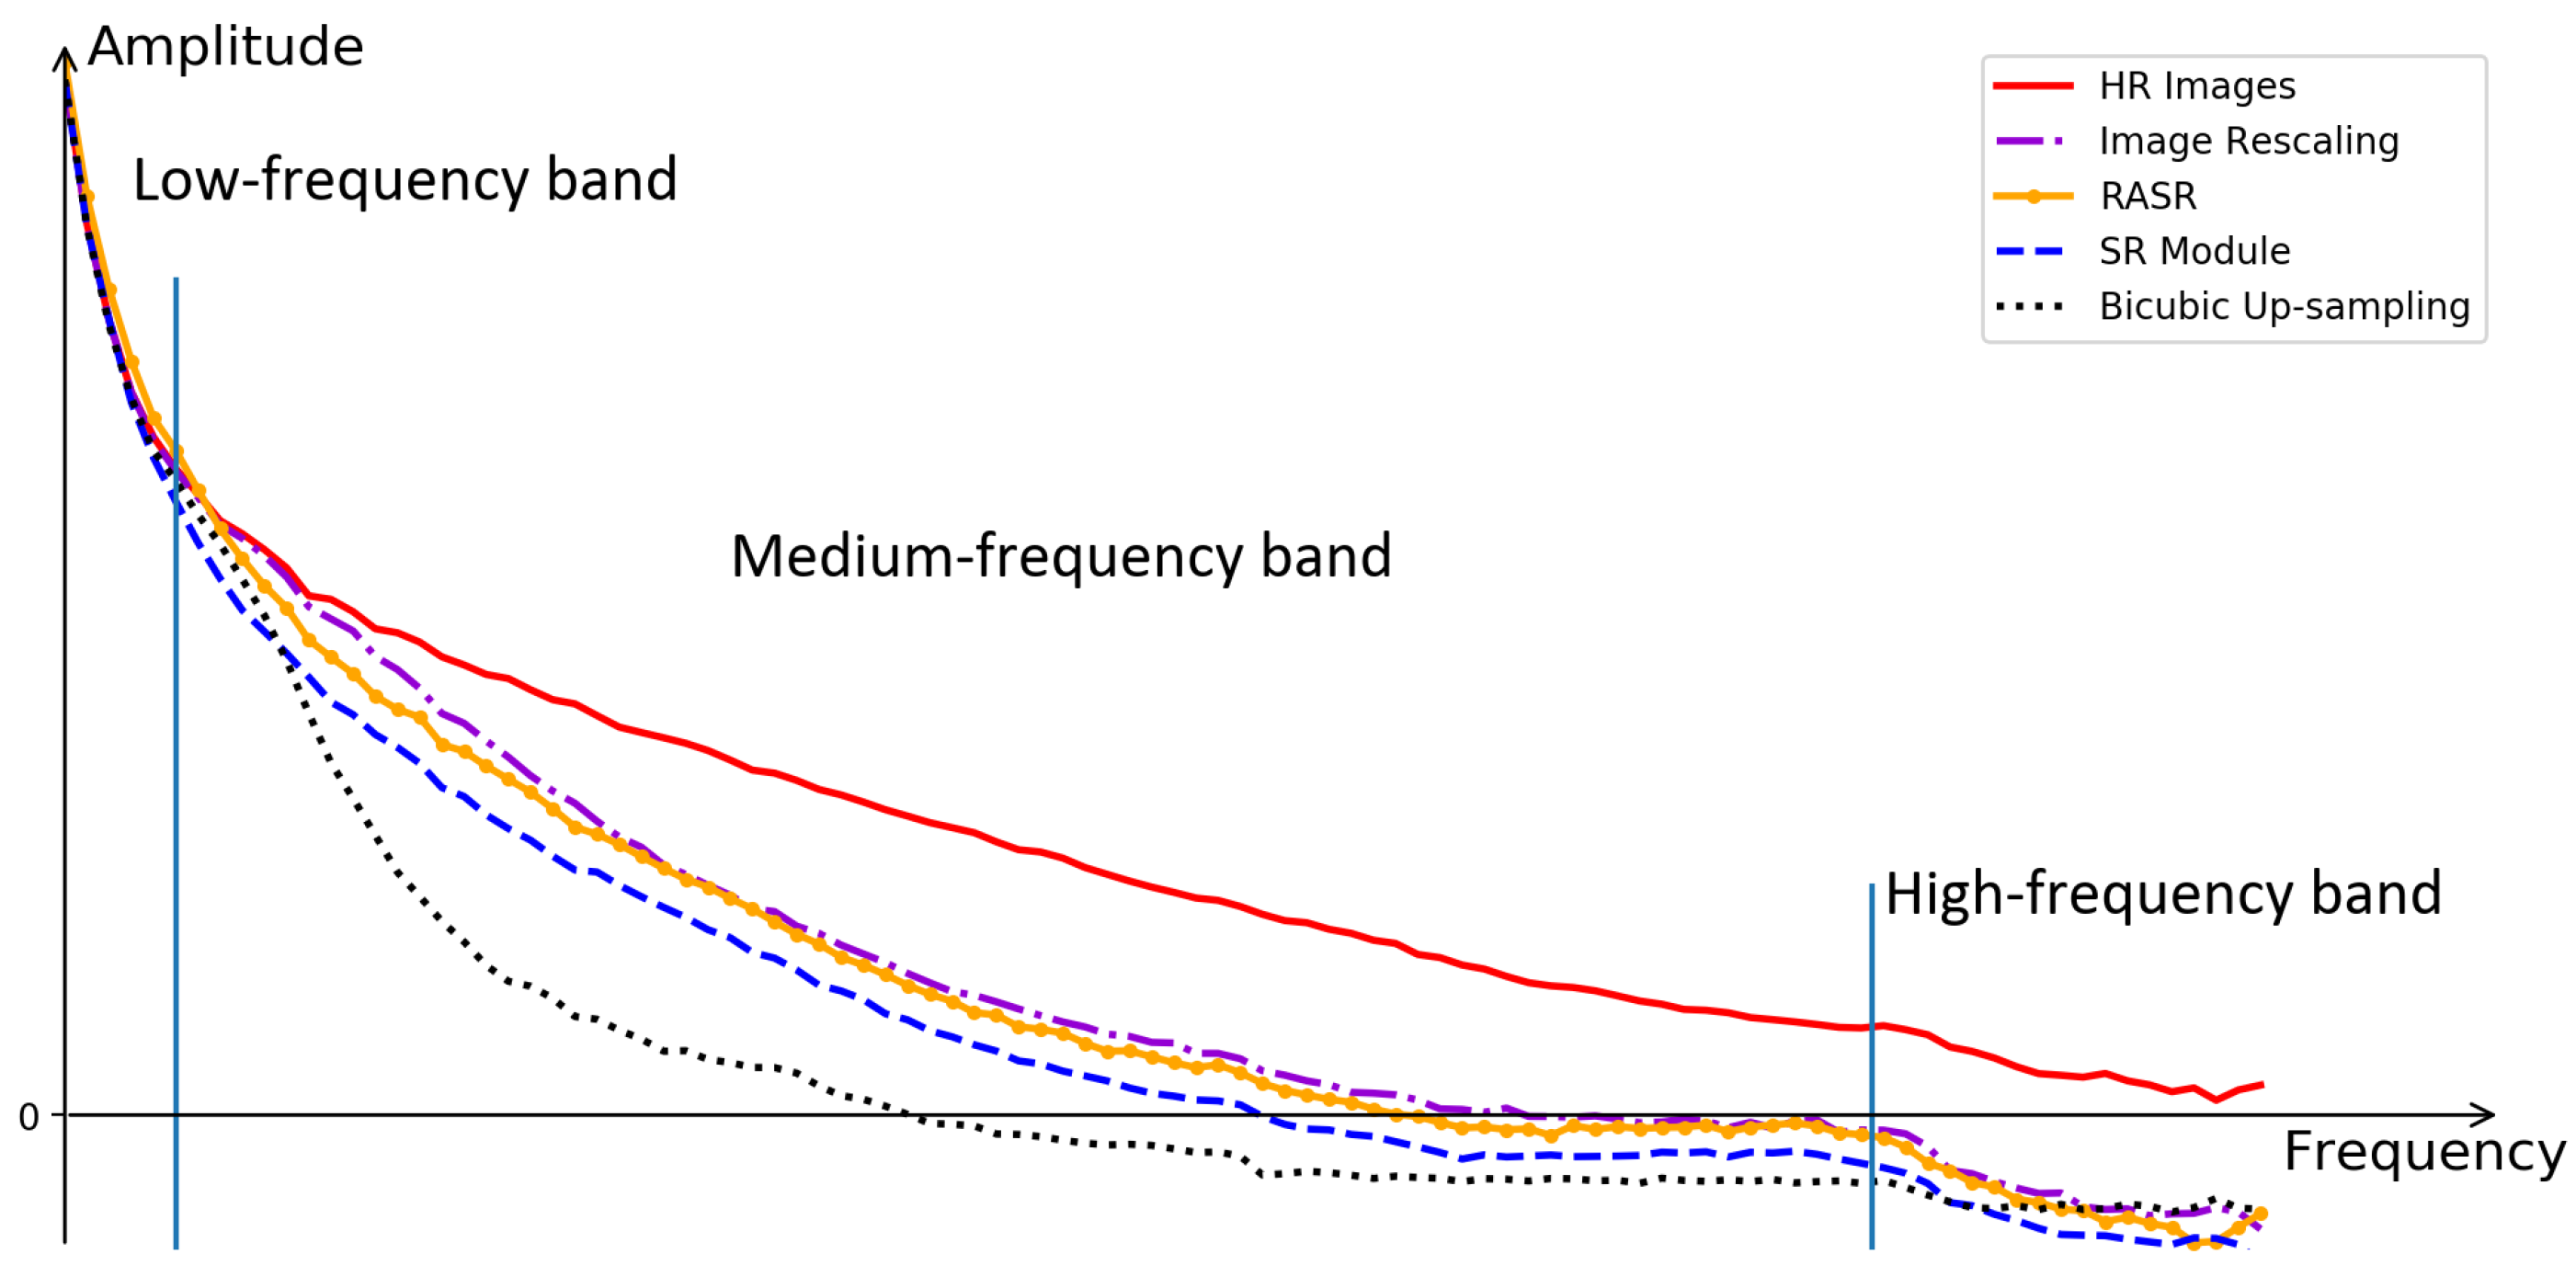
4.2.1. Effectiveness of RASR for Image SR
4.2.2. Effectiveness of RASR for Ship Detection
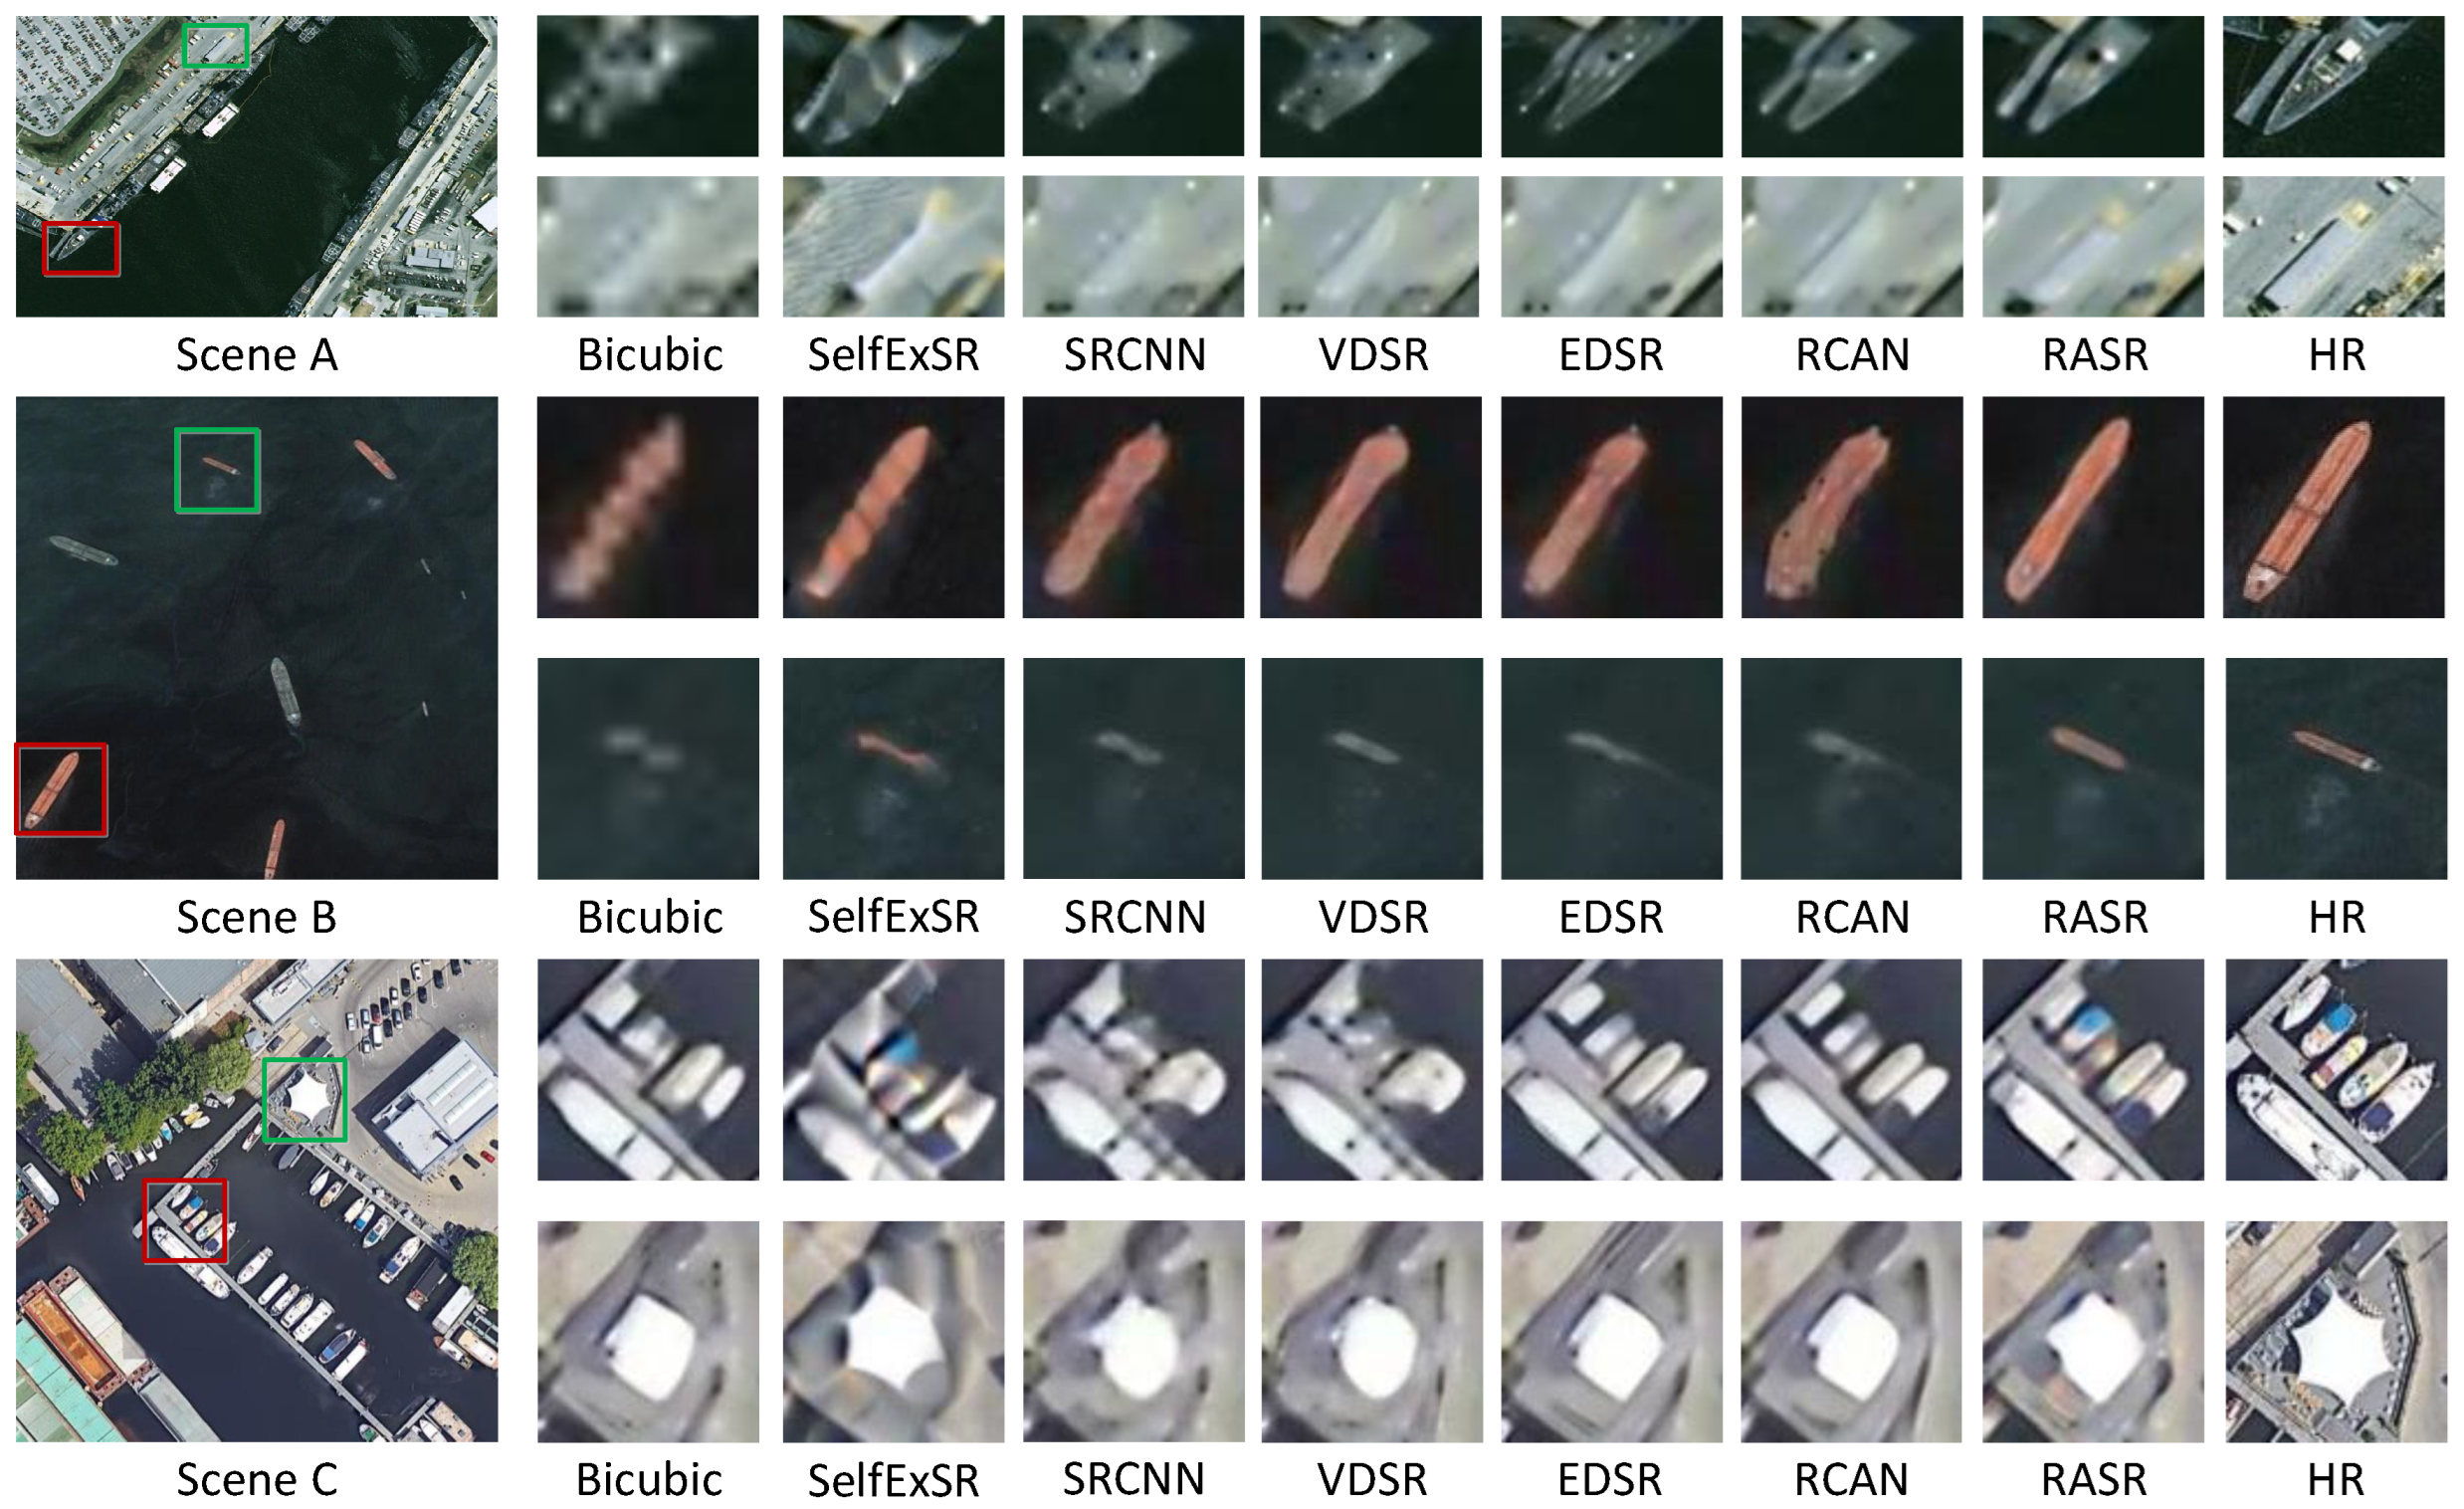
4.3. Comparison to the State-of-the-Art Methods
4.3.1. Comparison with SR Methods
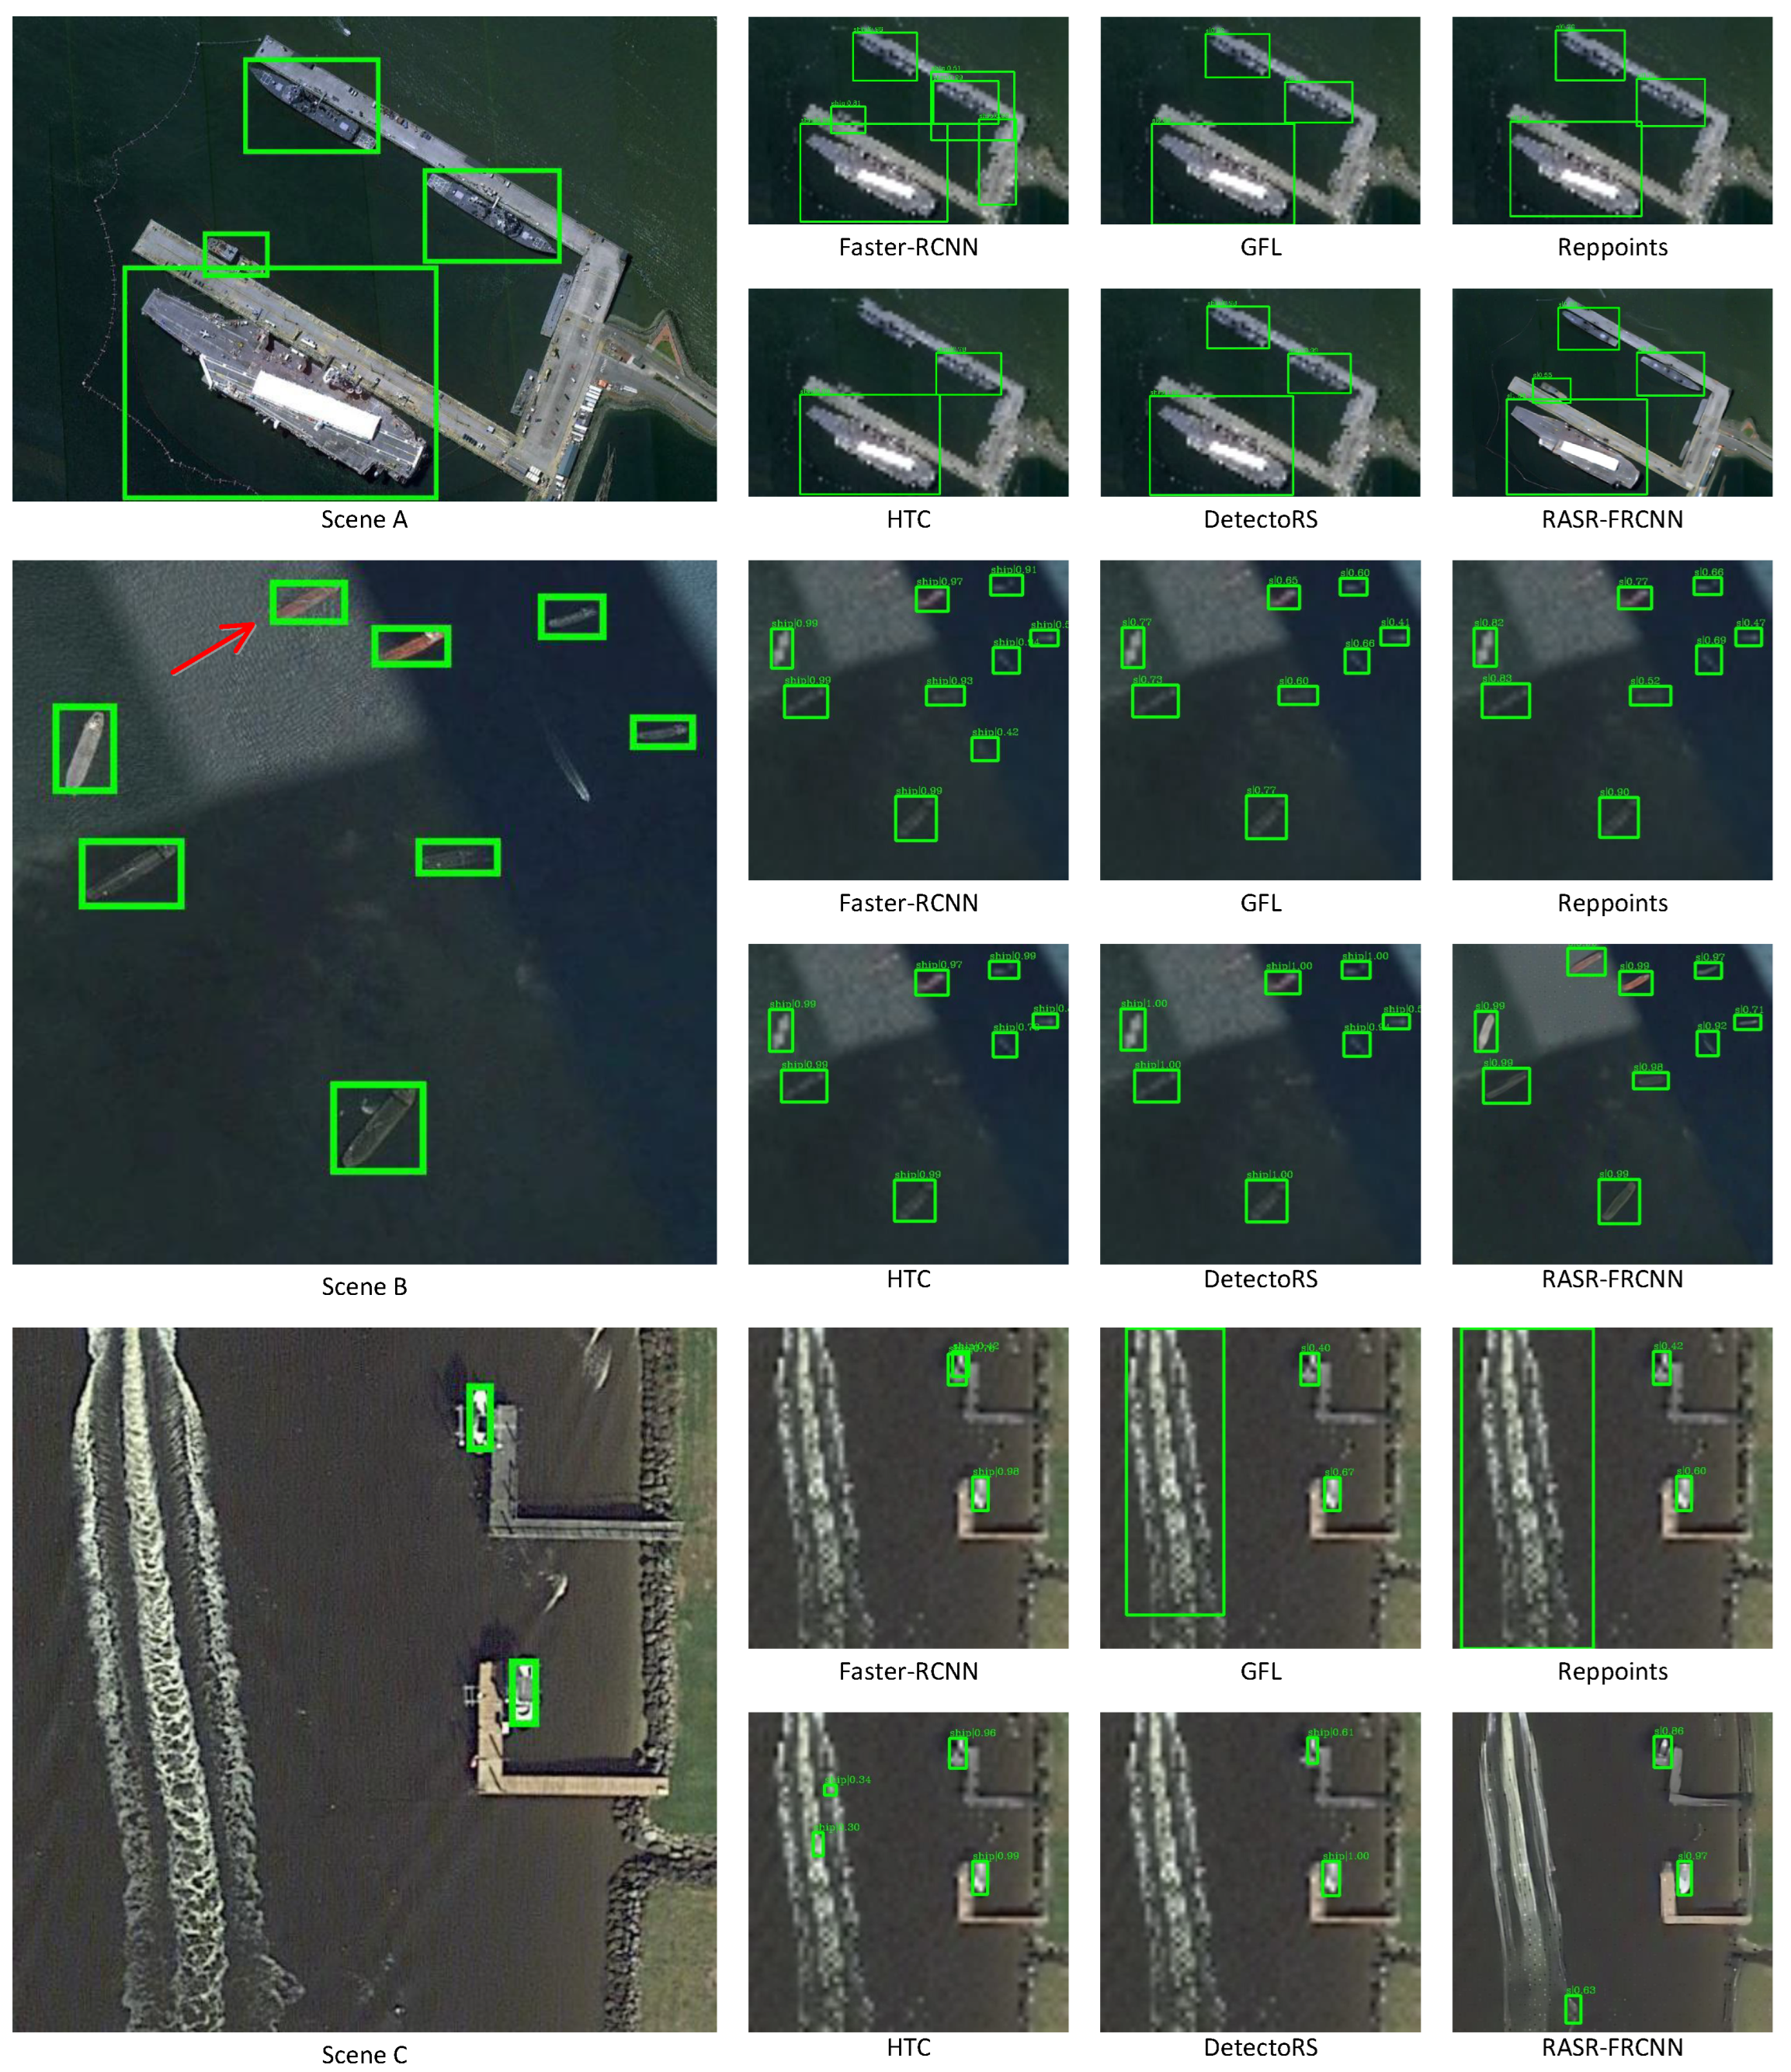
4.3.2. Comparison with Detection Methods
5. Conclusions
Author Contributions
Funding
Data Availability Statement
Conflicts of Interest
Abbreviations
| M-LR | Medium-low resolution |
| GSD | Ground sample distance |
| SR | Super-resolution |
| RASR | Rescaling assisted super-resolution |
| RASR-Det | Detection framework with RASR as a pre-processing approach |
| HR | High resolution |
| CNN | Convolution neutral network |
| VDSR | Very deep super-resolution network |
| RDN | Residual dense network |
| EESRGAN | Edge-enhanced super-resolution generative adversarial network |
| Faster-RCNN | Method in paper ”Faster-RCNN: Towards real-time object detection |
| with region proposal networks” | |
| FCOS | Fully Convolutional One-Stage Object Detection |
| ResNet50 | Deep residual network with 50 convolution and fully connection layers |
| ResNet101 | Deep residual network with 101 convolution and fully connection layers |
| GAN | Generative adversarial network |
| RDB | Residual dense block |
| HRSC2016 | High resolution ship collections 2016 |
| DOTA | A Large-scale Dataset for Object Detection in Aerial Images |
| NWPU VHR-10 | A challenging 10-class geospatial object detection dataset |
| SGD | Stochastic gradient descent |
| MMDetection | Open MMLab Detection Toolbox and Benchmark |
| PSNR | Peak signal-to-noise ratio |
| SSIM | Structural similarity |
| MSE | Mean squared error |
| RGB | Red-green-blue |
| AP | Average precision |
| IoU | Intersection over union |
| Average precision with intersection over union being 0.50 | |
| Average precision for small targets | |
| Average precision for medium targets | |
| Average precision for large targets | |
| COCO | Microsoft COCO: Common Objects in Context |
| dB | Decibel |
| SRCNN | Super-Resolution Convolutional Neural Network |
| EDSR | Enhanced deep residual super-resolution network |
| RCAN | Residual channel attention network |
| RASR-Faster-RCNN | Detection method integrating RASR and Faster-RCNN |
| GFL | Generalized focal loss |
| Reppoints | Point Set Representation for object detection |
| HTC | Hybrid task cascade for instance segmentation |
| DetectoRS | Detecting objects with recursive feature pyramid and |
| switchable atrous convolution | |
| MB | Million bytes |
References
- Zhang, X.; Wang, G.; Zhu, P.; Zhang, T.; Li, C.; Jiao, L. GRS-Det: An anchor-free rotation ship detector based on Gaussian-mask in remote sensing images. IEEE Trans. Geosci. Remote. Sens. 2020, 59, 3518–3531. [Google Scholar] [CrossRef]
- Yu, Y.; Yang, X.; Li, J.; Gao, X. A cascade rotated anchor-aided detector for ship detection in remote sensing images. IEEE Trans. Geosci. Remote. Sens. 2020, 60, 1–14. [Google Scholar] [CrossRef]
- Li, L.; Zhou, Z.; Wang, B.; Miao, L.; Zong, H. A novel CNN-based method for accurate ship detection in HR optical remote sensing images via rotated bounding box. IEEE Trans. Geosci. Remote. Sens. 2020, 59, 686–699. [Google Scholar] [CrossRef]
- Dong, X.; Wang, L.; Sun, X.; Jia, X.; Gao, L.; Zhang, B. Remote Sensing Image Super-Resolution Using Second-Order Multi-Scale Networks. IEEE Trans. Geosci. Remote. Sens. 2020, 59, 3473–3485. [Google Scholar] [CrossRef]
- Rabbi, J.; Ray, N.; Schubert, M.; Chowdhury, S.; Chao, D. Small-Object Detection in Remote Sensing Images with End-to-End Edge-Enhanced GAN and Object Detector Network. Remote Sens. 2020, 12, 1432. [Google Scholar] [CrossRef]
- Courtrai, L.; Pham, M.; Lefèvre, S. Small Object Detection in Remote Sensing Images Based on Super-Resolution with Auxiliary Generative Adversarial Networks. Remote Sens. 2020, 12, 3152. [Google Scholar] [CrossRef]
- Wang, B.; Lu, T.; Zhang, Y. Feature-Driven Super-Resolution for Object Detection. In Proceedings of the IEEE CRC, Wuhan, China, 16–18 October 2020; pp. 211–215. [Google Scholar]
- Noh, J.; Bae, W.; Lee, W.; Seo, J.; Kim, G. Better to follow, follow to be better: Towards precise supervision of feature super-resolution for small object detection. In Proceedings of the IEEE ICCV, Seoul, Korea, 27 October–2 November 2019; pp. 9725–9734. [Google Scholar]
- Wang, Z.; Chen, J.; Hoi, S.C. Deep learning for image super-resolution: A survey. IEEE Trans. Pattern Anal. Mach. Intell. 2020, 43, 3365–3387. [Google Scholar] [CrossRef] [PubMed] [Green Version]
- Li, J.; Pei, Z.; Zeng, T. From Beginner to Master: A Survey for Deep Learning-based Single-Image Super-Resolution. arXiv 2021, arXiv:2109.14335. [Google Scholar]
- Dong, C.; Loy, C.C.; He, K.; Tang, X. Learning a deep convolutional network for image super-resolution. In Proceedings of the ECCV, Zurich, Switzerland, 6–12 September 2014; Springer: Berlin/Heidelberg, Germany, 2014; pp. 184–199. [Google Scholar]
- Kim, J.; Kwon Lee, J.; Mu Lee, K. Accurate image super-resolution using very deep convolutional networks. In Proceedings of the IEEE CVPR, Las Vegas, NV, USA, 27–30 June 2016; pp. 1646–1654. [Google Scholar]
- Zhang, Y.; Tian, Y.; Kong, Y.; Zhong, B.; Fu, Y. Residual dense network for image super-resolution. arXiv 2018, arXiv:1802.08797v2. [Google Scholar]
- He, K.; Zhang, X.; Ren, S.; Sun, J. Deep residual learning for image recognition. In Proceedings of the IEEE CVPR, Las Vegas, NV, USA, 27–30 June 2016; pp. 770–778. [Google Scholar]
- Huang, G.; Liu, Z.; Van Der Maaten, L.; Weinberger, K.Q. Densely connected convolutional networks. In Proceedings of the IEEE CVPR, Honolulu, HI, USA, 21–26 July 2017; pp. 4700–4708. [Google Scholar]
- Li, J.; Fang, F.; Mei, K.; Zhang, G. Multi-scale residual network for image super-resolution. In Proceedings of the ECCV, Munich, Germany, 8–14 September 2018; pp. 517–532. [Google Scholar]
- Wang, L.; Dong, X.; Wang, Y.; Ying, X.; Lin, Z.; An, W.; Guo, Y. Exploring Sparsity in Image Super-Resolution for Efficient Inference. In Proceedings of the IEEE CVPR, Nashville, TN, USA, 20–25 June 2021; pp. 4917–4926. [Google Scholar]
- Wang, L.; Wang, Y.; Dong, X.; Xu, Q.; Yang, J.; An, W.; Guo, Y. Unsupervised Degradation Representation Learning for Blind Super-Resolution. In Proceedings of the IEEE CVPR, Nashville, TN, USA, 20–25 June 2021; pp. 10581–10590. [Google Scholar]
- Kim, H.; Choi, M.; Lim, B.; Lee, K.M. Task-aware image downscaling. In Proceedings of the ECCV, Munich, Germany, 8–14 September 2018; pp. 399–414. [Google Scholar]
- Sun, W.; Chen, Z. Learned image downscaling for upscaling using content adaptive resampler. IEEE Trans. Image Process. 2020, 29, 4027–4040. [Google Scholar] [CrossRef] [PubMed] [Green Version]
- Xiao, M.; Zheng, S.; Liu, C.; Wang, Y.; He, D.; Ke, G.; Bian, J.; Lin, Z.; Liu, T.Y. Invertible image rescaling. In Proceedings of the ECCV, Glasgow, UK, 23–28 August 2020; Springer: Berlin/Heidelberg, Germany, 2020; pp. 126–144. [Google Scholar]
- Ren, S.; He, K.; Girshick, R.; Sun, J. Faster R-CNN: Towards real-time object detection with region proposal networks. IEEE Trans. Pattern Anal. Mach. Intell. 2016, 39, 1137–1149. [Google Scholar] [CrossRef] [PubMed] [Green Version]
- Liu, W.; Anguelov, D.; Erhan, D.; Szegedy, C.; Reed, S.; Fu, C.Y.; Berg, A.C. SSD: Single shot multibox detector. In Proceedings of the ECCV, Amsterdam, The Netherlands, 11–14 October 2016; Springer: Berlin/Heidelberg, Germany, 2016; pp. 21–37. [Google Scholar]
- Zou, H.; He, S.; Wang, Y.; Li, R.; Cheng, F.; Cao, X. Ship detection based on medium-low resolution remote sensing data and super-resolved feature representation. Remote Sens. Lett. 2022, 13, 323–333. [Google Scholar] [CrossRef]
- He, S.; Zou, H.; Wang, Y.; Li, R.; Cheng, F.; Cao, X.; Li, M. Enhancing Mid–Low-Resolution Ship Detection With High-Resolution Feature Distillation. IEEE Geosci. Remote. Sens. Lett. 2021, 19, 1–5. [Google Scholar] [CrossRef]
- Lee, W.; Lee, J.; Kim, D.; Ham, B. Learning with privileged information for efficient image super-resolution. In Proceedings of the ECCV, Virtual, 15 August 2020; Springer: Berlin/Heidelberg, Germany, 2020; pp. 465–482. [Google Scholar]
- He, K.; Zhang, X.; Ren, S.; Sun, J. Delving deep into rectifiers: Surpassing human-level performance on imagenet classification. In Proceedings of the IEEE ICCV, Santiago, Chile, 7–13 December 2015; pp. 1026–1034. [Google Scholar]
- Shi, W.; Caballero, J.; Huszár, F.; Totz, J.; Aitken, A.P.; Bishop, R.; Rueckert, D.; Wang, Z. Real-time single image and video super-resolution using an efficient sub-pixel convolutional neural network. In Proceedings of the IEEE CVPR, Las Vegas, NV, USA, 27–30 June 2016; pp. 1874–1883. [Google Scholar]
- Liu, Z.; Yuan, L.; Weng, L.; Yang, Y. A High Resolution Optical Satellite Image Dataset for Ship Recognition and Some New Baselines. In Proceedings of the International Conference on Pattern Recognition Applications and Methods, Porto, Portugal, 24–26 February 2017; Volume 2, pp. 324–331. [Google Scholar]
- Xia, G.S.; Bai, X.; Ding, J.; Zhu, Z.; Belongie, S.; Luo, J.; Datcu, M.; Pelillo, M.; Zhang, L. DOTA: A large-scale dataset for object detection in aerial images. In Proceedings of the IEEE CVPR, Salt Lake City, UT, USA, 18–22 June 2018; pp. 3974–3983. [Google Scholar]
- Cheng, G.; Han, J.; Zhou, P.; Guo, L. Multi-class geospatial object detection and geographic image classification based on collection of part detectors. J. Photogramm. Remote. Sens. 2014, 98, 119–132. [Google Scholar] [CrossRef]
- Kingma, D.P.; Ba, J. Adam: A method for stochastic optimization. arXiv 2014, arXiv:1412.6980. [Google Scholar]
- Everingham, M.; Winn, J. The pascal visual object classes challenge 2012 (VOC2012) development kit. Pattern Anal. Stat. Model. Comput. Learn. Tech. Rep 2011, 8, 5. [Google Scholar]
- Tian, Z.; Shen, C.; Chen, H.; He, T. Fcos: Fully convolutional one-stage object detection. In Proceedings of the IEEE ICCV, Seoul, Korea, 27 October–2 November 2019; pp. 9627–9636. [Google Scholar]
- Huang, J.B.; Singh, A.; Ahuja, N. Single Image Super-resolution from Transformed Self-Exemplars. In Proceedings of the Proceedings of the IEEE Conference on Computer Vision and Pattern Recognition, Boston, MA, USA, 7–12 June 2015; pp. 5197–5206. [Google Scholar]
- Lim, B.; Son, S.; Kim, H.; Nah, S.; Mu Lee, K. Enhanced deep residual networks for single image super-resolution. In Proceedings of the IEEE CVPRW, Honolulu, HI, USA, 21–26 July 2017; pp. 136–144. [Google Scholar]
- Zhang, Y.; Li, K.; Li, K.; Wang, L.; Zhong, B.; Fu, Y. Image super-resolution using very deep residual channel attention networks. In Proceedings of the ECCV, Munich, Germany, 8–14 September 2018; pp. 286–301. [Google Scholar]
- Li, X.; Wang, W.; Wu, L.; Chen, S.; Hu, X.; Li, J.; Tang, J.; Yang, J. Generalized Focal Loss: Learning Qualified and Distributed Bounding Boxes for Dense Object Detection. arXiv 2020, arXiv:2006.04388. [Google Scholar]
- Yang, Z.; Liu, S.; Hu, H.; Wang, L.; Lin, S. Reppoints: Point set representation for object detection. In Proceedings of the IEEE ICCV, Seoul, Korea, 27 October–2 November 2019; pp. 9657–9666. [Google Scholar]
- Chen, K.; Pang, J.; Wang, J.; Xiong, Y.; Li, X.; Sun, S.; Feng, W.; Liu, Z.; Shi, J.; Ouyang, W.; et al. Hybrid task cascade for instance segmentation. In Proceedings of the IEEE CVPR, Long Beach, CA, USA, 15–20 June 2019; pp. 4974–4983. [Google Scholar]
- Qiao, S.; Chen, L.C.; Yuille, A. Detectors: Detecting objects with recursive feature pyramid and switchable atrous convolution. In Proceedings of the IEEE CVPR, Nashville, TN, USA, 20–25 June 2021; pp. 10213–10224. [Google Scholar]


| Down-Sampling Metrics | Datasets | Bicubic | SR | RASR | |||
|---|---|---|---|---|---|---|---|
| SSIM | PSNR | SSIM | PSNR | SSIM | PSNR | ||
| Bicubic | HRSC2016 [29] | 0.659 | 23.55 | 0.687 | 24.31 | 0.698 | 24.44 |
| DOTA [30] | 0.672 | 25.89 | 0.698 | 26.12 | 0.718 | 26.31 | |
| NWPU VHR-10 [31] | 0.856 | 30.18 | 0.857 | 30.48 | 0.870 | 30.72 | |
| Bicubic + Gaussian Blur | HRSC2016 [29] | 0.627 | 22.65 | 0.664 | 23.42 | 0.697 | 24.25 |
| DOTA [30] | 0.642 | 24.21 | 0.654 | 25.32 | 0.694 | 25.02 | |
| NWPU VHR-10 [31] | 0.841 | 28.71 | 0.838 | 29.57 | 0.856 | 30.38 | |
| Down-Sampling Metrics | Detector | Inputs | Datasets | ||
|---|---|---|---|---|---|
| HRSC2016 [29] | DOTA [30] | NWPU VHR-10 [31] | |||
| Bicubic | Faster-RCNN [22] | Bicubic | 0.788 | 0.633 | 0.861 |
| SR | 0.838 | 0.655 | 0.875 | ||
| RASR | 0.859 (0.021↑) | 0.746 (0.091↑) | 0.894 (0.019↑) | ||
| HR images | 0.894 | 0.847 | 0.921 | ||
| FCOS [34] | Bicubic | 0.478 | 0.513 | 0.822 | |
| SR | 0.626 | 0.597 | 0.852 | ||
| RASR | 0.735 (0.109↑) | 0.695 (0.098↑) | 0.898 (0.046↑) | ||
| HR images | 0.839 | 0.792 | 0.892 | ||
| Bicubic + Gaussian Blur | Faster-RCNN [22] | Bicubic | 0.785 | 0.675 | 0.856 |
| SR | 0.876 | 0.772 | 0.877 | ||
| RASR | 0.884 (0.008↑) | 0.780 (0.008↑) | 0.907 (0.030↑) | ||
| HR images | 0.894 | 0.847 | 0.921 | ||
| FCOS [34] | Bicubic | 0.149 | 0.521 | 0.807 | |
| SR | 0.772 | 0.715 | 0.852 | ||
| RASR | 0.780 (0.008↑) | 0.716 (0.001↑) | 0.898 (0.046↑) | ||
| HR images | 0.839 | 0.792 | 0.892 | ||
| Dataset | Inputs | Evaluation Indices | |||
|---|---|---|---|---|---|
| HRSC2016 [29] | Bicubic | 0.788 | 0.016 | 0.817 | 0.865 |
| SR | 0.838 | 0.050 | 0.863 | 0.891 | |
| RASR | 0.859 (0.021↑) | 0.102 (0.052↑) | 0.884 (0.021↑) | 0.918 (0.027↑) | |
| HR Images | 0.894 | 0.399 | 0.925 | 0.917 | |
| DOTA [30] | Bicubic | 0.633 | 0.631 | 0.739 | 0.258 |
| SR | 0.655 | 0.647 | 0.755 | 0.285 | |
| RASR | 0.746 (0.091↑) | 0.733 (0.086↑) | 0.820 (0.065↑) | 0.338 (0.053↑) | |
| HR Images | 0.847 | 0.842 | 0.892 | 0.460 | |
| NWPU VHR-10 [31] | Bicubic | 0.861 | 0.036 | 0.896 | −1 |
| SR | 0.875 | 0.011 | 0.910 | −1 | |
| RASR | 0.894 (0.019↑) | 0.162 (0.151↑) | 0.913 (0.003↑) | −1 | |
| HR Images | 0.921 | 0.230 | 0.946 | −1 | |
| Method | #Param. | Time | HRSC2016 | DOTA | NWPU VHR-10 | |||
|---|---|---|---|---|---|---|---|---|
| SSIM | PSNR | SSIM | PSNR | SSIM | PSNR | |||
| SelfExSR [35] | None | 37.878 s | 0.670 | 24.09 | 0.625 | 24.64 | 0.856 | 30.48 |
| RCAN [37] | 15.66 M | 69.746 ms | 0.689 | 24.30 | 0.704 | 26.63 | 0.861 | 30.29 |
| SRCNN [11] | 0.12 M | 15.944 ms | 0.672 | 23.82 | 0.682 | 26.06 | 0.861 | 30.59 |
| EDSR [36] | 39.17 M | 42.114 ms | 0.683 | 24.01 | 0.701 | 26.51 | 0.863 | 30.62 |
| VDSR [12] | 0.67 M | 29.978 ms | 0.677 | 23.92 | 0.686 | 23.11 | 0.863 | 30.71 |
| RASR | 2.50 M | 38.626 ms | 0.698 | 24.10 | 0.718 | 26.31 | 0.870 | 30.72 |
| Method | Datasets | ||
|---|---|---|---|
| HRSC2016 [29] | DOTA [30] | NWPU VHR-10 [31] | |
| GFL [38] | 0.826 | 0.575 | 0.856 |
| Reppoints [39] | 0.792 | 0.592 | 0.875 |
| HTC [40] | 0.634 | 0.668 | 0.863 |
| DetectoRS [41] | 0.860 | 0.677 | 0.808 |
| Faster-RCNN [22] | 0.820 | 0.651 | 0.853 |
| RASR-Faster-RCNN | 0.873 | 0.737 | 0.884 |
Publisher’s Note: MDPI stays neutral with regard to jurisdictional claims in published maps and institutional affiliations. |
© 2022 by the authors. Licensee MDPI, Basel, Switzerland. This article is an open access article distributed under the terms and conditions of the Creative Commons Attribution (CC BY) license (https://creativecommons.org/licenses/by/4.0/).
Share and Cite
Zou, H.; He, S.; Cao, X.; Sun, L.; Wei, J.; Liu, S.; Liu, J. Rescaling-Assisted Super-Resolution for Medium-Low Resolution Remote Sensing Ship Detection. Remote Sens. 2022, 14, 2566. https://doi.org/10.3390/rs14112566
Zou H, He S, Cao X, Sun L, Wei J, Liu S, Liu J. Rescaling-Assisted Super-Resolution for Medium-Low Resolution Remote Sensing Ship Detection. Remote Sensing. 2022; 14(11):2566. https://doi.org/10.3390/rs14112566
Chicago/Turabian StyleZou, Huanxin, Shitian He, Xu Cao, Li Sun, Juan Wei, Shuo Liu, and Jian Liu. 2022. "Rescaling-Assisted Super-Resolution for Medium-Low Resolution Remote Sensing Ship Detection" Remote Sensing 14, no. 11: 2566. https://doi.org/10.3390/rs14112566
APA StyleZou, H., He, S., Cao, X., Sun, L., Wei, J., Liu, S., & Liu, J. (2022). Rescaling-Assisted Super-Resolution for Medium-Low Resolution Remote Sensing Ship Detection. Remote Sensing, 14(11), 2566. https://doi.org/10.3390/rs14112566