Communication

Fire Radiative Power (FRP) Values for Biogeographical Region and Individual Geostationary HHMMSS Threshold (BRIGHT) Hotspots Derived from the Advanced Himawari Imager (AHI)

by
Chermelle B. Engel
1,2,*,
Simon D. Jones
1,2 and
Karin J. Reinke
1,2
1
Geospatial Science, School of Science, STEM College, RMIT University, Melbourne, VIC 3000, Australia
2
Smartsat Cooperative Research Centre, c/-Eleanor Harrald Building, Lot Fourteen, Frome Rd, Adelaide, SA 5000, Australia
*
Author to whom correspondence should be addressed.
Remote Sens. 2022, 14(11), 2540; https://doi.org/10.3390/rs14112540
Submission received: 7 April 2022 / Revised: 18 May 2022 / Accepted: 24 May 2022 / Published: 26 May 2022
(This article belongs to the Section Remote Sensing Communications)

Abstract

:
The purpose of this research was to derive and evaluate fire radiative power (FRP) values for real-time Biogeographical Region and Individual Geostationary HHMMSS Threshold (BRIGHT)/Advanced Himawari Imager (AHI) hotspots. While BRIGHT/AHI hotspots with 2 km nominal resolution are available every 10 min, they are without FRP values. Here, we present a method to calculate FRP values for BRIGHT/AHI hotspots and compute them over a 12-month period, day and night. FRP distributions from BRIGHT/AHI hotspots and coincident Moderate Resolution Imaging Spectroradiometer (MODIS) and Visible Infrared Imaging Radiometer Suite (VIIRS) hotspots are compared to assess relative agreement, with the distributions found to be broadly similar. Nuanced differences between the sensor FRP values were explored highlighting the need for a deeper understanding of the fire detection and FRP algorithms when doing intercomparisons. Notwithstanding the complexities of FRP intercomparisons, the computationally simple BRIGHT/AHI FRP definition allows for fast and real-time reporting of BRIGHT/AHI hotspots FRP.

1. Introduction

Satellite detections of fires provide fire intelligence for the detection and mapping of active fires and for applications estimating the environmental impact of wildfire such as fire severity [1] and fire emissions [2]. While polar-orbiting satellite data provide fine-scale fire radiative power (FRP) information (given their higher spatial resolution), geostationary satellite data can provide a rich source of FRP information (given their high temporal availability). The Advanced Himawari Imager (AHI), launched in October 2014 onboard the geostationary Himawari-8 satellite [3] and operational in July 2015, takes ten-minute observations over Asia and the South Pacific. AHI data have been used in algorithms developed to detect active fires [4,5,6,7]. One such algorithm, the Biogeographical Region and Individual Geostationary HHMMSS Threshold (BRIGHT/AHI) hotspot algorithm [7], was used operationally during the Australian Black Summer 2019/20 bushfire season and has recently been incorporated into the Geoscience Australia Digital Earth Australia (DEA) hotspots service (https://hotspots.dea.ga.gov.au; registered users; accessed from 21 September 2021). However, BRIGHT/AHI hotspots do not include fire radiative power (FRP) estimates.
Radiance-based FRP equations exist that could be applied to BRIGHT/AHI hotspot data. The first published FRP method [8], known now as the bispectral FRP method, used 3.8 μ m and 11 μ m channel detected subpixel fires to determine fire temperature and fire size (via the proportion of the satellite pixel they occupied). The fire temperature, fire background temperature (taken from surrounding pixels), and fire size allowed for FRP values to be calculated [9]. For example, the Japan Aerospace Exploration Agency (JAXA) Himawari-8 Wild Fire product used the bispectral FRP estimate [4]. Bispectral FRP methods, though, are thought to perform best on higher-spatial-resolution satellites [9]. Study [10] introduced FRP values derived using single-waveband observations, either 3.9 μ m or 2.1 μ m (depending on the intensity of the fire), and defined an association between FRP values and the difference between the fire and “background” eighth-order brightness temperatures for Moderate Resolution Imaging Spectroradiometer (MODIS) observations. Wooster et al. [9,11] similarly used ~4 μ m observations to derive FRP values based on differences between fire and “background” radiance values using experimentally determined fourth-order power-law scaling coefficients. The radiance-based FRP equations of [9,11] (hereafter FRPMIR, where mid-infrared (MIR; ~4 μ m )) have been applied to many satellite platforms, including MODIS [9,11,12], Visible Infrared Imaging Radiometer Suite (VIIRS) [13,14], Geostationary Operational Environmental Satellite (GOES) system [15,16], Meteosat-8 Spinning Enhanced Visible and InfraRed Imager (SEVIRI) [17], and AHI [5].
Here, FRPMIR calculations are applied to BRIGHT/AHI hotspot data. Results for an entire year encompassing all seasons, day and night (of BRIGHT/AHI hotspots), are presented for the whole of Australia and compared to the FRP values of MODIS and VIIRS active hotspots over the same period.

2. Materials and Methods

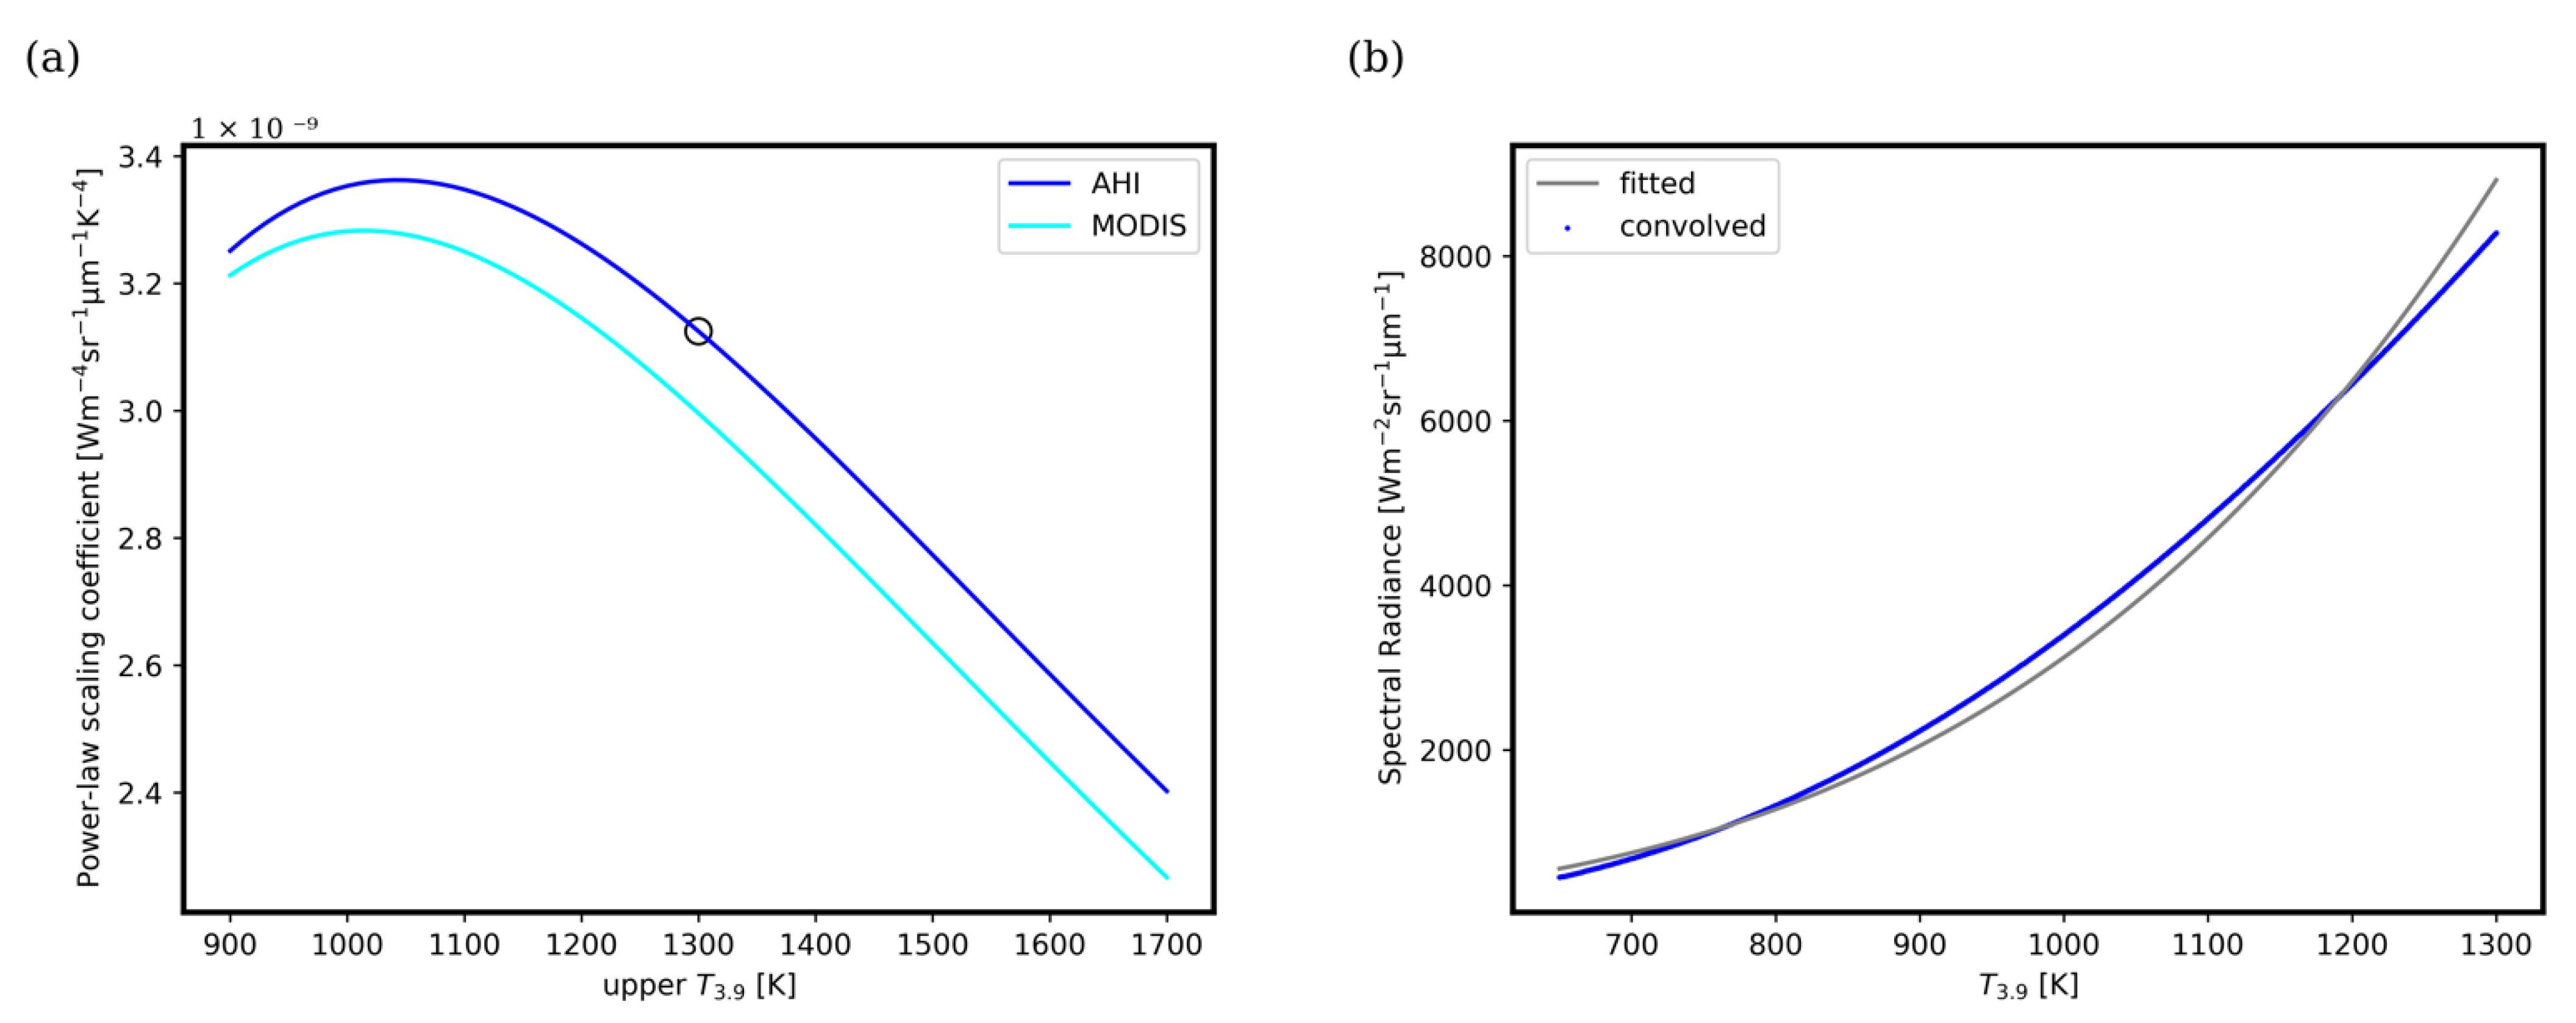
2.1. BRIGHT/AHI FRP Estimates

Twelve months of BRIGHT/AHI hotspot data and the accompanying BRIGHT/AHI thresholds from 1 April 2019, to 31 March 2020, every 10 min, were obtained from Study [7]. Active fire and thermal anomaly systems that deliver FRP values typically derive fire “background” from contextual windows of nearby “cloud-masked” pixels [9,11,12,17,18]. Cloud masks are not currently operationally available for AHI data over the Australian continent. BRIGHT/AHI, therefore, derives bioregional background values from raw (non-cloud-masked) AHI data. Running windows of multivariate AHI data taken at the same time of day (the current day and the 28 days prior) over biogeographical areas are used to filter the current-day data to lower cloud and fire contamination. Percentile values are then taken from the remaining current-day AHI data to determine dynamic BRIGHT/AHI thresholds. One such threshold is the 99th percentile of the filtered 3.9 μ m data from the current bioregion and timestep ( T 3.9 99 % ). BRIGHT/AHI hotspot T3.9 values, along with T 3.9 99 % , can be used to derive BRIGHT/AHI FRP information. (In BRIGHT/AHI, all data points with T3.9 > 350 K are identified as hotspots, even when T 3.9 99 % is unavailable. BRIGHT/AHI hotspots with no T 3.9 99 % value available are excluded from this study).
BRIGHT/AHI FRP values were calculated using the radiance-based FRP equation (based on (Equation (5) in [11]); assuming fires radiate as gray bodies) with the BRIGHT/AHI filtered-statistical MIR threshold used in place of the traditional contextual “background”, i.e.:
F R P A H I 4 × 10 6 × σ a A H I R E F ( L T 3.9   L T 3.9 99 % )   [ W ]
where FRPAHI = total amount of energy (W) emitted by the fire, σ = Stefan–Boltzmann constant ( 5.67 × 10 8   Wm 2 K 4 ), a A H I R E F = the reference AHI power-law scaling constant (derived as part of this study), L T 3.9 = 3.9 μ m observation in terms of radiance ( Wm 2 sr 1 μ m 1 ) , and L T 3.9 99 % = T 3.9 99 % in terms of radiance.
Wooster et al. [9,11] determined the fourth-order power-law scaling coefficients by fitting a fourth-order regression to the Planck equation convolved with the spectral response function (SRF), over a temperature range of 650–1300 K. This process was replicated here using the AHI channel #7 SRF [19] to determine a A H I R E F , with the value given in Section 3. In addition, other MIR ranges were considered with AHI power-law scaling constants ( a A H I ) and MODIS power-law scaling constants ( a M O D I S ) (using [20]) calculated for MIR ranges, with 650 K minimums and maximum values of 900 K through to 1700 K using 10 K intervals (and with 1 K steps between minimum and maximum).

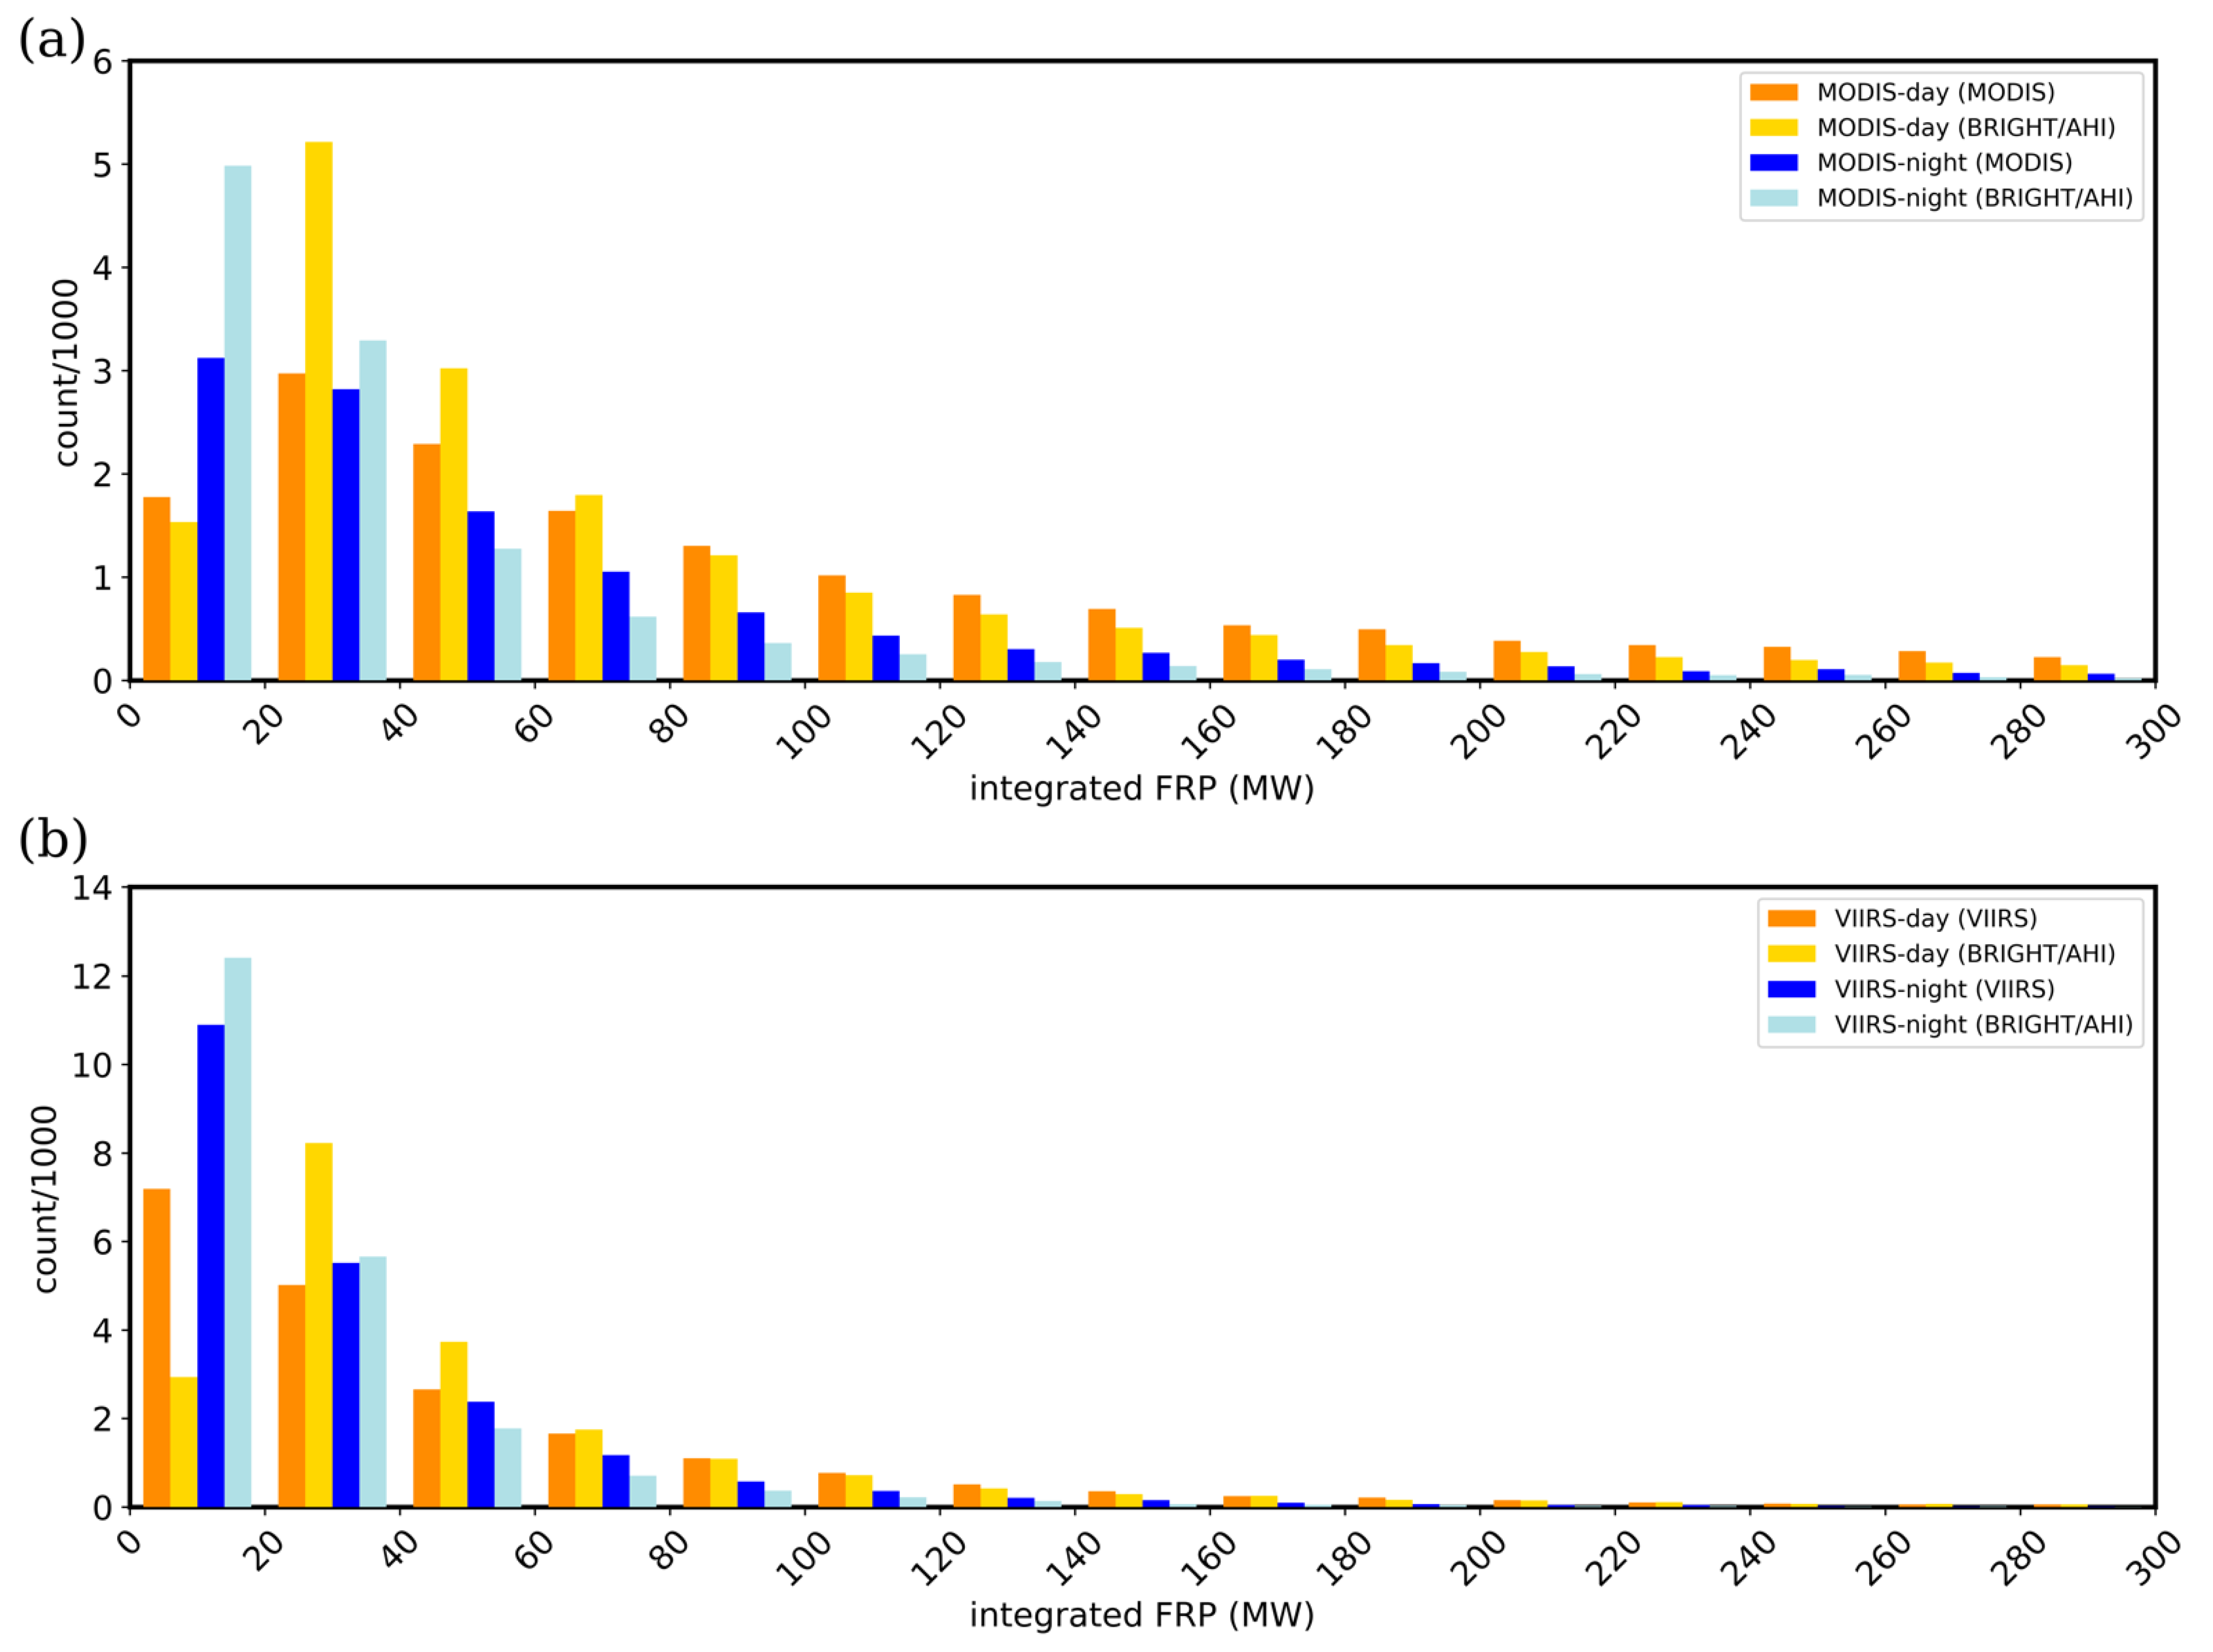
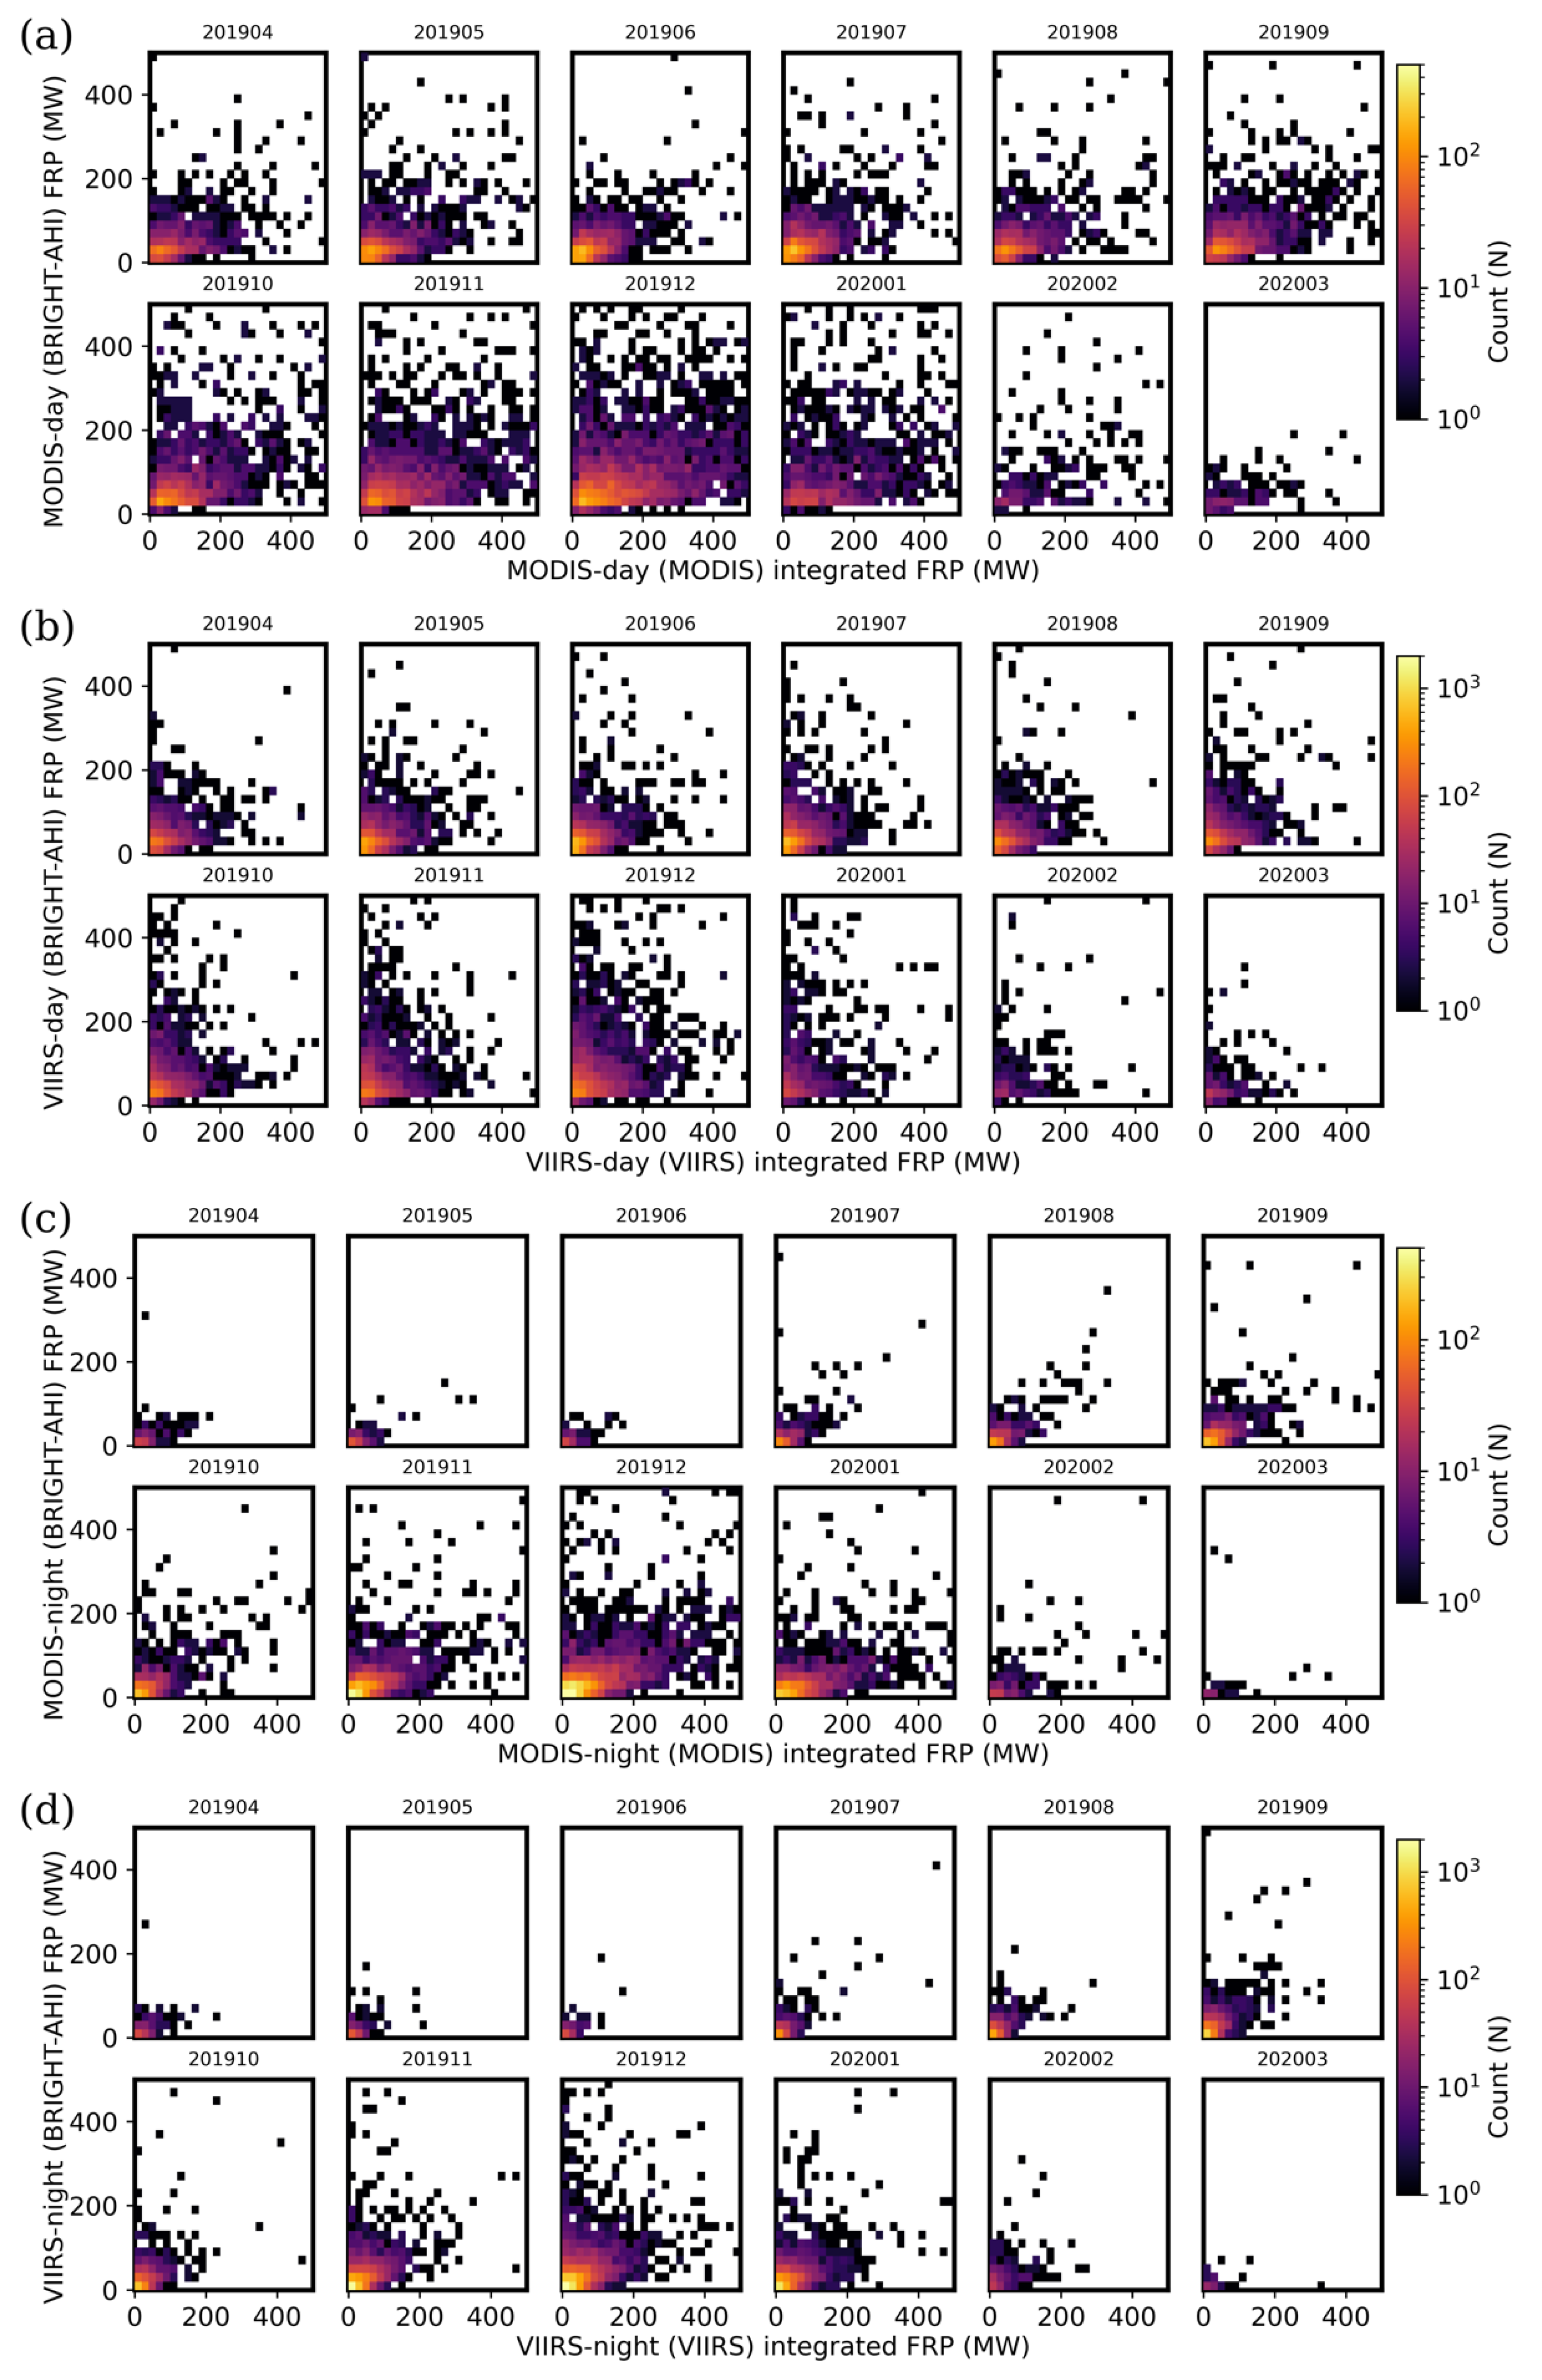
2.2. FRP Intercomparisons

BRIGHT/AHI hotspot FRP values were compared to MODIS and VIIRS 375 m FRP values. Archival quality MODIS (MCD14ML) [12] and VIIRS 375 m (VNP14IMGTML) [18] hotspot data from the Fire Information for Resource Management System (FIRMS) website (https://earthdata.nasa.gov/firms; accessed on 2 October 2018). MODIS hotspots from 1 April 2019 to 30 September 2019 were downloaded on 15 January 2020, while MODIS hotspots from 1 October 2019 to 31 March 2020 were downloaded on 27 July 2020. VIIRS hotspots from 1 April 2019 to 31 March 2020 were downloaded on 24 September 2020. MODIS and VIIRS hotspots had the nearest AHI pixel (in terms of latitude/longitude distance between pixels) and nearest AHI timestamp (in terms of temporal difference between scan times) assigned.
For each acquired time in the MODIS hotspot dataset, MODIS hotspots with the same acquired time were collected to describe one “scene” for comparison. The MODIS acquired time and MODIS day night indicator, AHI nearest timestamp, were recorded, along with a swath reconstructed from the maximum/minimum nearest AHI pixel values [6,7]. VIIRS “scenes” were defined similarly.
For each scene, hotspots from the sensor (i.e., either MODIS or VIIRS) with the acquired timestamp that fell within the reconstructed swath were aggregated onto their nearest AHI pixels. When multiple hotspots fell onto the same AHI pixel (due to differences in sensor spatial resolution), FRP values were summed (integrated), and the maximum MIR brightness temperature value was recorded. BRIGHT/AHI hotspots from the nearest AHI timestamp that fell in the reconstructed swath provided BRIGHT/AHI FRP and MIR values. (BRIGHT/AHI hotspots from the AHI timestamp 10 min prior were also used if no BRIGHT/AHI hotspot had been detected in the nearest AHI timestep at a given pixel in the reconstructed swath). When a sensor (i.e., either MODIS or VIIRS) hotspot occurred at the same AHI pixel as a BRIGHT/AHI hotspot, a match was deemed valid, and both the sensor (i.e., either MODIS or VIIRS) and BRIGHT/AHI FRP and MIR values were retained for further analysis.
Matched hotspots were grouped by the scene sensor and the scene day night indicator: MODIS daytime scenes (MODIS-day), MODIS nighttime scenes (MODIS-night), VIIRS daytime scenes (VIIRS-day), and VIIRS nighttime scenes (VIIRS-night). Matched hotspots, with the same nearest timestamp and AHI pixel, were counted only once (to account for overlapping swath reconstructions).

3. Results

The fitting procedure for a A H I R E F , when an MIR temperature range of 650–1300 K was used (as in [9,11]), is shown in Figure 1b, with a A H I R E F equal to 3.12 × 10 9   Wm 2 sr 1 μ m 1 . a A H I R E F was used in Equation (1) to calculate BRIGHT/AHI FRP estimates.
When other MIR temperature ranges were considered for the a A H I fitting, a peak a A H I of 3.36 × 10 9   Wm 2 sr 1 μ m 1 occurred for an MIR range of 650–1040 K (Figure 1a). a A H I then decreased monotonically as the MIR range kept increasing. a M O D I S varied similarly.
MIR observations saturate at 500 K for MODIS [21], 367 K for VIIRS [14], and 400 K for AHI observations [16]. Saturated MIR values can limit the FRP values. The percentage of matched hotspots with FRP values based on saturated MIR values (Table 1) varied with the sensor. Fifty-three percent (23,488 out of 43,890) of VIIRS-day (VIIRS) matched hotspots and 15% (3598 out of 25,225) of VIIRS-night (VIIRS) matched hotspots had FRP values based on saturated MIR observation values (Table 1; third column). Contrastingly, less than 0.56% of MODIS-day (MODIS) and MODIS-night (MODIS) matched hotspots had FRP values based on saturated MIR observation values (Table 1; third column). The geostationary BRIGHT/AHI matched hotspots were based on saturated MIR observation values ~1% of the time on average across the MODIS and VIIRS samples (Table 1; fourth column).
Twelve-month FRP histograms of BRIGHT/AHI and MODIS/VIIRS non-saturated matched hotspots had broad similarities and nuanced differences. Histograms of FRP values from non-saturated matched hotspots, with 20 MW wide bins and leading edges from 0 MW to 280 MW, are shown in (Figure 2). The broad similarities included: BRIGHT/AHI, MODIS, and VIIRS counts peak below 40 MW, with nonlinear decreases beyond 40 MW and with higher counts in the daytime than nighttime. Nuanced differences exist between the BRIGHT/AHI and MODIS/VIIRS distributions though. In the daytime comparisons (MODIS-day and VIIRS-day), BRIGHT/AHI had higher counts than MODIS or VIIRS for FRP values from 20 MW to 80 MW (Figure 2; orange and yellow), with MODIS and VIIRS counts higher otherwise (Figure 2; orange and yellow). In the nighttime comparisons (MODIS-night and VIIRS-night), BRIGHT/AHI had higher counts of hotspots with FRP values from 0 MW to 40 MW, with MODIS and VIIRS counts higher otherwise (Figure 2).
Twelve-month counts of all non-saturated matched hotspots and for only those with FRP > 300 MW (and their relative percentages) are shown in Table 2. MODIS returned FRP values greater than 300 MW more often (11%) than BRIGHT/AHI (5%). VIIRS and BRIGHT/AHI both returned FRP values greater than 300 MW 1% of the time, but these results likely reflect the exclusion of saturated matched hotspot FRP values.
Month-by-month 2D FRP histograms of non-saturated matched hotspots (Figure 3) again demonstrate the dominance of lower power fires on FRP comparisons. Peak counts occurred in similar FRP values for MODIS (and VIIRS) and BRIGHT/AHI (see Figure 3 color bar; log-scale). Strong disagreements in FRP values were less frequent than more similar FRP values. The highest levels of disagreement (i.e., low FRP in one sample and high FRP in the other) occurred in the months affected by the “Black Summer” Fires [22], i.e., during high-radiative-power wildfires.

4. Discussion

The BRIGHT/AHI FRP method outlined in this study will be incorporated into the DEA hotspots service, thus greatly enhancing the real-time fire information available over Australia for both emergency management and research purposes. Further, there is the potential for the BRIGHT/AHI hotspot and FRP methodology to be expanded to include East Asia and the Western Pacific regions.
The low rate of AHI MIR saturation (Table 1; fourth column) and high (10 min) temporal frequency make BRIGHT/AHI FRP information particularly useful over Australia. Saturated MIR radiance values prevent FRP values from being accurately calculated. The incidence of MIR saturation depends on the pixel size, the saturation limit, and the fire ecology. The AHI MIR saturation value (400 K) and spatial footprint (2 km) [3] resulted in ~1% of coincident matched MODIS-day (BRIGHT/AHI) hotspots hitting saturation, for a 12-month period over Australia, including the catastrophic “Black Summer” fires [22]. The VIIRS 375 m MIR saturation value (367 K) and spatial footprint (375 m) [18] gave the highest count of saturated MIR observations (Table 1), with more than 50% of matched daytime VIIRS hotspots based on saturated VIIRS MIR observations, restricting their use in FRP studies. While the VIIRS saturation frequency can be ameliorated by using combined VIIRS 375 m and VIIRS 750 m FRP data (as mentioned in [23]), the data provided by FIRMS included VIIRS 375 m hotspots only. The MODIS MIR saturation value (500 K) and spatial footprints (1 km) [21] gave the lowest count of saturated MIR observation values (Table 1); however, MODIS observations are available only four times per day including AQUA and TERRA.
Comparisons of FRP values from different sensors and fire detection algorithms require a nuanced understanding of their derivation, even when the same FRP calculation is used. For example, MODIS, VIIRS, and BRIGHT/AHI all use the FRPMIR equations. BRIGHT/AHI FRP estimates, though, use T 3.9 99 % in place of the more traditional contextual background definition used by the MODIS and VIIRS algorithms. T 3.9 99 % represents the 99th percentile of current-day cloud- and fire-filtered AHI T3.9 data over a representative biogeographical area, where filtering is based on a (28-day + current-day) running window of multivariate data over the same biogeographical area. The MODIS and VIIRS algorithms calculate contextual background MIR values for potential fire pixels using statistical information from (current-day) neighboring pixels that have been cloud- and fire-filtered using different definitions. FRP measures between different sensors may vary due to disparities in the definition of the “background” MIR alone, even when using the same FRP calculations.
Despite the different techniques used to approximate the background MIR values and sensor differences in size and timing, BRIGHT/AHI FRP and MODIS/VIIRS FRP distributions were shown to be broadly similar. Specifically, BRIGHT/AHI FRP and MODIS/VIIRS FRP distributions below 300 MW exhibited similar trends, with peaks around 40 MW before monotonically decreasing. For hotspots with FRP > 20 MW, counts were higher during daytime than at nighttime, in line with the FRP diurnal cycle discussed by [24]. The month-by-month FRP/FRP distributions indicated that differences in distributions were generally small, with peaks occurring at similar FRP values (Figure 3) across the different hotspot datasets. Further, the differences between BRIGHT/AHI FRP and MODIS and VIIRS FRP distributions were similar in scale to those reported between MODIS and VIIRS 750 m FRP values [25] and the geostationary GOES-R and SEVIRI systems [16].
BRIGHT/AHI FRP values may tend to underestimate the FRP of large fires in comparison to MODIS FRPs. BRIGHT/AHI hotspot counts peaked more strongly over an FRP range of 20 MW to 80 MW than MODIS hotspot counts (Figure 2a). BRIGHT/AHI hotspot counts tailed off faster than MODIS hotspot counts beyond 80 MW, and BRIGHT/AHI hotspot counts beyond FRP > 300 MW were lower than MODIS hotspot counts (Table 2). These results may reflect the comparatively stability of T 3.9 99 % values in comparison to MODIS and VIIRS “background” MIR values due to differences in sample sizes, dynamic thresholds, and cloud-screening algorithms or, conversely, an inherent conservatism.
FRP values should be interpreted as approximate. The power-law scaling coefficients used in Wooster et al. [9,11] are approximations. When a A H I and a M O D I S were calculated using other MIR ranges, they were not constant. In fact, the changes in a A H I and a M O D I S were nonlinear for the MIR ranges tested in this paper (Figure 1a). These results indicate that, while FRP values are extremely useful, researchers should take care when interpreting FRP values, taking the inherent approximations used in their derivation into account. In addition, researchers should take care when comparing FRPMIR values across sensor systems that the same power-law scaling MIR range assumptions have been used.
Finally, differences between polar-orbiting and geostationary FRP values may be caused by disparities in observation timing (i.e., smoke can move within minutes), sensor viewing angle and spatial resolution and/or failures in cloud masking. The lack of coincident FRP data for geostationary systems limits the evaluation of such intercomparisons to those of matched hotspots, and long-term studies (i.e., 12 months or greater) such as presented here are important to understand these complex associations and capture seasonal variation. Disagreements in FRP values are likely to persist for future inter-sensor FRP comparison studies where variations in sensor characteristics, hotspot detection, and FRP algorithms remain.

5. Conclusions

A method to produce BRIGHT/AHI FRP estimates using T 3.9 99 % in lieu of traditional contextual background values was proposed and evaluated. Considering only non-saturated matched hotspots, BRIGHT/AHI FRP were broadly similar to MODIS and VIIRS FRP distributions despite AHI having a much lower spatial resolution (IFOV: 2 km versus 1 km and 375 m for MODIS and VIIRS, respectively) and despite the differences in sensor and fire detection algorithm characteristics. The more nuanced differences were difficult to compare given the sensor and fire detection algorithm differences. Despite this, given that BRIGHT/AHI hotspots are available every 10 min BRIGHT/AHI FRP may provide a potentially rich data source for FRP investigations and real-time management and monitoring of fires.

Author Contributions

Conceptualization, C.B.E., S.D.J. and K.J.R.; methodology, C.B.E.; software, C.B.E.; validation, C.B.E.; formal analysis, C.B.E.; investigation, C.B.E. and S.D.J.; resources, S.D.J.; data curation, C.B.E.; writing—original draft preparation, C.B.E.; writing—review and editing, C.B.E., S.D.J. and K.J.R.; visualization, C.B.E.; supervision, S.D.J. and K.J.R.; project administration, S.D.J. and K.J.R.; funding acquisition and CIs, S.D.J. and K.J.R. All authors have read and agreed to the published version of the manuscript.

Funding

This research was funded by Smartsat CRC Real Time Fire Analytics (project 3.04).

Data Availability Statement

The data are available upon request.

Acknowledgments

The authors would like to thank the JMA, Tokyo, Japan, and the Australian Bureau of Meteorology for making Himawari-8 data available via the National Computing Infrastructure (NCI) and other means. The Bushfire and Natural Hazards CRC are also acknowledged for their funding support for the development of the BRIGHT hotspot detection algorithm enabling this ongoing work. The authors acknowledge the use of data and/or imagery from NASA’s Fire Information for Resource Management System (FIRMS) (https://earthdata.nasa.gov/firms; accessed on 2 October 2018), part of NASA’s Earth Observing System Data and Information System (EOSDIS).

Conflicts of Interest

The authors declare no conflict of interest. The funders had no role in the design of the study; in the collection, analyses, or interpretation of data; in the writing of the manuscript, or in the decision to publish the results.

References

  1. Keeley, J.E. Fire intensity, fire severity and burn severity: A brief review and suggested usage. Int. J. Wildland Fire 2009, 18, 116–126. [Google Scholar] [CrossRef]
  2. Kaufman, Y.J.; Setzer, A.W.; Justice, C.O.; Tucker, C.J.; Pereira, M.C.; Fung, I. Remote Sensing of Biomass Burning in the Tropics. In Fire in the Tropical Biota; Goldammer, J.G., Ed.; Springer: Berlin/Heidelberg, Germany, 1990. [Google Scholar] [CrossRef]
  3. Bessho, K.; Date, K.; Hayashi, M.; Ikeda, A.; Imai, T.; Inoue, H.; Kumagai, Y.; Miyakawa, T.; Murata, H.; Ohno, T.; et al. An introduction to Himawari 8/9—Japan’s New-Generation Geostationary Meteorological Satellites. J. Meteorol. Soc. Jpn. 2016, 94, 151–183. [Google Scholar] [CrossRef] [Green Version]
  4. Himawari-8 Wild Fire Product. Available online: https://www.eorc.jaxa.jp/ptree/documents/README_H08_L2WLF.txt (accessed on 11 June 2021).
  5. Xu, W.; Wooster, M.J.; Kaneko, T.; He, J.; Zhang, T.; Fisher, D. Major advances in geostationary fire radiative power (FRP) retrieval over Asia and Australia stemming from use of Himawari-8 AHI. Remote Sens. Environ. 2017, 193, 138–149. [Google Scholar] [CrossRef] [Green Version]
  6. Engel, C.B.; Jones, S.D.; Reinke, K. A Seasonal-Window Ensemble-Based Thresholding Technique Used to Detect Active Fires in Geostationary Remotely Sensed Data. IEEE Trans. Geosci. Remote Sens. 2021, 59, 4947–4956. [Google Scholar] [CrossRef]
  7. Engel, C.B.; Jones, S.D.; Reinke, K.J. Real-Time Detection of Daytime and Night-Time Fire Hotspots from Geostationary Satellites. Remote Sens. 2021, 13, 1627. [Google Scholar] [CrossRef]
  8. Dozier, J. A Method for Satellite Identification of Surface Temperature Fields of Subpixel Resolution. Remote Sens. Environ. 1981, 11, 221–229. [Google Scholar] [CrossRef]
  9. Wooster, M.J.; Roberts, G.; Perry, G.L.W.; Kaufman, Y.J. Retrieval of biomass combustion rates and totals from fire radiative power observations: FRP derivation and calibration relationships between biomass consumption and fire radiative energy release. J. Geophys. Res. 2005, 110. [Google Scholar] [CrossRef]
  10. Kaufman, Y.J.; Justice, C.O.; Flynn, L.P.; Kendall, J.D.; Prins, E.M.; Giglio, L.; Ward, D.E.; Menzel, P.; Setzer, A.W. Potential global fire monitoring from EOS-MODIS. J. Geophys. Res. 1998, 103, 32215–32238. [Google Scholar] [CrossRef]
  11. Wooster, M.J.; Zhukov, B.; Oertel, D. Fire radiative energy for quantitative study of biomass burning: Derivation from the BIRD experimental satellite and comparison to MODIS fire products. Remote Sens. Environ. 2003, 86, 83–107. [Google Scholar] [CrossRef]
  12. Giglio, L.; Schroeder, W.; Justice, C.O. The collection 6 MODIS active fire detection algorithm and fire products. Remote Sens. Environ. 2016, 178, 31–41. [Google Scholar] [CrossRef] [PubMed] [Green Version]
  13. Schroeder, W.; Giglio, L. Visible Infrared Imaging Radiometer Suite (VIIRS) 750 m Active Fire Detection and Characterization Algorithm Theoretical Basis Document 1.0; Department of Geographical Sciences, University of Maryland: College Park, MD, USA, 2017. Available online: https://lpdaac.usgs.gov/documents/133/VNP14_ATBD.pdf (accessed on 30 August 2021).
  14. Schroeder, W.; Giglio, L. NASA VIIRS Land Science Investigator Processing System (SIPS) Visible Infrared Imaging Radiometer Suite (VIIRS) 375 m & 750 m Active Fire Products Product User’s Guide Version 1.4; Department of Geographical Sciences, University of Maryland: College Park, MD, USA, 2018. Available online: https://lpdaac.usgs.gov/documents/427/VNP14_User_Guide_V1.pdf (accessed on 30 August 2021).
  15. Schmidt, C.S.; Hoffman, J.; Prins, E.M.; Lindstrom, S. GOES-R Advanced Baseline Imager (ABI) Algorithm Theoretical Basis Document for Fire/Hot Spot Characterization; NOAA NESDIS Center for Satellite Applications and Research: Silver Spring, MD, USA, 2012. Available online: https://www.star.nesdis.noaa.gov/goesr/docs/ATBD/Fire.pdf (accessed on 2 October 2018).
  16. Hall, J.V.; Zhang, R.; Schroeder, W.; Huang, C.; Giglio, L. Validation of GOES-16 ABI and MSG SEVIRI active fire products. Int. J. Appl. Earth Obs. Geoinf. 2019, 83, 101928. [Google Scholar] [CrossRef]
  17. Wooster, M.J.; Roberts, G.; Freeborn, P.H.; Xu, W.; Govaerts, Y.; Beeby, R.; He, J.; Lattanzio, A.; Fisher, D.; Mullen, R. LSA SAF Meteosat FRP products—Part 1: Algorithms, product contents, and analysis. Atmos. Chem. Phys 2015, 15, 13217–13239. [Google Scholar] [CrossRef] [Green Version]
  18. Schroeder, W.; Olivia, P.; Giglio, L.; Czizar, I.A. The New VIIRS 375 m active fire detection data product: Algorithm description and initial assessment. Remote Sens. Environ. 2014, 143, 85–96. [Google Scholar] [CrossRef]
  19. Himawari-8 Spectral Response Functions. Available online: https://www.data.jma.go.jp/mscweb/en/himawari89/space_segment/srf_201309/AHI-08_SpectralResponsivity.zip (accessed on 11 June 2021).
  20. MODIS Channel Number 21 Spectral Response Function. Available online: https://nwp-saf.eumetsat.int/downloads/rtcoef_rttov13/ir_srf/rtcoef_eos_2_modis_srf/rtcoef_eos_2_modis_srf_ch21.txt (accessed on 24 June 2021).
  21. Giglio, L.; Descloitres, J.; Justice, C.O.; Kaufman, Y.J. An Enhanced Contextual Fire Detection Algorithm for MODIS. Remote Sens. Environ. 2003, 87, 273–282. [Google Scholar] [CrossRef]
  22. Collins, L.; Bradstock, R.A.; Clarke, H.; Clarke, M.F.; Nolan, R.H.; Penman, T.D. The 2019/2020 mega-fires exposed Australian ecosystems to an unprecedented extent of high-severity fire. Environ. Res. Lett. 2021, 16, 044029. [Google Scholar] [CrossRef]
  23. Li, F.; Zhang, X.; Kondragunta, S.; Schmidt, C.C.; Holmes, C.D. A preliminary evaluation of GOES-16 active fire product using Landsat-8 and VIIRS active fire data, and ground-based prescribed fire records. Remote Sens. Environ. 2020, 237, 1. [Google Scholar] [CrossRef]
  24. Wiggins, E.B.; Soja, A.J.; Gargulinski, E.; Halliday, H.S.; Pierce, R.B.; Schmidt, C.C.; Nowak, J.B.; DiGangi, J.P.; Diskin, G.S.; Katich, J.M.; et al. High Temporal Resolution Satellite Observations of Fire Radiative Power Reveal Link Between Fire Behavior and Aerosol and Gas Emissions. Geophys. Res. Lett. 2020, 47, e2020GL090707. [Google Scholar] [CrossRef]
  25. Li, F.; Zhang, X.; Kondragunta, S.; Csiszar, I. Comparison of Fire Radiative Power Estimates from VIIRS and MODIS Observations. J. Geophys. Res. Atmos. 2018, 123, 4545–4563. [Google Scholar] [CrossRef]
Figure 1. (a) Power-law scaling coefficients per upper MIR fitted for AHI (3.9 μ m ; channel #7) (dark blue) and MODIS (3.9 μ m ; channel #21) (light blue). (b) The approximated spectral radiances for AHI (3.9 μ m ; channel #7) calculated using MIR range of 650 K to 1300 K (in 1 K intervals), along with the convolved Planck’s Law and AHI SRF (blue). (The black circle shown in (a) shows the AHI power-law scaling coefficient in (b)).
Remotesensing 14 02540 g001
Figure 2. (a) Counts of non-saturated matched hotspots stratified by FRP value (in 20 MW bins) for MODIS-day (MODIS) (orange), MODIS-night (MODIS) (dark blue), MODIS-day (BRIGHT/AHI) (yellow), and MODIS-night (BRIGHT/AHI) (light blue). (b) Same but for VIIRS datasets.
Remotesensing 14 02540 g002
Figure 3. (a) Two-dimensional FRP histograms of month-by-month non-saturated MODIS-day (MODIS) FRP versus MODIS-day (BRIGHT/AHI) FRP values, individual plots for each month start April 2019 and end March 2020 (with the month shown above each plot as YYYYMM). (bd) Same as (a) except for VIIRS-day, MODIS-night, and VIIRS-night, respectively.
Remotesensing 14 02540 g003
Table 1. Number of all matched hotspots in year-long Australia-wide sample, along with the respective number of matched hotspots calculated using saturated MIR values (in terms of count and percentage of the total count), where polar means MODIS or VIIRS, and geo means BRIGHT/AHI.
Total CountCount Saturated
(Polar)
Count Saturated
(Geo)
MODIS-day18,081101 (0.56%)230 (1.27%)
MODIS-night11,82134 (0.29%)51(0.43%)
VIIRS-day43,89023,488 (53.32%)500 (1.14%)
VIIRS-night25,2253598 (14.26%)95 (0.38%)
Table 2. Number of non-saturated matched hotspots in year-long Australia-wide sample, along with the respective number of matched hotspots with FRP > 300 MW (in terms of count and percentage of the total count), where polar means MODIS or VIIRS, and geo means BRIGHT/AHI.
Total (Count)Polar > 300 MW (Count)Geo > 300 MW (Count)
MODIS-day17,8092706 (15.2%)1238 (7.0%)
MODIS-night11,749624(5.3%)249 (2.1%)
VIIRS-day20,395222 (1%)368 (1.8%)
VIIRS-night21,62160 (0.3%)98 (0.45%)
Publisher’s Note: MDPI stays neutral with regard to jurisdictional claims in published maps and institutional affiliations.

