Article

Tracking the Early Movements of Northeast China Cold Vortices Using FY-3D MWTS-2 Observations of Brightness Temperature

Center of Data Assimilation for Research and Applications, Nanjing University of Information Science & Technology, Nanjing 210044, China
*
Author to whom correspondence should be addressed.
Remote Sens. 2022, 14(11), 2530; https://doi.org/10.3390/rs14112530
Submission received: 22 April 2022 / Revised: 19 May 2022 / Accepted: 23 May 2022 / Published: 25 May 2022

Abstract

:
The Northeast China cold vortex (NCCV) often occurs in spring and summer, causing extreme weather such as rainstorm and hail in Northeast China. The brightness temperature (TB) observations of Microwave Temperature Sounder-2 (MWTS-2) on board Fengyun-3D (FY-3D), which can provide atmospheric temperature in various vertical layers, are firstly limb-corrected and then applied to track the origin and movement of four NCCV cases in June and July 2019. Results show that a cold core is observed at the location of NCCVs in TB observations of channels 4 and 5, whose peak weighting function (WF) altitudes are 700 and 400 hPa, respectively, indicating the cold structure of NCCVs in the middle and lower troposphere. The TB observations of channels 6 and 7, which measure the atmospheric temperature around 250 and 200 hPa, respectively, capture a warm core structure of NCCVs in the upper troposphere and lower stratosphere. Being less affected by the low-level cloud and rain, TB observations of channels 6 and 7 are applied to identify and track the warm cores of NCCVs. The NCCV tracks of movement identified by MWTS-2 observations compare well with those determined by the 500 hPa geopotential height and the 300 hPa potential vorticity (PV) anomaly from the ERA5 reanalysis. Both clearly show that the NCCVs were originated from high latitudes, then moved southeastward, and finally entered Northeast China. The entire process took several days. Therefore, TB observations of MWTS-2 can be used to identify the precursors of NCCVs and monitor their appearances, developments, and movements in time. With the flourishing development of Fengyun satellite series in China as well as the already existing 40 years of microwave sounder observations worldwide, this research provides a new way to investigate the synoptic and climatological features of NCCVs.

Graphical Abstract

1. Introduction

Cutoff lows are closed low-pressure systems separated from the westerly jet stream in the middle and upper troposphere [1]. East Asia, North America, and Europe are the three major regions with frequent occurrences of cutoff lows in the globe [2]. Northeast China cold vortices (NCCVs) are persistent and quasi-stationary cutoff lows that appear over Northeast China [3]. NCCVs are defined as having a closed contour of geopotential height at 500 hPa and a cold center, being located in the region of 35–60°N, 115–145°E and existing for 3 or more days [4,5,6].
NCCVs could appear throughout the year but most frequently in summer. In fact, about 42% of summer days in Northeast China are affected by NCCVs [7]. Liu et al. (2015) [6] analyzed the NCCVs from May to August from 1948 to 2012 based on the reanalysis data of geopotential height from the National Centers for Environmental Prediction (NCEP) [8] and found that the NCCVs mostly sustained 3–6 days. Huang and Li (2020) [9] employed the ERA-Interim reanalysis [10] to study NCCVs from May to August from 1979 to 2018 and pointed out that the NCCVs mostly originated from the northwest to the northeast of China and moved eastward in summer. According to the historical weather maps in April to October from 1956 to 1990, Sun et al. (1994) [4] showed a seasonal change of the NCCV-active area. They found that NCCVs were mainly active around 52°N in April, then moved southward, and reached the southernmost position near 43°N in June. After June, they slowly moved northward and finally jumped to 52°N in August and stayed there until October. Global reanalysis datasets are excellent for studying the temporal and spatial characteristics of NCCVs but cannot be used to monitor and track the incoming cutoff lows to form NCCVs in real time.
NCCVs often cause cold temperature and persistent rain and flood as well as sudden severe convection in Northeast China [11]. Moreover, despite only a lifetime of several days of an individual NCCV, frequent occurrences of NCCVs could affect the monthly mean temperature in the lower troposphere over Northeast China [12], Meiyu features in East Asia [13], and precipitation in the first rainy season over southern China [14]. He et al. (2006) [13] suggested that if there are frequent and intense activities of NCCVs during the Meiyu period, the dry and cold air from the north could move further to the south, meeting the low-level warm and wet southwest air along the northern edge of the Meiyu region. A vertical structure of dry upper air over wet lower air is favorable for forming an unstable layer conducive to Meiyu rainfall. Therefore, it is important to monitor and study NCCVs from both meteorological and climatological perspectives.
NCCVs have a cold structure in the middle and lower troposphere and a warm and high PV structure in the upper troposphere and lower stratosphere. Zhong et al. (2011) [15] conducted a diagnostic study on an NCCV case in July 2006 with the NCEP reanalysis and found that the NCCV at its mature stage, which was characterized by the 500 hPa temperature trough matching geopotential height trough, had warm and cold structures above and below 300 hPa, respectively. The NCCV-associated high PV dipped down to the middle and lower troposphere. Additionally, using the NCEP reanalysis, Shen et al. (2020) [16] studied 418 cases of NCCV from 2000 to 2018 by dynamic composite method and obtained the warm (cold) structure in the upper (lower) layer in NCCV dynamic composite maps. If these and other features of NCCVs can be spotted in microwave sounding observations of brightness temperature (TB), the TB observations may be used to identify and track NCCVs with real-time satellite observations.
This research explores the possibility of directly monitoring the occurrences and movements of NCCVs with TB observations of Fengyun-3D (FY-3D) Microwave Temperature Sounder-2 (MWTS-2) [17,18]. The first satellite microwave temperature sounder was the Microwave Sounding Unit (MSU) on board the National Oceanic and Atmospheric Administration (NOAA) polar-orbiting satellite Television Infrared Observation Satellite-N (TIROS-N) in 1978, which had only four channels [19]. Since 1998, the Advanced Microwave Sounding Unit-A (AMSU-A) on board NOAA-15 to NOAA-19, and MetOp-A/B/C have added 11 channels [20,21]. More recently, the Advanced Technology Microwave Sounders (ATMS) on board both the Suomi National Polar-orbiting Partnership (S-NPP) and NOAA-20 have been operating with 16 temperature channels, with a new channel added in the lower troposphere [22]. Therefore, there have been more than 40 years of global TB observations from microwave temperature sounders [23]. In China, the first two satellites FY-3A/B of the Chinese second generation polar-orbiting environmental satellite (POES) series Fengyun (FY), which were launched on 27 May 2008 and 5 December 2010, respectively, had been equipped with MWTS, which had the same channel frequencies as MSU [17,18]. The FY-3C and FY-3D launched on 23 September 2013 and 14 November 2017, respectively, were equipped with MWTS-2, which has the same channel frequencies as AMSU-A channels 3–15 [24].
The 13 MWTS-2 channels are located within the 50–60 GHz oxygen band and measure the global atmospheric temperature at different altitudes. So far, some key techniques have been developed for MWTS-2 observations, including data quality control [25], striping noise mitigation [26], and limb correction [27]. MWTS-2 TB observations were successfully applied to study the warm core of typhoons [28,29]. Recently, Niu et al. (2021) [30] pointed out that there are some similarities between the structure of NCCVs and typhoons. They studied the synoptic scale NCCVs using MWTS-2 observations.
This research provides a new way for investigating NCCVs. Compared with the ECMWF reanalysis V5 (ERA5) whose final release would have at least 2–3 months delay [31], polar-orbiting satellites offer global TB observations twice a day and are made available in real time. Radiosonde stations provide real-time data but are too sparse to capture horizontal structures of NCCVs [30]. It is practical to use satellite TB observations for real-time weather monitoring. There are few studies on NCCVs that directly used microwave temperature-sounding observations. Although Niu et al. (2021) [30] creatively verified that the three-dimensional temperature structure of NCCVs can be retrieved from these TB observations, this study is the first attempt to directly apply the microwave temperature-sounding observations for tracking early signals of NCCVs. In this research, four NCCV cases from June to July 2019 are selected to track the origin and movement of NCCVs from MWTS-2 TB observations. Compared with the ERA5 reanalysis, a possibility of using MWTS-2 observations for identifying NCCVs is offered, providing a starting basis for monitoring the occurrence and movement of NCCVs in real time.
This paper is organized as follows. Section 2 briefly describes TB observations of FY-3D MWTS-2 and the ERA5 reanalysis. Section 3 presents a limb correction method applied to MWTS-2 TB observations. Section 4 presents numerical results from a detailed analysis of an arbitrarily selected NCCV case. Vertical structure analysis and tracks of four NCCV cases in June and July 2019 are provided in Section 5. Conclusions and future planned research are provided in Section 6.

2. MWTS-2 Observations and the ERA5 Reanalysis

A meteorological polar-orbiting satellite travels in a circular orbit over the globe at an altitude of about 830 km above the Earth’s surface. It completes roughly 14 orbits around the Earth per day for any remote-sensing instrument on board the satellite to provide two global coverages of observations, which consist of ascending and descending nodes. MWTS-2 on board FY-3D can observe the global atmospheric temperature from the Earth’s surface to about 42 km (or 2 hPa), with 13 oxygen absorption bands whose central frequencies range from 50.3 to 57.6 GHz. These channels primarily measure radiations from the oxygen in the atmosphere, which is mainly determined by the atmospheric temperature, owing to the homogeneous distributions of oxygen in the atmosphere. MWTS-2 scans with a maximum scan angle of 49.5° relative to the nadir, resulting in a swath width of approximately 2350 km. There are 90 fields-of-view (FOVs) along each scan line. The size of the FOV at nadir is about 32 km. Details of channel number, central frequency, and noise equivalent differential temperature (NEDT) are provided in Table 1.
The weighting function (WF) of a channel specifies the relative contribution that each atmospheric layer makes to the radiation emitted to space at a certain wavelength. For a given channel, the greater the WF of a layer, the more the atmosphere of that layer contributes to the TB observations of the channel. In other words, each channel measures the radiation emitted by the atmosphere around the peak WF altitude. WFs of MWTS-2 channels 1–13 calculated by the Radiative Transfer for TIROS Operational Vertical Sounder version 13.0 (RTTOV13.0) [32] with the U.S. standard atmospheric profile [33] as input are shown in Figure 1. The MWTS-2 WFs of different channels nearly evenly distribute in the logarithmic vertical coordinate, making the profiling of atmospheric temperature possible. The peak WF altitudes are provided in Table 1.
The ERA5 reanalysis [31] is the fifth generation of ECMWF reanalysis for the global climate and weather since 1950. Based on the Integrated Forecasting System (IFS) Cy41r2, the ERA5 reanalysis provides hourly estimates of many atmospheric, land, and oceanic climate variables, with 137 vertical model levels from the surface up to 1 Pa. The ERA5 reanalysis is updated daily with a latency of about 5 days, and the final release would be 2–3 months later. Compared with the ERA-Interim reanalysis, the ERA5 reanalysis is endowed with higher temporal and spatial resolutions, making it possible to investigate the evolution of weather systems with more details than other reanalysis datasets. The ERA5 hourly data on 37 pressure levels (listed in Table 2) from 1000 to 1 hPa with horizontal resolution of 0.25° × 0.25°, including 16 atmospheric variables such as geopotential, temperature, and potential vorticity, are used in this research.

3. Limb Correction Method

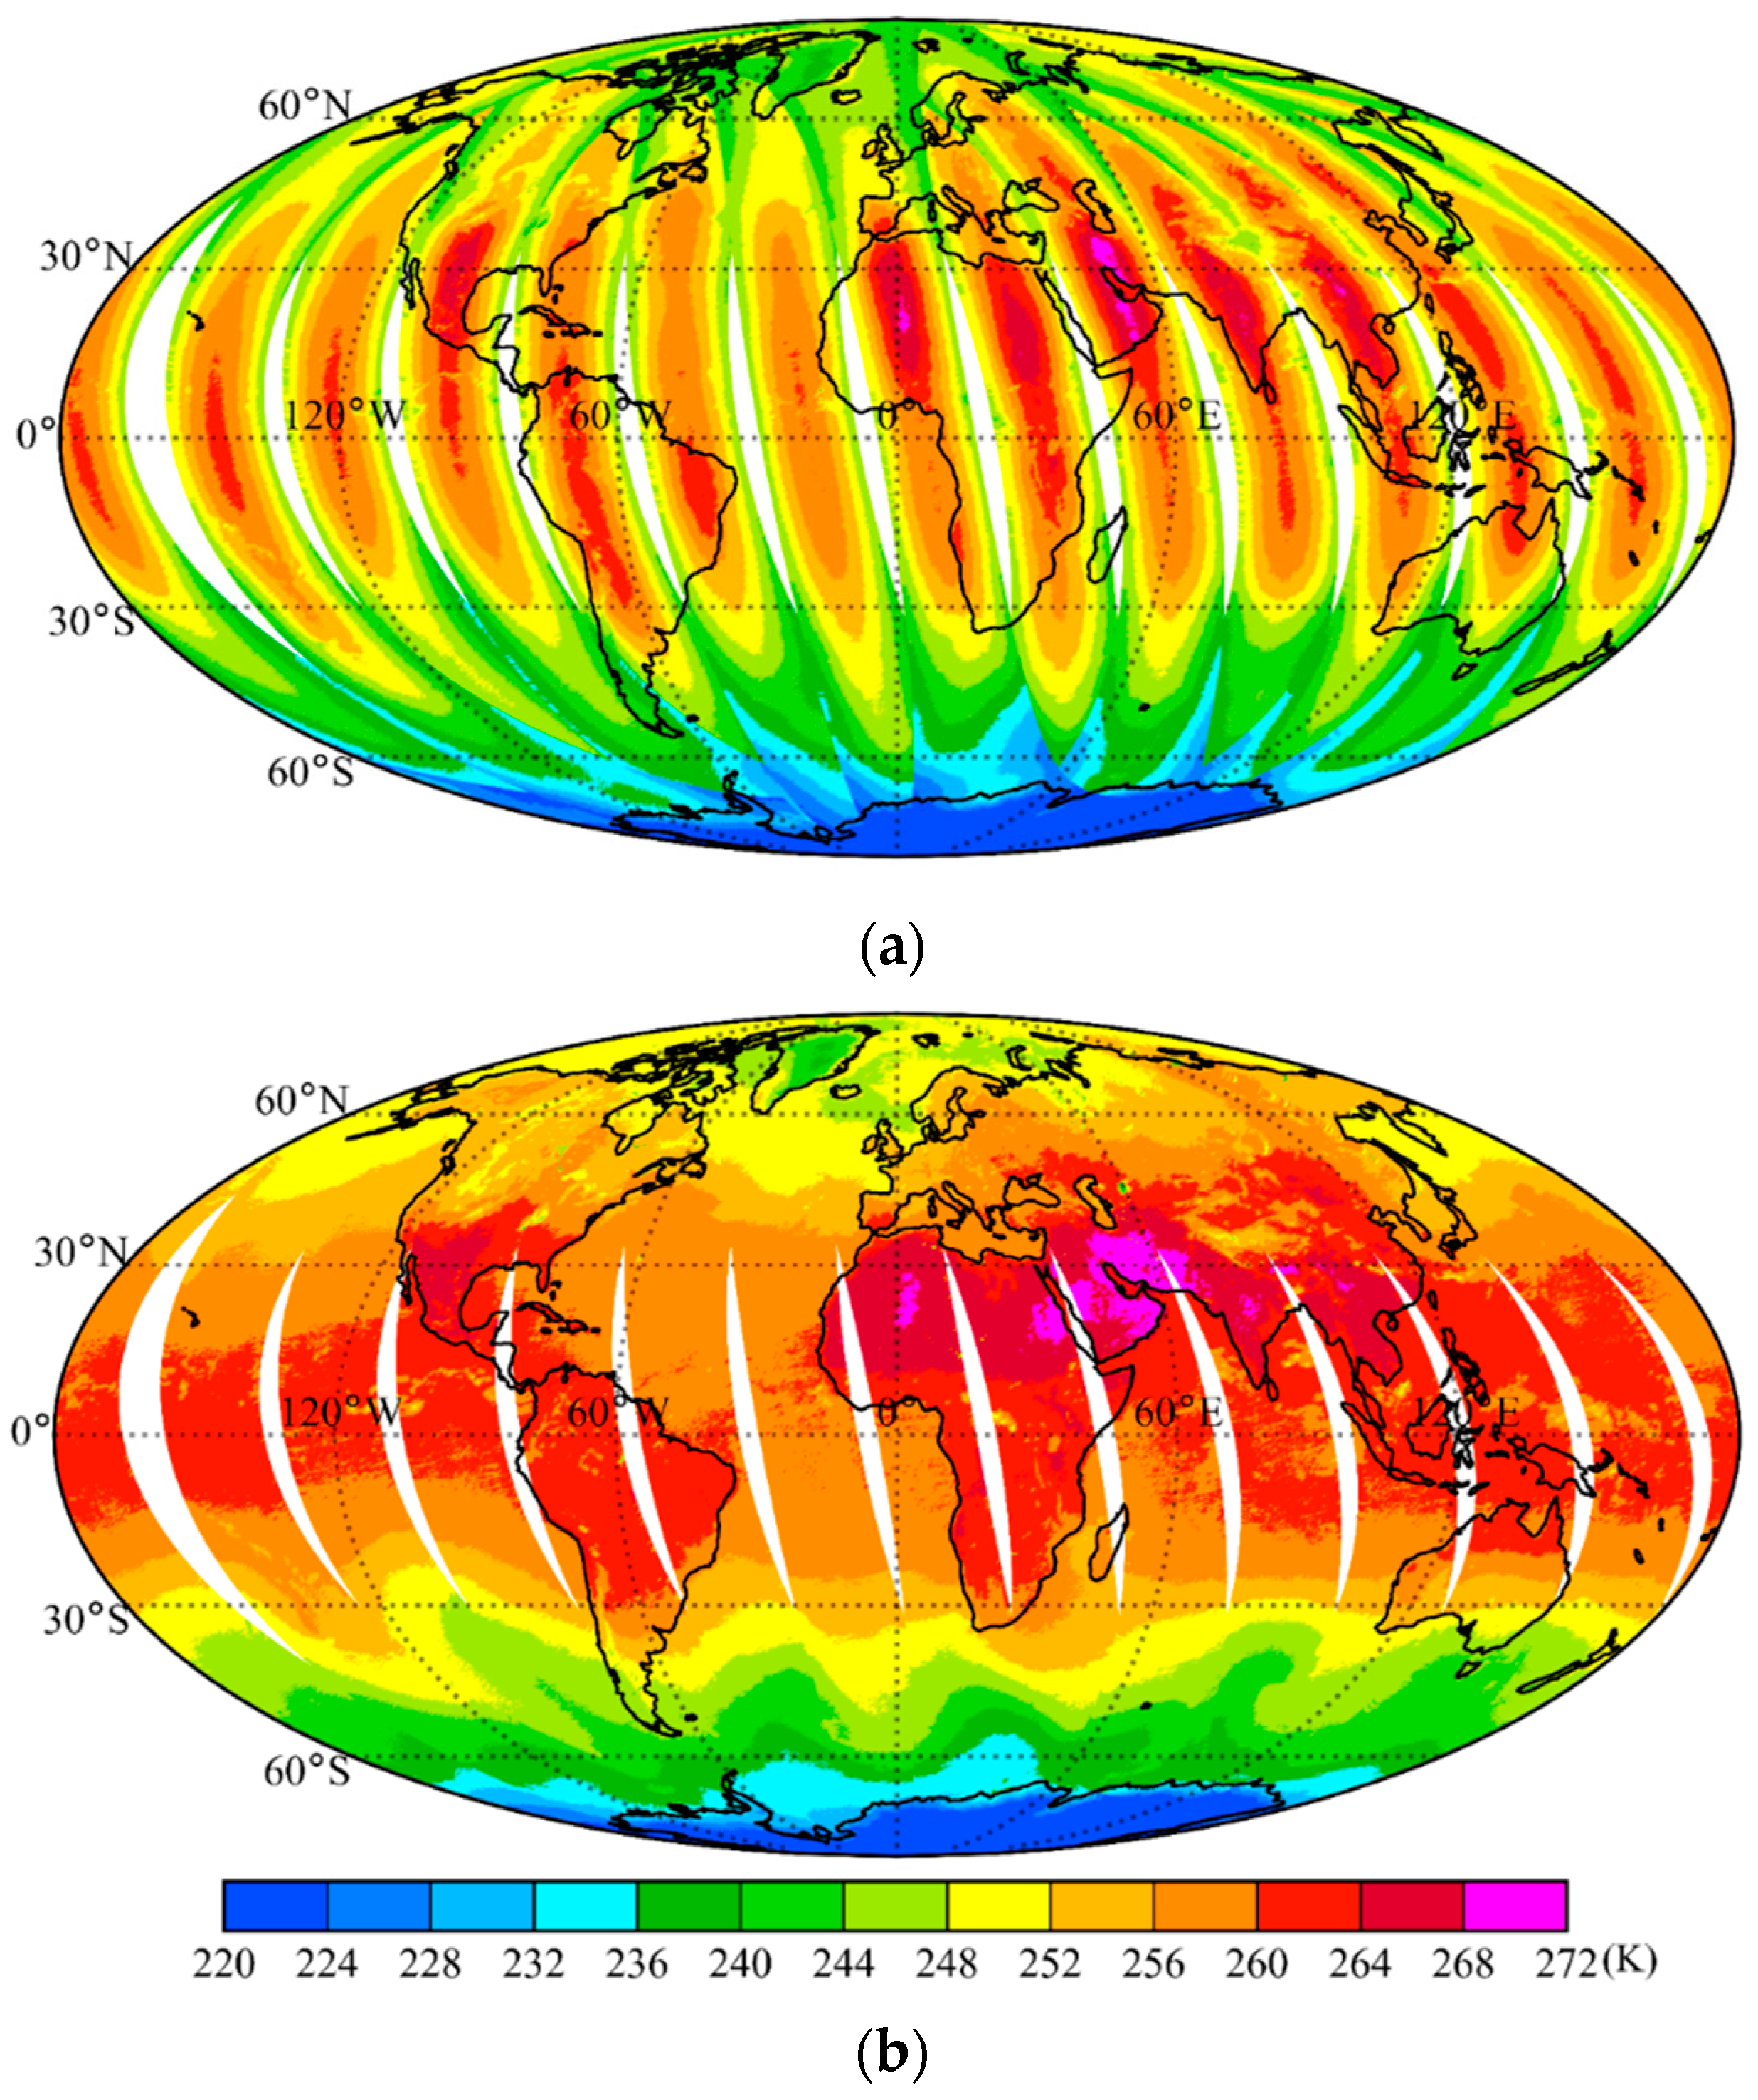
MWTS-2 is a cross-track radiometer. As the POES FY-3D circles around the Earth between the north and south polar regions, it observes the Earth by consecutive scan lines. Each scan line consists of 90 FOVs of varying scan angles. The scan angle at nadir is zero. A larger scan angle from the nadir corresponds to a longer distance from the observing instrument MWTS-2 to the Earth and a large size of FOV, which makes an observed TB value at largest scan angles differ from that at nadir along the same scan line by several degrees. Such a variation of TB is called the limb effect [34,35]. In the troposphere, where temperature decreases with height, a larger scan angle would obtain lower TB, while in the stratosphere, where temperature increases with height, off-nadir TB observations are higher than those of the nadir [27]. The global TB observations of channel 4 at the ascending node on 21 June 2019, which measures troposphere temperature around 700 hPa, are shown in Figure 2a. The off-nadir TB observations are obviously lower than those near the nadir along each scan line, blurring the weather signals. Under such circumstances, the limb correction is necessary.
The limb correction method was initially designed for TIROS Operational Vertical Sounder (TOVS) [36]. Goldberg et al. (2001) [34] and Zhang et al. (2017) [35] applied the limb correction to AMSU-A and ATMS observations, respectively. Tian et al. (2018) [27] later applied the same limb correction method to MWTS-2 observations. The main idea of limb correction is to adjust the measurements at various scan angles to a fixed one (usually the nadir). The adjacent channels, whose peak WF altitudes are just below or above the given channel, often have strong statistical correlations with the target channel [35]. Therefore, a target channel and its adjacent channels are used as the predictors for the target channel when calculating scan-dependent patterns. The last column in Table 1 lists the predictor channels for each channel of MWTS-2 [27]. The following is a brief description of the limb correction method for MWTS-2.
Supposing that the limb effect of a target channel can be compensated for by using linear combinations of its predictor channels at a given scan angle, the limb-corrected TB T b , L C ( k ) ( i , j ) of MWTS-2 can be obtained as follows:
T b , L C ( k ) ( i , j ) = b i ( k ) + m = k 1 k + 1 a i ( k , m ) ( T b ( m ) ( i , j ) T b ( m ) ( i ) ¯ )
where i , j , k separately denote FOV number, scan line number, and channel number. T b ( k ) ( i , j ) is the raw TB observation at the ith FOV in the jth scan line of channel k . T b ( m ) ¯ ( i ) is the global mean of raw TB at the ith FOV of channel m . The limb correction coefficients b i ( k ) and a i ( k , m )   ( m = k 1 , k ,   k + 1 ) are obtained by minimizing the following cost function:
J ( a i ( k , m ) , b i ( k ) ) = φ ( T b , r e g ( k ) ( i , φ ) T b , n a d i r ( k ) ( φ ) ¯ ) 2
Latitude is denoted as φ , and T b , n a d i r ( k ) ( φ ) ¯ represents the mean TB at channel k of the nadir (FOV positions 45 and 46) estimated in every 2° latitudinal band whose center latitude is φ . T b , r e g ( k ) ( i , φ ) is defined as:
T b , r e g ( k ) ( i , φ ) = b i ( k ) + m = k 1 k + 1 a i ( k , m ) ( T b ( m ) ( i , φ ) ¯ T b ( m ) ( i ) ¯ )
T b ( m ) ( i , φ ) ¯ is the mean raw TB at the ith FOV at channel m of 2° latitudinal band. The limb correction coefficients of each channel at every FOV can be obtained by the above minimization and then added as a correction term to TB observations following Equation (1). Note that the limb correction coefficients need to be updated regularly in time, and observations of MWTS-2 channels 1–4 are recommended to be corrected separately over land and sea due to emissivity differences [35]. In this research, correction coefficients are trained with observations which are 7–10 days ahead of the target time range, and channels 1–4 are corrected over land and sea separately.

4. Results

In this section, an NCCV case from 21 to 29 June 2019 is selected for a detailed analysis. We first describe the limb correction results and show the exact distributions of peak WF altitudes of MWTS-2 channels during the case, then demonstrate the TB observations of the NCCV, and finally illustrate the potential vorticity and tropopause feature of this NCCV case.

4.1. Limb Correction Results

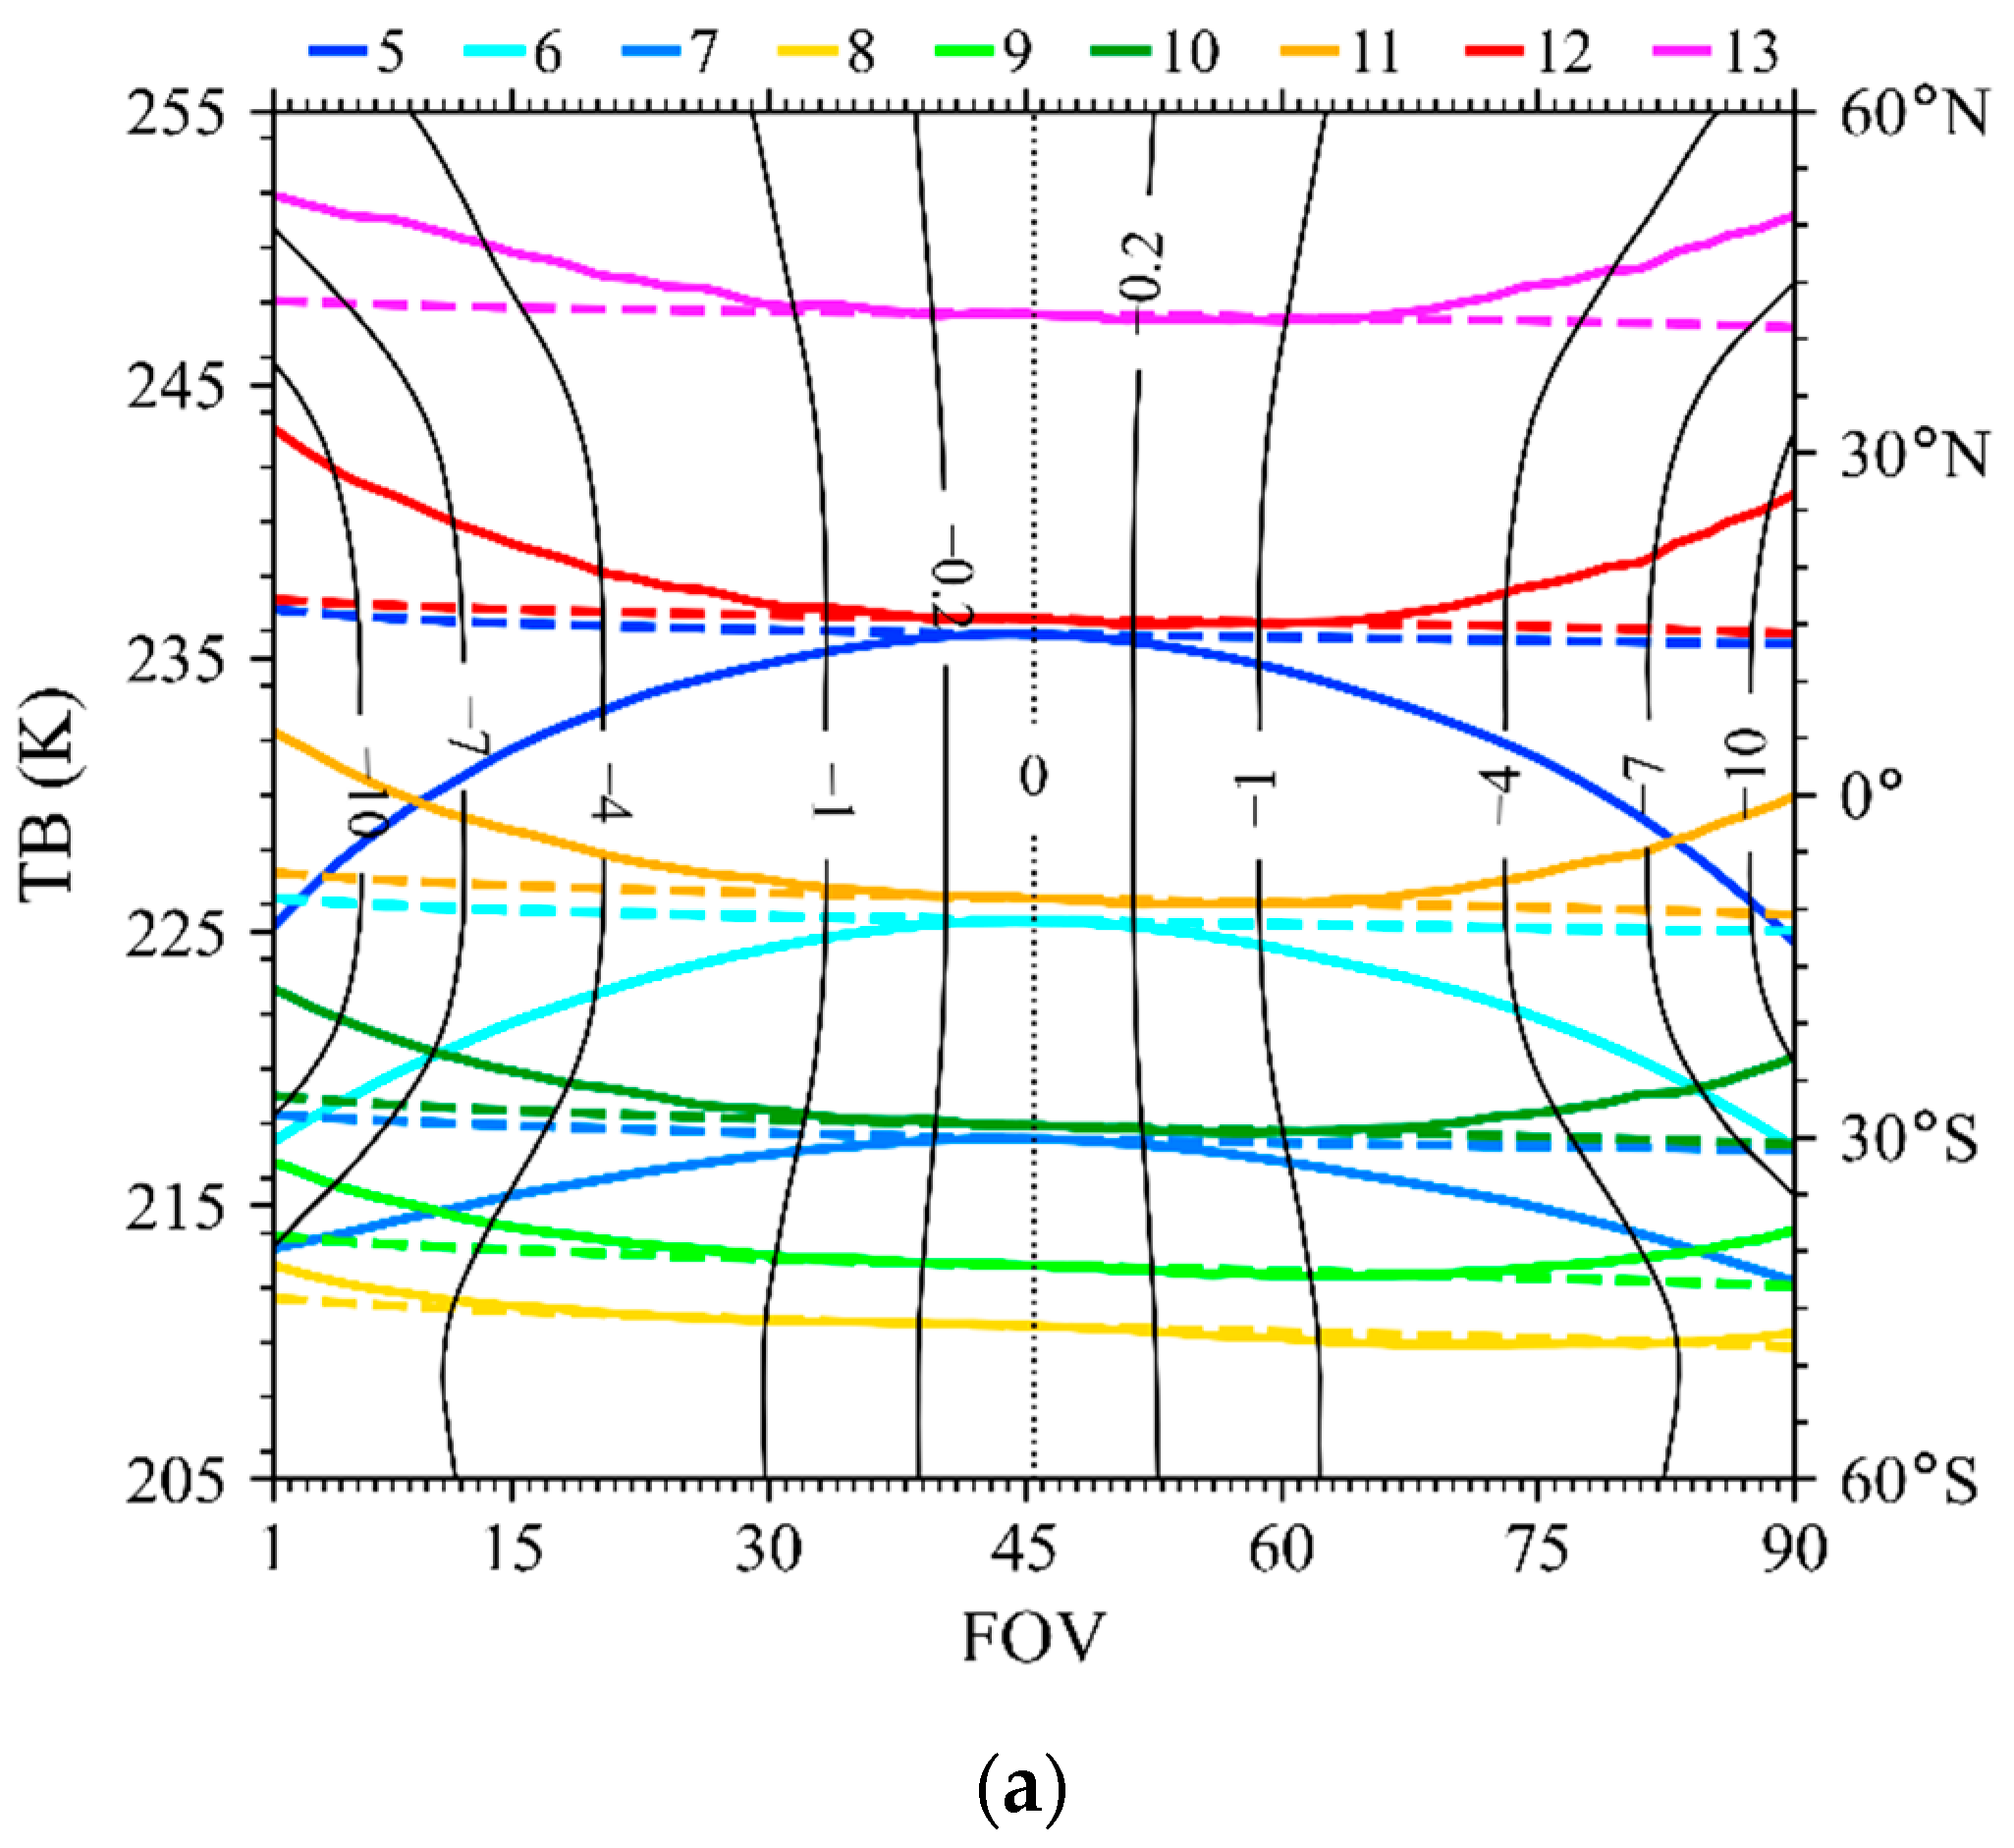
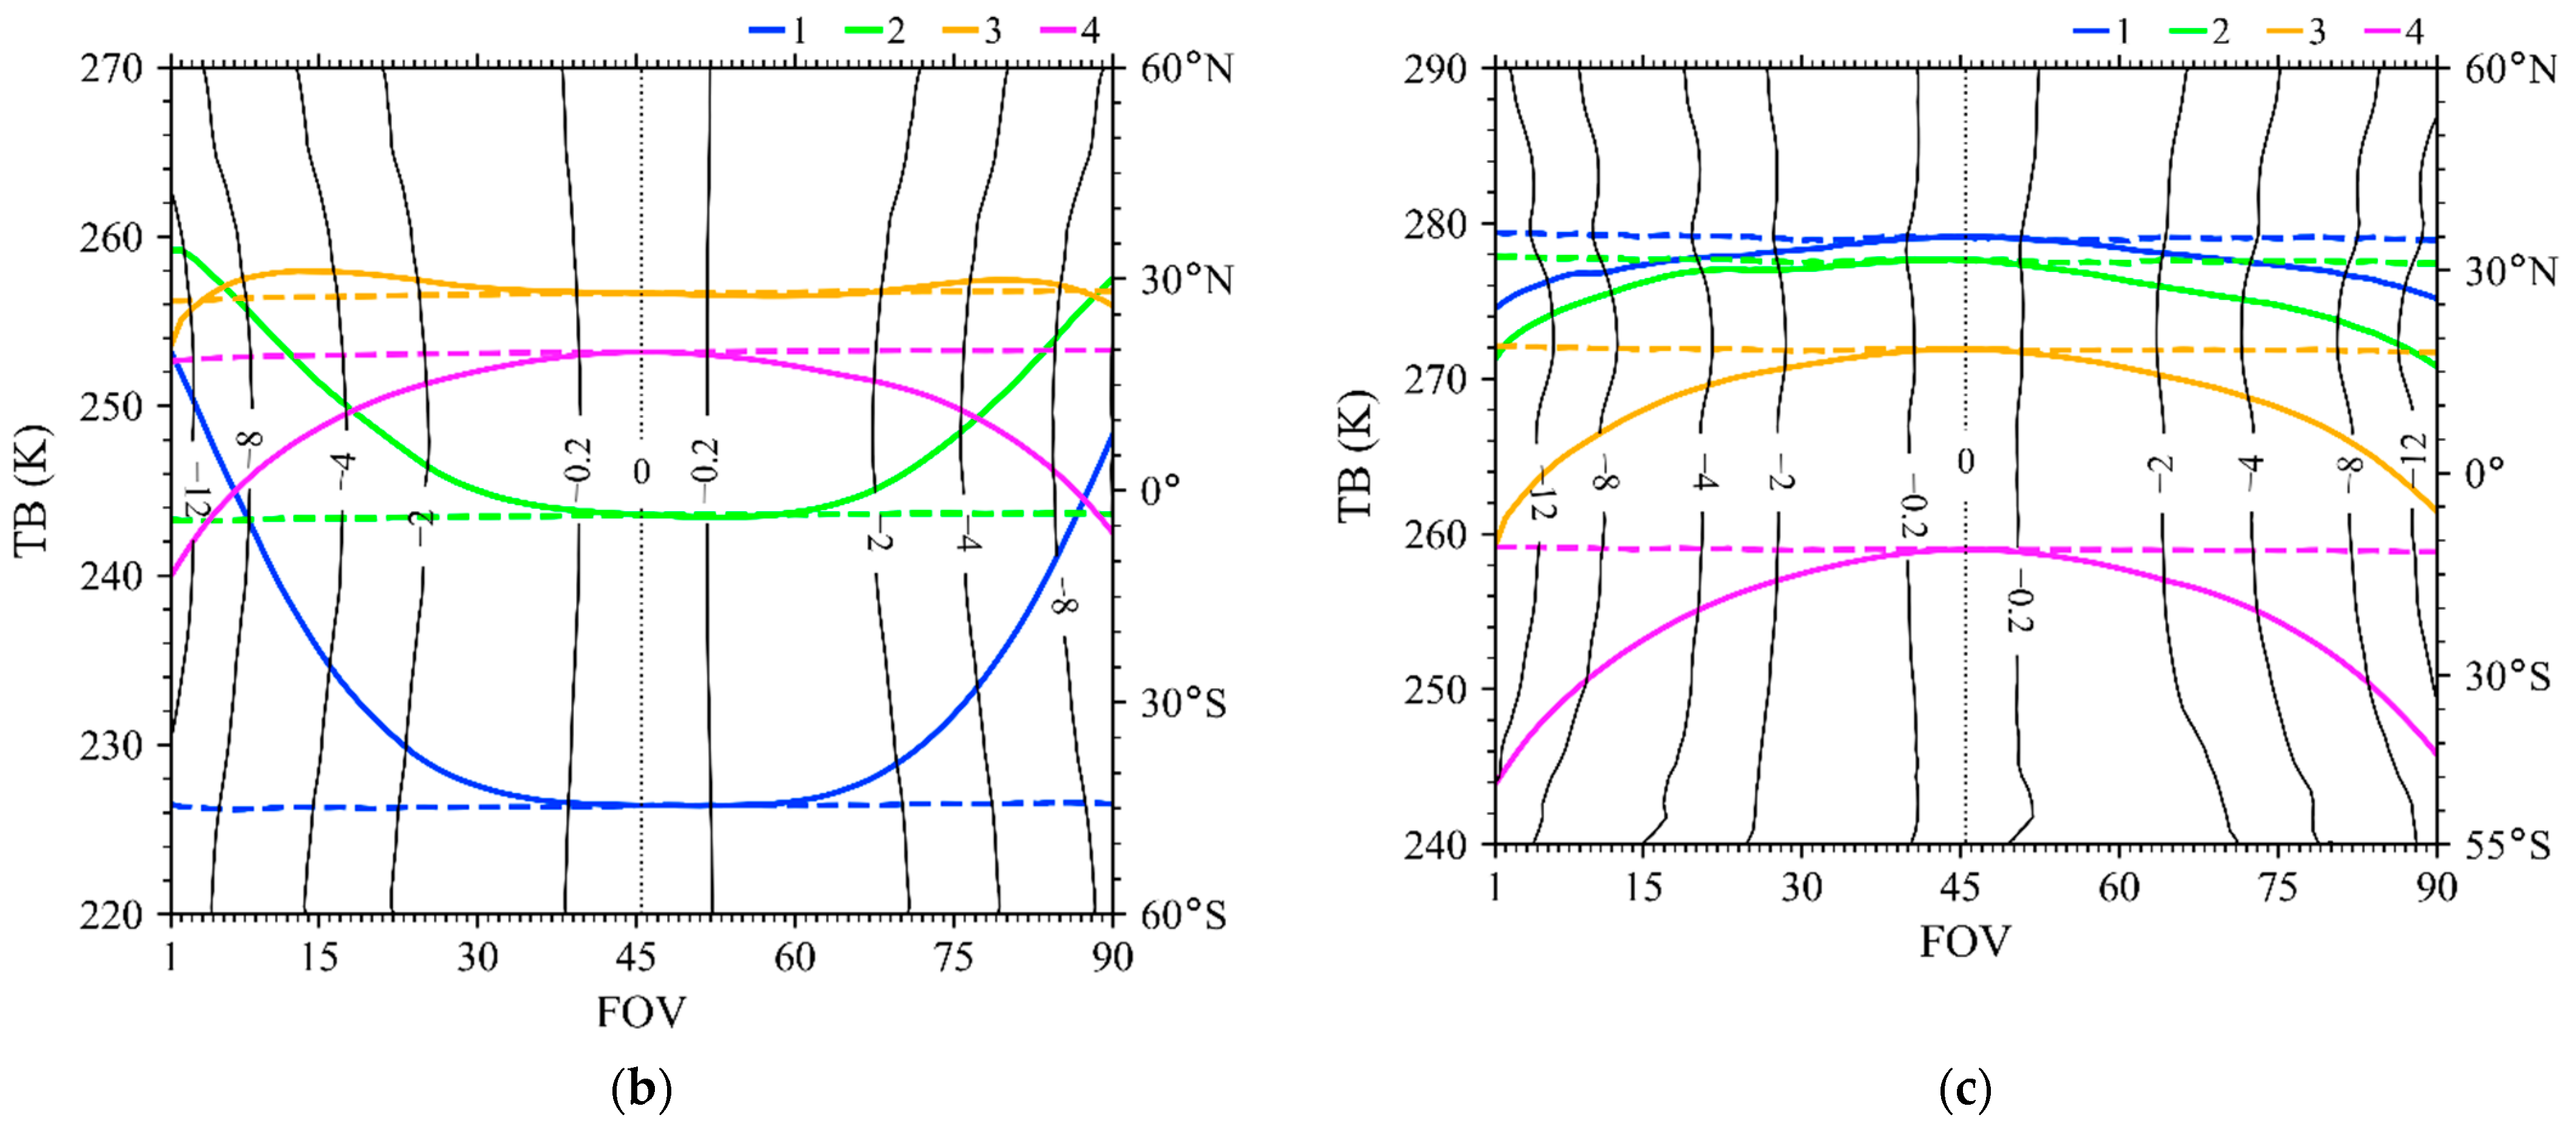
Figure 3 shows the results of the limb correction conducted on MWTS-2 observations from 21 to 30 June 2019 with correction coefficients trained by observations from 10 to 20 June 2019. In Figure 3a, scan dependences of MWTS-2 channels 5–13 global mean TB observations before and after the limb correction are presented. Observations of channels 5–7 are largely influenced by the tropospheric atmosphere, and the off-nadir observations are lower than those of the nadir, which can be called limb darkening [35]. Channels 8–13 mainly measure the temperature of the stratosphere, and their off-nadir observations are higher than those of the nadir, which can be referred to as limb lightening [35]. After the limb correction, the limb darkening and lightening effects of the off-nadir FOVs are reduced, and the off-nadir TB means are closer to those of the nadir. In Figure 3a, thin black contours show limb correction values of channel 6 as a function of FOVs and latitudes at 2° interval. For a given FOV, the limb error generally decreases with latitudes.
Figure 3b,c shows the limb correction results of channels 1–4 over sea and land, respectively. Comparing the blue and green curves in Figure 3b,c, the limb error patterns of channels 1–2 over sea (limb brightening) and land (limb darkening) are different, which results from the low sea surface emissivity and high land surface emissivity in contrast to the atmosphere at these frequencies [35]. The same as channels 5–13, off-nadir TB observations of channels 1–4 are modified to the mean value at nadir. Figure 2 shows the global correction of channel 4 in a more straightforward way. Atmospheric temperature distributions provided by TB observations are clearer after the correction in Figure 2b. All TB observations demonstrated in the following figures are limb-corrected.

4.2. MWTS-2 Peak WF Altitudes

As shown in Figure 1, the peak WF of MWTS-2 channels 4–7 are located in an altitude range from the middle troposphere to the low stratosphere where the NCCV signals in the atmospheric temperature are significantly larger and clearer than elsewhere [15,16]. Channels 1–3 in the lower troposphere are strongly influenced by the underlying surface, and the stratospheric channels 8–13 do not contain obvious signals of NCCVs. Therefore, TB observations of channels 4–7 are used for studying NCCVs.
Besides channel frequencies, the TBs and associated WFs are also affected by topography and atmospheric conditions, such as temperature and moisture. We may examine the WF peak vertical levels of channels 4–7 during the NCCV process in the Northeast Hemisphere using the ERA5 reanalysis at 06:00 UTC 23 June 2019 as input to the RTTOV version 13.0. Results of peak WF altitudes of MWTS-2 channels 5–7 are shown in Figure 4a–c. Also calculated is the thermal tropopause (Figure 4d), which is defined as the lowest level at which the lapse-rate decreases to 2 K km−1 or less and the average lapse-rate between this level and all higher levels within 2 km does not exceed 2 K km−1 [37]. The black solid curves in Figure 4a–c indicate the locations where the peak WF altitude equals the tropopause pressure. The peak WF altitudes are above (below) the tropopause north (south) of the black curves in Figure 4a–c. Peak WF altitudes of MWTS-2 channel 5 (Figure 4a) vary between 390 and 430 hPa, which are in the upper troposphere. Channel 6 peak WF altitudes in high latitudes are in the stratosphere (north of the black solid curve in Figure 4b), and the cutoff low located at (50°N, 80°E) with lower tropopause height than its surroundings (Figure 4d) is especially included. The cutoff lows form as the stratospheric air intrudes into the troposphere and lower latitudes, which leads to the decrease of the tropopause height [38,39]. As shown in Figure 4c, the peak WF altitudes of channel 7 are mostly in the stratosphere in the middle and high latitudes (north of 40°N), while in low latitudes (south of the black solid curve in Figure 4c), where convective activities are strong and tropopause is higher than other latitudes, channel 7 observations mainly focus on the troposphere. Peak WF altitudes of MWTS-2 channel 4 are found to be located between 650 and 720 hPa, which are below the tropopause (figure omitted). Therefore, channel 4 TB observations mainly show the atmospheric temperature in the middle and lower troposphere. In summary, during the process of the NCCV, channels 4–5 observe below tropopause, while channels 6–7 mainly focus on the NCCV in the stratosphere.

4.3. TB Observations of Channels 4 and 6

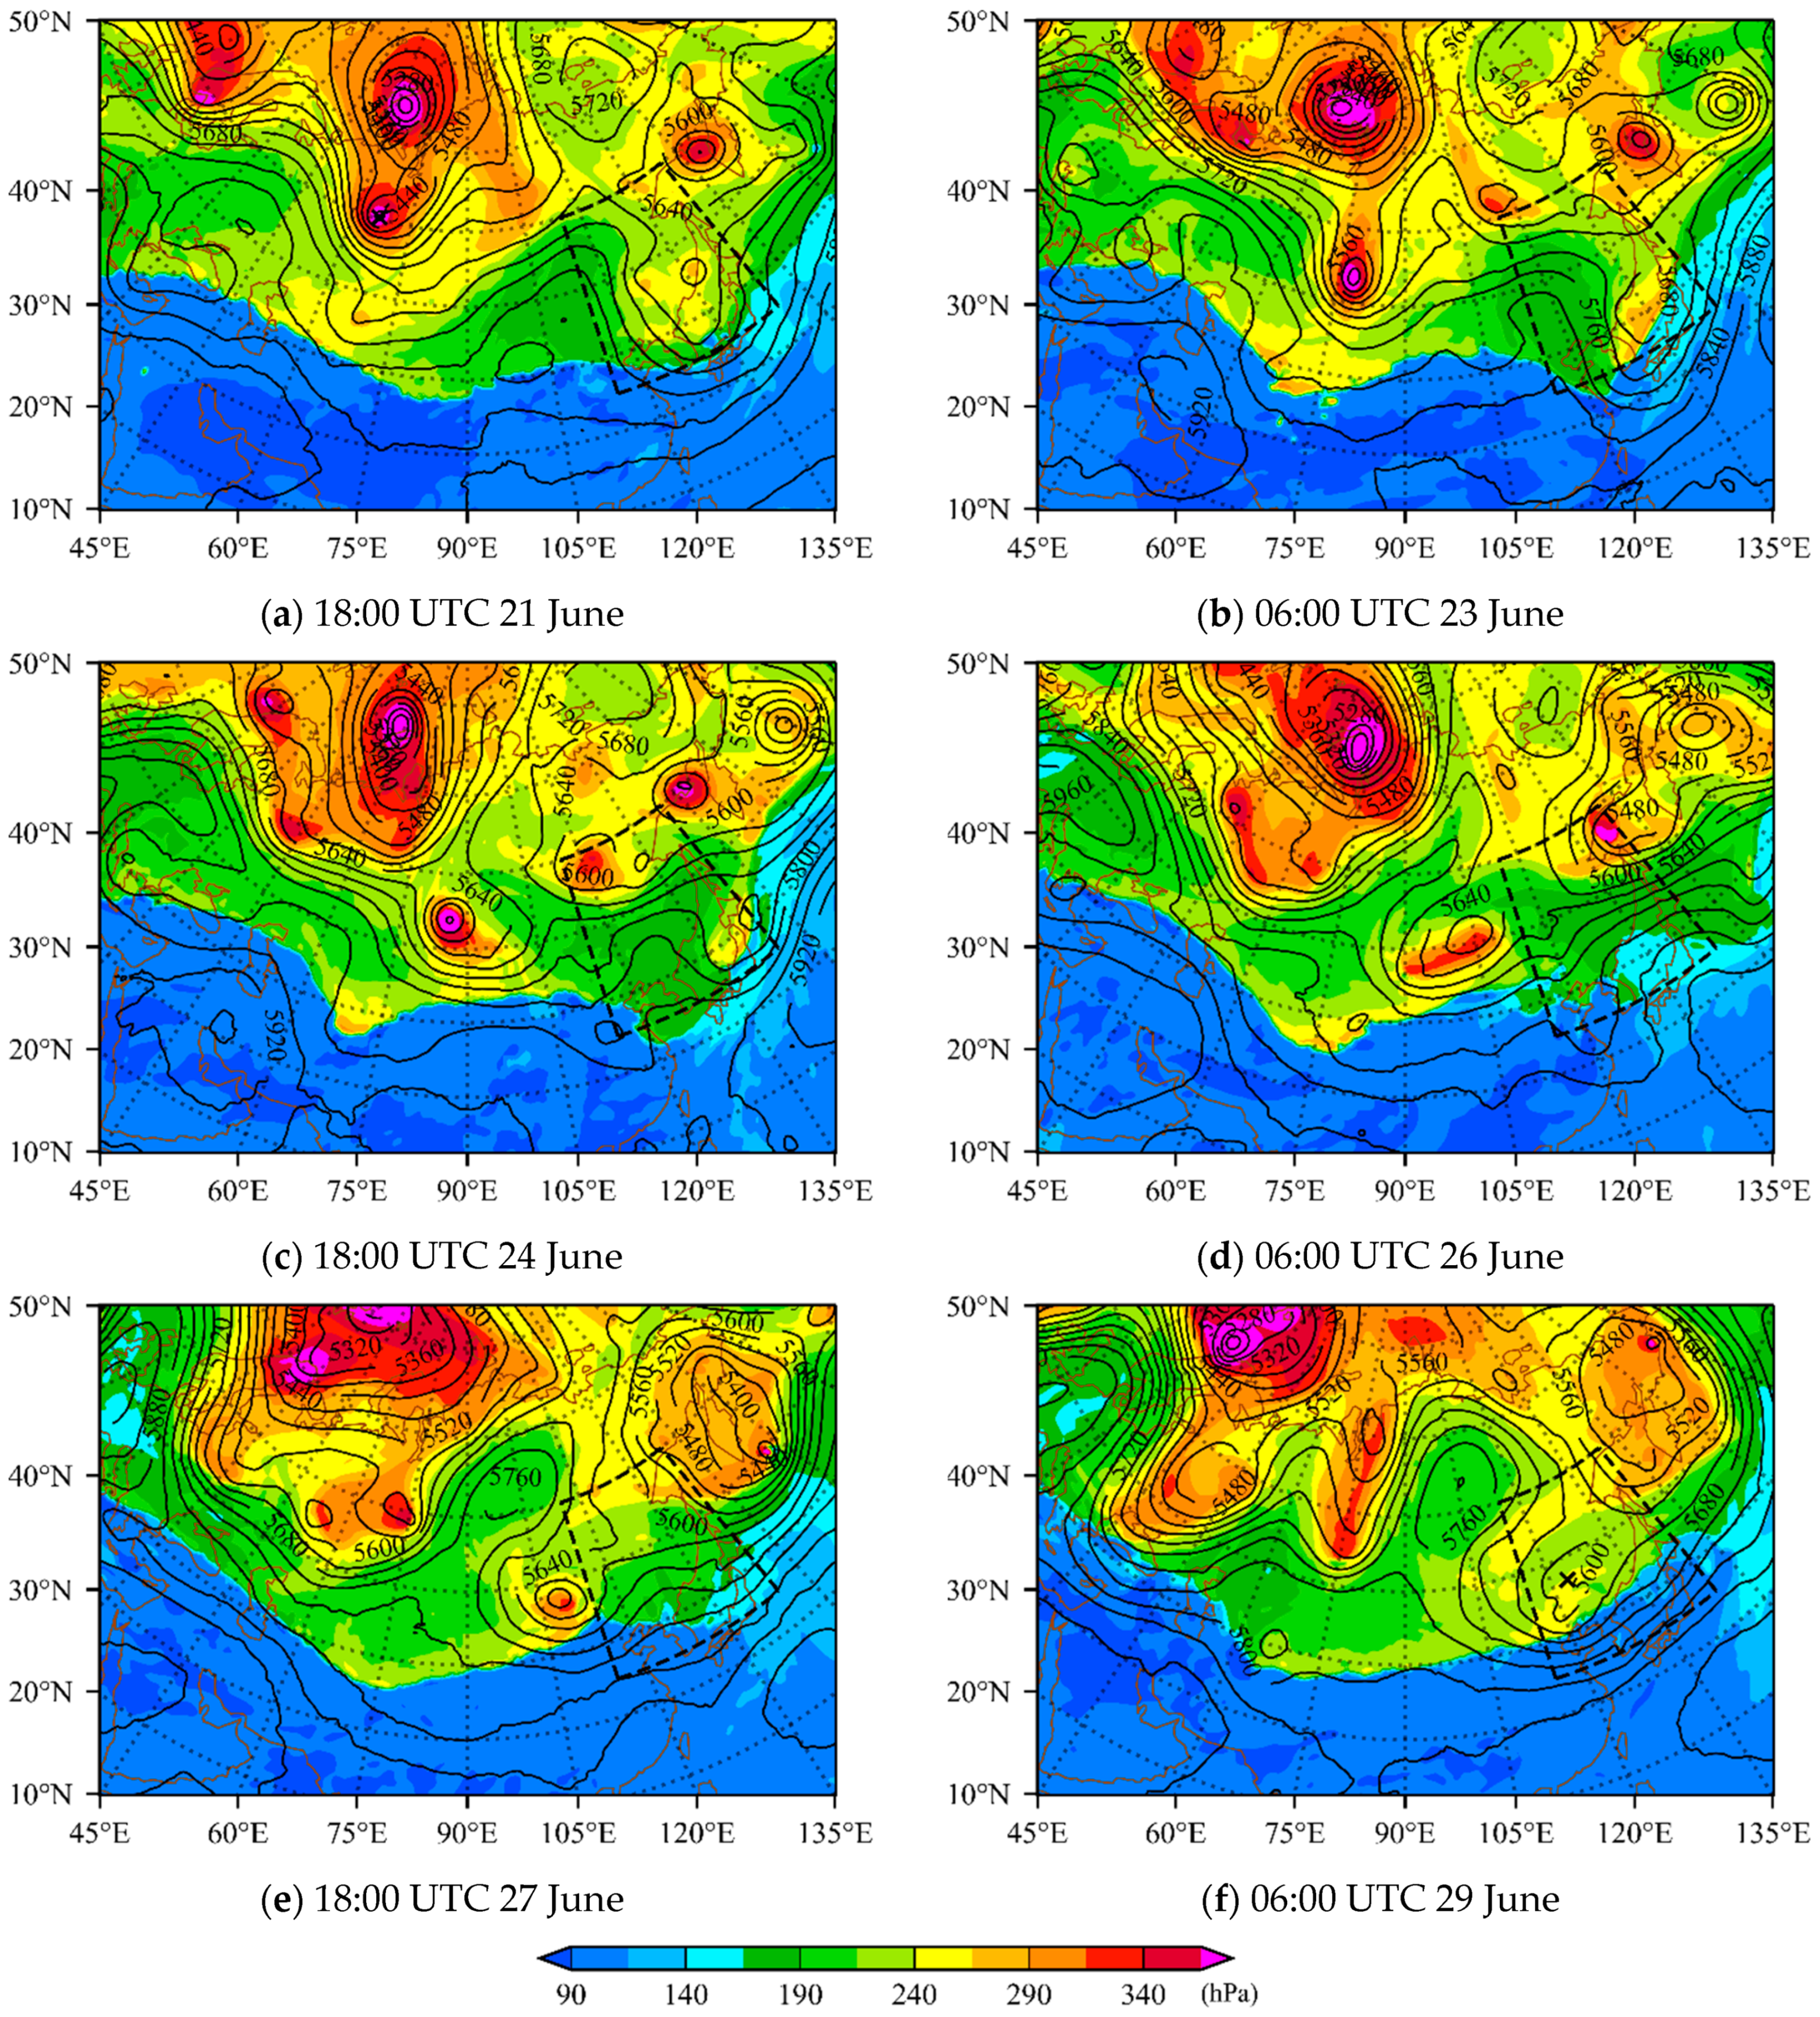
Geopotential heights at different pressure levels are often used to observe and identify NCCV related low-pressure systems [9,12,16]. Cutoff lows from which NCCVs originate are mainly active in the middle and high latitudes of Asia [9,16], which is the region of concern in this research. In the temperature fields, NCCVs are characterized as cold (warm) core below (above) the tropopause. The observing times of FY-3D MWTS-2 over the NCCV region centered at (50°N, 90°E) are close to 06:00 and 18:00 UTC at the ascending and descending node, respectively. Therefore, daily reanalysis of geopotential height near the peak WF level at 06:00 and 18:00 UTC are chosen to compare with the two nodes of MWTS-2 observations, respectively. In Figure 5, TB observations of channel 4 from 21 to 29 June 2019, along with ERA5 geopotential height at 700 hPa (peak WF altitude of channel 4), are illustrated.
As seen in Figure 5, features of channel 4 TB observations well match those in 700 hPa geopotential heights in middle latitudes, with low (high) TB areas corresponding to low (high) pressure systems. As demonstrated in Figure 5a,b, as a trough located near (65°E, 60°N) evolved gradually, a cutoff low separated from the polar vortex from 21 to 23 June to form an NCCV. The NCCV-related cold anomaly and low pressure trough can be observed from both TB observations and geopotential height. In Figure 5c,d, the closed circulation of the cutoff low formed and moved eastward from (90°E, 55°N) to (105°E, 55°N). From 27 to 29 June (Figure 5e,f), the cutoff low entered the NCCV domain (35–60°N, 115–145°E), and finally weakened, with the low TB center becoming weak and insignificant.
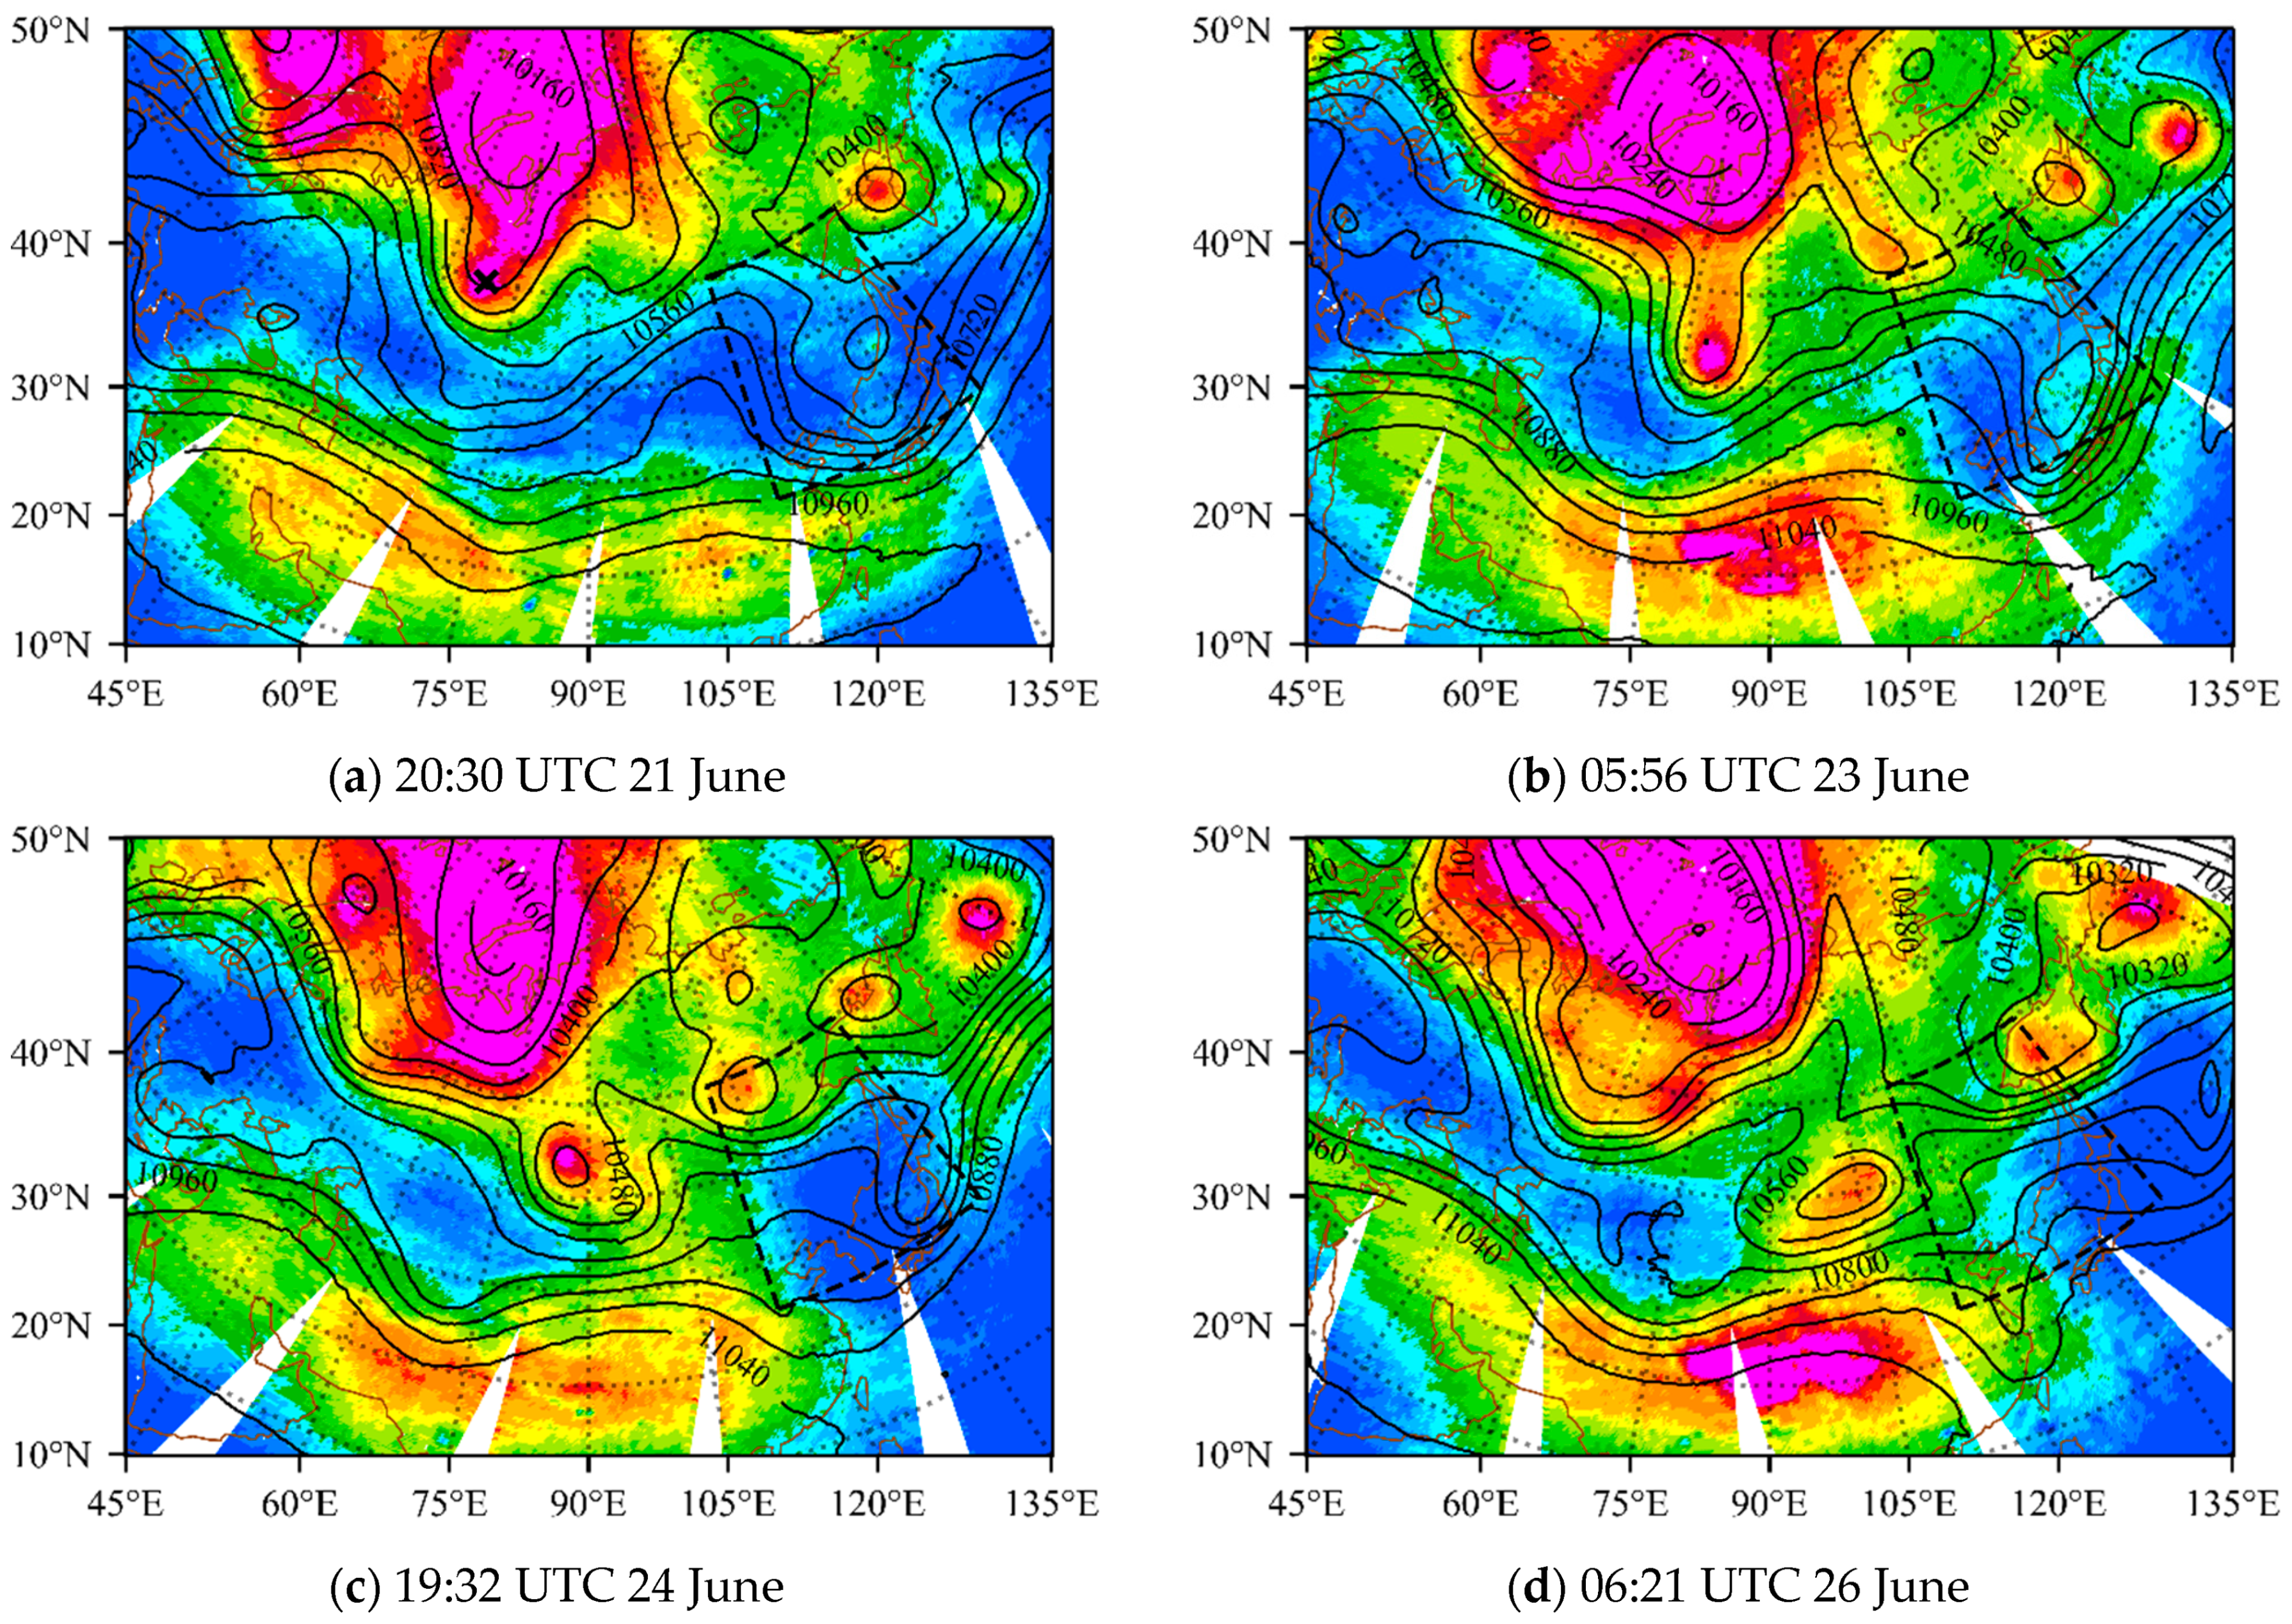
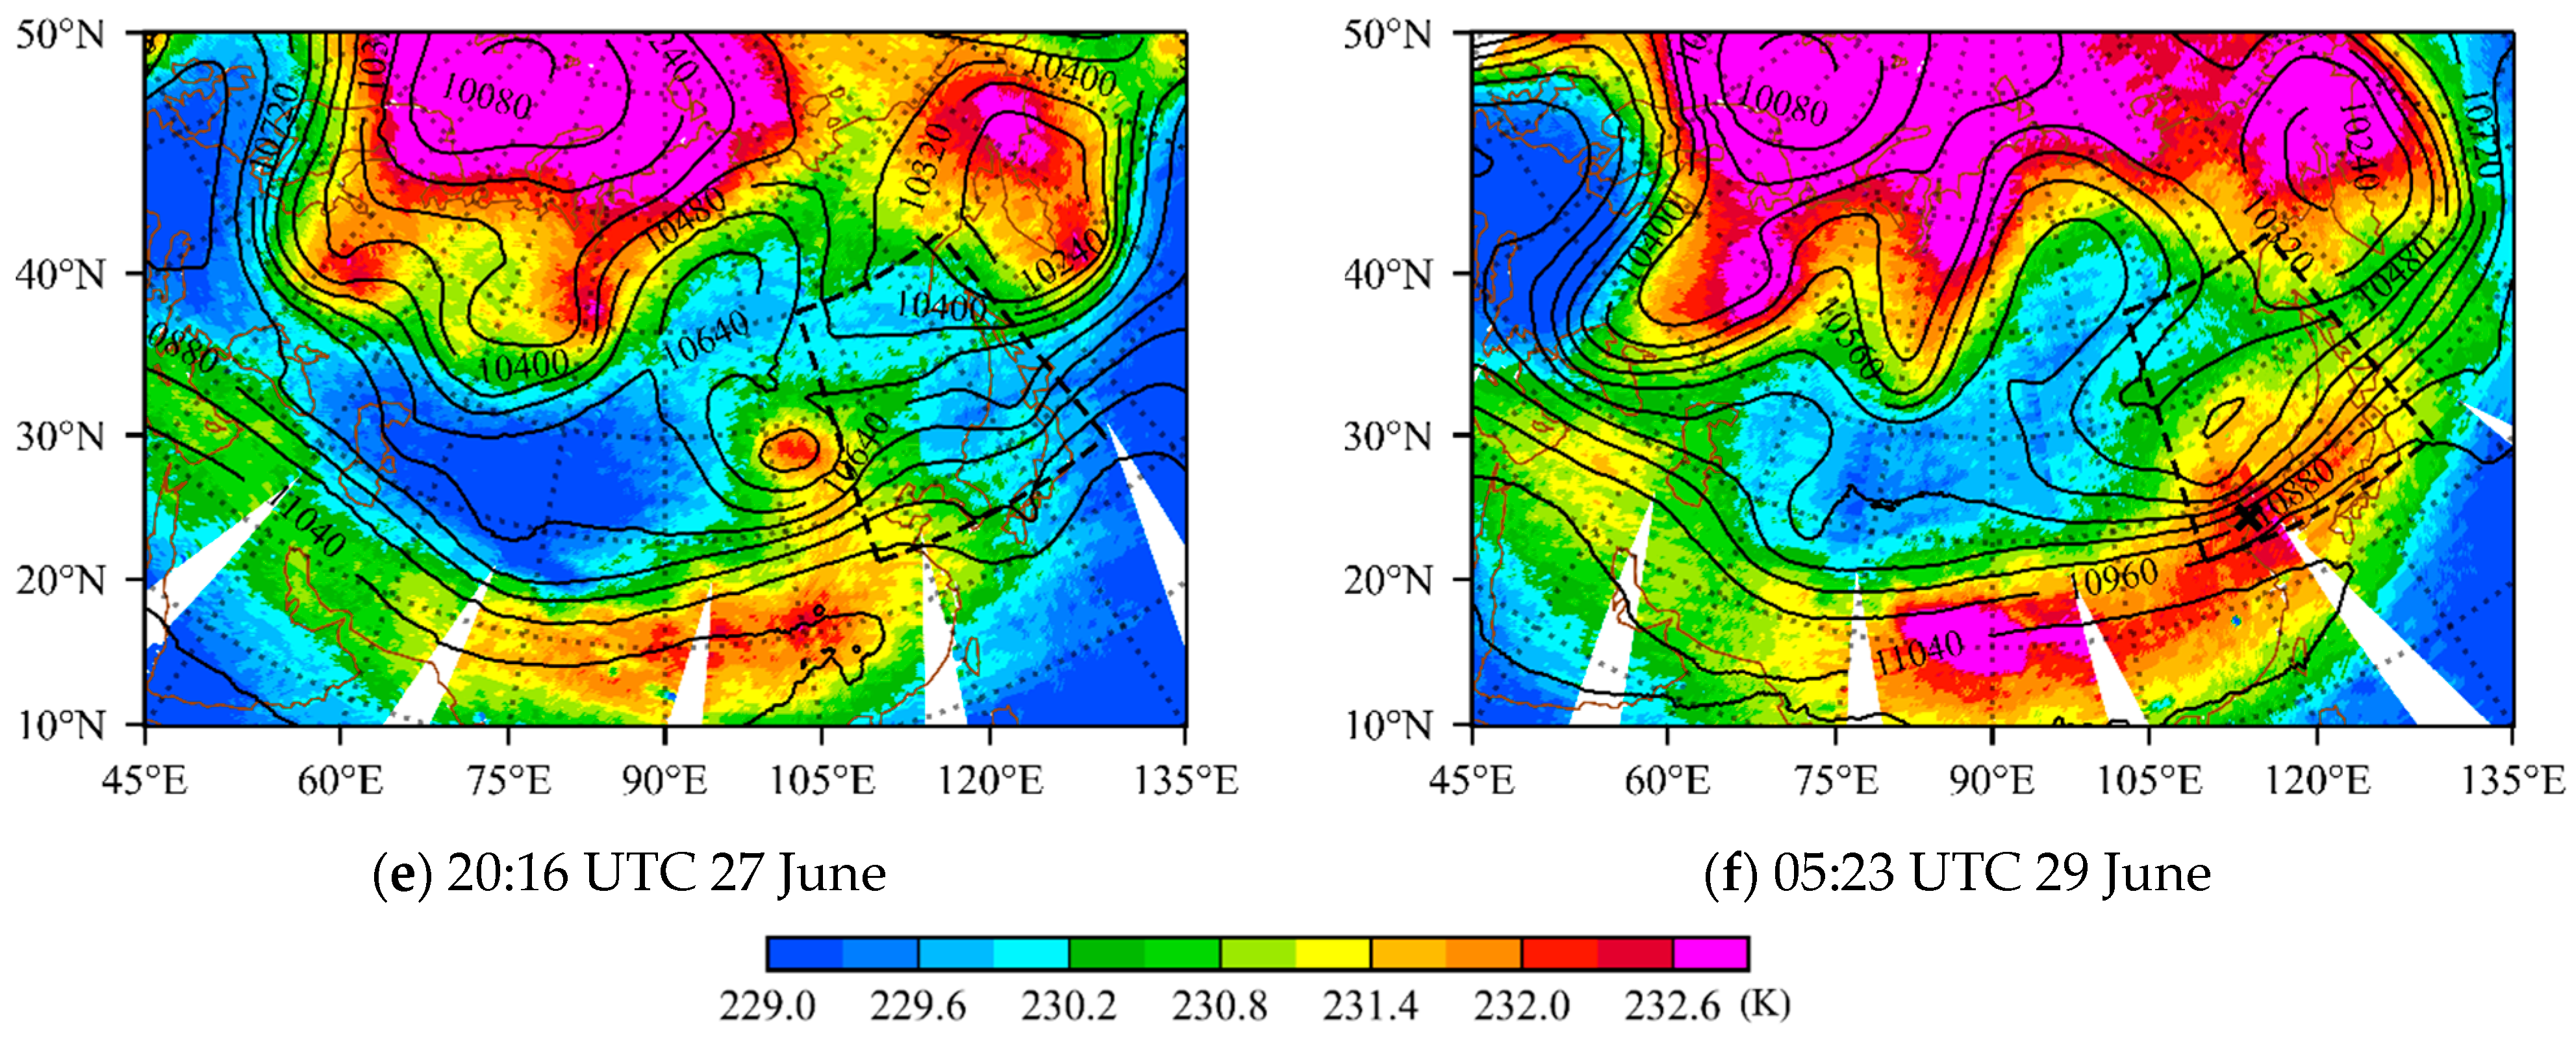
The peak WF altitudes of channel 6 are located around 250 hPa, and the cutoff low is characterized as a local warm anomaly in channel 6 TB observations. In Figure 6a, the high TB centers indicated by the black cross indicate the warm core of the NCCV system in the stratosphere, which is collocated with the 250 hPa trough. The process of formation and movement of the cutoff low observed in Figure 5 can also be captured by channel 6 TB observations, even in a clearer way when the system started to weaken in Figure 6d,e. TB observations of channels 5 and 7 (figure omitted) have similar features to those of channels 4 and 6, respectively. In summary, TB observations of channels 4 and 5 mainly show the cold core of NCCVs in the troposphere, while those of channels 6–7 capture the warm core of NCCVs in the upper troposphere and the low stratosphere.

4.4. Potential Vorticity and Tropopause

Apart from having closed geopotential height contours and temperature anomalous structures, cutoff lows are also associated with a low tropopause, due to an intrusion of stratospheric air into regions that are climatologically troposphere [38,39,40]. Stratospheric potential vorticity (PV) is an order of magnitude larger than those in the troposphere [41]; cutoff lows, therefore, can also be recognized as high PV centers [15,39,40]. The level at which PV equals 2.0 PV units (1 PVU = 10 6 K m 2 kg 1 s 1 ) is commonly taken as the dynamic tropopause [42].
PV is a physical quantity which reflects the dynamic and thermodynamic properties of the atmosphere comprehensively [43]. It is defined as follows:
P V = ζ a θ ρ
where ζ a , θ , and ρ denote absolute vorticity, potential temperature, and air density, respectively. PV is conserved in an adiabatic frictionless process and, therefore, can be used as a dynamic tracer for air-mass [44].
Figure 7 shows the PV and geopotential height at 300 hPa. Areas with PV larger than 2 PVU are shaded in colors. In Figure 7, the cutoff lows are in good correspondence with high PV areas. The appearance of the cutoff low, its southeastward, and the formation of NCCV are seen clearly in the PV field.
To confirm a gradual decrease of the tropopause height above the cutoff low, the traditional thermal tropopause [37] is provided in Figure 8. The ERA5 temperature profiles from 21 to 29 June are used to calculate the tropopause following the method proposed by Reichler et al. (2003) [45]. The 500 hPa geopotential height is shown with tropopause pressure for reference. The tropopause pressure varies from roughly 90 to 360 hPa, and the cutoff low at 500 hPa often appears under a low tropopause. As the system weakens, the tropopause height would elevate.

5. Discussion

5.1. Vertical Structures of Cutoff Lows

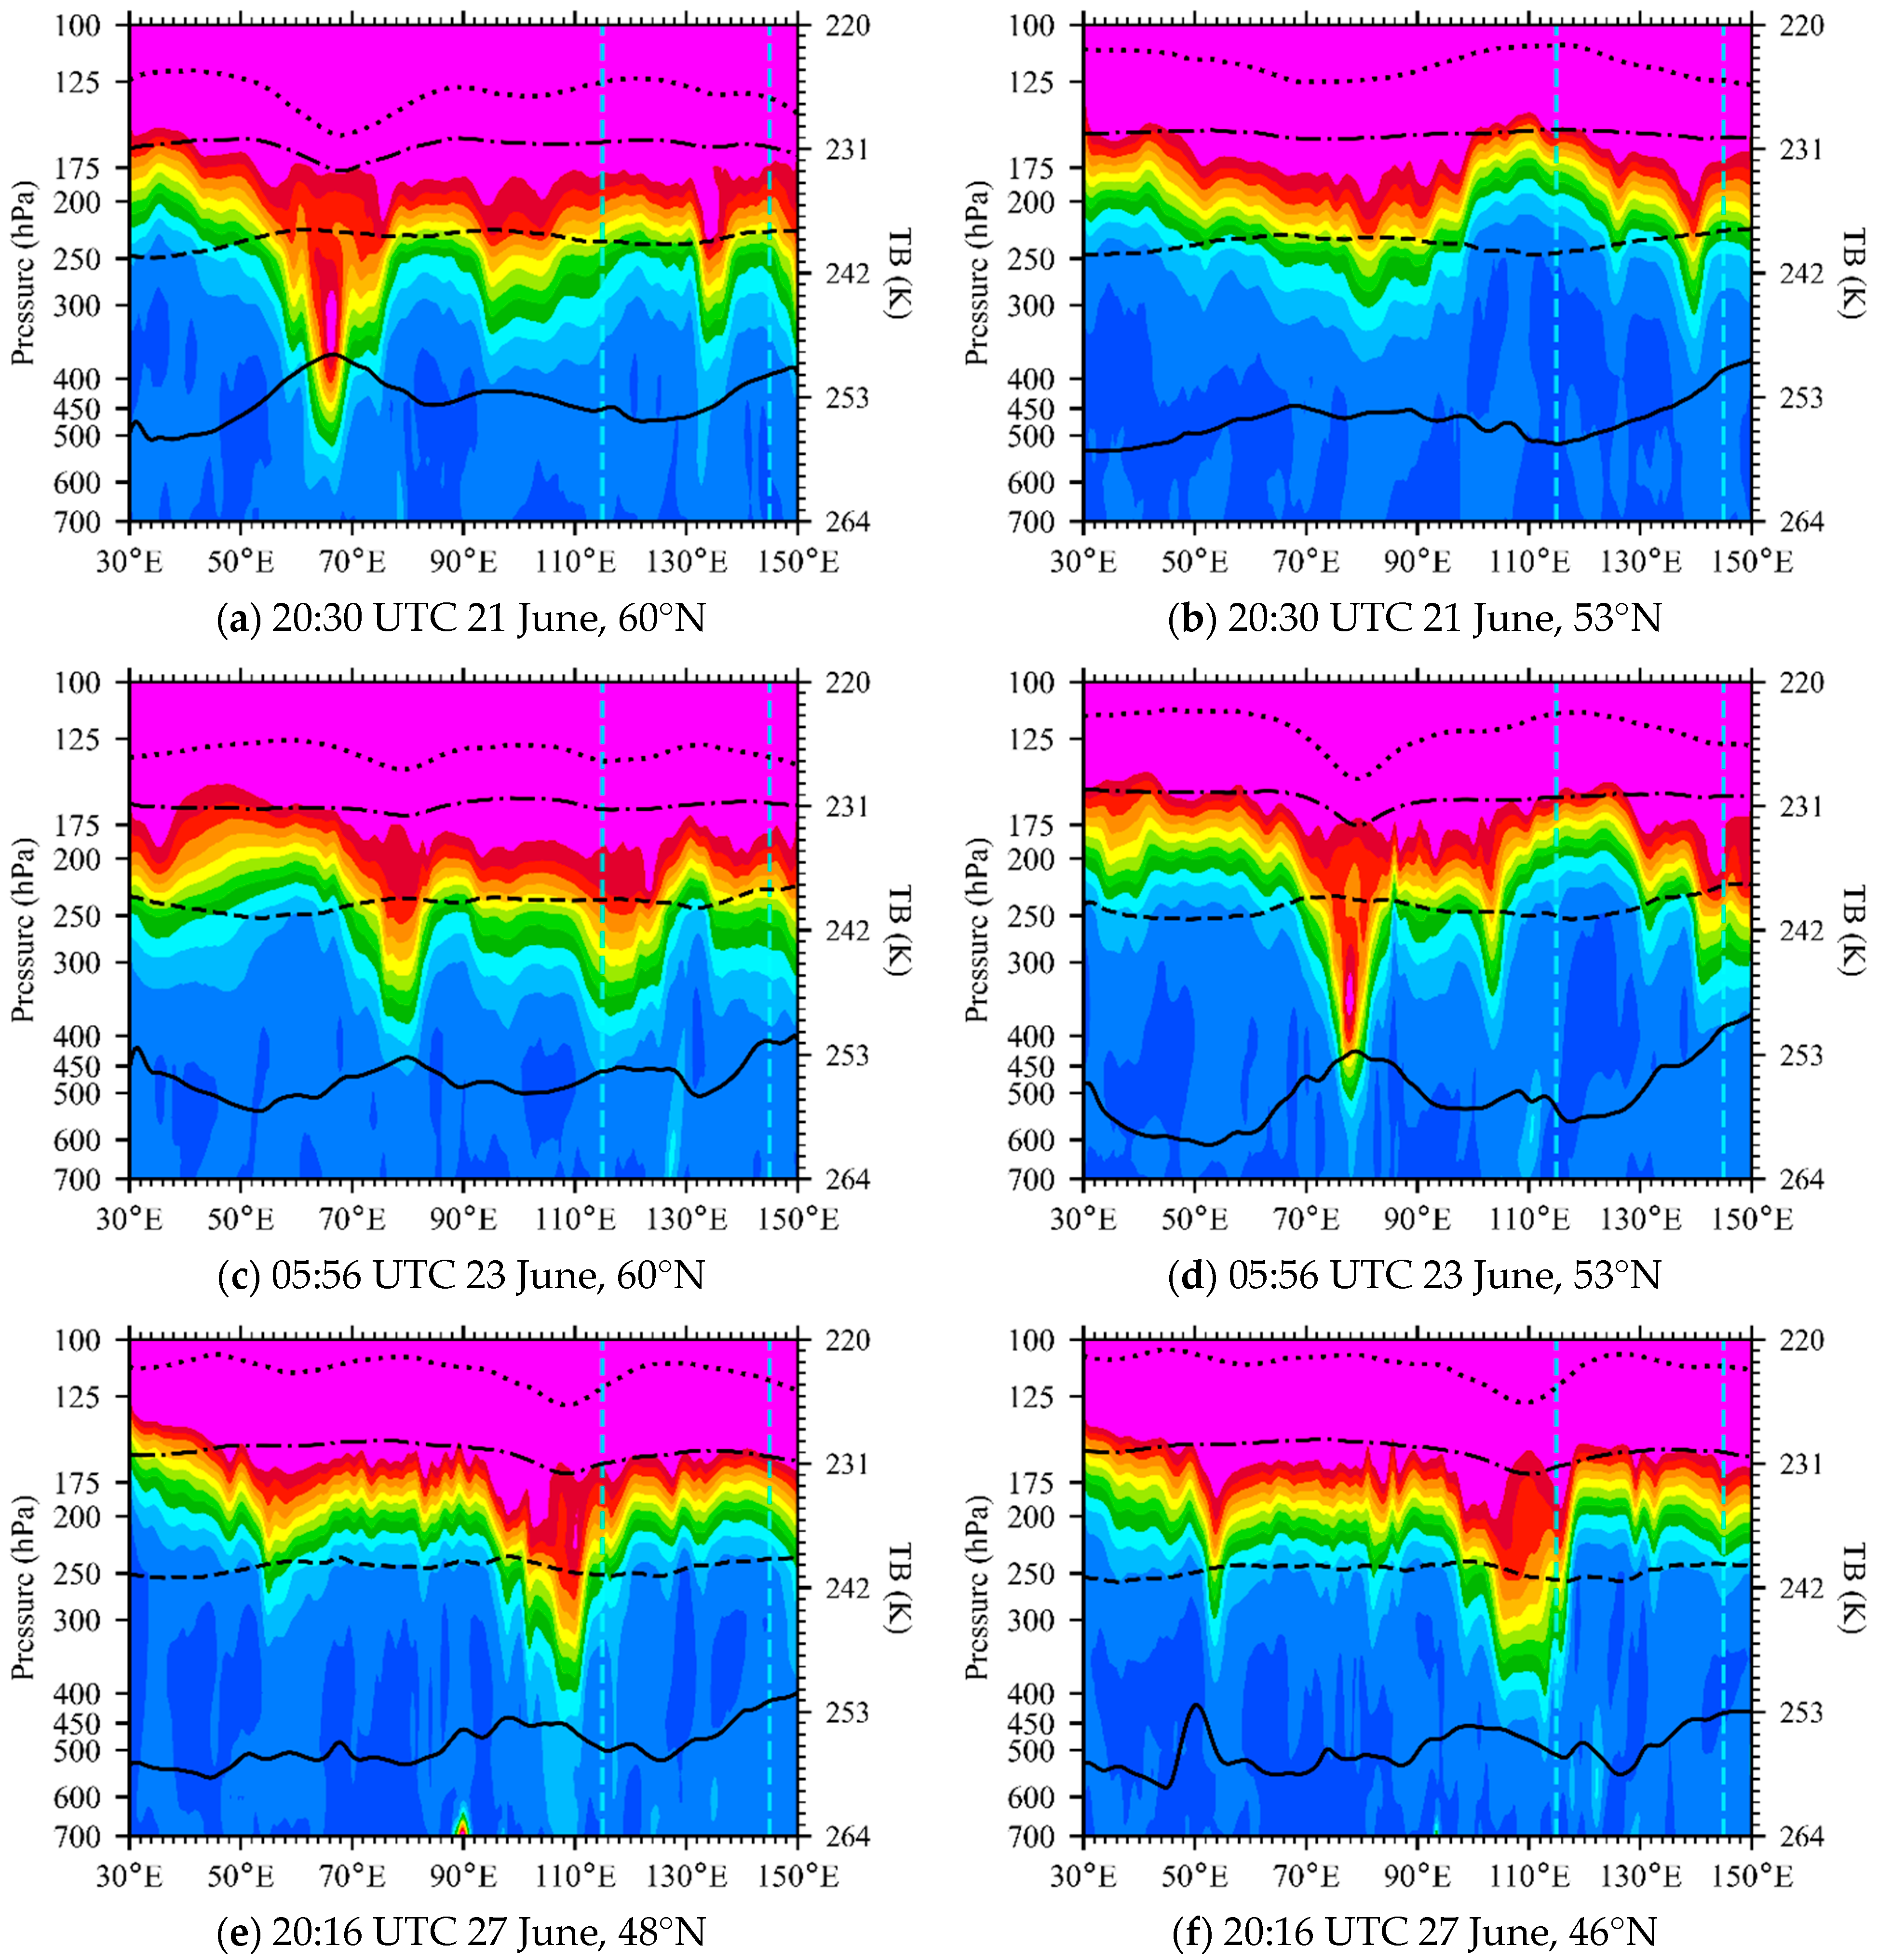
The origination and movement of a cutoff low that lead to an NCCV to form can be seen on the horizontal isobaric surfaces, while the structural characteristics of the system can be further examined through its vertical cross-sections. Figure 9 illustrates the latitudinal cross-sections of the ERA5 PV and MWTS-2 TB observations of channels 4–7. All TB observations have already been interpolated to the ERA5 grid. In Figure 9a, a cutoff low had just developed at 18:00 UTC 21 June. At the location near (60°N, 65°E), high PV anomaly extended from about 200 hPa to about 600 hPa, indicating a lowering of the tropopause. At the same location, TB observations of channels 4–5 have cold anomalies, while those of channels 6–7 show warm anomalies. Compared with Figure 9a, Figure 9b shows a cross-section at a lower latitude of 53°N at the same time. No apparent PV or TB anomaly was observed around 65°E. Comparing results in Figure 9a with Figure 9c at the same latitude of 60°N, as the high PV anomaly center moved from around 65°E to 80°E and became weak after 36 h, TB anomalies also moved and weakened. Comparing Figure 9b and Figure 9d, the high PV anomaly appeared at around 80°E in Figure 9d, and TBs of channels 4–7 show obvious anomalies at the same place. The above comparisons among Figure 9a–d show that the cutoff low was obviously moving southeastward from 21 to 23 June. Figure 9e–h show a process where the cutoff low system enters the NCCV domain while weakening. The depth of the PV anomaly and the amplitude of TB anomalies were reduced as the cutoff low weakened.
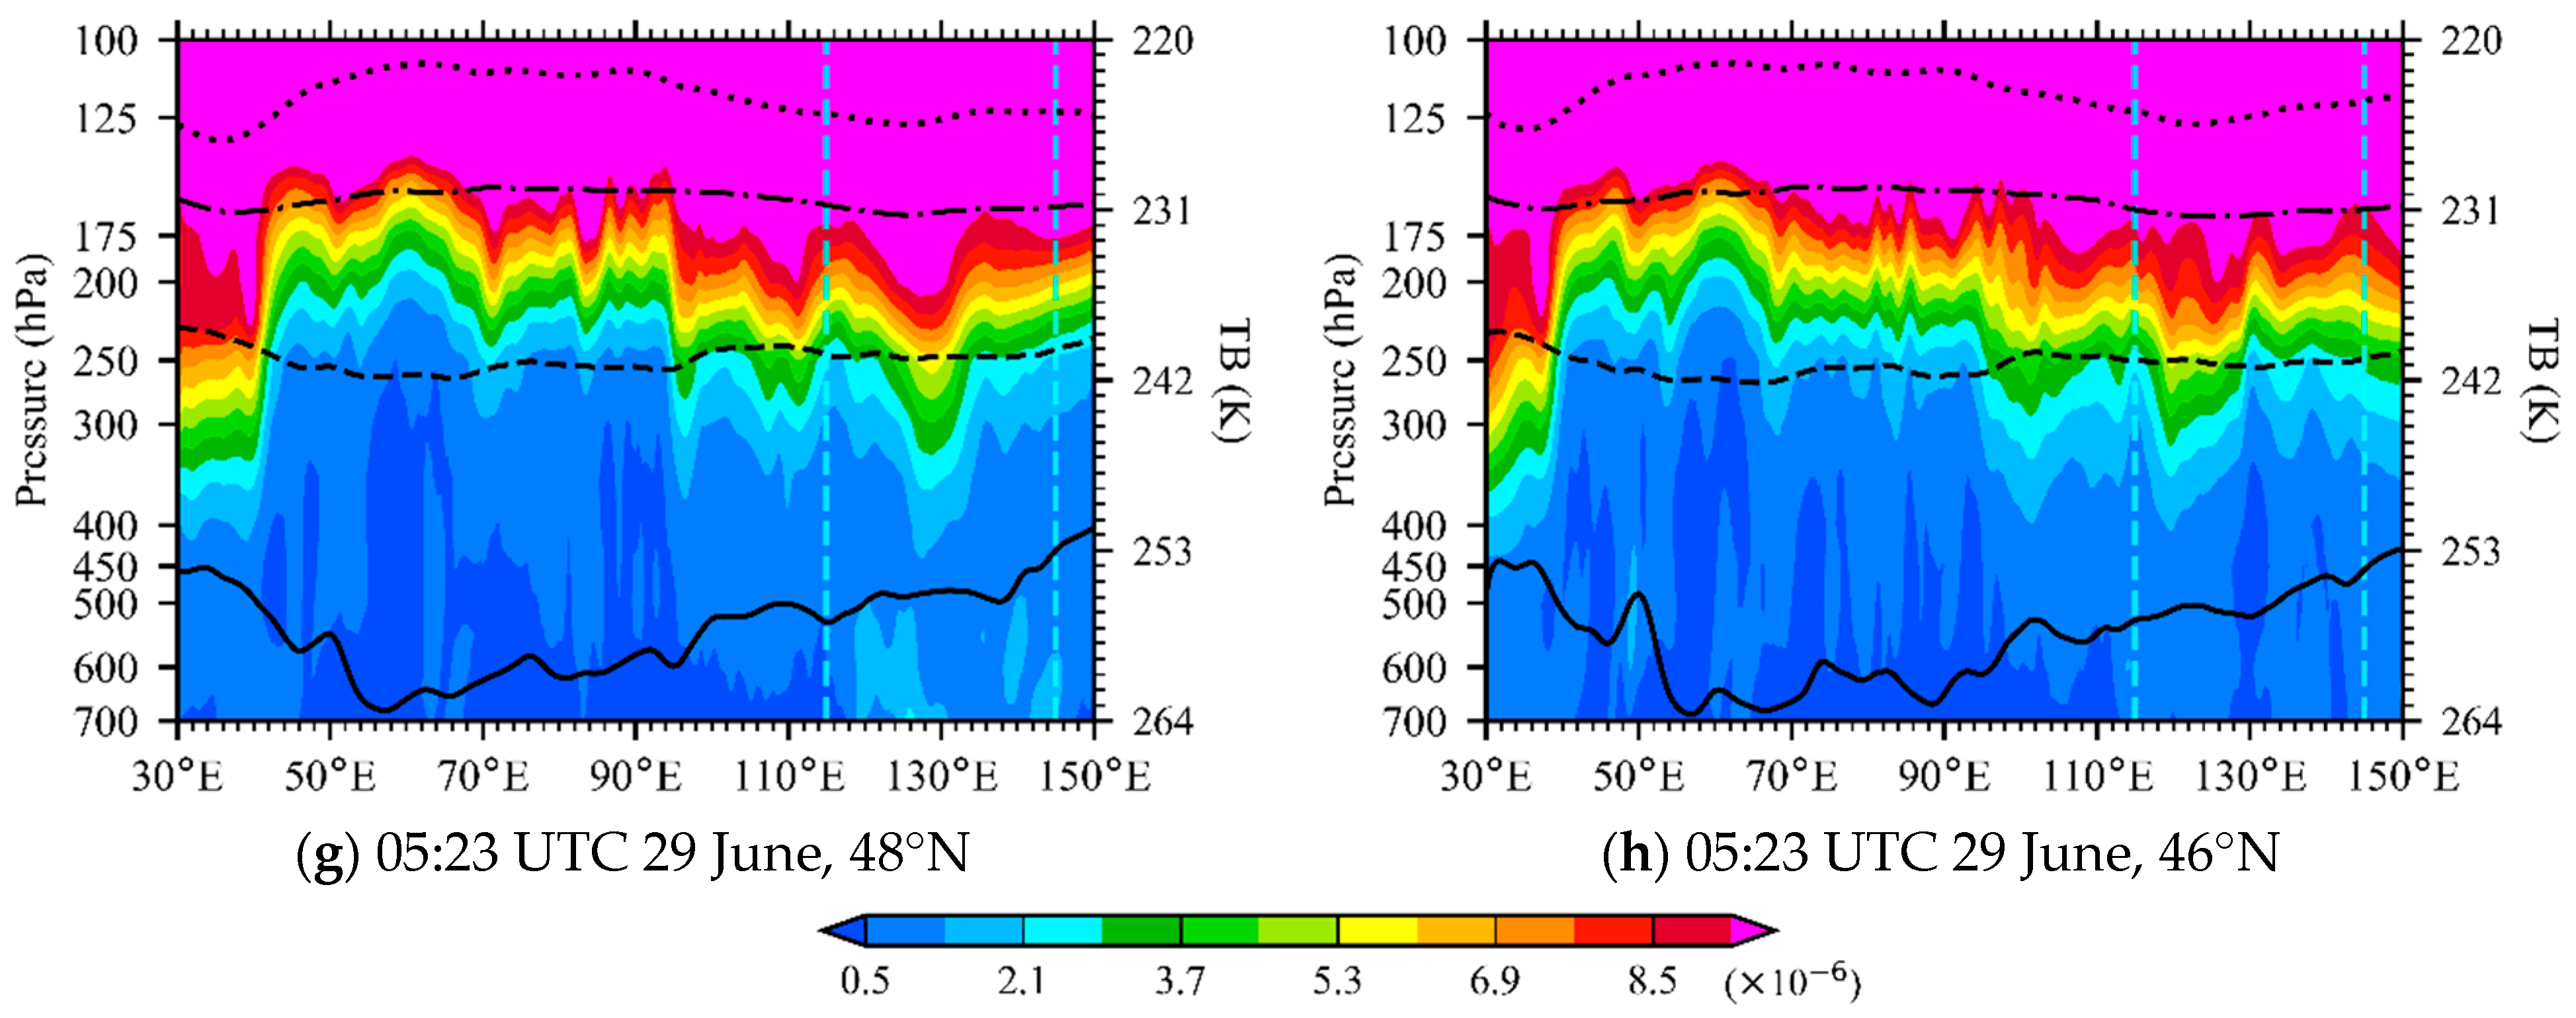
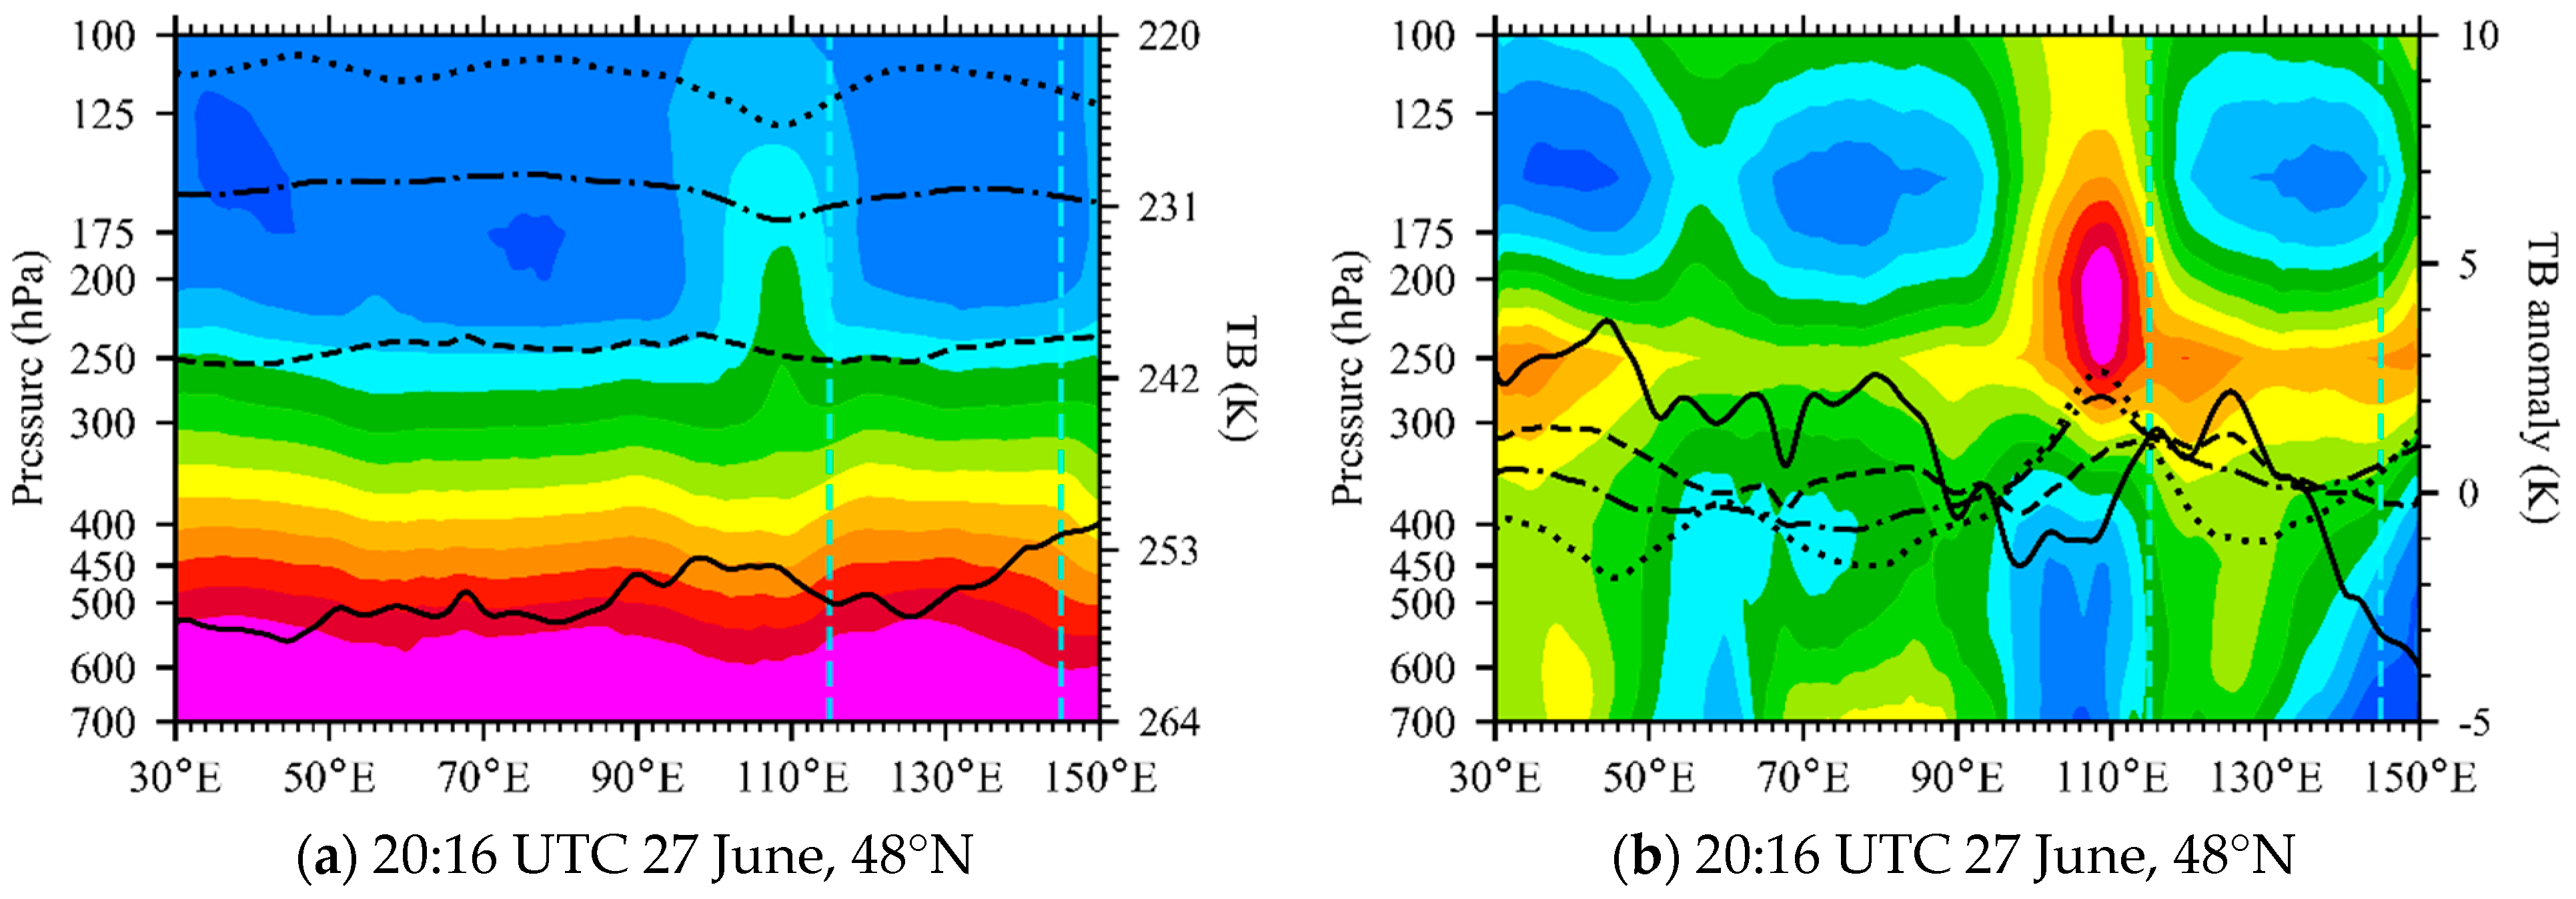
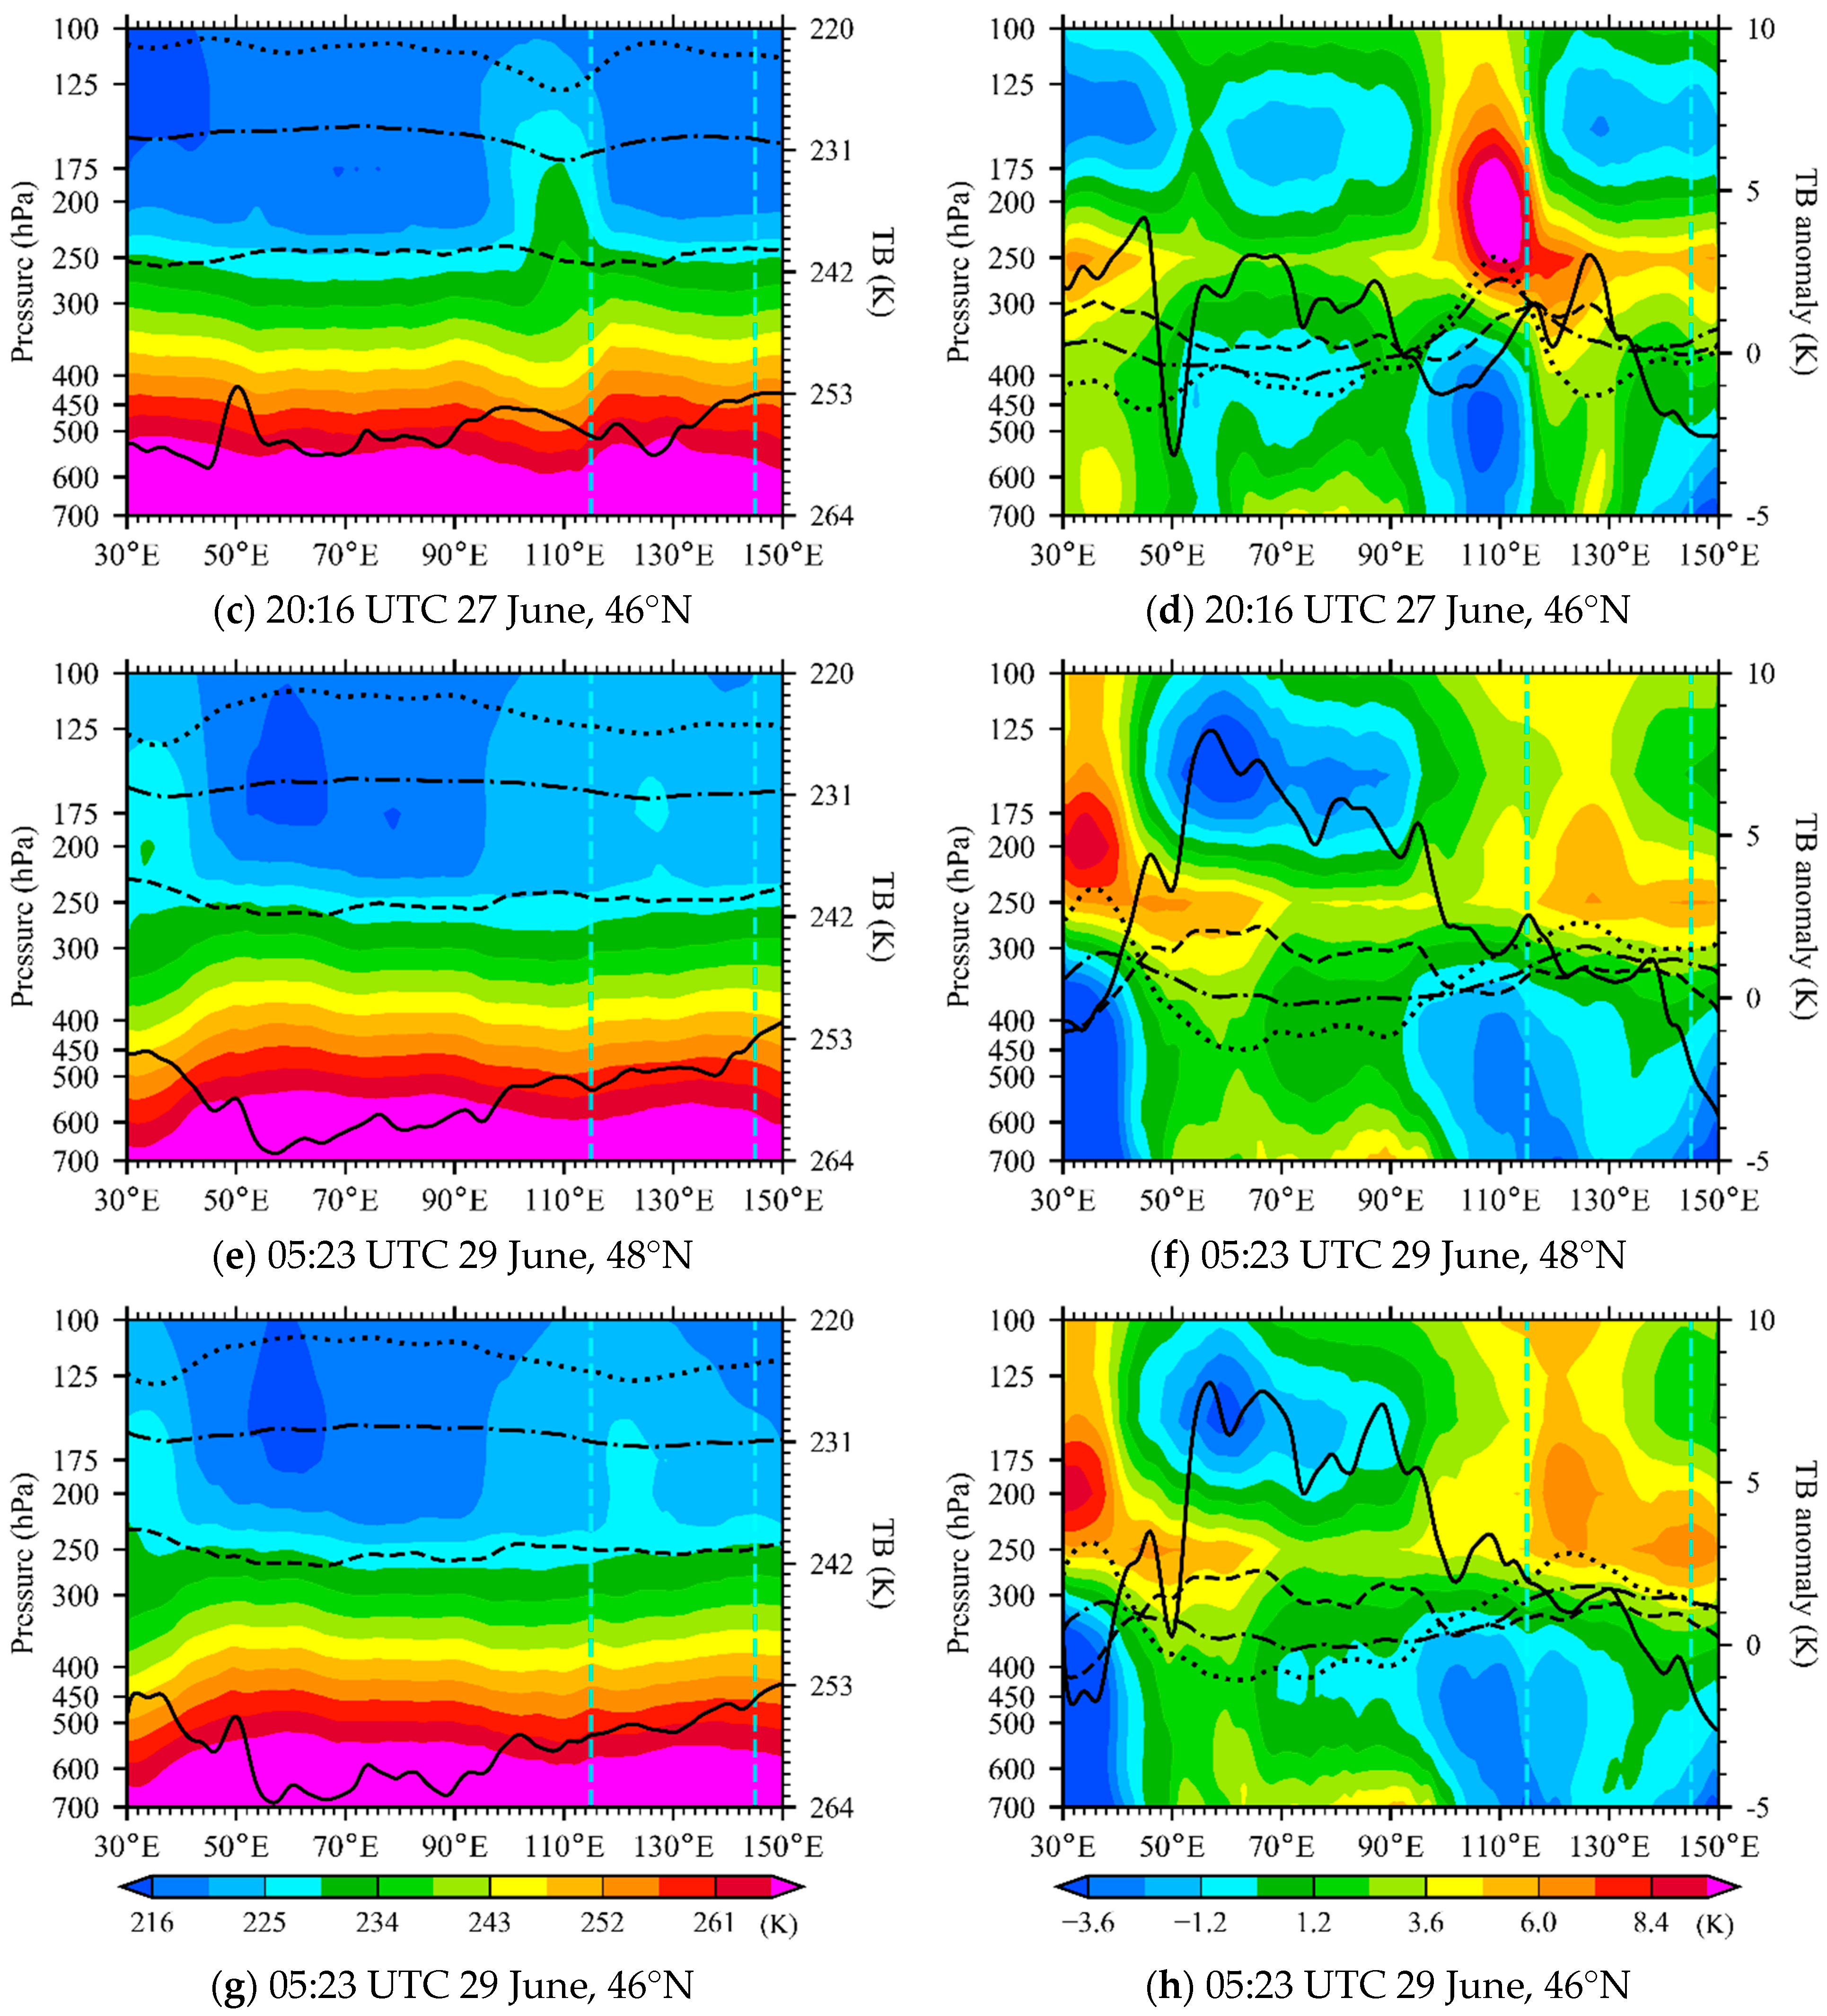
In order to further investigate the process of the cutoff low entering the NCCV domain and gradually weakening, cross-sections of temperatures and temperature anomalies from the ERA5 reanalysis, overlapping with TBs and TB anomalies of channels 4–7 at 48°N and 46°N from 27 to 29 June are demonstrated in Figure 10. The reference states for calculating anomalies are given by the global average of temperatures (TBs) at different latitudes and vertical levels (channels) from 21 to 29 June 2019. In the left panel of Figure 10, due to the large temperature variation within 300–700 hPa, the cold core of the cutoff low in the middle and lower troposphere is not obvious, with only a downward concave contour of temperature at 110°E. However, in the upper layer of 100–300 hPa, there is a clear upward convex curve of temperature contour, which shows an existence of a warm core and corresponds to high anomalies of channels 6–7 TB observations. When the cutoff low became weak, an insignificant warm core in the upper layer could be observed in Figure 10e,g, and channels 6–7 TB anomalies were relatively small at this time.
Temperature and TB anomalies are illustrated in the right panel of Figure 10, which amplifies the TB features of the cutoff low. It can be clearly seen that there was an obvious negative temperature anomaly at 450–700 hPa and an obvious positive temperature anomaly at 100–300 hPa near 110°E. At 18:00 UTC 27 June, TB observations of channels 6–7 had positive anomalies of 2–3 K, while those of channels 4–5 had negative anomalies around −1 K. In Figure 10f,h, the cutoff low had entered the NCCV domain at 06:00 UTC 29 June, with the center at about (46°N, 120°E). At this time, TB anomalies of channels 6–7 are around 1–3 K near the NCCV, while negative TB anomalies of channels 4–5 are weak. Therefore, when the cutoff low is strong, channels 4–7 can observe it clearly. However, when the NCCV system gradually weakens, the structure observed by channels 6–7 is clearer than those of channels 4–5, because of the stratosphere intrusion feature of cutoff lows and because the channels of higher levels are less affected by the underlying surface, low-level cloud, and rain.

5.2. Tracks of the Cutoff Lows to Form NCCV

Based on the analysis above, it can be inferred that the high TB centers of channels 6–7 can be used to locate and identify the cutoff lows. In addition to the NCCV case in 21 to 29 June 2019 studied above, cutoff lows and their movements that lead to occurrences of another three NCCVs in July 2019 are also studied. The starting and ending times of the four precipitation events which occurred in Northeast China in June and July 2019 under the influences of four NCCV cases are listed in Table 3. Hourly precipitation measurements were provided by a dense network of automatic stations.
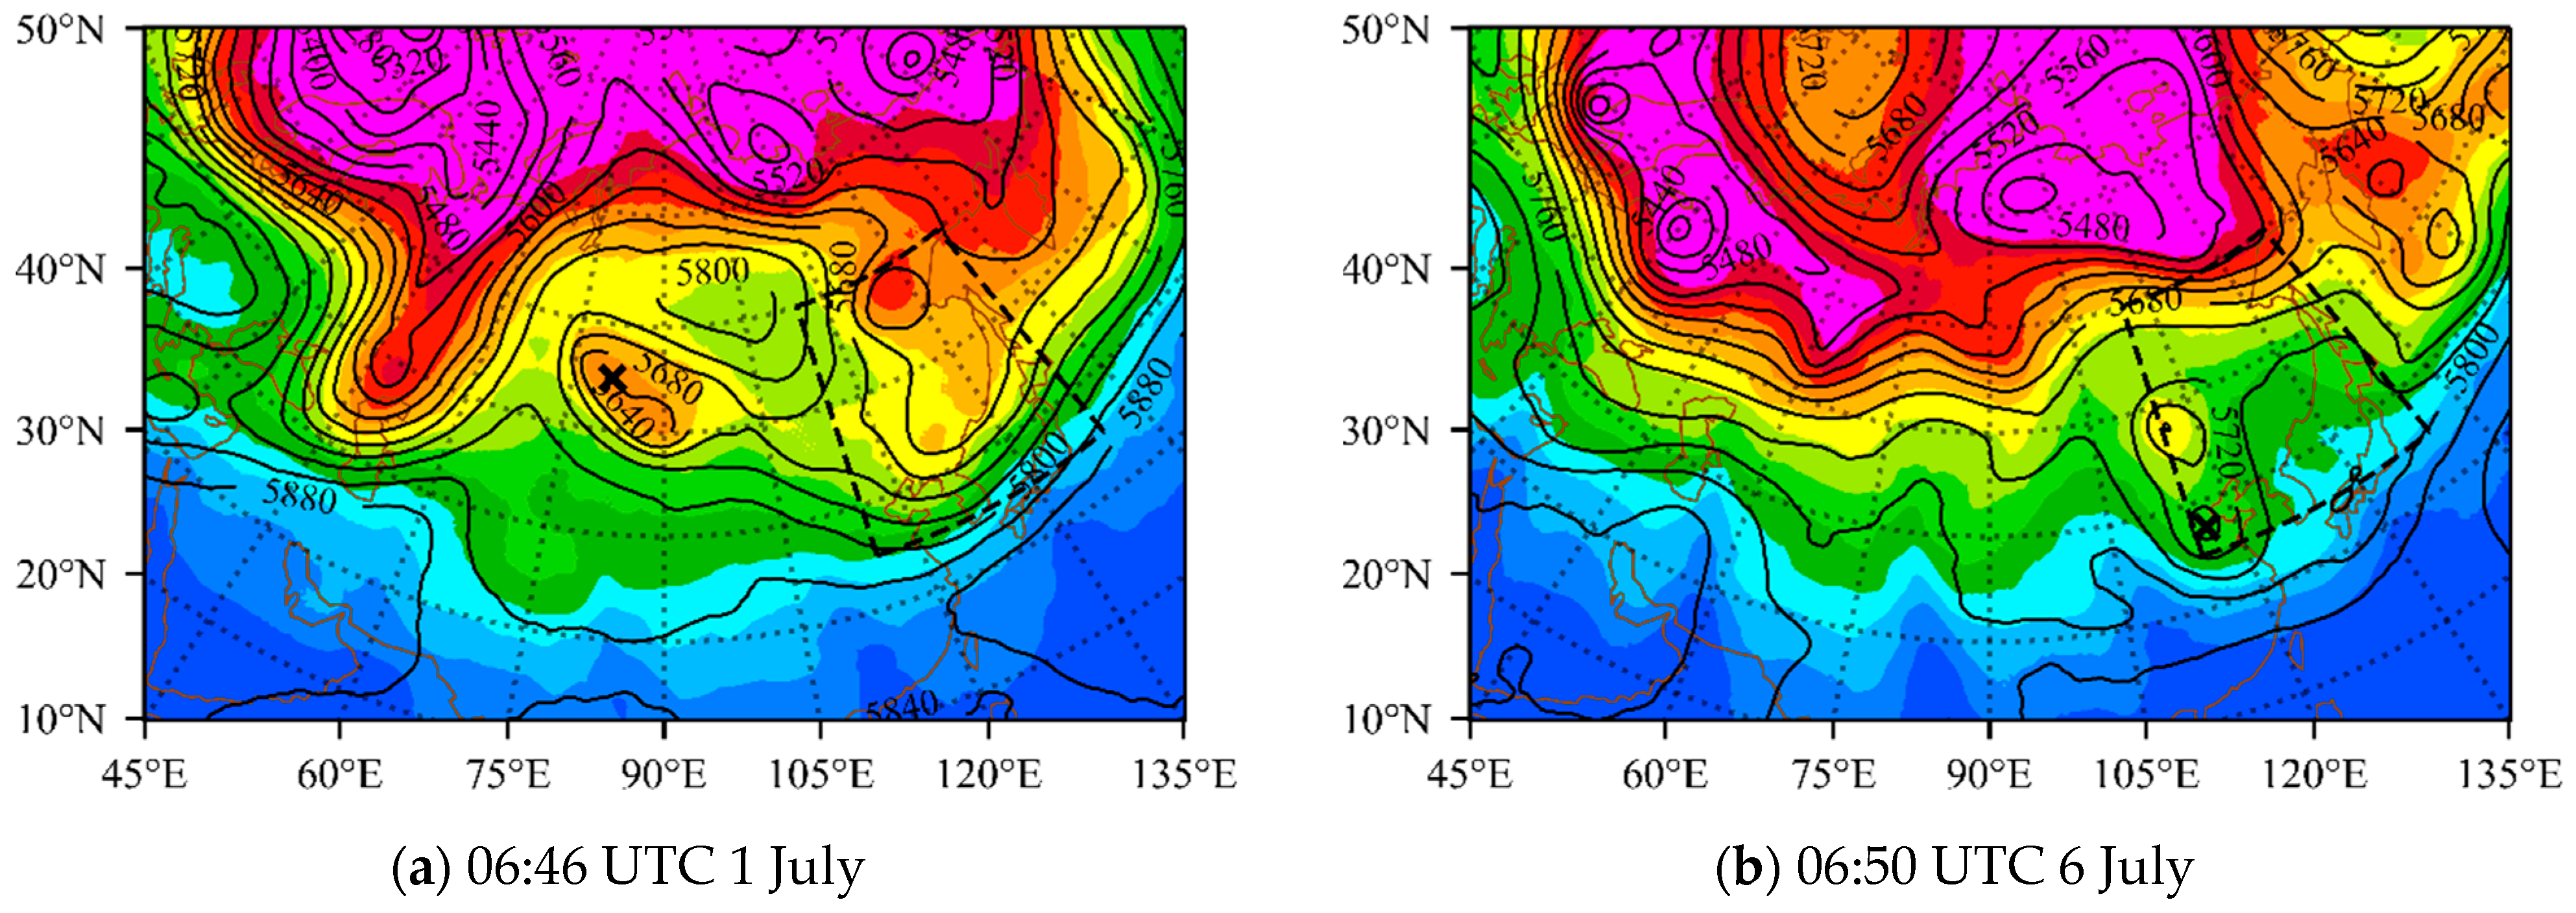
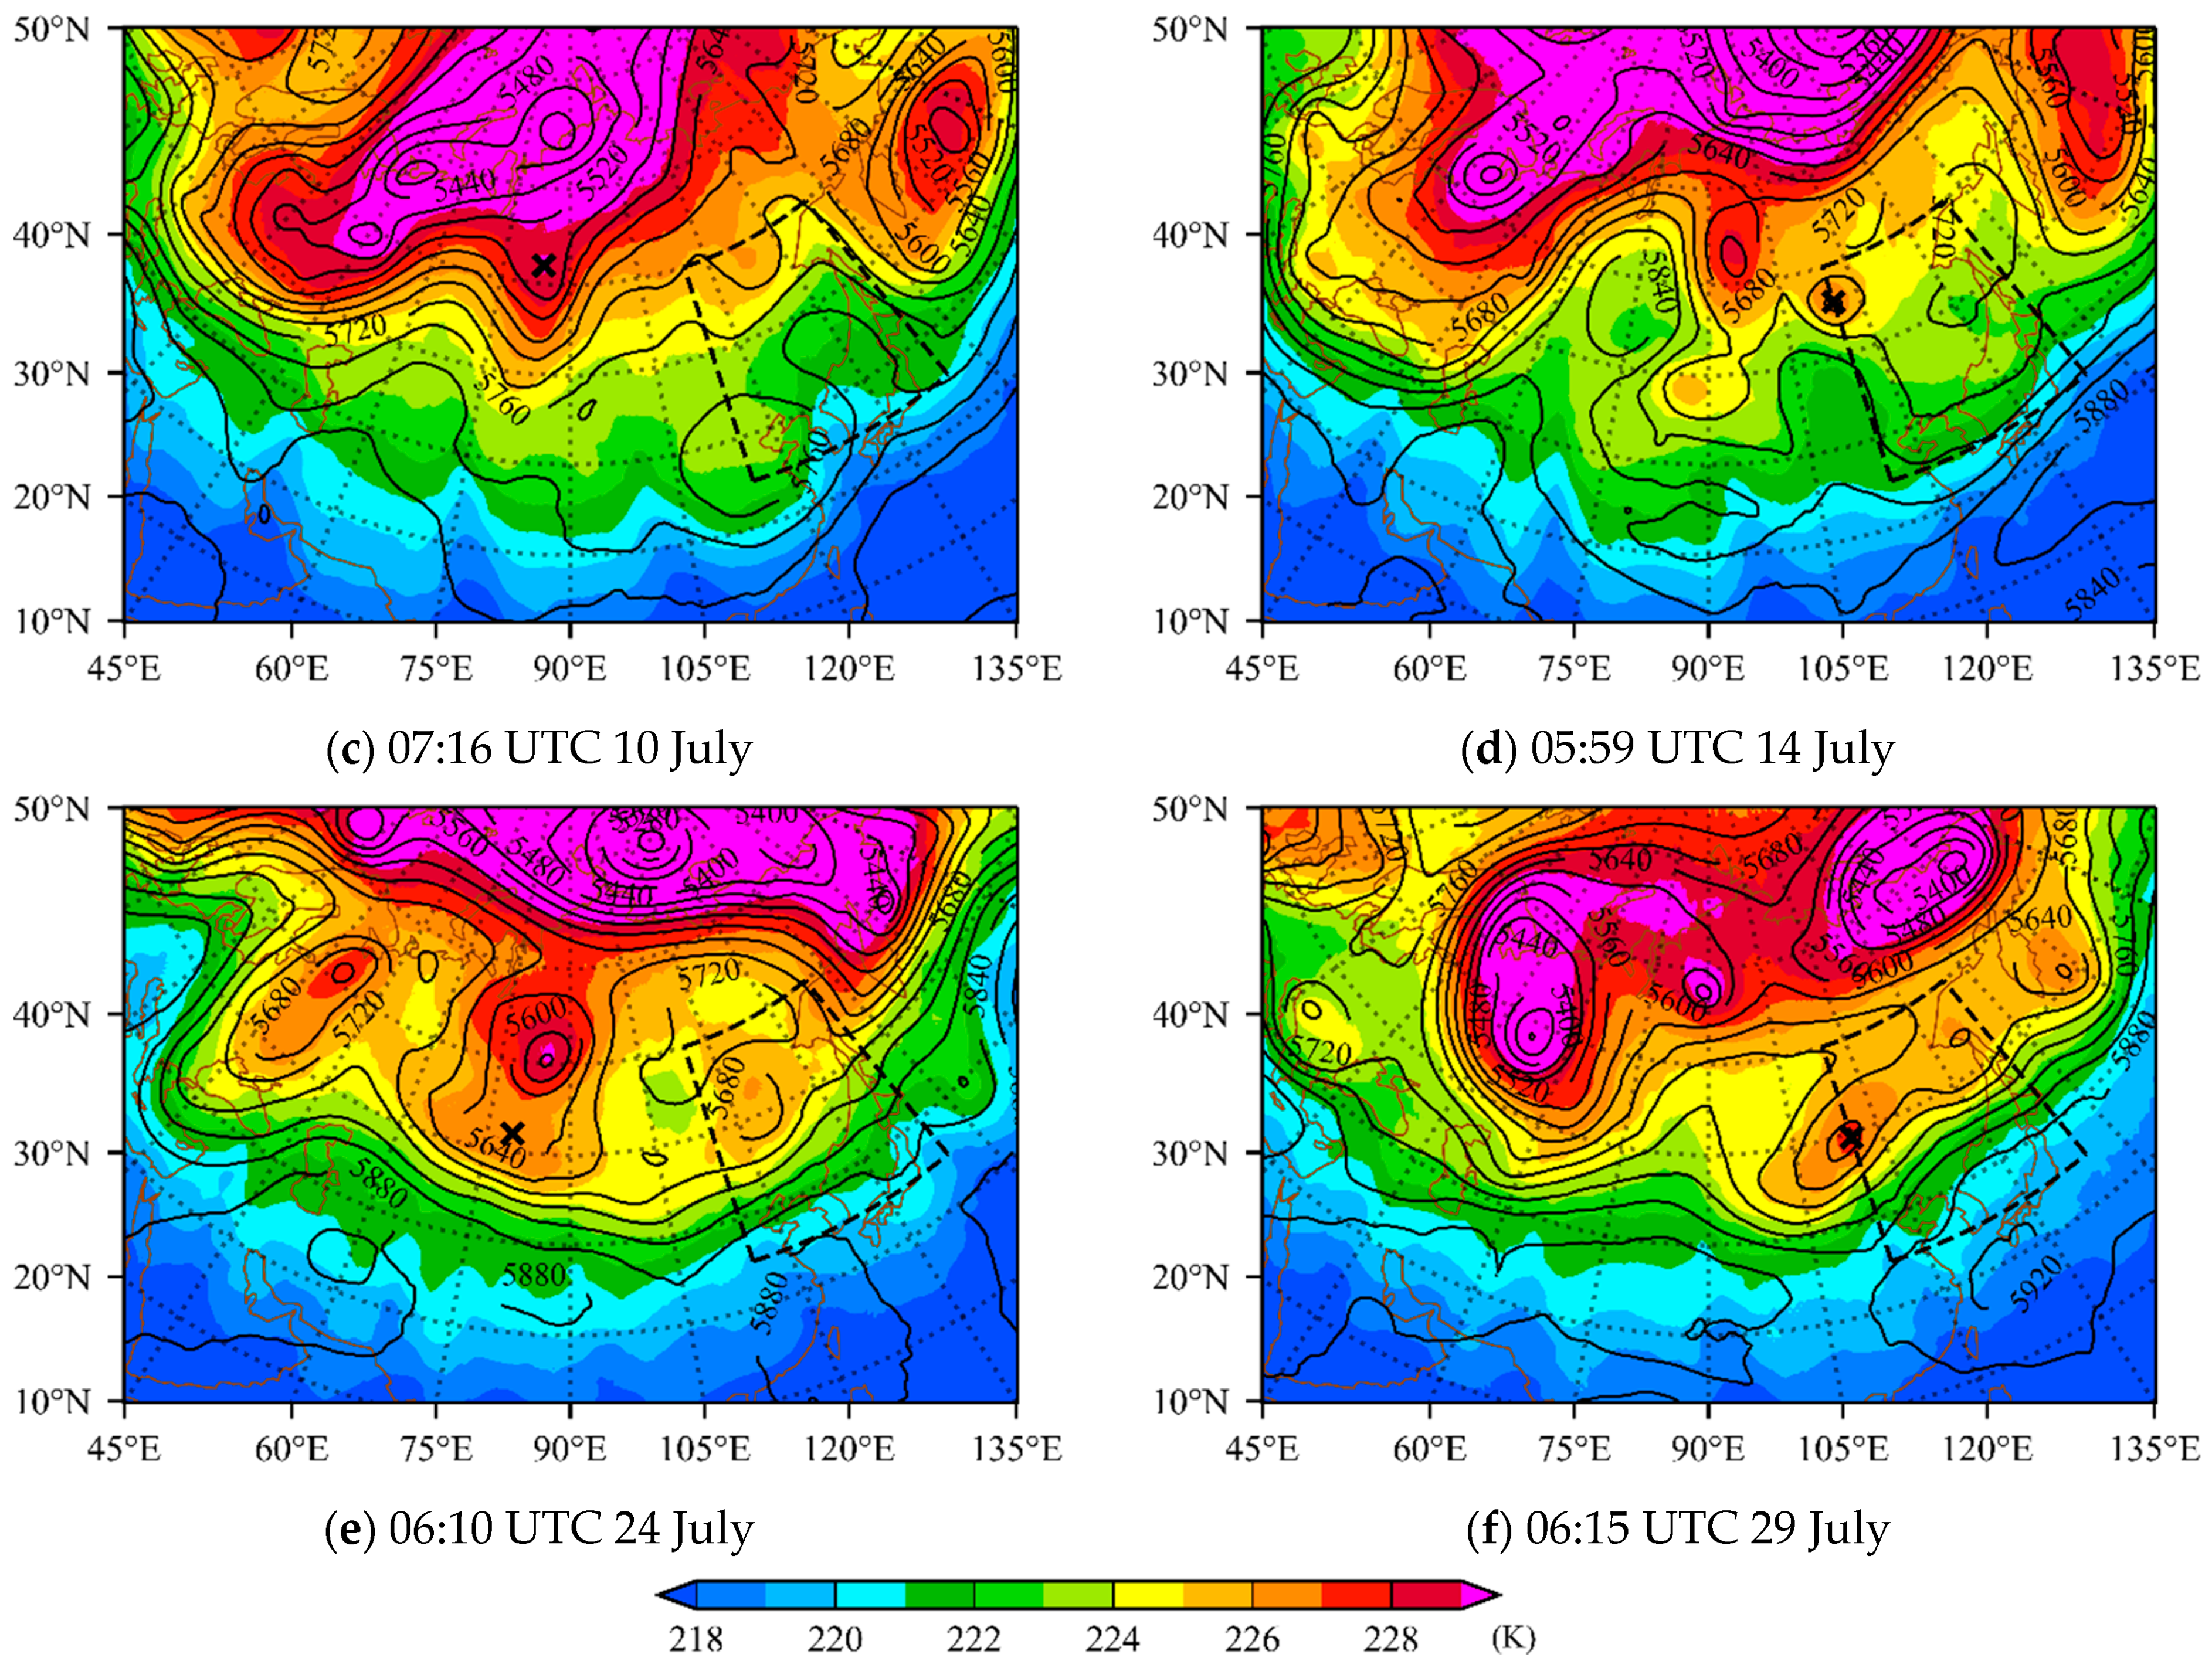
Figure 11 shows the spatial distributions of TB observations of channel 7 and the ERA5 500 hPa geopotential height at the starting times and the times of cutoff lows entering the NCCV domain of the three newly added NCCV case studies. The high TB centers of channel 7 coincide with the cutoff lows at 500 hPa. Figure 11a,c,e (left panel) show a developed cutoff low, a trough that leads to the formation of cutoff low, and another developing trough, respectively. The three systems all evolved from the middle- and high-latitude areas northwest of the NCCV domain.
Figure 12 shows the tracks of the four cutoff lows of the NCCVs in June and July 2019 manually determined by the high TB centers of MWTS-2 channels 6–7 (Figure 12a), the 500 hPa low-pressure centers (Figure 12b), and the 300 hPa high PV centers (Figure 12c). The NCCV tracks identified by channel 6 are approximately the same as those of channel 7 (Figure 12a). The NCCV tracks identified by TB observations of channels 6–7 are generally in good agreement with those determined by geopotential height and PV, which suggests the validity of using MWTS-2 TB observations for tracking cutoff lows/NCCVs. As channels 6–7 mainly show upper-level atmosphere, the tracks identified by these two channels (Figure 12a) are slightly more similar to those detected by 300 hPa PV (Figure 12c) than 500 hPa geopotential height (Figure 12b), for example, the process of cutoff low entering the NCCV domain of the tracks in blue for the 1–8 July case as well as the twists and turns of the tracks in red for the 24–30 July case. The solid symbols in Figure 12 indicate the times of the cutoff low center entering the NCCV domain, which are also listed in Table 3. The times of cutoff low center entering the NCCV domain are close to the times when the precipitation started, but sometimes the precipitation would occur earlier than the arrival of the cutoff low. As a result, it is essential to pay attention to the cutoff lows early before their arrival. The possibility of applying TB observations of MWTS-2 channels 6–7 to observing the precursors of NCCVs is verified above.

6. Conclusions

Satellite TB observations from MWTS-2 on board FY-3D are applied in this research to investigate the potential for real-time monitoring of NCCVs. Compared with the ERA5 reanalysis, TB observations of MWTS-2 channels 4–5 signal NCCV cold core structure in the troposphere, while TB observations of channels 6–7 capture NCCV warm core structures in the stratosphere. With fewer influences from the Earth’s surface and low-level cloud and precipitation, channels 6–7 observe NCCVs in a clearer way than channels 4–5. The moving tracks of the four NCCV cases determined by local TB warm centers of channels 6–7 compared favorably with those determined by the 300 hPa PV and 500 hPa geopotential height from the ERA5 reanalysis. In other words, TB observations of MWTS-2 channels 6–7 can be used for identifying the precursors of NCCVs.
This study provides a new way of observing NCCVs directly from MWTS-2 TB observations. Possibilities to first make the algorithm automatic and then to compare the rate of detections and the rate of false alarms between automation and those manually performed will be explored in a follow-on work. Moreover, this paper only employed the TB observations from FY-3D MWTS-2, which is a recently launched afternoon polar-orbiting meteorological satellite. If observations from microwave sounders on board early-morning (FY-3E), morning (e.g., MetOp-C), and afternoon (e.g., FY-3D or NOAA-20) polar-orbiting satellites are used together, we may have six times the daily global TB observations for investigating NCCVs at synoptic and mesoscales. Further investigations are also planned to seek dominating features in terms of NCCV tracks and structures that lead to heavy rain events.

Author Contributions

Conceptualization, X.Z. and H.L.; methodology, H.L. and X.Z.; software, H.L.; validation, H.L. and X.Z.; formal analysis, H.L. and X.Z.; investigation, H.L. and X.Z.; resources, X.Z.; data curation, H.L. and X.Z.; writing—original draft preparation, H.L.; writing—review and editing, X.Z.; visualization, H.L.; supervision, X.Z.; project administration, X.Z.; funding acquisition, X.Z. All authors have read and agreed to the published version of the manuscript.

Funding

This research was supported by the National Key R&D Program of China Grant 2018YFC1507302.

Institutional Review Board Statement

Not applicable.

Informed Consent Statement

Not applicable.

Data Availability Statement

Not applicable.

Conflicts of Interest

The authors declare no conflict of interest.

References

  1. Palmén, E.; Newton, C.W. Atmospheric Circulation Systems: Their Structure and Physical Interpretation; Academic Press: New York, NY, USA, 1969. [Google Scholar]
  2. Nieto, R.; Gimeno, L.; de al Torre, L.; Ribera, P.; Gallego, D.; García-Herrera, R.; García, J.A.; Nuñez, M.; Redaño, A.; Lorente, J. Climatological Features of Cutoff Low Systems in the Northern Hemisphere. J. Clim. 2005, 18, 3085–3103. [Google Scholar] [CrossRef] [Green Version]
  3. Wang, W.; Li, J.; Hu, C.; Li, J.; Jiao, M. A Review of Definition, Identification and Quantitative Investigation on Northeast Cold Vortex. J. Meteorol. Sci. 2017, 37, 394–402. [Google Scholar]
  4. Sun, L.; Zheng, X.; Wang, Q. The Climatological Characteristics of Northeast Cold Vortex in China. Q. J. Appl. Meteorol. Chin. 1994, 5, 297–303. [Google Scholar]
  5. Zhang, L.; Li, Z. A Summary of Research on Cold Vortex over Northeast China. Clim. Environ. Res. Chin. 2009, 14, 218–228. [Google Scholar]
  6. Liu, G.; Lian, Y.; Yan, P.; Zeng, Y.; Yang, X.; Cao, L. The Objective Recognition and Classification of Northeast Cold Vortex and the Northern Hemisphere Atmospheric Circulation Characters in May to August. Sci. Geogr. Sin. 2015, 35, 1042–1050. [Google Scholar]
  7. Sun, L. A Study of the Persistence Activity of Northeast Cold Vortex in China. Sci. Atmos. Sin. Chin. 1997, 21, 297–307. [Google Scholar]
  8. Kalnay, E.; Kanamitsu, M.; Kistler, R.; Collins, W.; Deaven, D.; Gandin, L.; Iredell, M.; Saha, S.; White, G.; Woollen, J.; et al. The NCEP/NCAR 40-Year Reanalysis Project. Bull. Am. Meteorol. Soc. 1996, 77, 437–472. [Google Scholar] [CrossRef] [Green Version]
  9. Huang, X.; Li, D. Objective Identification Method and Variation Characteristics of the Northeast China Cold Vortex from May to August of 1979–2018. Acta Meteorol. Sin. 2020, 78, 945–961. [Google Scholar]
  10. Dee, D.P.; Uppala, S.M.; Simmons, A.J.; Berrisford, P.; Poli, P.; Kobayashi, S.; Andrae, U.; Balmaseda, M.A.; Balsamo, G.; Bauer, P.; et al. The ERA-Interim Reanalysis: Configuration and Performance of the Data Assimilation System. Q. J. R. Meteorol. Soc. 2011, 137, 553–597. [Google Scholar] [CrossRef]
  11. Li, S.; Ding, Z.; Dai, P.; Liu, Y. Recent Advances in Research on Northeast China Cold Vortex. J. Arid Meteorol. 2016, 34, 13–19. [Google Scholar]
  12. Sun, L.; An, G.; Lian, Y.; Sheng, B.; Tang, X. A Study of the Persistent Activity of North East Cold Vortex in Summer and Its Genral Circulation Anomaly Characteristics. Acta Meteorol. Sin. 2000, 55, 704–714. [Google Scholar] [CrossRef]
  13. He, J.; Wu, Z.; Jiang, Z.; Miao, C.; Han, G. “Climate Effect” of the Northeast Cold Vortex and Its Influences on Meiyu. Chin. Sci. Bull. Chin. 2006, 51, 2803–2809. [Google Scholar] [CrossRef]
  14. Miao, C.; Wu, Z.; He, J.; Chi, Y. The Anomalous Features of the Northeast Cold Vortex During the First Flood Period in the Last 50 Years and Its Correlation with Rainfall in South China. Chin. J. Atmos. Sci. 2006, 30, 1249–1256. [Google Scholar]
  15. Zhong, S.; Wang, D.; Zhang, R.; Liu, Y. Analyses on the Structure Characteristic and Formation Mechanism of the Rainstorm Related to a Cold Vortex System over Northeast China. Plateau Meteorol. 2011, 30, 951–960. [Google Scholar]
  16. Shen, X.; Zhang, C.; Gao, H.; Wang, L. Classification and Dynamic Composite Analysis of Three Kinds of High Altitude Cold Vortex. Torrential Rain Disasters 2020, 39, 1–9. [Google Scholar]
  17. Dong, C.; Yang, J.; Zhang, W.; Yang, Z.; Lu, N.; Shi, J.; Zhang, P.; Liu, Y.; Cai, B. An Overview of a New Chinese Weather Satellite FY-3A. Bull. Am. Meteorol. Soc. 2009, 90, 1531–1544. [Google Scholar] [CrossRef]
  18. Zhang, P.; Yang, J.; Dong, C.; Lu, N.; Yang, Z.; Shi, J. General Introduction on Payloads, Ground Segment and Data Application of Fengyun 3A. Front. Earth Sci. 2009, 3, 367–373. [Google Scholar] [CrossRef]
  19. Schwalb, A. The TIROS-N/NOAA A-G Satellite Series; The National Aeronautics and Space Administration: Washington, DC, USA, 1978; p. 12135.
  20. Mo, T. Prelaunch Calibration of the Advanced Microwave Sounding Unit-A for NOAA-K. IEEE Trans. Microw. Theory Tech. 1996, 44, 1460–1469. [Google Scholar] [CrossRef] [Green Version]
  21. Mo, T. Calibration of the Advanced Microwave Sounding Unit-A Radiometers for NOAA-N and NOAA-N’; U.S. Department of Commerce, National Oceanic and Atmospheric Administration: Washington, DC, USA; National Environmental Satellite, Data, and Information Service (NESDIS): Silver Spring, MD, USA, 2002.
  22. Kim, E.; Lyu, C.-H.J.; Anderson, K.; Vincent Leslie, R.; Blackwell, W.J. S-NPP ATMS Instrument Prelaunch and on-Orbit Performance Evaluation. J. Geophys. Res. Atmos. 2014, 119, 5653–5670. [Google Scholar] [CrossRef] [Green Version]
  23. Zou, X. Atmospheric Satellite Observations, 1st ed.; Academic Press: New York, NY, USA, 2020; ISBN 978-0-12-820950-9. [Google Scholar]
  24. Yang, Z.; Zhang, P.; Gu, S.; Hu, X. Capability of Fengyun-3D Satellite in Earth System Observation. J. Meteorol. Res. 2019, 33, 1113–1130. [Google Scholar] [CrossRef]
  25. Li, J.; Zou, X. A Quality Control Procedure for FY-3A MWTS Measurements with Emphasis on Cloud Detection Using VIRR Cloud Fraction. J. Atmos. Ocean. Technol. 2013, 30, 1704–1715. [Google Scholar] [CrossRef] [Green Version]
  26. Zou, X.; Tian, X. Striping Noise Analysis and Mitigation for Microwave Temperature Sounder-2 Observations. Adv. Atmos. Sci. 2019, 36, 711–720. [Google Scholar] [CrossRef]
  27. Tian, X.; Zou, X.; Yang, S. A Limb Correction Method for the Microwave Temperature Sounder 2 and Its Applications. Adv. Atmos. Sci. 2018, 35, 1547–1552. [Google Scholar] [CrossRef]
  28. Tian, X.; Zou, X. ATMS- and AMSU-A-Derived Hurricane Warm Core Structures Using a Modified Retrieval Algorithm. J. Geophys. Res. Atmos. 2016, 121, 12630–12646. [Google Scholar] [CrossRef] [Green Version]
  29. Niu, Z.; Zou, X.; Huang, W. Typhoon Warm-Core Structures Derived from FY-3D MWTS-2 Observations. Remote Sens. 2021, 13, 3730. [Google Scholar] [CrossRef]
  30. Niu, Z.; Zou, X.; Li, D. Northeast China Cold Vortex Observed by FY-3 MWTS-2 and MetOp AMSU-A. J. Geophys. Res. Atmos. 2021, 126, e2021JD035471. [Google Scholar] [CrossRef]
  31. Hersbach, H.; Bell, B.; Berrisford, P. The ERA5 Global Reanalysis. Q. J. R. Meteorol. Soc. 2020, 146, 1999–2049. [Google Scholar] [CrossRef]
  32. Saunders, R.; Hocking, J.; Turner, E.; Rayer, P.; Rundle, D.; Brunel, P.; Vidot, J.; Roquet, P.; Matricardi, M.; Geer, A.; et al. An Update on the RTTOV Fast Radiative Transfer Model (Currently at Version 12). Geosci. Model Dev. 2018, 11, 2717–2737. [Google Scholar] [CrossRef] [Green Version]
  33. U.S. Standard Atmosphere, 1976; National Oceanic and Atmospheric Administration: Washington, DC, USA, 1976.
  34. Goldberg, M.D.; Crosby, D.S.; Zhou, L. The Limb Adjustment of AMSU-A Observations: Methodology and Validation. J. Appl. Meteorol. Climatol. 2001, 40, 70–83. [Google Scholar] [CrossRef]
  35. Zhang, K.; Zhou, L.; Goldberg, M.; Liu, X.; Wolf, W.; Tan, C.; Liu, Q. A Methodology to Adjust ATMS Observations for Limb Effect and Its Applications. J. Geophys. Res. Atmos. 2017, 122, 11347–11356. [Google Scholar] [CrossRef]
  36. Wark, D.Q. Adjustment of TIROS Operational Vertical Sounder Data to a Vertical View; NOAA Technical Report; National Environmental Satellite, Data, and Information Service (NESDIS): Silver Spring, MD, USA, 1993.
  37. World Meteorological Organization (WMO). Meteorology—A Three-Dimensional Science. WMO Bull. 1957, 6, 134–138. [Google Scholar]
  38. Chen, D.; Lü, D.; Chen, Z. Simulation of the Stratosphere-Troposphere Exchange Process in a Typical Cold Vortex over Northeast China. Sci. China Earth Sci. 2014, 57, 1452–1463. [Google Scholar] [CrossRef]
  39. Portmann, R.; Sprenger, M.; Wernli, H. The Three-Dimensional Life Cycles of Potential Vorticity Cutoffs: A Global and Selected Regional Climatologies in ERA-Interim (1979–2018). Weather Clim. Dyn. 2021, 2, 507–534. [Google Scholar] [CrossRef]
  40. Nieto, R.; Sprenger, M.; Wernli, H.; Trigo, R.M.; Gimeno, L. Identification and Climatology of Cut-off Lows near the Tropopause. Ann. N. Y. Acad. Sci. 2008, 1146, 256–290. [Google Scholar] [CrossRef] [PubMed]
  41. Tao, Z.; Zhou, X.; Zheng, Y. Vorticity, Potential Vorticity and Stratospheric Dry Intrusion: Origin, Application and Misuse of Potential Vorticity Concept. Meteorol. Mon. 2012, 38, 28–40. [Google Scholar]
  42. Holton, J.R.; Haynes, P.H.; McIntyre, M.E.; Douglass, A.R.; Rood, R.B.; Pfister, L. Stratosphere-Troposphere Exchange. Rev. Geophys. 1995, 33, 403–439. [Google Scholar] [CrossRef]
  43. Ertel, H. Ein neuer hydrodynamischer Erhaltungssatz. Naturwissenschaften 1942, 30, 543–544. [Google Scholar] [CrossRef]
  44. Hoskins, B.J.; Mcintyre, M.E.; Robertson, A.W. On the Use and Significance of Isentropic Potential Vorticity Maps. Q. J. R. Meteorol. Soc. 1985, 111, 877–946. [Google Scholar] [CrossRef]
  45. Reichler, T.; Dameris, M.; Sausen, R. Determining the Tropopause Height from Gridded Data. Geophys. Res. Lett. 2003, 30. [Google Scholar] [CrossRef] [Green Version]
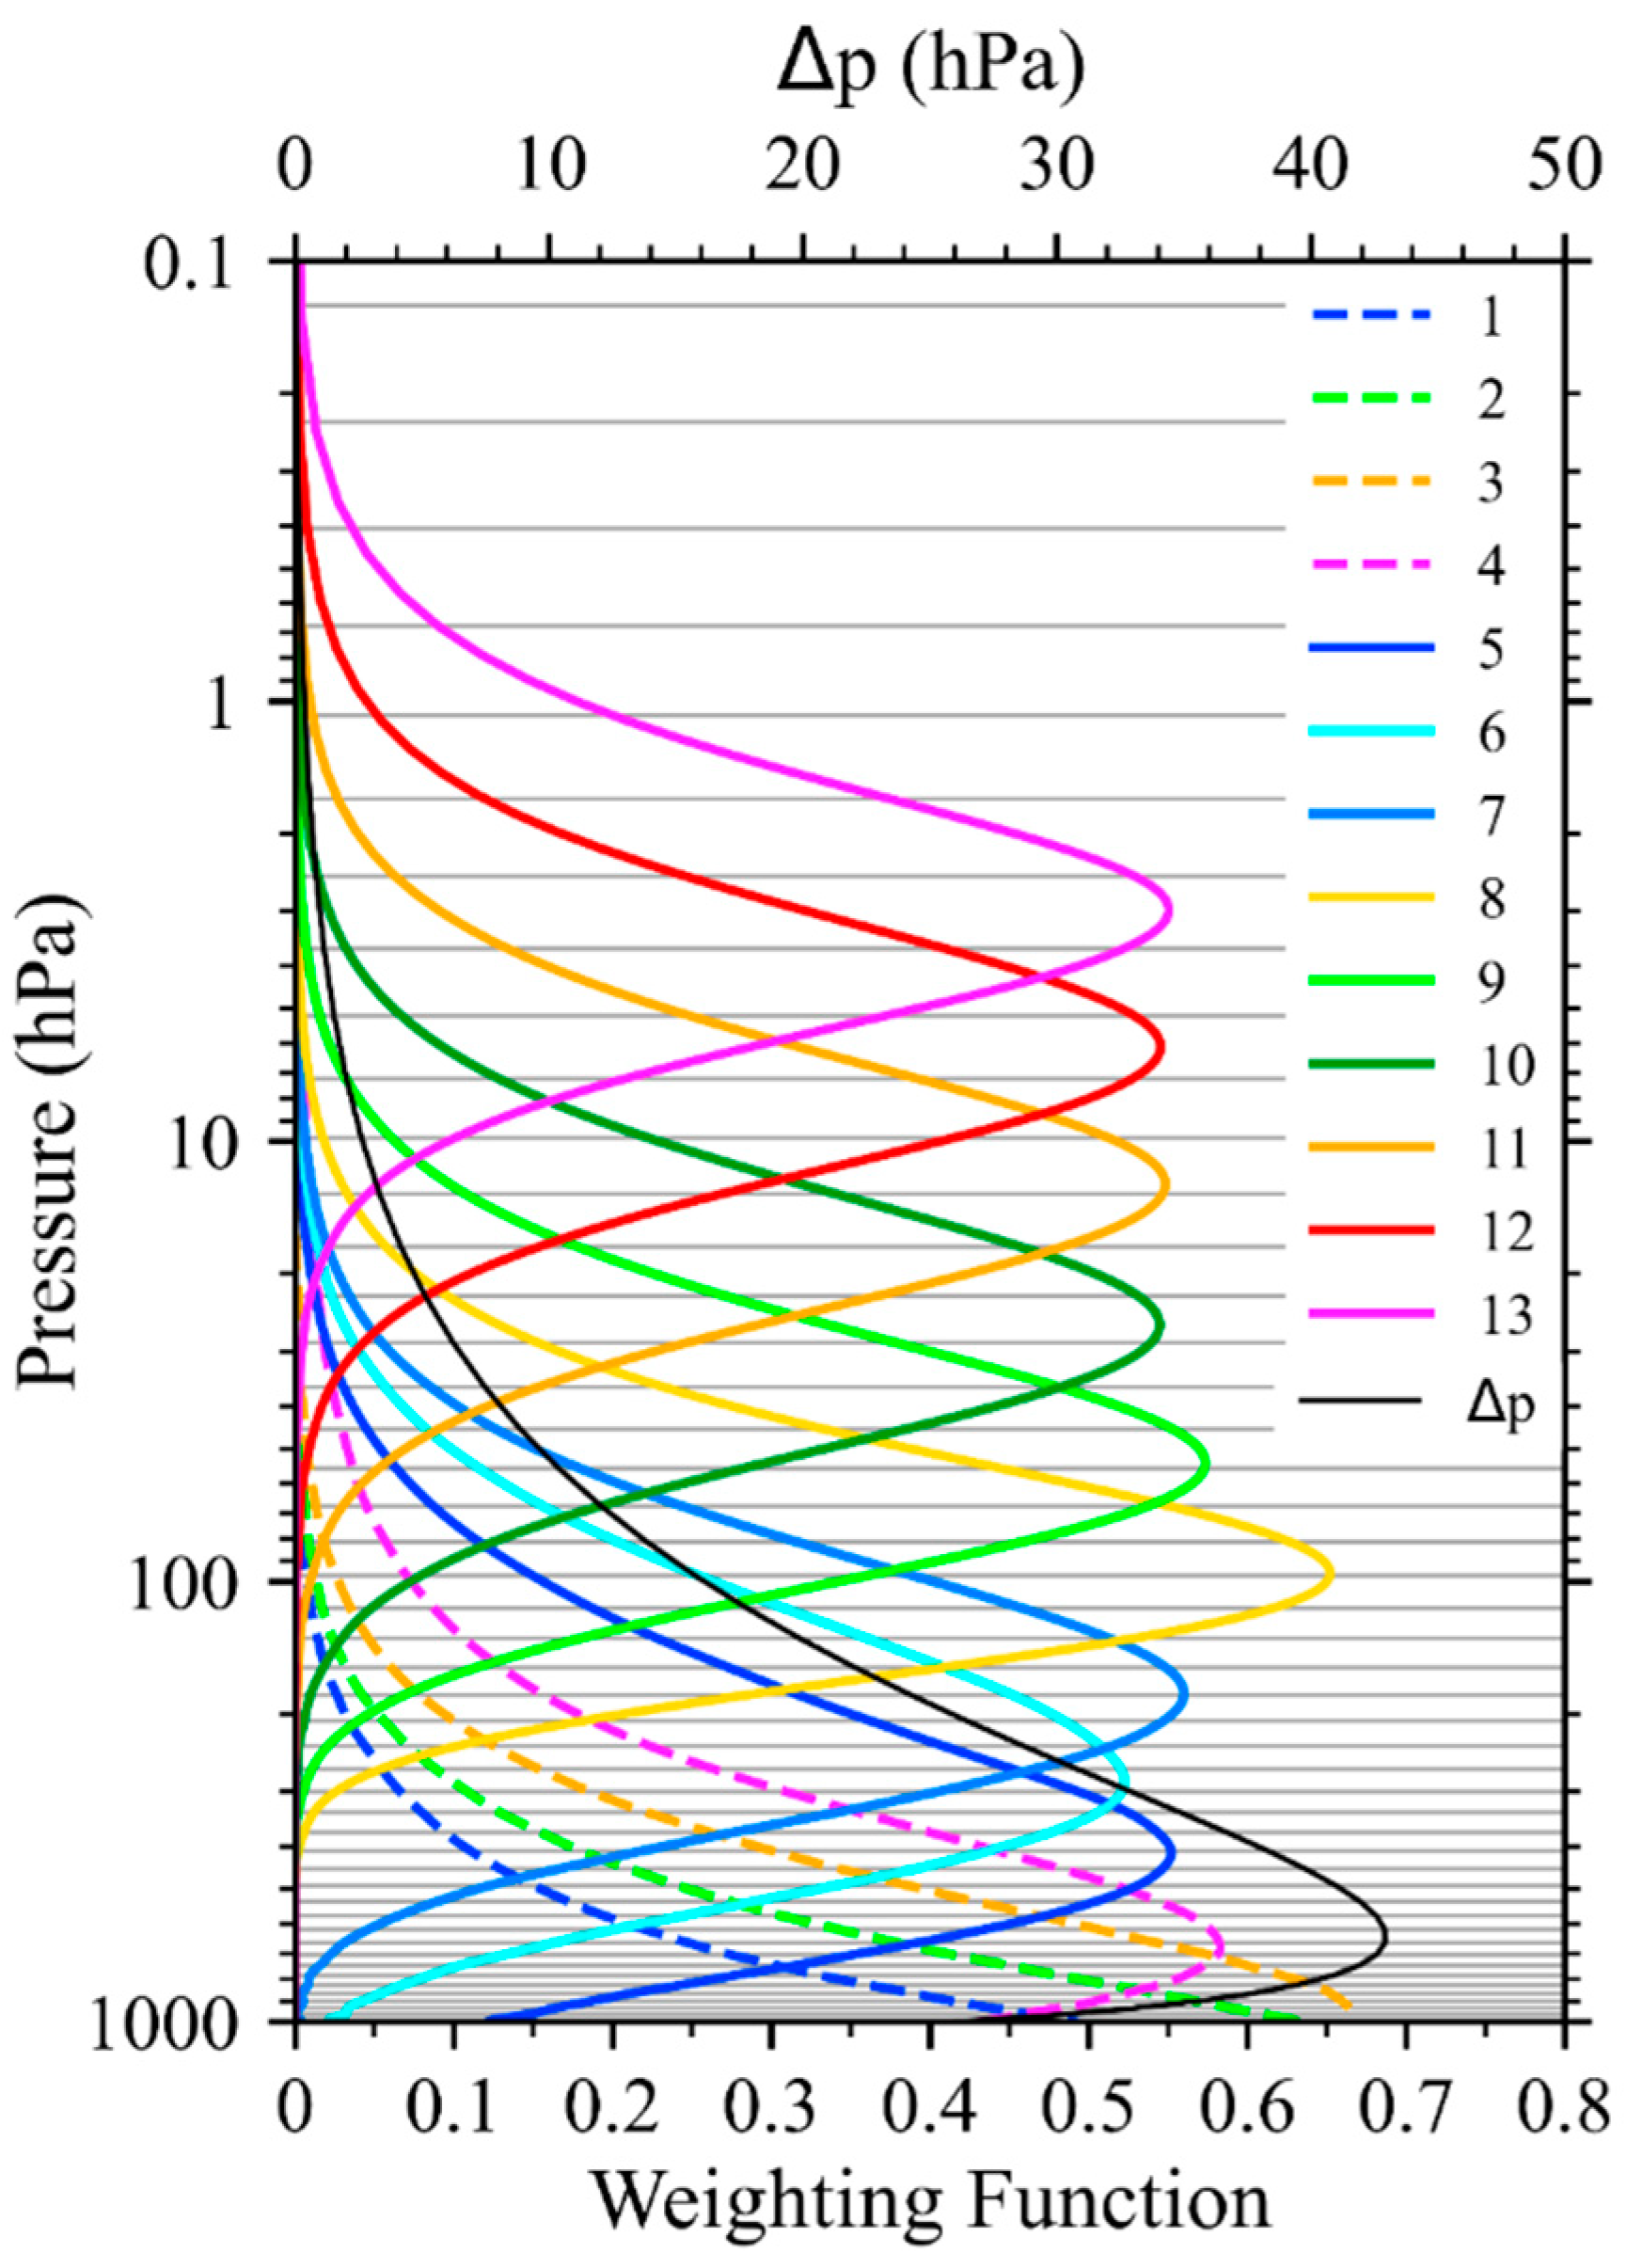
Figure 1. Weighting functions of FY-3D MWTS-2 channels 1–13 (colored curves), calculated by the RTTOV13.0 with the U.S. standard atmosphere profile as input at the nadir. The vertical levels (gray horizontal lines) of RTTOV and the pressure difference between each two neighboring levels of them (black curve) are shown.
Remotesensing 14 02530 g001
Figure 2. Global distributions of FY-3D MWTS-2 brightness temperature observations of channel 4 (a) before and (b) after the limb correction at the ascending node on 21 June 2019 (Unit: K).
Remotesensing 14 02530 g002
Figure 3. Mean scan dependences of FY-3D MWTS-2 brightness temperature observations (Y-axis on the left) before (colored solid curves) and after (colored dashed curves) the limb correction (a) of channels 5–13 globally and (b,c) of channels 1–4 over (b) sea and (c) land within (60°N–60°S, 180°W–180°E). Thin black contours are limb correction values T b ( k = 6   or   4 ) ( i , φ ) T b , L C ( k = 6   or   4 ) ( i , φ ) of (a) channel 6 and (b,c) channel 4 as a function of scan position and latitude at 2° intervals. Limb correction is conducted on observations from 21 to 30 June 2019 with correction coefficients trained with observations from 10 to 20 June 2019.
Remotesensing 14 02530 g003aRemotesensing 14 02530 g003b
Figure 4. Spatial distributions of (ac) peak WF altitudes of MWTS-2 channels 5–7 and (d) tropopause pressures at 06:00 UTC 23 June 2019 (color shaded, unit: hPa) with ERA5 500 hPa geopotential height (contours, interval: 40 gpm). The black solid curves indicate where the differences between peak WF altitude and tropopause pressure are zero, and peak WF altitudes are smaller on the north side of the curve. All WFs are calculated by RTTOV with ERA5 reanalysis as input, and tropopause pressure is calculated with temperature from ERA5 reanalysis. Lambert projection with standard latitudes of 30°N and 60°N is used here, and the black dashed box represents the NCCV domain (35–60°N, 115–145°E).
Remotesensing 14 02530 g004
Figure 5. Spatial distributions of MWTS-2 limb-corrected brightness temperature observations (color shaded, unit: K) of channel 4 from 21 to 29 June 2019 with ERA5 700 hPa geopotential height (contours, interval: 40 gpm) at 06:00 UTC for satellite ascending node and 18:00 UTC for descending node of each day. The time when the satellite scanned the location (50°N, 90°E) is labeled below each figure.
Remotesensing 14 02530 g005
Figure 6. Spatial distributions of MWTS-2 limb-corrected brightness temperature observations (color shaded, unit: K) of channel 6 from 21 to 29 June 2019 with ERA5 250 hPa geopotential height (contours, interval: 80 gpm) at 06:00 UTC for satellite ascending node and 18:00 UTC for descending node of each day. The time when the satellite scanned the location (50°N, 90°E) is labeled below each figure.
Remotesensing 14 02530 g006aRemotesensing 14 02530 g006b
Figure 7. Spatial distributions of potential vorticity (color shaded, unit: K m 2 kg 1 s 1 ) and geopotential height (contours, interval: 80 gpm) at 300 hPa of the ERA5 reanalysis from 21 to 29 June 2019. The black crosses in (a,f) indicate the NCCV centers determined by high PV center at 300 hPa.
Remotesensing 14 02530 g007
Figure 8. Spatial distributions of tropopause pressure (color shaded, unit: hPa) and geopotential height at 500 hPa (contours, interval: 40 gpm) of ERA5 reanalysis from 21 to 29 June 2019. The black crosses in (a,f) indicate the NCCV centers determined by low geopotential height center at 500 hPa. Tropopause pressure is calculated with temperature from ERA5 reanalysis.
Remotesensing 14 02530 g008
Figure 9. West–east cross-sections of ERA5 potential vorticity (shaded, unit: K m 2 kg 1 s 1 ) and MWTS-2 brightness temperature (curves, unit: K) of channel 4 (solid), 5 (dashed), 6 (dash dotted), and 7 (dotted) at 60°N, 53°N, 48°N, and 46°N. Cyan dashed lines show the range of NCCV domain. Note that the Y-axis on the right is reversed.
Remotesensing 14 02530 g009aRemotesensing 14 02530 g009b
Figure 10. West–east cross-sections of (left panels) temperatures and (right panels) temperature anomalies (shaded, unit: K) from ERA5 reanalysis, with black curves indicating (left panels) brightness temperatures and (right panels) brightness temperature anomalies of MWTS-2 channels 4 (solid), 5 (dashed), 6 (dash-dotted), and 7 (dotted) at 48°N and 46°N from 27 to 29 June 2019. The anomalies are calculated with respect to zonal means of each level (or channel) at the given latitude of data from 21 to 29 June 2019. The zonal means of MWTS-2 channels 4, 5, 6, and 7 at latitude 48°N are 255.1, 239.7, 229.8, and 223.2 K, while at 46°N, the means are 255.6, 239.9, 229.7, and 222.6 K.
Remotesensing 14 02530 g010aRemotesensing 14 02530 g010b
Figure 11. Spatial distributions of MWTS-2 channel 7 limb-corrected brightness temperature observations (color shaded, unit: K) at (left panels) case starting time and (right panels) the time of cutoff low center entering the NCCV domain of three cases in July 2019, with geopotential height at 500 hPa of ERA5 reanalysis (contours, interval: 40 gpm). The black crosses indicate the NCCV centers determined by high brightness temperature center of channel 7.
Remotesensing 14 02530 g011aRemotesensing 14 02530 g011b
Figure 12. Tracks of the four NCCV cases in June and July 2019 identified by (a) high-brightness temperature centers of MWTS-2 channel 6 (solid) and channel 7 (dashed), (b) low geopotential height centers at 500 hPa, and (c) high potential vorticity centers at 300 hPa of ERA5 reanalysis. Two consecutive same symbols represent the cutoff low identified twice a day (ascending and descending nodes, 06:00 UTC and 18:00 UTC), and the solid symbols indicate the centers of cutoff lows which just entered the NCCV domain.
Remotesensing 14 02530 g012
Table 1. Channel number, central frequency, noise equivalent differential temperature (NEDT), peak weighting function (WF) altitude, and predictor channels of the MWTS-2 channels 1–13. Beam width of each channel is 2.2°. Peak WF altitudes are based on the results in Figure 1.
ChannelFrequency (GHz)NEDT (K)Peak WF
Altitude (hPa)
Predictor Channels
150.31.2Surface1,2,3
251.760.75Surface1,2,3
352.80.759502,3,4
453.5960.757003,4,5
554.40.754004,5,6
654.940.752505,6
755.50.752007,8,9
8 f 0 = 57.290.751008,9
9 f 0   ± 0.2171.2508,9,10
10 f 0   ± 0.322 ± 0.0481.2259,10,11
11 f 0   ± 0.322 ± 0.0221.71010,11
12 f 0   ± 0.322 ± 0.012.4510,11,12
13 f 0   ± 0.322 ± 0.00453.6212,13
Table 2. Vertical pressure levels of the ERA5 reanalysis hourly data.
Level No.Pressure (hPa)Level No.Pressure (hPa)Level No.Pressure (hPa)
111417527750
221520028775
331622529800
451725030825
571830031850
6101935032875
7202040033900
8302145034925
9502250035950
10702355036975
1110024600371000
1212525650
1315026700
Table 3. The starting and ending times of precipitation relating to four NCCV cases in June and July 2019 and the time of cutoff low center entering the NCCV domain separately determined by MWTS-2 brightness temperature observations of channel 6 and 7, potential vorticity (PV) at 300 hPa, and geopotential height ( Φ ) at 500 hPa from the ERA5 reanalysis. The 06:00 and 18:00 UTC of channels 6 and 7 represent the ascending and descending node of the satellite observations, respectively.
Precipitation Starting Time00:00 UTC 29 June00:00 UTC 7 July00:00 UTC 12 July00:00 UTC 29 July
Precipitation ending time00:00 UTC 30 June00:00 UTC 8 July00:00 UTC 13 July00:00 UTC 30 July
Channel 606:00 UTC 2906:00 UTC 606:00 UTC 1406:00 UTC 29
Channel 718:00 UTC 2806:00 UTC 606:00 UTC 1406:00 UTC 29
300 hPa PV06:00 UTC 2906:00 UTC 606:00 UTC 1406:00 UTC 29
500 hPa Φ 18:00 UTC 2806:00 UTC 518:00 UTC 1306:00 UTC 29
Publisher’s Note: MDPI stays neutral with regard to jurisdictional claims in published maps and institutional affiliations.