Article

UAV-Based Multitemporal Remote Sensing Surveys of Volcano Unstable Flanks: A Case Study from Stromboli

1
Earth Sciences Department, University of Florence, 50121 Firenze, Italy
2
Civil Protection Centre, University of Florence, 50125 Firenze, Italy
3
National Institute of Oceanography and Applied Geophysics—OGS, 34010 Trieste, Italy
*
Author to whom correspondence should be addressed.
Remote Sens. 2022, 14(10), 2489; https://doi.org/10.3390/rs14102489
Submission received: 13 April 2022 / Revised: 16 May 2022 / Accepted: 17 May 2022 / Published: 23 May 2022

Abstract

:
UAV-based photogrammetry is becoming increasingly popular even in application fields that, until recently, were deemed unsuitable for this technique. Depending on the characteristics of the investigated scenario, the generation of three-dimensional (3D) topographic models may in fact be affected by significant inaccuracies unless site-specific adaptations are implemented into the data collection and processing routines. In this paper, an ad hoc procedure to exploit high-resolution aerial photogrammetry for the multitemporal analysis of the unstable Sciara del Fuoco (SdF) slope at Stromboli Island (Italy) is presented. Use of the technique is inherently problematic because of the homogeneous aspect of the gray ash slope, which prevents a straightforward identification of match points in continuous frames. Moreover, due to site accessibility restrictions enforced by local authorities after the volcanic paroxysm in July 2019, Ground Control Points (GCPs) cannot be positioned to constrain georeferencing. Therefore, all 3D point clouds were georeferenced using GCPs acquired in a 2019 (pre-paroxysm) survey, together with stable Virtual Ground Control Points (VGCPs) belonging to a LiDAR survey carried out in 2012. Alignment refinement was then performed by means of an iterative algorithm based on the closest points. The procedure succeeded in correctly georeferencing six high-resolution point clouds acquired from April 2017 to July 2021, whose time-focused analysis made it possible to track several geomorphological structures associated with the continued volcanic activity. The procedure can be further extended to smaller-scale analyses such as the estimation of locally eroded/accumulated volumes and pave the way for rapid UAV-based georeferenced surveys in emergency conditions at the SdF.

1. Introduction

UAV-based photogrammetry is a cost-effective technique that allows for the acquisition of three-dimensional topographic models with centimetric accuracy. When performance capabilities are optimized, the outcomes are comparable to those derived from more expensive techniques that involve more elaborate survey campaigns such as Aerial Laser Scanning (ALS) or Terrestrial Laser Scanning (TLS) [1,2]. The possibility to rapidly acquire high-resolution photograms at different angles and carry different types of cameras and sensors makes the technique well suited to large, remote, and/or markedly rough terrains. Such quality may be highly instrumental in enhancing the assessment and management of natural hazards, especially if affected areas are inaccessible for in situ investigations [3].
As a result, it has proven to be an effective and flexible tool for topographic surveying and monitoring of landslides [4,5,6,7], rapidly documenting the damage resulting from earthquakes [8,9,10,11], or evaluating volcanic activity and landform interpretation in active volcanoes [12,13,14,15,16,17]. Just to cite a few examples from the latter subject, Turner et al., 2017 [18] demonstrated how UAV-based photogrammetry to generate Digital Elevation Models (DEMs) may provide the basis for estimating future flow path behavior and capturing topographic changes caused by pāhoehoe flow inflation. Rokhmana et al., 2016 [19] exploited UAV-based optical products such as DEMs and orthophotos for change-detection analysis and three-dimensional (3D) volumetric quantification of newly ejected volcanic products, highlighting how the technique may prove essential for acquiring data in the immediate aftermath of catastrophic eruptive activity. Darmawan et al., 2018 [20] mapped the morphology and structure of an active lava dome, which supported the identification of a fracture encircling an unstable dome sector and the consequent estimation of slope factors of safety.
In this context, UAVs have a strategic advantage in the sense that they are operated remotely, which greatly simplifies the data collection procedure. At the same time, operators can keep themselves at a reasonable distance from the hazardous area [21]. These advantages become even more crucial when UAV flights have to be repeated frequently to track the evolution of dynamic processes [22,23,24,25].
However, there is also an inherent risk of instrumentation losses; even though drones can usually make an emergency landing in the event of a breakdown (hence preserving the vehicle and measuring instruments), this is of no practical benefit if it occurs in an inaccessible area. Since the photogrammetric technique is commonly associated with relatively low costs, potential economic impacts are nonetheless minimized.
The positioning of Ground Control Points (GCPs), whose coordinates are to be recorded by means of a Global Navigation Satellite System (GNSS) device with centimetric to subcentimetric accuracy, is highly important to correct possible distortions and refine georeferencing [25]. Control points can either be permanent ground features or artificial targets distributed over the site of interest before the flight and clearly visible on raw images. The required density of GCPs varies according to the cameras used, from the calibration of the lenses to the image aerial georeferencing precision. Recently, several studies focused on the minimum number and optimal distribution in photogrammetric surveying [26,27,28,29].
In some cases, placing artificial GCPs on the ground can be logistically problematic or even impossible depending on the terrain morphology. Moreover, this activity increases the time that operators are exposed to local risks. Alternatively, other correction techniques such as Real-Time Kinematic (RTK) and Post-Processing Kinematic (PPK) have been developed to provide highly accurate georeferenced products [30,31,32], but systematic elevation errors still remain significant [25]. Štroner et al., 2021 [33] were among the first to deal with the issue by showing that elevation errors can be reduced by combining two flights with different image acquisition axes. However, doubling the number of flights is time consuming and may not be viable in hazardous areas.
This study describes an ad-hoc methodology that was developed for multitemporal analysis of UAV-based photogrammetric products acquired in a completely inaccessible and highly hazardous area, namely the northwestern unstable flank of Stromboli volcano (also known as the ‘Sciara del Fuoco’ (SdF) depression).
The SdF is a depression located on the northwest flank of Stromboli Island, the emerging portion of a ~3000 m high stratovolcano located in southern Italy (Figure 1). It is filled with volcaniclastic deposits and lavas that are emitted from a summit crater terrace located at ≈750 m a.g.l. More in detail, the slope is a subaerial–submarine collapse scar [34], whose subaerial part has a gradient between 30° and 40° and is continuously affected by active instability in the form of gravel flows and rockfalls [35,36,37]. The area is an exceptional test site for stressing both instrumentations and methods and at the same time providing scientific data useful for monitoring the gravitational phenomena of the Stromboli slope and related impacts.
The main hazard associated with large-scale landslides at Stromboli is their ability to generate tsunamis, whose effects can propagate far away from the source areas [38,39,40]. The last relevant tsunami at Stromboli occurred in December 2002 as a result of the collapse of a large portion of the SdF during the 2002–2003 eruption. The waves caused significant damage to the east coast of the island up to an altitude of about 10 m above sea level, to the near island of Panarea, and were largely detected along the Southern Tyrrhenian Sea coasts [41].
Figure 1. Sciara del Fuoco, Stromboli Island (image from Google Earth). Numbered dots refer to the take-off points. Locations of main craters (NEC: North East Crater; CC: Central Crater; SWC: South West Crater) are reported. On the left, the lithological map of the Sciara del Fuoco (modified after [42,43]).
Remotesensing 14 02489 g001
The photogrammetric survey campaigns carried out in situ–generated 3D point clouds, orthorectified aerial photo mosaics, and high-resolution Digital Terrain Models (DTMs). These products allow for the evaluation of the morphological evolution of the investigated area by comparing subsequent surveys over time and acting as a support for the analysis of data from a GB-InSAR system installed in the area.

2. Materials and Methods

Six UAV surveys have been carried out from October 2016 to June 2019 to model the Sciara del Fuoco landslide, using traditional GCPs. However, due to the great difficulties in acquiring centimeter-level GNSS measurements in the area caused by some technical and logistical aspects, it was necessary to reprocess the whole dataset following a new workflow that does not include the use of GCPs (Figure 2). Due to the restriction of accessibility after the 3 July 2019, eruption, the applied methodology is now the only methodology usable in the area to generate high-resolution georeferenced DEMs. In July 2021, a new survey was carried out to test the reliability of the developed workflow, which can be applied to any other inaccessible survey area.
Additionally, the homogenous surface of the slope, characterized by uniform volcanic ash, encumbers the automated detection of matching points, which are required for generating accurate 3D point clouds from the Structure-from-Motion (SfM) technique. All of these aspects contribute to the consideration of the Sciara del Fuoco landslide as a challenge for the use of UAV-based photogrammetry without GCPs.
Surveys have been carried out with the drone Saturn, entirely designed, developed, and patented by the Department of Earth Sciences of the University of Florence [24]. Continuous experimentation and technical improvements allow for the adaptation of the drone to different scenarios, thus extending the applicability of the photogrammetric technique.
The modeled area of the subaerial portion of the Sciara del Fuoco has a total extension of about 2 km2 (except for the first survey, which covered a reduced area of about 1 km2). Seven aerial photogrammetric surveys were carried out in the area between October 2016 and July 2021.
Focusing on the first 6 surveys, over the years, the applied technique has been perfected, significantly reducing execution times and increasing the quality of the final products (Table 1). Among the improvements made:
  • The number of planned flights has gone from a minimum of 4 to a maximum of 7 flights to cover the entire area of interest. These were performed by acquiring strips parallel to the slope, at a variable height, and with nadiral grip geometry. The increase in flights has made it possible to raise the number of frames and, therefore, the accuracy of the products.
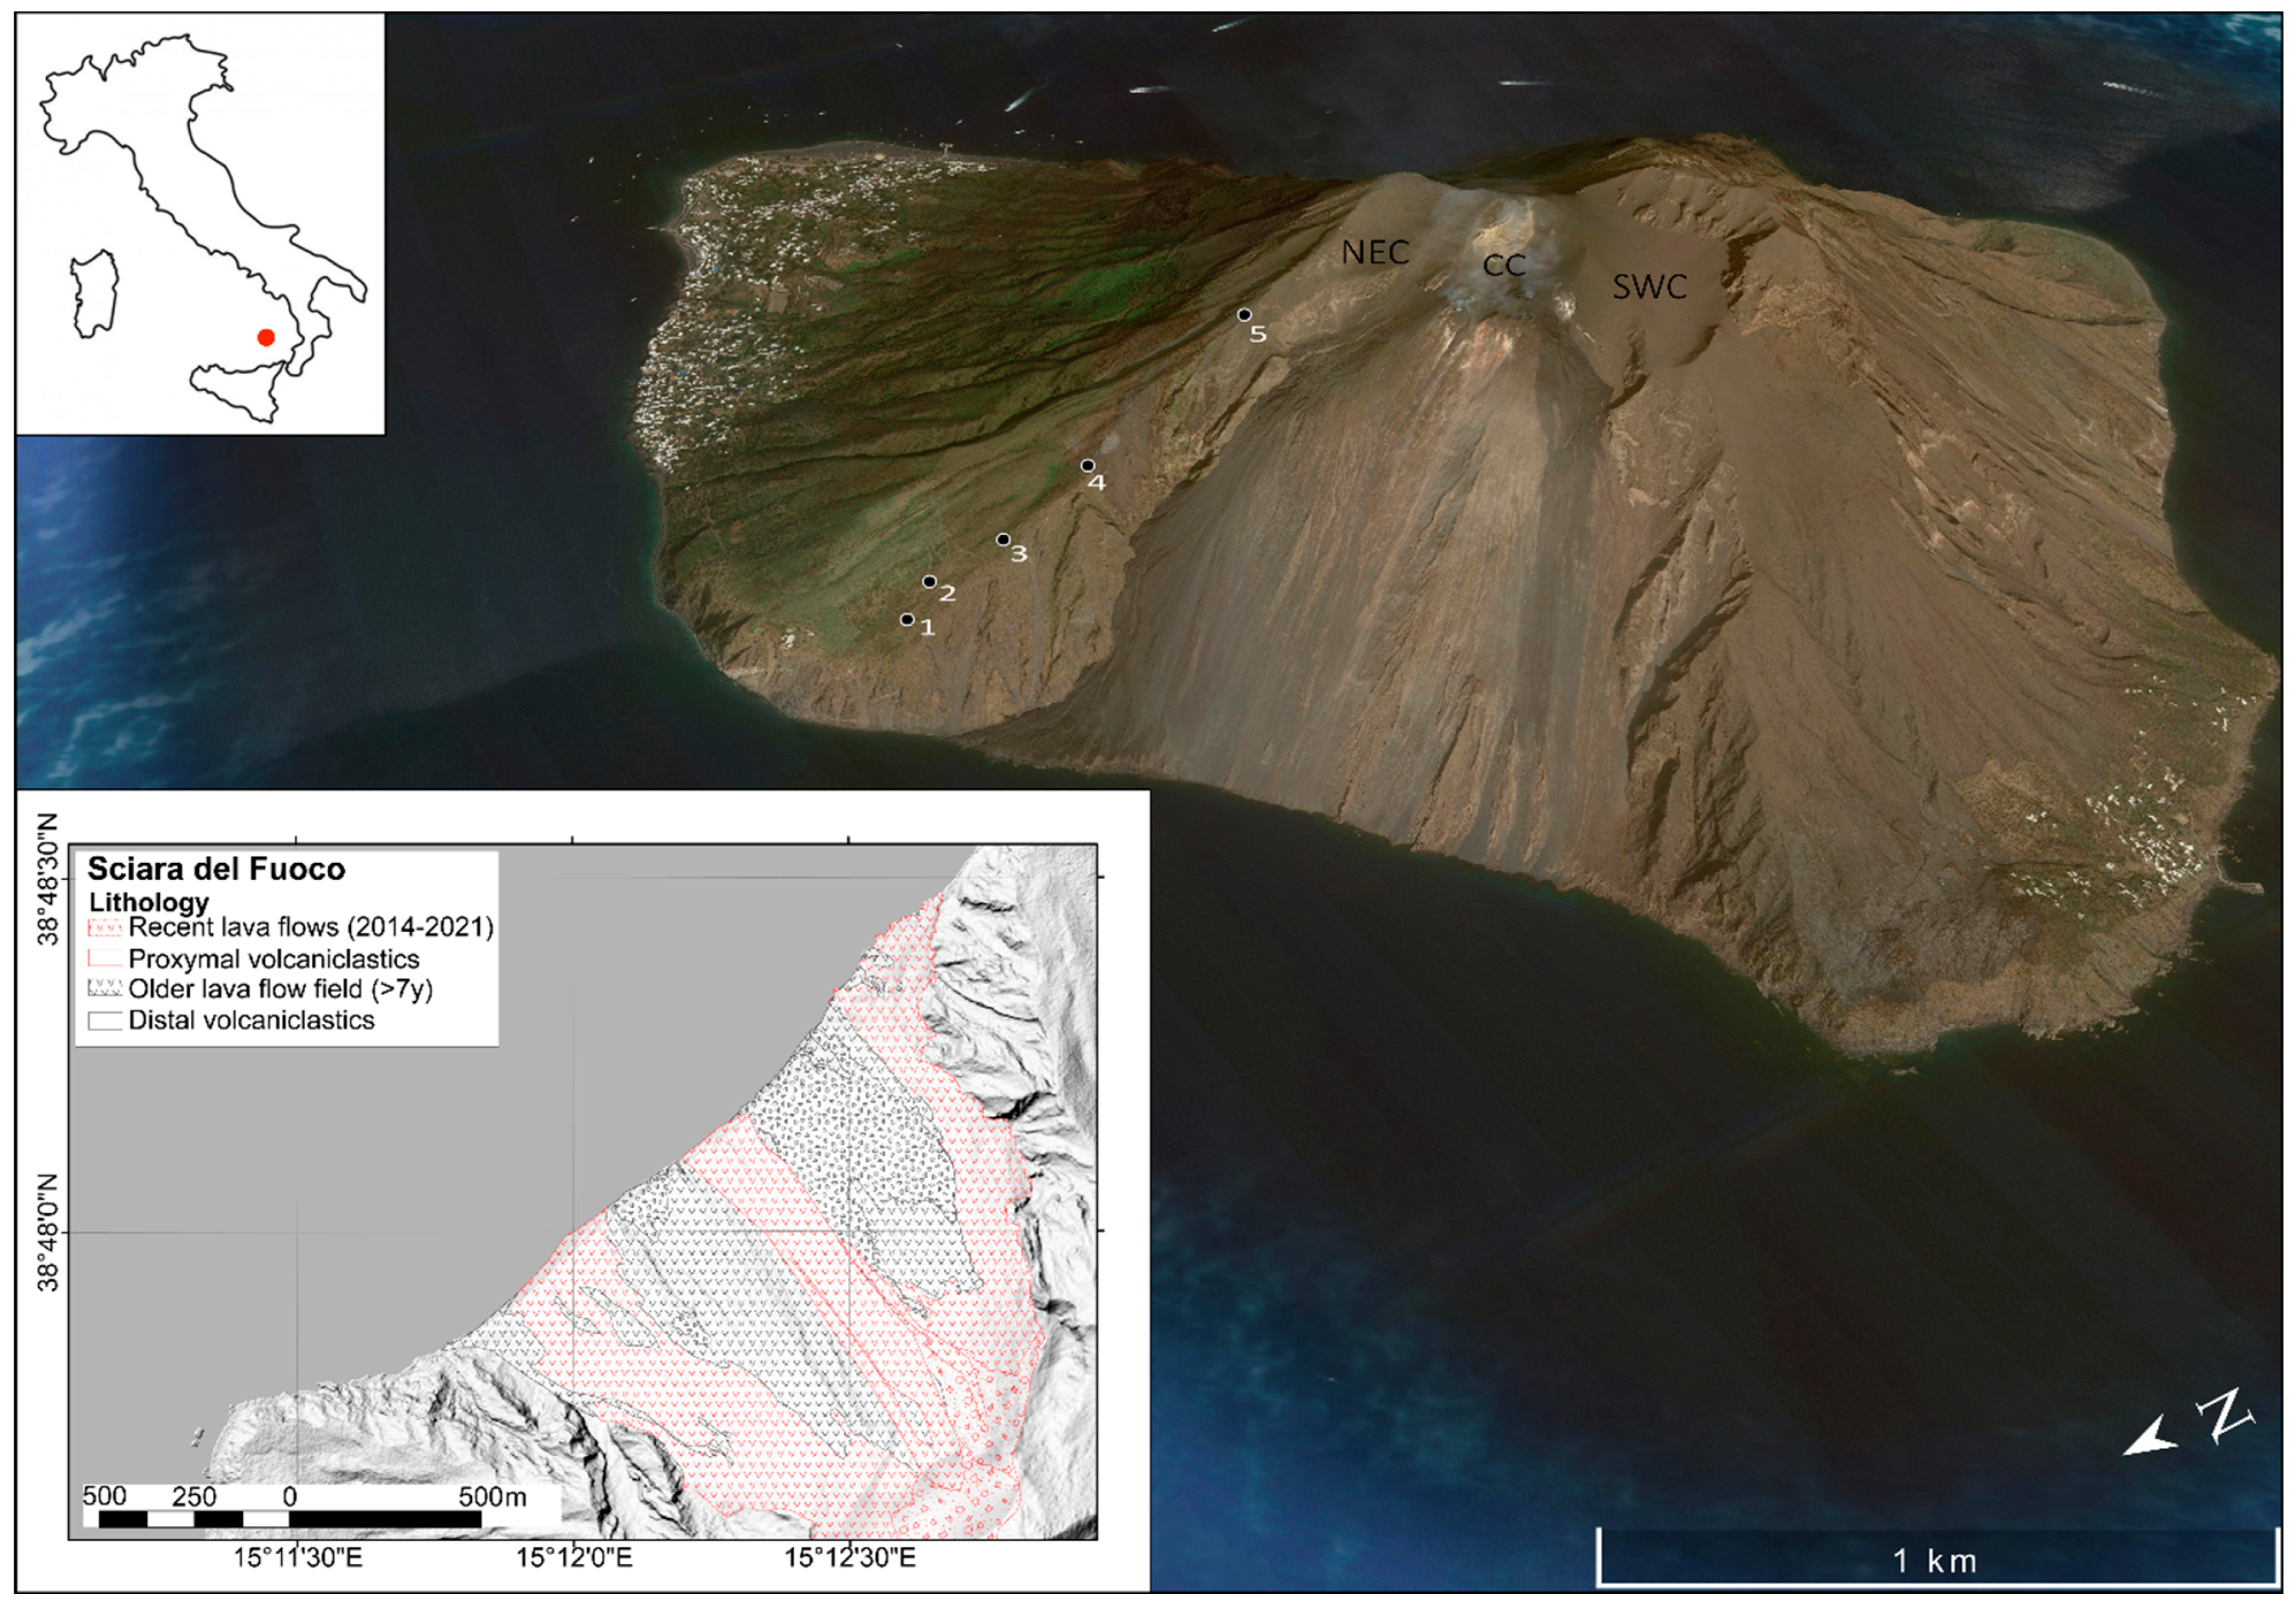
  • The 5 take-off points used in the first reliefs placed at an increasing altitude on the NE side of the Sciara del Fuoco have been replaced by a unique starting point located at an altitude of 190 m above sea level (take-off number 1 in Figure 1). The single take-off point considerably reduced acquisition times and the risk exposure of operators.
  • GNSS systems campaigns on the ground with RTK correction, aimed at measuring the coordinates of control points (Ground Control Points (GCPs)), were carried out during each drone survey. GCPs were materialized on the ground with specific targets recognizable on aerial photos and necessary for the georeferencing of three-dimensional models. The shape, color, and material of the targets were modified during the surveys to understand which was the most recognizable from the frames and therefore returned better accuracy and precision. Among those used previously, the targets used in December 2018 and June 2019 of square shape (20 × 20 cm), orange color, and with a black central circle with a diameter of 5 cm were the most appropriate.
Additionally, thanks to the experience gained, the positioning of the marker was optimized over time, considering only highly visible and good satellite coverage locations.
Three EMILD REACH GNSS antennas were used for the acquisition of GCPs during the surveys named Stromboli 5–6 in Table 1, instead of a Leica GPS equipment used for those called Stromboli 2–3–4. Over the years, these three aspects (shape and position of GCPs and GNSS quality) have led to a decrease in the average georeferencing error of products. Regularly and before each campaign, the GNSS antenna was tested on a referenced calibration point, and the error respected the specifications.
Images were analyzed and processed using a Structure-from-Motion (SfM) software to obtain three-dimensional representations of the investigated surfaces in point cloud format, Digital Terrain Models (DTMs), and high-definition orthophotos. The technique takes advantage of the fundamental concepts of classical analogic photogrammetry to combine digital images appropriately acquired using matching and triangulation algorithms. These algorithms allow for the identification of homologous points visible on multiple images, and to define their exact position in three-dimensional space. Processing was performed with Agisoft Metashape Professional software [44].
Comparing the generated point clouds, some critical issues emerged in the central area, that is, the core of the Sciara del Fuoco covered by volcanic ash and continuously rolling surface material. It was noted that the area was affected by convexity, characterized by a distortion in the central portion and a consequent fictitious distance that made impossible any reasonable comparison between different models (Figure 2A). The offset was not constant (therefore not removable manually) and in the order of a few tens of meters. The cause is due to both intrinsic limitations of the technique and to logistical problems. Firstly, the area under examination was reconstructed starting from extremely homogeneous frames both in shape and in color, representative of part of the slope of the volcano covered mainly by monochromatic and one-dimensional ash. This makes it difficult to identify match points or points that are clearly distinguishable by shape and color and therefore identifiable in multiple frames, which, in the technique used, are the essential keys for the reconstruction of the three-dimensional model.
In addition, the total absence of GCPs in the central area of the survey meant that the georeferencing in that area was a secondary one, i.e., consequent to the GNSS measurements carried out along the sides of the relief in aid of the metric georeferencing of the drone’s GNSS antenna. This area is in fact unreachable, and for this reason, during all surveys, markers were positioned along the trails that run along the Sciara del Fuoco to the east and west. The combination of these two factors generated the distortions found in the central part of the models.
Given the impossibility of solving the problem related to the Structure-from-Motion technique, to remedy the lack of GCPs in the area, an aerial LiDAR survey carried out in 2012 was used. In detail, 15 stable and known points were exported from the LiDAR survey and imported into each survey as GCPs (Lidar Ground Control Points (LGCPs), Figure 3). These were chosen thanks to a careful morphological analysis in the high-definition orthophotos aimed at identifying clearly recognizable morphological features that have not undergone any change from the execution of the Airborne Laser Scanning (ALS) survey since June 2019, the date of acquisition of the Stromboli 6 dataset.
The point clouds of the UAV survey of Stromboli 1 to Stromboli 6 were then reworked by anchoring them to the aforementioned LGCPs points, so as to impose the georeferencing of the area not covered by the markers and subject to distortions (Figure 2B(I)).
Although the addition of the markers obtained from the ALS survey solved the convexity in the central portion of the Sciara del Fuoco in all the models, these remained affected by other problems, compromising the multitemporal analysis. In the distal areas of the Sciara del Fuoco, or those covered by GCPs and which should have been perfectly aligned between the whole dataset, some horizontal translations of the order of the meter were still present. In addition, misalignments of entire strips of contiguous frames or limited portions were identified in most of the surveys.
Some discrepancies and errors were probably introduced over the years by the GNSS instrumentation used in the first measurement campaigns. Having verified some recognizable structures with the new GNSS instrumentation and having improved the visibility and positioning of the markers in the last measurement campaigns, it was decided to georeference all the surveys using the GCPs of the Stromboli 6 dataset.
The reliability of the DSM generated with the Stromboli 6 survey (June 2019) was verified by comparing it with the model obtained on the same day using high-resolution satellite images taken from the PLEIADES-1 constellation (Figure 4). The difference in evaluation between the two shows in fact excellent correspondence within the measurement error.
Thanks to the very high-resolution orthophotos (from 10 to 7 cm/pixel), taken periodically, it was possible to verify and recognize 23 known points in the different datasets and georeference them with respect to the last acquisition campaign (Stromboli 6); these points were called virtual markers (VGCPs, Figure 2B(II) and Figure 3).
All the point clouds were then reworked using Agisoft Metashape Professional 1.7 software using both VGCPs and the 15 known LGCPs obtained from the 2012 airborne LiDAR survey.
As a further precaution adopted in the re-elaboration phase, the image alignment optimization procedure was not adopted. The optimization algorithm recalculates the position and inclination of the camera once the point cloud is corrected in the function of the GCPs’ position, allowing for a reduction in the average georeferencing error. In the particular case of the Sciara del Fuoco; however, it was observed that the optimization process causes misalignments of groups of images, as well as the formation of secondary alignment planes of point clouds in some sectors, worsening the accuracy of the final result. The optimization assumes that the position measurements on the ground are less affected by errors than those in flight; altitude variations, together with vibrations and delays in image shooting or simply GNSS measurement errors, can cause georeferencing errors of the image (height and angles of grip), so as to cause errors of alignment and accuracy of georeferencing on the ground. If there is good coverage of GCPs or a complex and well-defined structure is visible on the ground, the algorithm allows effectively correcting the position data of the images; otherwise, it can cause distortions and errors. In the case of the SdF, the presence of large, dark, homogeneous, and sandy areas, together with the impossibility of positioning GCPs, has led to the deduction that the position data recorded in flight by the drone are more reliable than those algorithmically derivable from the ground.
Given the nature of the surveys aimed at a multitemporal analysis, it was therefore decided not to use algorithms for optimizing the position of the images in order to reduce artifacts and distortions, although it increased the estimated error on the GCPs.
Table 2 shows the main characteristics of the surveys after their reprocessing; the average error is in most cases significantly higher than it was after the first elaboration (Table 1). The increase in the error on the GCPs, however, allows the comparison of multitemporal data with greater reliability within the measurement errors detected.
It was possible to apply the optimization only in the case of Stromboli 4. The model had various misalignments mainly due to a significant change in the illumination of the slope due to weather conditions. Processing the entire dataset of images minimizes errors in georeferencing accuracy. In this case, however, a better result was obtained by dividing the entire dataset into two parts: the first including the first 3 flights starting from the coast and the second including those upwards, grouping frames with homogeneous lighting. Therefore, a clear line dividing the two parts is visible. Although the survey is not continuous, two sections were obtained that are comparable with the data obtained in the other measurement campaigns. Probably due to the smaller areal extension processed, in this case, the optimization tool worked successfully, minimizing the error without generating distortion and artifacts. This particularity is subject to analysis and verification and will be clarified in the continuation of the research activities.
To further improve the results and eliminate rotation and translation errors of the model axes, point clouds were finally realigned using the Fine Registration tool, Iterative Closest Point (ICP), available on CloudCompare 2.11 software (Figure 2C) [45]. The tool improves the georeferencing accuracy of a point cloud by aligning it to a reference point cloud based on the search of pairs of nearest points in two adjacent scans.
The state of emergency declared after the eruption on 3 July 2019, made it impossible to continue making UAV surveys at regular intervals. For this reason, the first available data after Stromboli 6 were obtained in July 2021 (hence Stromboli 7, whose specifications are listed in Table 3).
On this occasion, the described procedure was tested. The aerial photogrammetric survey was carried out without positioning any Ground Control Points (GCPs). After processing the images, the model was then georeferenced only using GCPs from Stromboli 6 and from the 2012 ALS LiDAR survey (VGCPs and LGCPs in Figure 3) and successively realigned by means of the ICP alignment tool, precisely following the explained method. The result is a georeferenced high-definition 3D point cloud, as shown in Figure 5.

3. Results

3.1. April 2017 to June 2019 DEMs Comparison

The point clouds resulting from the elaboration of the images belonging to the first six surveys were used to generate DSMs to calculate new difference maps with the ArcGIS Desktop software (v. 10.7.1) (Figure 6) [46]. Due to its partial coverage of the SdF area and the lack of GCPs for correct georeferencing, the comparison with the first survey, Stromboli 1, was not taken into account. The errors due to the rotations between the models have been corrected, pointing out an optimal result. The change detection analysis allows therefore to identify and map numerous areas characterized by accumulation and/or erosion of volcanic materials. Since stable areas, such as the trails running along the SdF, are characterized by values of less than ± 1 m, all the areas with difference values less than 1 m have been considered as not affected by any geomorphic variation. This is not in any case feasible for the comparison with the Stromboli 2 survey where, for the problems pointed out in the previous section, the realignment is affected by a significant error. It is, however, possible to relatively identify the areas affected by meaningful geomorphic changes.
Starting from the difference between the last two flights, Stromboli 6 and Stromboli 5 (June 2019–December 2018) in Figure 6a, and moving backward, it is possible to identify an erosion area, between −1 and −2 m deep, in the middle of the shoreline. This area became bigger and moved up to the slope in the difference between Stromboli 6 and Stromboli 4 (June 2019–May 2018) in Figure 6b, reaching the border of the volcano crater. In this case, the difference between the two DEMs along the shoreline surfaces is up to −10 m. Similar differences in distribution can be found in Figure 6c, where Stromboli 6 and Stromboli 3 (June 2019–November 2017) are compared. Here, the area suffering from erosion (negative differences) is wider, but it is side by side with an area in blue tones on the southwestern side of the shoreline, with positive differences up to 10 m (within the red box in Figure 6c). However, through a visual examination of the two orthophotos, we can easily avoid the mistake of interpreting this area as one caused by a thick deposition. The square shape of the blue area identifies indeed a misalignment error caused by an excessive difference in illumination due to the different positions of the sun between the two surveys (carried out in summer and in winter, respectively).

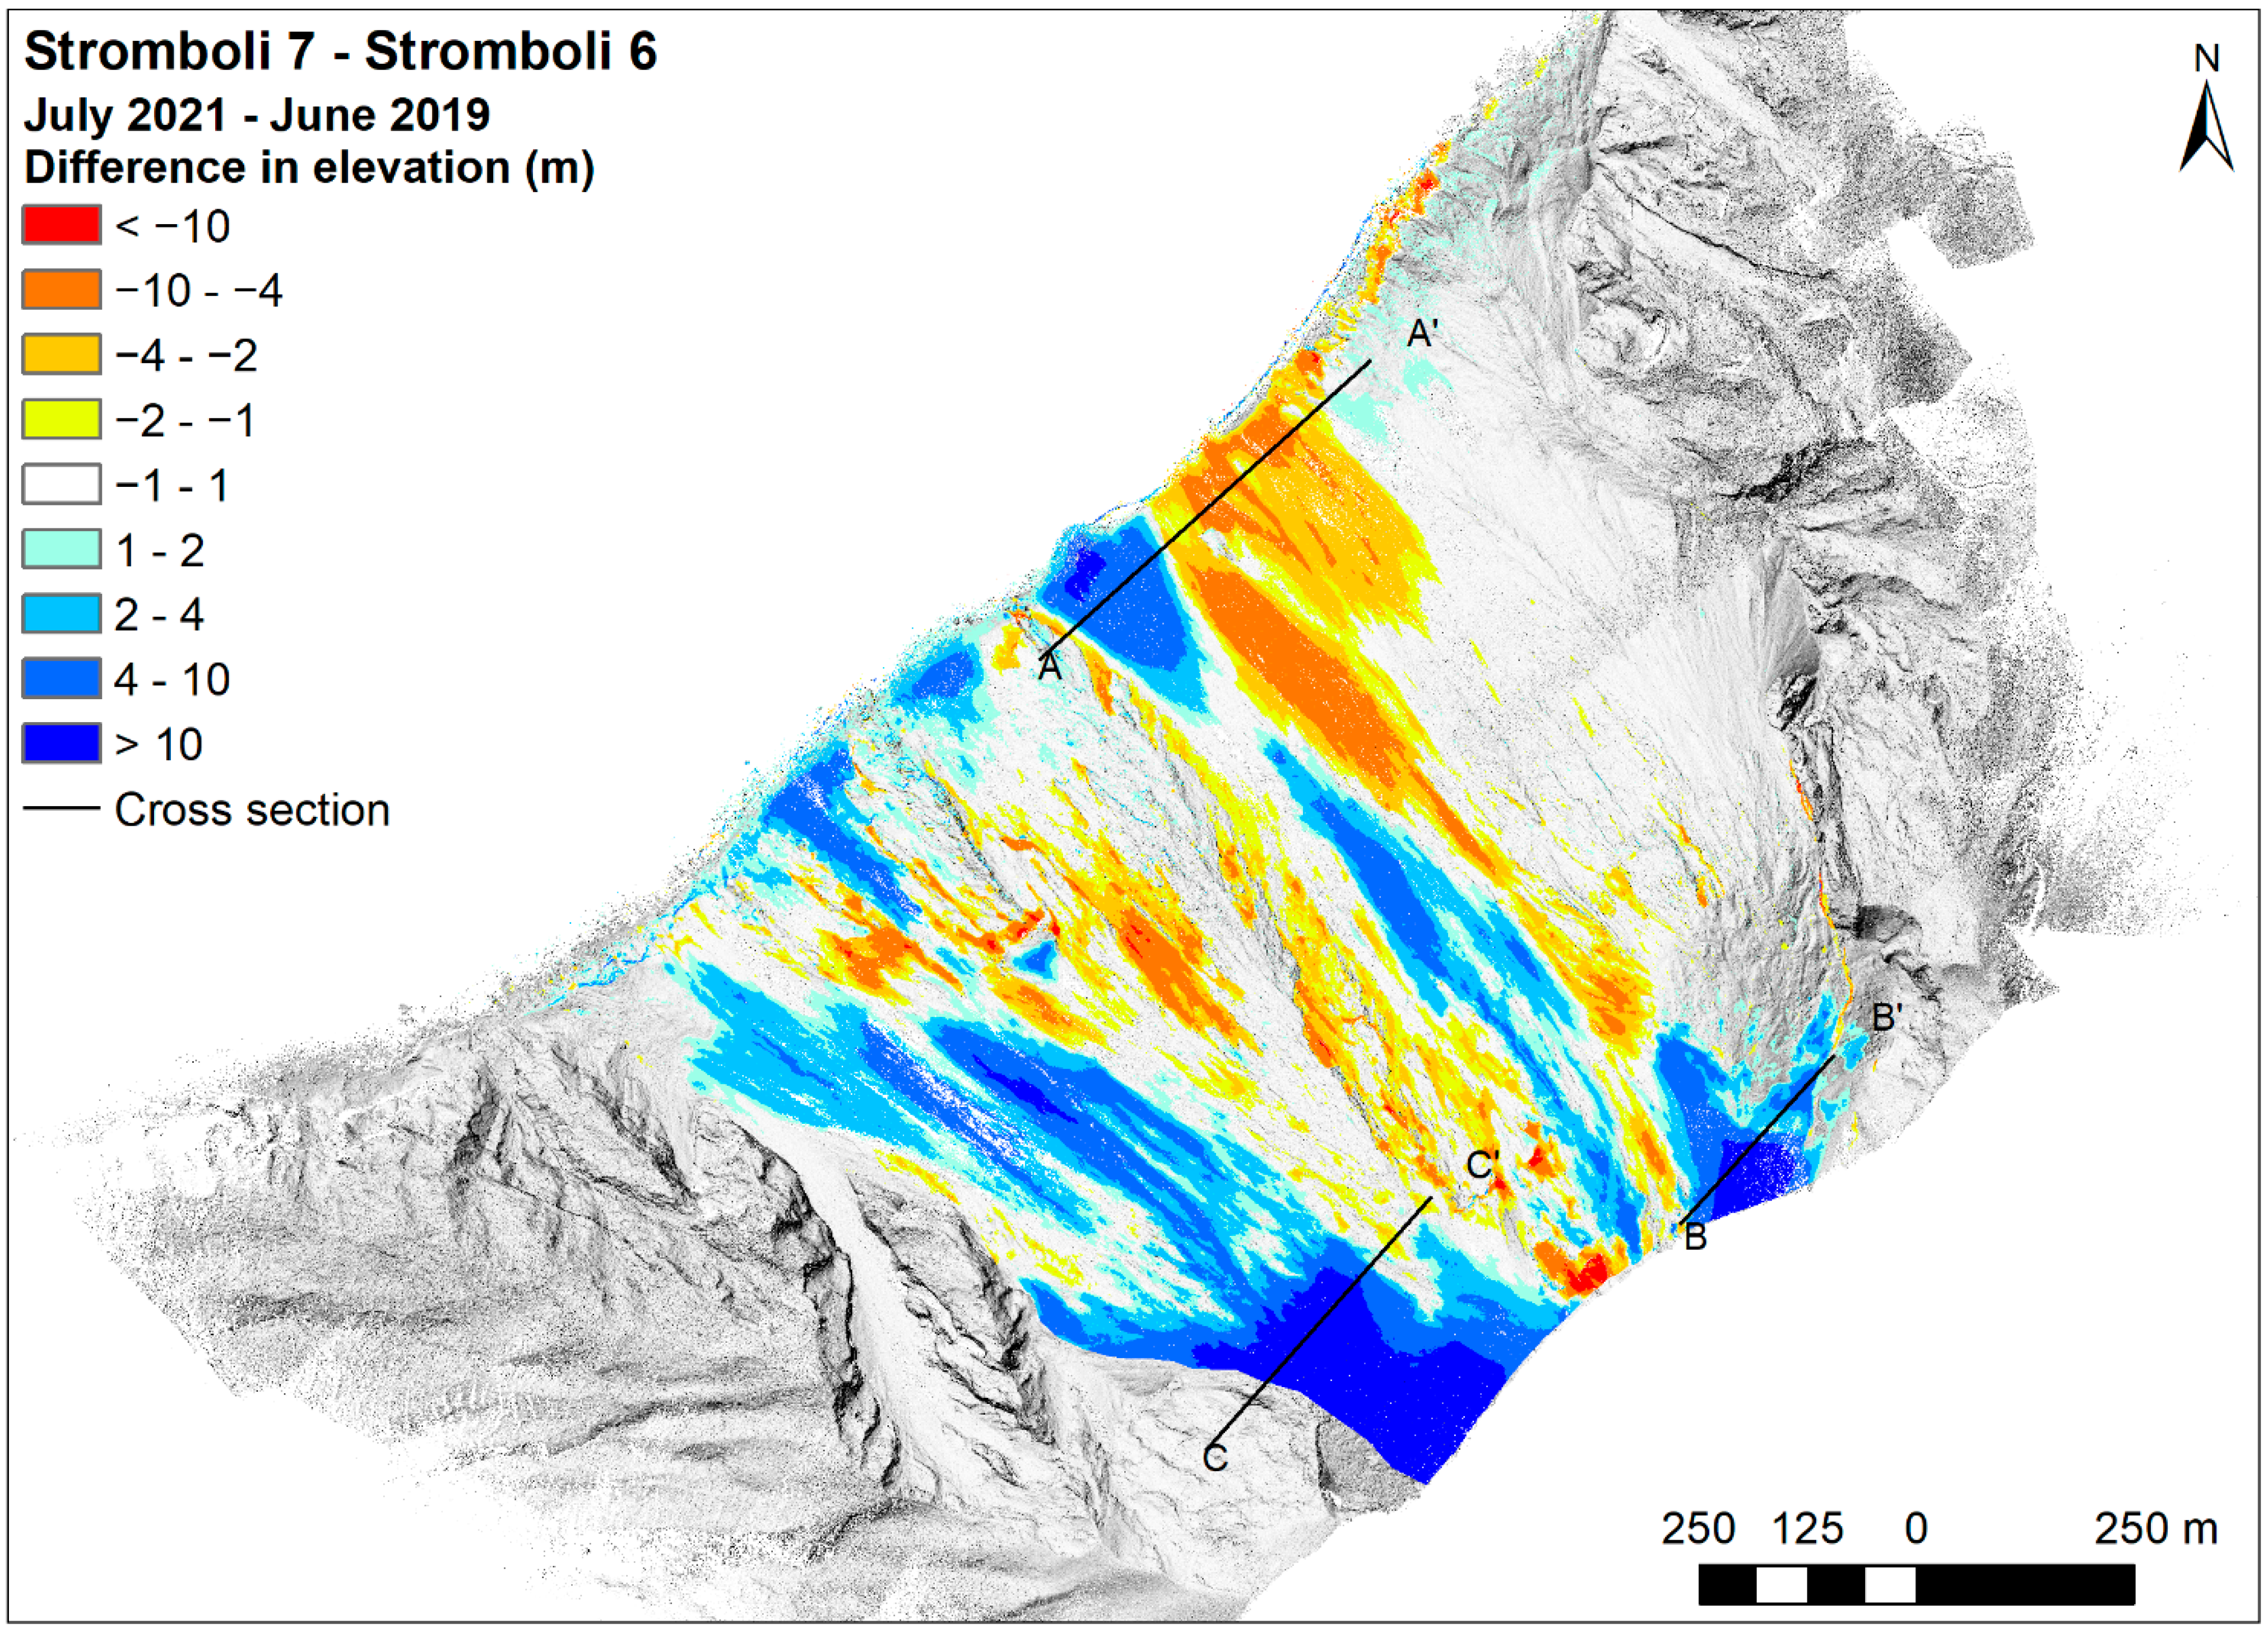
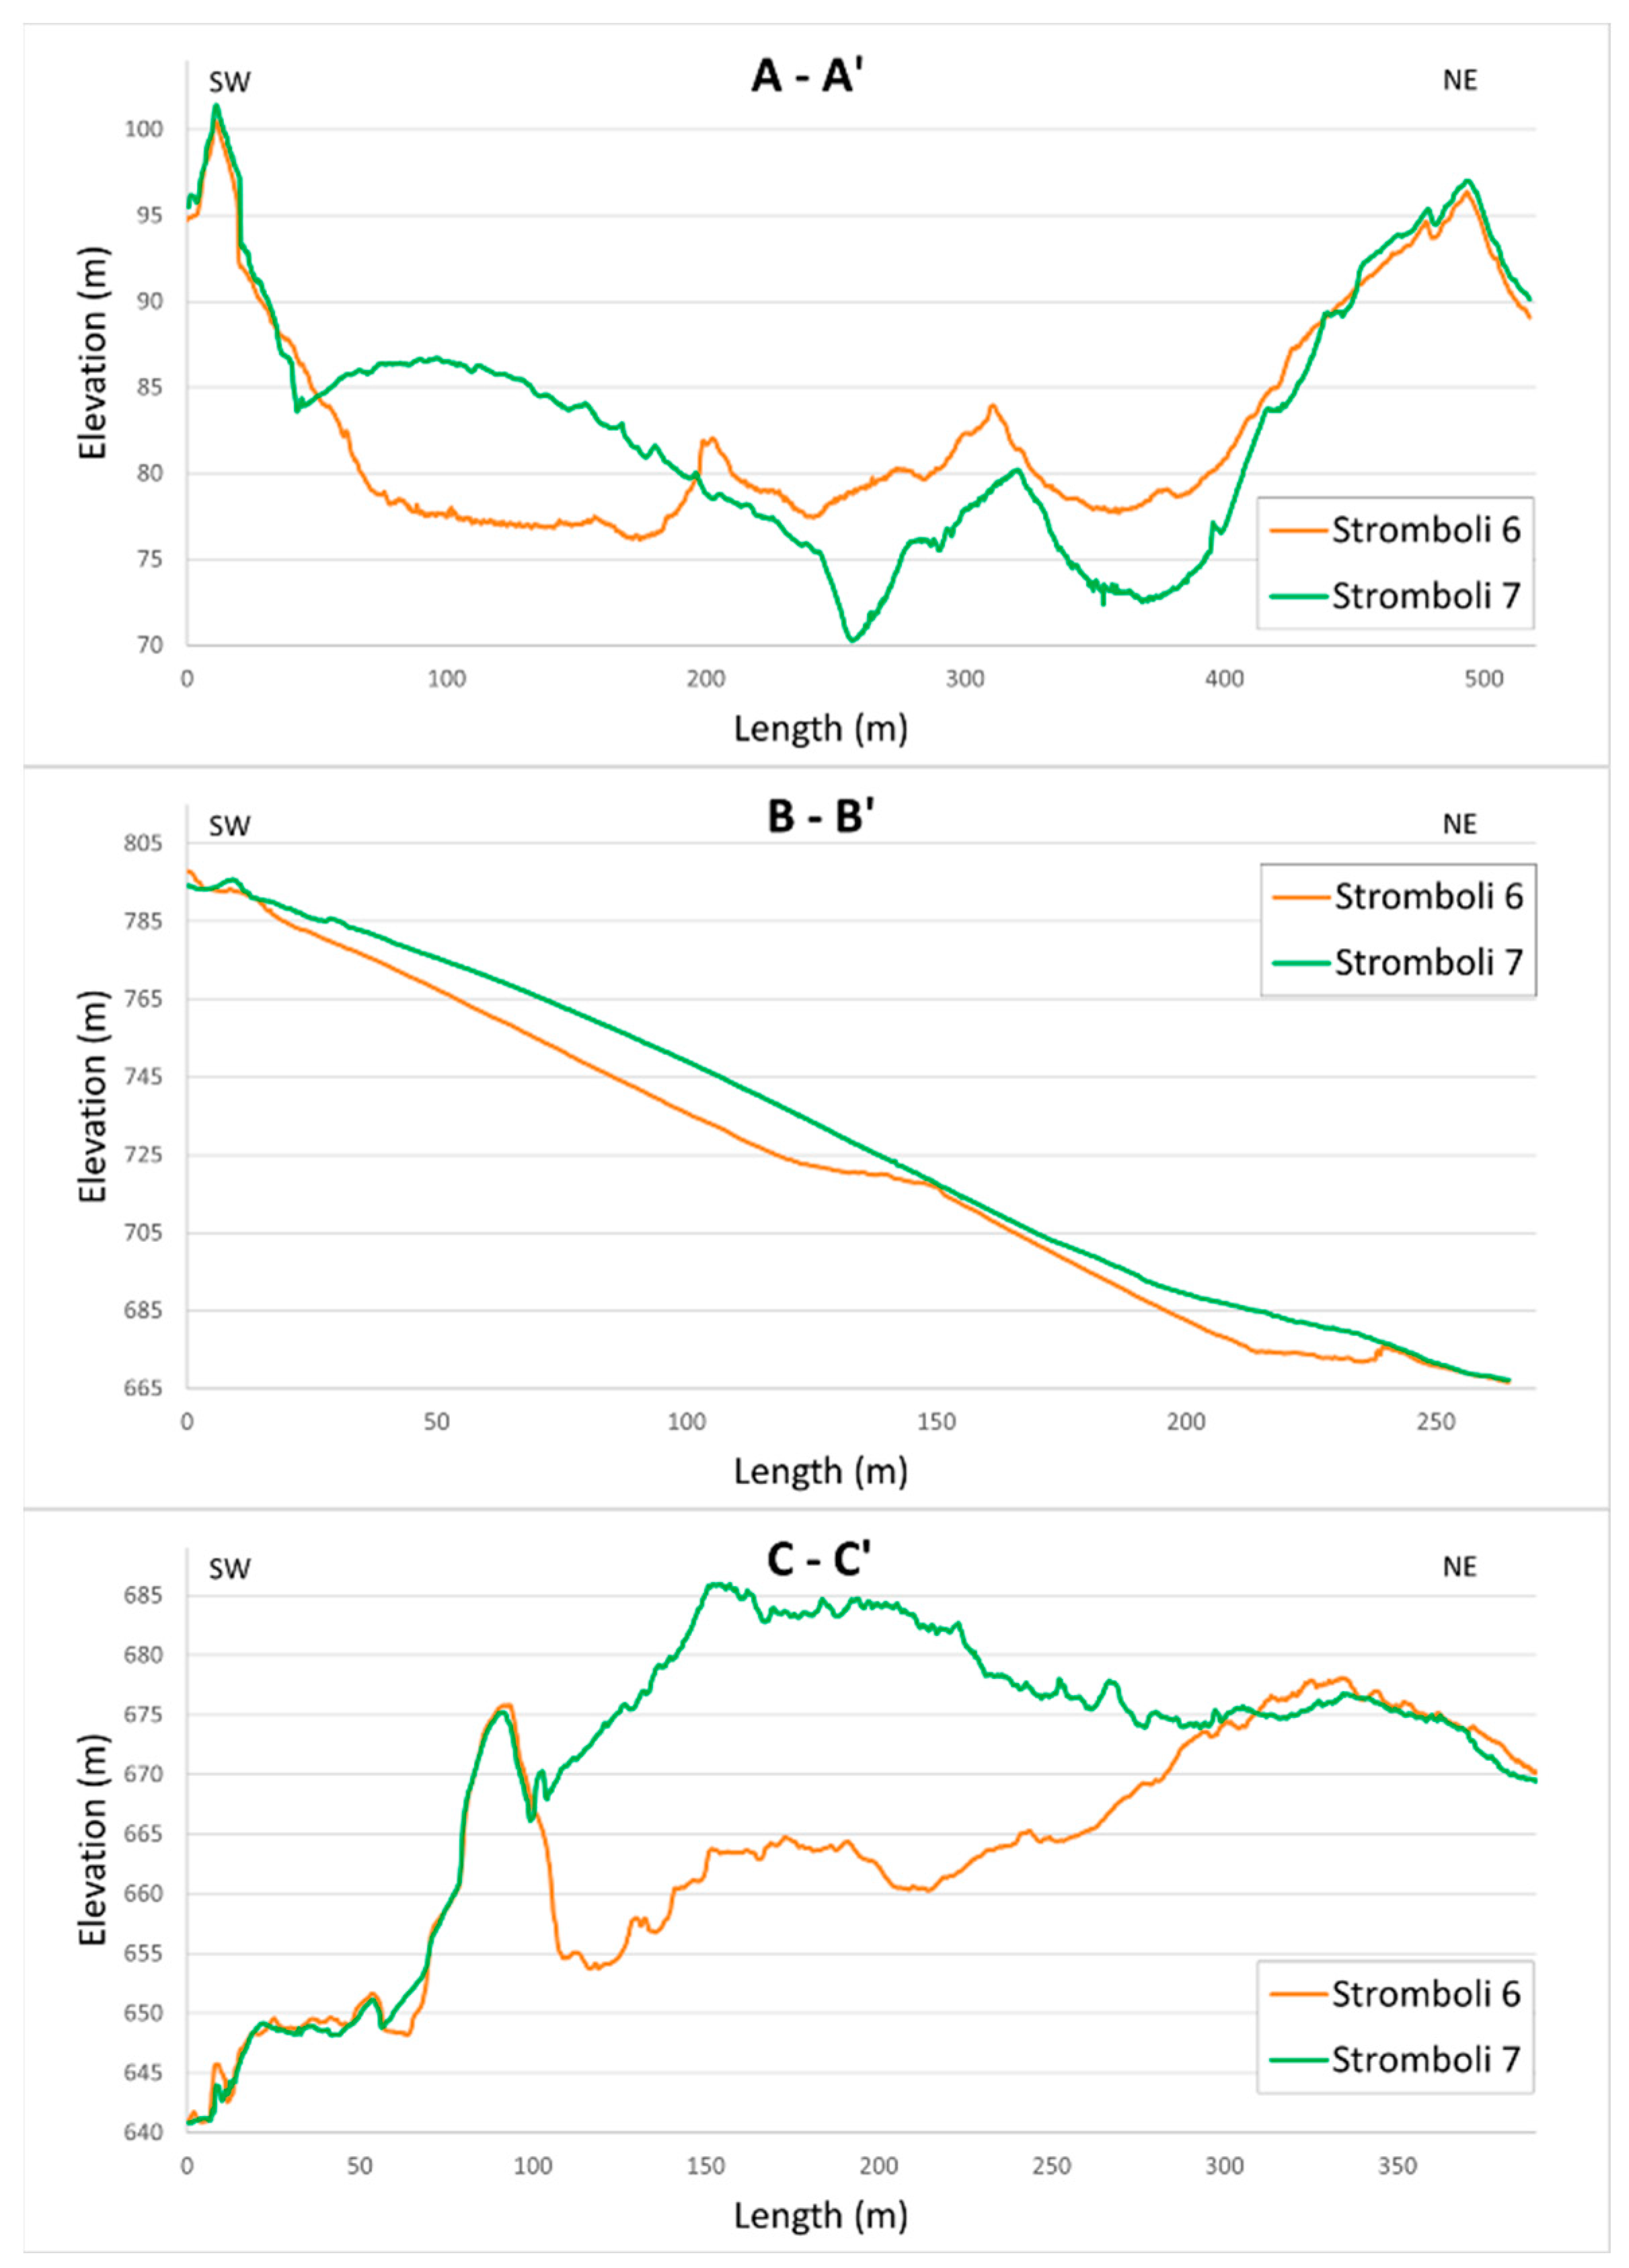
3.2. Application on July 2021 DEM

The potential of the presented methodology is evident looking at the difference between the Stromboli 7 and Stromboli 6 models (Figure 7 and Figure 8). The two DSMs are correctly aligned, and the analysis points out significant changes in the morphology, due to erosion processes, gravitational phenomena, lava overflows, and mostly the paroxysm that occurred on 3 July 2019.
Looking at the lowest sector of the SdF in Figure 8, in proximity to the A-A’ cross-section, the main morphological changes are related to coastal erosion phenomena rather than deposit due to lava overflows shown in the figure as orange and blue areas, respectively. Similarly, the portion crossed by section B-B’ includes the North East Crater (NEC) overflows. Among all the visible differences, the accumulation in the northwest sector of the map stands out. The growth in elevation is due to the very intense Strombolian activity that occurred in Stromboli between the two acquisitions [43,47,48,49,50,51,52,53,54,55]. The above-mentioned phenomena are entirely attributable to the activity described in Table 4, where the main events that occurred between June 2019 and July 2021 are listed.

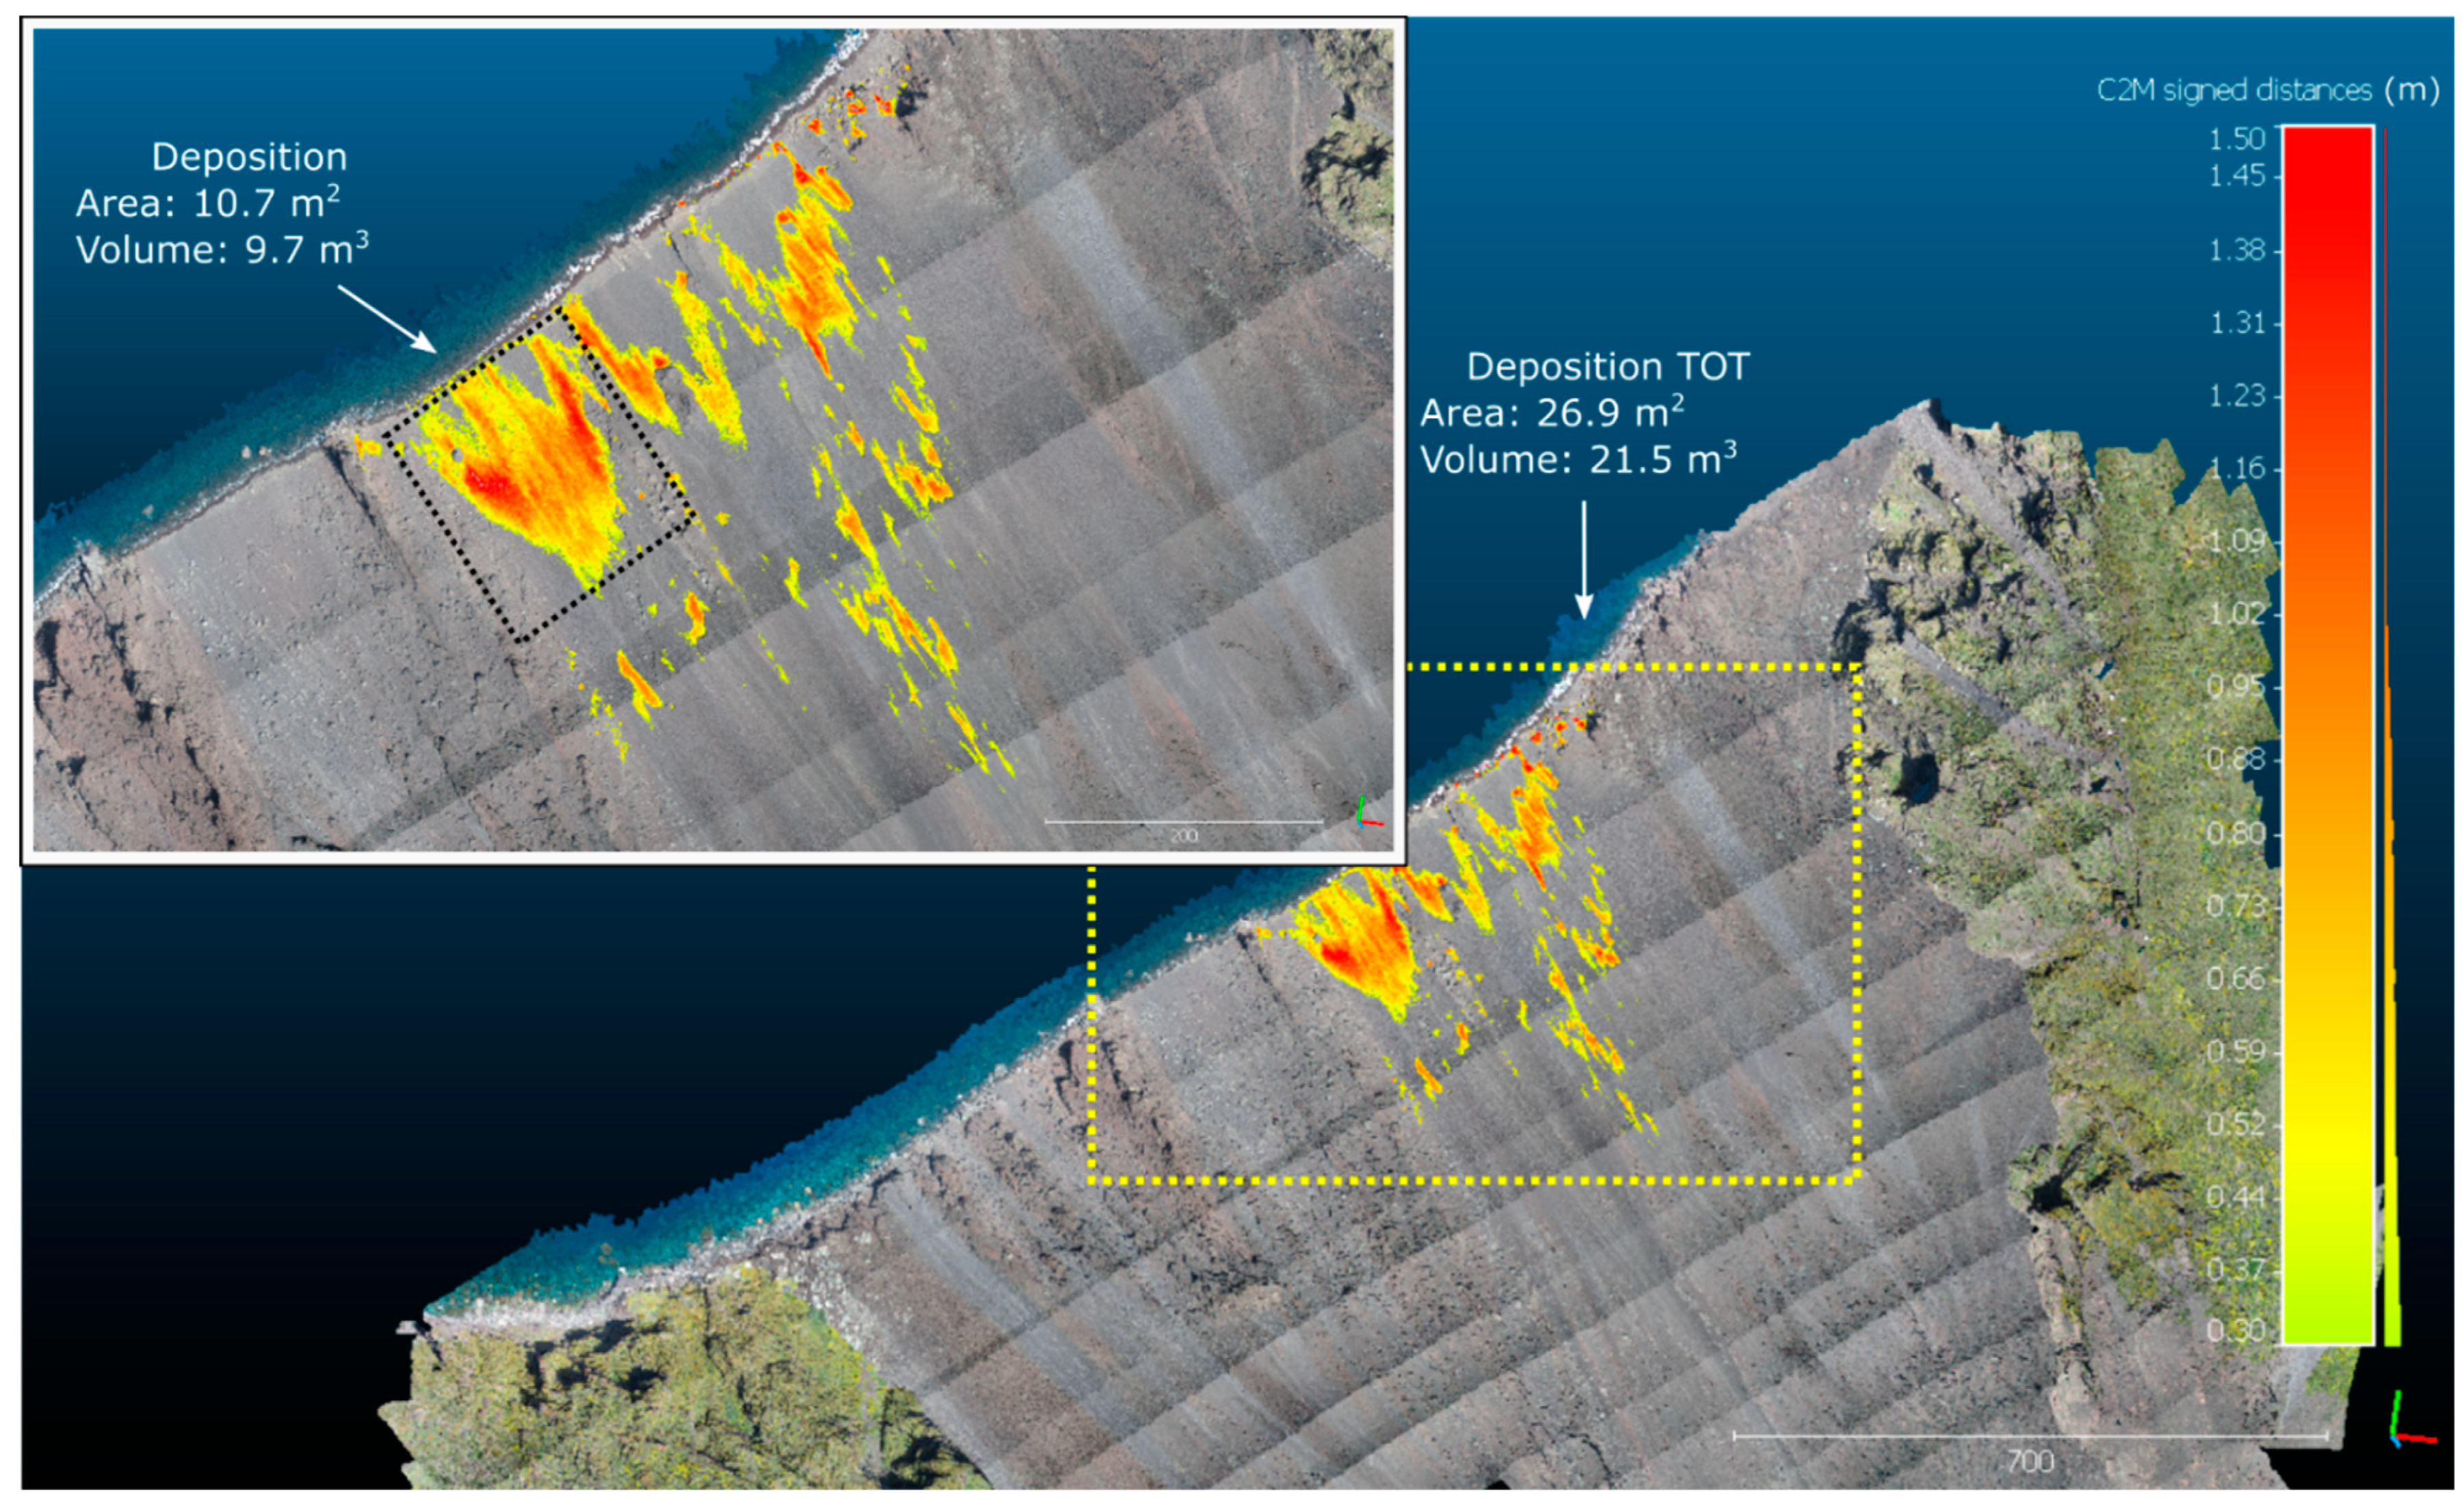
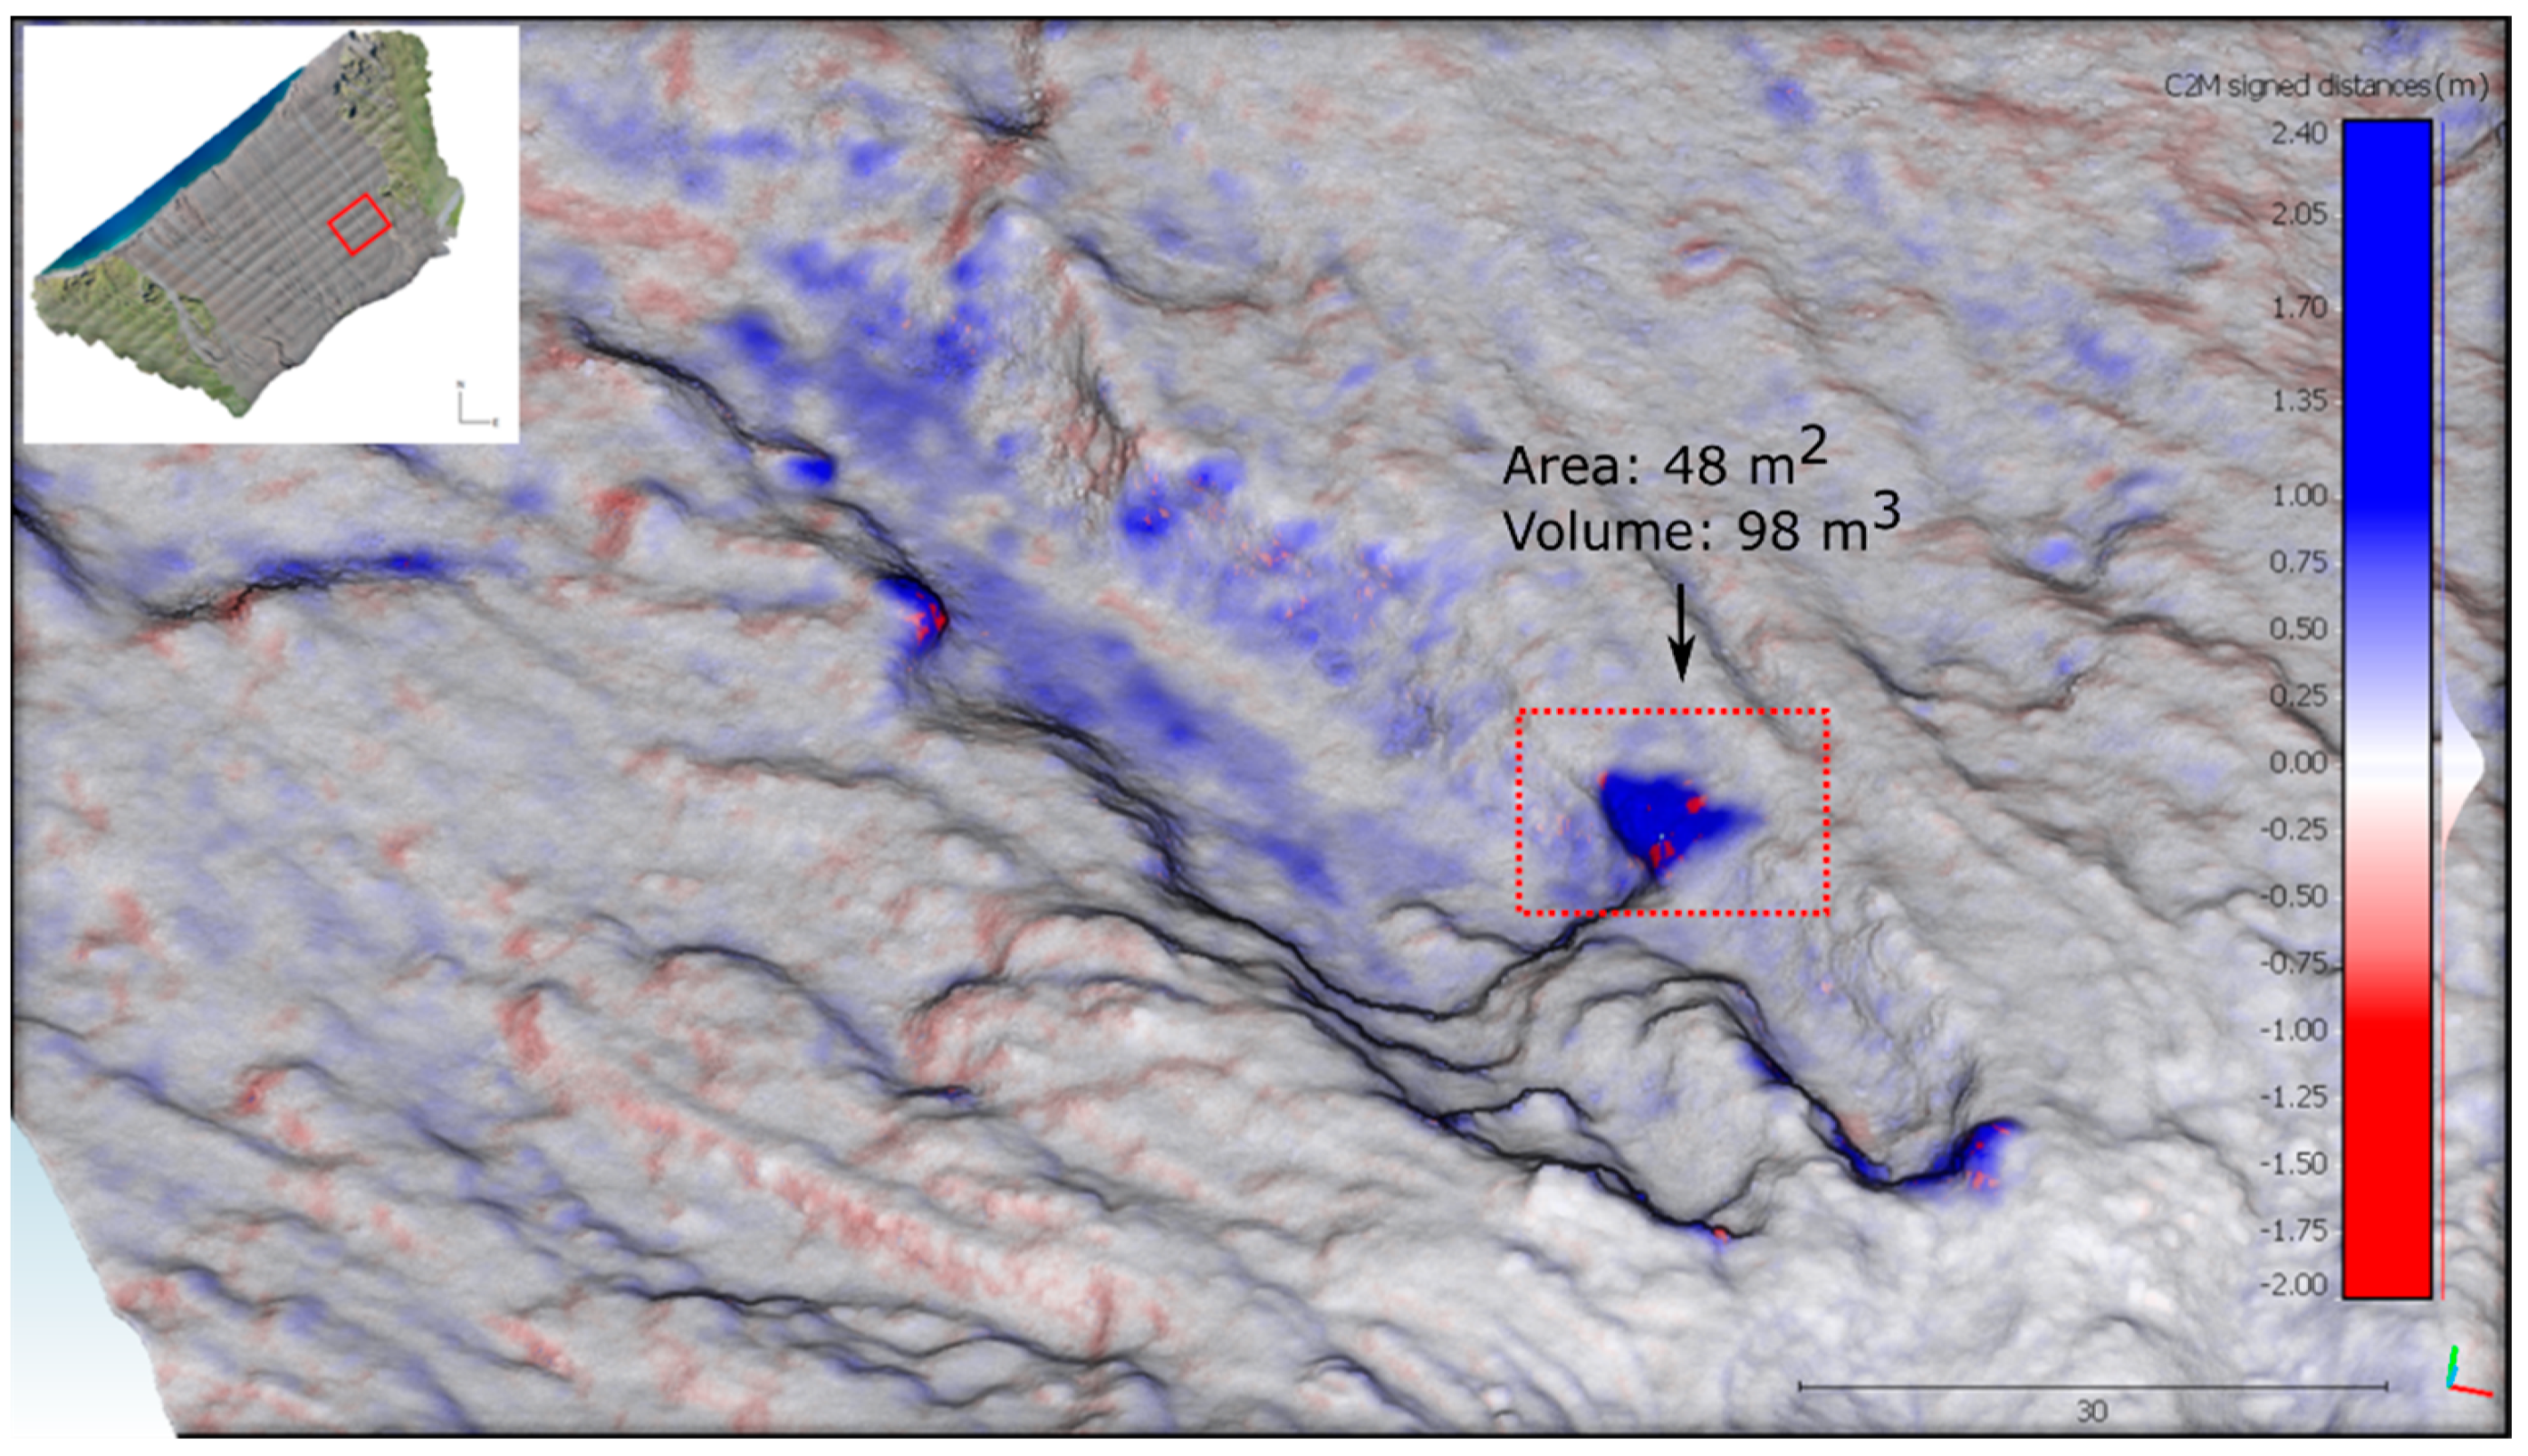
3.3. Small-Scale Detailed Analysis

As discussed, the setting-up procedure allows us to produce a change detection analysis for the whole SdF slope and identify significant variations in the morphology. On the other hand, deeper analysis of less relevant variations, as well as more precise quantification of involved volumes, can also be performed. The Iterative Closest Point (ICP) realignment technique indeed allows for the detailed study of small areas. The smaller the area to be examined, the greater the accuracy of the realignment, and consequently the more accurate the evaluation of the surfaces involved in morphological processes. In order to demonstrate the potential of this technique, two areas of detail were analyzed.
The first area is located in the previously described central coastal zone subject to continuous topographical changes (Figure 9). There, the refinement in the alignment of the two clouds enabled considering the restricted area inscribed in the yellow square of Figure 9 and the estimation of deposition area and volume.
Similarly, Figure 10 shows the case of a pre-existing detachment area in the southwestern portion of the Sciara del Fuoco, just below the plateau. The realignment of a small area of about 150 m × 180 m made it possible to identify some significant gaps that modified its overall morphology. The whole dataset was compared to date the detachment that took place between April 2017 and November 2017 (see the difference between Stromboli 3 and Stromboli 2, Figure 10). Both analyses allow us to appreciate the morphometric variations at a decimetric scale.

4. Discussion and Conclusive Remarks

The photogrammetric technique has been already used to model the SdF slope. Baldi et al., 2005 [56] carried out a helicopter-based photogrammetric survey proving the high potential of the tool for rapid data acquisition in inaccessible areas, such as those involved in volcanic phenomena. Marsella et al., 2012 [57] performed a quantitative reconstruction of the morphological changes of the SdF between 1868 and 2009, integrating historical maps, aerial photogrammetric, and Airborne Laser Scanner surveys. Di Traglia et al., 2018, 2020 [42,58] analyzed the geomorphological responses to the volcanic activity at the Stromboli volcano by comparing DEMs generated from tri-stereo PLÉIADES-1 imagery and LiDAR data. The work of Civico et al. (2021) [17] instead focused on the morphological variations of the crater terrace of Stromboli, detected by using UAVs.
However, in all these studies, DEMs were generated by integrating airborne and ground-based techniques or only from aerial/satellite photogrammetric survey, thus with a low resolution unable to identify minor structures. In addition, aerial-based photogrammetry is an expensive technique that usually requires time-consuming organization and coordination [59,60]. In this paper, high-resolution aerial photogrammetry for the multitemporal analysis of the unstable Sciara del Fuoco (SdF) slope at Stromboli Island (Italy) has been presented.
During our topographic reconstruction, several difficulties in the alignment and georeferencing of the generated 3D point clouds have emerged. Despite the product’s high resolution and precision, surveys were not in fact comparable and usable for a reliable change-detection analysis.
This was, however, possible through the development of a specific processing methodology, allowing the analysis of morphological variations of a largely inaccessible area at a decimetric scale. The procedure includes:
  • Positioning of GCPs alongside the perimeter of the inaccessible area.
  • Drone multitemporal surveys using physical shutter cameras and lenses with a field of view of less than 80° to minimize rolling shutter and lens distortions; on-board submetric GNSS or in any case capable of Horizontal Dilution of Point (HDOP) < 1 m.
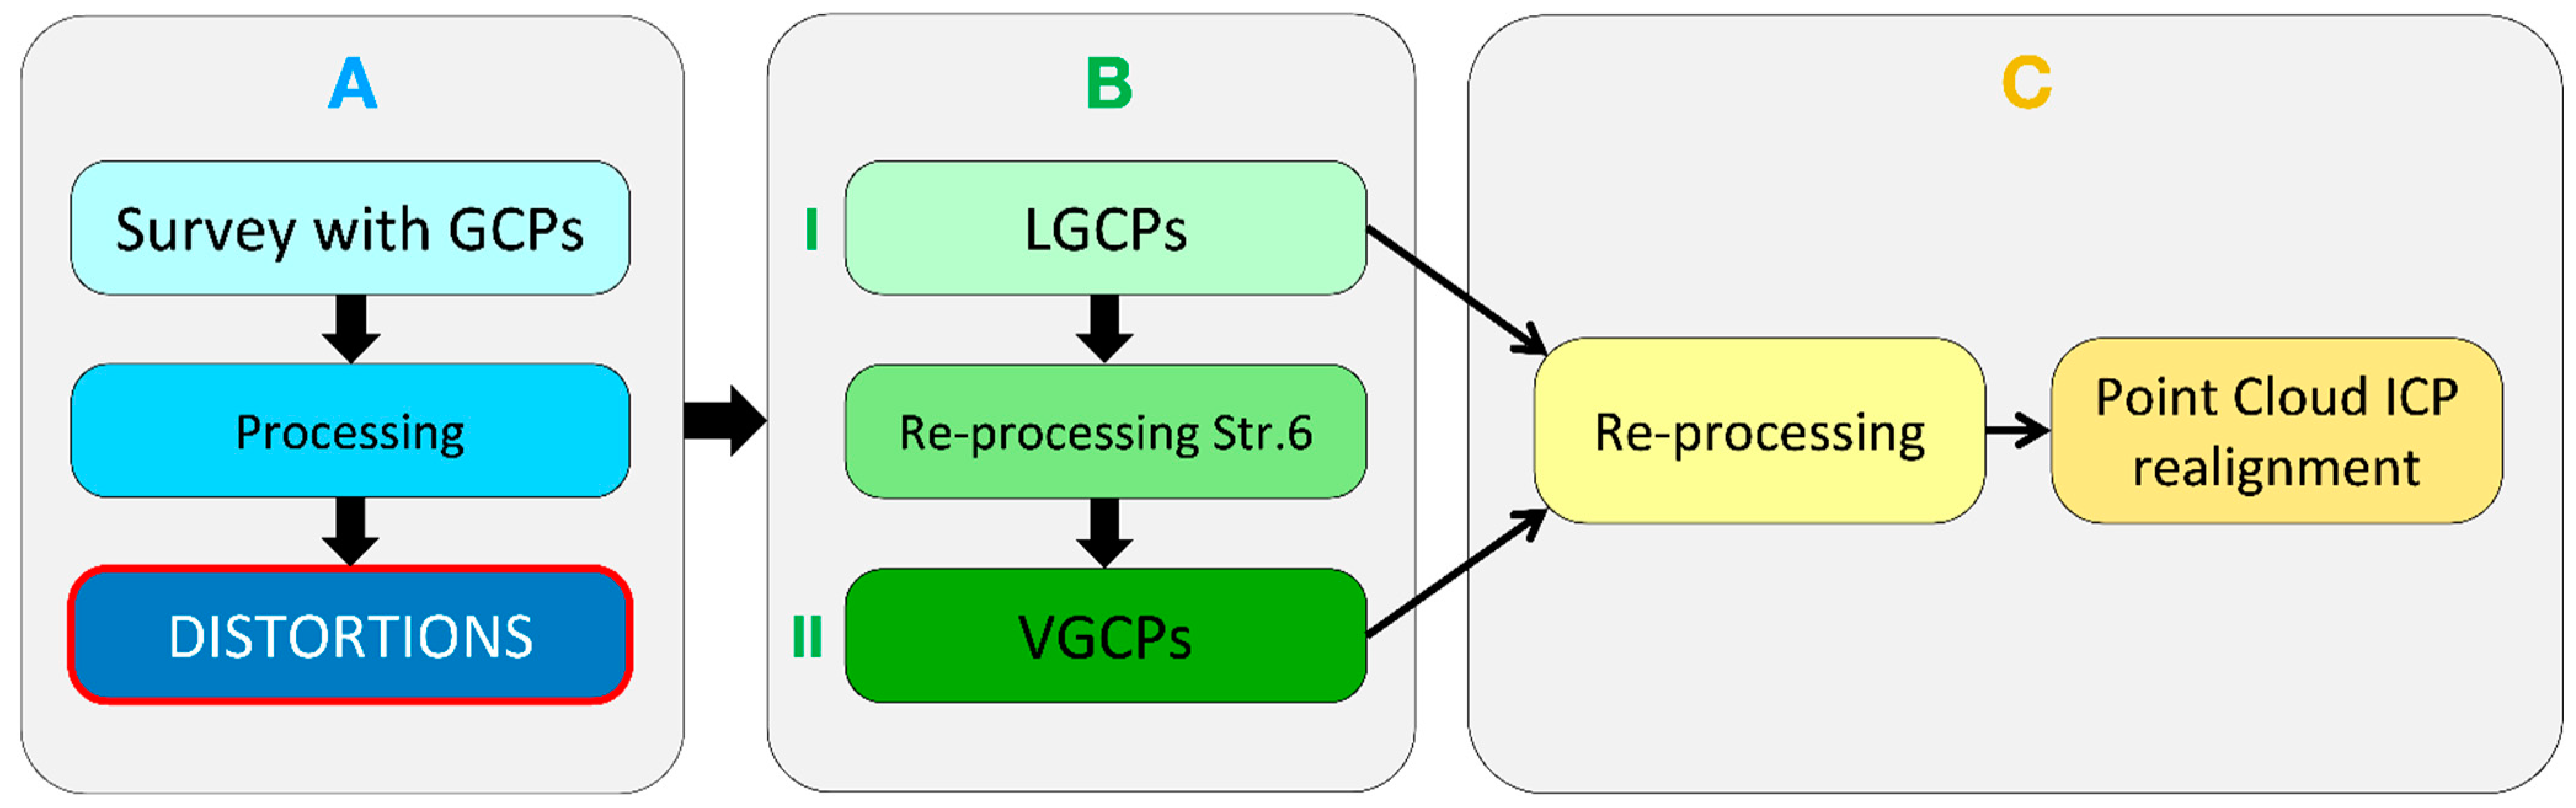
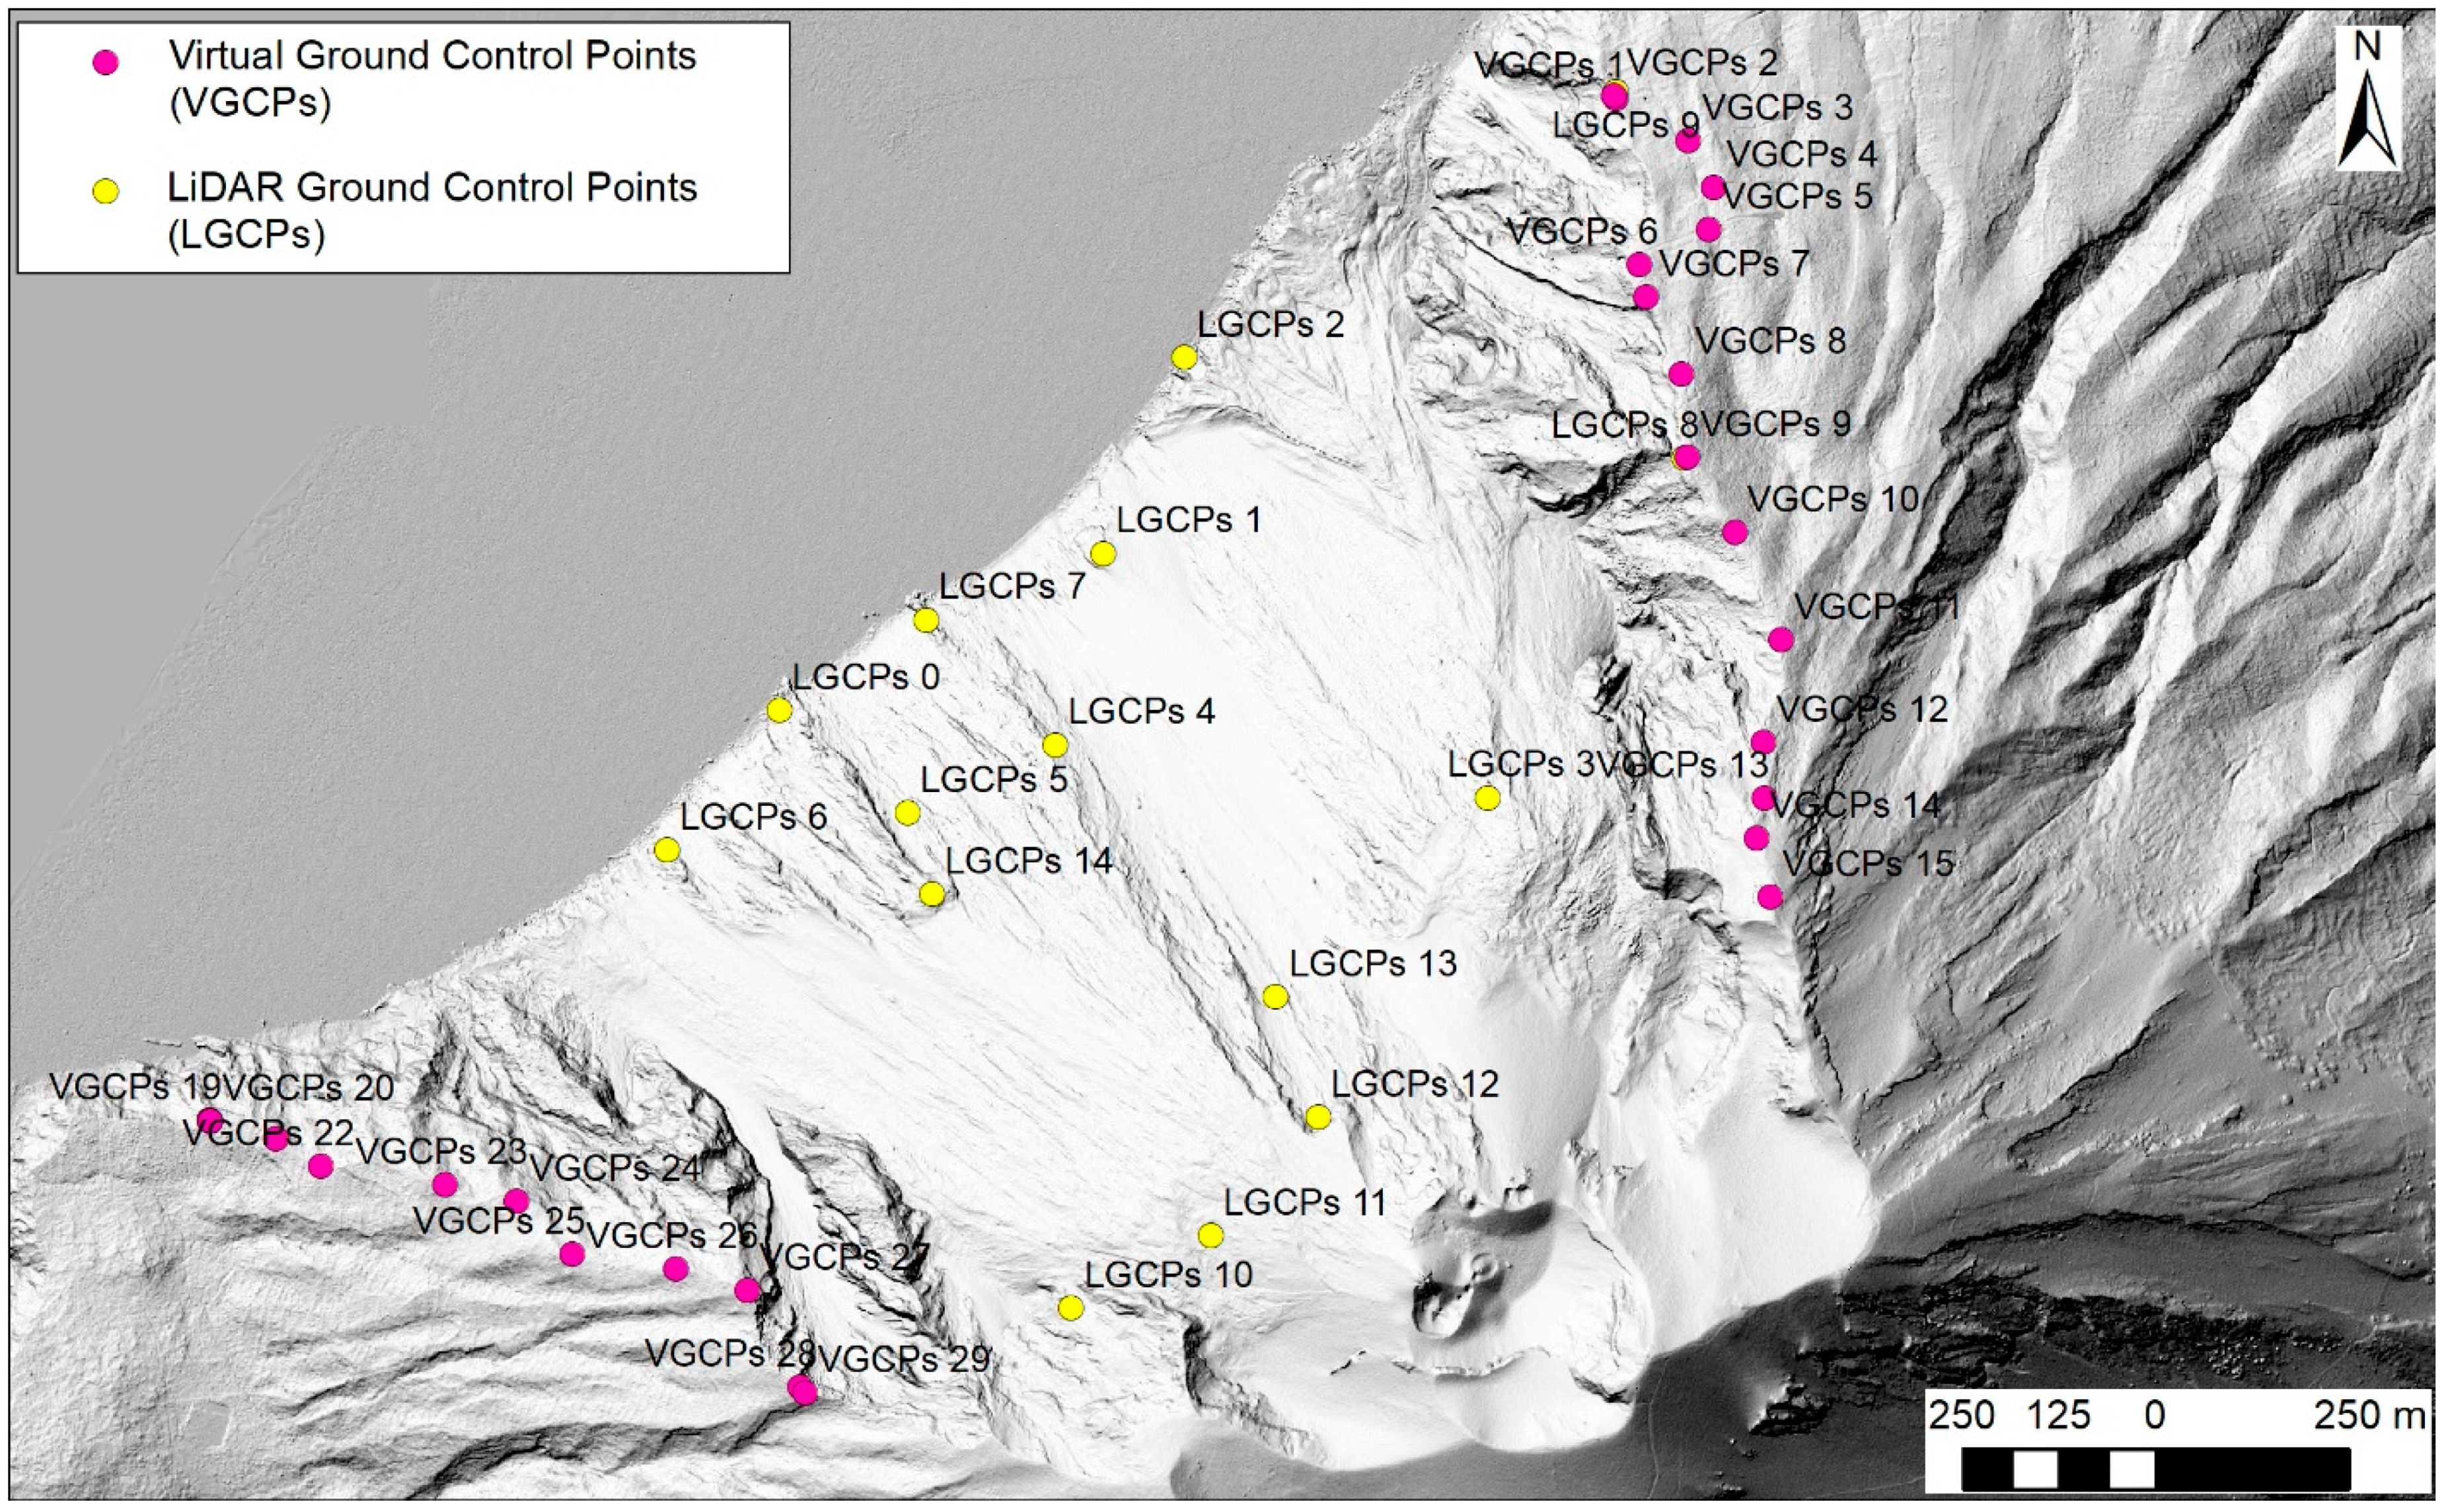
  • Anchoring of point clouds to virtual GCPs exported from a previous LiDAR survey carried out in 2012 located along the unreachable portions of the Sciara del Fuoco.
  • Georeferencing using GCPs obtained from GNSS measurements of the June 2019 survey positioned along the trails or in any case in areas that have not undergone changes and are easily recognizable from the frames acquired over the years.
  • Georeferencing refinement by realigning the point clouds with respect to a reference point cloud (Stromboli 6).
The results, with particular reference to the multitemporal analysis and therefore to the differences calculated between pairs of DSMs, highlighted the potential of the technique, which was tested for the georeferencing of a further UAV-based photogrammetric survey carried out in July 2021. The elevation difference map between Stromboli 7 and Stromboli 6 pointed out several structures related to the volcanic activity in the time lap.
The method can be extended to all cases in which operating on the ground is not possible. In the case of the SDF, the georeferencing by means of the exported points from the LiDAR survey of 2012 and the GCPs of the aerial photogrammetric survey of June 2019 allows for carrying out surveys with a reduced campaign of positioning of markers on the ground. This would significantly reduce the time and therefore the risk exposure of the operators during the activities. Keep in mind that, in ideal weather conditions and in the absence of unforeseen events related to the instrumentation, the photogrammetric surveys have required up to now 1 day for the GPS campaign and 1 day for drone flights (3 h of flight operations).
The technique used allows for the alignment of small portions of the slope with further precision. This, in addition to a more accurate estimate of the surfaces involved in accumulation and/or erosion phenomena, allows for the investigation of potential trigger areas of gravitational phenomena or newly formed fractures.

Author Contributions

Conceptualization: T.G., C.T.S., G.R., F.D.T., T.N. and N.C.; Data collection: T.G., C.T.S., G.R., F.D.T., T.N. and L.T.; Data analysis: T.G., C.T.S. and G.R.; Writing—Original Draft Preparation: T.G., C.T.S. and G.R.; Writing—Review & Editing: F.D.T., T.N. and N.C. All authors have read and agreed to the published version of the manuscript.

Funding

This work has been financially supported by the “Presidenza del Consiglio dei Ministri—Dipartimento della Protezione Civile” (Presidency of the Council of Ministers—Department of Civil Protection) (Scientific Responsibility: N.C.); this publication, however, does not reflect the position and the official policies of the Department. This work has been financially supported by “Volcano Sentinel—extension” project (Call: “Settore ricerca scientifica e innovazione tecnologica”; founded by: Ente Cassa di Risparmio di Firenze. Scientific Responsibility: F.D.T.).

Conflicts of Interest

The authors declare no conflict of interest.

References

  1. Francioni, M.; Salvini, R.; Stead, D.; Coggan, J. Improvements in the integration of remote sensing and rock slope modelling. Nat. Hazards 2018, 90, 975–1004. [Google Scholar] [CrossRef] [Green Version]
  2. Gomez, C.; Kato, A. Multi-scale voxel-based algorithm for UAV-derived point-clouds of complex surfaces. In Proceedings of the 2014 IEEE International Conference on Aerospace Electronics and Remote Sensing Technology, Yogyakarta, Indonesia, 13–14 November 2014; pp. 205–209. [Google Scholar]
  3. Mandirola, M.; Casarotti, C.; Peloso, S.; Lanese, I.; Brunesi, E.; Senaldi, I.; Federico, R.; Monti, A.; Facchetti, C. Guidelines for the use of Unmanned Aerial Systems for fast photogrammetry-oriented mapping in emergency response scenarios. Int. J. Disaster Risk Reduct. 2021, 58, 102207. [Google Scholar] [CrossRef]
  4. Casagli, N.; Frodella, W.; Morelli, S.; Tofani, V.; Ciampalini, A.; Intrieri, E.; Raspini, F.; Rossi, G.; Tanteri, L.; Lu, P. Spaceborne, UAV and ground-based remote sensing techniques for landslide mapping, monitoring and early warning. Geoenviron. Disasters 2017, 4, 9. [Google Scholar] [CrossRef]
  5. Garnica-Peña, R.J.; Alcántara-Ayala, I. The use of UAVs for landslide disaster risk research and disaster risk management: A literature review. J. Mt. Sci. 2021, 18, 482–498. [Google Scholar] [CrossRef]
  6. Giordan, D.; Manconi, A.; Facello, A.; Baldo, M.; Allasia, P.; Dutto, F. Brief Communication: The use of an unmanned aerial vehicle in a rockfall emergency scenario. Nat. Hazards Earth Syst. Sci. 2015, 15, 163–169. [Google Scholar] [CrossRef] [Green Version]
  7. Suh, J.; Choi, Y. Mapping hazardous mining-induced sinkhole subsidence using unmanned aerial vehicle (drone) photogrammetry. Environ. Earth Sci. 2017, 76, 144. [Google Scholar] [CrossRef]
  8. Dominici, D.; Alicandro, M.; Massimi, V. UAV photogrammetry in the post-earthquake scenario: Case studies in L’Aquila. Geomat. Nat. Hazards Risk 2017, 8, 87–103. [Google Scholar] [CrossRef] [Green Version]
  9. Meyer, D.; Hess, M.; Lo, E.; Wittich, C.E.; Hutchinson, T.C.; Kuester, F. UAV-based post disaster assessment of cultural heritage sites following the 2014 South Napa Earthquake. In Proceedings of the 2015 Digital Heritage, Granada, Spain, 28 September–2 October 2015; Volume 2, pp. 421–424. [Google Scholar]
  10. Stepinac, M.; Gašparović, M. A review of emerging technologies for an assessment of safety and seismic vulnerability and damage detection of existing masonry structures. Appl. Sci. 2020, 10, 5060. [Google Scholar] [CrossRef]
  11. Zhou, J.P.; Gong, J.H.; Wang, T.; Wang, D.C.; Yang, L.Y.; Zhao, X.J.; Yu, H.; Zhao, Z.M. Study on UAV Remote Sensing Image Acquiring and Visualization Management System for the Area Affected by 5.12 Wenchuan Earthquake. J. Remote Sens. 2008, 6, 877–884. [Google Scholar]
  12. Daud, S.M.S.M.; Yusof, M.Y.P.M.; Heo, C.C.; Khoo, L.S.; Singh, M.K.C.; Mahmood, M.S.; Nawawi, H. Applications of drone in disaster management: A scoping review. Sci. Justice 2022, 62, 30–42. [Google Scholar] [CrossRef]
  13. Nakano, T.; Kamiya, I.; Tobita, M.; Iwahashi, J.; Nakajima, H. Landform monitoring in active volcano by UAV and SFM-MVS technique. Int. Arch. Photogramm. Remote Sens. Spat. Inf. Sci. 2014, 40, 71. [Google Scholar] [CrossRef] [Green Version]
  14. Albino, F.; Smets, B.; d’Oreye, N.; Kervyn, F. High-resolution TanDEM-X DEM: An accurate method to estimate lava flow volumes at Nyamulagira Volcano (DR Congo). J. Geophys. Res.: Solid Earth 2015, 120, 4189–4207. [Google Scholar] [CrossRef] [Green Version]
  15. De Beni, E.; Cantarero, M.; Messina, A. UAVs for volcano monitoring: A new approach applied on an active lava flow on Mt. Etna (Italy), during the 27 February–02 March 2017 eruption. J. Volcanol. Geotherm. Res. 2018, 369, 250–262. [Google Scholar] [CrossRef]
  16. Favalli, M.; Fornaciai, A.; Nannipieri, L.; Harris, A.; Calvari, S.; Lormand, C. UAV-based remote sensing surveys of lava flow fields: A case study from Etna’s 1974 channel-fed lava flows. Bull. Volcanol. 2018, 80, 29. [Google Scholar] [CrossRef]
  17. Civico, R.; Ricci, T.; Scarlato, P.; Andronico, D.; Cantarero, M.; Carr, B.B.; De Beni, E.; Del Bello, E.; Johnson, J.B.; Kueppers, U.; et al. Unoccupied Aircraft Systems (UASs) Reveal the Morphological Changes at Stromboli Volcano (Italy) before, between, and after the 3 July and 28 August 2019 Paroxysmal Eruptions. Remote Sens. 2021, 13, 2870. [Google Scholar] [CrossRef]
  18. Turner, N.R.; Perroy, R.L.; Hon, K. Lava flow hazard prediction and monitoring with UAS: A case study from the 2014–2015 Pāhoa lava flow crisis, Hawai ‘i. J. Appl. Volcanol. 2017, 6, 17. [Google Scholar] [CrossRef] [Green Version]
  19. Rokhmana, C.A.; Andaru, R. Utilizing UAV-based mapping in post disaster volcano eruption. In Proceedings of the 2016 6th International Annual Engineering Seminar (InAES), Yogyakarta, Indonesia, 1–3 August 2016; pp. 202–205. [Google Scholar]
  20. Darmawan, H.; Walter, T.R.; Troll, V.R.; Budi-Santoso, A. Dome instability at Merapi volcano identified by drone photogrammetry and numerical modeling. Nat. Hazards Earth Syst. Sci. Discuss. 2018, 1–27. [Google Scholar]
  21. Gomez, C.; Purdie, H. UAV-based photogrammetry and geocomputing for hazards and disaster risk monitoring–a review. Geoenviron. Disasters 2016, 3, 23. [Google Scholar] [CrossRef] [Green Version]
  22. Marek, L.; Miřijovský, J.; Tuček, P. Monitoring of the Shallow Landslide Using UAV Photogrammetry and Geodetic Measurements. Eng. Geol. Soc. Ter. 2015, 2, 113–116. [Google Scholar]
  23. Niethammer, U.; James, M.R.; Rothmund, S.; Travelletti, J.; Joswig, M. UAV based remote sensing of the Super-Sauze landslide: Evaluation and results. Eng. Geol. 2012, 128, 2–11. [Google Scholar] [CrossRef]
  24. Gracchi, T.; Rossi, G.; Stefanelli, C.T.; Tanteri, L.; Pozzani, R.; Moretti, S. Tracking the Evolution of Riverbed Morphology on the Basis of UAV Photogrammetry. Remote Sens. 2021, 13, 829. [Google Scholar] [CrossRef]
  25. Rossi, G.; Tanteri, L.; Tofani, V.; Vannocci, P.; Moretti, S.; Casagli, N. Multitemporal UAV surveys for landslide mapping and characterization. Landslides 2018, 15, 1045–1052. [Google Scholar] [CrossRef] [Green Version]
  26. Ferrer-González, E.; Agüera-Vega, F.; Carvajal-Ramírez, F.; Martínez-Carricondo, P. UAV Photogrammetry Accuracy Assessment for Corridor Mapping Based on the Number and Distribution of Ground Control Points. Remote Sens. 2020, 12, 2447. [Google Scholar] [CrossRef]
  27. Agüera-Vega, F.; Carvajal-Ramírez, F.; Martínez-Carricondo, P. Assessment of photogrammetric mapping accuracy based on variation ground control points number using unmanned aerial vehicle. Meas. J. Int. Meas. Confed. 2017, 98, 221–227. [Google Scholar] [CrossRef]
  28. Martínez-Carricondo, P.; Agüera-Vega, F.; Carvajal-Ramírez, F.; Mesas-Carrascosa, F.J.; García-Ferrer, A.; Pérez-Porras, F.J. Assessment of UAV-photogrammetric mapping accuracy based on variation of ground control points. Int. J. Appl. Earth Obs. Geoinf. 2018, 72, 1–10. [Google Scholar] [CrossRef]
  29. Reshetyuk, Y.; Mårtensson, S.G. Generation of Highly Accurate Digital Elevation Models with Unmanned Aerial Vehicles. Photogramm. Rec. 2016, 31, 143–165. [Google Scholar] [CrossRef]
  30. Forlani, G.; Dall’Asta, E.; Diotri, F.; di Cella, U.M.; Roncella, R.; Santise, M. Quality assessment of DSMs produced from UAV flights georeferenced with on-board RTK positioning. Remote Sens. 2018, 10, 311. [Google Scholar] [CrossRef] [Green Version]
  31. Rabah, M.; Basiouny, M.; Ghanem, E.; Elhadary, A. Using RTK and VRS in direct geo-referencing of the UAV imagery. NRIAG J. Astron. Geophys. 2018, 7, 220–226. [Google Scholar] [CrossRef] [Green Version]
  32. Tomaštík, J.; Mokroš, M.; Surový, P.; Grznárová, A.; Merganič, J. UAV RTK/PPK method-An optimal solution for mapping inaccessible forested areas? Remote Sens. 2019, 11, 721. [Google Scholar] [CrossRef] [Green Version]
  33. Štroner, M.; Urban, R.; Seidl, J.; Reindl, T.; Brouček, J. Photogrammetry Using UAV-Mounted GNSS RTK: Georeferencing Strategies without GCPs. Remote Sens. 2021, 13, 1336. [Google Scholar] [CrossRef]
  34. Kokelaar, P.; & Romagnoli, C. Sector collapse, sedimentation and clast population evolution at an active island-arc volcano: Stromboli, Italy. Bull. Volcanol. 1995, 57, 240–262. [Google Scholar] [CrossRef]
  35. Di Traglia, F.; Bartolini, S.; Artesi, E.; Nolesini, T.; Ciampalini, A.; Lagomarsino, D.; Martì, J.; Casagli, N. Susceptibility of intrusion-related landslides at volcanic islands: The Stromboli case study. Landslides 2018, 15, 21–29. [Google Scholar] [CrossRef] [Green Version]
  36. Blackburn, E.A.; Wilson, L.; Sparks, R.J. Mechanisms and dynamics of strombolian activity. J. Geol. Soc. 1976, 132, 429–440. [Google Scholar] [CrossRef]
  37. Schaefer, L.N.; Di Traglia, F.; Chaussard, E.; Lu, Z.; Nolesini, T.; Casagli, N. Monitoring volcano slope instability with Synthetic Aperture Radar: A review and new data from Pacaya (Guatemala) and Stromboli (Italy) volcanoes. Earth-Sci. Rev. 2019, 192, 236–257. [Google Scholar] [CrossRef]
  38. Maramai, A.; Graziani, L.; Tinti, S. Tsunamis in the Aeolian Islands (southern Italy): A review. Mar. Geol. 2005, 215, 11–21. [Google Scholar] [CrossRef]
  39. Fornaciai, A.; Favalli, M.; Nannipieri, L. Numerical simulation of the tsunamis generated by the Sciara del Fuoco landslides (Stromboli Island, Italy). Sci. Rep. 2019, 9, 18542. [Google Scholar] [CrossRef] [Green Version]
  40. Esposti Ongaro, T.; de’Michieli Vitturi, M.; Cerminara, M.; Fornaciai, A.; Nannipieri, L.; Favalli, M.; Calusi, B.; Macìas, J.; Castro, M.J.; Ortega, S.; et al. Modeling Tsunamis Generated by Submarine Landslides at Stromboli Volcano (Aeolian Islands, Italy): A Numerical Benchmark Study. Front. Earth Sci. 2021, 9, 274. [Google Scholar] [CrossRef]
  41. Tinti, S.; Pagnoni, G.; Zaniboni, F. The landslides and tsunamis of the 30th of December 2002 in Stromboli analysed through numerical simulations. Bull. Volcanol. 2006, 68, 462–479. [Google Scholar] [CrossRef]
  42. Di Traglia, F.; Fornaciai, A.; Favalli, M.; Nolesini, T.; Casagli, N. Catching geomorphological response to volcanic activity on steep slope volcanoes using multi-platform remote sensing. Remote Sens. 2020, 12, 438. [Google Scholar] [CrossRef] [Green Version]
  43. Di Traglia, F.; Fornaciai, A.; Casalbore, D.; Favalli, M.; Manzella, I.; Romagnoli, C.; Chiocci, F.L.; Cole, P.; Nolesini, T.; Casagli, N. Subaerial-submarine morphological changes at Stromboli volcano (Italy) induced by the 2019–2020 eruptive activity. Geomorphology 2022, 400, 108093. [Google Scholar] [CrossRef]
  44. Agisoft. Agisoft Metashape User Manual Professional Edition, Version 1.7. 2019. Available online: https://www.agisoft.com/pdf/metashape-pro_1_7_en.pdf (accessed on 22 January 2021).
  45. CloudCompare (Version 2.11). 2020. Available online: http://www.cloudcompare.org/ (accessed on 10 April 2022).
  46. ESRI. ArcGIS Desktop: Version 10.7.1.; Environmental Systems Research Institute: Redlands, CA, USA, 2011. [Google Scholar]
  47. Plank, S.; Marchese, F.; Filizzola, C.; Pergola, N.; Neri, M.; Nolde, M.; Martinis, S. The July/August 2019 Lava Flows at the Sciara del Fuoco, Stromboli–Analysis from Multi-Sensor Infrared Satellite Imagery. Remote Sens. 2019, 11, 2879. [Google Scholar] [CrossRef] [Green Version]
  48. Calvari, S.; Di Traglia, F.; Ganci, G.; Giudicepietro, F.; Macedonio, G.; Cappello, A.; Nolesini, T.; Pecora, E.; Bilotta, G.; Centorrino, V.; et al. Overflows and pyroclastic density currents in March-April 2020 at Stromboli volcano detected by remote sensing and seismic monitoring data. Remote Sens. 2020, 12, 3010. [Google Scholar] [CrossRef]
  49. Università degli Studi di Firenze-Centro per la Protezione Civile (UNIFI-CPC, 2020a) Comunicato Sistema SAR di Stromboli del Periodo 15 Aprile 2020 ore 11. Available online: https://cme.ingv.it/bollettini-e-comunicati/comunicati-unifi-cpc-stromboli/467-2020-04-15-comunicato-sistema-sar-di-stromboli-del-periodo-15-aprile-2020-ore-11-1/file (accessed on 1 March 2020).
  50. Università degli Studi di Firenze-Centro per la Protezione Civile (UNIFI-CPC, 2020b) Comunicato Sistema SAR di Stromboli del Periodo 19 Aprile 2020 ore 23. Available online: https://cme.ingv.it/bollettini-e-comunicati/comunicati-unifi-cpc-stromboli/468-2020-04-19-comunicato-sistema-sar-di-stromboli-del-periodo-19-aprile-2020-ore-23-00-1/file (accessed on 1 March 2020).
  51. Università degli Studi di Firenze-Centro per la Protezione Civile (UNIFI-CPC, 2020c) Bollettino Sistema SAR di Stromboli del periodo 23 aprile 2020–30 aprile 2020. Available online: https://cme.ingv.it/bollettini-e-comunicati/bollettini-unifi-cpc-stromboli-1/308-2020-04-30-bollettino-sistema-sar-di-stromboli-del-periodo-23-aprile-2020-30-aprile-2020/file (accessed on 1 March 2020).
  52. Università degli Studi di Firenze-Centro per la Protezione Civile (UNIFI-CPC, 2021a) Bollettino Sistema SAR di Stromboli del periodo 21 Gennaio 2021–28 Gennaio 2021. Available online: https://cme.ingv.it/bollettini-e-comunicati/bollettini-unifi-cpc-stromboli-1/597-2021-01-28-bollettino-sistema-sar-di-stromboli-del-periodo-21-gennaio-2021-28-gennaio-2021/file (accessed on 1 March 2020).
  53. Università degli Studi di Firenze-Centro per la Protezione Civile (UNIFI-CPC, 2021b) Comunicato Sistema SAR di Stromboli del periodo 19 Maggio 2021 ore 18. Available online: https://cme.ingv.it/bollettini-e-comunicati/comunicati-unifi-cpc-stromboli/689-2021-05-19-comunicato-sistema-sar-di-stromboli-del-19-maggio-2021-ore-18/file (accessed on 1 March 2020).
  54. Università degli Studi di Firenze-Centro per la Protezione Civile (UNIFI-CPC, 2021c) Comunicato Sistema SAR di Stromboli del periodo 17 Giugno 2021 ore 23.15. Available online: https://cme.ingv.it/bollettini-e-comunicati/comunicati-unifi-cpc-stromboli/750-2021-06-17-comunicato-sistema-sar-di-stromboli-del-17-giugno-2021-ore-23-15/file (accessed on 1 March 2020).
  55. Università degli Studi di Firenze-Centro per la Protezione Civile (UNIFI-CPC, 2021d) Comunicato Sistema SAR di Stromboli del periodo 26 Novembre 2021 ore 10. Available online: https://cme.ingv.it/bollettini-e-comunicati/comunicati-unifi-cpc-stromboli/981-2021-11-26-comunicato-sistema-sar-di-stromboli-del-26-novembre-2021-ore-10-00/file (accessed on 1 March 2020).
  56. Baldi, P.; Fabris, M.; Marsella, M.; Monticelli, R. Monitoring the morphological evolution of the Sciara del Fuoco during the 2002–2003 Stromboli eruption using multi-temporal photogrammetry. ISPRS J. Photogramm. Remote Sens. 2005, 59, 199–211. [Google Scholar] [CrossRef]
  57. Marsella, M.; Baldi, P.; Coltelli, M.; Fabris, M. The morphological evolution of the Sciara del Fuoco since 1868: Reconstructing the effusive activity at Stromboli volcano. Bull. Volcanol. 2012, 74, 231–248. [Google Scholar] [CrossRef]
  58. Di Traglia, F.; Calvari, S.; D’Auria, L.; Nolesini, T.; Bonaccorso, A.; Fornaciai, A.; Esposito, A.; Cristaldi, A.; Favalli, M.; Casagli, N. The 2014 effusive eruption at Stromboli: New insights from in situ and remote-sensing measurements. Remote Sens. 2018, 10, 2035. [Google Scholar] [CrossRef] [Green Version]
  59. Kellner, J.R.; Armston, J.; Birrer, M.; Cushman, K.C.; Duncanson, L.; Eck, C.; Fallager, C.; Imbach, B.; Král, K.; Krůček, M.; et al. New opportunities for forest remote sensing through ultra-high-density drone lidar. Surv. Geophys. 2019, 40, 959–977. [Google Scholar] [CrossRef] [Green Version]
  60. Udin, W.S.; Ahmad, A. Assessment of photogrammetric mapping accuracy based on variation flying altitude using unmanned aerial vehicle. In Proceedings of the IOP Conference Series: Earth and Environmental Science—8th International Symposium of the Digital Earth (ISDE8), Kuching, Malaysia, 26–29 August 2013; Volume 18, p. 012027. [Google Scholar]
Figure 2. Methodological flowchart. (A) Processing of the surveys at the Sciara del Fuoco with traditional Ground Control Points (GCPs) that pointed out distortions and alignment issues. (B) Use of LiDAR Ground Control Points (LGCPs) (I) to re-process the Stromboli 6 dense cloud and identification of stable Virtual Ground Control points (VGCPs) (II). (C) Final re-processing of all the surveys using LGCPs and VGCPs and use of the ICP alignment tool.
Remotesensing 14 02489 g002
Figure 3. Position of Virtual Ground Control Points (VGCPs) derived from the Stromboli 6 dataset and Lidar Ground Control Points (LGCPs) obtained from the LiDAR survey carried out in 2012.
Remotesensing 14 02489 g003
Figure 4. Difference map between the Stromboli 6 aerial photogrammetric survey (carried out in June 2019) and the model generated from the images taken from the PLEIADES-1 constellation acquired on the same day. On the left side, three cross sections highlighting the correspondence of the two models.
Remotesensing 14 02489 g004
Figure 5. Stromboli 7 dense cloud generated from the aerial photogrammetry survey carried out in July 2021. Details of the Stromboli 7 3D point cloud, highlighting the high resolution.
Remotesensing 14 02489 g005
Figure 6. Difference in elevation between Digital Surface Models. (a) Stromboli 6–Stromboli 5; (b) Stromboli 6–Stromboli 4; (c) Stromboli 6–Stromboli 3. The area inside the red box identifies a misalignment error. (d) Stromboli 6–Stromboli 2.
Remotesensing 14 02489 g006
Figure 7. Difference in elevation between Stromboli 7 and Stromboli 6 Digital Surface Models, generated from two UAV-based photogrammetric surveys carried out in July 2021 and June 2019, respectively.
Remotesensing 14 02489 g007
Figure 8. Cross-section across portion of the Sciara del Fuoco along profiles represented in Figure 7. Stromboli 6 and Stromboli 7 are the DSMs generated by the UAV-based photogrammetric survey carried out in June 2019 and July 2021, respectively.
Remotesensing 14 02489 g008
Figure 9. Stromboli 6–Stromboli 5 difference evaluated in an area close to the coastline after the usage of the Iterative Closest Point (ICP) alignment tool. Points within the yellow square are those taken into account for the realignment.
Remotesensing 14 02489 g009
Figure 10. Stromboli 3–Stromboli 2 difference evaluated in a small area after the usage of the Iterative Closest Point (ICP) alignment tool. The analysis points out a small detachment area formed in the period that occurred between April 2017 and November 2017.
Remotesensing 14 02489 g010
Table 1. Stromboli 1 to Stromboli 6 UAV-based photogrammetric survey specifications and product characteristics.
Stromboli 1Stromboli 2Stromboli 3Stromboli 4Stromboli 5Stromboli 6
DateOctober 2016April 2017November 2017May 2018December 2018June 2019
CameraCanon IXUS 240Canon IXUS 240Canon IXUS 240Canon IXUS 240Canon IXUS 160Canon IXUS 160
Frames2969281165139015121212
Flight plans467777
GNSS
System
-Leica 1200Leica 500Leica 500EMLID REACHEMLID REACH
GCPs01716313229
Take-off points553211
N. Points232′486700′460625′743882′9841′772′0901′585′190
DSM
Resolution (cm/pix)
109.7109.576.5
GCPs
Average
error (m)
4.72.30.80.30.10.3
Table 2. UAV-based photogrammetric survey specifications and product characteristics after the finest realignment processing.
Stromboli 1Stromboli 2Stromboli 3Stromboli 4Stromboli 5Stromboli 6
VGCPs271921292929
LiDAR GCPs3131451515
N. Points309′058857′445625′7431′229′0681′735′9451′585′190
DSM Resolution (cm/pix)9.89.99.61076.5
GCPs Average error (m)10.99.82.40.62.42.6
Table 3. Stromboli 7 UAV survey specifications and product characteristics.
Stromboli 7
DateJuly 2021
CameraCanon IXUS 160
Frames1102
Flight plans7
GNSS SystemEMLID REACH
Take-off points1
VGCPs29
LiDAR GCPs15
N. Points1′922′353′547
DSM Resolution (cm/pix)4.8
GCPs Average error (m)1.2
Table 4. Events occurred at Stromboli volcano between June 2019 and July 2020. The position of South West Crater (SWC) and North East Crater (NEC) is shown in Figure 1.
DateEvent DescriptionReference
3 July 2019–30 August 2019Lava flow from SWC associated with paroxysmal explosionDi Traglia et al., 2022 [43]; Plank et al., 2019 [47]
12 July 2019Lava flow from NECDi Traglia et al., 2022 [43]
18 January 2020Lava overflow from NECDi Traglia et al., 2022 [43]
5 February 2020Lava overflow from NECDi Traglia et al., 2022 [43]
28 February 2020Lava overflow from NECDi Traglia et al., 2022 [43]; Calvari et al., 2020 [48]
28 March–1 April 2020Lava overflows from NECDi Traglia et al., 2022 [43]; Calvari et al., 2020 [48]
15 April 2020Lava overflows from NECUNIFI-CPC 2020a [49]
19 April 2020Lava overflows from NECUNIFI-CPC 2020b [50]
24 April 2020Lava overflows from NECUNIFI-CPC 2020c [51]
18–24 January 2021Lava overflows from NEC and major explosionUNIFI-CPC 2021a [52]
19 May 2021Lava flow from NECUNIFI-CPC 2021b [53]
17 June 2021Lava overflows from NECUNIFI-CPC 2021c [54]
25 November 2021Lava overflows from NECUNIFI-CPC 2021d [55]
Publisher’s Note: MDPI stays neutral with regard to jurisdictional claims in published maps and institutional affiliations.

