
Monitoring and Predicting the Subsidence of Dalian Jinzhou Bay International Airport, China by Integrating InSAR Observation and Terzaghi Consolidation Theory


 ,
,
Abstract
:1. Introduction
2. Study Area and Data Source
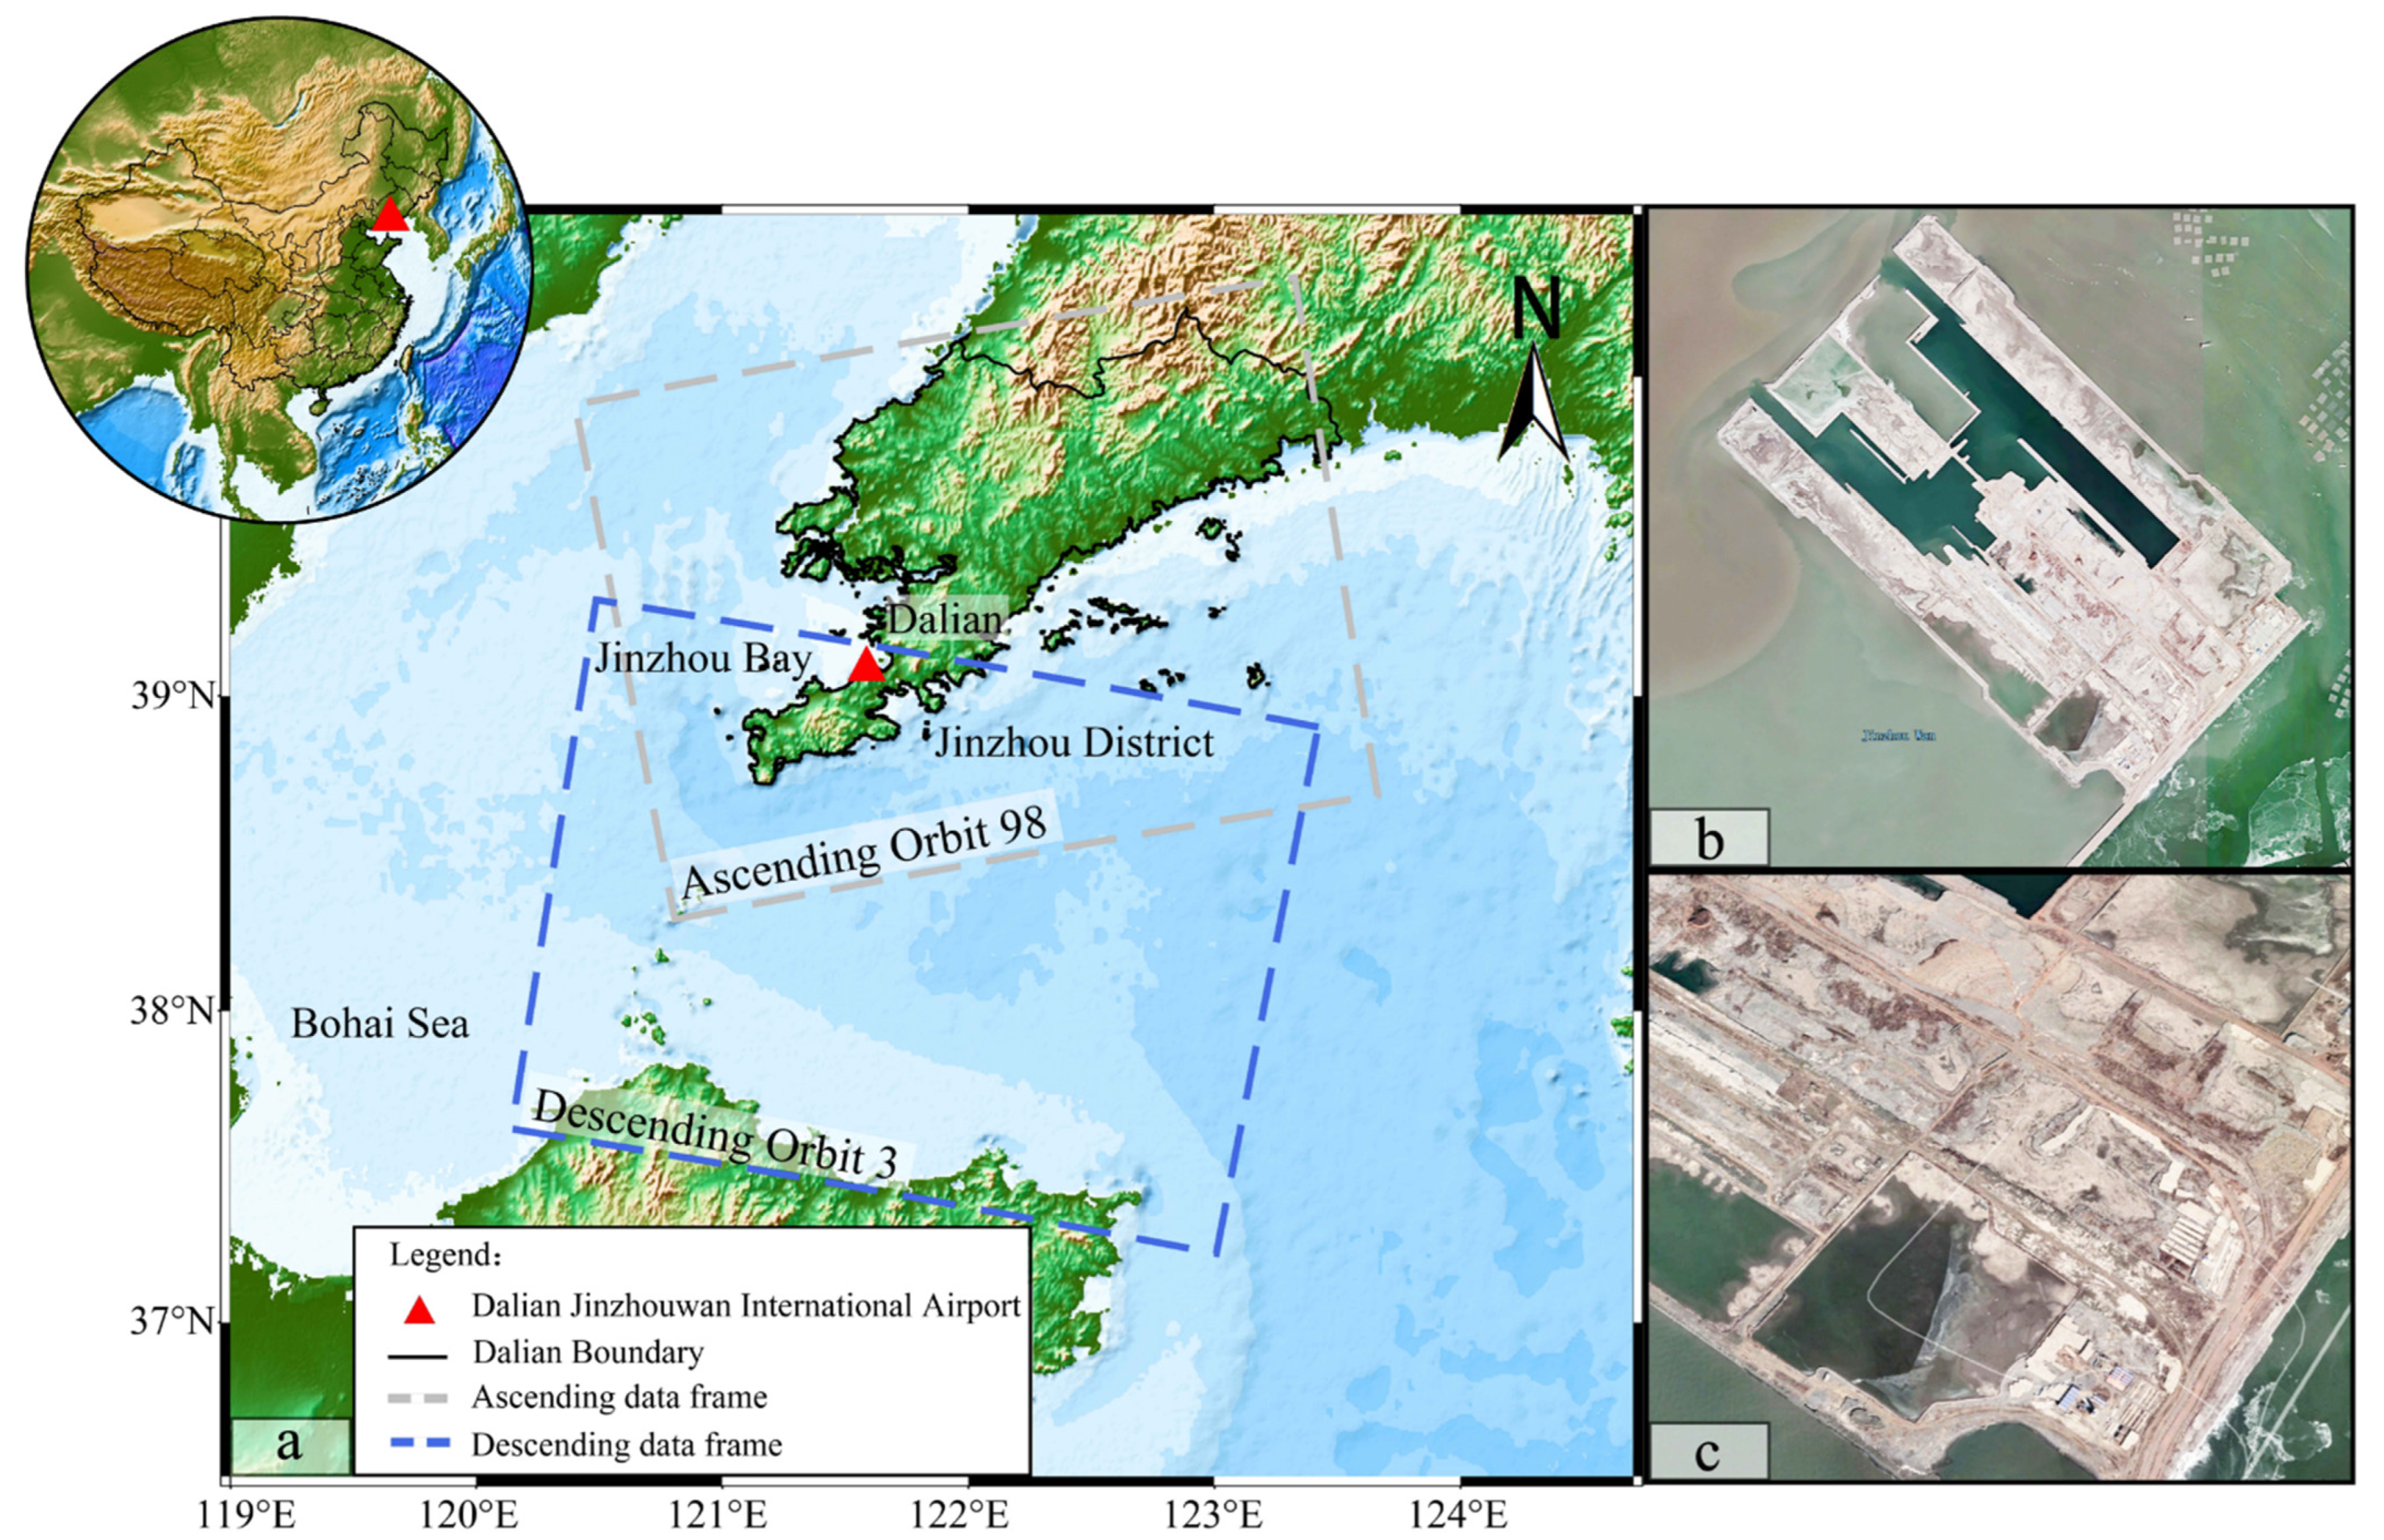
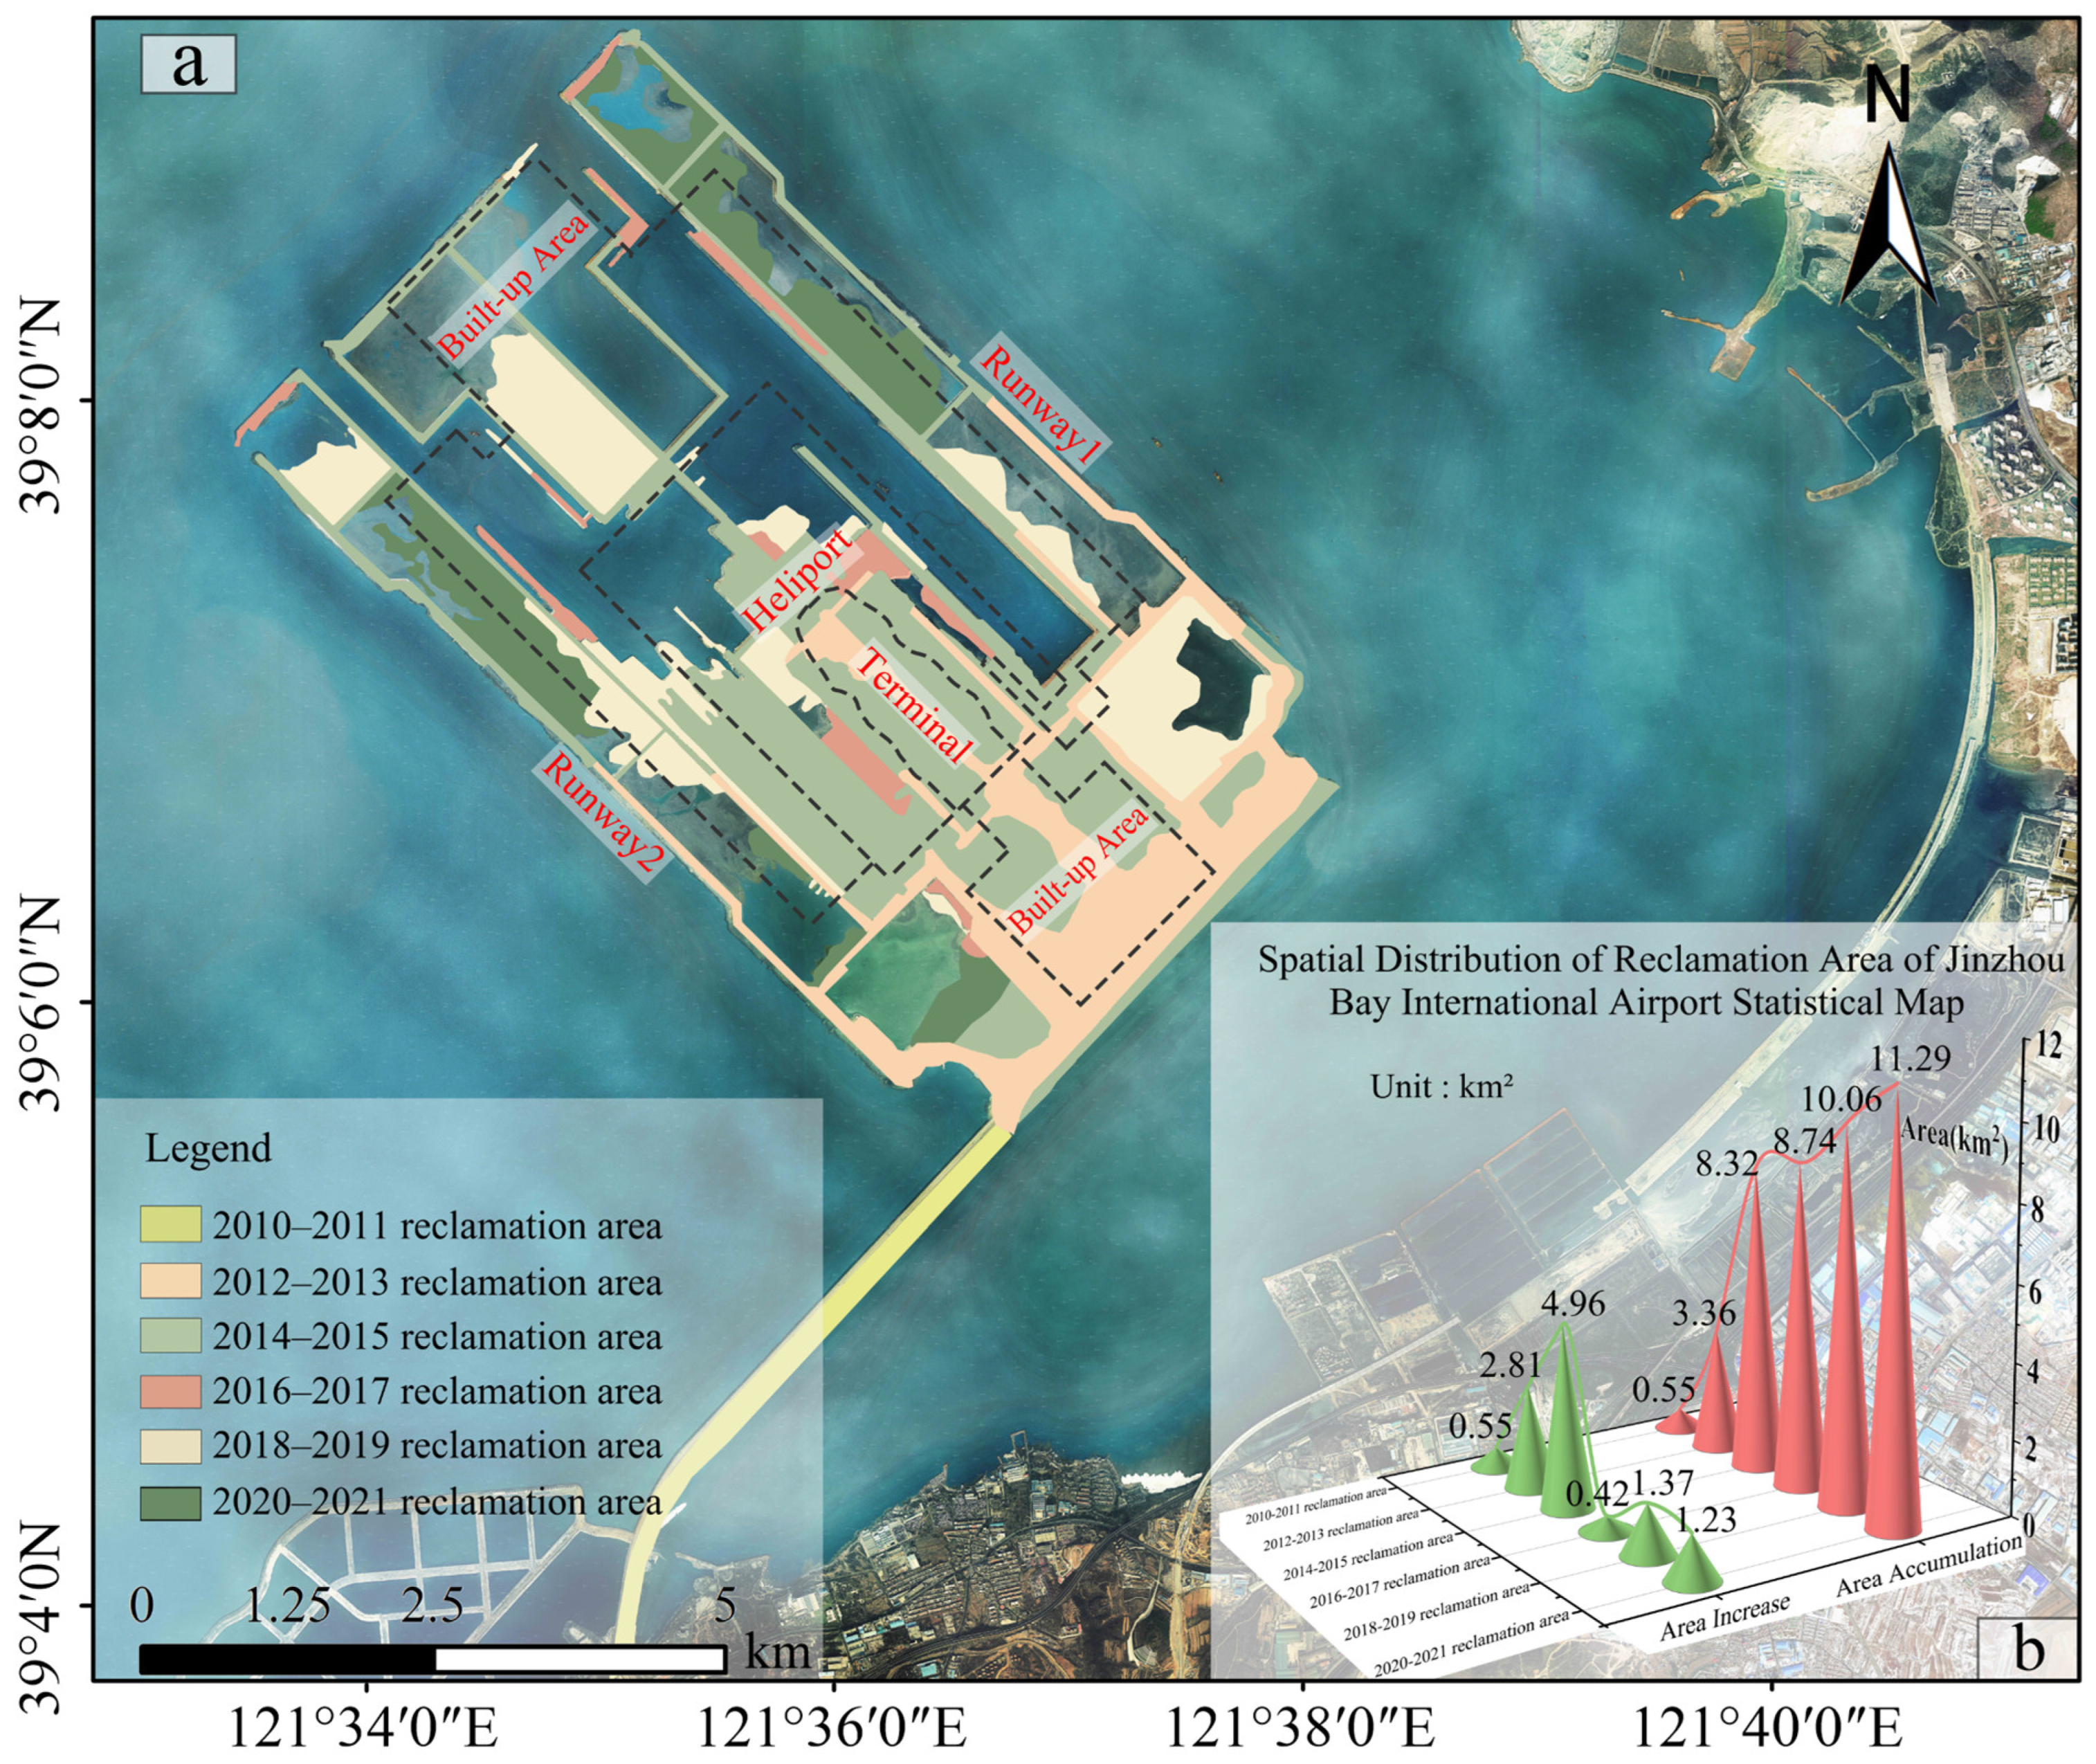
2.1. Study Area
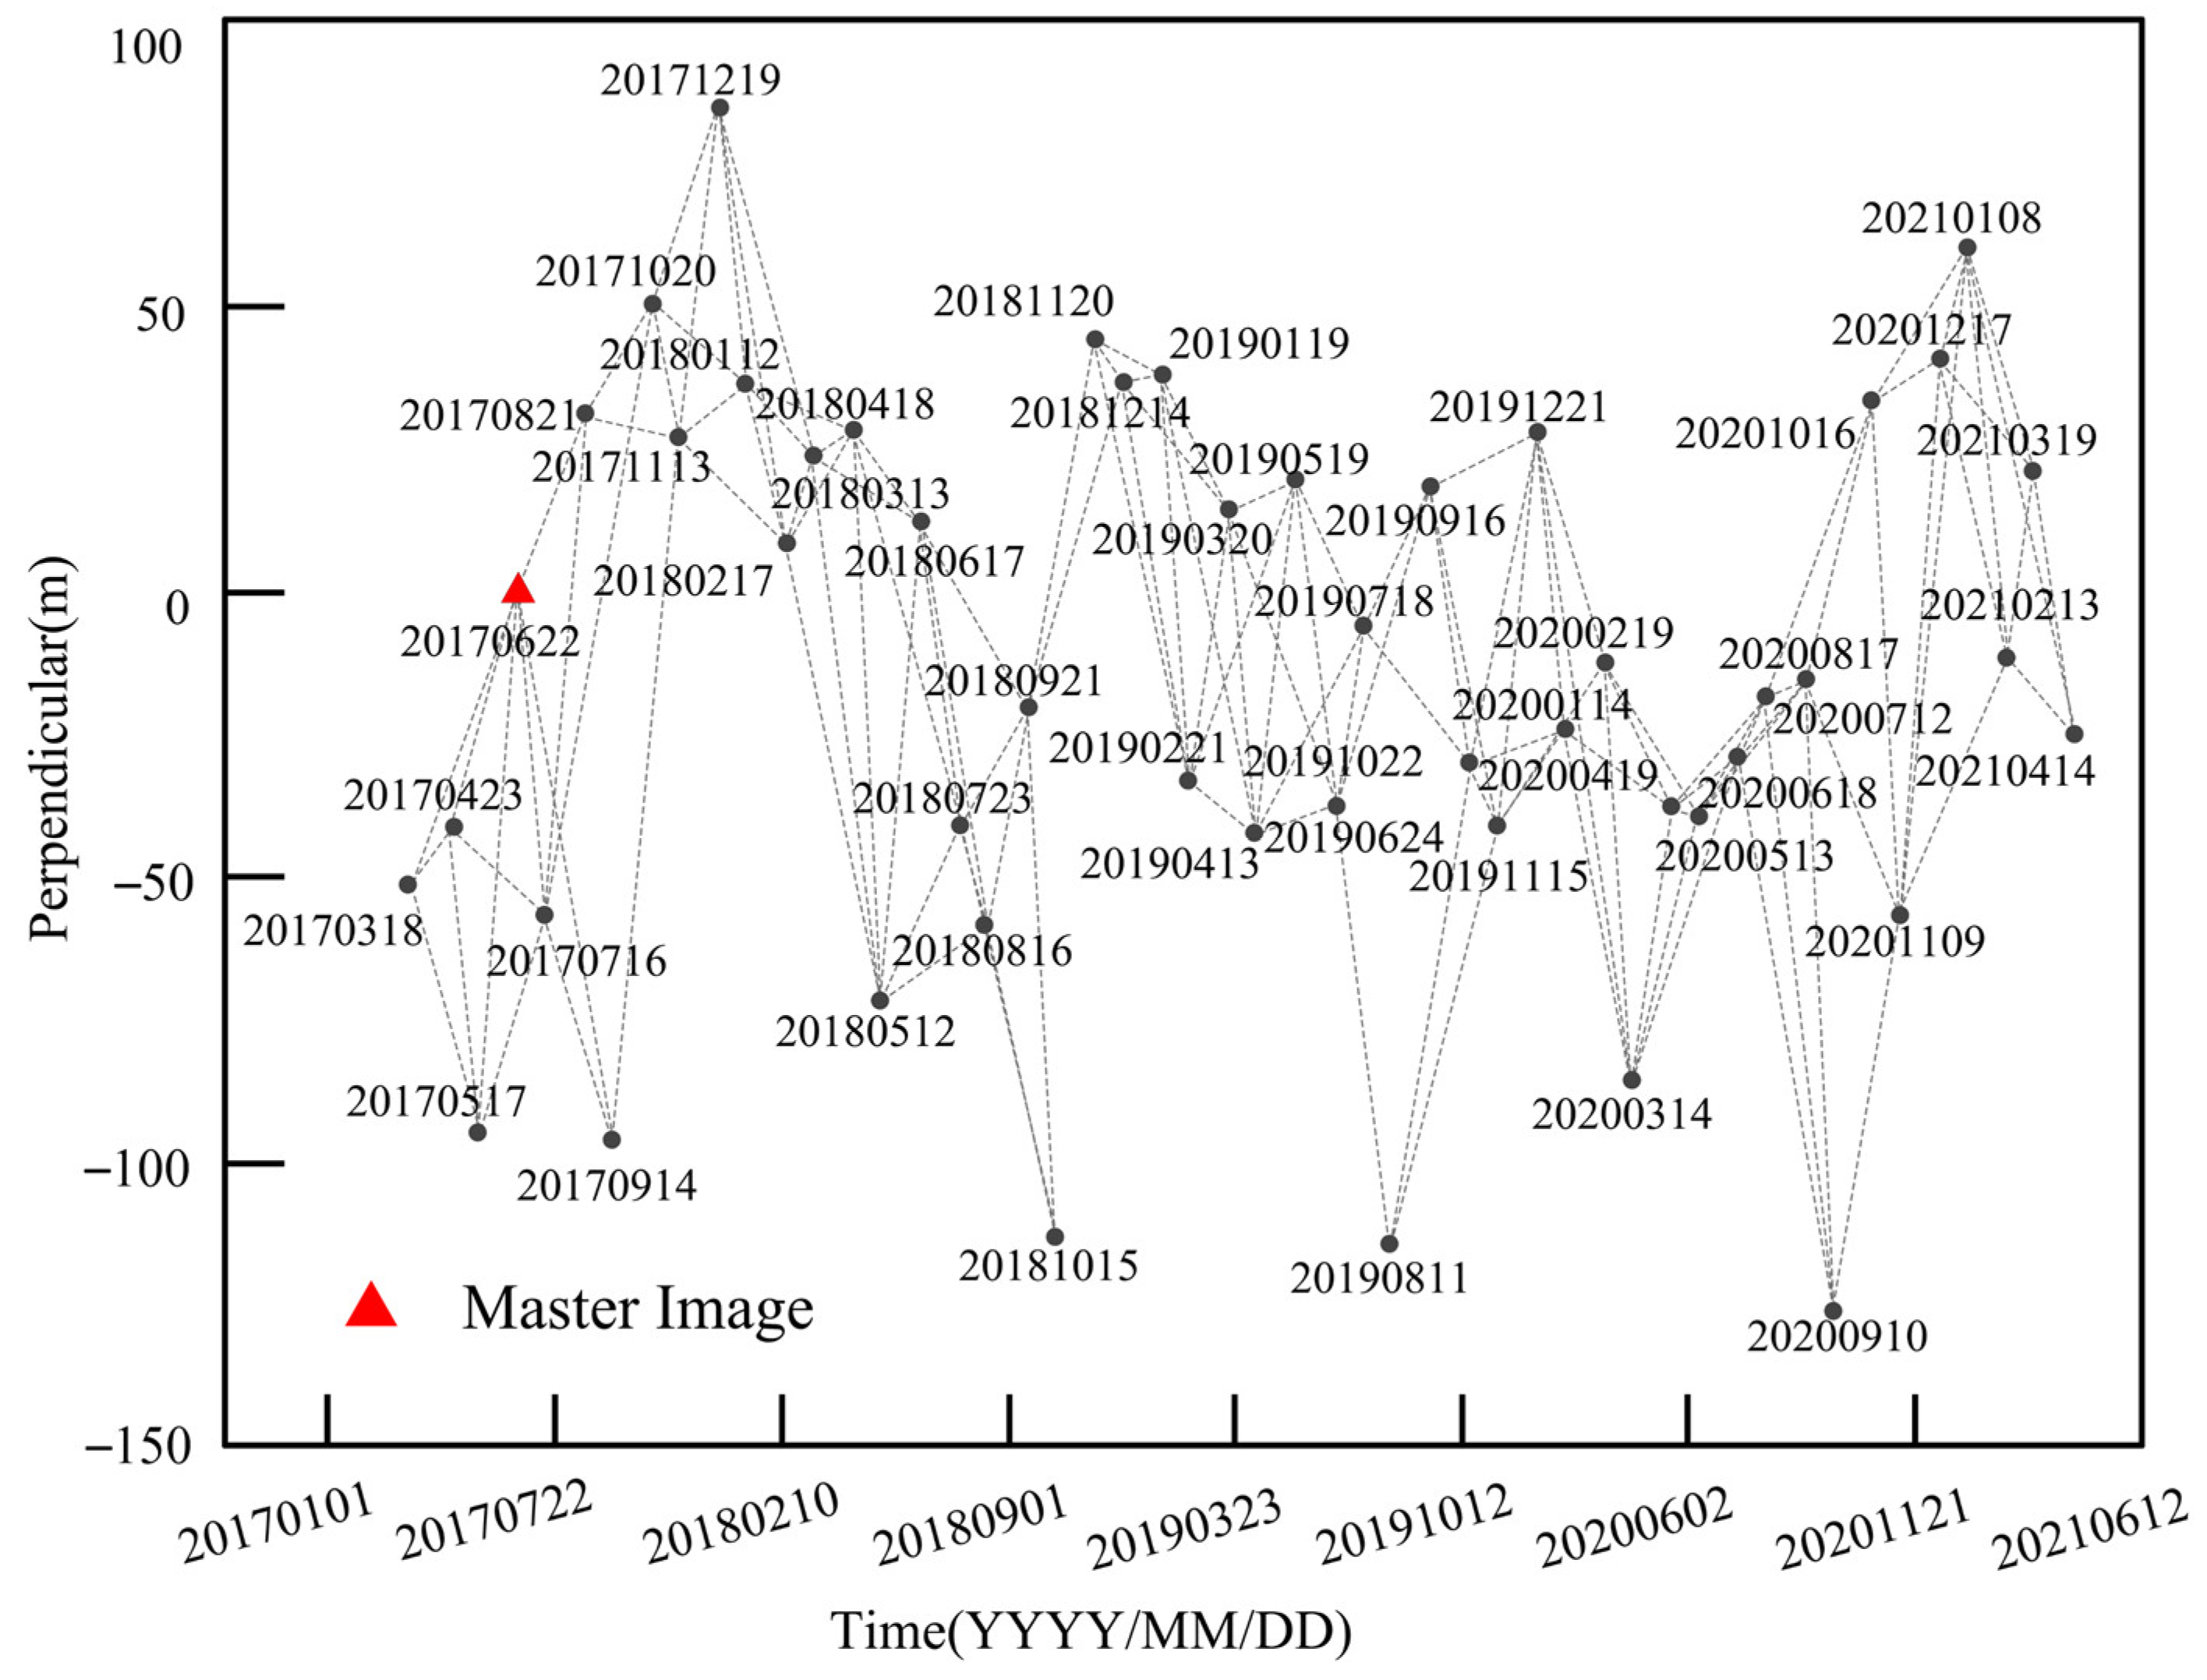
2.2. Data Source
3. Methodology
3.1. SBAS-InSAR Technology
3.2. Terzaghi Consolidation Theory
4. Results and Discussion
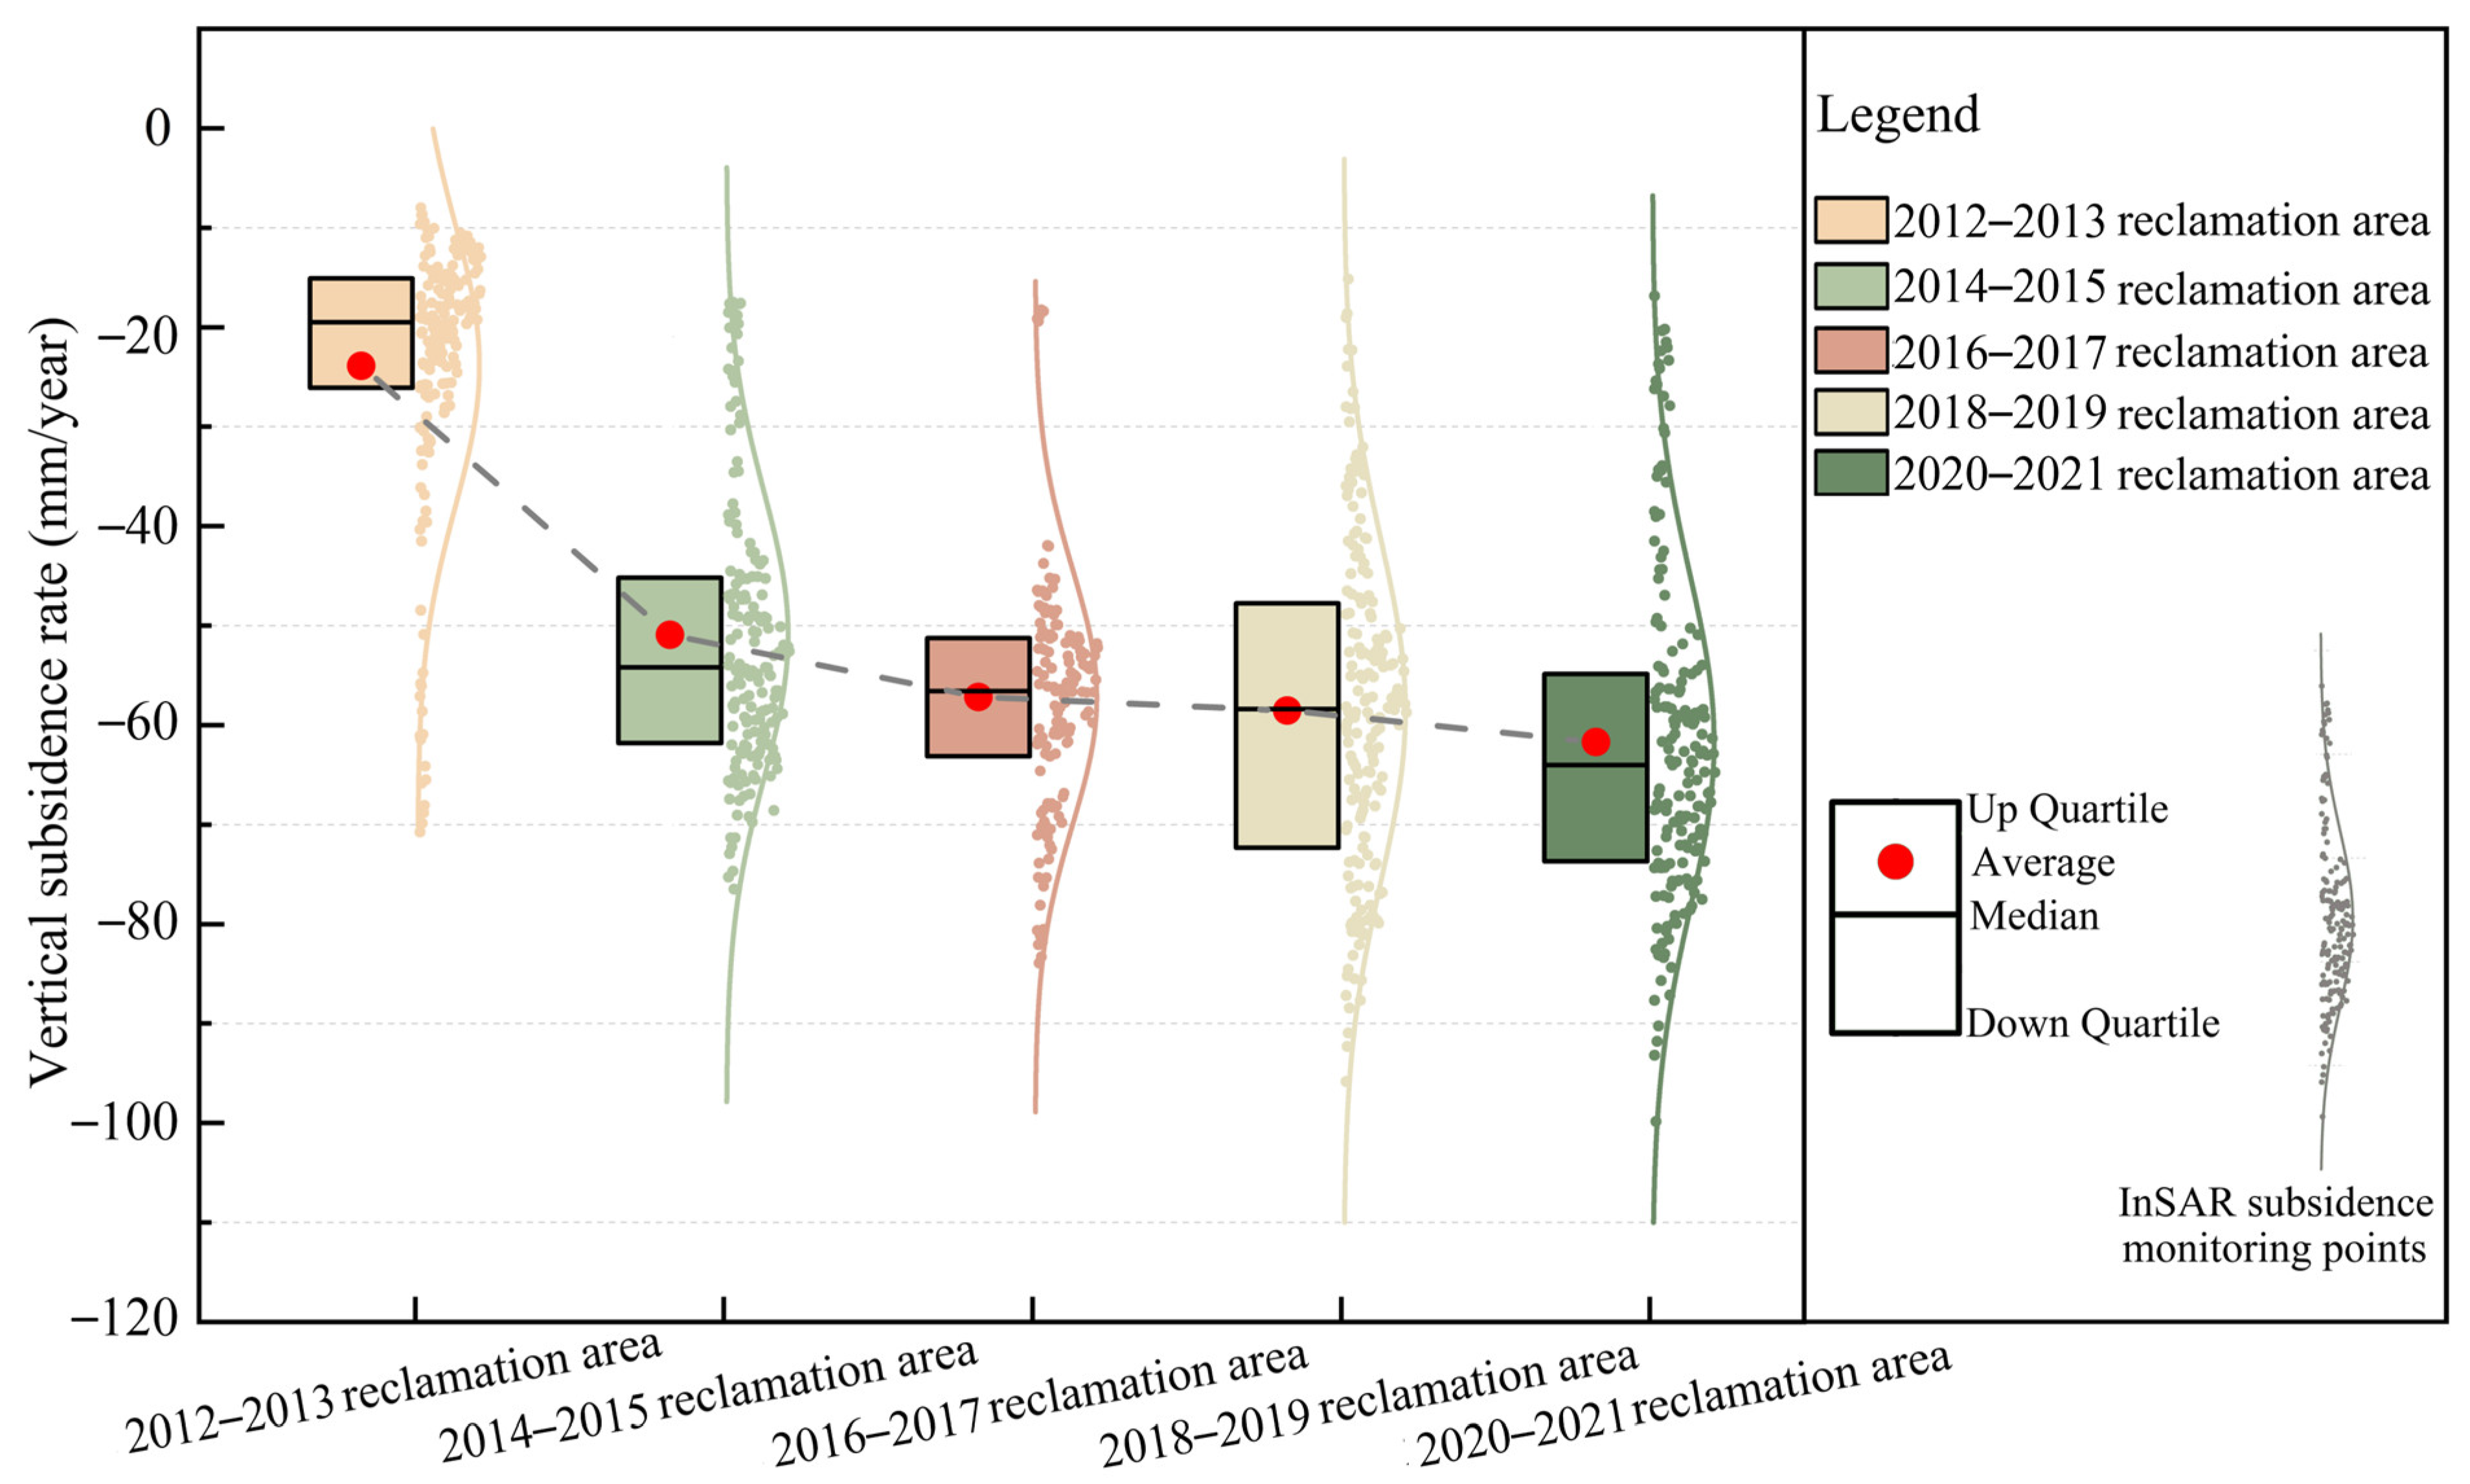
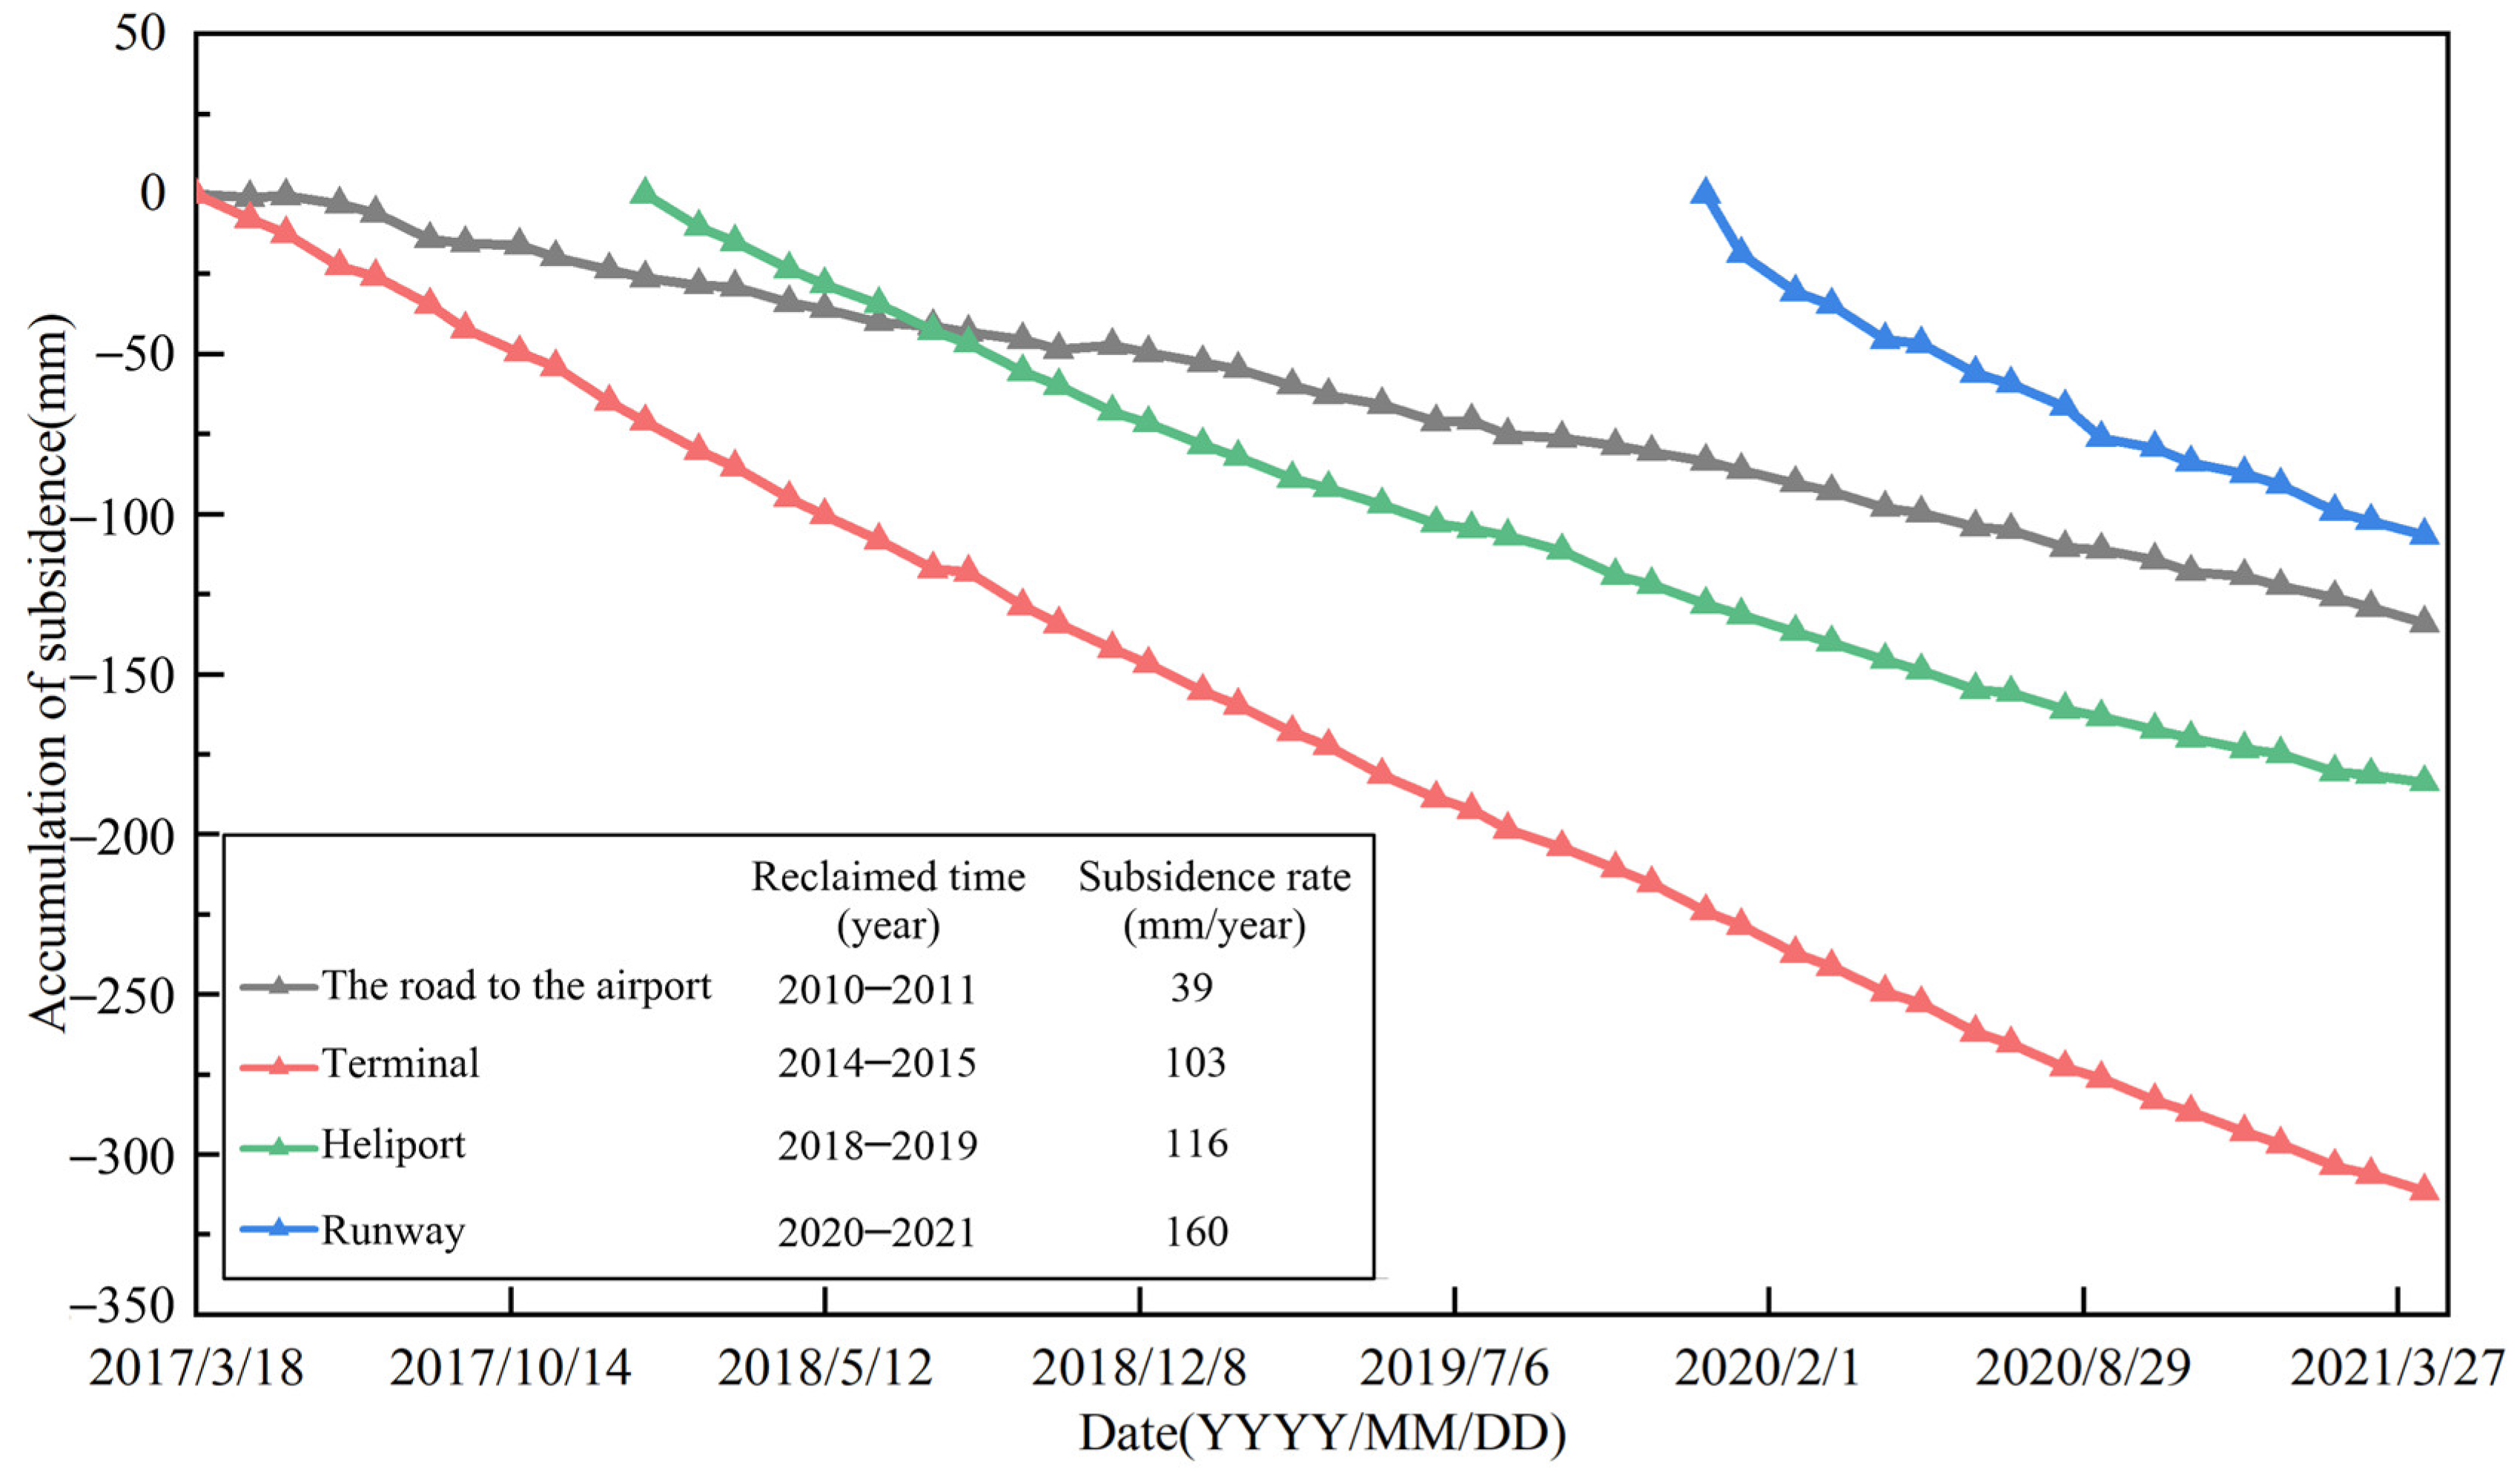
4.1. Analysis of Spatial and Temporal Subsidence Characteristics of DJBIA
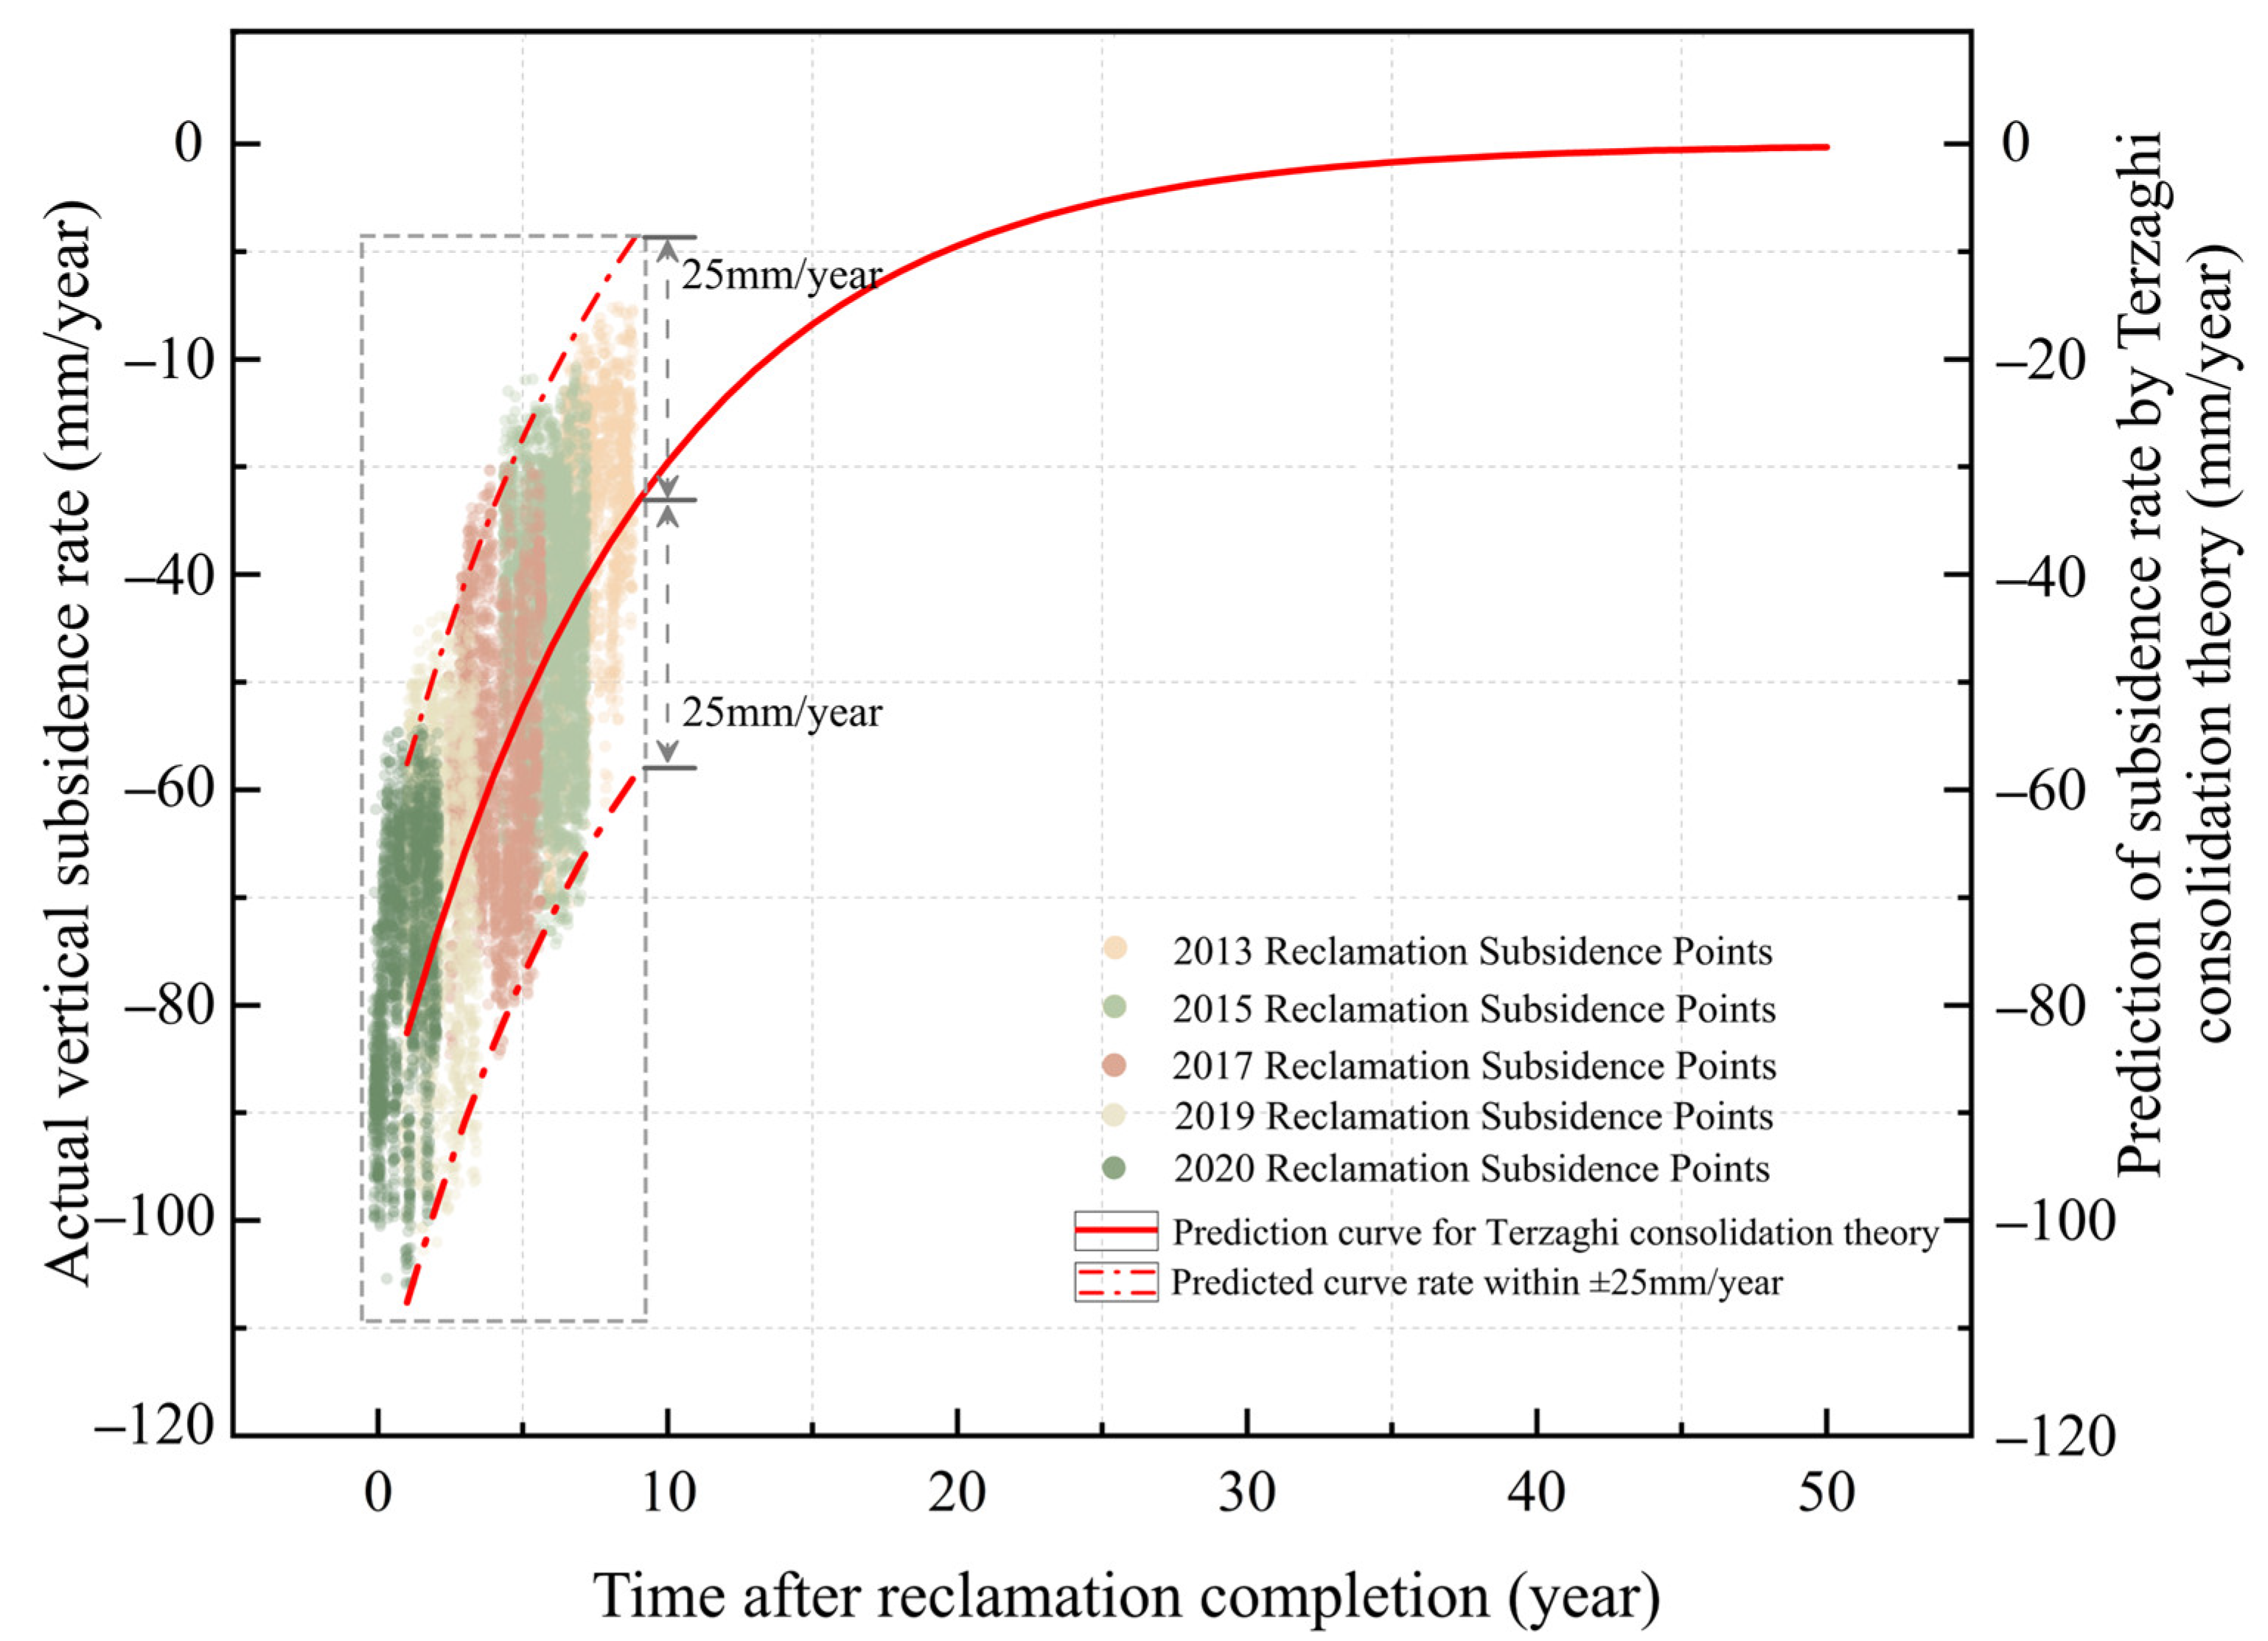
4.2. Terzaghi Consolidation Theory Verification and Prediction
5. Conclusions
Author Contributions
Funding
Conflicts of Interest
References
- Cigna, F.; Tapete, D. Urban growth and land subsidence: Multi-decadal investigation using human settlement data and satellite InSAR in Morelia, Mexico. Sci. Total Environ. 2022, 811, 152211. [Google Scholar] [CrossRef] [PubMed]
- Ma, P.; Wang, W.; Zhang, B.; Wang, J.; Shi, G.; Huang, G.; Chen, F.; Jiang, L.; Lin, H. Remotely sensing large- and small-scale ground subsidence: A case study of the Guangdong–Hong Kong–Macao Greater Bay Area of China. Remote Sens. Environ. 2019, 232, 111282. [Google Scholar] [CrossRef]
- Hu, L.; Dai, K.; Xing, C.; Li, Z.; Tomás, R.; Clark, B.; Shi, X.; Chen, M.; Zhang, R.; Qiu, Q.; et al. Land subsidence in Beijing and its relationship with geological faults revealed by Sentinel-1 InSAR observations. Int. J. Appl. Earth Obs. Geoinf. 2019, 82, 101886. [Google Scholar] [CrossRef]
- Aimaiti, Y.; Yamazaki, F.; Liu, W. Multi-Sensor InSAR Analysis of Progressive Land Subsidence over the Coastal City of Urayasu, Japan. Remote Sens. 2018, 10, 1304. [Google Scholar] [CrossRef] [Green Version]
- Marshall, C.; Large, D.J.; Athab, A.; Evers, S.L.; Sowter, A.; Marsh, S.; Sjögersten, S. Monitoring tropical peat related settlement using ISBAS InSAR, Kuala Lumpur International Airport (KLIA). Eng. Geol. 2018, 244, 57–65. [Google Scholar] [CrossRef]
- Jiang, H.; Balz, T.; Cigna, F.; Tapete, D. Land Subsidence in Wuhan Revealed Using a Non-Linear PSInSAR Approach with Long Time Series of COSMO-SkyMed SAR Data. Remote Sens. 2021, 13, 1256. [Google Scholar] [CrossRef]
- Ramirez, R.A.; Lee, G.-J.; Choi, S.-K.; Kwon, T.-H.; Kim, Y.-C.; Ryu, H.-H.; Kim, S.; Bae, B.; Hyun, C. Monitoring of construction-induced urban ground deformations using Sentinel-1 PS-InSAR: The case study of tunneling in Dangjin, Korea. Int. J. Appl. Earth Obs. Geoinf. 2022, 108, 102721. [Google Scholar] [CrossRef]
- Dai, K.; Li, Z.; Xu, Q.; Bürgmann, R.; Milledge, D.G.; Tomas, R.; Fan, X.; Zhao, C.; Liu, X.; Peng, J.; et al. Entering the era of earth observation-based landslide warning systems: A novel and exciting framework. IEEE Geosci. Remote Sens. Mag. 2020, 8, 136–153. [Google Scholar] [CrossRef] [Green Version]
- Shi, X.; Yang, C.; Zhang, L.; Jiang, H.; Liao, M.; Zhang, L.; Liu, X. Mapping and characterizing displacements of active loess slopes along the upstream Yellow River with multi-temporal InSAR datasets. Sci. Total Environ. 2019, 674, 200–210. [Google Scholar] [CrossRef]
- Fan, X.; Xu, Q.; Scaringi, G.; Dai, L.; Li, W.; Dong, X.; Zhu, X.; Pei, X.; Dai, K.; Havenith, H.-B. Failure mechanism and kinematics of the deadly June 24th 2017 Xinmo landslide, Maoxian, Sichuan, China. Landslides 2017, 14, 2129–2146. [Google Scholar] [CrossRef]
- Tomás, R.; Li, Z.; Lopez-Sanchez, J.M.; Liu, P.; Singleton, A. Using wavelet tools to analyse seasonal variations from InSAR time-series data: A case study of the Huangtupo landslide. Landslides 2016, 13, 437–450. [Google Scholar] [CrossRef] [Green Version]
- Wasowski, J.; Bovenga, F. Investigating landslides and unstable slopes with satellite Multi Temporal Interferometry: Current issues and future perspectives. Eng. Geol. 2014, 174, 103–138. [Google Scholar] [CrossRef]
- Jiang, Y.; Liao, M.; Wang, H.; Zhang, L.; Balz, T. Deformation Monitoring and Analysis of the Geological Environment of Pudong International Airport with Persistent Scatterer SAR Interferometry. Remote Sens. 2016, 8, 1021. [Google Scholar] [CrossRef] [Green Version]
- Jiang, L.; Lin, H. Integrated analysis of SAR interferometric and geological data for investigating long-term reclamation settlement of Chek Lap Kok Airport, Hong Kong. Eng. Geol. 2010, 110, 77–92. [Google Scholar] [CrossRef]
- Pepe, A.; Bonano, M.; Zhao, Q.; Yang, T.; Wang, H. The Use of C-/X-Band Time-Gapped SAR Data and Geotechnical Models for the Study of Shanghai’s Ocean-Reclaimed Lands through the SBAS-DInSAR Technique. Remote Sens. 2016, 8, 911. [Google Scholar] [CrossRef] [Green Version]
- Zhao, Q.; Lin, H.; Gao, W.; Zebker, H.A.; Chen, A.; Yeung, K. InSAR detection of residual settlement of an ocean reclamation engineering project: A case study of Hong Kong International Airport. J. Oceanogr. 2011, 67, 415–426. [Google Scholar] [CrossRef]
- Dai, K.; Shi, X.; Gou, J.; Hu, L.; Chen, M.; Zhao, L.; Dong, X.; Li, Z. Diagnosing Subsidence Geohazard at Beijing Capital International Airport, from High-Resolution SAR Interferometry. Sustainability 2020, 12, 2269. [Google Scholar] [CrossRef] [Green Version]
- Gao, M.; Gong, H.; Chen, B.; Zhou, C.; Chen, W.; Liang, Y.; Shi, M.; Si, Y. InSAR time-series investigation of long-term ground displacement at Beijing Capital International Airport, China. Tectonophysics 2016, 691, 271–281. [Google Scholar] [CrossRef]
- Lu, M.; Deng, K.; Feng, G.; Li, K.; Xiong, Z.; Wang, Y.; He, S. Reclaimed-Airport Surface-Deformation Monitoring by Improved Permanent-Scatterer Interferometric Synthetic-Aperture Radar: A Case Study of Shenzhen Bao’an International Airport, China. Photogramm. Eng. Remote Sens. 2021, 87, 105–116. [Google Scholar]
- Liu, P.; Chen, X.; Li, Z.; Zhang, Z.; Xu, J.; Feng, W.; Wang, C.; Hu, Z.; Tu, W.; Li, H. Resolving surface displacements in Shenzhen of China from time series InSAR. Remote Sens. 2018, 10, 1162. [Google Scholar] [CrossRef] [Green Version]
- Susaki, J.; Tsujino, M.; Anahara, T. Fusion of different frequency SAR images for DInSAR-based land subsidence monitoring. In Proceedings of the 2017 IEEE International Geoscience and Remote Sensing Symposium (IGARSS), Worth, TX, USA, 23–28 July 2017; pp. 945–948. [Google Scholar]
- Ito, H.; Susaki, J.; Anahara, T. Integrating multi-temporal sar images and gps data to monitor three-dimensional land subsidence. ISPRS Ann. Photogramm. Remote Sens. Spat. Inf. Sci. 2019, 4, 9–16. [Google Scholar] [CrossRef] [Green Version]
- Ito, H.; Susaki, J. Land subsidence monitoring by integrating PSI and Geodetic Deformation Measurements. In Proceedings of the IGARSS 2018-2018 IEEE International Geoscience and Remote Sensing Symposium, Valencia, Spain, 23–27 July 2018; pp. 498–501. [Google Scholar]
- Xu, B.; Feng, G.; Li, Z.; Wang, Q.; Wang, C.; Xie, R. Coastal Subsidence Monitoring Associated with Land Reclamation Using the Point Target Based SBAS-InSAR Method: A Case Study of Shenzhen, China. Remote Sens. 2016, 8, 652. [Google Scholar] [CrossRef] [Green Version]
- Zhuo, G.; Dai, K.; Huang, H.; Li, S.; Shi, X.; Feng, Y.; Li, T.; Dong, X.; Deng, J. Evaluating Potential Ground Subsidence Geo-Hazard of Xiamen Xiang’an New Airport on Reclaimed Land by SAR Interferometry. Sustainability 2020, 12, 6991. [Google Scholar] [CrossRef]
- Liu, X.; Zhao, C.; Zhang, Q.; Yang, C.; Zhang, J. Characterizing and monitoring ground settlement of marine reclamation land of Xiamen New Airport, China with Sentinel-1 SAR Datasets. Remote Sens. 2019, 11, 585. [Google Scholar] [CrossRef] [Green Version]
- Guo, F.; Zhang, H.; Fan, Y.; Zhu, P.; Wang, S.; Lu, X.; Jin, Y. Environment. Detection and evaluation of a ventilation path in a mountainous city for a sea breeze: The case of Dalian. Build. Environ. 2018, 145, 177–195. [Google Scholar] [CrossRef]
- Zhu, X. Research on Risk Assessment and Disaster Mitigation of Geological Disasters in Dalian. Master’s Thesis, Liaoning Normal University, Liaoning, China, 2021. [Google Scholar]
- China Civil Aviation Website. Dong Zhiyi went to Dalian New Airport for Research. Available online: http://www.caacnews.com.cn/1/1/201911/t20191107_1285087_wap.html. (accessed on 1 April 2022).
- Bai, W. Improved Algorithm and Application of One-Dimensional Consolidation Theory for Soft Soil Foundation. Master’s Thesis, Xi’an University of Technology, Xi’an, China, 2020. [Google Scholar]
- Deng, H. Study on Reclamation and Soft Soil Characteristics in Dalian Coastal Zone. Master’s Thesis, Jilin University, Jilin, China, 2020. [Google Scholar]
- Cong, B. Calculation of the Foundation Settlement of Soft Clay at the DaLian Offshore Airport. Master’s Thesis, Dalian University of Technology, Dalian, China, 2013. [Google Scholar]
- Lanari, R.; Mora, O.; Manunta, M.; Mallorquí, J.J.; Berardino, P.; Sansosti, E. A small-baseline approach for investigating defor-mations on full-resolution differential SAR interferograms. IEEE Trans. Geosci. Remote Sens. 2004, 42, 1377–1386. [Google Scholar] [CrossRef]
- Osmanoğlu, B.; Sunar, F.; Wdowinski, S.; Cabral-Cano, E. Time series analysis of InSAR data: Methods and trends. ISPRS J. Photogramm. Remote Sens. 2016, 115, 90–102. [Google Scholar] [CrossRef]
- Costantini, M. A novel phase unwrapping method based on network programming. IEEE Trans. Geosci. Remote Sens. 1998, 36, 813–821. [Google Scholar] [CrossRef]
- Hooper, A.; Zebker, H.A. Phase unwrapping in three dimensions with application to InSAR time series. JOSA A 2007, 24, 2737–2747. [Google Scholar] [CrossRef] [Green Version]
- Chen, G.; Zhang, Y.; Zeng, R.; Yang, Z.; Chen, X.; Zhao, F.; Meng, X. Detection of land subsidence associated with land crea-tion and rapid urbanization in the chinese loess plateau using time series insar: A case study of Lanzhou new district. Remote Sens. 2018, 10, 270. [Google Scholar] [CrossRef] [Green Version]
- Liao, M.; Wang, T. Time Series InSAR Technology and Application; Science Press: Beijing, China, 2014; pp. 83–86. [Google Scholar]
- Goldstein, R.M.; Werner, C. Radar interferogram filtering for geophysical applications. Geophys. Res. Lett. 1998, 25, 4035–4038. [Google Scholar] [CrossRef] [Green Version]
- Dai, K.; Liu, G.; Li, Z.; Li, T.; Yu, B.; Wang, X.; Singleton, A. Extracting Vertical Displacement Rates in Shanghai (China) with Multi-Platform SAR Images. Remote Sens. 2015, 7, 9542–9562. [Google Scholar] [CrossRef] [Green Version]
- Wang, H.; Wright, T.J.; Yu, Y.; Lin, H.; Jiang, L.; Li, C.; Qiu, G. InSAR reveals coastal subsidence in the Pearl River Delta, China. Geophys. J. Int. 2012, 191, 1119–1128. [Google Scholar] [CrossRef] [Green Version]
- Huang, J.; Griffiths, D.J.G. One-dimensional consolidation theories for layered soil and coupled and uncoupled solutions by the finite-element method. Geotechnique 2010, 60, 709–713. [Google Scholar] [CrossRef] [Green Version]
- Chen, Z. Soil Mechanics; Tsinghua University Press: Beijing, China, 2006; pp. 100–160. [Google Scholar]
- Barnes, G. Soil Mechanics: Principles and Practice; Macmillan International Higher Education: London, UK, 2016. [Google Scholar]
- Terzaghi, K.; Peck, R.B.; Mesri, G. Soil Mechanics in Engineering Practice; John Wiley and Sons: Hoboken, NJ, USA, 1996; pp. 1–592. [Google Scholar]
- Dai, K.; Liu, G.; Yu, B.; Jia, H.; Ma, D.; Wang, X. Detecting Subsidence along a High Speed Railway by Ultrashort Baseline TCP-InSAR with High Resolution Images. Int. Arch. Photogramm. Remote Sens. Spat. Inf. Sci. 2013, XL-7/W2, 61–65. [Google Scholar] [CrossRef] [Green Version]
- Wang, Q.; Zhang, Y.; Dong, Y.; Fu, Y. Subsidence monitoring of land reclamation area dike project based on time-series InSAR technology. Highway 2021, 66, 276–281. [Google Scholar]
- Tosen, R.; Pickles, A.; Jaros, M. Assessment of differential settlement at Chek Lap Kok Airport reclamation site. In Proceedings of the a Seminar on the Geotechnical Aspects of the Airport Core Projects; Hong Kong Institution of Civil Engineers: Hong Kong, China, 1998. [Google Scholar]
- Plant, G.W.; Covil, C.S.; Hughes, R.A. Site Preparation for the New Hong Kong International Airport; Thomas Telford: London, UK, 1998. [Google Scholar]
- Pickles, A.; Tosen, R. Settlement of Reclaimed Land for the New Hong Kong International Airport. Proc. Inst. Civ. Eng.-Geotech. Eng. 1998, 131, 191–209. [Google Scholar] [CrossRef]


| Parameter | Value | |
|---|---|---|
| Satellite | Sentinel-1A | Sentinel-1B |
| Orbit | Ascending | Descending |
| Azimuth/Range pixel spacing | 13.99 m/2.33 m | 13.99 m/2.33 m |
| Radar wavelength | 5.6 cm | 5.6 cm |
| Polarization mode | VV | VV |
| Revisit period | 12 d | 12 d |
| The angle of incidence | 39.2° | 39.1° |
| Temporal coverage | 2017.03–2021.04 | 2019.12.20–2021.04.13 |
| Number of images | 50 | 15 |
| Parameter | Corresponding Values |
|---|---|
| Permeability Coefficient | α = 0.0342 m/year |
| Initial Porosity Ratio | = 0.806 |
| Compression Coefficient | β = 3.52 × 10⁻⁴ |
| Water Gravity | = 10.101 kN/ |
| Maximum Drainage Distance | H = −19.4 m |
| Solidification Stress | Γ = 250 kPa |
| Coefficient of Consolidation | C = 17.3959 |
| Profile Name | Reclamation Time (Year) | Maximum Subsidence Rate (mm/Year) | ||
|---|---|---|---|---|
| AA′ | 2012–2013 | 2014–2015 | −91 | −97 |
| BB′ | 2014–2015 | −93 | ||
| CC′ | 2016–2017 | −99 | ||
| DD′ | 2018–2019 | 2014–2015 | −108 | −98 |
Publisher’s Note: MDPI stays neutral with regard to jurisdictional claims in published maps and institutional affiliations. |
© 2022 by the authors. Licensee MDPI, Basel, Switzerland. This article is an open access article distributed under the terms and conditions of the Creative Commons Attribution (CC BY) license (https://creativecommons.org/licenses/by/4.0/).
Share and Cite
Shi, X.; Chen, C.; Dai, K.; Deng, J.; Wen, N.; Yin, Y.; Dong, X. Monitoring and Predicting the Subsidence of Dalian Jinzhou Bay International Airport, China by Integrating InSAR Observation and Terzaghi Consolidation Theory. Remote Sens. 2022, 14, 2332. https://doi.org/10.3390/rs14102332
Shi X, Chen C, Dai K, Deng J, Wen N, Yin Y, Dong X. Monitoring and Predicting the Subsidence of Dalian Jinzhou Bay International Airport, China by Integrating InSAR Observation and Terzaghi Consolidation Theory. Remote Sensing. 2022; 14(10):2332. https://doi.org/10.3390/rs14102332
Chicago/Turabian StyleShi, Xianlin, Chen Chen, Keren Dai, Jin Deng, Ningling Wen, Yong Yin, and Xiujun Dong. 2022. "Monitoring and Predicting the Subsidence of Dalian Jinzhou Bay International Airport, China by Integrating InSAR Observation and Terzaghi Consolidation Theory" Remote Sensing 14, no. 10: 2332. https://doi.org/10.3390/rs14102332
APA StyleShi, X., Chen, C., Dai, K., Deng, J., Wen, N., Yin, Y., & Dong, X. (2022). Monitoring and Predicting the Subsidence of Dalian Jinzhou Bay International Airport, China by Integrating InSAR Observation and Terzaghi Consolidation Theory. Remote Sensing, 14(10), 2332. https://doi.org/10.3390/rs14102332