Article

Comparative Analysis of the Sensitivity of SAR Data in C and L Bands for the Detection of Irrigation Events

1
INRAE, UMR TETIS, University of Montpellier, AgroParisTech, 500 Rue François Breton, CEDEX 5, 34093 Montpellier, France
2
University of Montpellier, G-EAU Unit, AgroParisTech, CIRAD, INRAE, Institut Agro, IRD, Domaine du Merle, 13300 Salon de Provence, France
3
CESBIO, Université de Toulouse, CNES/CNRS/INRAE/IRD/UPS, 18 Av. Edouard Belin, bpi 2801, CEDEX 9, 31401 Toulouse, France
*
Author to whom correspondence should be addressed.
Remote Sens. 2022, 14(10), 2312; https://doi.org/10.3390/rs14102312
Submission received: 16 March 2022 / Revised: 22 April 2022 / Accepted: 2 May 2022 / Published: 11 May 2022

Abstract

:
Comprehensive knowledge about irrigation timing is crucial for water resource management. This paper presents a comparative analysis between C- and L-band Synthetic Aperture Radar (SAR) data for the detection of irrigation events. The analysis was performed using C-band time series data derived from the Sentinel-1 (S1) satellite and two L-band images from the PALSAR-2 (ALOS-2) sensor acquired over irrigated grassland plots in the Crau plain of southeast France. The S1 C-band time series was first analyzed as a function of rainfall and irrigation events. The backscattering coefficients in both the L and C bands were then compared to the time difference between the date of the acquired SAR image and the date of the last irrigation event occurring before the SAR acquisition ( Δ t ). Sensitivity analysis was performed for 2 classes of the Normalized Difference Vegetation Index (NDVI 0.7 and NDVI > 0.7 ). The main results showed that when the vegetation is moderately developed (NDVI 0.7 ), the C-band temporal variation remains sensitive to the soil moisture dynamics and the irrigation events could be detected. The C-VV signal decreases due to the drying out of the soil when the time difference between the S1 image and irrigation event increases. For well-developed vegetation cover (NDVI > 0.7 ), the C-band sensitivity to irrigation events becomes dependent on the crop type. For well-developed Gramineae grass with longs stalks and seedheads, the C band shows no correlation with Δ t due to the absence of the soil contribution in the backscattered signal, contrary to the legume grass type, where the C band shows a good correspondence between C-VV and Δ t for NDVI > 0.7. In contrast, analysis of the L-band backscattering coefficient shows that the L band remains sensitive to the soil moisture regardless of the vegetation cover development and the vegetation characteristics, thus being more suitable for irrigation detection than the C band. The L-HH signal over Gramineae grass or legume grass types shows the same decreasing pattern with the increase in Δ t , regardless of the NDVI-values, presenting a decrease in soil moisture with time and thus high sensitivity of the radar signal to soil parameters. Finally, the co-polarizations for both the C and L bands (L-HH and C-VV) tend to be more adequate for irrigation detection than the HV cross-polarization, as they show higher sensitivity to soil moisture values.

1. Introduction

With the need to fulfill increasing food demands due to an increase in the population, global agricultural intensification is increasing resource use, especially water [1]. Overexploitation of fresh water by the agricultural sector is causing rapid degradation of water resources, especially in arid and semi-arid areas [2,3]. Significant expansion of irrigated areas has necessitated the implementation and mobilization of different irrigation strategies to achieve sustainable water management and thus water savings [4,5]. The first step towards mobilizing such strategies is to obtain a robust knowledge of the distribution of irrigation and the irrigation frequency at global and local scales.
Remote sensing offers a powerful tool for irrigation monitoring at large scales. Several studies have shown the significant potential of remote sensing data to quantify both the extent of irrigation and irrigation timing using passive optical [6,7,8,9] and/or active radar remote sensing data [10,11,12,13,14]. While optical remote sensing provides the difference in the spectral signature between irrigated and rain-fed crops caused by higher levels of photosynthesis and biomass for irrigated plots, SAR (Synthetic Aperture Radar) data provides the wetness information of the soil (soil moisture), which varies between irrigated and rain-fed plots.
SAR data has been recently exploited to detect irrigation events, especially with the availability of the free and open-access C-band SAR images offered by the Sentinel-1 (S1) constellation. The SAR backscattering signal is known to be sensitive to the soil water content [15,16,17,18,19,20], which makes it possible to detect the wetness information of the soil following an irrigation episode. The increase in the soil moisture caused by an irrigation episode is the key element that links the use of SAR data for irrigation mapping and the detection of irrigation events. After an irrigation episode, the surface soil moisture of the irrigated plot increases, which could eventually lead to an increase in the SAR backscattering signal. Gao et al. [11], Bazzi et al. [21,22], and Pageot et al. [12] reported that irrigated plots could be distinguished from rain-fed plots using the S1 time series data. While Gao et al. [11] used statistical metrics, such as the mean, variance, and correlation length, derived from the S1 time series in a random forest (RF) classifier to map irrigated areas, Bazzi et al. [21] tested the direct use of the S1 time series in RF and convolutional neural network (CNN) to classify irrigated and rain-fed plots. Bazzi et al. [21] reported that the use of the S1 time series in a CNN classifier provided the best accuracy for irrigation mapping, reaching 94%.
In a recent study, Bazzi et al. [10] proposed a decision tree algorithm for irrigation events’ detection called the IEDM (Irrigation Event Detection Model), which mainly relies on the change in the SAR backscattering signal at the plot scale between consecutive S1 C-band images at a 6-day revisit time. They separated the increase in the SAR signal due to an irrigation event from the increase in the SAR backscattered signal due to rainfall by using rainfall information derived from the grid-scale (10 km × 10 km) SAR backscattered signal [23]. IEDM was validated over irrigated grassland plots, where Bazzi et al. [14] conveyed that irrigation events using the IEDM could be detected with an accuracy that reached 76%.
The detection of irrigation events based on the increase in the SAR backscattering signal between two consecutive SAR acquisitions (increase in soil moisture) is challenging. Indeed, the capability of detecting irrigation events using SAR data also depends on the vegetation characteristics, such as the phenology phase or vegetation density, and the characteristics of the SAR satellite, such as the wavelength and the revisit time. First, the revisit time of the SAR satellite could constrain the detection of an irrigation event when using SAR data. This constraint is mainly due to the drying out of the soil, a few days after the irrigation event, caused by evaporation, especially during the summer season with high temperatures. Thus, when the SAR image is acquired a long time after the irrigation episode, detection of the irrigation event becomes difficult since at the time of SAR acquisition, the soil will have approximately the same soil moisture value as before the irrigation event. Bazzi et al. [14] analyzed the effect of the time difference between the irrigation date and the SAR acquisition date on the detection of irrigation events using C-band SAR data. They concluded that over low vegetation cover with an NDVI (Normalized Difference Vegetation Index) less than 0.7, an irrigation event could be detected until 3 days after the irrigation episode. Beyond three days, the irrigation detection becomes difficult, and the possibility of detecting irrigation events decreases. For developed vegetation cover with NDVI greater than 0.7, they showed that it becomes difficult to detect the irrigation event 1 day after irrigation. These results are also in line with the findings of El Hajj et al. [19], who showed that it becomes difficult to detect irrigation events using X-band SAR data (wavelength ~3 cm) 3 days after irrigation. Therefore, the detection of irrigation events based on the variation in the soil moisture values between consecutive SAR images requires a high revisit time of the SAR satellite to guarantee the detection of all irrigation events.
In addition to the revisit time of SAR sensors, other factors may also limit the detection of irrigation events. In fact, the penetration of the SAR signal in the vegetation canopy depends on the vegetation cover characteristics (e.g., structure, biomass, vegetation water content, vegetation density, etc.) and the SAR wavelength [24]. For certain crops, such as wheat and barley, several studies have demonstrated that the sensitivity of the C-band SAR signal (wavelength ~6 cm) to soil moisture is negligible in the presence of very well-developed vegetation cover [25,26,27,28,29,30]. El Hajj et al. [25] showed that for wheat crops, the C-band S1-SAR signal in VV and VH polarizations becomes insensitive to surface soil moisture for LAI (Leaf Area Index) values beyond 1.5 m2/m2 (vegetation height of approximately 70 cm). Baghdadi et al. [18] also showed that over grassland, the sensitivity of the SAR signal in the C band (VV polarization) decreases from 0.11 dB/vol.% for low biomass values to 0.05 dB/vol.% when the biomass is greater than 1 kg/m2 (NDVI~0.7). Therefore, in the presence of certain well-developed vegetation cover, the detection of irrigation events based on the soil moisture variation between consecutive S1 images could be difficult due to the absence of the soil contribution (particularly soil moisture) in the SAR backscattering signal.
To overcome the difficulty in detecting irrigation events in certain well-developed vegetation cover, SAR data with longer wavelengths and thus higher penetration capabilities, such as L-band (wavelength ~24 cm) data, could be required. In addition to their low revisit time, reaching sometimes, at best, one image per month, the actual L-band SAR satellites (e.g., PALSAR-2) are not yet in free and open-access modes, which limits their use for the detection of irrigation events. This low revisit time makes current L-band operating satellites inadequate for monitoring the change in soil moisture values caused by irrigation events. With future planned L-band satellites, such as the NISAR (NASA-ISRO SAR, planned to be launched in 2024) and Tandem-L (German Aerospace Center, planned to be launched in the end of 2022), some of which are planned to be open access, the use of L-band data for irrigation event detection may be more achievable.
With the aim of detecting irrigation events at the plot scale using SAR data, the objective of this paper was to compare the sensitivity of the S1 C-band and the ALOS-2 L-band images for irrigation detection over well-developed vegetation cover. A sensitivity analysis of both the C and L bands for irrigation detection was performed over irrigated grassland plots during two growth cycles. The first growth cycle is rich in grasses (coarse hay) and resembles wheat crops. The second grass cycle is richer in legumes with a lesser percentage of coarse hay. Section 2 presents a description of the study site, dataset, and the analysis approach. Section 3 compares the potential of the C and L bands to detect irrigation events. Finally, Section 4 presents the main conclusions.

2. Materials and Methods

2.1. Study Site

The study site is located on the Crau plain of southeast France, centered on 5°1′E, 43°38′N (Figure 1) and characterized by a Mediterranean climate with a dry summer. For the year 2019, the maximum temperature varied between 6 °C in winter and 43 °C in summer, with the average temperature in the summer reaching 25 °C according to a local meteorological station located 6 km away from the study site. At the study site, 45 irrigated grassland plots oriented toward hay production were examined in this study. A gravity irrigation system was used over the studied plots. Between March and October 2019, 848 irrigation episodes were registered over the 45 plots, where the exact date of the end of each irrigation episode at each plot was recorded. The irrigation frequency at each plot was approximately 1 irrigation every 10 days. The average surface area of the plots was 2.9 ha. The shape of the grassland plots was generally elongated, with the length significantly larger than the width. The average length of the plots was 334 m and the average width was 86 m.
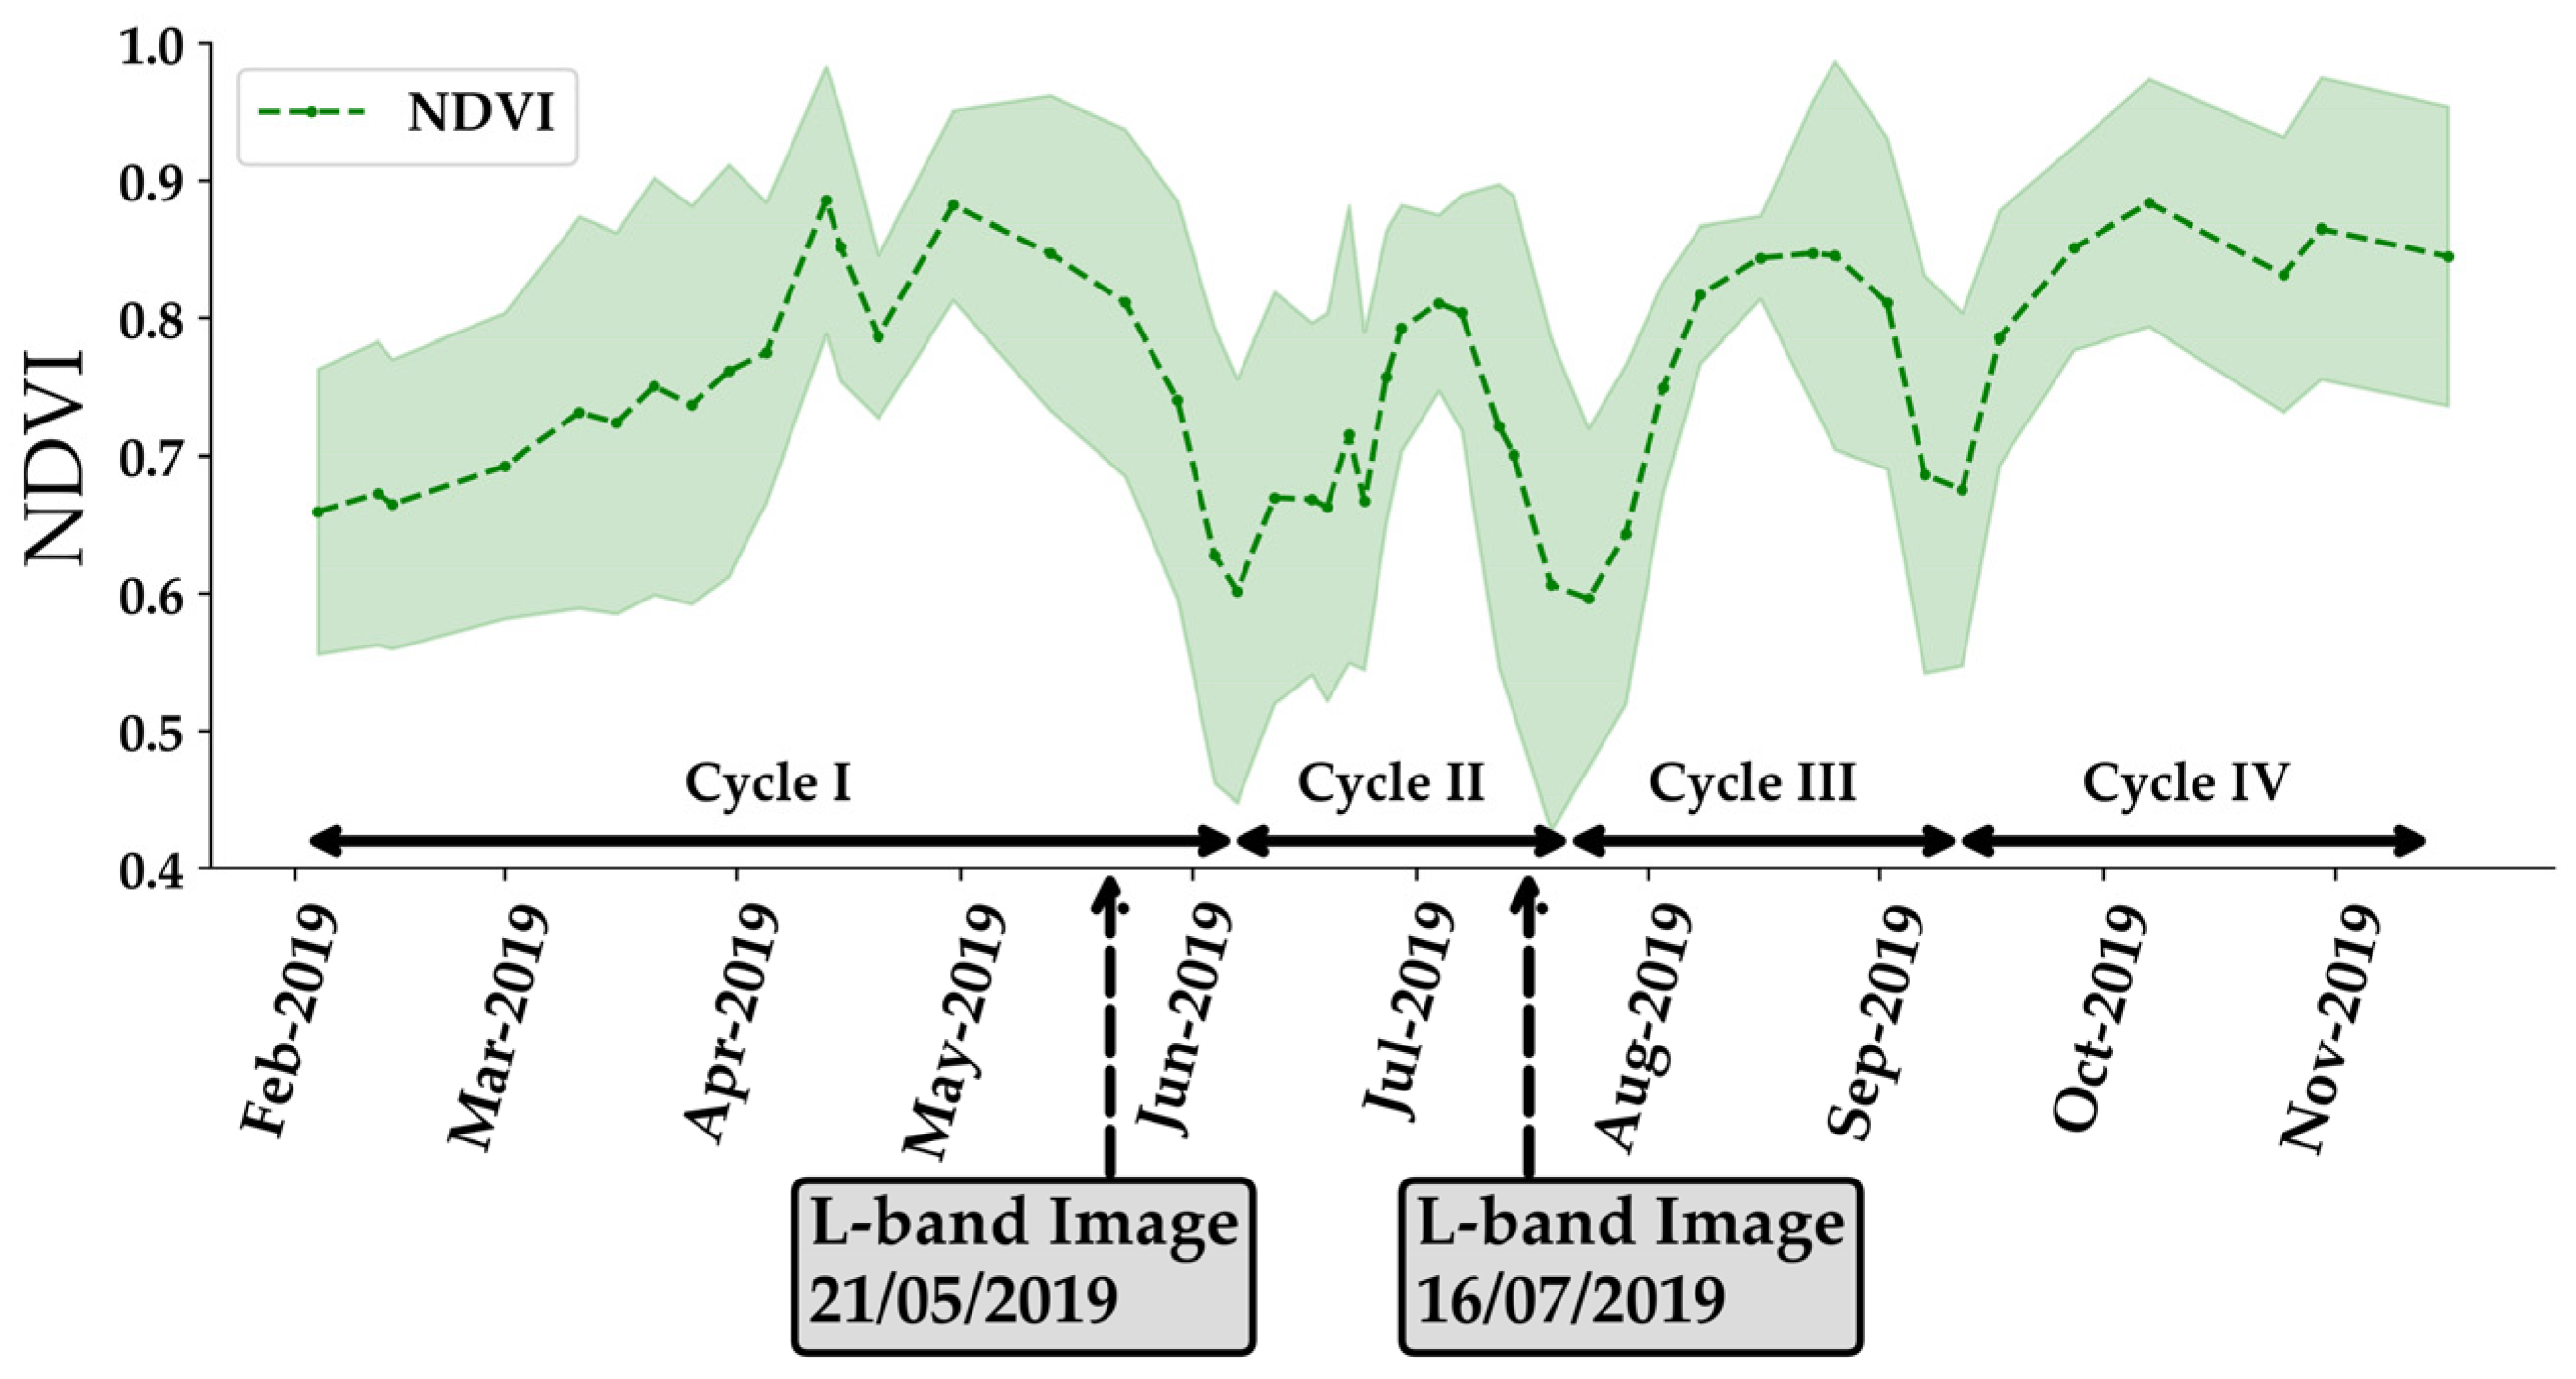
Each plot showed 4 grass growth cycles between February and November 2019 as shown by the average Sentinel-2 NDVI temporal profile of the 45 reference plots in Figure 2. The green shaded envelope of Figure 2 represents the standard deviation of the average NDVI for the 45 plots. The first growth cycle, which is usually harvested in May, is rich in grasses (60–65% coarse hay of the Gramineae family) with longs stalks and it is particularly suitable for feeding horses and fattening cattle. The proportion of grasses with long stalks decreases in the second cycle to obtain a balanced biomass proportion between grasses and legumes. The grasses proportion decreases more with the increase in the legume proportion in the third cycle. The fourth cycle is usually grazed by sheep and harvested when the temperature reaches its minimum record in the year [31]. In each growth cycle, all the reference plots have the same grass type corresponding to that growth cycle (all plots are either coarse hay or legume).
Generally, the soil moisture of the grassland plots varied between 10 and 45 vol.% over the year according to in situ measurements [19]. Before an irrigation event, the soil moisture was usually between 15 and 20 vol.%. However, after an irrigation event, the soil moisture value reached about 45 vol.%. It generally decreased to approximately 25 vol.% 2 days after irrigation in the summer and 4 days after irrigation in the spring season [19].
Figure 3 shows representative photos, captured from the study site, of the actual vegetation cover during cycle I (coarse hay) and cycle II (legumes). Figure 3a,b represent moderately and well-developed coarse hay in April and May, respectively. For the moderately developed coarse hay, the vegetation height was about 0.5 m whereas for the well-developed coarse hay, the vegetation height was about 1.13 m. The well-developed coarse hay (Figure 3b) shows the longs stalks with seedheads (inflorescence). Figure 3c shows a non-developed legume grass of cycle II (June 2019) with a vegetation height reaching 0.25 m.

2.2. ALOS-2 Images

Two SAR images in L band (wavelength ~24 cm) acquired by the PALSAR-2 (Phase Array Synthetic Aperture Radar) on board of the ALOS-2 satellite were analyzed in this study (the only images available between March and September 2019). The first image was acquired on 21 May 2019 at 23 h UTC (in growth cycle I) whereas the second image was acquired on 16 July 2019 at 23 h UTC (in growth cycle II) (Figure 2). In May 2019 (first ALOS-2 image on 21 May), the average temperature reached 16 °C, with the average maximum temperature reaching 22 °C. In July 2019 (second ALOS-2 image on 16 July), the average temperature was 26 °C, with the maximum average temperature reaching 33 °C. Thus, due to higher temperatures in summer, the evaporation rate was more important in cycle II than that in cycle I. The evaporation rate in summer reached approximately 10 mm/day [19,31].
The 2 ALOS-2 images are in dual polarizations (HH and HV) with a spatial resolution of 6 m × 6 m. The incidence angle of the 2 images over the study site is 34°. A radiometric calibration of the two ALOS-2 images was performed using the Sentinel Application Platform (SNAP) in order to convert the digital number of the images into backscattering coefficients in linear units. For each L-band image, the backscattering coefficient for each plot ( σ L 0 ) was calculated by averaging all the σ L 0 values of all pixels within the plots in both HH and HV polarizations. To avoid border pixels, the plots were buffered interiorly by 6 m (1 pixel).

2.3. Sentinel-1 Images

In total, 100 GRD (Ground Range Detection) C-band S1 images in VV and VH polarization were downloaded via the Copernicus website (https://scihub.copernicus.eu/dhus/#/home, accessed on 2 May 2022) over the study site for the period between March and the end of July 2019 covering the first 2 growth cycles. The S1 images between March and July were only considered since the two ALOS-2 acquisitions occurred in May and July, thus coinciding only with the first two growth cycles.
S1 images were acquired in both ascending (A) and descending (D) acquisition modes corresponding to 4 different S1 orbits. In total, 2 descending acquisitions, designated by D1 and D2, were acquired in the morning (~05 h00 UTC) whereas 2 ascending acquisitions, designated by A1 and A2, were acquired in the afternoon (~17 h00 UTC). Each orbit acquisition, D1, D2, A1, and A2, provided a time series of 25 S1 images at a 6 day revisit time at an incidence angle θ of 32°, 42°, 44°, and 35° over the study site, respectively. The morning D2 image was acquired 24 h after the S1-D1 image. The S1-A1 image was then acquired 12 h after the S1-D2 image followed finally by the S1-A2 acquired 24 h after the S1-A1. For each S1 image, the backscattering coefficient for each plot in the C band ( σ C 0 ) was calculated by averaging all the σ C 0 values of all pixels within the plots for both VV and VH polarizations. To avoid border pixels, the plots were buffered interiorly by 10 m (one pixel). Images corresponding to the same orbit acquisition provided the time series of the σ C 0 values at a 6 day revisit time.

2.4. Sentinel-2 Images

In total, 30 Sentinel-2 (S2) images captured by S2A and S2B satellites were downloaded for the period between March and July 2019 over the study site via the French Land Data Center (Theia). The downloaded S2 images are ortho-rectified images corrected for atmospheric effects using the MAJA (MACCS ATCOR Joint Algorithm) processor for atmospheric correction. The frequency of the S2 images varies between 5 to 10 days according to the cloud cover. The S2 images were used to calculate the NDVI images. The NDVI was used as a vegetation descriptor in the analysis of the σ C 0 and σ L 0 sensitivities’ for the detection of irrigation events.

2.5. Approach Description

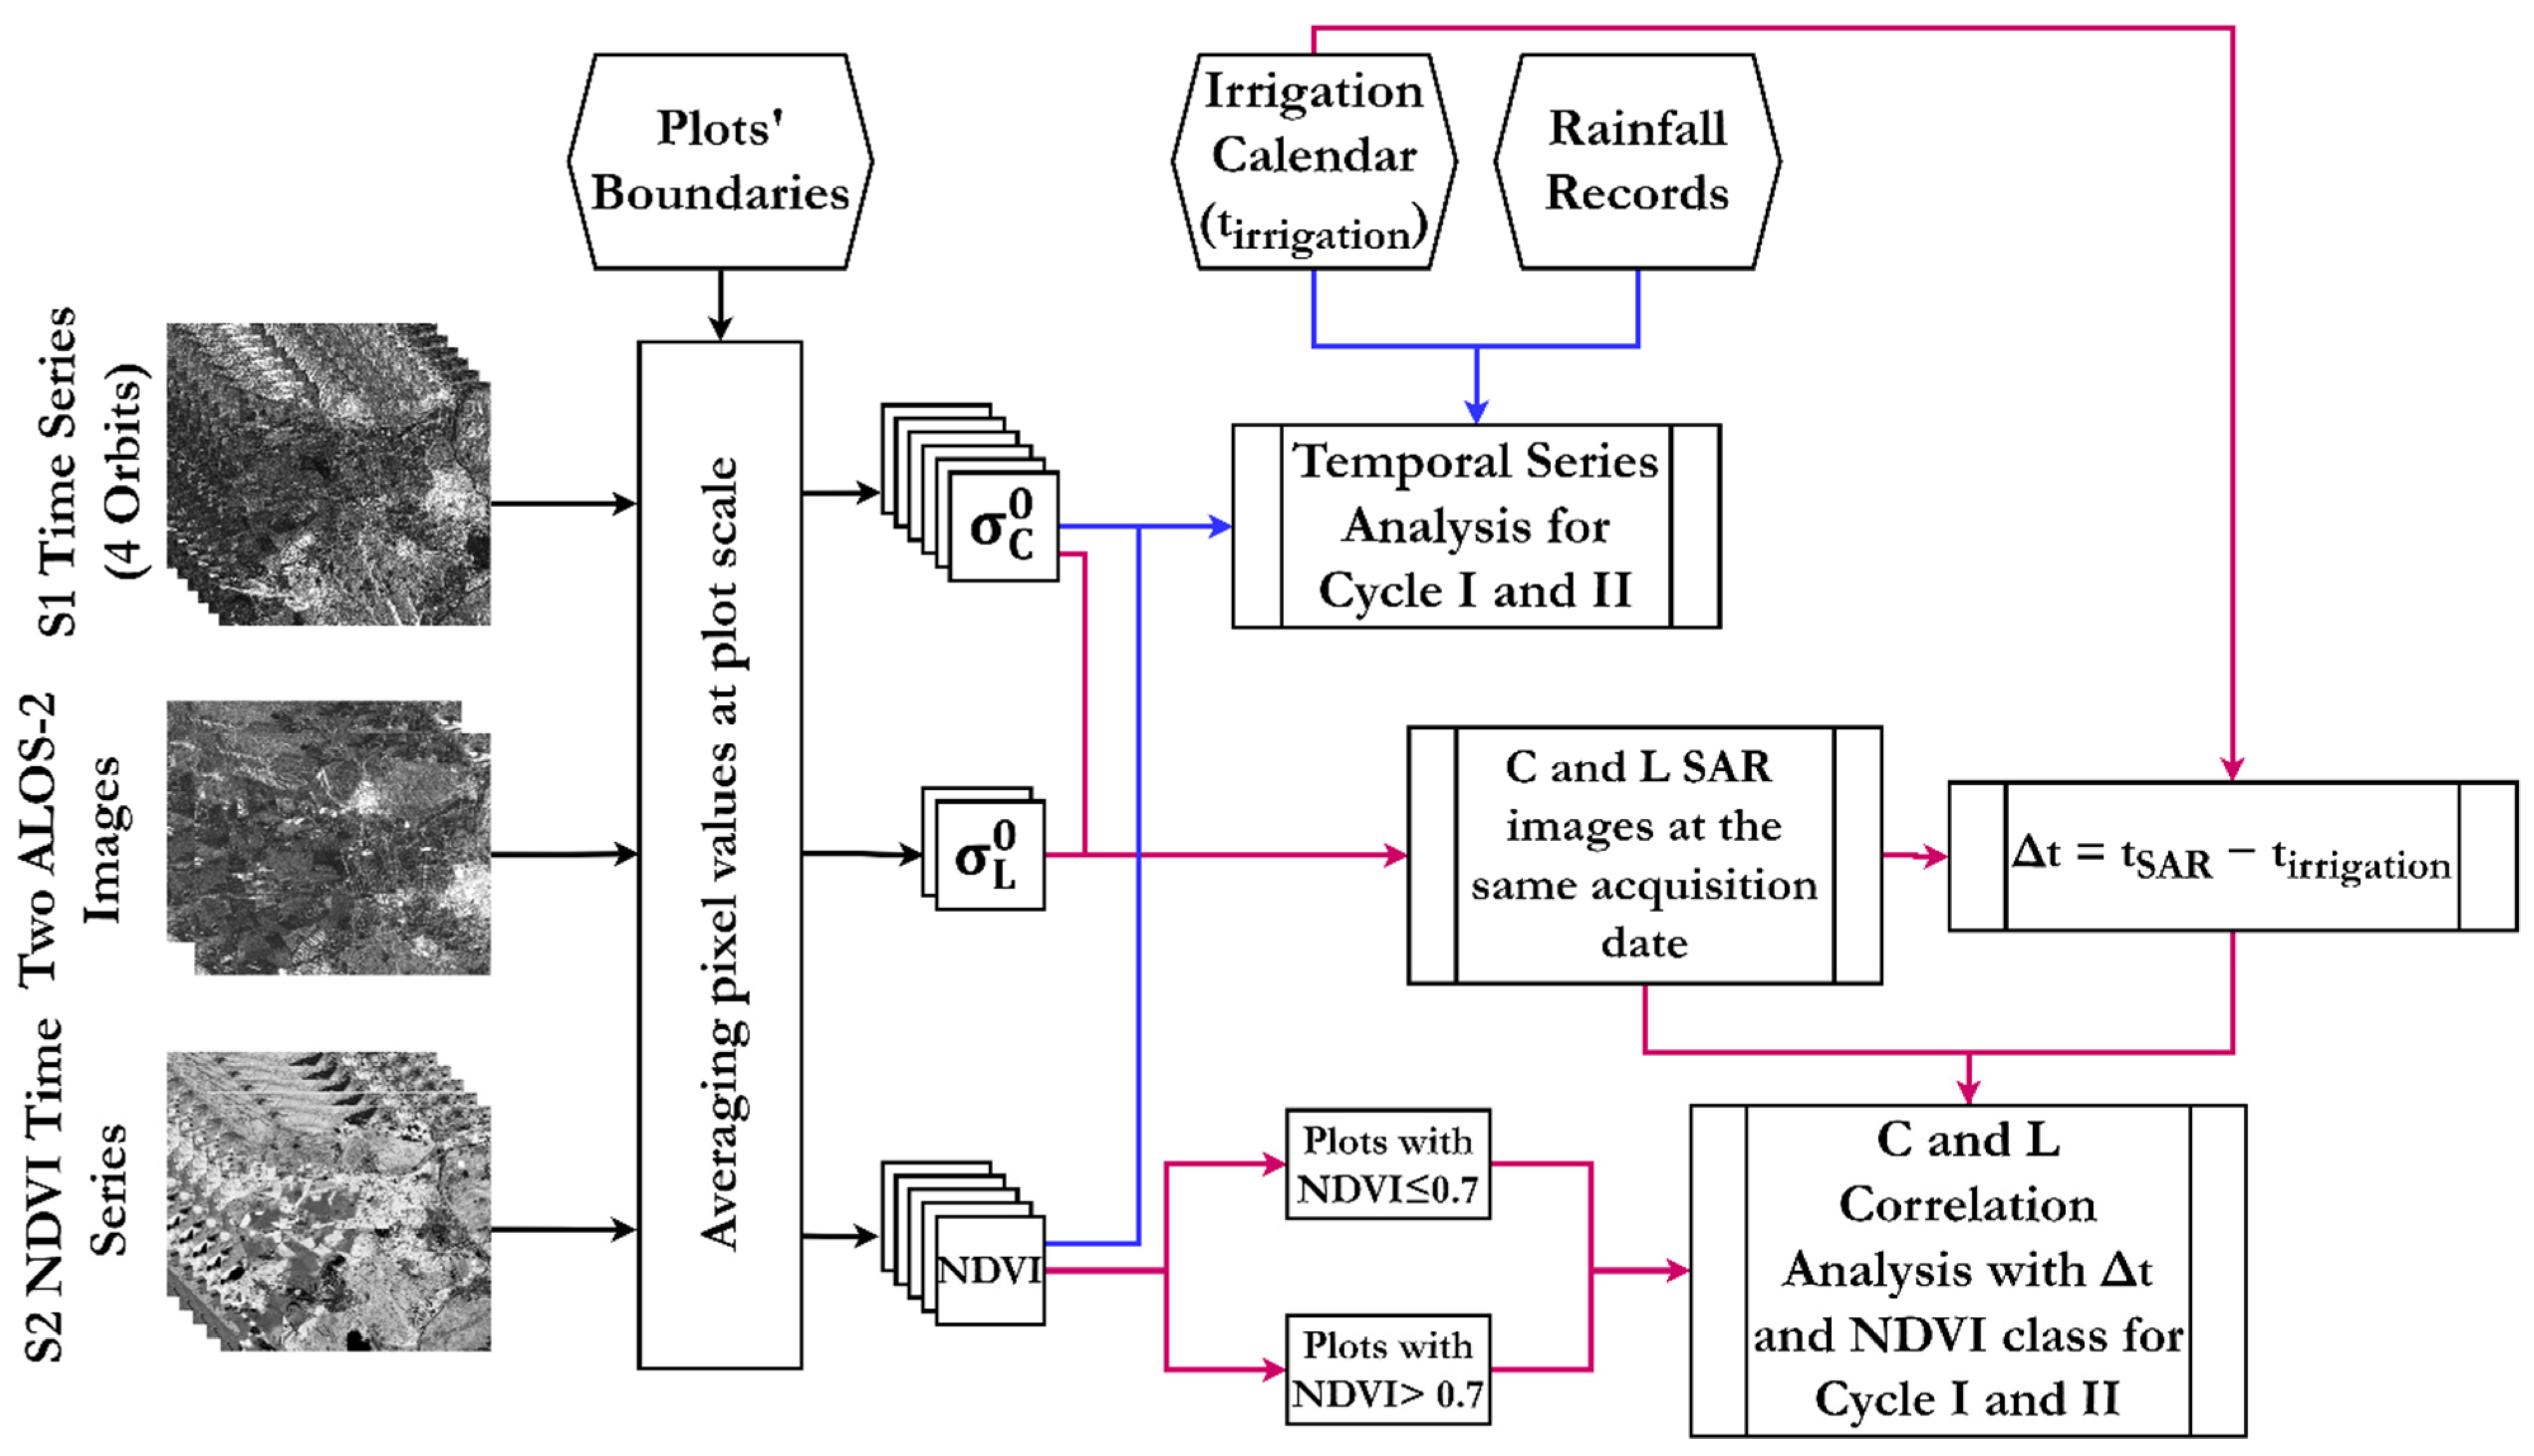
Figure 4 represents a flow chart describing the performed comparative analysis. In this study, comparative analysis between the C and L bands was performed for the first and second cycles because the available L-band images were acquired only during cycle I (one image on 21/05/2019) and cycle II (one image on 16/07/2019). As explained in Section 2.1, cycle I and II have different biomass proportions of coarse hay and legumes, with the proportion of coarse hay being higher in cycle I than that in cycle II. However, cycle II is a good representative of the remaining cycles III and IV since they have approximately the same biomass proportion of the grass species. Thus, cycle I and II permit analysis of the C and L bands’ sensitivities to irrigation as a function of the grass species.
First, we studied the response of the S1 backscattering signal ( σ C 0 ) following irrigation events in order to understand the capability of detecting irrigation events using the C-band SAR data. We examined, for the reference 45 grassland plots, the temporal evolution of σ C 0 according to rainfall and irrigation events. The analysis was carried out for the four acquisition modes (D1, D2, A1, and A2) and for the first and second growth cycles (Figure 4).
Then, we analyzed the potential of the C and L bands for the detection of irrigation events using the S1 images and the ALOS-2 images both acquired on the same day. The comparison was performed over the growth cycles I (spring season) and II (summer season). To do so, we calculated for each of the 45 reference plots the difference in days between the SAR (S1 and ALOS-2) acquisition date t SAR (21/05/2019 and 16/07/2019) and the date of the last irrigation that occurred on each plot ( Δ t = t SAR t irrigation ) (Figure 4). Then, we analyzed the relationship between σ C 0 and σ L 0 as a function of the Δ t values for both cycles separately. The parameter Δ t is considered to be a proxy measure of the soil moisture state. In fact, irrigation that occurred on the same day as an SAR image ( Δ t = 0 ) would result in a high backscattering value due to the high soil moisture caused by irrigation. On the other hand, a long time with no irrigation (high Δ t values) would cause drying out of the soil and would logically result in low SAR backscattering values, especially in the absence of rainfall events. C- and L-band correlation analysis with Δ t in cycle I and II was carried out for 2 NDVI classes (NDVI 0.7 and NDVI > 0.7). The threshold value of 0.7 is a good representative of undeveloped to moderately developed vegetation cover (NDVI 0.7) and well-developed vegetation cover (NDVI 0.7). Indeed, this categorization of the two NDVI classes was adopted and verified in several similar studies dealing with SAR penetration analysis in different types of vegetation, such as wheat, maize, and grassland [19,25,26].

3. Results

3.1. C and L Bands’ Behaviors in Growth Cycle I

3.1.1. Temporal Analysis of σ C 0

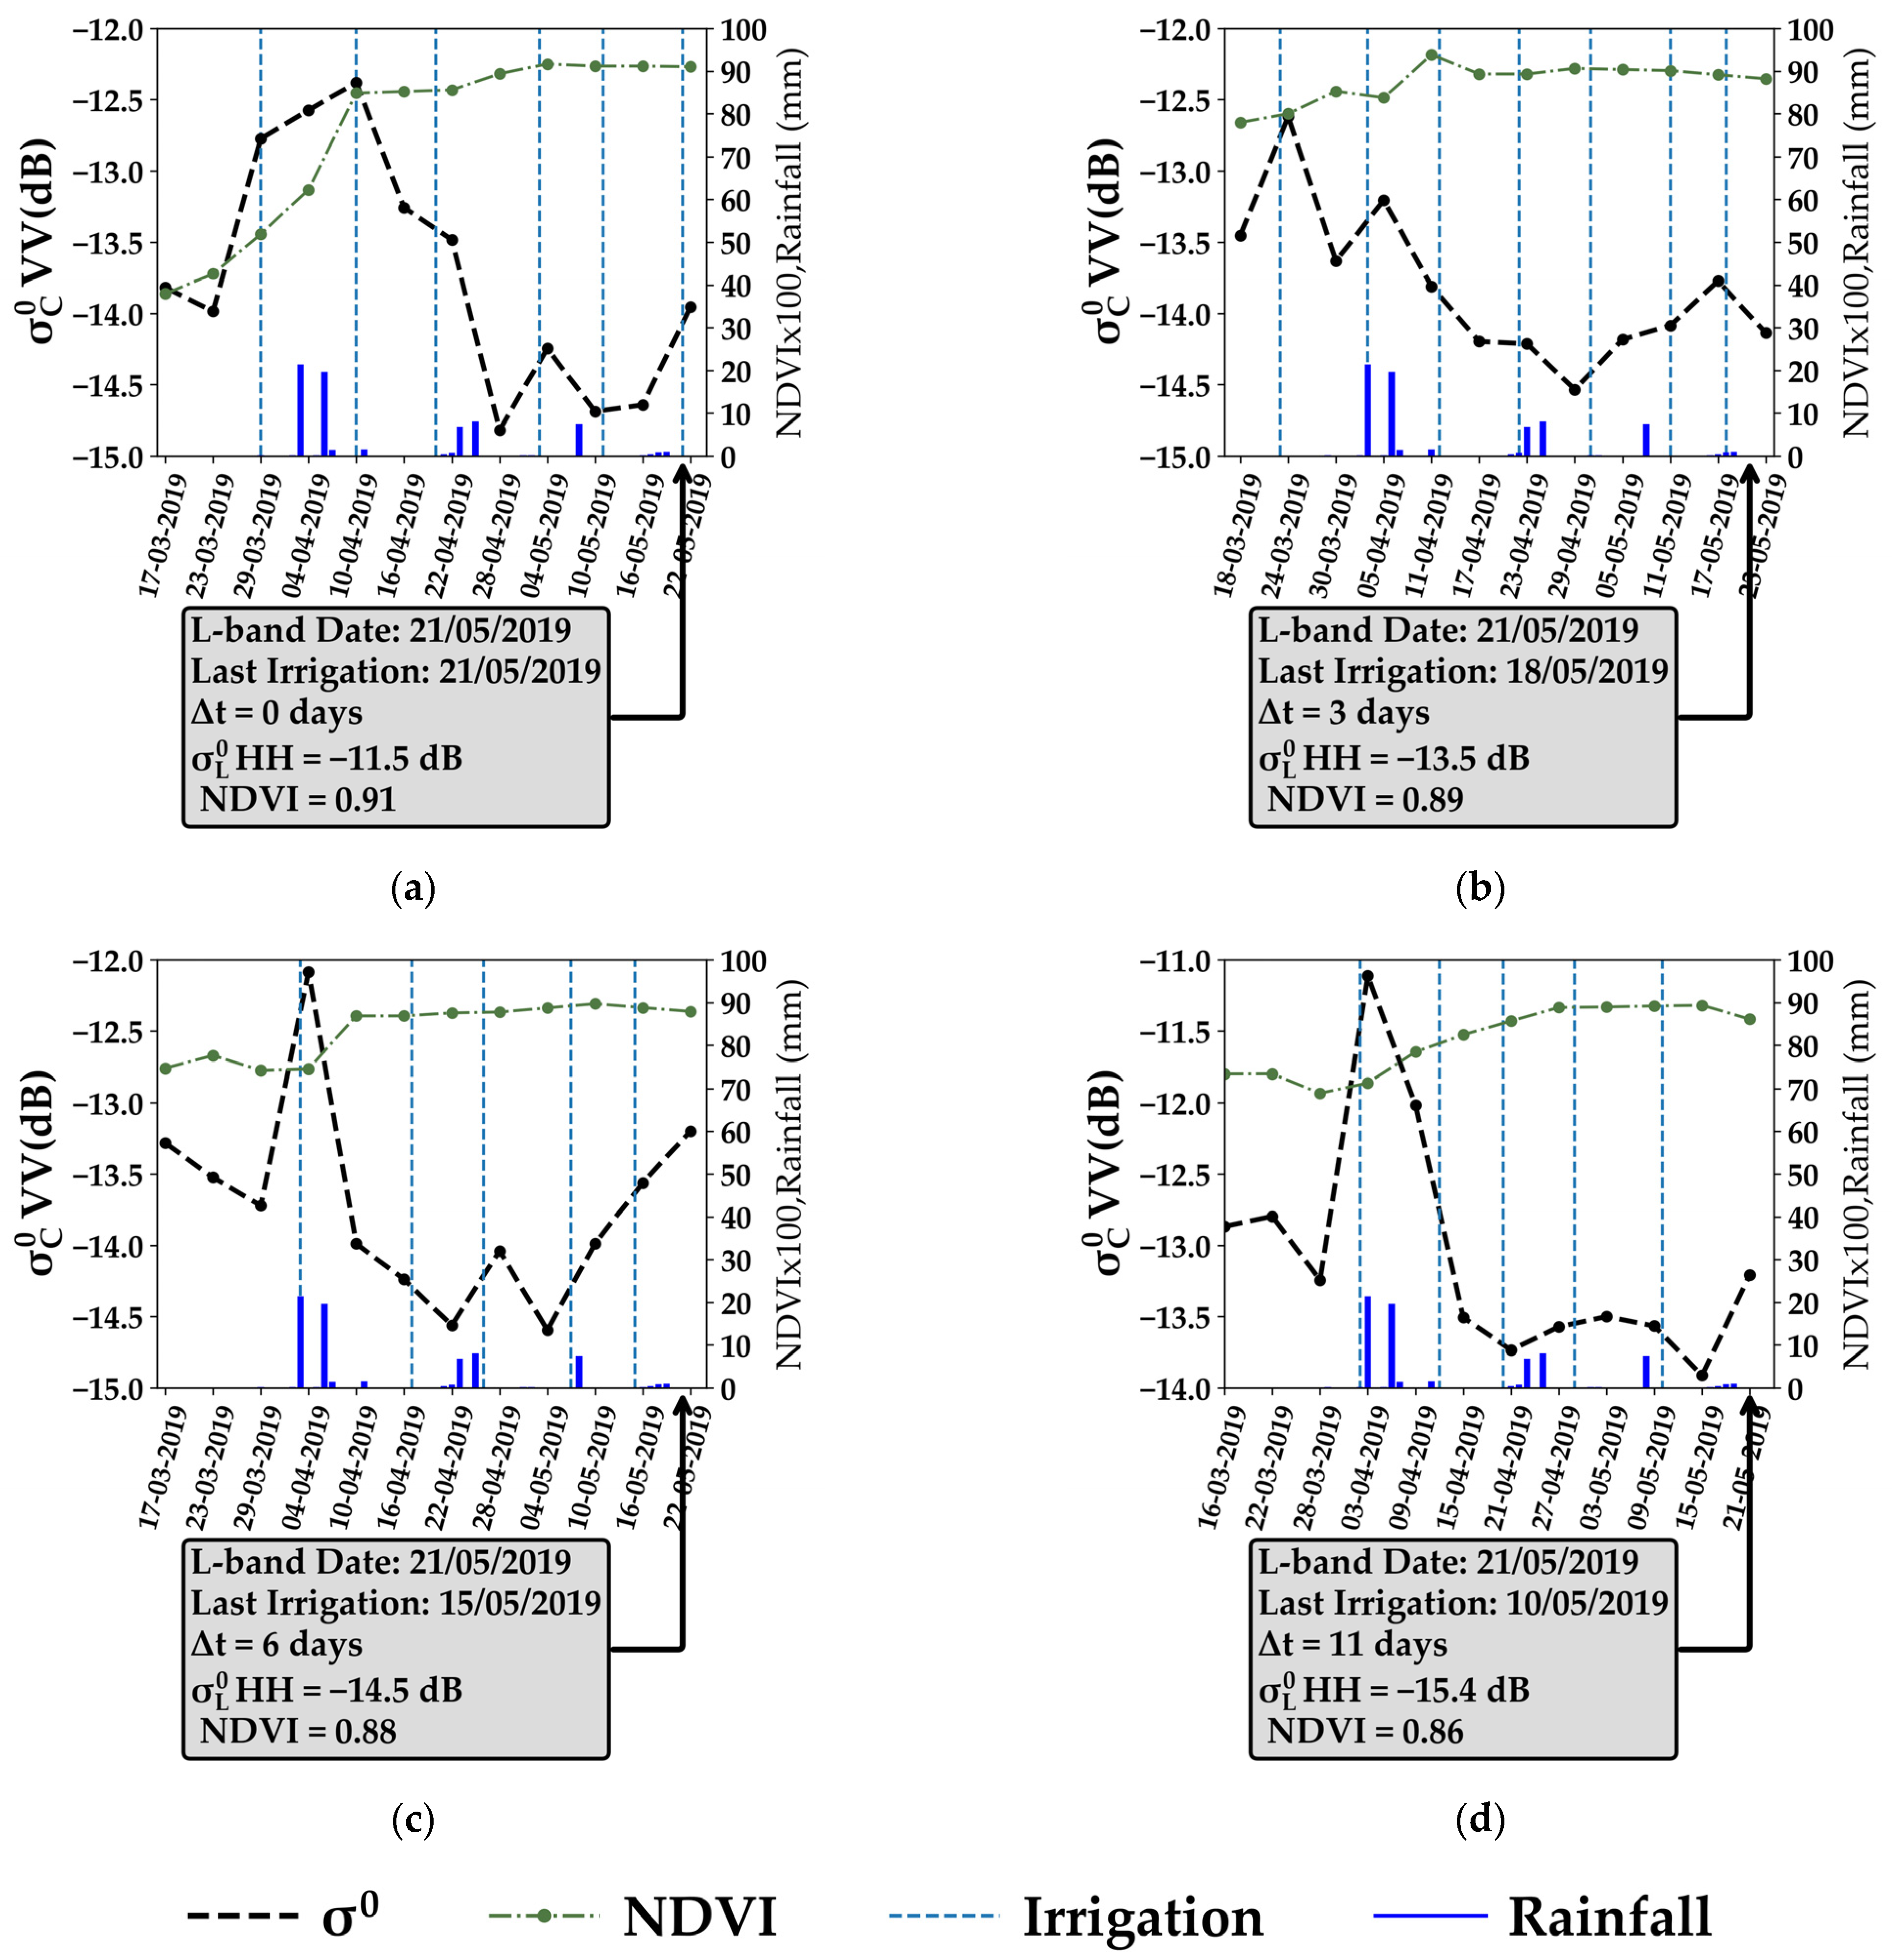
Figure 5 presents examples of the temporal evolution of the S1 C-band SAR signal ( σ C 0 ) for 4 different grassland plots between 20 March 2019 and 25 May 2019. Each example in Figure 5 corresponds to one of the four S1 acquisitions: A1 at an incidence angle of 44° (Figure 5a), A2 at 35° (Figure 5b), D2 at 42° (Figure 5c), and D1 at 32° (Figure 5d). In addition, the four plots were selected, with different Δ t values calculated as the difference between the first acquisition date of the ALOS-2 image of 21/05/2019 and the last irrigation date before 21/05/2019 ( Δ t equals 0, 3, 6, and 11 days for Figure 5a, Figure 3b, Figure 3c and Figure 3d, respectively).
For the grassland plot in Figure 5a, σ C 0 increased by 1.2 dB from −13.9 to −12.7 dB between 23/03 and 29/03 due to an irrigation event that occurred on 29/03 (the same day of the S1 acquisition). The NDVI value was relatively low on 29/03, reaching 0.52. The S1 signal then remained approximately stable at high values on 04/04, where the σ C 0 reached −12.5 dB due to the rainfall event (21.4 mm) that occurred on 03/04. The second irrigation event that occurred on 10/04 (same day of the S1 image) caused σ C 0 to remain stable, reaching −12.3 dB. The NDVI value on 10/04 was 0.84. This stability of σ C 0 at high levels, between 29/03 and 10/04, indicates the persistence of humid soil conditions between the 2 consecutive S1 images. Then, 6 days later on 16/04, the σ C 0 value decreased by 1 dB to reach −13.3 dB, with no recorded irrigation or rainfall events. Later, the irrigation event that occurred on 20/04 did not show an increase in the σ C 0 value on 22/04, which decreased to reach −13.5 dB on 22/04. The NDVI value on 22/04 was 0.86. Between 22/04 and 28/04, σ C 0 sharply decreased to reach its lowest value on 28/04 (−14.8 dB) regardless of the rainfall event of 8 mm that occurred on 25/04. NDVI on 28/04 reached 0.89. The irrigation event that took place on 11/05, 5 days before the S1 acquisition on 16/05, did not show any increase in the σ C 0 value between 10/05 and 16/05. Finally, the irrigation event that took place on 21/05 (1 day before the S1 acquisition) slightly increased the σ C 0 values between 16/05 and 22/05 (increase of 0.6 dB). The L-band image was acquired on 21/05, the same day as an irrigation event. The value of σ L 0 in HH polarization reached −11.5 dB on 21/05 ( Δ t = 0 days), with the NDVI value reaching 0.91.
In the grassland plot of Figure 5b, the irrigation event that occurred on 23/03, 1 day before the S1 acquisition, caused the σ C 0 value to increase from −13.4 dB on 18/03 to −12.6 dB on 24/03 (increase of 0.8 dB). NDVI on 24/03 was 0.78. σ C 0 then decreased between 24/03 and 29/03 to reach −13.6 dB, with no recorded rainfall or irrigation. The irrigation event and the rainfall event that occurred on 03/04 slightly increased the σ C 0 values between 29/03 and 05/04, reaching −13.2 dB. The rainfall event that occurred on 06/04 (19.6 mm) did not show any effect on the σ C 0 value, which decreased between 05/04 and 10/04 to reach −13.8 dB. σ C 0 continued to decrease, reaching −14.2 dB on 17/04 while the irrigation event that took place on 12/04 (5 days before the S1 image) did not show any effect on the σ C 0 value. σ C 0 then remained stable at very low values for the image acquired on 23/04 (−14.2 dB) despite the presence of an irrigation event that occurred on 22/04 followed by slight rainfall (6.8 mm) on 23/04. The 3 irrigation events that occurred on 01/05, 11/05, and 18/05 did not provoke any important increase in the σ C 0 values. Between 05/04 and 23/05, the NDVI values reached their maximum order of 0.9. The L-band image acquired on 21/05 was 3 days after the last irrigation event on 18/05. The value of σ L 0 in HH polarization reached −13.5 dB on 21/05 ( Δ t = 3 days), with the NDVI value reaching 0.91.
In Figure 5c, the rainfall and the irrigation events that occurred on 03/04, 1 day before the S1 acquisition on 04/04, caused the σ C 0 value to increase from −13.7 dB on 29/03 to −12.1 dB on 03/04 (increase of 1.6 dB). NDVI on 04/04 was 0.74. After 04/04, the σ C 0 value decreased to reach −13.9, −14.2, and −14.5 dB on 10/04, 16/04, and 22/04, respectively, and the NDVI values increased to reach 0.88 on 22/04. The irrigation event that took place on 17/04 (5 days before the S1 image on 22/04) did not show any increase in the σ C 0 values between 16/04 and 22/04. σ C 0 then marginally increased by only 0.5 dB between 22/04 and 28/04 due to 2 rainfall events on 23/04 and 25/04 and an irrigation event on 26/04. The irrigation events that took place on 07/05 and 15/05 also slightly increased the σ C 0 values by an order of 0.5 dB only. For this plot, the L-band image acquired on 21/05 was 6 days after the last irrigation on 15/05 ( Δ t = 6 days), where the σ L 0 value in HH polarization reached −14.5 dB, with the NDVI value reaching 0.88.
In Figure 5d, the irrigation event on 02/04 and the rainfall event on 03/04 (21.4 mm) caused the σ C 0 value in the C band to increase by 2.1 dB from 28/03 to 03/04, with the NDVI value reaching 0.71 on 03/04. Between 03/04 and 15/05, the σ C 0 value decreased gradually with the increase in NDVI from 0.71 to 0.89 and the 4 irrigation events that occurred on 12/04, 20/04, 29/04, and 10/05 had no impact on the σ C 0 value. Between 03/04 and 15/05, the σ C 0 values continued to decrease regardless of the change in the soil moisture due to rainfall or irrigation. The last irrigation before the acquisition of the L-band image occurred on 10/05, 11 days before the L-band image acquisition. The σ L 0 value in the L band reached −15.6 dB and the registered NDVI reached 0.86.
In the four examples shown in Figure 5, it is clear that when the vegetation cover of the coarse hay developed in the first growth cycle (NDVI at a maximum order ~0.9), the response of σ C 0 to the water supplements (either irrigation or rainfall) was negligible. The σ C 0 backscattered signal was insensitive to the soil moisture values. As a result, the irrigation events could hardly be detected based on the variation in the soil moisture values between consecutive S1 images. Only some irrigation (or rainfalls) that occurred on the same day as the S1 acquisition or 1 day before led to a slight increase in the σ C 0 values (increase of less than 0.7 dB) between consecutive S1 images. The 4 plots of Figure 5 encountered 23 irrigation events for 2 months between mid-March and mid-May. From these 23 irrigations, only 5 irrigation events induced a high increase in σ C 0 between consecutive S1 images, thus showing an increase in the soil moisture values. These irrigation events are most likely to be detected as irrigation events. Indeed, these events correspond to moderate NDVI values of less than 0.7 in most cases. In addition, 6 out of 23 irrigation events showed a slight increase in σ C 0 between consecutive S1 dates. These six events correspond to high NDVI values but occurred on the same day or one day before the S1 acquisition. These events are less likely to be detected as irrigation events. Finally, 12 out of 23 irrigation events, encountering very high NDVI values, over the 4 plots showed no effect on the σ C 0 values following irrigation events. These events are impossible to detect using the change detection in the S1 C-band backscattering between two S1 dates.
Regarding the σ L 0 values, the four examples provided in Figure 5 shows that σ L 0 varied with the Δ t values even in the presence of very well-developed vegetation cover (NDVI between 0.86 and 0.9). In fact, when irrigation occurred on the same day as the ALOS-2 image ( Δ t = 0 ), σ L 0 reached −11.5 dB, which decreased to −13.5 dB when Δ t was 3 days. A lower σ L 0 value (−14.5 dB) was registered for the plot that experienced its last irrigation 6 days before the ALOS-2 acquisition and finally the lowest value of −15.4 dB was recorded when the irrigation was 11 days before the ALOS-2 image.

3.1.2. C and L Bands’ Responses to Irrigation Events in Growth Cycle I

The sensitivity of the C and L bands for irrigation detection in the first growth cycle was then analyzed as a function of the time difference between the acquisition date of the SAR images (in C and L bands) and the last irrigation event that occurred before the SAR acquisition. The S1 image acquired on 21/05/2019 corresponds to the D1 acquisition at an incidence angle of 32°. For the date 21/05/2019, Δ t of the 45 plots varied between 0 (last irrigation occurred on 21/05) and 13 days (last irrigation occurred 13 days ago). Two classes of NDVI were defined. The first class contains grassland plots with an NDVI value less than or equal to 0.7 on 21/05/2019 (9 plots) and the second represents grassland plots with an NDVI value greater than 0.7 on 21/05/2019 (36 plots).
First, Figure 6 provides examples on the differences in the SAR backscattering coefficients for grassland plots as a function of the time difference between the last irrigation event and the SAR acquisition date for the S1 and ALOS-2 acquisitions on 21/05 in VV and HH polarizations, respectively. The plots outlined in blue are examples of plots that were irrigated 0 to 1 days before the SAR acquisition, plots that were irrigated 4 to 6 days before the SAR image are shown in green, and examples of plots that were irrigated more than 10 days before the SAR acquisition are shown in black. In Figure 6a, corresponding to the S1 C-band image in VV polarization, it can be seen by photointerpretation that all the plots have the same SAR backscattering values regardless of their Δ t value. In Figure 6b, corresponding to the ALOS-2 image in HH polarization, it is quite visible that plots irrigated 10 days before the SAR acquisition appear in almost red color (low values) whereas those irrigated 0 to 1 day before the acquisition most likely appear in lighter colors (yellow to blue indicating higher values). Intermediate values of Δ t between 4 and 6 days (green outlined plots) show moderate colors (orange to yellow), indicating moderate backscattering coefficients.
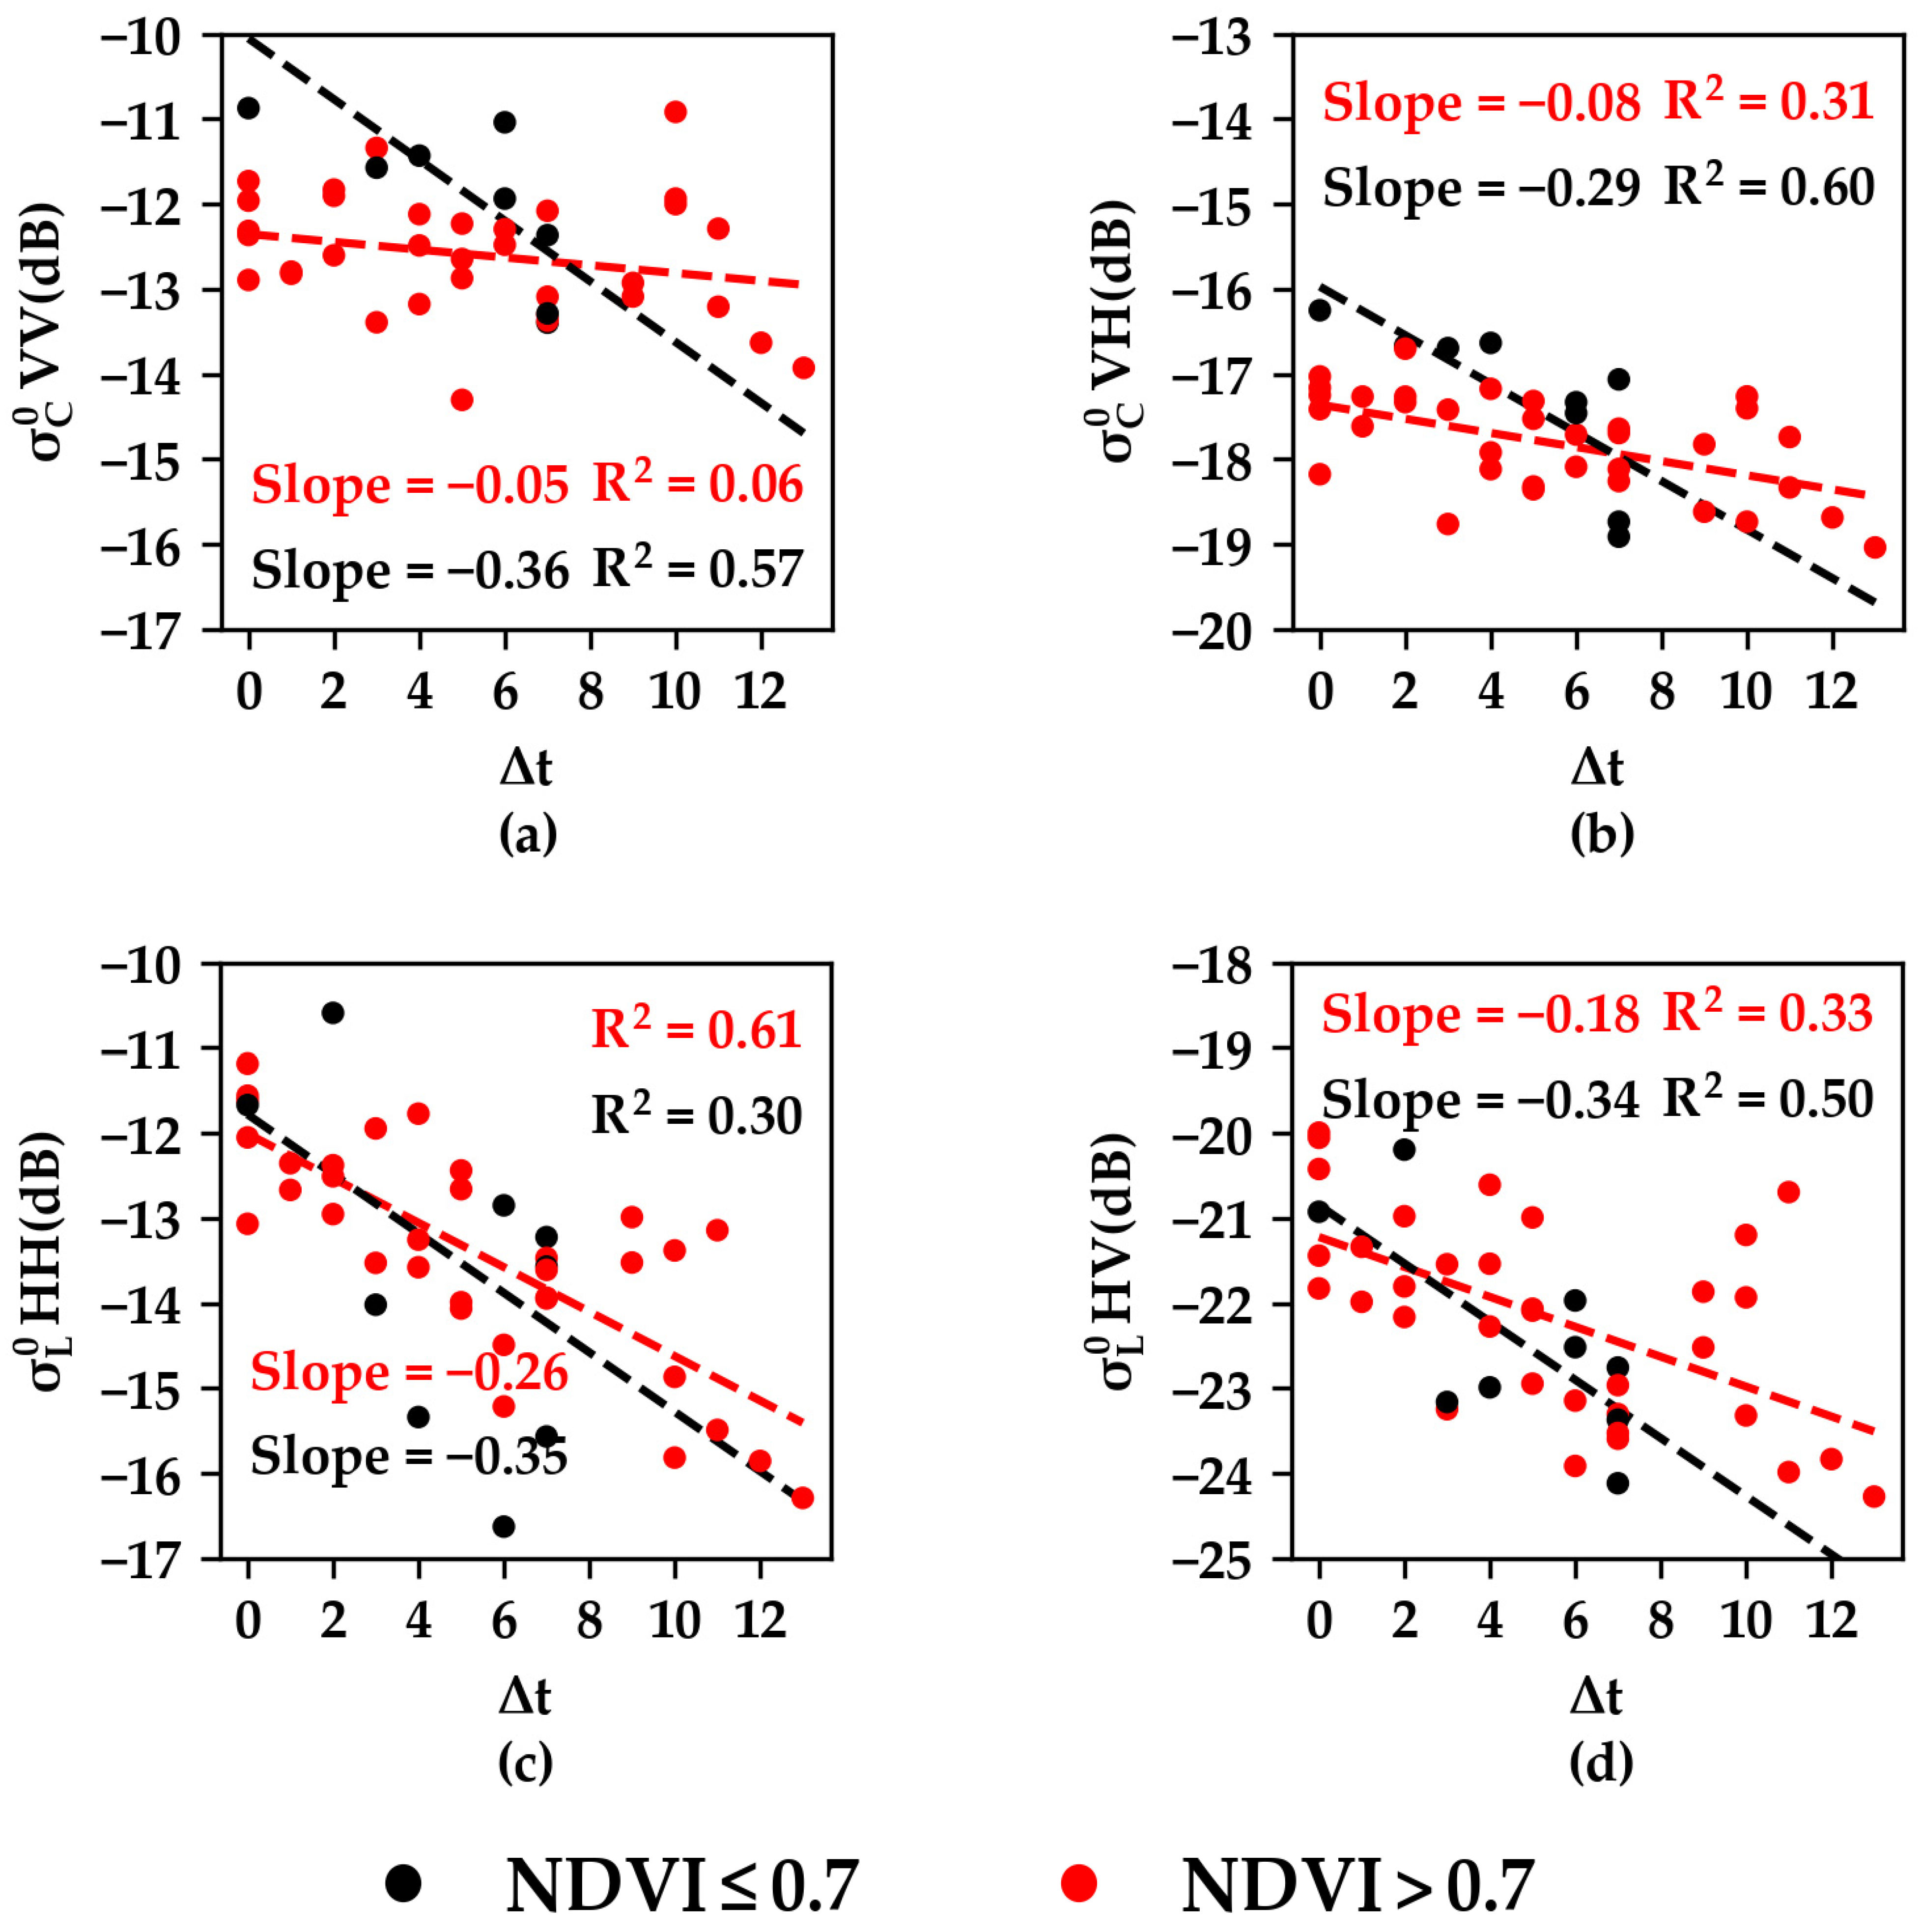
Figure 7 presents the variation in σ C 0 in VV (Figure 7a), σ C 0 in VH (Figure 7b), σ L 0 in HH (Figure 7c), and σ L 0 in HV (Figure 7d) as a function of Δ t for NDVI 0.7 (in black) and NDVI > 0.7 (in red) for the 45 grassland plots. In Figure 7a, the σ C 0 values in VV polarization for plots with NDVI < 0.7 show a decreasing pattern from −10.8 dB when the irrigation occurred on the same day as the S1 acquisition to −13.2 dB when the S1 acquisition was 7 days after the last irrigation. The coefficient of determination (R2) of the fitted linear line reached 0.57, with a decreasing slope of −0.36. For NDVI greater than 0.7, the variation in σ C 0 in VV polarization as a function of Δ t was negligible, with the slope value of the fitted linear equation reaching −0.05 and an R2 value of 0.06. For the C band in VH polarization (Figure 7b), the plots with NDVI 0.7 show a decreasing behavior of σ C 0 as a function of Δ t (slope = −0.29 and R2 = 0.6) whereas for NDVI > 0.7, the variation in σ C 0 as a function of Δ t is also very low, with a slope value of −0.08.
Figure 7c shows the variation in the σ L 0 in HH polarization as a function of Δ t for the two NDVI classes. For NDVI 0.7 , σ L 0 decreases as the time difference between the image date and the irrigation date increases, with the slope of the linear equation reaching −0.42 and an R2 value of 0.31. For NDVI 0.7 , the σ L 0 value in HH polarization decreases from −11.5 dB to less than −15 dB (decreases more than 5 dB) when Δ t increases from 0 (same day of irrigation) to 7 days (L-band image acquired 7 days after irrigation). For NDVI > 0.7 , σ L 0 in HH polarization also shows a decreasing pattern, with a negative slope of −0.26 and R2 value of 0.61. In fact, σ L 0 in HH polarization decreases from −12 dB when the irrigation occurred on the same day as the L-band acquisition date to less than −16 dB when the L-band image was acquired more than 12 days after the irrigation (decrease of 4 dB between Δ t = 0 and Δ t = 13 days). Thus, plots with NDVI greater than and less than 0.7 show approximately the same decreasing pattern for σ L 0 in HH polarization when Δ t increases. Similarly, σ L 0 in HV polarization shows a decreasing pattern as a function of Δ t for both classes of NDVI, with a decreasing slope of −0.34 and −0.18 for NDVI 0.7 and NDVI > 0.7 , respectively (Figure 7d). However, the decreasing slopes for σ L 0 as a function of Δ t are less sharp in HV than that in HH.

3.2. C and L Bands’ Behaviors in Growth Cycle II

3.2.1. Temporal Analysis of σ C 0

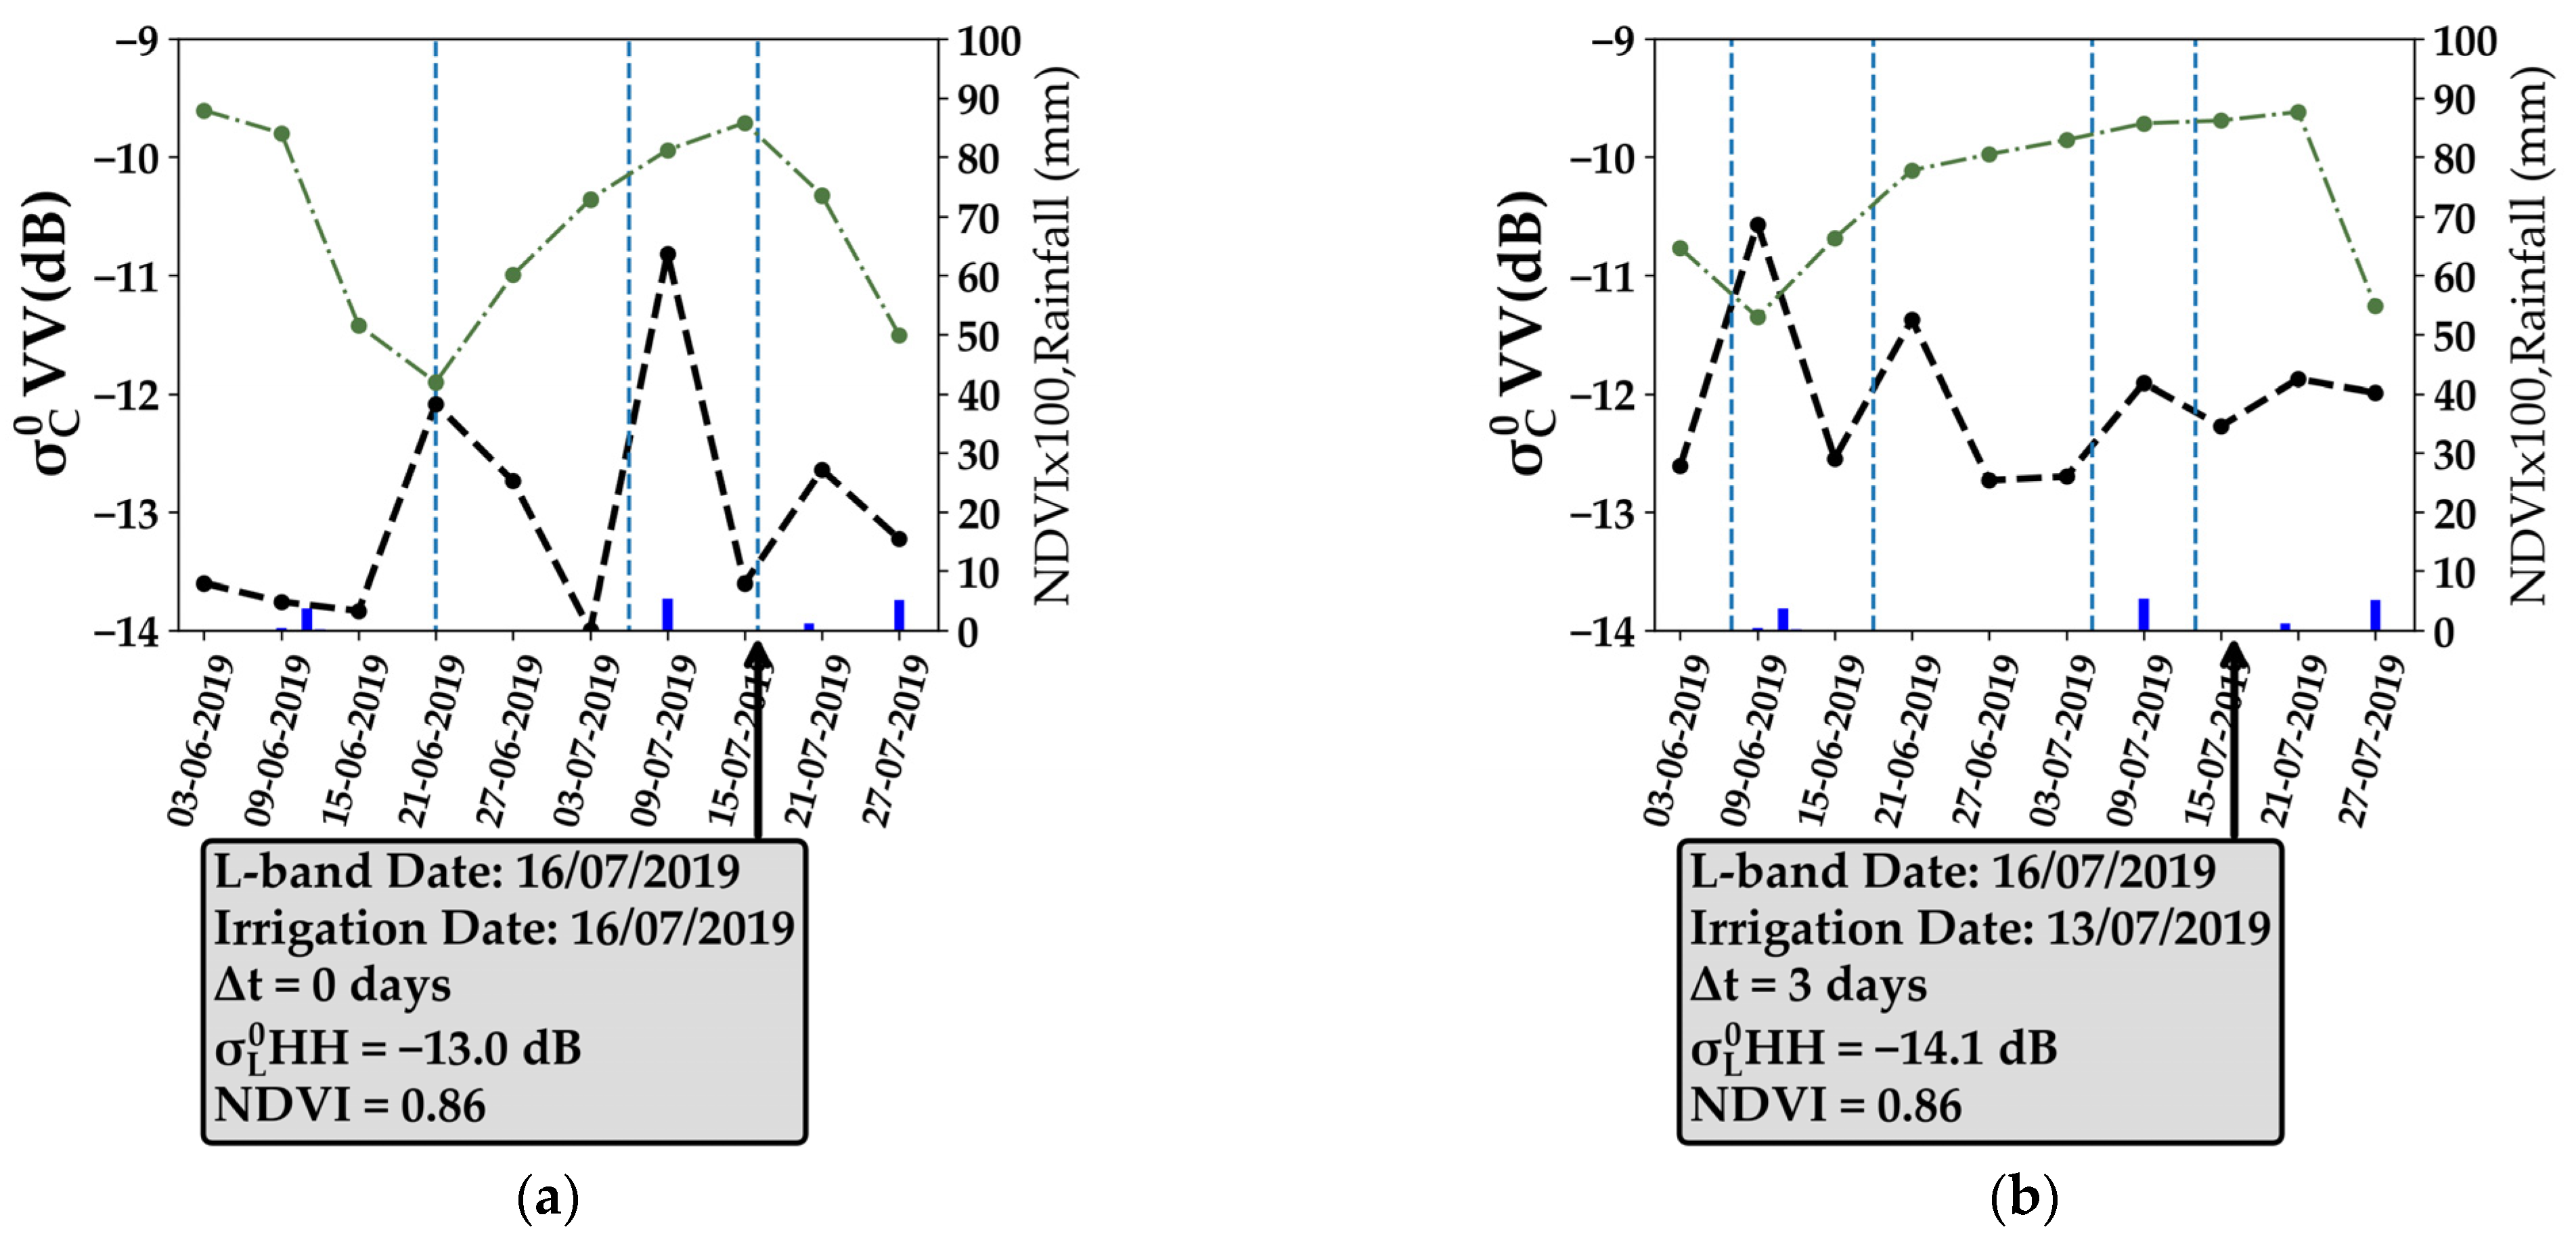
Figure 8 presents the temporal evolution of the S1 C-band backscattering coefficient σ C 0 for 4 different grassland plots during the second growth cycle between June and July 2019. Each example in Figure 8 shows the temporal evolution of σ C 0 at one of the four different S1 orbits: 44°-A1 (Figure 8a), 42°-D2 (Figure 8b), 32°-D1 (Figure 8c), and 35°-A2 (Figure 8d). Moreover, each used reference grassland plot presents a different value of Δ t for the ALOS-2 image on 16 July (difference between the ALOS acquisition date and the date of the last irrigation that occurred before the ALOS acquisition).
In Figure 8a, the σ C 0 time series acquired at an incidence angle of 44° shows that the first irrigation event on 21/06 caused σ C 0 to increase by 1.8 dB from −13.8 dB on 15/06 to −12.0 dB on 21/06 (the same day of irrigation). NDVI on 21/06 was low, with a value of 0.51 (beginning of the growth cycle). The σ C 0 values then decreased with an absence of irrigation and rainfall events to reach −14.0 dB 12 days after the last irrigation. During this period, the vegetation started to develop and the NDVI values reached 0.72 on 03/07. Due to an irrigation event on 06/07, σ C 0 increased from −14.0 dB on 03/07 to reach −10.8 dB on 09/07 3 days after irrigation (increase of 3.1 dB), where NDVI on 09/07 reached 0.82. σ C 0 then decreased to reach −13.6 dB on 15/07 due to the drying out of the soil and then increased by 1 dB between 15/07 and 21/07 due to an irrigation event that occurred on 16/07 (5 days before the S1 image). The available L-band image acquired on 16/07 (same day as the last irrigation Δ t = 0 ) showed a σ L 0 value of −13.0 dB in HH polarization, where the NDVI value on this date reached 0.86.
In Figure 8b, the first irrigation event that occurred on 07/06 caused an increase of 2.1 dB in the σ C 0 values between 03/06 and 09/06. The vegetation cover on 09/06 was still low, with an NDVI value of 0.52. σ C 0 then decreased with the dryness of the soil to reach −12.5 dB on 15/06 and then increased by 1.2 dB between 15/06 and 21/06 due to an irrigation event that occurred on 18/06. The NDVI value on 21/06 reached 0.77. With the absence of irrigation between 21/06 and 03/07, the σ C 0 values decreased, reaching −12.7 dB. The irrigation event that took place on 05/07 caused an increase of 0.8 dB in the σ C 0 values between 03/07 and 09/07 (S1 image 4 days after the irrigation), where the NDVI value on 09/07 reached 0.86. The next irrigation event on 13/07 did not show a significant increase in the σ C 0 values, which slightly decreased by 0.3 dB to reach −12.2 dB with an NDVI of 0.86. The L-band image acquired on 16/07, 3 days after the last irrigation on 13/07, shows a σ L 0 value of −14.1 dB with an NDVI value 0.86.
In Figure 8c, the 2 irrigation events that took place on 14/06 and 20/06 caused the σ C 0 values to increase by 1.1 and 2 dB between 08/06–14/06 and 14/06–20/06, respectively (both irrigations on the same day as the S1 acquisitions). NDVI also increased from 0.47 on 08/06 to reach 0.69 on 20/06. The σ C 0 values then decreased by 1.5 dB on 26/06 due to the dryness of the soil and then increased by 1.1 dB on 02/07, with an irrigation event occurring on the same day as the S1 acquisition. The NDVI value on 02/07 reached 0.85. Six days later, the σ C 0 decreased sharply with no irrigation to reach −12.3 dB on 08/07. The irrigation events that took place on 11/07, 3 days before the S1 acquisition on 14/07, caused an increase of 0.8 dB in the σ C 0 values between 08/07 and 14/07. σ C 0 then increased by 1.3 dB due to irrigation that took place on 18/07 2 days before the S1 acquisition on 20/07. The last irrigation event that took place on 25/07 maintained the σ C 0 values at a high level between 20/07 (−10.5 dB) and 26/07 (−10.8 dB). The L-band image on 16/07, 5 days after the irrigation on 11/07, shows a σ L 0 value of −14.7 dB, with an NDVI of 0.84.
Figure 8d shows that σ C 0 increased from −12.9 dB on 10/06 to −11.0 dB on 16/06 (increase of 1.9 dB) due to the irrigation event that occurred on 16/06 (same day as the S1 image). NDVI on 16/06 reached 0.74. The σ C 0 value then decreased to reach −13.0 dB on 22/06 and remained nearly stable on 28/06 (−12.7 dB) with no recorded irrigation events. Between 28/06 and 04/07, the σ C 0 value increased by 1.1 dB due to an irrigation event that occurred on 01/07 (3 days before the S1 image). Then, the σ C 0 values decreased for 2 consecutive S1 images to reach −13.7 dB on 16/07, with no irrigation occurring over the previous 15 days. The L-band image acquired on the 16/07 with a Δ t value of 15 days (the ALOS image and the nearest irrigation were 15 days apart) shows a σ L 0 value of −17.4 dB in HH polarization with an NDVI value of 0.46.
In the four examples shown in Figure 8, the effect of the irrigation on the σ C 0 value was visible in the presence of either moderately developed or well-developed vegetation cover for the growth cycle II. Most of the irrigation events induced an important increase in the σ C 0 values between the consecutive S1 images. This means that σ C 0 is still sensitive to the soil moisture values even if the vegetation is well developed in the growth cycle II, which is rich in legumes. The 4 grassland plots encountered 17 irrigation events between June and July 2019. In the 4 examples, 16 out of 17 irrigation episodes showed an important increase in the σ C 0 values (more than 0.7 dB) between consecutive S1 images regardless of the NDVI value. These events are most likely detected as irrigation events. As a result, it could, over the legume grass, detect irrigation events using the increase in the soil moisture between consecutive C-band S1 acquisitions regardless of the vegetation development.
Regarding the σ L 0 values, the four examples provided in Figure 8 also show that σ L 0 varies with the Δ t values. σ L 0 was higher for an Δ t value equal to 0 (−13.0 dB) than that obtained 3 days after the irrigation (−14.1 dB). Then, 5 days after the irrigation, the grassland reference plot, as shown in Figure 8c, showed a value of −14.7 dB, which decreased to −17.4 dB for the grassland plot irrigated 15 days before the ALOS-2 acquisition.

3.2.2. C and L Bands’ Responses to Irrigation Events in Growth Cycle II

For the second growth cycle, characterized by a different plant cover composition than that in cycle I (lesser proportion of coarse hay and higher proportion of legumes), an analysis was carried out to study the sensitivity of the C and L bands for irrigation detection. As performed for the C and L images in 21/05 (cycle I), the variation in σ C 0 and σ L 0 was investigated as a function of the time difference between the SAR acquisition date and the last irrigation date ( Δ t ) for C- and L-band images acquired on 16/07. The S1 image acquired on 16/07/2019 corresponds to the A2 acquisition at an incidence angle of 35°. For the C and L acquisitions on 16/07, the Δ t value for the 45 reference plots varied between 0 (irrigation occurred on 16/07) and 19 days (last irrigation occurred 19 days before 16/07). On 16/07, the 2 classes of NDVI 0.7 and NDVI > 0.7 included 16 and 29 plots, respectively.
Figure 9 shows examples of the differences in the SAR backscattering coefficients for sample grassland plots, as a function of the time difference between the last irrigation event and the SAR acquisition date for the S1 (Figure 9a) and ALOS-2 (Figure 9b) acquisitions on 16/07 in VV and HH polarizations, respectively. The blue, green, and black outlined plots are examples of grassland plots that were irrigated 0 to 1 days, 4 to 6 days, and more than 10 days respectively, prior to the SAR acquisition. In both the C- and L-band images of 16/07, we can observe, by photointerpretation, that plots with Δ t greater than 10 days have low backscattering values (red to orange). Plots with Δ t values between 4 and 6 days have moderate backscattering values whereas plots irrigated at 0 to 1 days show the highest backscattering coefficients. Moreover, it is observed that the backscattering interval difference between the minimum backscattering (irrigation 10 days before acquisition) and maximum (0 to 1 days before acquisition) is more noticeable in the L band than that in the C band.
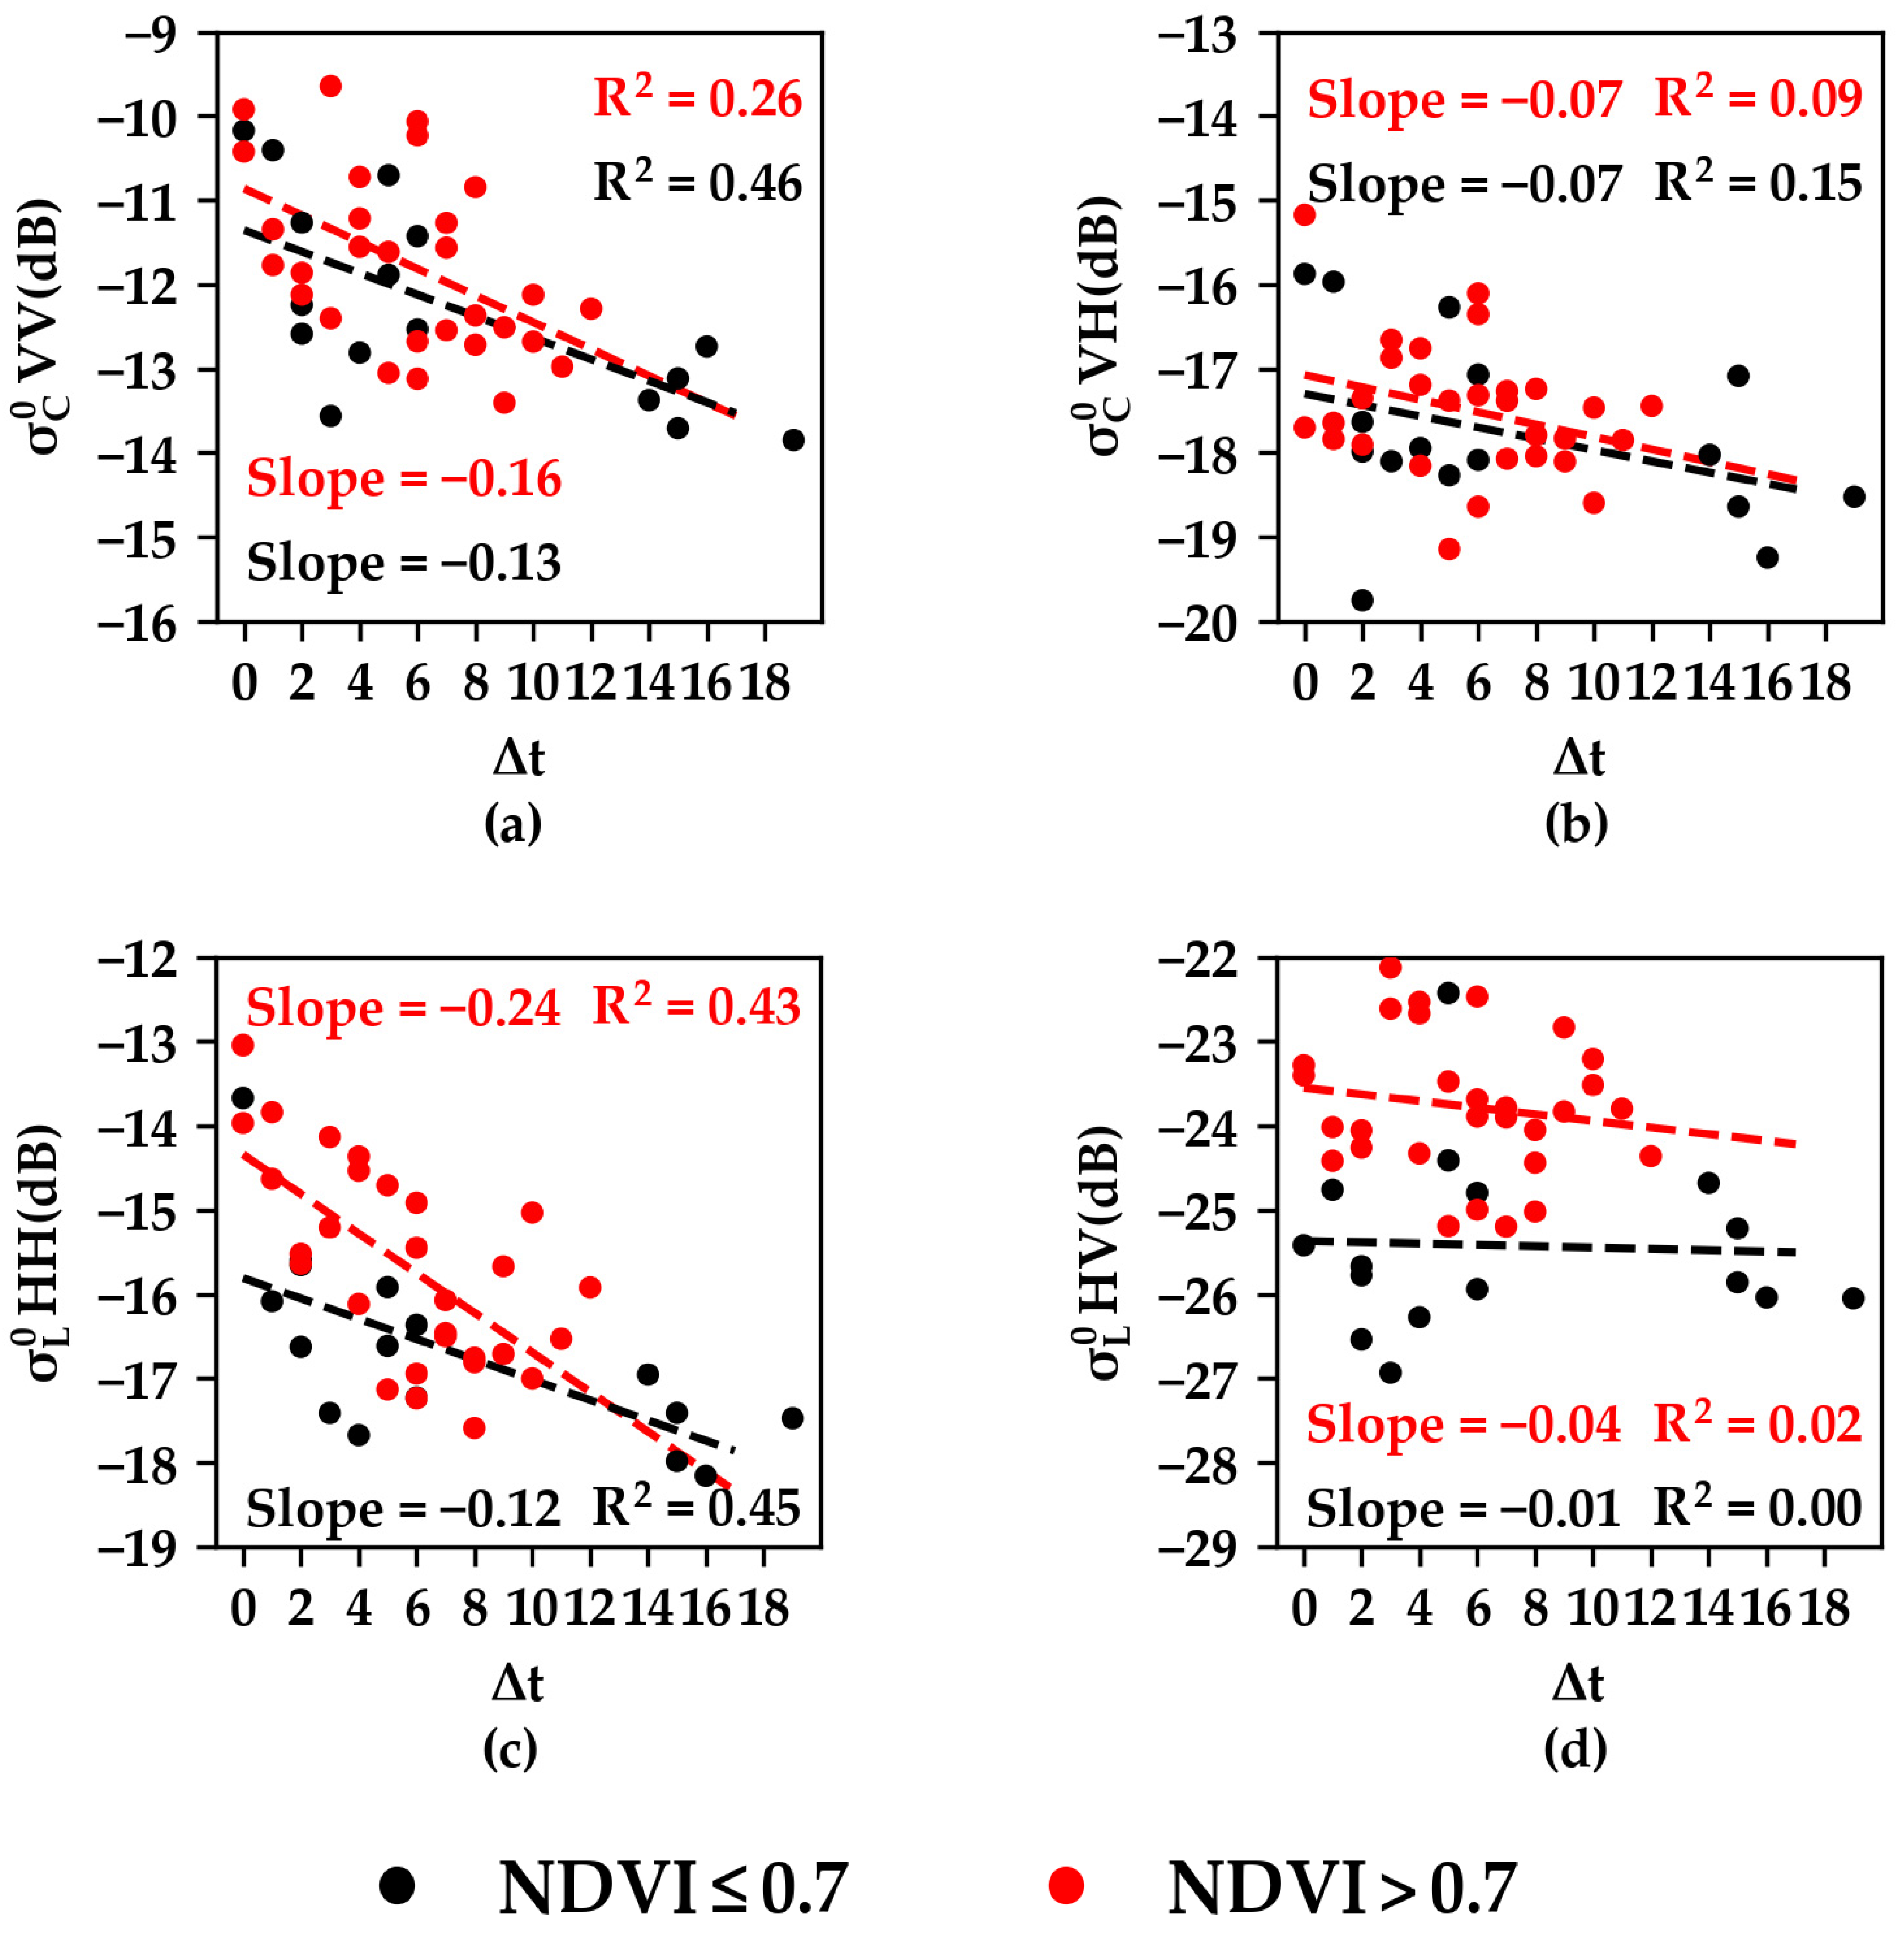
Figure 10 presents the variation in σ C 0 in VV (Figure 10a), σ C 0 in VH (Figure 10b), σ L 0 in HH (Figure 10c), and σ L 0 in HV (Figure 10d) as a function of Δ t for the two NDVI classes (NDVI 0.7 in black and NDVI > 0.7 in red). In Figure 10a, σ C 0 in VV polarization shows a decreasing pattern for σ C 0 as a function of Δ t (slope of −0.16) for NDVI 0.7 . σ C 0 decreases from −10.1 dB when the S1 image was acquired on the same day as irrigation to −13.8 dB when the S1 acquisition occurred 19 days after the last irrigation. Similarly, the NDVI > 0.7 class also shows a decreasing pattern between −9.9 dB when the irrigation occurred on the same day as the S1 acquisition to −13 dB when the irrigation occurred 11 days before the S1 acquisition. The decreasing slope is nearly the same between the 2 classes, whereas the R2 value is higher for NDVI 0.7 (0.46) than that for NDVI > 0.7 (0.26). In the VH polarization of the C band in Figure 10b, the decrease in σ C 0 as a function of Δ t is less important than that in VV, with a slope of −0.07. However, both NDVI classes show approximately the same behavior for σ C 0 as a function of Δ t .
In Figure 10c, σ L 0 in HH polarization shows a decreasing pattern for both classes of NDVI, with a decreasing slope of −0.24 and −0.12 for NDVI > 0.7 and NDVI 0.7 , respectively. For the plots with NDVI 0.7 , σ L 0 decreased from −13.8 dB when the irrigation occurred on the same day as the ALOS-2 acquisition to less than −17 dB when the ALOS-2 acquisition occurred more than 18 days after the irrigation event. For the plots with NDVI > 0.7 , σ L 0 decreases from −13 dB at Δ t = 0 to less than −16 dB when Δ t is greater than 10 days. The coefficient of determination of the linear fitting curve is nearly the same for both classes (0.43 and 0.45) and higher than that obtained using the C-band VV polarization. In the HV polarization, the σ L 0 values did not show any significant decrease with the increase in Δ t (Figure 10d).

4. Discussion

4.1. Irrigation Sensitivities of C and L Bands in Growth Cycle I

The variation in σ C 0 in VV and VH polarizations as a function of Δ t in the first growth cycle (Figure 7) indicates that when the vegetation of coarse hay is moderately developed, wet soil, due to irrigation on the same day as the S1 acquisition, yields high σ C 0 values. The σ C 0 values then decrease gradually to low values when the soil dries out 6 to 7 days after the irrigation. As the soil starts to dry regularly after an irrigation event, a decrease in the radar signal is frequently observed when moving away from the irrigation date because the radar backscattered signal decreases when the soil moisture decreases [16,17]. The results obtained in Figure 7 thus shows that in the case of NDVI 0.7 for coarse hay cover, σ C 0 remains sensitive to the soil water content and thus irrigation events could be detected if the irrigation date was not far from the S1 acquisition date. These findings also confirm the examples of the grassland plots shown in Figure 5, where the irrigation events that occurred at the beginning of the growth cycle with low NDVI values caused an important increase in the σ C 0 values between consecutive S1 images. In contrast, when the canopy cover of coarse hay is well developed with high NDVI values (NDVI > 0.7 ) in the first growth cycle, Figure 7a shows that the same σ C 0 value could be obtained when the irrigation occurred on the same day as the S1 acquisition and when the irrigation occurred 10 to 13 days before the S1 acquisition. Considering that Δ t is a proxy measure of the wetness–dryness of the soil, the absence of a correlation between σ C 0 and Δ t for NDVI > 0.7 in the first crop cycle means that σ C 0 is not correlated with the soil moisture values. This means that the sensitivity of σ C 0 to the soil water content is negligible for high NDVI values and that the irrigation events could hardly be detected. These findings confirm the examples shown in Figure 5, where σ C 0 did not show any response to the irrigation events (or rainfall) when the vegetation is well developed (NDVI at its maximum order) except for some slight increases that were visible only when the irrigation occurred on the same day or one day before the S1 acquisition. The loss of the sensitivity of σ C 0 to the soil water content in this case is mainly due to the attenuation of the SAR signal by the well-developed canopy cover of the coarse hay in cycle I [32]. This type of grass (Gramineae) holds similar geometrical and phenological properties to wheat, which highly attenuates the C-band SAR signal between the germination and the heading phenology phases [26,33,34]. Several studies [29,35] have demonstrated that for wheat canopies, the vegetation attenuation for the C band starts after the germination phase when the vertical stems and leaves are elongated. The attenuation by vegetation reaches its extreme limit, leading to the lowest C-SAR backscattering signal during the heading phase when the spike emerges from leaves. When the penetration of the S1 signal becomes weak due to the developed vegetation cover of the coarse hay, the soil contribution becomes negligible in the backscattered signal and thus the irrigation could hardly be detected between consecutive S1 images.
The behavior of σ L 0 as a function of the time difference between the image acquisition date and the irrigation date in the first growth cycle indicates that, in the presence of either moderate or well-developed coarse hay vegetation cover, σ L 0 in HH and HV polarizations could still be sensitive to the soil water content. In fact, for both NDVI classes, the high σ L 0 values observed when the image was acquired on the same day as the irrigation and the gradual decrease in σ L 0 when the L-band image was acquired far from the irrigation date indicates that the σ L 0 value is highly correlated with the wetness and dryness conditions of the soil. With wet soil conditions, due to irrigation that occurred on the same day as the L-band acquisition, high σ L 0 values are recorded. In contrast, dry soil due to a lack of irrigation 5 to 6 days before the ALOS-2 acquisition, shows low σ L 0 values. Thus, for any NDVI value (any vegetation development stage of coarse hay), σ L 0 could still be sensitive to the soil water content (wetness and dryness) and therefore the irrigation events could be straightforwardly detected. The sensitivity of σ L 0 to the soil water content even in the presence of the vegetation cover is mainly due to the ability of the L band at a wavelength of 24 cm to penetrate the developed dense vegetation cover and reach the soil surface layer.

4.2. Irrigation Sensitivities of C and L Bands in Growth Cycle II

The variation in σ C 0 as a function of Δ t in the second growth cycles indicates that using the VV polarization, σ C 0 remains sensitive to the soil moisture values even in the presence of well-developed vegetation cover (NDVI > 0.7 ). With low or high NDVI values, σ C 0 registers high values when the soil is wet due to irrigation that occurred on the same day as the S1 acquisition, which decreases when the soil dries out over several days with no irrigation. These findings validate the variations in the σ C 0 values following irrigation events present in Figure 8. In the four grassland plots shown in Figure 8, it is visible that most of the irrigation events caused an important increase in the σ C 0 values between consecutive S1 images even when NDVI indicates well-developed vegetation cover. This means that the penetration of the C band was limited less by the vegetation cover development and the backscattering SAR signal was sensitive to the soil moisture. Thus, in the second growth cycle, the attenuation of the σ C 0 values due to well-developed vegetation cover is lower than that in the first cycle. This could be explained by the lesser biomass proportion of the Gramineae coarse hay (grasses), which is less dominant in growth cycle II than that of growth cycle I. The growth cycle II is richer in legumes, which cause less attenuation of the C band compared to the grasses. In fact, legume crops do not have the same elongation of vertical stems and spikes, which are present in coarse hay, and thus cause less attenuation of the C-band SAR signal. In VH polarization, the correlation between σ C 0 and Δ t (decreasing slope and low R2 value) was less than that in VV. This was expected since it is well known that the sensitivity of VH polarization to the soil water content is less than that of VV polarization [25,33,34,36,37,38].
The high sensitivity of σ L 0 in HH polarization to soil moisture in the presence of either moderate or well-developed vegetation cover is clearly visible in Figure 10c. The direct decreasing pattern, with good R2 values between σ L 0 and Δ t , indicates that the σ L 0 values in HH polarization vary according to the dryness–wetness of the soil in the presence of either small or developed vegetation cover. Compared to σ C 0 in VV polarization, σ L 0 in HH polarization shows a higher decreasing slope and higher correlation coefficient, especially for NDVI > 0.7 . Therefore, σ L 0 in HH polarization proves a higher efficiency for irrigation detection regardless of the vegetation cover.
The variation in σ L 0 in HV polarization presented in Figure 10d does not show a direct relationship between the dryness–wetness (soil moisture) and the σ L 0 values. This could be explained by two main reasons. First, HV polarization is less sensitive to the soil water content than HH polarization as shown by several studies [25,32,33,39]. Second, in order to ensure a high signal to noise ratio, the σ L 0 values must be greater than Noise-Equivalent-Sigma-Zero (NESZ), which corresponds to the background sensor noise. As noted in the description of the PALSAR-2 SAR specification, NESZ of PALSAR-2 is of the order of −25 dB [40]. Indeed, Figure 10d shows that most of the σ L 0 values of the grassland plots in HV polarization on 16/07/2019 are lower than NESZ (−25 dB), which makes them inadequate for any further analysis or application. In addition, the influence of the noise is stronger for cross-polarizations (such as HV) than that for co-polarizations (such as HH). In fact, even if NESZ is of the same order of magnitude for both cross- and co-polarizations, the σ 0 values are usually lower for cross-polarizations than co-polarizations. For this reason, many pixels of the ALOS-2 (PALSAR-2) images sometimes have σ L 0 values that are lower than the NESZ value in cross-polarizations. This problem occurs frequent for PALSAR-2 pixels, especially over smooth areas (very low backscattering) and/or dry soils.

5. Conclusions

In this study, a comparative analysis of the SAR C and L bands’ sensitivities for the detection of irrigation events is presented. Over intensively irrigated reference grassland plots in a Mediterranean context, the C-band Sentinel-1 (S1) temporal series were first analyzed following rainfall and irrigation events for coarse hay grass and legume grass growth cycles. Then, using two available ALOS-2 images (L-band) acquired on the same date as S1, a comparison between the C and L bands for irrigation detection was performed by analyzing the backscattering coefficient according to the time difference between the SAR acquisition date and the date of the last irrigation event that occurred before the SAR acquisition ( Δ t ). Δ t was considered as a proxy soil moisture measure.
The main findings showed that the C band is suitable for the detection of irrigation events over moderately developed vegetation cover (NDVI < 0.7 ) regardless of the crop type, where the S1 C-band time series analysis emphasized that the C band remains sensitive to the soil moisture variation following irrigation or rainfall. The results also demonstrated that the C band’s usefulness for irrigation detection becomes limited for well-developed (NDVI < 0.7 ) Gramineae crops as the C-band sensitivity to soil moisture becomes negligible. However, well-developed legume crops did not constrain the detection of irrigation events using the C-band signal, mainly due to lesser attenuation of the C band by the legume cover. The results also demonstrated that the sensitivity of the L band to soil moisture and thus its potential for irrigation detection was generally higher than that of the C band. Regardless of the vegetation’s development stage and the vegetation characteristics (Gramineae or legumes), the L band showed high sensitivity to the soil dryness/wetness. The analysis of the L-band backscattering coefficient according to the Δ t values showed decreasing values of the backscattering coefficient as the soil gradually dried after an irrigation event. With the near future planned L-band sensors (NISAR, Tandem L, PALSAR-3), the use of L-band data can provide accurate detection of irrigation events with higher confidence mainly for well-developed vegetation. The combined use of L- and C-band data will allow enhancement of the temporal resolution of SAR acquisitions and the detection of almost all irrigation events.

Author Contributions

Conceptualization, H.B. and N.B.; Data curation, H.B.; Formal analysis, H.B. and N.B.; Investigation, H.B.; Methodology, H.B. and N.B.; Software, H.B.; Supervision, F.C., M.Z. and N.B.; Validation, H.B., M.Z., F.C. and N.B.; Visualization, H.B.; Writing—original draft, H.B.; Writing—review and editing, N.B., F.C. and M.Z. All authors have read and agreed to the published version of the manuscript.

Funding

This research received funding from the French Space Study Center (CNES, TOSCA 2022 project) and the National Research Institute for Agriculture, Food and the Environment (INRAE).

Institutional Review Board Statement

Not applicable.

Informed Consent Statement

Not applicable.

Data Availability Statement

Sentinel-1 data are available via the Copernicus open access hub (https://scihub.copernicus.eu/dhus/#/home, accessed on 1 May 2022).

Acknowledgments

The authors wish to thank the French Space Study Center (TOSCA 2022) and the National Research Institute for Agriculture, Food and Environment (INRAE) for supporting this work. Authors would like to thank also the European Space Agency (ESA) for providing the S1 images, the Japan Aerospace Exploration Agency (JAXA) for the PALSAR-2/ALOS-2 images and the French Land Data Center (Theia) for providing the S2 images.

Conflicts of Interest

The authors declare no conflict of interest.

References

  1. Food and Agriculture Organization (FAO). Water for Sustainable Food and Agriculture; FAO: Rome, Italy, 2017; ISBN 978-92-5-109977-3. [Google Scholar]
  2. Ferguson, C.R.; Pan, M.; Oki, T. The Effect of Global Warming on Future Water Availability: CMIP5 Synthesis. Water Resour. Res. 2018, 54, 7791–7819. [Google Scholar] [CrossRef]
  3. Tramblay, Y.; Koutroulis, A.; Samaniego, L.; Vicente-Serrano, S.M.; Volaire, F.; Boone, A.; Le Page, M.; Llasat, M.C.; Albergel, C.; Burak, S.; et al. Challenges for Drought Assessment in the Mediterranean Region under Future Climate Scenarios. Earth-Sci. Rev. 2020, 210, 103348. [Google Scholar] [CrossRef]
  4. García-Tejero, I.F.; Durán-Zuazo, V.H.; Muriel-Fernández, J.L.; Rodríguez-Pleguezuelo, C.R. Water and Sustainable Agriculture. In Water and Sustainable Agriculture; Springer: Berlin/Heidelberg, Germany, 2011; pp. 1–94. [Google Scholar]
  5. Schaldach, R.; Koch, J.; Aus der Beek, T.; Kynast, E.; Flörke, M. Current and Future Irrigation Water Requirements in Pan-Europe: An Integrated Analysis of Socio-Economic and Climate Scenarios. Glob. Planet. Chang. 2012, 94–95, 33–45. [Google Scholar] [CrossRef]
  6. Maselli, F.; Battista, P.; Chiesi, M.; Rapi, B.; Angeli, L.; Fibbi, L.; Magno, R.; Gozzini, B. Use of Sentinel-2 MSI Data to Monitor Crop Irrigation in Mediterranean Areas. Int. J. Appl. Earth Obs. Geoinf. 2020, 93, 102216. [Google Scholar] [CrossRef]
  7. Siebert, S.; Döll, P.; Hoogeveen, J.; Faures, J.-M.; Frenken, K.; Feick, S. Development and Validation of the Global Map of Irrigation Areas. Hydrol. Earth Syst. Sci. 2005, 9, 535–547. [Google Scholar] [CrossRef]
  8. Ozdogan, M.; Gutman, G. A New Methodology to Map Irrigated Areas Using Multi-Temporal MODIS and Ancillary Data: An Application Example in the Continental US. Remote Sens. Environ. 2008, 112, 3520–3537. [Google Scholar] [CrossRef] [Green Version]
  9. Massari, C.; Modanesi, S.; Dari, J.; Gruber, A.; De Lannoy, G.J.M.; Girotto, M.; Quintana-Seguí, P.; Le Page, M.; Jarlan, L.; Zribi, M.; et al. A Review of Irrigation Information Retrievals from Space and Their Utility for Users. Remote Sens. 2021, 13, 4112. [Google Scholar] [CrossRef]
  10. Bazzi, H.; Baghdadi, N.; Fayad, I.; Zribi, M.; Belhouchette, H.; Demarez, V. Near Real-Time Irrigation Detection at Plot Scale Using Sentinel-1 Data. Remote Sens. 2020, 12, 1456. [Google Scholar] [CrossRef]
  11. Gao, Q.; Zribi, M.; Escorihuela, M.; Baghdadi, N.; Segui, P. Irrigation Mapping Using Sentinel-1 Time Series at Field Scale. Remote Sens. 2018, 10, 1495. [Google Scholar] [CrossRef] [Green Version]
  12. Pageot, Y.; Baup, F.; Inglada, J.; Baghdadi, N.; Demarez, V. Detection of Irrigated and Rainfed Crops in Temperate Areas Using Sentinel-1 and Sentinel-2 Time Series. Remote Sens. 2020, 12, 3044. [Google Scholar] [CrossRef]
  13. Le Page, M.; Jarlan, L.; El Hajj, M.M.; Zribi, M.; Baghdadi, N.; Boone, A. Potential for the Detection of Irrigation Events on Maize Plots Using Sentinel-1 Soil Moisture Products. Remote Sens. 2020, 12, 1621. [Google Scholar] [CrossRef]
  14. Bazzi, H.; Baghdadi, N.; Fayad, I.; Charron, F.; Zribi, M.; Belhouchette, H. Irrigation Events Detection over Intensively Irrigated Grassland Plots Using Sentinel-1 Data. Remote Sens. 2020, 12, 4058. [Google Scholar] [CrossRef]
  15. Baghdadi, N.; Zribi, M.; Loumagne, C.; Ansart, P.; Anguela, T. Analysis of TerraSAR-X Data and Their Sensitivity to Soil Surface Parameters over Bare Agricultural Fields. Remote Sens. Environ. 2008, 112, 4370–4379. [Google Scholar] [CrossRef] [Green Version]
  16. Baghdadi, N.; Holah, N.; Zribi, M. Calibration of the Integral Equation Model for SAR Data in C-band and HH and VV Polarizations. Int. J. Remote Sens. 2006, 27, 805–816. [Google Scholar] [CrossRef]
  17. Baghdadi, N.; Abou Chaaya, J.; Zribi, M. Semiempirical Calibration of the Integral Equation Model for SAR Data in C-Band and Cross Polarization Using Radar Images and Field Measurements. IEEE Geosci. Remote Sens. Lett. 2011, 8, 14–18. [Google Scholar] [CrossRef] [Green Version]
  18. Baghdadi, N.N.; El Hajj, M.; Zribi, M.; Fayad, I. Coupling SAR C-Band and Optical Data for Soil Moisture and Leaf Area Index Retrieval over Irrigated Grasslands. IEEE J. Sel. Top. Appl. Earth Obs. Remote Sens. 2016, 9, 1229–1243. [Google Scholar] [CrossRef] [Green Version]
  19. Hajj, M.; Baghdadi, N.; Belaud, G.; Zribi, M.; Cheviron, B.; Courault, D.; Hagolle, O.; Charron, F. Irrigated Grassland Monitoring Using a Time Series of TerraSAR-X and COSMO-SkyMed X-Band SAR Data. Remote Sens. 2014, 6, 10002–10032. [Google Scholar] [CrossRef] [Green Version]
  20. Hamze, M.; Baghdadi, N.; El Hajj, M.M.; Zribi, M.; Bazzi, H.; Cheviron, B.; Faour, G. Integration of L-Band Derived Soil Roughness into a Bare Soil Moisture Retrieval Approach from C-Band SAR Data. Remote Sens. 2021, 13, 2102. [Google Scholar] [CrossRef]
  21. Bazzi, H.; Baghdadi, N.; Ienco, D.; El Hajj, M.; Zribi, M.; Belhouchette, H.; Escorihuela, M.J.; Demarez, V. Mapping Irrigated Areas Using Sentinel-1 Time Series in Catalonia, Spain. Remote Sens. 2019, 11, 1836. [Google Scholar] [CrossRef] [Green Version]
  22. Bazzi, H.; Ienco, D.; Baghdadi, N.; Zribi, M.; Demarez, V. Distilling Before Refine: Spatio-Temporal Transfer Learning for Mapping Irrigated Areas Using Sentinel-1 Time Series. IEEE Geosci. Remote Sens. Lett. 2020, 17, 1909–1913. [Google Scholar] [CrossRef]
  23. Bazzi, H.; Baghdadi, N.; El Hajj, M.; Zribi, M. Potential of Sentinel-1 Surface Soil Moisture Product for Detecting Heavy Rainfall in the South of France. Sensors 2019, 19, 802. [Google Scholar] [CrossRef] [PubMed] [Green Version]
  24. Ulaby, F.T. Microwave Remote Sensing Active and Passive. In Rader Remote Sensing and Surface Scattering and Emission Theory; Artech House Publishers: Norwood, MA, USA, 1982; pp. 848–902. [Google Scholar]
  25. El Hajj, M.; Baghdadi, N.; Bazzi, H.; Zribi, M. Penetration Analysis of SAR Signals in the C and L Bands for Wheat, Maize, and Grasslands. Remote Sens. 2018, 11, 31. [Google Scholar] [CrossRef] [Green Version]
  26. Nasrallah, A.; Baghdadi, N.; El Hajj, M.; Darwish, T.; Belhouchette, H.; Faour, G.; Darwich, S.; Mhawej, M. Sentinel-1 Data for Winter Wheat Phenology Monitoring and Mapping. Remote Sens. 2019, 11, 2228. [Google Scholar] [CrossRef] [Green Version]
  27. Joseph, A.T.; van der Velde, R.; O’Neill, P.E.; Lang, R.; Gish, T. Effects of Corn on C- and L-Band Radar Backscatter: A Correction Method for Soil Moisture Retrieval. Remote Sens. Environ. 2010, 114, 2417–2430. [Google Scholar] [CrossRef]
  28. He, B.; Xing, M.; Bai, X. A Synergistic Methodology for Soil Moisture Estimation in an Alpine Prairie Using Radar and Optical Satellite Data. Remote Sens. 2014, 6, 10966–10985. [Google Scholar] [CrossRef] [Green Version]
  29. Srivastava, H.S.; Patel, P.; Sharma, K.P.; Krishnamurthy, Y.V.N.; Dadhwal, V.K. A Semi-Empirical Modelling Approach to Calculate Two-Way Attenuation in Radar Backscatter from Soil Due to Crop Cover. Curr. Sci. 2011, 100, 1871–1874. [Google Scholar]
  30. Weiß, T.; Ramsauer, T.; Jagdhuber, T.; Löw, A.; Marzahn, P. Sentinel-1 Backscatter Analysis and Radiative Transfer Modeling of Dense Winter Wheat Time Series. Remote Sens. 2021, 13, 2320. [Google Scholar] [CrossRef]
  31. Mérot, A. Analyse et Modélisation Du Fonctionnement Biophysique et Décisionnel d’un Système Prairial Irrigué-Application Aux Prairies Plurispécifiques de Crau En Vue de l’élaboration d’un Outil d’Aide à La Décision. Ph.D. Thesis, Ecole Nationale Superieure Agronomique de Montpelli, Montpellier, France, 2007. [Google Scholar]
  32. El Hajj, M.; Baghdadi, N.; Zribi, M. Comparative Analysis of the Accuracy of Surface Soil Moisture Estimation from the C- and L-Bands. Int. J. Appl. Earth Obs. Geoinf. 2019, 82, 101888. [Google Scholar] [CrossRef]
  33. Mattia, F.; Le Toan, T.; Picard, G.; Posa, F.I.; D’Alessio, A.; Notarnicola, C.; Gatti, A.M.; Rinaldi, M.; Satalino, G.; Pasquariello, G. Multitemporal C-Band Radar Measurements on Wheat Fields. IEEE Trans. Geosci. Remote Sens. 2003, 41, 1551–1560. [Google Scholar] [CrossRef]
  34. Picard, G.; Le Toan, T.; Mattia, F. Understanding C-Band Radar Backscatter from Wheat Canopy Using a Multiple-Scattering Coherent Model. IEEE Trans. Geosci. Remote Sens. 2003, 41, 1583–1591. [Google Scholar] [CrossRef]
  35. Del Frate, F.; Ferrazzoli, P.; Guerriero, L.; Strozzi, T.; Wegmuller, U.; Cookmartin, G.; Quegan, S. Wheat Cycle Monitoring Using Radar Data and a Neural Network Trained by a Model. IEEE Trans. Geosci. Remote Sens. 2004, 42, 35–44. [Google Scholar] [CrossRef]
  36. El Hajj, M.; Baghdadi, N.; Zribi, M.; Bazzi, H. Synergic Use of Sentinel-1 and Sentinel-2 Images for Operational Soil Moisture Mapping at High Spatial Resolution over Agricultural Areas. Remote Sens. 2017, 9, 1292. [Google Scholar] [CrossRef] [Green Version]
  37. Baghdadi, N.; El Hajj, M.; Zribi, M.; Bousbih, S. Calibration of the Water Cloud Model at C-Band for Winter Crop Fields and Grasslands. Remote Sens. 2017, 9, 969. [Google Scholar] [CrossRef] [Green Version]
  38. Brown, S.C.; Quegan, S.; Morrison, K.; Bennett, J.C.; Cookmartin, G. High-Resolution Measurements of Scattering in Wheat Canopies-Implications for Crop Parameter Retrieval. IEEE Trans. Geosci. Remote Sens. 2003, 41, 1602–1610. [Google Scholar] [CrossRef] [Green Version]
  39. Cookmartin, G.; Saich, P.; Quegan, S.; Cordey, R.; Burgess-Allen, P.; Sowter, A. Modeling Microwave Interactions with Crops and Comparison with ERS-2 SAR Observations. IEEE Trans. Geosci. Remote Sens. 2000, 38, 658–670. [Google Scholar] [CrossRef]
  40. ALOS-2/PALSAR-2. Available online: https://www.eorc.jaxa.jp/ALOS-2/en/about/palsar2.htm (accessed on 18 November 2021).
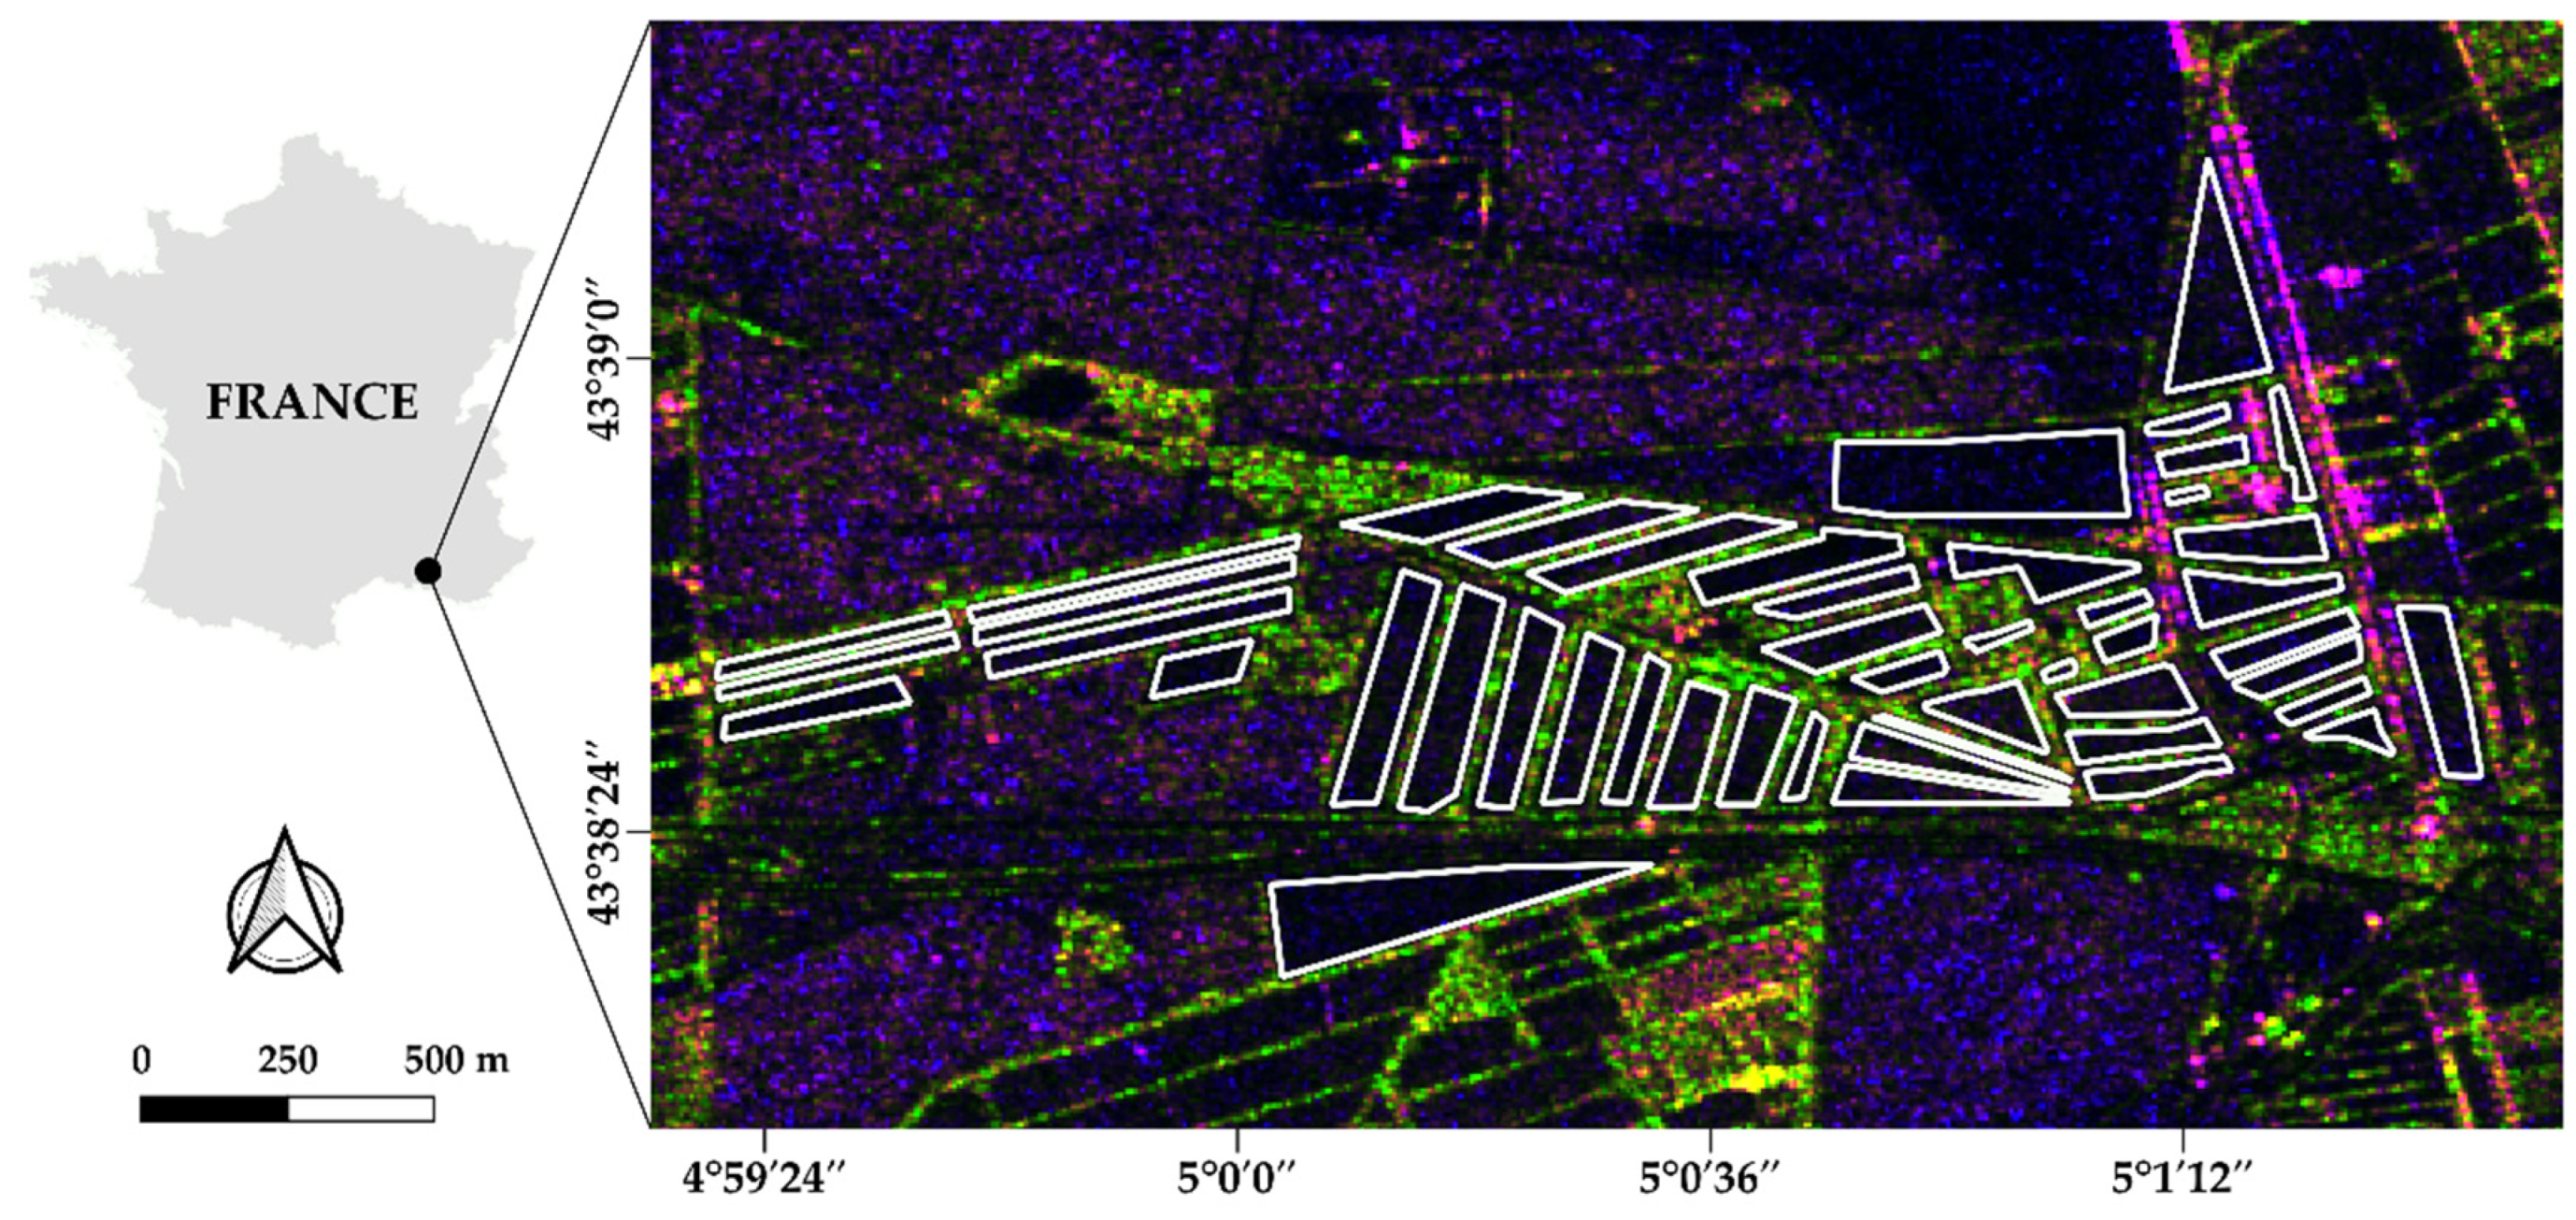
Figure 1. Location of the study site (Crau Plain). White polygons delineate the 45 irrigated grassland plots. The background is an RGB composite color of the ALOS-2 L-band SAR image acquired on 21 May 2019 (R: HH, G: HV and B: HH/HV).
Remotesensing 14 02312 g001
Figure 2. NDVI temporal profile representing the 4 grassland growth cycles of the reference 45 irrigated grassland plots. The shaded region is the standard deviation of the average NDVI values over the 45 plots. Dashed arrows show the dates of the available L-band ALOS-2 images.
Remotesensing 14 02312 g002
Figure 3. Representative examples of actual vegetation during the first and second crop cycles. (a) Moderately developed coarse hay (cycle I), (b) well-developed coarse hay (cycle I), and (c) undeveloped legume grass (cycle II).
Remotesensing 14 02312 g003
Figure 4. Flowchart of the performed comparative analysis. Arrows in blue represent the time series analysis. Arrows in magenta represent the C–L correlation analysis with Δ t values.
Remotesensing 14 02312 g004
Figure 5. Temporal evolution of the S1 C-band SAR backscattering for 4 different grassland plots during the first growth cycle between March and May 2019. The green dotted line represents the S2 NDVI values multiplied by 100. The dashed blue lines represents the irrigation events and the solid blue bars represent the rainfall amounts. The grey boxes show the σ L 0 values derived from the ALOS-2 image acquired on 21/05/2019 with the corresponding Δ t value, the last irrigation date, and the NDVI value on 21/05/2019. (a) A1 at 44°, (b) A2 at 35°, (c) D2 at 42°, and (d) D1 at 32°.
Remotesensing 14 02312 g005
Figure 6. Examples of the differences in the SAR backscattering coefficients for grassland plots as a function of the time difference between the last irrigation event and the SAR acquisition date ( Δ t ) on 21/05 for (a) the S1 C band in VV polarization and (b) ALOS-2 L band in HH polarization. Blue, green, and black represent plots with Δ t from 0–1 days, 4–6 days, and more than 10 days, respectively.
Remotesensing 14 02312 g006
Figure 7. Variation in the σ C 0 and σ L 0 values as a function of the time difference between the SAR acquisition date and the last irrigation date for the C-band and L-band images acquired on 21/05/2019 in the growth cycle I. Each point represents a reference grassland plot. Black and red points correspond to grassland plots with NDVI 0.7 and NDVI > 0.7 , respectively. (a) σ C 0 in VV, (b) σ C 0 in VH, (c) σ L 0 in HH, and (d) σ L 0 in HV.
Remotesensing 14 02312 g007
Figure 8. Temporal evolution of the S1 C-band SAR backscattering for 4 different grassland plots during the second growth cycle between June and July 2019. The green dotted line represents the S2 NDVI values multiplied by 100. The dashed blue lines represents the irrigation events and the solid blue bars represent the rainfall amounts. The grey boxes show the σ L 0 values derived from the ALOS-2 image acquired on 16/07/2019 with the corresponding Δ t value, the last irrigation date, and the NDVI value on 16/07/2019. (a) A1 at 44°, (b) D2 at 42°, (c) D1 at 32°, and (d) A2 at 35°.
Remotesensing 14 02312 g008aRemotesensing 14 02312 g008b
Figure 9. Examples of the differences in the SAR backscattering coefficients for grassland plots as a function of the time difference between the last irrigation event and the SAR acquisition date ( Δ t ) on 16/07 for (a) S1 C band in VV polarization and (b) ALOS-2 L band in HH polarization. Blue, green, and black represent plots with Δ t from 0–1 days, 4–6 days, and more than 10 days, respectively.
Remotesensing 14 02312 g009
Figure 10. Variation in the σ C 0 and σ L 0 values as a function of the time difference ( Δ t in days) between the SAR acquisition date and the irrigation date for the C-band and L-and images acquired on 16/07/2019 in the growth cycle II. Each point represents a reference grassland plot. Black and red points correspond to plots with NDVI 0.7 and NDVI > 0.7 , respectively. (a) σ C 0 in VV, (b) σ C 0 in VH, (c) σ L 0 in HH, and (d) σ L 0 in HV.
Remotesensing 14 02312 g010
Publisher’s Note: MDPI stays neutral with regard to jurisdictional claims in published maps and institutional affiliations.