Abstract
The construction of Longyangxia Reservoir has altered the hydrogeological conditions of its banks. Infiltration and erosion caused by the periodic rise and fall of the water level leads to collapse of the reservoir banks and local deformation of the landslide. Due to heterogeneous topographic characteristics across the region, water level also varies between different location. Previous research on the influence of fluctuations in reservoir water level on landslide deformation has focused on single-point monitoring of specific slopes, and single-point water level monitoring data have often been used instead of water level data for the entire reservoir region. In addition, integrated remote sensing methods have seldom been used for regional analysis. In this study, the freely-available Landsat8 OLI and Sentinel-2 data were used to extract the water level of Longyangxia Reservoir using the NDWI method, and Sentinel-1A data were used to obtain landslide deformation time series using SBAS-InSAR technology. Taking the Chana, Chaxi, and Mangla River Estuary landslides (each having different reservoir water level depths) as typical examples, the influence of changes in reservoir water level on the deformation of three wading landslides was analyzed. Our main conclusions are as follows: First, the change in water level is the primary external factor controlling the deformation velocity and trend of landslides in the Longyangxia Reservoir, with falling water levels having the greatest influence. Second, the displacement of the Longyangxia Reservoir landslides lags water level changes by 0 to 62 days. Finally, this study provides a new method applicable other areas without water level monitoring data.
1. Introduction
The upper reaches of the Yellow River Basin are located in the transition zone between the Qinghai–Tibet Plateau and Loess Plateau in China. Influenced by the tectonic uplift of the Qinghai–Tibet Plateau, the region has large topographic relief (Figure 1a) [1]. Meanwhile, strong incision by the Yellow River has created high and steep terrain on both banks, promoting the occurrence of landslides. References [2,3], investigated disaster points in the upper reaches of the Yellow River and found that there are a total of 205 large and small landslides in the area, including 15 giant landslides (volume greater than 100 million m3). However, the upper reaches of the Yellow River have abundant hydraulic resources and have been developed as an important hydropower corridor following construction projects by the Chinese government to promote regional economic development. In this section of the Yellow River, 12 cascade hydropower stations have been built on the main river, with a total storage capacity of 342.66 billion m3. Of these, the existing Longyangxia reservoir has the largest storage capacity (247 billion m3; Figure 1b). Two hydropower stations are currently under construction, which have a total storage capacity of 14.76 billion m3. The construction of hydropower stations can alter the local hydrogeological conditions, which in turn can exacerbate existing geological hazards or result in new ones. A reservoir impoundment can cause instability and destruction of the dam, for example the Malpasset Dam [4], or Buffalo Creek Dam [5]; in addition, reservoir landslides such as the Vajoint Reservoir landslide [6] and Qianjiangping landslide [7], may trigger floods and tsunamis [5], threatening the life and property of people in the downstream areas, as well as affecting the integrity of engineering and construction facilities and unobstructed inland waterways [8,9].
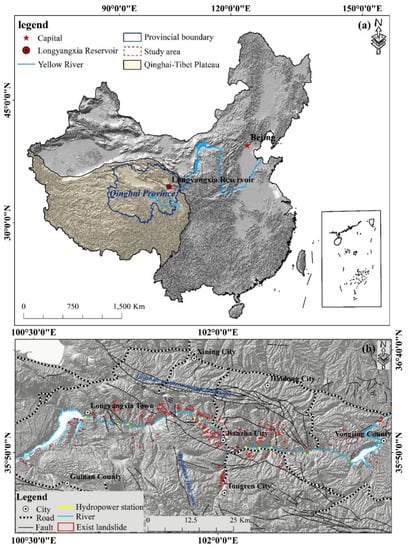
Figure 1.
(a) Geographical location of Longyangxia Reservoir in China. The red solid line is the border of Qinghai Province, the blue shaded area is the Qinghai–Tibet Plateau, and the red triangle is the location of Longyangxia Reservoir. (b) Geological disasters, faults, and hydropower stations in the upper reaches of the Yellow River.
Previous studies have shown that monthly fluctuations in reservoir water level can reduce slope stability [10,11,12]. These water level changes increase the reactivation probability of old landslides, as well as induce new landslides [13,14]. This may result in the reservoir becoming the main geological hazard-prone and high-risk area. Periodic variations in reservoir water level may also reactivate reservoir bank landslides. For example, seasonal changes in reservoir water level have been shown to significantly impact landslide occurrence following reservoir impoundment [9,15].
Traditional methods, such as geodetic surveys, inclinometers, photogrammetry, and GPS, have been used for landslide monitoring. However, these methods have the disadvantages of being expensive and time-consuming, and they produce only a few monitoring points covering a limited area [16]. In addition, the majority of the available water level data comes from hydrological stations, with limited monitoring points, which means that water level data in the vicinity of specific landslides cannot be obtained. At the same time, the distribution of potential landslides is unknown, hindering the deployment of water level monitoring instruments, which makes it particularly difficult to carry out research on the impact of water level changes on landslide deformation over large areas.
Synthetic aperture radar (SAR) is an advanced microwave imaging equipment [17]. Satellite sensors actively transmit electromagnetic waves to ground targets and receive backscattered signals; the backscattered signals are stored as complex images to record amplitude and phase information [18]. Interferometric synthetic aperture radar (InSAR) technology uses the phase difference between two SAR images obtained in the same area at different times to estimate the deformation along the line of sight of the radar [19]. The monitoring accuracy of InSAR can reach millimeter level over a wide area [20,21], and it has the advantages of detecting change at high resolution, large areal coverage, “all-weather” capability, and daytime/nighttime access of the radar sensors [22]. These attributes provide the possibility of measuring the displacement of a landslide in the slow-moving stage [23]. The two most common multitemporal technologies are permanent scatterer interferometric synthetic aperture radar (PS-InSAR) [24,25], which is dominated by permanent scatterers, and small baseline subset interferometric synthetic aperture radar (SBAS-InSAR) [26,27], which is dominated by distributed scatterers. The application of these technologies has achieved outstanding results in the study of land subsidence and landslide movement [28,29,30,31,32,33,34]. Remote sensing has also become a conventional method in the monitoring of land surface water [35]. Landsat and Sentinel-2 images have the advantages of a fixed revisit period, large observation range, easy access, high resolution, and rich surface feature information. They have been widely used to monitor water resources and flood disasters and to extract water body information [36,37,38]. Commonly used water-monitoring methods include the normalized difference water index (NDWI) [39], modified NDWI (MNDWI) [40], and enhanced water index (EWI) [41]; these methods have a high accuracy for flood disaster monitoring [38,42].
Since the impoundment of Longyangxia Reservoir in 1986, the geological environment of slopes in the reservoir region has changed by varying amounts, and landslide activity within the vicinity of the reservoir remains unclear. Previous related research on geological disasters around Longyangxia Reservoir has focused mainly on landslide dating and landslide risk assessment [43,44]. Here, we use SBAS-InSAR technology to estimate the surface displacement of Longyangxia Reservoir, together with NDWI to extract water level data for specific slops. The Chana, Chaxi, and Mangla River Estuary landslides were selected as typical cases to explore the relationship between fluctuations in reservoir water level of the reservoir and deformation of the reservoir banks, and thereby to analyze the influence of water level changes on the banks in terms of promoting landslides. Our method is easy to use, and the remote sensing images are open-source and easy to obtain, which can provide new ideas for such research in other areas without water level data.
2. Study Area
The Longyangxia Reservoir straddles the boundary between Gonghe County and Guinan County in Qinghai Province. It has a perimeter length of ~123 km and is a first-level hydropower station with the largest reservoir capacity in the upper reaches of the Yellow River (Figure 2). The region has a typical plateau arid–semiarid continental climate, with average annual precipitation of 240–440 mm, and evaporation of 1327–1379 mm [45]. The vegetation coverage is low, and thus, its role in soil and water resources conservation is limited. Affected by regional differential tectonic movement, the north bank of Longyangxia Reservoir has developed multiple-level terraces, while the terrain of the south bank is steep and there are numerous ravines. The relative heights of the slopes are mainly 300–500 m, and the slope angles are 35–45°. Water infiltration combined with water erosion has reduced the shear strength of the soil on the south bank, forming cavities which result in slope instability.
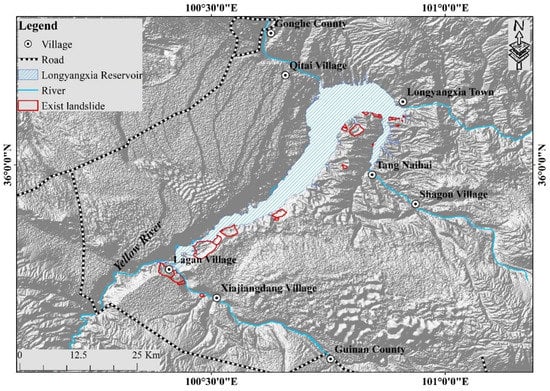
Figure 2.
Longyangxia Reservoir landslide.
The strata in the study are as follows: Neogene glutenite, sandstone, argillaceous sandstone, and mudstone; lower Pleistocene silty mudstone, siltstone mixed with variegated fine sandstone, mudstone, fine sandstone and glutenite interbedded (mainly distributed on the right bank of the Longyangxia Reservoir, it is a slippery stratum in the area), with calcareous concretions and semicemented conglomerate; and Quaternary to Holocene fine-grained quartz sandstone, and upper Pleistocene alluvial–pluvial gray gravel, sand, with a clay layer [3] (Figure 3).
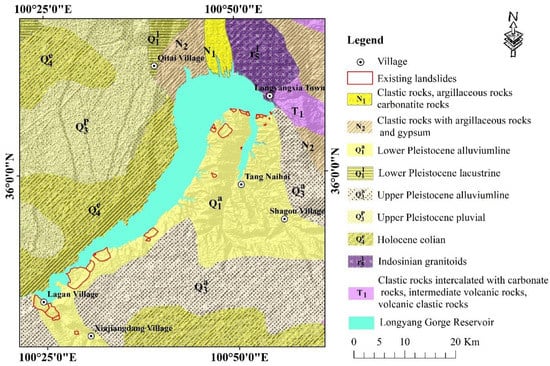
Figure 3.
Geological map of the Longyangxia Reservoir area is digitized from reference [3].
Frequent earthquakes have occurred at the Longyangxia Reservoir, which have damaged or destroyed the accumulated structure of old landslides, and reduced slope stability [46,47]. Additionally, after the reservoir was impounded, static and dynamic water pressure has altered the mechanical equilibrium of the original slope, water-eroded caves have developed, and the bank slope morphology has changed significantly, resulting in a large number of collapses and small landslides [48]. Wei [44] identified 24 landslides in the Longyangxia Reservoir area, most of which have large scale and long sliding distances; these landslides have inflicted many human casualties and major economic losses.
3. Data and Methods
3.1. Data Sources
Forty-five scenes of Sentinel-1A single-look complex C-Band SAR datasets covering the study area were acquired to obtain the displacement velocity of Longyangxia Reservoir. Sentinel-1A data time series from 1 March 2017 to 21 March 2020 (Table 1) have a temporal resolution of 24 days. Precise orbit ephemerides (POD) data provided by the European Space Agency (ESA), and ALOS World 3D 12.5 m digital elevation model (DEM), generated by ALOS PRISM, were used to remove the topography-related phase and geocoding. Real water level data was sourced from the Hydroinfo website managed by the Ministry of Water Resources of China (http:/xxfb.Mwr.cn/index.html/ accessed on 10 June 2021).

Table 1.
Sentinel-1A data parameters.
We used seven scenes of Sentinel-2A data, and five scenes of Sentinel-2B data (Table 2) (https://earthexplorer.usgs.gov/ accessed on 6 July 2020), 30 scenes of Landsat 8 optical image data (Table 3) (https://www.gscloud.cn/ accessed on 4 July 2020), to extract the boundary of the Longyangxia Reservoir area from the period 15 February 2017 to 18 March 2020. Three additional images from that period were unavailable due to weather conditions; hence, a total of 42 scenes of optical remote-sensed data were used to extract the water level.

Table 2.
Sentinel-2 data parameters.

Table 3.
Landsat8 OLI data parameters.
Precipitation data for the Longyangxia Reservoir area were obtained by kriging interpolation in ArcGIS, using precipitation observations at 27 basic stations in Qinghai Province (Figure 4) (daily surface climate data values, China Meteorological Data Network).
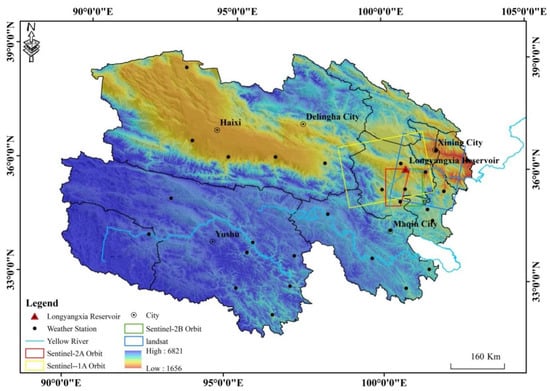
Figure 4.
Track coverage of the SAR image and multisource remote sensing image data in the study area.
3.2. Principles of SBAS-InSAR Technology
SBAS-InSAR technology generates interferograms with a small perpendicular baseline, short time interval, and a small Doppler center frequency difference [26]. The technology limits the decorrelation phenomena caused by conventional InSAR due to the large spatial baseline, and the application of the singular value decomposition method allows us to easily link independent SAR acquisition datasets separated by large baselines, thus increasing the observation temporal sampling rate. The processing sequence of the SBAS-InSAR technology is described below.
The master and slave images need to be registered before interference processing, so that SAR image pixels of a given area acquired at different times will overlap. Spatial decorrelation occurs due to the different incidence angles of radar beams during radar scanning. The longer the time interval between radar images, the greater the temporal decorrelation; and the longer the perpendicular baseline between radar images, the greater the likelihood of spatial decorrelation [49]. Therefore, in this study, a temporal baseline of 60 days and 40% of the critical baseline were used to generate a connection diagram, yielding 89 interferogram pairs (Figure 5). The Delaunay 3D unwrapping method uses a Delaunay triangle mesh for unwrapping (only the part with high coherence is unwrapped, which is not affected by the low-coherence phase element) [50,51]. However, there are numerous water bodies and low-coherence areas in the Longyangxia Reservoir area. We used the Delaunay MCF unwrapping method (with the unwrapping threshold set to 0.35) to minimize the impact of phase jumps. An external DEM was used to remove the terrain phase, and the flat phase was removed using the interferogram obtained by the conjugate multiplication of two images. We used a Goldstein filter to reduce noise, with a window size of 32 × 32. Manual inspection of the generated interferograms was carried out to remove interferograms with low coherence, poor phase unwrapping, and which were severely affected by atmospheric turbulence and the terrain phase [52]. Finally, the remaining interferogram pairs were used for interference inversion. Forty-five ground control points (GCPs) with coherence > 0.75 were used to eliminate the influence of residual orbital errors. GCPs were selected that were located far from the area of deformation, with a high coherence and good unwrapping area [53]. A linear inversion model was used to invert the first step and obtain the preliminary displacement rate. However, phase propagation delays can be caused by temporal changes in atmospheric conditions within the troposphere between SAR acquisitions. Therefore, a second step of inversion was performed to remove the atmospheric phase via low-pass spatial filtering and high-pass temporal filtering [54]. Finally, the singular value decomposition (SVD) method was used to obtain the time series of displacement in the Longyangxia Reservoir area.
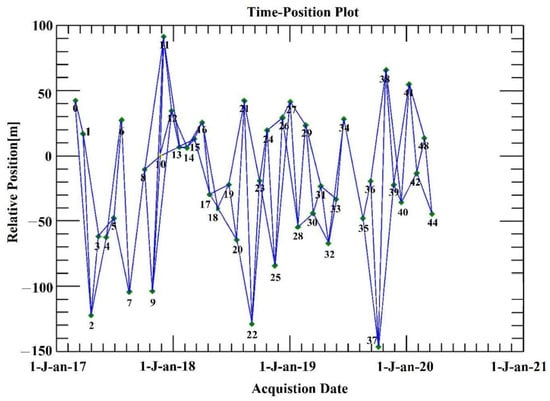
Figure 5.
Spatiotemporal baseline of the SAR images.
3.3. Water Level Extraction
In Landsat images, the B5, B4, and B3 bands synthesize standard false-color images with bright colors, which aids vegetation classification and water recognition (Figure 6a,b). The B8 band in the Sentinel-2 image is used to replace the near-infrared band for band calculation. In the infrared band, the water can absorb almost all of the incident energy in the near-infrared and mid-infrared bands, and so the reflected energy of the water body is very small, and the water body has a dark color in the image; however, the absorption energy of vegetation and soil in these two bands is small, and the brightness value of soils and vegetation in the image are higher [55]. The existing water body index usually uses the high absorptivity of water in the near-infrared and mid-infrared bands and the high reflectivity of the green band to emphasize water and weaken non-water bodies via the use of various mathematical operations for water extraction. There are few buildings around Longyangxia Reservoir, and signals from built land are few. In this study, NDWI was used to calculate the water index of Longyangxia Reservoir, using the following formula [39]:
where NDWI > 0 is water and NDWI < 0 is land, green is the green light band, and NIR is the near-infrared band.
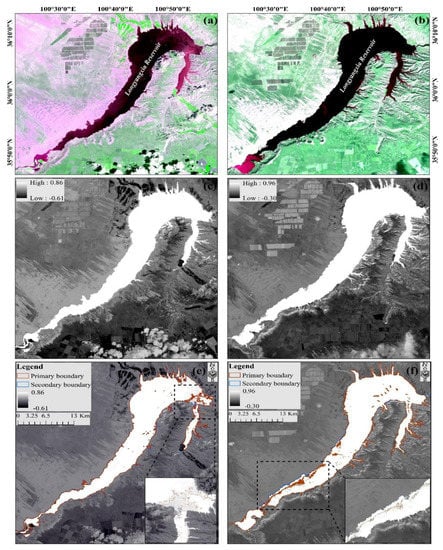
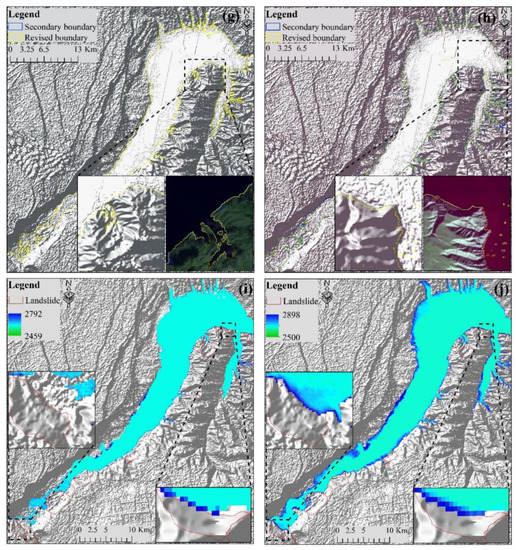
Figure 6.
Using NDWI to extract the water level of Longyangxia Reservoir, taking 16 July 2017 and 26 October 2019 as examples. (a) False color Landsat image on 16 July 2017; (b) False color Landsat image on 26 October 2019; (c) NDWI binarized image on 16 July 2017; (d) NDWI binarized image on 26 October 2019; (e) Water body boundaries under different segmentation thresholds on 16 July 2017; (f) Water bodies under different segmentation thresholds on 26 October 2019; (g) DEM shadow modeling to remove the water body that was erroneously extracted from the water body boundary on 16 July 2017; (h) DEM shadow modeling to remove the water body that was erroneously extracted from the water body boundary on 26 October 2019; (i) Water body boundary clipping DEM and specific slope water level data on 16 July 2017; (j) Water body boundary clipping DEM and specific slope water level data on 26 October 2019.
Before calculating the NDWI, the Landsat OLI images were calibrated for radiation and subjected to atmospheric correction in the ENVI software; the original Sentinel-2 images were resampled to the same resolution in SNAP software, and then the Sen2cor plug-in was used for atmospheric correction. The NDWI was calculated using the two images after preprocessing (Figure 6c,d). The NDWI file calculated from Sentinel-2 data was output to the GeoTIFF format and loaded into ENVI software, together with the Landsat8 OLI image, for threshold segmentation in order to obtain the water boundary of the reservoir at various times (Figure 6e,f). While extracting the water boundary, terrain shadow may be mistakenly extracted as water bodies. We calculated the topographic shadow of Longyangxia Reservoir by setting the azimuth and latitude parameters based on the DEM, using the 3D analysis tool box in ArcGIS. We removed the incorrect water boundary that is extracted (Figure 6g,h), and superimposed the corrected boundary on the high-resolution DEM to obtain the water level in the reservoir at different times. We then used the boundaries of the Chana, Chaxi, and Manla river Estuary landslides to cut the extracted water level (Figure 6i,j). Finally, the grid values of points in the middle and at both sides of each landslide were selected and averaged to obtain the water levels of the three landslides. The water level extraction results are listed in Table 4.

Table 4.
Water levels of Chaxi, Chana, and Manla River Estuary landslides in the Longyangxia reservoir area.
The flow chart of SBAS-InSAR and water level extraction technology is illustrated in Figure 7.
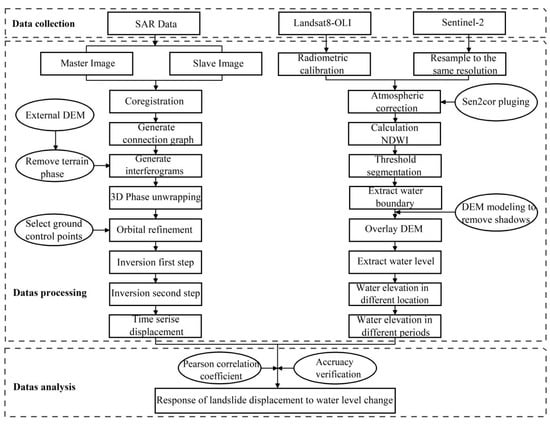
Figure 7.
Flow chart of the application of SBAS-InSAR technology and water level extraction.
3.4. Pearson Correlation Coefficient
Correlation analysis can reflect the degree of mutual influence between elements. The Pearson correlation coefficient is defined as the quotient of the covariance and standard deviation between two variables (Formula (2)). Here, the Pearson correlation coefficient was calculated between the real water level and the water level extracted by remote sensing, to verify the accuracy of the extracted water level. We then calculate the correlation between water level rise, fall, rainfall, and landslide displacement; this allowed us to explore the main influencing factors of landslide displacement, and quantitatively study the response time of landslide displacement to water level change. The formula is
where r is the correlation coefficient; σa represents the standard deviation of water level in a rising or falling stage; σb represents the standard deviation of landslide displacement in a rising or falling water level stage; and σab is the covariance between water level and landslide displacement in a rising or falling water level stage [56]. The correlation coefficient r has values between −1 and 1; the greater the absolute value of r, the stronger the correlation, and the greater the effect that water level change has on landslide deformation. In the same way, the correlation coefficient between rainfall and landslide in the rainy and dry seasons can also be obtained.
4. Results and Analysis
4.1. Time Series Analysis of Longyangxia Reservoir InSAR Displacements and Representative Landslides
SBAS-InSAR technology was used to obtain the displacement rate of Longyangxia reservoir between 1 March 2017 and 21 March 2020, along the direction of the radar line of sight (LOS). In the displacement rate diagram, positive values represent landslide displacement moving towards the sensor, and negative values represent landslide displacement away from the sensor. Longyangxia Reservoir is located in a region with an arid climate, with sparse vegetation dominated by low grass and shrubs (Figure 8b), which enables SBAS-InSAR to extract more distributed point targets. A total of 2,444,731 coherent point targets were extracted in a study area of 2470.3 km2, with an average density of 989.65 km−2. According to the standard deviation and average value of the coherent point targets, based on field surveys, the relative stability threshold of the study area was set to the range −10 to 10 mm/year, which is in good agreement with the field survey results. It is important to note that setting a threshold too small will cause an originally stable area to change to unstable and setting the threshold too large will cause the deformed area to be ignored. Reference to Figure 8a shows that from 1 March 2017 to 21 March 2020, the average displacement velocity of the Longyangxia Reservoir area was −47 to 28 mm/year, with 90% of the displacement velocity concentrated within the range of −10 mm to 10 mm/year, which indicates that most areas of the Longyangxia Reservoir are in a relatively stable state. However, 12 unstable slopes or landslides were identified (Table 5) in the area of steep topography on the south bank, concentrated in the area from the dam to the Wangshike section. Among these, the cumulative displacements of the Chana landslide and Chaxi landslide were −85.9 mm and −63.04 mm, respectively. The three-year cumulative displacements of the Mangla River Estuary landslide, and of a newly-identified potential landslide at the Yellow River inlet and Baiztan Landslide, were −40 mm to 60 mm, while the cumulative displacements of other landslides were less than −40 mm (Figure 9). In addition, the displacement monitoring results indicate that the ranges of the Chana, Chaxi, and Mangla River Estuary landslides are larger than those of the other landslides (for which the cumulative displacement is <40 mm) and the displacement velocities were greater.
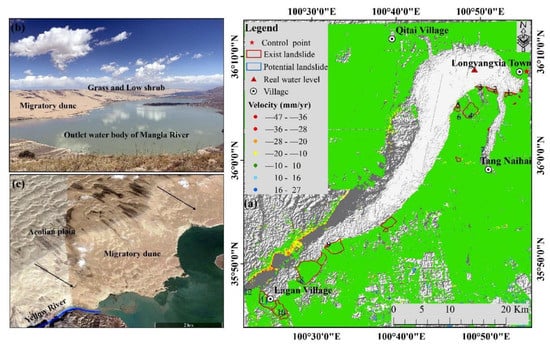
Figure 8.
(a) Average displacement rate of Longyangxia Reservoir from 1 March 2017 to 21 March 2020; (b) eolian sand and shrub vegetation on the north bank of the reservoir; (c) sand dune landforms on the north bank.

Table 5.
List of potential landslides.
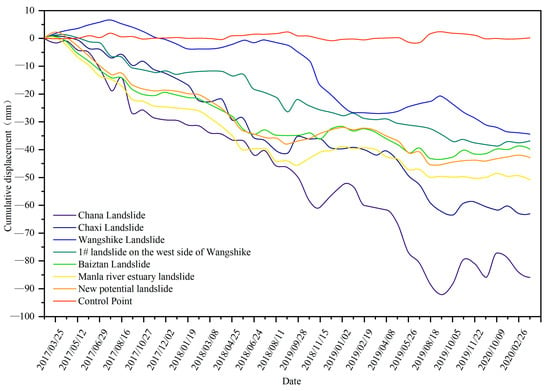
Figure 9.
Spatial deformation characteristics of Chaxi landslide. (a) Cumulative displacement of Chaxi landslide on March 1, 2017, (b) Cumulative displacement of the Chaxi landslide on February 12, 2018, (c) Cumulative displacement of Chaxi landslide on August 11, 2018, (d) Cumulative displacement of Chaxi landslide on May 2, 2019, (e) Cumulative displacement of Chaxi landslide on August 18, 2019, (f) Cumulative displacement of Chaxi landslide on October 5, 2019, (g) Cumulative displacement of Chaxi landslide on March 21, 2020.
There are two anomalous areas in Figure 8a, as follows: (1) A large area of migratory dunes or semifixed dunes on the north bank of Longyangxia Reservoir. Here, the shape of sand dunes will be modified to varying degrees under wind action, or the dunes may move faster than the upper limit of the displacement velocity that can be monitored by InSAR technology. This will result in decorrelation, and failure of the interferogram unwrapping, and results in a large area without deformation points on the north bank of the reservoir (Figure 8b). (2) Part of the north bank of the reservoir comprises desert, covered by shrub vegetation. Depending on seasonality and the influence of wind erosion and desertification, the sparse vegetation may be further reduced and gradually transition to desert. This causes the backscatter characteristics of the ground objects stored in the SAR image to change, resulting in a large displacement on the terrace on the north bank (Figure 8c).
As we have not obtained GPS data from the study area, the control point deformation is compared with the potential landslide deformation. As shown in Figure 9, the annual average deformation of the control point was 0.12 mm, and the annual cumulative deformation varied from −1.51 mm to 2.39 mm, which is much smaller than the relative stability threshold of this area. There were no singular values in the smoothing data near the control point, thus demonstrating the accuracy of the data in this study.
We selected the Chana, Chaxi, and Mangla River Estuary landslides as typical landslide case studies to analyze the influence of Longyangxia Reservoir water level change on landslide displacement. There are four main reasons behind our choices: (1) The large residual volume of the three landslides, the Chana landslide is 127 million m3, the Chaxi landslide is 35 million m3 [57], and the Mangla River Estuary landslide is 120 million m3 [2]. (2) Associated hazards: Once the Chana landslide and the Chaxi landslide slip into the reservoir, the resulting waves caused by this movement will endanger the lives of the surrounding people and the safe operation of the dam. The Mangla River Estuary landslide at the end of the reservoir will block the Yellow River, and subsequent rises in water level will potentially cause disastrous flooding for the village of Guohuyu. (3) Activity characteristics: The extent and deformation rate of the Chana, Chaxi, and Mangla River Estuary landslides are relatively large. (4) Characteristics of water level change: The Chana and Chaxi landslides are close to the head of the reservoir, where the water is deep. The Mangla River Estuary landslide is located at the end of the reservoir, where the water is shallow, and the water level has relatively large seasonal changes.
4.1.1. The Chana Landslide
The Chana landslide occurred in 1943, and has a length of 1900 m, a height difference of 420 m, and a planar area of 4 km2. The strata comprise sandy loam, clay, sand, clay, sandy loam, sand, and aeolian deposits from bottom to top, and the surface of the slope is covered with Quaternary collapse deposits. During the deformation monitoring period from 1 March 2017 to 21 March 2020, no deformation points were extracted in the western parts of the landslide, and the deformation points in the central part were sparse. The reasons for this may include the following: (i) Sentinel-1A provides ascending orbit data, the satellite flight direction is northwards, and the line of sight is east; therefore, the western part of the Chana landslide is susceptible to satellite geometric imaging. (ii) The central slope of the Chana landslide has a large vertical height difference, and the SAR imaging process is affected by the terrain, which can produce shadow effects. Therefore, we obtained the cumulative displacement along the line of sight in the eastern and central slope toe of the Chana landslide.
Taking the first SAR image as a reference (Figure 10a), we calculated the relative displacement of the other images to analyze the spatial deformation of the landslide. In the north–south direction, the rear edge of the Chana landslide is stable overall, and deformation is mainly located at the foot of the landslide body. In the east–west direction, the eastern part of the Chana landslide deformed first. As time progressed, the central part of the slope also experienced obvious displacement, but the deformation in the east was significantly larger than in the center (Figure 10c–f).
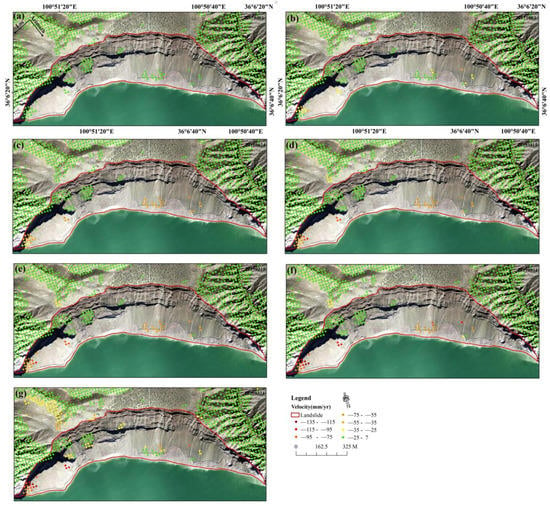
Figure 10.
Spatial deformation characteristics of the Chana landslide. (a) Cumulative displacement of Chana landslide on 1 March 2017, (b) Cumulative displacement of Chana landslide on 3 October 2017, (c) Cumulative displacement of Chana landslide on 24 June 2018, (d) Cumulative displacement of Chana landslide on 15 November 2018, (e) Cumulative displacement of Chana landslide on 19 February 2019, (f) Cumulative displacement of Chana landslide on 11 September 2019, (g) Cumulative displacement of Chana landslide on 21 March 2020.
Based on the InSAR deformation results, we conducted a field survey on the Chana landslide. The trailing edge of the landslide was a steep cliff with no large cracks. Large-scale steep scarps and small-scale secondary landslides were found to have occurred in the east near the sidewalls, the landslide toe has undergone various degrees of slumping, and there were even scattered broken blocks of soil (Figure 11b). The soil in the center of the landslide is loose, and there are local collapses, scattered stones, and many gullies on the slope surface. Overall, the shape of the slope is irregular, with concave–convex topography, and some of the soil has lost its underlying support (Figure 11c). In the western part of the landslide, surface cracks have developed, the soil structure is loose, and there is a high degree of fragmentation with isolated fallen soil blocks (Figure 11d).
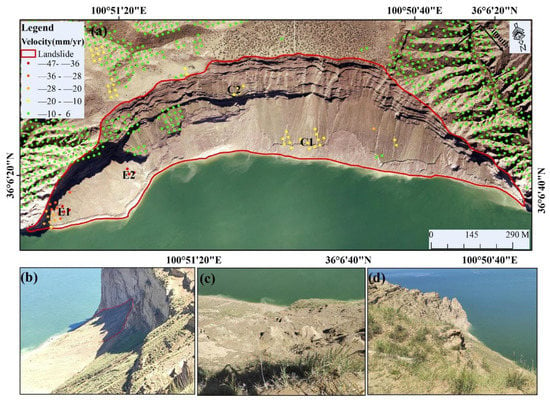
Figure 11.
(a) Deformation velocity of the Chana landslide. (b) A small landslide on the eastern side, (c) collapse position and scattered rocks in the central part, and (d) isolated soil blocks on the western side.
The eastern displacement of the Chana landslide is represented by E1 and E2, and the central part is represented by C1 and C2, from bottom to top (Figure 11a). It can be seen from Figure 12 that E1 and E2 have the largest deformation rates (cumulative displacement −85.90 mm to −111.46 mm) and the same deformation trend. The overall landslide displacement exhibits a fluctuating decline, but with accelerated displacement over short periods of time. The water level of Longyangxia Reservoir rises from July to November each year, and then falls from November to April of the following year. When the reservoir water level dropped in 2017, the landslide displacement showed a generally linear decrease, but the displacement velocity was small. When the reservoir water level dropped in 2018 and 2019, the landslide displacement was rather variable. However, the landslide displacement did not peak at the time of minimum water level, suggesting landslide displacement might lag water level changes. In 2017 and 2018, landslide displacement decreased and fluctuated during the period of rising water level; in 2019, landslide displacement first decreased and then increased during the period of rising water level. Therefore, the displacement of the Chana landslide was affected by both the rise and fall of water level. In 2017, landslide displacement decreased during the rainfall period. In 2018 and 2019, landslide displacement increased during the rainfall period, but there was no sudden acceleration or deceleration. Therefore, rainfall may not significantly promote landslide displacement. Before 9 December 2018, the central and eastern parts of the slope had similar displacement trends, after which uplift occurred in the central part of the slope. Infiltration caused by the rising water level may have softened the slope soil, causing local damage to the slope and causing upslope material to fall and accumulate further downslope. The displacement of the trailing edge of the slope was small and steady (cumulative displacement −13.53 mm).
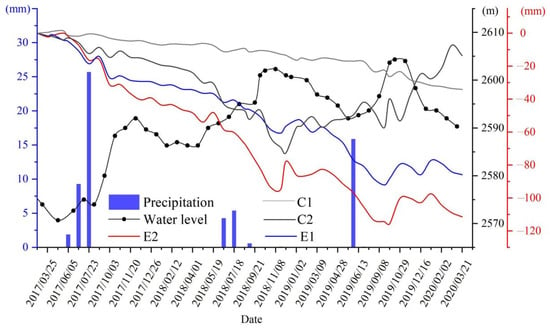
Figure 12.
Time series of precipitation, water level, and deformation for Chana landslide.
In summary, when considering spatial variability, the magnitude of deformation of the Chana landslide was greater in the east than in the center, and the lower part is more strongly deformed than the upper part. When considering temporal variability, the landslide experienced no accelerated deformation as a whole. Therefore, the probability of overall instability of the Chana landslide over a short period of time is very small. The large-scale collapse caused by the slope toe collapse may be the most important failure mode in the eastern part of the Chana landslide, while the failure mode in the central part of the slope is multistage sliding.
4.1.2. The Chaxi Landslide
The width of the Chaxi landslide is 1300 m, the height difference is 470 m, and the planar area is 0.47 km2. The lower stratum is mainly cohesive soil, and the upper stratum is sandy soil. From the spatial deformation diagram of the Chaxi landslide (Figure 13a), it can be seen that dense deformation points are obtained in the east, center, and upper parts of the Chaxi landslide and remain stable; the landslide crown and western deformation points are missing. During the deformation of the Chaxi landslide, the central and lower parts of the slope were deformed first (Figure 13b), followed by the eastern part of the slope (Figure 13c,d), and finally the western part of the slope (Figure 13e–g). As time progressed, the area of the deforming part Chaxi of the landslide continued to expand.
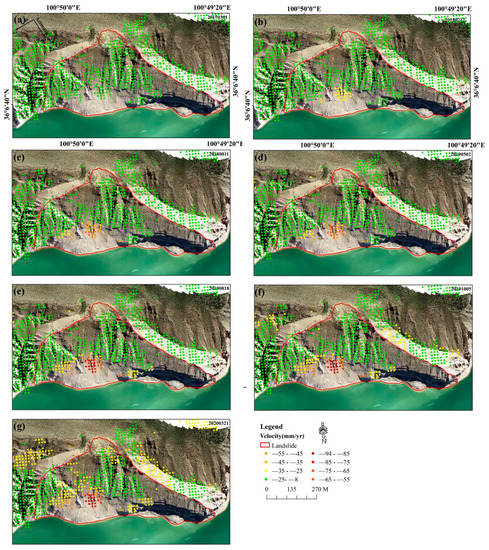
Figure 13.
Cumulative displacement of landslides in the Longyangxia Reservoir area.
Field investigation indicated that severe deformation and collapses have occurred on the crown of the landslide, forming a large depression, and a major collapse has occurred below the depression (Figure 14b). At the same time, there was severe wind-sandification at the crown of the landslide, and the surface displacement rate was fast. Therefore, the displacement rate in this sector could not be detected using InSAR technology. The vertical height difference in the center of the landslide is ~330 m; there is a steep gradient and abundant loose materials, and many collapses and caves occur on the slope (Figure 14c). There have been several small landslides in the middle and lower parts of the Chaxi landslide, and obvious scratch marks can be seen at its rear edge. These small landslides reduced the integrity of the rock and soil at the foot of the Chaxi landslide and provided favorable conditions for local deformation. The western part of the landslide has the steepest slope and the most complex topography. The erosive effect of changes in reservoir water level and the impact of waves generated by boat traffic have led to the collapse of the western bank. The upper part of the soil has been destabilized and the slopes are extremely prone to instability (Figure 14d). However, the cracks in each part of the landslide body have not penetrated, so the probability of overall instability is small.
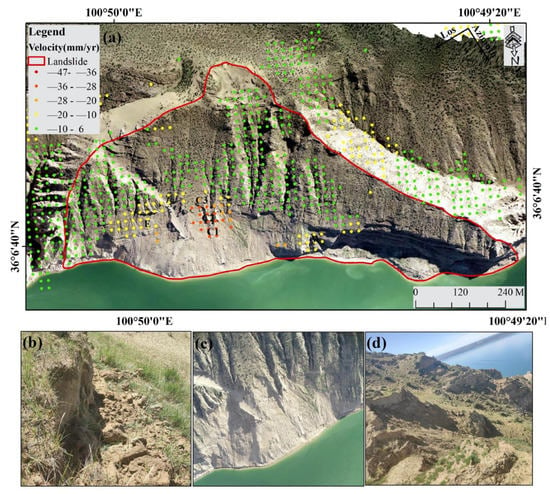
Figure 14.
(a) Deformation velocity of Chaxi landslide, (b) partial collapse of the rear edge, (c) small landslides in the center, and (d) exposed soil in the western part.
As shown in Figure 14a, the labels C1, C2, and C3 represent the central part of the slope, E represents the east of the slope, and W represents the west of the slope. Figure 15 shows that the landslide displacements of different parts of the Chaxi landslide have been different. In the central part, the deformation rate of the front edge nearest the reservoir was fastest (cumulative displacement −81 mm to −88 mm), and the displacement rate gradually decreased as the distance from the reservoir increased (cumulative displacement −39 mm); the overall deformation was directed towards Longyangxia Reservoir by leading edge traction, and the deformation at the edges on both sides was markedly smaller than that in the central part (cumulative displacement −33 mm to −46 mm). Overall, the displacement of the Chaxi landslide can be characterized by periodic behavior, with a trend of increasing fluctuations, but there has been no continuous acceleration of deformation. From a local point of view, the displacement rate of the landslide has varied inconsistently across different time periods. Before 27 October 2017, the displacement rate was slow, but the deformation rate subsequently increased; the main reason for this change was a record high water level in 2018–2019 reaching soil that had not been previously infiltrated by the reservoir water and was more sensitive to the change of water level. In the rainfall periods of 2017 and 2018, the landslide displacement did not increase, but continued to fluctuate periodically. The landslide displacement during the 2019 rainfall period showed accelerated deformation, but at this time, the reservoir water reached its lowest level, and the acceleration of the displacement may be caused by the drop in the previous water level.
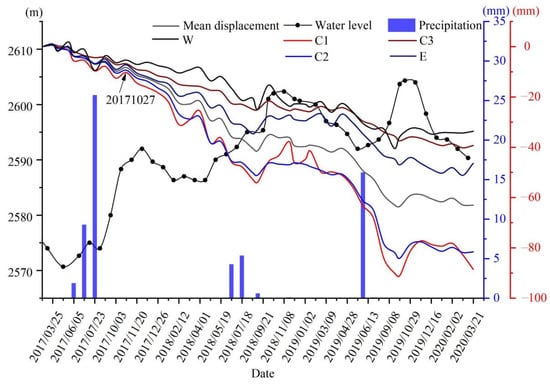
Figure 15.
Time series of precipitation, water level, and deformation for the Chaxi landslide.
In summary, the deformation and damage in the central part of the Chaxi landslide was observed to be greater than that on the east and west sides, the deformation velocity near the reservoir was faster than that further away from the reservoir, and there has been multilevel bottom-up sliding. Therefore, the failure mode of the central part of the slope has been traction sliding, and the main failure mode of the western part of the slope has been bank collapse.
4.1.3. The Mangla River Estuary Landslide
The Mangla River Estuary landslide is located at the point of entry of the Yellow River into Longyangxia Reservoir; it is 3000 m wide and has an elevation difference of 575 m. The strata mainly comprise gravel, clay, and sandy soil. In the monitoring time series, the cumulative displacement is −40 mm to −53 mm. It can be seen from Figure 16 that the deformation points are concentrated in the slope toe accumulation area, while deformation signs are absent in the trailing edge. During the deformation of the Mangla River Estuary landslide, the central and lower parts of the slope deformed first, followed by the western part of the slope. As time progressed, the magnitude of slope deformation continued to increase and the affected area expanded to the rear edge, especially in the central and lower parts of the slope (Figure 16).
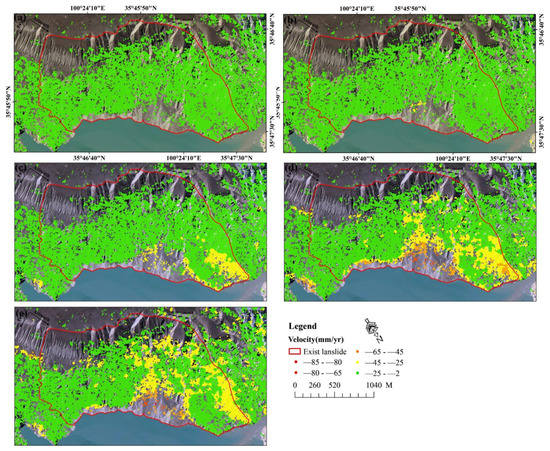
Figure 16.
Spatial deformation characteristics of the Mangla River Estuary landslide. (a) Cumulative displacement of Mangla River Estuary landslide on 1 March 2017, (b) Cumulative displacement of Mangla River Estuary landslide on 12 February 2018, (c) Cumulative displacement of Mangla River Estuary landslide on 24 June 2018, (d) Cumulative displacement of Mangla River Estuary landslide on 18 August 2019, (e) Cumulative displacement of Mangla River Estuary landslide on 21 March 2020.
Monitoring and field investigation of the landslide revealed a high density of large cracks in the rear edge, and more than 10 shallow landslides and collapses of different scales (Figure 17b,c). The rapid deformation of the trailing edge has led to large changes in the backscatter characteristics of ground objects stored within SAR images, resulting in decorrelation. The nomadic activities of local herders expanded the bare land area behind the landslide, resulting in serious desertification in this area. Previous studies have shown that vegetation plays a critical role in stabilizing the shallow soil [58,59,60]. Patches of collapsed grassy vegetation, large areas of deformation and subsidence, and shallow landslides (Figure 17d) and flowing soil (Figure 17e) in the area may be closely related to the increase in the area of bare ground.
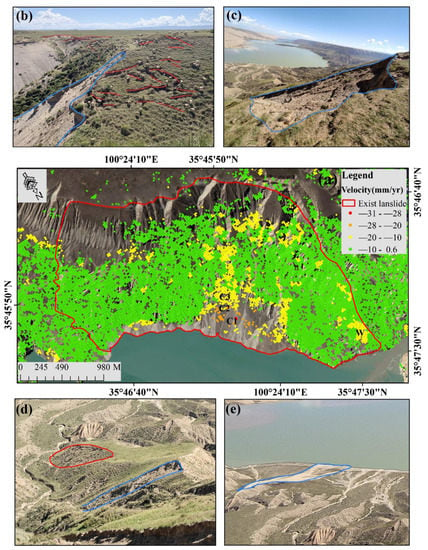
Figure 17.
(a) Deformation velocity of the Mangla River Estuary landslide, (b) unstable area at the rear edge, (c) secondary landslide, (d) potential deformation zone and small landslide in the center of the landslide, and (e) soil flow in the eastern part of the landslide. Red solid lines indicate tensile cracks and potential settlement areas, and blue lines indicate actual landslides.
As shown in Figure 17, the central part of the slope is represented by C1, C2, and C3, from bottom to top, and W is the west side of the slope. Overall, the displacement of each part of the landslide showed an increasing trend (Figure 18), and the displacement rate tended to be stable. Landslide displacement rate was fast before 25 April 2018, after which the landslide displacement was slow, showing a cyclical up–down cycle. This behavior reflects that initially the maximum water level was far away from the deformation location, the bank slope was flat, the hydraulic gradient was small, the water flow path was long, and the energy consumption was large. Therefore, landslide displacement during this period was less affected by the water level. Subsequently, the reservoir water level increased considerably, the landslide displacement and the water level change trends tended to be the same, and the landslide displacement decreased (increased) during the periods of rising (falling) water level. However, because the reservoir water level changed faster than the groundwater level, landslide displacement changes lag water level changes. Locally, the deformation velocity in the center of the slope gradually decreased from bottom to top, and the magnitude of deformation in the west of the slope was smaller than that in the center; this is related to the topography of the deformed part of the landslide and the distance from the reservoir bank. During rainfall periods from 2017 to 2019, the displacement of the landslide decreased. Therefore, rainfall did not promote greater displacement of the landslide.
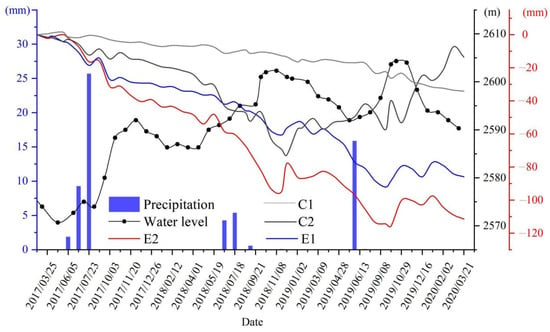
Figure 18.
Time series of precipitation, water level, and deformation for the Mangla River Estuary landslide.
In summary, the Mangla River Estuary landslide is a local deformation feature. Under the influence of water level changes, the central part of the landslide may experience long-term creeping.
4.2. Response of Landslide Deformation to Water Level Fluctuations
Here, we have used the NDWI method to extract the water level for the Chana, Chaxi, and Mangla River Estuary landslides, using Landsat8 OLI data and Sentinel-2 data. Bivariate analysis of the extracted water level and the measured water level shows that the change trends for the two acquired levels are highly consistent, with correlation coefficients of 0.965 and 0.979, respectively (p < 0.01) (Figure 19).
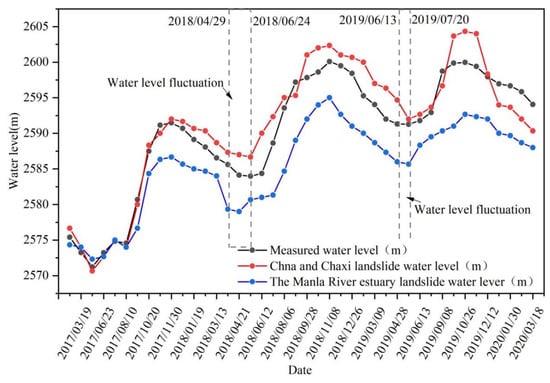
Figure 19.
Time series of the Chana, Chaxi, and Mangla River estuary landslide water levels, and the measured water level.
Recent studies have reported that falling water levels will cause more significant deformation of landslides than rising water levels [61,62,63]. During the monitoring period (from 15 February 2017 to 21 March 2020), the water level of Longyangxia Reservoir changed periodically from 2570.68 m to 2604.33 m. Based on the measured water level and the water level extracted from remote sensing images, the time series of reservoir water level can be divided into three stages (Figure 20): water level rising (July to November), fluctuation (May to June), and falling (November to April of the following year). We used the Pearson correlation coefficient (r) to indicate the strength of the correlation between water level change and landslide deformation.
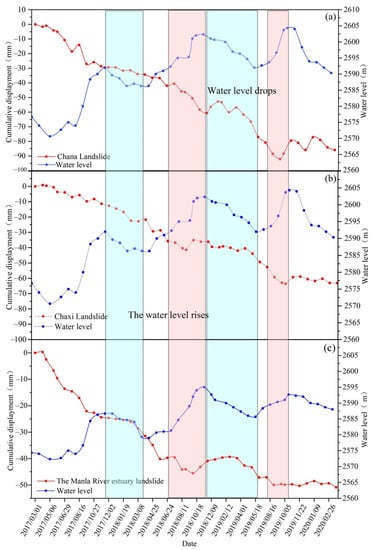
Figure 20.
Water level and landslide displacement time series. (a) The Chana landslide, (b) Chaxi landslide, and (c) Mangla River Estuary landslide.
Landslide displacement lags behind changes in reservoir water level [64,65], which we analyze here. It is assumed that the response time of landslide displacement to the change of water level is no more than n days, and the correlation coefficient between the two is calculated with an interval of two days. The delay duration for which the correlation coefficient is the largest represents the lag time between landslide displacement and water level change. The falling water level period in 2017 is incomplete and cannot be compared with the rising period, hence we analyze water level changes and landslide displacement in 2018 and 2019 only. The results show that the maximum correlation coefficients for the Chana, Chaxi, and Mangla River Estuary landslides are −0.994, 0.481, and 0.561, respectively, for rising water level rise in 2018, and 0.996, 0.978, and 0.967, respectively, for declining water level in 2019, the maximum correlation coefficients for rising water level are −0.669, −0.888, and 0.705, respectively, and 0.990, 0.954, and 0.935 for declining water level. Notably then, the correlation coefficients are larger during the falling period for the three landslides (Figure 21). According to the maximum correlation coefficient, we obtained the lag time for the Chana, Chaxi, and Mangla River Estuary landslides in the rising stage of water level as 16–30 days, 12–42 days, and 0–28 days, respectively, and 16–60 days, 10–34 days, and 0–62 days in the falling stage, respectively.
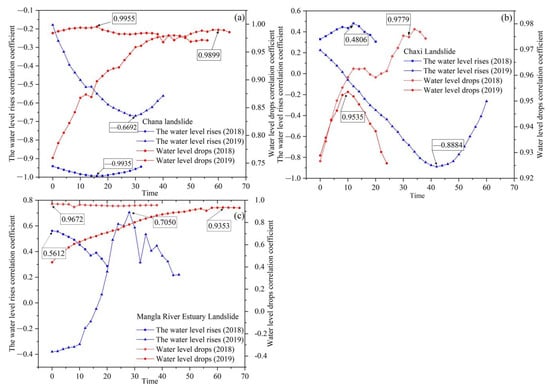
Figure 21.
Correlation between landslide displacement and water level change. (a) Correlation coefficient between the displacement of the Chana landslide and the water level. (b) Correlation coefficient between the displacement of the Chaxi landslide and the water level fluctuation. (c) Indicates the correlation coefficient between the displacement of the Mangla River estuary slope and the water level.
We also compared and analyzed the deformation rate from daily displacements of the landslides during the rise and fall of water level (Table 6). The results show that the daily displacements during the decline of water level are greater for the Chaxi and Mangla River Estuary landslides than displacements during water level rise. It should be noted that for the Chana landslide, daily displacement during the 2018 water level rising period was greater than displacement during the period of falling water level. This may be explained by the results of the correlation analysis between water level and deformation; in 2018 (rising period, −0.994; falling period, 0.996), the Chana landslide had a short active period during the rise of water level, with 78% of displacement in that year accommodated during that period. The average deformation rate was 1.75 times that of 2017–2019. In summary, the rise and fall of reservoir water level can increase the deformation of the landslide, but it is the decline of water level that plays the leading role in the deformation.

Table 6.
Daily displacement of Chana, Chaxi, and Mangla River Estuary landslides.
5. Discussion
The relationship between reservoir water level fluctuations and landslide displacement is related to the associated soil expansion–contraction cycle [9,66]. The upper part of the landslide in the study area consists of sand, and the lower part, of clay and mudstone. Due to differences in soil properties, the seepage generated by reservoir water infiltration is heterogeneous. The upper sandy soil has a large pore space, a high permeability coefficient and water permeability; the lower clayey part has low water permeability and strong water retention. When the reservoir water level rises, water continuously penetrates into the sand body and accumulates within a thin sand layer in between the upper sandy soil and the lower cohesive soil. Within a relatively short period, the sand structure is irreversibly deformed due to the loading and unloading of water, and the structure is rearranged. With the increase in the pore water pressure, matrix suction is reduced, and the effective stress on the sand framework decreases, which reduces the shear strength and stability of the landslide [67,68]. However, a rise in water level generates water pressure, which provides a supporting force acting on the landslide surface, in turn increasing its resistance to movement and increasing the stability of the slopes [66,67,68,69,70]. This is also the reason why the slope deformation velocity is very low when the reservoir water level rises. When the reservoir water level falls, the unloading of the slope water pressure reduces its supporting effect on the slope [11], and the decrease in water level also leads to a decrease in the confining pressure of the slopes [71]. Under high osmotic and hydrodynamic pressure, the direction of the hydraulic gradient is directed to the outside of the slope, causing dynamic seepage forces and promoting soil movement, which decreases slope stability [70,71,72]. The infiltration of water in the early stage results in a rise in the groundwater level of the slope, which can cause the pore water pressure to increase; due to the water retention capacity of the soil, the reservoir water level falls more rapidly than the groundwater level. This is the main reason why the cumulative displacement of the Chana, Chaxi, and Mangla River Estuary landslides lags behind the water level fluctuations.
The hydrological conditions of reservoir water level vary with changes in rainfall or water level fluctuations [73]. Therefore, the influencing factors for the displacement of landslides in the vicinity of the reservoir include rainfall as the main factor and water level fluctuations as a supplementary factor; in contrast, with water level fluctuations as the major factor and rainfall as an auxiliary factor, the combined effects of the two factors are almost equal. The total annual rainfall at the Longyangxia Reservoir from 2017 to 2019 was 383 mm to 589 mm, and it can be seen from Figure 22 that the dry season is from November to March of the following year, and that the rainfall is concentrated during summer (June to August, during which the rainfall was 215–386 mm). Table 7 shows that from 2017 to 2019, the annual cumulative displacement of the Longyangxia Reservoir landslide ranged from −11.09 mm to −33.13 mm, and that the cumulative displacement during the summer ranged from −1.82 mm to −7.66 mm. Although the rainfall during the summer accounts for 55–66% of the annual total, the cumulative displacement of the landslide during the corresponding period only comprised 13–32% of the annual cumulative displacement. Although the summer rainfall in 2019 was greater than that in 2018, the cumulative displacement of the Chana and Chaxi landslides during this period was smaller. In addition, there is a weak correlation between landslide displacement and rainfall (for 2018, the correlation coefficients between rainfall and the Chana, Chaxi, and Mangla River Estuary landslides are 0.28, 0.21, and 0.42, respectively; for 2019, the correlation coefficients are 0.15, 0.21, and 0.11, respectively). Therefore, rainfall is not an important factor in promoting landslide deformation at the Longyangxia Reservoir.
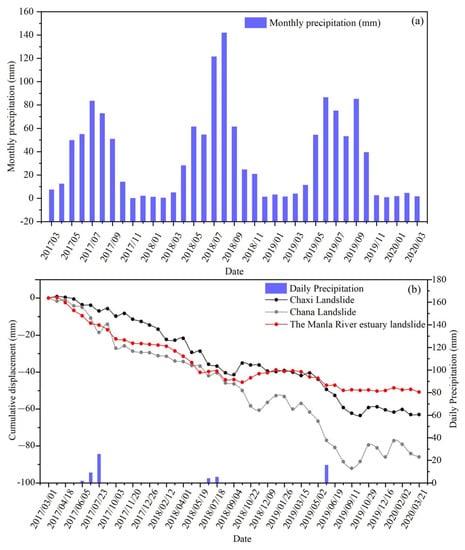
Figure 22.
Relationship between precipitation and landslide deformation. (a) Monthly precipitation at the Longyangxia Reservoir; (b) landslide cumulative displacement and daily precipitation, from 2017 to 2020.

Table 7.
Cumulative displacement and annual cumulative displacement of the Chana, Chaxi, and Mangla River Estuary landslides in summer.
The accuracy of the data extraction of the reservoir water level also affects the deformation analysis of the wading landslide on the reservoir bank. The Surface Water and Ocean Topography (SWOT) mission aims to significantly improve the current remote monitoring capabilities of lakes and reservoirs [74], with a revisit period of 21 days, and its Ka-band radar interferometer (KaRIn) will be the first broad-spectrum interferometer that is different from traditional altimeters. This new instrument will measure the two-dimensional surface water elevation and will provide surface water elevation and water surface range in vector format [75].
In future reservoir water level research, SWOT satellite sensor data can be combined with Landsat and Sentinel-2 data to monitor reservoir water level, thereby mitigating defects of different sensors in sampling frequency and accuracy and improving reservoir water level monitoring capabilities.
6. Conclusions
Longyangxia Reservoir is the largest hydropower station in the upper reaches of the Yellow River. The geological conditions in the reservoir area are complex, and the stability of the reservoir bank landslide seriously affects the safe operation of the Longyangxia Reservoir. Based on SAR data with high temporal and spatial resolution, we used emerging SBAS-InSAR technology to obtain the current status of Longyangxia Reservoir landslide activity. By also using optical remote sensing images, the NDWI method enabled retrievals of the reservoir water level at specific slopes within Longyangxia Reservoir; in situ water level observations were also used to verify the accuracy of the extracted reservoir water level. The Chana, Chaxi, and Mangla River Estuary landslides (with different reservoir water level depths) were taken as typical examples, and the deformation characteristics of the three landslides under the conditions of falling water level, rising water level, and rainfall were analyzed. The principal findings are as follows.
- (1)
- We obtained the surface deformation velocity of slopes surrounding Longyangxia Reservoir and ascertained the current status of its landslide activity. Ninety percent of the study area remains relatively stable, and the surface of some areas moves slowly (velocities of −47 to 28 mm per year). Sand dune movement is the main surface deformation process on the north bank of the reservoir, while clusters of potential landslides develop on the south bank of the reservoir. A total of 12 potential landslides were identified at the Longyangxia Reservoir, ten of which were local deformations of existing landslides, and two were new potential landslides.
- (2)
- Taking the Chana, Chaxi, and Mangla River Estuary landslides as examples, a change in water level, not rainfall, is the primary external factor that controls the deformation velocity and temporal trend of potential landslides in the study area. During the monitoring period, landslide displacement had a moderate to strong correlation with rises and falls in the water level but was uncorrelated to weakly correlated with rainfall. In addition, both rises and falls in the reservoir water level affect the development and evolution of landslides in the reservoir area but falls in reservoir water level have the greater impact. Meanwhile, landslide displacement and water level change are not synchronized: displacement lags water level changes by about 0–62 days.
- (3)
- Taking Longyangxia Reservoir as an example, this study used the NDWI and InSAR technology to demonstrate a new method applicable to research in other areas without water level monitoring data.
Author Contributions
S.Z.: conceptualization, software, methodology, investigation, resources, writing—original draft, writing—reviewing and editing, visualization; R.Z.: conceptualization, supervision, project administration, funding acquisition, writing—reviewing and editing; H.Z.: supervision, methodology, writing—reviewing and editing; X.M. (Xingmin Meng): supervision, project administration, resources; Z.Z.: conceptualization, software, writing—reviewing and editing, supervision; X.M. (Xiangpei Meng): investigation, resources; H.W.: investigation, resources; Y.Z.: methodology, resources; J.L.: data curation, resources. All authors have read and agreed to the published version of the manuscript.
Funding
This research is supported by the National Key R&D Program of China (Grant No. 2018YFC1504704); the Second Tibetan Plateau Scientific Expedition and Research Program (STEP) (Grant No. 2021QZKK0204); and the Construction Project of Gansu Technological Innovation Center (Grant No. 18JR2JA006); the National Natural Science Foundation of China (Grant No. 42007232) and the Fundamental Research Funds for the Central Universities (Grant No. lzujbky-2021-sp01).
Institutional Review Board Statement
Not applicable.
Informed Consent Statement
Not applicable.
Data Availability Statement
The Sentinel-1A, Sentinel-2, and precise orbits dates were provided by the European Space Agency. The Landsat images were provided by the United States Geological Survey. We thank China Meteorological Data Network for providing the precipitation data and Japan Aerospace Exploration Agency for providing the 12.5 m DEM data.
Acknowledgments
We are grateful to the editor and anonymous reviewers for reviewing the manuscript. We thank Ma. J.H. and Yao. Y.Q. for their help and support in the graphics layout and field surveys.
Conflicts of Interest
The authors declare no conflict of interest.
References
- Jia, L.; Hu, D.; Wu, H.; Zhao, X.; Chang, P.; You, B.; Zhang, M.; Wang, C.; Ye, M.; Wu, Z.; et al. Yellow River terrace sequences of the Gonghe–Guide section in the northeastern Qinghai–Tibet: Implications for plateau uplift. Geomorphology 2017, 295, 323–336. [Google Scholar] [CrossRef]
- Yin, Z.Q.; Wei, G.; Qi, X.; Zhou, C. Spatial and temporal characteristics of landslide and there response to climatic change from Sigou to Lagan gorges in upper reaches of Yellow River. J. Eng. Geol. 2013, 21, 129–137, (In Chinese with English abstract). [Google Scholar]
- Yin, Z.Q.; Qin, X.G.; Zhao, W.J.; Li, X.L.; Cheng, G.M.; Wei, G.; Shi, L.Q.; Yuan, C.D. Temporal and Spatial Evolution and Triggering Mechanism of Landslide and Debris Flow in the Upper Yellow; River Science Press: Beijing, China, 2016; (In Chinese with English abstract). [Google Scholar]
- Duffaut, P. The traps behind the failure of Malpasset arch dam, France, in 1959. J. Rock Mech. Geotech. Eng. 2013, 5, 335–341. [Google Scholar] [CrossRef]
- Mattox, A.; Higman, B.; Mckittirick, E.; Coil, D. Understanding DamFailure. 2016. Available online: http://www.groundtruthtrekking.org/Issues/OtherIssues/understanding-dam-failure.html (accessed on 4 August 2020).
- Barla, G.; Paronuzzi, P. The 1963 Vajont Landslide: 50th Anniversary. Rock Mech. Rock Eng. 2013, 46, 1267–1270. [Google Scholar] [CrossRef]
- Tang, M.; Xu, Q.; Yang, H.; Li, S.; Iqbal, J.; Fu, X.; Huang, X.; Cheng, W. Activity law and hydraulics mechanism of landslides with different sliding surface and permeability in the Three Gorges Reservoir Area, China. Eng. Geol. 2019, 260, 105212. [Google Scholar] [CrossRef]
- Bai, S.; Wang, J.; Thiebes, B.; Cheng, C.; Yang, Y. Analysis of the relationship of landslide occurrence with rainfall: A case study of Wudu County, China. Arab. J. Geosci. 2014, 7, 1277–1285. [Google Scholar] [CrossRef]
- Michoud, C.; Baumann, V.; Lauknes, T.R.; Penna, I.; Derron, M.-H.; Jaboyedoff, M. Large slope deformations detection and monitoring along shores of the Potrerillos dam reservoir, Argentina, based on a small-baseline InSAR approach. Landslides 2015, 13, 451–465. [Google Scholar] [CrossRef]
- Sun, G.; Zheng, H.; Tang, H.; Dai, F. Huangtupo landslide stability under water level fluctuations of the Three Gorges reservoir. Landslides 2015, 13, 1167–1179. [Google Scholar] [CrossRef]
- Pinyol, N.M.; Alonso, E.E.; Corominas, J.; Moya, J. Canelles landslide: Modelling rapid drawdown and fast potential sliding. Landslides 2011, 9, 33–51. [Google Scholar] [CrossRef]
- Huang, F.; Luo, X.; Liu, W. Stability analysis of hydrodynamic pressure landslides with different permeability coefficients affected by reservoir water level fluctuations and rainstorms. Water 2017, 9, 450. [Google Scholar] [CrossRef]
- Mao, W.; Yan, E.C.; Song, K.; Zhang, T.T. Deformation of reservior landslide during reservoir water fluctuation. Appl. Mech. Mater. 2011, 90–93, 1334–1340. [Google Scholar] [CrossRef]
- Li, L.; Yao, X.; Yao, J.; Zhou, Z.; Feng, X.; Liu, X. Analysis of deformation characteristics for a reservoir landslide before and after impoundment by multiple D-InSAR observations at Jinshajiang River, China. Nat. Hazards 2019, 98, 719–733. [Google Scholar] [CrossRef]
- Yao, W.; Li, C.; Zuo, Q.; Zhan, H.; Criss, R.E. Spatiotemporal deformation characteristics and triggering factors of Baijiabao landslide in Three Gorges Reservoir region, China. Geomorphology 2019, 343, 34–47. [Google Scholar] [CrossRef]
- Liao, M.; Tang, J.; Wang, T.; Balz, T.; Zhang, L. Landslide monitoring with high-resolution SAR data in the Three Gorges region. Sci. China Earth Sci. 2011, 55, 590–601. [Google Scholar] [CrossRef]
- Cumming, I.; Wong, F.H. Digital Processing of Synthetic Aperture Radar Data: Algorithms and Implementatio; Artech House: Norwood, MA, USA, 2004. [Google Scholar]
- Shi, X.; Yang, C.; Zhang, L.; Jiang, H.; Liao, M.; Zhang, L.; Liu, X. Mapping and characterizing displacements of active loess slopes along the upstream Yellow River with multi-temporal InSAR datasets. Sci. Total Environ. 2019, 674, 200–210. [Google Scholar] [CrossRef] [PubMed]
- Herrera, G.; Gutiérrez, F.; García-Davalillo, J.; Guerrero, J.; Notti, D.; Galve, J.P.; Fernandez-Merodo, J.A.; Cooksley, G. Multi-sensor advanced DInSAR monitoring of very slow landslides: The Tena Valley case study (Central Spanish Pyrenees). Remote Sens. Environ. 2013, 128, 31–43. [Google Scholar] [CrossRef]
- Cenni, N.; Fiaschi, S.; Fabris, M. Integrated use of archival aerial photogrammetry, GNSS, and InSAR data for the monitoring of the Patigno landslide (Northern Apennines, Italy). Landslides 2021, 18, 2247–2263. [Google Scholar] [CrossRef]
- Wang, Y.; Liu, D.; Dong, J.; Zhang, L.; Guo, J.; Liao, M.; Gong, J. On the applicability of satellite SAR interferometry to landslide hazards detection in hilly areas: A case study of Shuicheng, Guizhou in Southwest China. Landslides 2021, 18, 1–11. [Google Scholar] [CrossRef]
- Wiesmann, A.; Wegmuller, U.; Honikel, M.; Strozzi, T.; Werner, C. Potential and methodology of satellite based SAR for hazard mapping. IEEE Int. Geosci. Remote Sens. Symp. 2002, 7, 3262–3264. [Google Scholar] [CrossRef]
- Squarzoni, G.; Bayer, B.; Franceschini, S.; Simoni, A. Pre- and post-failure dynamics of landslides in the Northern Apennines revealed by space-borne synthetic aperture radar interferometry (InSAR). Geomorphology 2020, 369, 107353. [Google Scholar] [CrossRef]
- Ferretti, A.; Prati, C.; Rocca, F. Permanent scatterers in SAR interferometry. IEEE Trans. Geosci. Remote Sens. 2001, 39, 8–20. [Google Scholar] [CrossRef]
- Ferretti, A.; Fumagalli, A.; Novali, F.; Prati, C.; Rocca, F.; Rucci, A. A new algorithm for processing interferometric data-stacks: Squeesar. IEEE Trans. Geosci. Remote Sens. 2011, 49, 3460–3470. [Google Scholar] [CrossRef]
- Berardino, P.; Fornaro, G.; Lanari, R.; Sansosti, E. A new algorithm for surface deformation monitoring based on small baseline differential SAR interferograms. IEEE Trans. Geosci. Remote Sens. 2002, 40, 2375–2383. [Google Scholar] [CrossRef]
- Schmidt, D.A.; Bürgmann, R. Time-dependent land uplift and subsidence in the Santa Clara valley, California, from a large interferometric synthetic aperture radar data set. J. Geophys. Res. Earth Surf. 2003, 108. [Google Scholar] [CrossRef]
- Herrera, G.; Fernández-Merodo, J.; Mulas, J.; Pastor, M.; Luzi, G.; Monserrat, O. A landslide forecasting model using ground based SAR data: The Portalet case study. Eng. Geol. 2009, 105, 220–230. [Google Scholar] [CrossRef]
- Bernardie, S.; Desramaut, N.; Malet, J.-P.; Gourlay, M.; Grandjean, G. Prediction of changes in landslide rates induced by rainfall. Landslides 2015, 12, 481–494. [Google Scholar] [CrossRef]
- Zhang, Z.; Zeng, R.; Meng, X.; Zhang, Y.; Zhao, S.; Ma, J.; Yao, Y. Effect of Soluble Salt Loss via Spring Water on Irrigation-Induced Landslide Deformation. Water 2020, 12, 2889. [Google Scholar] [CrossRef]
- Pawluszek-Filipiak, K.; Borkowski, A. Monitoring mining-induced subsidence by integrating differential radar interferometry and persistent scatterer techniques. Eur. J. Remote Sens. 2021, 54, 18–30. [Google Scholar] [CrossRef]
- Kumar, S.; Kumar, D.; Chaudhary, S.K.; Singh, N.; Malik, K.K. Land subsidence mapping and monitoring using modified persistent scatterer interferometric synthetic aperture radar in Jharia Coalfield, India. J. Earth Syst. Sci. 2020, 129, 1–10. [Google Scholar] [CrossRef]
- Jennifer, J.J.; Saravanan, S.; Pradhan, B. Persistent Scatterer Interferometry in the Post-Event Monitoring of the Idukki Landslides. Geocarto Int. 2020, 1–15. [Google Scholar] [CrossRef]
- Troncone, A.; Pugliese, L.; Lamanna, G.; Conte, E. Prediction of rainfall-induced landslide movements in the presence of stabilizing piles. Eng. Geol. 2021, 288, 106143. [Google Scholar] [CrossRef]
- Chen, Q.; Zhang, Y.; Ekroos, A.; Hallikainen, M. The role of remote sensing technology in the EU water framework directive (WFD). Environ. Sci. Policy 2004, 7, 267–276. [Google Scholar] [CrossRef]
- DeVries, B.; Huang, C.; Armston, J.; Huang, W.; Jones, J.W.; Lang, M.W. Rapid and robust monitoring of flood events using Sentinel-1 and Landsat data on the Google Earth Engine. Remote Sens. Environ. 2020, 240, 111664. [Google Scholar] [CrossRef]
- Choung, Y.-J.; Jo, M.-H. Monitoring water resource changes using multi-temporal landsat imagery taken in changnyeong, south korea. Procedia Eng. 2016, 154, 348–352. [Google Scholar] [CrossRef][Green Version]
- Du, Z.; Li, W.; Zhou, D.; Tian, L.; Ling, F.; Wang, H.; Gui, Y.; Sun, B. Analysis of Landsat-8 OLI imagery for land surface water mapping. Remote Sens. Lett. 2014, 5, 672–681. [Google Scholar] [CrossRef]
- McFeeters, S.K. The use of the Normalized Difference Water Index (NDWI) in the delineation of open water features. Int. J. Remote Sens. 1996, 17, 1425–1432. [Google Scholar] [CrossRef]
- Xu, H. Modification of normalised difference water index (NDWI) to enhance open water features in remotely sensed imagery. Int. J. Remote Sens. 2006, 27, 3025–3033. [Google Scholar] [CrossRef]
- Yan, C.; Song, X.; Zhou, Y.; Duan, H.; Li, S. Assessment of aeolian desertification trends from 1975’s to 2005’s in the watershed of the Longyangxia Reservoir in the upper reaches of China’s Yellow River. Geomorphology 2009, 112, 205–211. [Google Scholar] [CrossRef]
- Singh, K.V.; Setia, R.; Sahoo, S.; Prasad, A.; Pateriya, B. Evaluation of NDWI and MNDWI for assessment of waterlogging by integrating digital elevation model and groundwater level. Geocarto Int. 2015, 30, 650–661. [Google Scholar] [CrossRef]
- Li, X.L.; Guo, X.H.; Li, W.H. Mechanism of giant landslides form longyangxia valley to liujiaxia valley along yellow river. J. Eng. Geol. 2011, 19, 516–529, (In Chinese with English abstract). [Google Scholar] [CrossRef]
- Wei, G. Study on the Distribution Characteristics and Risk Assessment of Super large scale Landslides from Longyang Gorge to Sigou Gorge in the Upper reaches of Yellow River. Ph.D. Thesis, China University of Geosciences, Wuhan, China, 2013. (In Chinese with English abstract). [Google Scholar]
- Yan, P.; Zhang, Y.J.; Zhang, Y. A Study on Information Extraction of Water System in Semi-arid Regions with the Enhanced Water Index (EWI) and GIS Based Noise Remove Techniques. Remote Sens. Inf. 2007, 6, 62–67, (In Chinese with English abstract). [Google Scholar]
- Gorum, T.; Fan, X.; van Westen, C.J.; Huang, R.Q.; Xu, Q.; Tang, C.; Wang, G. Distribution pattern of earthquake-induced landslides triggered by the 12 May 2008 Wenchuan earthquake. Geomorphology 2011, 133, 152–167. [Google Scholar] [CrossRef]
- Liu, H.-X.; Xu, Q.; Li, Y.-R. Effect of lithology and structure on seismic response of steep slope in a shaking table test. J. Mt. Sci. 2014, 11, 371–383. [Google Scholar] [CrossRef]
- Wang, L.; Guo, F.; Wang, S. Prediction model of the collapse of bank slope under the erosion effect of wind-induced wave in the Three Gorges Reservoir Area, China. Environ. Earth Sci. 2020, 79, 1–17. [Google Scholar] [CrossRef]
- Liu, P.; Li, Z.; Hoey, T.; Kincal, C.; Zhang, J.; Zeng, Q.; Muller, J.-P. Using advanced InSAR time series techniques to monitor landslide movements in Badong of the Three Gorges region, China. Int. J. Appl. Earth Obs. Geoinform. 2013, 21, 253–264. [Google Scholar] [CrossRef]
- Darvishi, M.; Schlögel, R.; Kofler, C.; Cuozzo, G.; Rutzinger, M.; Zieher, T.; Toschi, I.; Remondino, F.; Mejia-Aguilar, A.; Thiebes, B.; et al. Sentinel-1 and Ground-Based Sensors for Continuous Monitoring of the Corvara Landslide (South Tyrol, Italy). Remote Sens. 2018, 10, 1781. [Google Scholar] [CrossRef]
- Liu, F.; Pan, B. A New 3-D Minimum Cost Flow Phase Unwrapping Algorithm Based on Closure Phase. IEEE Trans. Geosci. Remote Sens. 2020, 58, 1857–1867. [Google Scholar] [CrossRef]
- Hao, J.; Wu, T.; Hu, G.; Zou, D.; Zhu, X.; Zhao, L.; Li, R.; Xie, C.; Ni, J.; Yang, C.; et al. Investigation of a small landslide in the qinghai-tibet plateau by insar and absolute deformation model. Remote Sens. 2019, 11, 2126. [Google Scholar] [CrossRef]
- Zhao, F.; Meng, X.; Zhang, Y.; Chen, G.; Su, X.; Yue, D. Landslide susceptibility mapping of karakorum highway combined with the application of sbas-insar technology. Sensors 2019, 19, 2685. [Google Scholar] [CrossRef]
- Hanssen, R.F. Radar Interferometry: Data Interpretation and Error Analysis; Springer Science & Business Media: Berlin/Heidelberg, Germany, 2001. [Google Scholar]
- Ji, L.; Zhang, L.; Wylie, B. Analysis of Dynamic Thresholds for the Normalized Difference Water Index. Photogramm. Eng. Remote Sens. 2009, 75, 1307–1317. [Google Scholar] [CrossRef]
- Shang, M.; Liao, G.; Ma, R.; Liu, Y.Y. Quantitative correlation analysis on deformation of Baijiabao landslide between rainfall and reservoir water level. J. Eng. Geol. 2021, 29, 742–750, (In Chinese with English abstract). [Google Scholar]
- Liu, H.C.; Zhang, Z.Y. The mechanism of huge landslides in overconsolidated clay near Longyang Gorge damsite. J. Cheng-Du Coll. Geology. 1986, 3, 98–108, (In Chinese with English abstract). [Google Scholar]
- Li, M.; Ma, C.; Du, C.; Yang, W.; Lyu, L.; Wang, X. Landslide response to vegetation by example of July 25–26, 2013, extreme rainstorm, Tianshui, Gansu Province, China. Bull. Int. Assoc. Eng. Geol. 2020, 80, 751–764. [Google Scholar] [CrossRef]
- Wang, S.; Zhao, M.; Meng, X.; Chen, G.; Zeng, R.; Yang, Q.; Liu, Y.; Wang, B. Evaluation of the Effects of Forest on Slope Stability and Its Implications for Forest Management: A Case Study of Bailong River Basin, China. Sustainability 2020, 12, 6655. [Google Scholar] [CrossRef]
- Lan, H.; Wang, D.; He, S.; Fang, Y.; Chen, W.; Zhao, P.; Qi, Y. Experimental study on the effects of tree planting on slope stability. Landslides 2020, 17, 1021–1035. [Google Scholar] [CrossRef]
- Li, D.; Miao, F.; Xie, Y.; Leo, C. Hazard Prediction for Baishuihe Landslide in the Three Gorges Reservoir during the Extreme Rainfall Return Period. KSCE J. Civ. Eng. 2019, 23, 5021–5031. [Google Scholar] [CrossRef]
- Zhang, Y.; Zhang, Z.; Xue, S.; Wang, R.; Xiao, M. Stability analysis of a typical landslide mass in the Three Gorges Reservoir under varying reservoir water levels. Environ. Earth Sci. 2020, 79, 42. [Google Scholar] [CrossRef]
- Chen, M.-L.; Qi, S.-C.; Lv, P.-F.; Yang, X.-G.; Zhou, J.-W. Hydraulic response and stability of a reservoir slope with landslide potential under the combined effect of rainfall and water level fluctuation. Environ. Earth Sci. 2021, 80, 1–19. [Google Scholar] [CrossRef]
- Huang, Q.; Wang, J.; Xue, X. Interpreting the influence of rainfall and reservoir infilling on a landslide. Landslides 2015, 13, 1139–1149. [Google Scholar] [CrossRef]
- Li, D.-Y.; Sun, Y.-Q.; Yin, K.-L.; Miao, F.-S.; Glade, T.; Leo, C. Displacement characteristics and prediction of Baishuihe landslide in the Three Gorges Reservoir. J. Mt. Sci. 2019, 16, 2203–2214. [Google Scholar] [CrossRef]
- Wang, H.; Sun, Y.; Tan, Y.; Sui, T.; Sun, G. Deformation characteristics and stability evolution behavior of Woshaxi landslide during the initial impoundment period of the Three Gorges reservoir. Environ. Earth Sci. 2019, 78, 592. [Google Scholar] [CrossRef]
- Wang, Z.; Li, Q.; Zhang, N.; Jin, Y.; Qin, H.; Ding, J. Slope failure of biotreated sand embankments under rainfall conditions: Experimental investigation and numerical simulation. Bull. Int. Assoc. Eng. Geol. 2020, 79, 4683–4699. [Google Scholar] [CrossRef]
- Hu, X.; He, C.; Zhou, C.; Xu, C.; Zhang, H.; Wang, Q.; Wu, S. Model Test and Numerical Analysis on the Deformation and Stability of a Landslide Subjected to Reservoir Filling. Geofluids 2019, 2019, 5924580. [Google Scholar] [CrossRef]
- Sun, G.; Zheng, H.; Huang, Y.; Li, C. Parameter inversion and deformation mechanism of Sanmendong landslide in the Three Gorges Reservoir region under the combined effect of reservoir water level fluctuation and rainfall. Eng. Geol. 2016, 205, 133–145. [Google Scholar] [CrossRef]
- Xia, M.; Ren, G.M.; Ma, X.L. Deformation and mechanism of landslide influenced by the effects of reservoir water and rainfall, Three Gorges, China. Nat. Hazards 2013, 68, 467–482. [Google Scholar] [CrossRef]
- Yu, S.; Ren, X.; Zhang, J.; Wang, H.; Wang, J.; Zhu, W. Seepage, Deformation, and Stability Analysis of Sandy and Clay Slopes with Different Permeability Anisotropy Characteristics Affected by Reservoir Water Level Fluctuations. Water 2020, 12, 201. [Google Scholar] [CrossRef]
- Li, S.J.; Knappett, J.A.; Feng, X.T. Centrifugal test on slope instability influenced by rise and fall of reservoir water level. Yanshilixue Yu Gongcheng Xuebao/Chin. J. Rock Mech. Eng. 2008, 27, 1586–1593, (In Chinese with English abstract). [Google Scholar]
- Xiong, X.; Shi, Z.; Xiong, Y.; Peng, M.; Ma, X.; Zhang, F. Unsaturated slope stability around the Three Gorges Reservoir under various combinations of rainfall and water level fluctuation. Eng. Geol. 2019, 261, 105231. [Google Scholar] [CrossRef]
- Bonnema, M.; Hossain, F. Assessing the Potential of the Surface Water and Ocean Topography Mission for Reservoir Monitoring in the Mekong River Basin. Water Resour. Res. 2019, 55, 444–461. [Google Scholar] [CrossRef]
- Fjortoft, R.; Gaudin, J.-M.; Pourthie, N.; Lalaurie, C.-J.; Mallet, A.; Nouvel, J.-F.; Martinot-Lagarde, J.; Oriot, H.; Borderies, P.; Ruiz, C. KaRIn on SWOT: Characteristics of Near-Nadir Ka-Band Interferometric SAR Imagery. IEEE Trans. Geosci. Remote Sens. 2013, 52, 2172–2185. [Google Scholar] [CrossRef]
Publisher’s Note: MDPI stays neutral with regard to jurisdictional claims in published maps and institutional affiliations. |
© 2022 by the authors. Licensee MDPI, Basel, Switzerland. This article is an open access article distributed under the terms and conditions of the Creative Commons Attribution (CC BY) license (https://creativecommons.org/licenses/by/4.0/).