1. Introduction
Over the past few decades, as space techniques are leaping forward, searching on the moon has been arousing huge attention from the public. As impacted by the unique environment, the moon has abundant resources that do not exist on the earth, which may lead to breakthroughs in numerous novel technologies and help human societies develop more sustainably. Accordingly, a large number of nations have launched their lunar exploration programs and learned the importance of researching the impact craters to select the landing sites of their space ships. To be more specific, the size and distribution of impact craters should be recorded to generate 3D images of the surface and gain insights into the terrain and landform of the moon. Besides, it helps to investigate the evolution of lunar geological structure and geological activities, i.e., the vital information of landing space ships. Being passionate about the moon, China delivered considerable exploration satellites. The mentioned lunar exploration satellites provide digital elevation map (DEM) data and digital orthophoto map (DOM) data that cover the whole moon with different resolutions. For accuracy, these data outperform the other lunar surface image data and can present the information on impact craters. Thus far, considerable studies have focused on crater detection. However, the processing and analysis of most existing crater detection methods stress the optical images, thereby causing some limitations. First, the display of the impact crater on the optical image is easily affected by the direction of sunlight; moreover, it is difficult to identify the small impact craters with diameters less than 3 km on the optical images, even under reasonable sunlight conditions.
As impacted by the limitations, lunar craters detection still remains challenging. To address the common difficulties, Silburt et al. [
1] adopted DEM data to detect impact craters, where they sampled DEM data with a depth of 16 bits/pixel to 8 bits/pixel, and introduce them into the convolutional neural network as the common picture data for learning. Though the effects of sunlight exposure can be slightly reduced, the detection ability of small impact craters remain poor. This study fully exploits the depth information in DEM data. First, the DEM data is transformed into the point cloud data. Then, the deep learning model is used to learn its deep semantic features for the preliminary detection. Lastly, more accurate detection results of lunar impact crater are obtained by post-processing the preliminary detection results.
In brief, the main contributions of this study include:
A novel impact crater point cloud dataset obtained from the high-precision DEM images that is acquired by Chang’E-2, as well as the corresponding category information for the respective point;
A two-stage learning-based method to detecting small impact craters, which first acquires the preliminary detection results by the semantic segmentation and then further polishes the results through the post-processing. The method is capable of robustly detecting small impact craters even with the disturbances of sunlight.
2. Related Work
2.1. Crater Detection Algorithm
Initially, the crater detection was conducted manually via the visual inspection of images [
2,
3,
4,
5], which has great limitations and defects. Crater detection algorithms (CDAs) aim to perform crater detection more efficiently and robustly. Among many surveys [
6,
7,
8], the CDAs can be divided in a range of manners. The most common is to divide CDAs into non-machine learning methods and machine learning methods.
2.1.1. Non-Machine Learning Methods
On the whole, methods [
9,
10,
11,
12,
13,
14,
15,
16], etc., use pattern recognition methods to identify the rims of the impact crater in an image. The mentioned methods first use the digital image processing technology to sharpen the edges of the impact crater rims. Based on the enhanced edges of the crater rims, these methods use the Hough Transform or the Template Matching to detect impact craters. Moreover, Kim et al. [
11] also used neural networks to remove false detection results. Honda et al. [
12] used the optimized detection algorithm to detect different clustered image sets.
2.1.2. Machine Learning Methods
Overall, the mentioned methods [
17,
18,
19,
20] should build a training set for model training as impacted by the use of machine learning methods. As revealed from the experimental results provided by Wetzler et al. [
20], the support vector machine achieved the optimal results at that time. Stepinski et al. [
21] used the decision tree algorithm based on the gradient algorithm. Di et al. [
22] adopted a novel variant of Haar-like features and a boosting algorithm to detect the square regions containing one crater. Pedrosa et al. [
23] used the watershed algorithm in infrared images, and they used the Template Matching to match the rim features of the craters.
A range of studies [
6,
7,
8,
14] compared numerous machine learning methods. However, the mentioned machine learning methods are now being replaced by deep learning methods. Methods [
1,
24,
25] are representative of the successful application of deep learning methods. These methods exploit the image semantic segmentation methods for the impact crater detection and have achieved high performance.
2.2. Semantic Segmentation of Point Clouds
The existing deep learning point cloud semantic segmentation methods can roughly fall into Projection-based Methods and Point-based Methods by complying with the input of the network. Projection-based Methods are capable of converting point cloud data into other forms of data (e.g., images and voxels), whereas they do not use the point cloud data as the input to the network. As opposed to the mentioned, Point-based Methods directly use the point cloud data as the original input of the network.
2.2.1. Projection-Based Methods
The general idea of methods including [
26,
27] is to represent point cloud data as a set of images rendered from multiple views. Subsequently, the rendered image is sent to the image semantic segmentation network. Through the pose mapping, the semantics of the original point cloud data is obtained by complying with the semantic segmentation results of the rendered image. The main problem facing the mentioned methods is how to improve the accuracy of image semantic segmentation, how to determine the number and distribution of views to cover a comprehensive 3D object, as well as how to avoid mutual occlusion.
Some methods [
28,
29,
30] voxelize the point cloud data and subsequently adopt a 3D convolution kernel to build a deep learning network for feature learning. The main problems of the mentioned methods include:
The selection of the voxelization scale. Using a smaller voxel can obtain a high-resolution voxel representation and retain the original data information maximally, whereas the resulting memory and calculation costs are excessively large. If a larger voxel is used, though memory and computational overhead will be reduced, considerable data information will be lost.
How to reduce computing memory and reduce computational overhead. For a scene like a square, after being voxelized, numerous voxels that do not contain any point cloud data will emerge. However, it should still be involved in the 3D convolution operation. Thus, considerable useless memory will be used, and a waste of computing resources will be caused. The mentioned problems can be solved in numerous manners. Riegler et al. [
31] exploited the idea of OctTree to efficiently represent voxels so that they can be operated at high resolution. Graham et al. [
32] introduced the sparse convolution and the submanifold sparse convolution, and they used hash to save memory and reduce the number of the operations.
2.2.2. Point-Based Methods
Point cloud data refers to the irregular data, and has disorder and rotation translation invariance. Thus, the conventional convolution kernel cannot directly act on the point cloud data. On that basis, various methods can directly use the original point cloud data.
Zaheer et al. [
33] introduced the basic conditions to achieve the permutate invariant and the permutate equivariant of the irregular data e.g., point cloud, and they realized the mentioned conditions through Multi-Layer Perceptron (MLP) to achieve feature learning. Besides, Qi et al. [
34] met the basic conditions by using the MLP and the Max Pooling, and the network was processed to have the rotation and translation invariance through the Spatial Transformer Network. Qi et al. [
35] made a further improvement on the basis of Qi et al. [
34], so that it can focus on local features (e.g., a convolution kernel), whereas it still adopts MLP for feature learning. In addition, Klokov et al. [
36] used the Kd-Tree to learn point cloud features.
Yi et al. [
37] exploited the idea of graph convolution to point cloud semantic segmentation. Its core idea refers to building a graph based on the relationship between the current point and its adjacent points, as well as updating the features of the current point through the adjacent points and adjacent edges of the current point. By yielding the representation of the Fourier transform and the inverse Fourier transform on the graph, the representation of the convolution operation on the graph can be expressed and adopted to update the features of the current point. Moreover, numerous methods [
38,
39,
40,
41,
42,
43,
44,
45,
46] place stress on how to construct the weighted sum operation similar to the convolution kernel and achieve effective results.
3. Methods
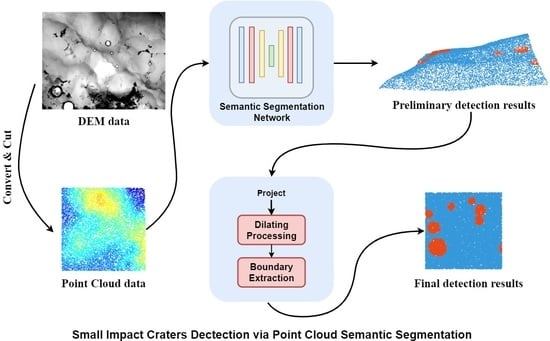
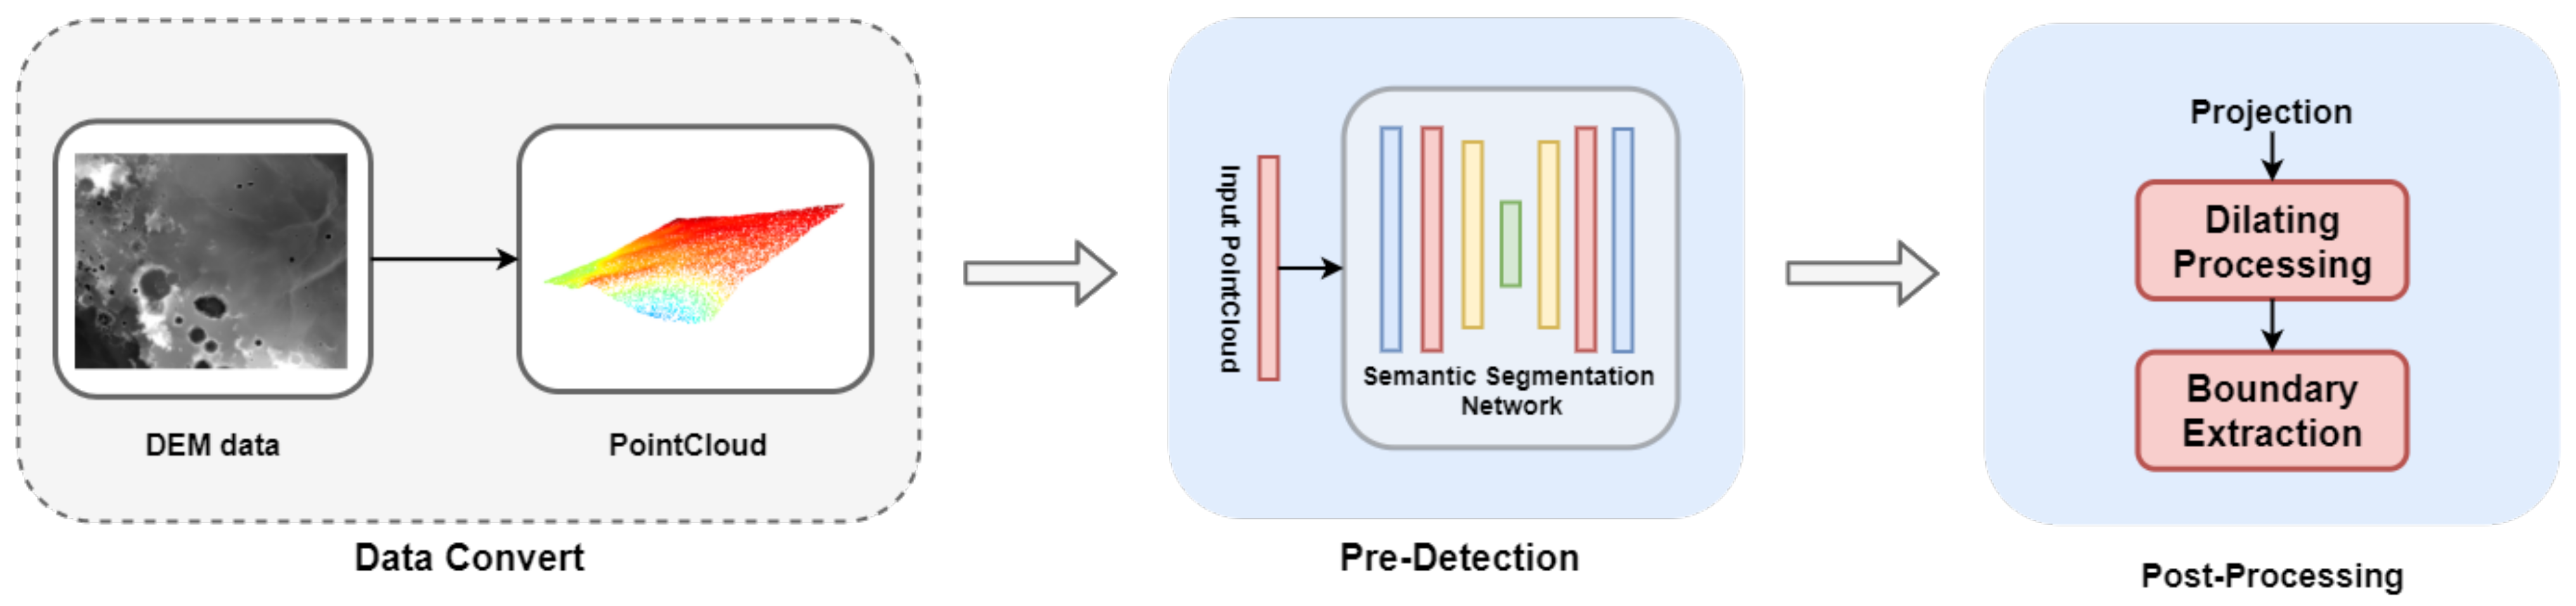
In the present section, the proposed algorithm framework for small impact crater detection is elucidated in detail. As illustrated in
Figure 1, the proposed algorithm largely comprises two stages, i.e., Pre-Detection and Post-Processing.The DEM data are first converted into the point cloud data. Subsequently, the point cloud semantic segmentation model here is adopted in the Pre-Detection module to achieve the preliminary detection results. Compared with DOM data, DEM data are less susceptible to the effect of solar illumination, which helps detect the detection of impact craters. Furthermore, by converting the DEM data to the point cloud data, no information loss will be caused, which often happens when the DEM data are used as image data. Next, the Post-Processing module will further refine the preliminary detection results. In
Section 3.1, the point cloud dataset of the moon is introduced. Besides, the point cloud semantic segmentation model in the pre-detection module is presented in
Section 3.2. Subsequently, the Post-Processing module here is introduced in
Section 3.3.
3.1. Point Cloud Dataset of the Moon
An effective dataset can underpin a deep learning network to exhibit better generalization capabilities. Labeling point cloud data refers to a sophisticated task. Two problems will arise if data on the point cloud data converted from DEM data are directly labeled:
Point cloud data transformed from DEM data are significantly large, so that the cost of labeling is noticeably high.
Human labeling will introduce considerable noise, impacted by the lack of relevant knowledge.
Thus, the DEM data obtained from Chang’E-2 and the impact crater data recently provided by Robbins [
47] are adopted to create a lunar impact crater point cloud data set with the labeled information.
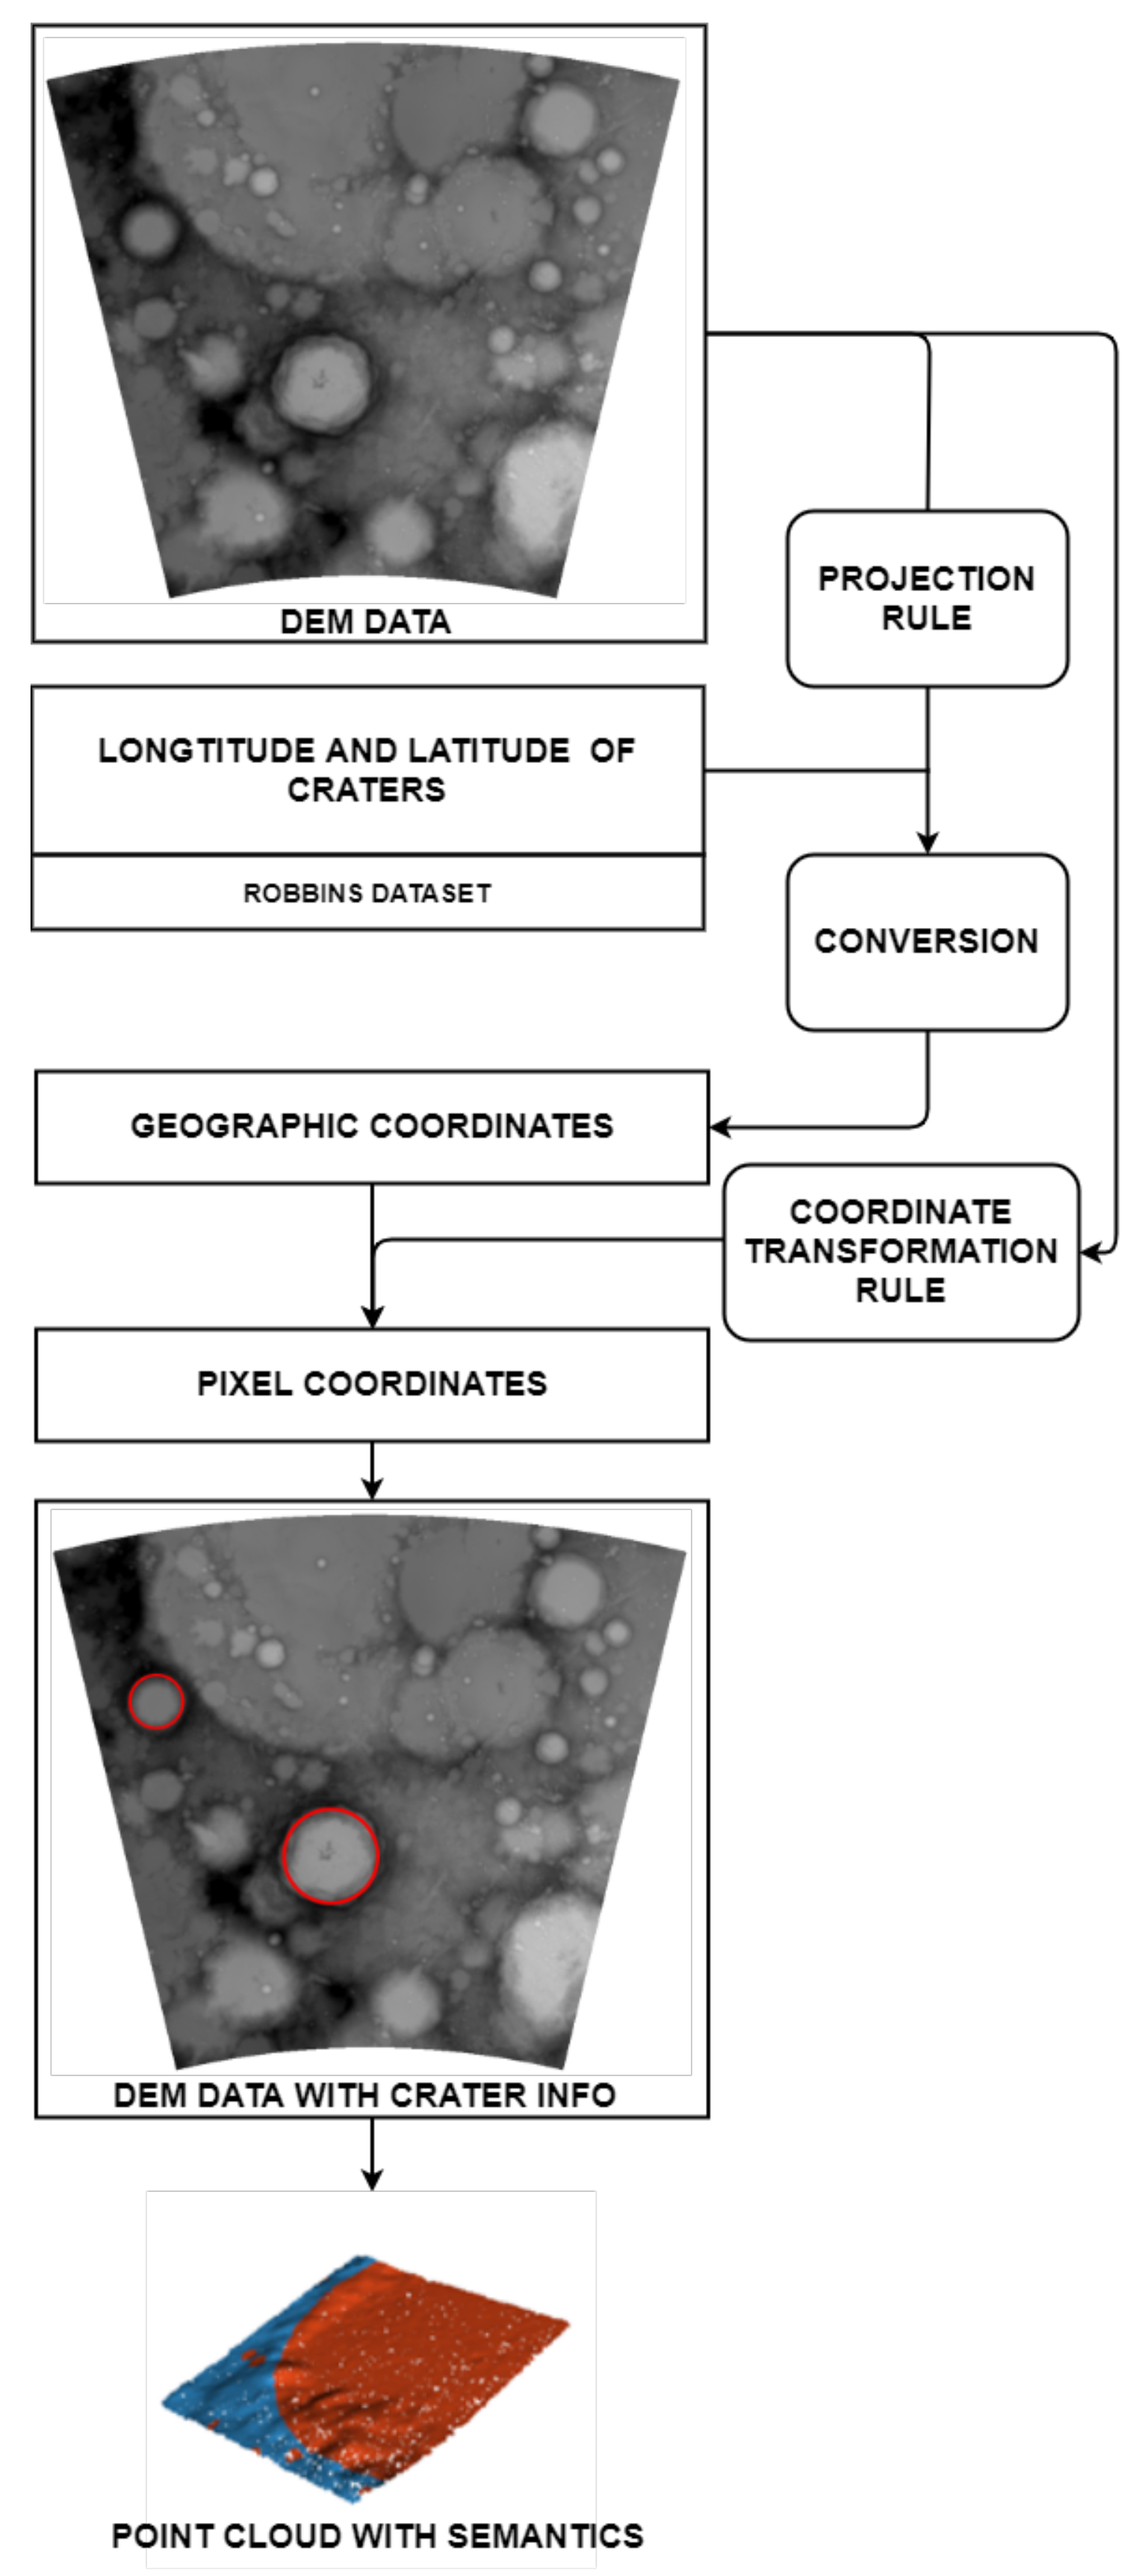
According to
Figure 2, the projection rule and the coordinate transformation rule of each DEM image are first obtained. Next, the impact craters should be mapped. To be specific, based on the conversion rules of the Geographic Information System (GIS), the longitude and latitude of the impact craters in the Robbins data are converted into geographic coordinates by using the projection rule. Next, the geographic coordinates are converted into pixel coordinates by using the coordinate transformation rule. Lastly, the point cloud data set with semantics is generated from the DEM data with the impact crater information, as shown in
Figure 3. Assuming that a pixel
in the DEM image contains a height information value
z, the pixel can be transformed into a point cloud
, where the calculation methods of
x and
y are expressed below:
where
v and
h express the unit pixel resolutions of the DEM image in the vertical and horizontal directions, respectively. Accordingly, the transformation from DEM to point cloud data can be completed.
3.2. Pre-Detection
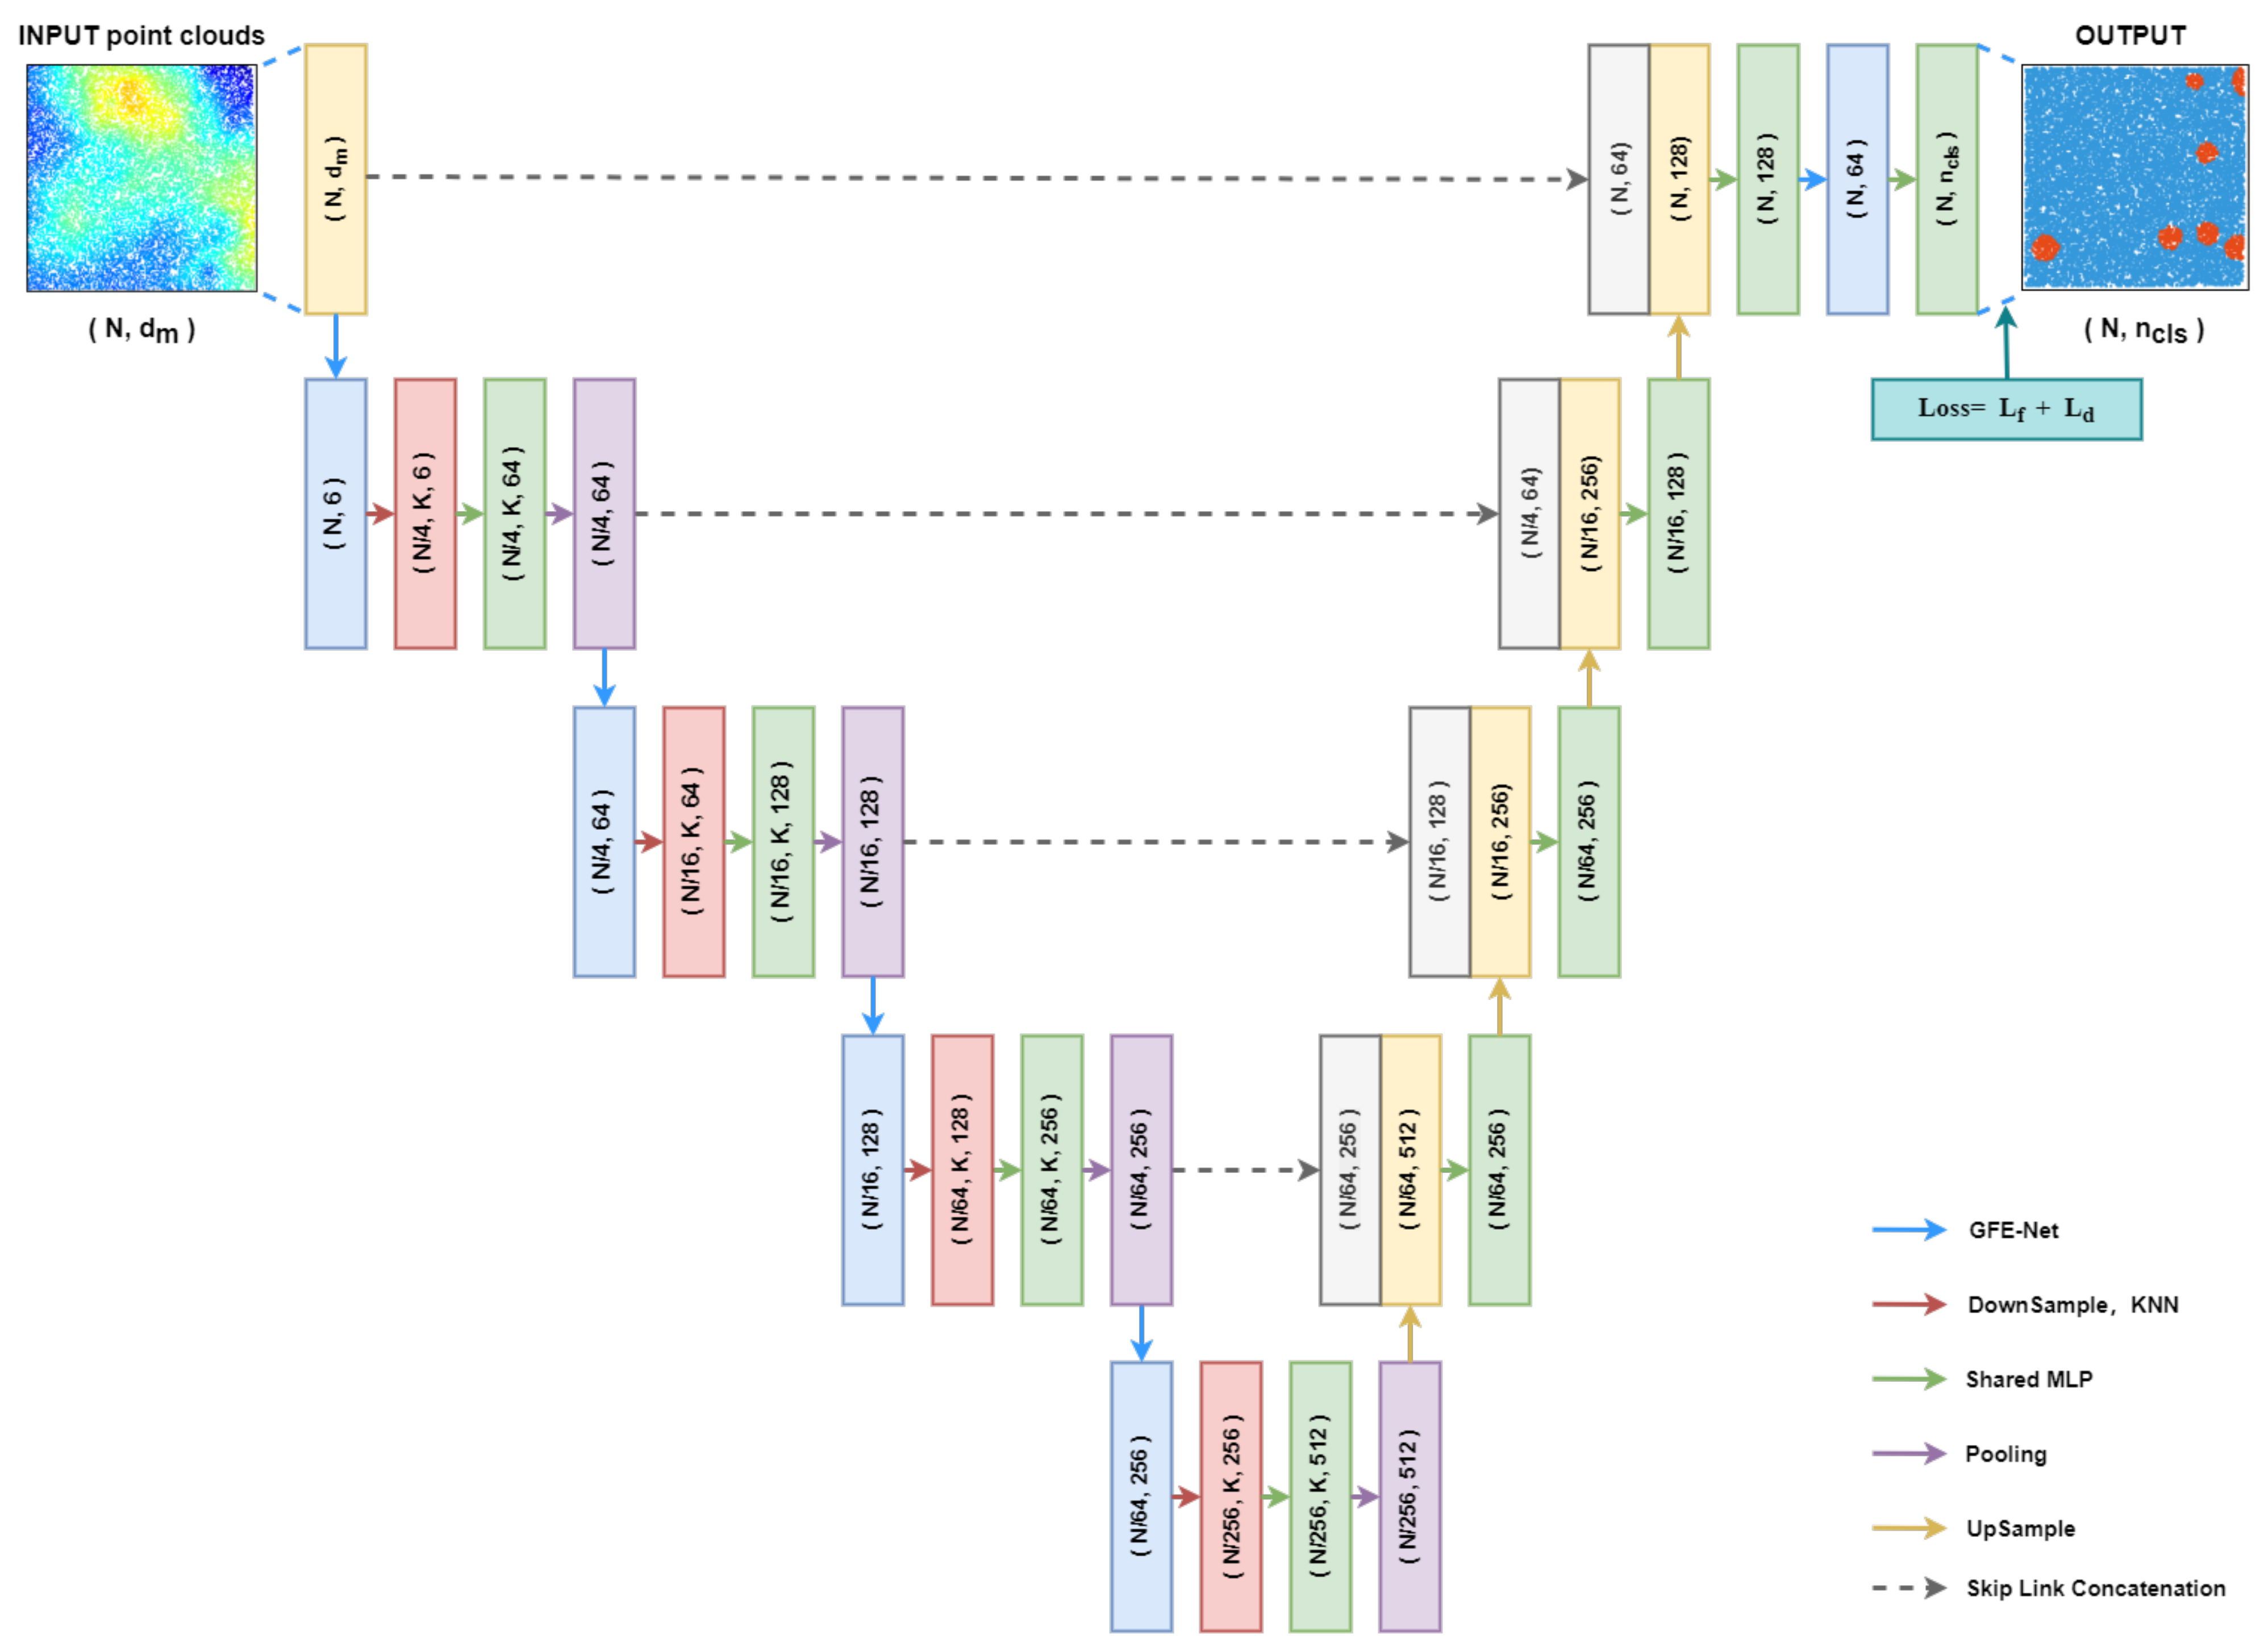
In the pre-detection module, a point cloud semantic segmentation deep learning network is adopted to pre-detect the point cloud data, which are converted from DEM data and then provide preliminary detection results(shown in
Figure 4). In this study, a new network is implemented based on pointnet++ architecture [
35], shown in
Figure 5. In this study, the point cloud semantic segmentation network consists of the downsampling stage and the upsampling stage. The downsampling stage and the upsampling stage are connected by the multi-level skip links. After the point cloud data is inputted into the point cloud semantic segmentation network in this study, four operations of “global feature exchange network- sampling-shared multilayer perceptron-pooling” are conducted in the downsampling stage. To be specific, the global feature exchange network (GFE-Net) refers to a sub-network proposed for learning global features. More details regarding GFE-Net ware presented in the following sections. The output features from the downsampling stage will undergo multiple “concatenation-upsampling-shared multilayer perceptron” operations. The skip link combines the multi-level features of the downsampling stage and the upsampling stage through “concatenation”. All multilayer perceptron in the network use the modified linear unit (ReLu) as the activation function. The last layer of the network outputs the probability that each point pertains to each category.
3.2.1. Global Feature Exchange Network
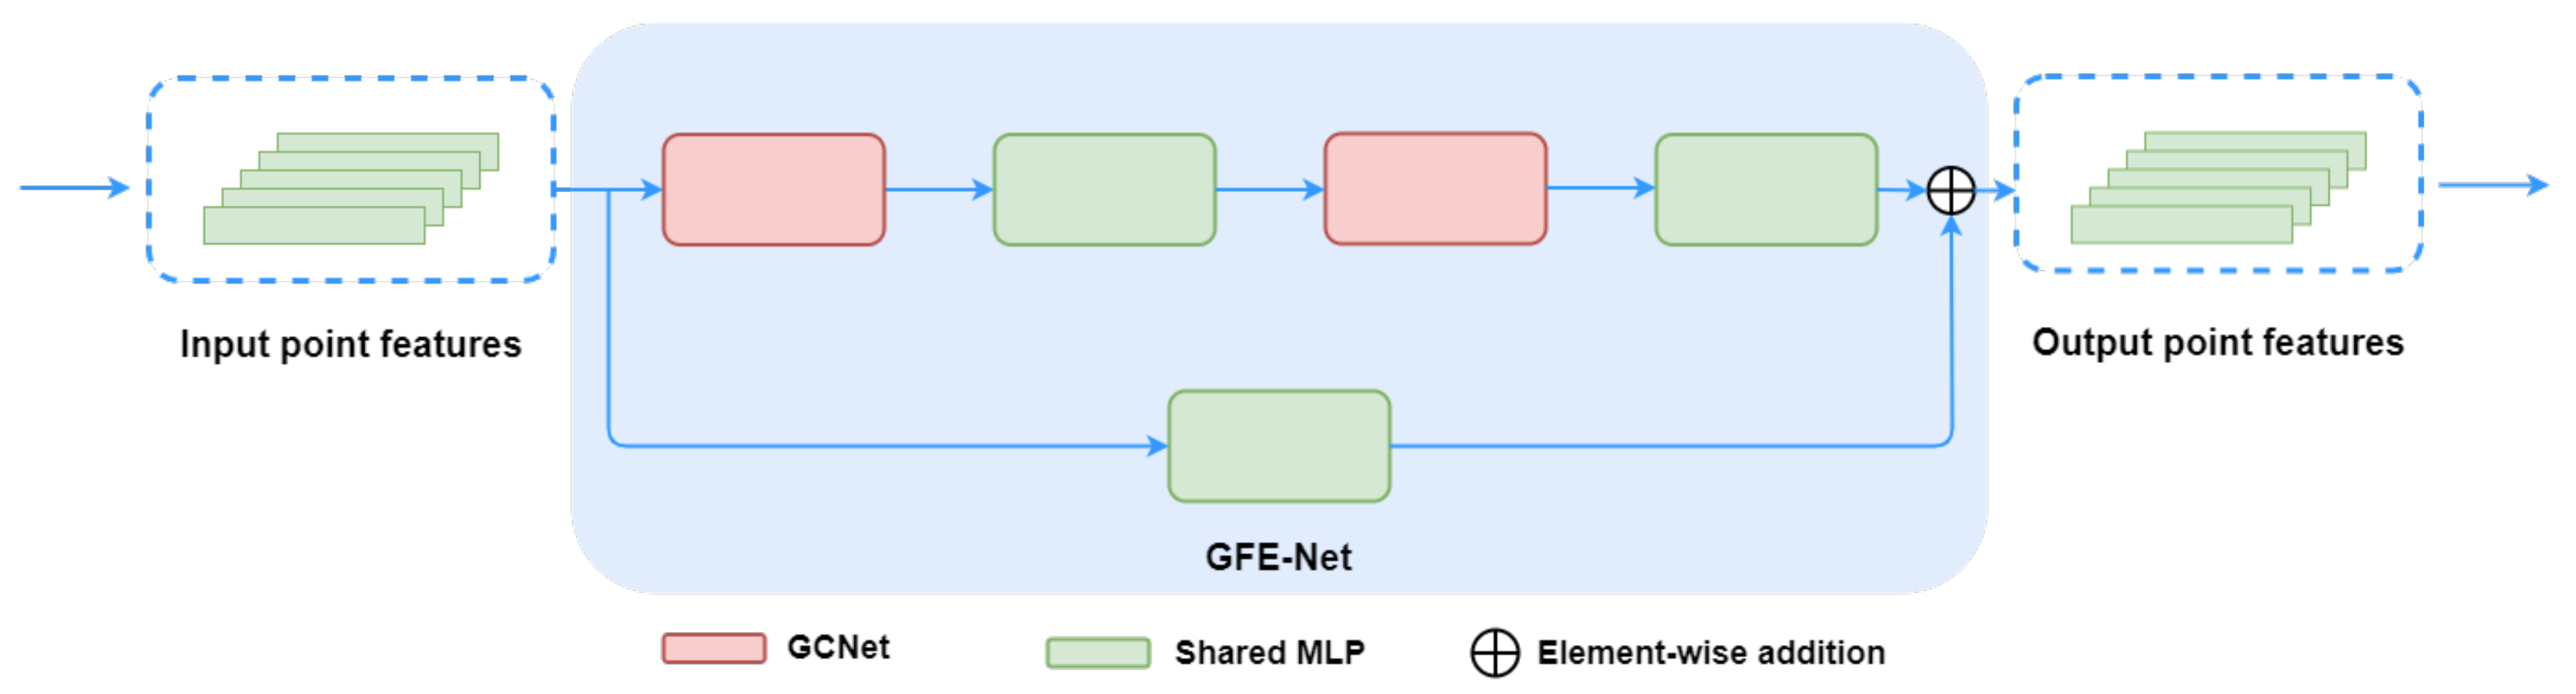
To allow the network to learn global features, the network should be endowed with information aggregation capabilities. To this end, a new network module termed as GFE-Net is proposed, shown in
Figure 6. GFE-Net receives the point features from the previous layer as the input. Besides, it employs an attention module to fuse the global features, and finally passes the output for new features to the next layer. This study adopts Global Context Network (GC-Net) [
48] as the attention module. GC-Net simplified Non-local Network and integrated with the Squeeze-and-Excitation Networks (SE-Net) [
49]. It saves the integration of global information aggregation capabilities, which avoid the expensive computation. Moreover, a residual mechanism is adopted to maintain the flow of low-level information to high-level information. The output
O of GFE-Net can be expressed as:
where
denotes the input point features,
is GCNet operator,
expresses a shared MLP.
3.2.2. Joint Loss
As revealed from the analysis of the data set, a serious imbalance exists between positive and negative samples. Numerous loss functions can be used to alleviate this problem. Focal loss [
50] is extensively used in object detection in computer vision. While solving the problem of uneven sample balance, it can also make the network focus on learning difficult samples. The Focal loss
can be expressed as:
where
N denotes the number of training samples;
represents the true probability of the sample;
is the predicted probability;
and
are hyperparameters adopted to control the loss performance. Dice loss [
51] also exhibits high performance in the problem of data imbalance, which can be formulated as:
where
and
sub-tables indicate the number of elements of semantic class
X and
Y, and
is the number of elements of the intersection between
X and
Y. In this study, a joint loss function composed of Focal loss and Dice loss is be applied to solve the sample imbalance problem mentioned before. Joint loss can be expressed as:
where
denotes a factor to balance two loss;
denotes the Focal loss;
expresses the Dice loss.
3.3. Post-Processing
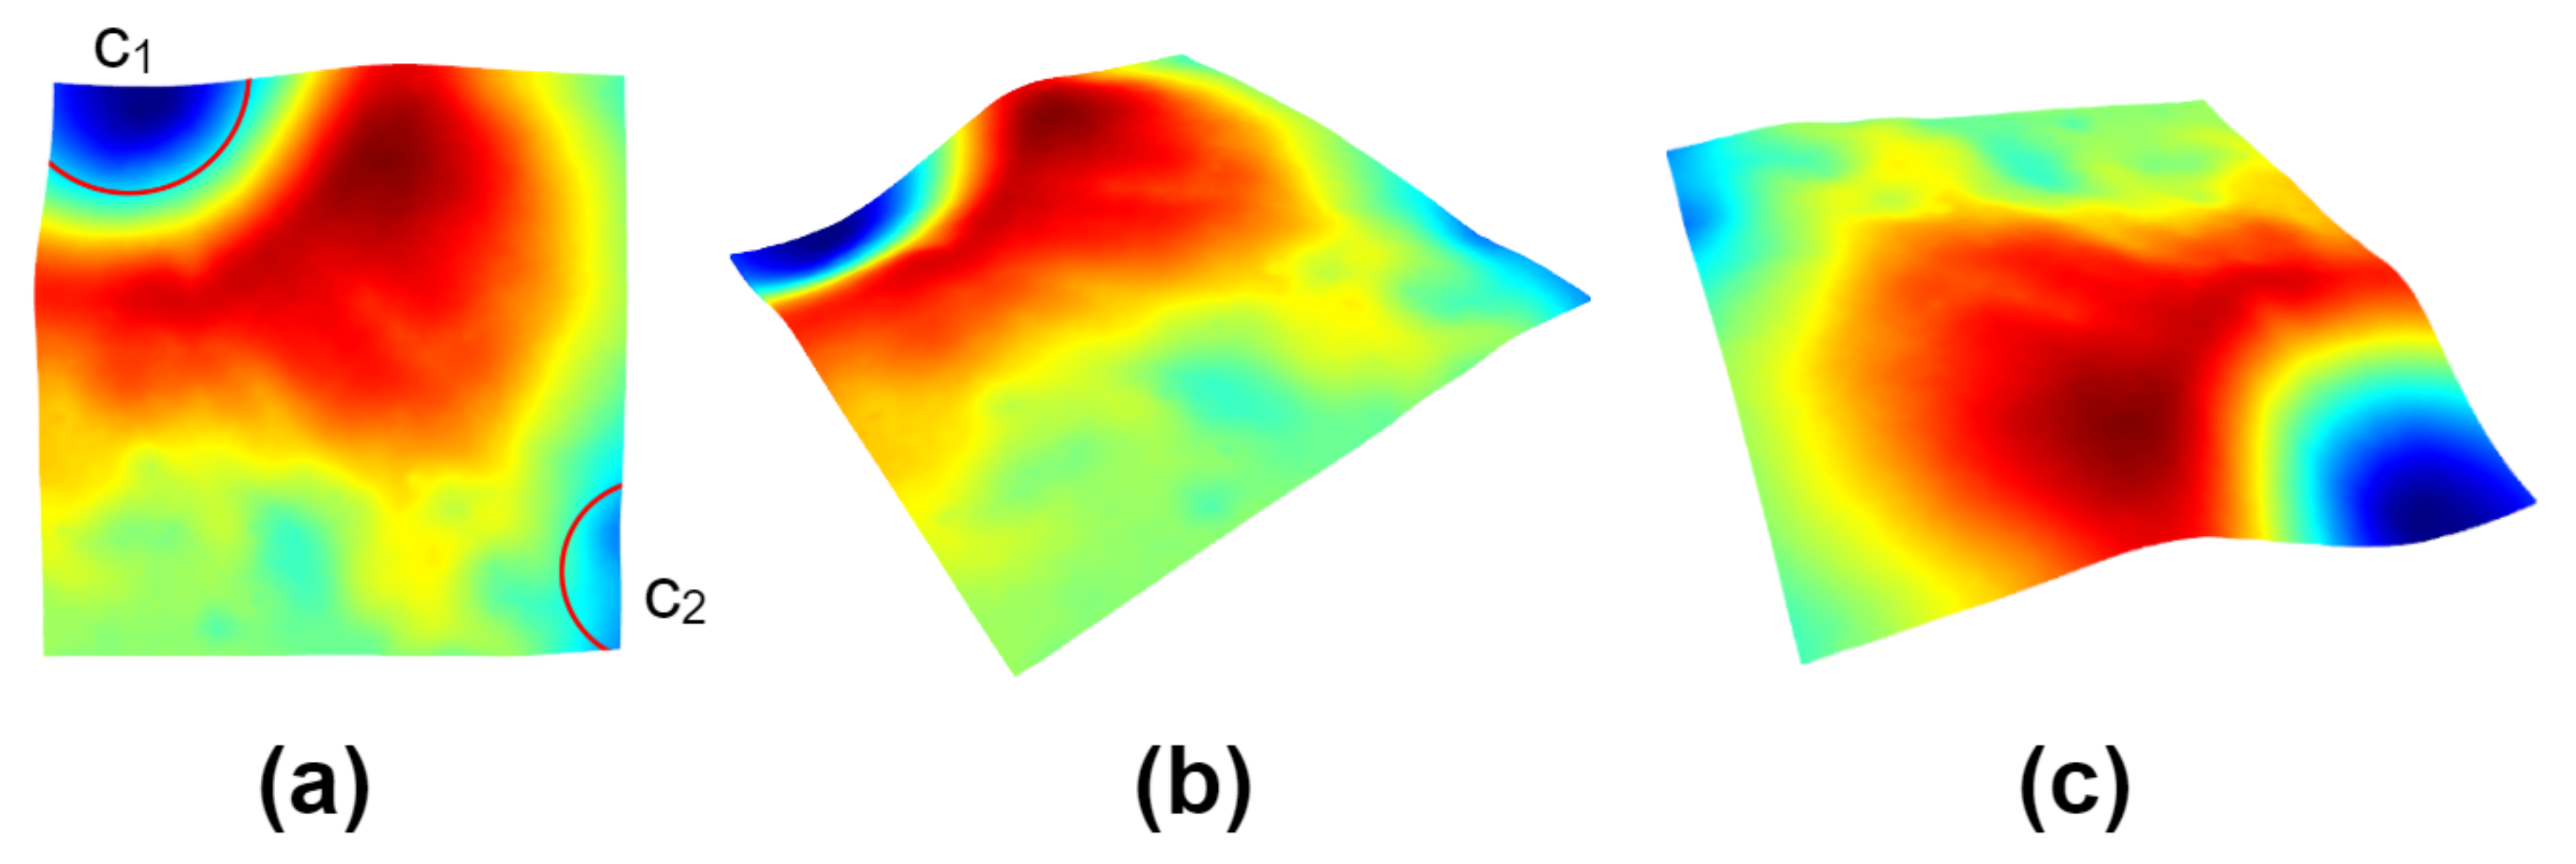
By comparing the preliminary detection results from the pre-detection module with the ground truth on the datasets, a small number of network predictions are still concentrated in the center of the crater. In other words, the point cloud semantic segmentation network remains ineffective at addressing the common problem that the point cloud semantic segmentation task cannot effectively segment the boundary well, though there has been great progress. In other point cloud semantic segmentation scenarios, it is generally achieved by introducing the additional plane geometry information or the boundary geometry information into the semantic segmentation network to achieve the correction of boundary segmentation. In the detection task of small lunar impact craters, the boundary of the small crater is not significant (shown in
Figure 7), so the additional geometric information cannot be introduced to achieve a better segmentation result. Accordingly, the post-processing module (shown in
Figure 1) is designed to refine the detection results.
The preliminary detection results are first projected to the 2D plane. Since the point cloud data originate from DEM data, the plane projection operation will not affect the preliminary detection results. Subsequently, the morphological dilation and boundary extraction operations will be carried out on the projection plane.
3.3.1. Dilating Processing
Through the morphological dilation operation, the preliminary detection results are concentrated in the center of the impact crater approach the edge of the impact crater. Moreover, there are also cases where multiple discontinuous segmentation results are detected in an impact crater. Through dilation operation, the mentioned discontinuous segmentation results will be linked together to form a whole. In the absence of the morphological dilation operation, the subsequent boundary extraction operation will extract multiple impact crater boundaries in a true impact crater, thereby seriously affecting the detection results. Thus, the morphological dilation operation is required.
3.3.2. Boundary Extraction
Boundary extraction acts as the core part of post-processing. From prior knowledge, the impact craters are known to be largely circular. Accordingly, the detection results can be improved by finding the circular boundary of the preliminary detection results. To extract the circle boundary, the contour finding algorithm in [
52] is first used to find the contour of the preliminary detection results on the projection plane. Next, according to the contour, the minimum enclosing circles of the preliminary detection results can be obtained. As shown in
Figure 8, the detection results can be effectively corrected in this manner.
4. Experiments
This section introduces the metrics and implementation details for the experiments in
Section 4.1 and
Section 4.2, respectively. Subsequently, the results on the dataset are reported in
Section 4.3.
4.1. Metrics
By referring the practices of most impact crater detection algorithms, the Precision, the Recall and the
measure metrics are adopted to evaluate the performance of the proposed algorithm. The Precision,
P, and the Recall,
R, are, respectively expressed as:
where
denotes the true positives, represents the number of samples that are positive and predicted to be positive;
denotes false negatives, represents the number of samples that are positive and predicted to be negative;
are false positives, represents the number of samples that are positive and predicted to be negative. In other words, the precision represents the ratio of the number of positive samples predicted to be positive to the number of all samples predicted to be positive.
In practice, however, the Precision and the Recall are often a pair of contradictory evaluation metrics. A trade-off between the Precision and the Recall should be obtained constantly. Thus,
score, as a balance metric between precision and recall, can more effectively evaluate the algorithm, as expressed below:
where
P denotes the precision, and
R is the recall. The core idea of
score refers to improving the precision and the recall. Besides, this score expects that the difference between the precision and the recall is minimal.
According to [
1], the new crater percentage is also adopted to measure the new craters,
, as expressed below:
where
N represents the number of impact craters detected by using the proposed algorithm, but not matched in the ground truth;
G is the number of ground-truth craters.
Moreover, the mean Iou (mIou) evaluation metric is adopted in the point cloud semantic segmentation task to evaluate the improvement brought by the proposed network. The calculation formula of mIou is written:
where
M denotes the number of semantic class;
T represents the point cloud of the current target in cloud truth;
I expresses the prediction point cloud of the current target;
and
, respectively, represent the intersection and union of prediction and cloud truth, respectively.
In the experiments here, the proposed algorithm is tested and evaluated at the in point-level and the crater-level, respectively, to show the performance of the proposed algorithm. The Point-level precision, the Point-level recall, the Point-level score and the mean Iou will be used to evaluate the performance of the proposed point cloud semantic segmentation network. To detect the performance of impact crater overall, the Crater-level precision, the Crater-level recall, the Crater-level score and the NCP are adopted to compare with other impact crater detection algorithms which also use the deep learning method.
4.2. Experiments Details
This study selected a total of 80 Chang’E DEM images with 50 m resolution covering 28 S 28 N area to make a point cloud dataset composed of 80 point clouds, and only small impact craters less than 3000 m in diameter are included in the dataset. Besides, 40 point clouds were randomly selected for the training, and the remaining 40 point clouds data were selected for the testing. Each point cloud has up to points, covering up to 500,000 × 430,000 × 20,000 m in moon 3D space.
Moreover, the following settings are used for the experiment here. In the training phase, the 40 training point clouds are cut and sampled using sliding window to get many small point clouds. In the end, a small point cloud of 16,384 points is sent to the network for training. The initial learning rate is set to 0.001 and decays with epoch, and the Adam optimizer with default parameters is used. During the testing process, the data are also cut and sampled to ensure the robustness of of the proposed method. In addition, the effect of the proposed method is verified based on the above metric. All experiments are conducted on four NVIDIA TITAN RTX GPUs.
4.3. Detection Result
In this part, the results of semantic segmentation (preliminary detection) are evaluated on our dataset, and the comparison experiments are conducted with: PointNet [
34], PointNet++ [
35].
To evaluate the semantic segmentation of the Pre-Detection network, the Precision, the Recall, the
and the Mean IoU (mIoU) are compared at the point-level. The classification accuracy of points is not presented, as accuracy is not a great reference under the effect of data imbalance. To ensure the fairness of the experiment, the parameters of each method are optimized to a great extent (including solving the problem of data imbalance). In
Table 1, the proposed network network significantly improves the results of detection which brings about 3% improvement in
and Mean IoU.
The results of pre-detection module and post-processing module are compared in
Table 2, in order to quantify the role of Post-Processing module. Compared with the preliminary detection results, the use of the Post-Processing module yields a result of 60.47% in Point-level
, which brings 1.2% improvement. Likewise, the Mean IoU has also improved by 1.23%
Moreover, the final detection results are also compared with the current deep learning crater detection algorithm Silburt [
1] at the crater-level. To test the performance of algorithm Silburt, we used the method mentioned in
Section 3.1 is adopted to map the Robbins data to the DEM image of Chang’E-2, whereas images are not converted to the point cloud data. In
Table 3, the proposed algorithm achieved better detection results in New Crater Percentage. The New Crater Percentage, the Recall and the crater-level
improved by 4.89%, 5.42%, and 0.67%, respectively. The improvement of Recall and New Crater Percentage shows the feasibility of using point cloud semantic segmentation for impact crater detection. Compared with image-based detection methods, the proposed method has greater advantages in the detection of small impact craters.
5. Discussion
Under the effect of the wave of deep learning, impact crater detection methods are constantly improving, and many novel image-oriented deep learning methods are used to get better detection results. The proposed method method starts from the point cloud, and applies the semantic segmentation method of point cloud to the crater impact detection, aiming at using the deep learning method to learn the deep spatial distribution characteristics and eliminate the effect of illumination. The experimental results show that the proposed method can obtain high detection results, mainly due to the following reasons:
The optical image will be affected by the light direction during the acquisition process. Under some illumination angles of sunlight, the grayscale information (or color information) of many impact craters will be consistent with the non-impact crater part, which will affect the detection results.
Converting DEM images to point cloud data does not cause the loss of elevation information. Accordingly, compared with other methods using DEM images directly, more information can be used to obtain better detection results.
Point cloud semantic segmentation learns the spatial information of impact crater, which is more conducive to the detection of impact crater than the color information of image.
However, the proposed method cannot be adopted to detect large impact craters. Besides the overlapping problem of super large impact craters and small impact craters, the biggest challenge is that the amount of point cloud data transformed from large impact craters are huge, which requires more computing resources. We also try to use sliding window, our previous work quadtree sampling [
53] and other methods to deal with large impact craters. However, its spatial distribution information will still be lost, causing training failure.
Moreover, an end-to-end network is actually required, which can accurately identify the boundary of the impact crater. However, up to now, whether it is image semantic segmentation, target detection and other technologies, crater boundary fitting remains not ideal. The proposed method also needs the post-processing module to correct the detection results, in order to better fit the impact crater boundary. How to design a network that better fits the boundary of the impact crater is also a direction that deserves further attention in the future.
6. Conclusions
This study focuses on improving the detection results of small impact craters. A two-stage detection method based on point cloud semantic segmentation is proposed to solve the problem that the optical image of small impact crater is easily affected by the direction of sunlight. At the first stage, a point cloud semantic segmentation network is proposed to obtain preliminary detection results. At the second stage, the post-processing module will further modify the preliminary detection results of the pre-detection module. Moreover, this study creates create a lunar impact crater point cloud data set with labeled information for training and testing, by using the DEM data obtained from Chang’E-2 and impact crater data recently provided by [
47]. The proposed method is also used on the test dataset, and the experiment results show that the proposed method can get better detection results.
However, the proposed method method also has some limitations. For the existing point cloud semantic segmentation technology, large-scale point cloud data cannot be sent to the network for training without sampling. In the experiment here, considerable spatial distribution information is lost when sampling the point cloud data of the large impact crater, so it is difficult to obtain good detection results.
In subsequent studies, the stress will be placed on the semantic segmentation on large-scale point cloud to detect large impact craters.
Author Contributions
Conceptualization, Y.H.; methodology, Y.H.; validation, Y.H., J.X., L.L. and Y.W.; writing—original draft, Y.H.; writing—review and editing, J.X., L.Z., L.L. and Y.W.; funding acquisition, J.X.; project administration, J.X.; supervision, J.X., L.L. and Y.W.; visualization, Y.H. All authors have read and agreed to the published version of the manuscript.
Funding
This work is supported by the Open Research Fund of Key Laboratory of Space Utilization, Chinese Academy of Sciences (No. LSU-KFJJ-2019-11), the Strategic Priority Research Program of the Chinese Academy of Sciences (No. XDA23090304), National Natural Science Foundation of China (U2003109), the Youth Innovation Promotion Association of the Chinese Academy of Sciences (Y201935), the Fundamental Research Funds for the Central Universities and the National Key R&D Program of China under Grant (2018YFB1005001).
Institutional Review Board Statement
Not applicable.
Informed Consent Statement
Not applicable.
Data Availability Statement
Data are available in a publicly accessible repository that does not issue DOIs. Publicly available datasets were analyzed in this study.
Acknowledgments
The authors would like to thank the reviewers for their valuable comments and suggestions.
Conflicts of Interest
The authors declare no conflict of interest.
References
- Silburt, A.; Ali-Dib, M.; Zhu, C.; Jackson, A.; Valencia, D.; Kissin, Y.; Tamayo, D.; Menou, K. Lunar crater identification via deep learning. Icarus 2019, 317, 27–38. [Google Scholar] [CrossRef]
- Barlow, N.G. Crater size-frequency distributions and a revised Martian relative chronology. Icarus 1988, 75, 285–305. [Google Scholar] [CrossRef]
- Rodionova, J.; Dekchtyareva, K.; Khramchikhin, A.; Michael, G.; Ajukov, S.; Pugacheva, S.; Shevchenko, V. Morphological Catalogue of the Craters of Mars; ESA-ESTEC: Noordwijk, The Netherlands, 2000. [Google Scholar]
- Andersson, L.; Whitaker, E.A. NASA Catalogue of Lunar Nomenclature; NASA: Washington, DC, USA, 1982. [Google Scholar]
- Kozlova, E.; Michael, G.; Rodionova, J.; Shevchenko, V. Compilation and preliminary analysis of a catalogue of craters of mercury. In Proceedings of the 32nd Annual Lunar and Planetary Science Conference, Houston, TX, USA, 12–16 March 2001; p. 1231. [Google Scholar]
- Patil, J.; Kini, S.N. A Survey Paper on Crater Detection. Int. J. Sci. Res. IJSR 2015, 4, 81–85. [Google Scholar]
- Stepinski, T.; Ding, W.; Vilalta, R. Detecting impact craters in planetary images using machine learning. In Intelligent Data Analysis for Real-Life Applications: Theory and Practice; IGI Global: Hershey, PA, USA, 2012; pp. 146–159. [Google Scholar]
- Sawabe, Y.; Matsunaga, T.; Rokugawa, S. Automated detection and classification of lunar craters using multiple approaches. Adv. Space Res. 2006, 37, 21–27. [Google Scholar] [CrossRef]
- Barata, T.; Alves, E.I.; Saraiva, J.; Pina, P. Automatic recognition of impact craters on the surface of Mars. In Proceedings of the International Conference Image Analysis and Recognition, Porto, Portugal, 29 September–1 October 2004; pp. 489–496. [Google Scholar]
- Cheng, Y.; Johnson, A.E.; Matthies, L.H.; Olson, C.F. Optical Landmark Detection for Spacecraft Navigation; NASA: Washington, DC, USA, 2003. [Google Scholar]
- Kim, J.R.; Muller, J.P.; van Gasselt, S.; Morley, J.G.; Neukum, G. Automated crater detection, a new tool for Mars cartography and chronology. Photogramm. Eng. Remote Sens. 2005, 71, 1205–1217. [Google Scholar] [CrossRef]
- Honda, R.; Iijima, Y.; Konishi, O. Mining of topographic feature from heterogeneous imagery and its application to lunar craters. In Progress in Discovery Science; Springer: Berlin/Heidelberg, Germany, 2002; pp. 395–407. [Google Scholar]
- Leroy, B.; Medioni, G.; Johnson, E.; Matthies, L. Crater detection for autonomous landing on asteroids. Image Vis. Comput. 2001, 19, 787–792. [Google Scholar] [CrossRef]
- Salamuniccar, G.; Loncaric, S. Method for crater detection from martian digital topography data using gradient value/orientation, morphometry, vote analysis, slip tuning, and calibration. IEEE Trans. Geosci. Remote Sens. 2010, 48, 2317–2329. [Google Scholar] [CrossRef]
- Salamunićcar, G.; Lončarić, S. GT-57633 catalogue of Martian impact craters developed for evaluation of crater detection algorithms. Planet. Space Sci. 2008, 56, 1992–2008. [Google Scholar] [CrossRef]
- Salamunićcar, G.; Lončarić, S. Open framework for objective evaluation of crater detection algorithms with first test-field subsystem based on MOLA data. Adv. Space Res. 2008, 42, 6–19. [Google Scholar] [CrossRef]
- Burl, M.C.; Stough, T.; Colwell, W.; Bierhaus, E.; Merline, W.; Chapman, C. Automated Detection of Craters and Other Geological Features; NASA: Washington, DC, USA, 2001. [Google Scholar]
- Plesko, C.; Brumby, S.; Asphaug, E.; Chamberlain, D.; Engel, T. Automatic crater counts on mars. In Proceedings of the 35th Lunar and Planetary Science Conference, League City, TX, USA, 15–19 March 2004; p. 1935. [Google Scholar]
- Vinogradova, T.; Burl, M.; Mjolsness, E. Training of a crater detection algorithm for Mars crater imagery. In Proceedings of the IEEE Aerospace Conference, Big Sky, MT, USA, 9–16 March 2002; Volume 7, p. 7. [Google Scholar]
- Wetzler, P.G.; Honda, R.; Enke, B.; Merline, W.J.; Chapman, C.R.; Burl, M.C. Learning to detect small impact craters. In Proceedings of the 2005 Seventh IEEE Workshops on Applications of Computer Vision (WACV/MOTION’05)-Volume 1, Breckenridge, CO, USA, 5–7 January 2005; Volume 1, pp. 178–184. [Google Scholar]
- Stepinski, T.F.; Mendenhall, M.P.; Bue, B.D. Machine cataloging of impact craters on Mars. Icarus 2009, 203, 77–87. [Google Scholar] [CrossRef]
- Di, K.; Li, W.; Yue, Z.; Sun, Y.; Liu, Y. A machine learning approach to crater detection from topographic data. Adv. Space Res. 2014, 54, 2419–2429. [Google Scholar] [CrossRef]
- Pedrosa, M.M.; de Azevedo, S.C.; da Silva, E.A.; Dias, M.A. Improved automatic impact crater detection on Mars based on morphological image processing and template matching. Geomat. Nat. Hazards Risk 2017, 8, 1306–1319. [Google Scholar] [CrossRef]
- DeLatte, D.M.; Crites, S.T.; Guttenberg, N.; Tasker, E.J.; Yairi, T. Segmentation Convolutional Neural Networks for Automatic Crater Detection on Mars. IEEE J. Sel. Top. Appl. Earth Obs. Remote Sens. 2019, 12, 2944–2957. [Google Scholar] [CrossRef]
- Lee, C. Automated crater detection on Mars using deep learning. Planet. Space Sci. 2019, 170, 16–28. [Google Scholar] [CrossRef]
- Lawin, F.J.; Danelljan, M.; Tosteberg, P.; Bhat, G.; Khan, F.S.; Felsberg, M. Deep projective 3D semantic segmentation. In Proceedings of the International Conference on Computer Analysis of Images and Patterns, Ystad, Sweden, 22–24 August 2017; pp. 95–107. [Google Scholar]
- Boulch, A.; Le Saux, B.; Audebert, N. Unstructured Point Cloud Semantic Labeling Using Deep Segmentation Networks. 3DOR 2017, 2, 7. [Google Scholar]
- Liu, F.; Li, S.; Zhang, L.; Zhou, C.; Ye, R.; Wang, Y.; Lu, J. 3DCNN-DQN-RNN: A deep reinforcement learning framework for semantic parsing of large-scale 3D point clouds. In Proceedings of the IEEE International Conference on Computer Vision, Venice, Italy, 22–29 October 2017; pp. 5678–5687. [Google Scholar]
- Çiçek, Ö.; Abdulkadir, A.; Lienkamp, S.S.; Brox, T.; Ronneberger, O. 3D U-Net: Learning dense volumetric segmentation from sparse annotation. In Proceedings of the International Conference on Medical Image Computing and Computer-Assisted Intervention, Athens, Greece, 17–21 October 2016; pp. 424–432. [Google Scholar]
- Tchapmi, L.; Choy, C.; Armeni, I.; Gwak, J.; Savarese, S. Segcloud: Semantic segmentation of 3d point clouds. In Proceedings of the 2017 International Conference on 3D Vision (3DV), Qingdao, China, 10–12 October 2017; pp. 537–547. [Google Scholar]
- Riegler, G.; Osman Ulusoy, A.; Geiger, A. Octnet: Learning deep 3d representations at high resolutions. In Proceedings of the IEEE Conference on Computer Vision and Pattern Recognition, Honolulu, HI, USA, 21–26 July 2017; pp. 3577–3586. [Google Scholar]
- Graham, B.; Engelcke, M.; Van Der Maaten, L. 3d semantic segmentation with submanifold sparse convolutional networks. In Proceedings of the IEEE Conference on Computer Vision and Pattern Recognition, Salt Lake City, UT, USA, 18–23 June 2018; pp. 9224–9232. [Google Scholar]
- Zaheer, M.; Kottur, S.; Ravanbakhsh, S.; Poczos, B.; Salakhutdinov, R.R.; Smola, A.J. Deep sets. In Proceedings of the Advances in Neural Information Processing Systems, Long Beach, CA, USA, 4–9 December 2017; pp. 3391–3401. [Google Scholar]
- Qi, C.R.; Su, H.; Mo, K.; Guibas, L.J. Pointnet: Deep learning on point sets for 3d classification and segmentation. In Proceedings of the IEEE Conference on Computer Vision and Pattern Recognition, Honolulu, HI, USA, 21–26 July 2017; pp. 652–660. [Google Scholar]
- Qi, C.R.; Yi, L.; Su, H.; Guibas, L.J. Pointnet++: Deep hierarchical feature learning on point sets in a metric space. In Proceedings of the Advances in Neural Information Processing Systems, Long Beach, CA, USA, 4–9 December 2017; pp. 5099–5108. [Google Scholar]
- Klokov, R.; Lempitsky, V. Escape from cells: Deep kd-networks for the recognition of 3d point cloud models. In Proceedings of the IEEE International Conference on Computer Vision, Venice, Italy, 22–29 October 2017; pp. 863–872. [Google Scholar]
- Yi, L.; Su, H.; Guo, X.; Guibas, L. SyncSpecCNN: Synchronized Spectral CNN for 3D Shape Segmentation. In Proceedings of the 2017 IEEE Conference on Computer Vision and Pattern Recognition (CVPR), Honolulu, HI, USA, 21–26 July 2017; pp. 6584–6592. [Google Scholar] [CrossRef]
- Simonovsky, M.; Komodakis, N. Dynamic edge-conditioned filters in convolutional neural networks on graphs. In Proceedings of the IEEE Conference on Computer Vision and Pattern Recognition, Honolulu, HI, USA, 21–26 July 2017; pp. 3693–3702. [Google Scholar]
- Le, T.; Duan, Y. Pointgrid: A deep network for 3d shape understanding. In Proceedings of the IEEE Conference on Computer Vision and Pattern Recognition, Salt Lake City, UT, USA, 18–23 June 2018; pp. 9204–9214. [Google Scholar]
- Lifschitz, V. Pointwise circumscription. In Proceedings of the National Conference on Artificial Intelligence (AAAI), Philadelphia, PA, USA, 11–15 August 1986; pp. 406–410. [Google Scholar]
- Li, Y.; Bu, R.; Sun, M.; Wu, W.; Di, X.; Chen, B. Pointcnn: Convolution on x-transformed points. In Proceedings of the Advances in Neural Information Processing Systems, Montréal, QC, Canada, 3–8 December2018; Volume 31, pp. 820–830. [Google Scholar]
- Su, H.; Jampani, V.; Sun, D.; Maji, S.; Kalogerakis, E.; Yang, M.H.; Kautz, J. Splatnet: Sparse lattice networks for point cloud processing. In Proceedings of the IEEE Conference on Computer Vision and Pattern Recognition, Salt Lake City, UT, USA, 18–23 June 2018; pp. 2530–2539. [Google Scholar]
- Liu, Y.; Fan, B.; Xiang, S.; Pan, C. Relation-shape convolutional neural network for point cloud analysis. In Proceedings of the IEEE Conference on Computer Vision and Pattern Recognition, Long Beach, CA, USA, 15–20 June 2019; pp. 8895–8904. [Google Scholar]
- Wu, W.; Qi, Z.; Fuxin, L. Pointconv: Deep convolutional networks on 3d point clouds. In Proceedings of the IEEE Conference on Computer Vision and Pattern Recognition, Long Beach, CA, USA, 15–20 June 2019; pp. 9621–9630. [Google Scholar]
- Mao, J.; Wang, X.; Li, H. Interpolated convolutional networks for 3d point cloud understanding. In Proceedings of the IEEE International Conference on Computer Vision, Long Beach, CA, USA, 15–20 June 2019; pp. 1578–1587. [Google Scholar]
- Wang, Y.; Sun, Y.; Liu, Z.; Sarma, S.E.; Bronstein, M.M.; Solomon, J.M. Dynamic graph cnn for learning on point clouds. ACM Trans. Graph. Tog 2019, 38, 1–12. [Google Scholar] [CrossRef]
- Robbins, S.J. A new global database of lunar impact craters> 1–2 km: 1. Crater locations and sizes, comparisons with published databases, and global analysis. J. Geophys. Res. Planets 2019, 124, 871–892. [Google Scholar] [CrossRef]
- Cao, Y.; Xu, J.; Lin, S.; Wei, F.; Hu, H. Gcnet: Non-local networks meet squeeze-excitation networks and beyond. In Proceedings of the IEEE/CVF International Conference on Computer Vision Workshops, Seoul, Korea, 27 October–2 November 2019. [Google Scholar]
- Hu, J.; Shen, L.; Sun, G. Squeeze-and-excitation networks. In Proceedings of the IEEE Conference on Computer Vision and Pattern Recognition, Salt Lake City, UT, US, 18–23 June 2018; pp. 7132–7141. [Google Scholar]
- Lin, T.Y.; Goyal, P.; Girshick, R.; He, K.; Dollár, P. Focal loss for dense object detection. In Proceedings of the IEEE International Conference on Computer Vision, Venice, Italy, 22–29 October 2017; pp. 2980–2988. [Google Scholar]
- Milletari, F.; Navab, N.; Ahmadi, S.A. V-net: Fully convolutional neural networks for volumetric medical image segmentation. In Proceedings of the 2016 Fourth International Conference on 3D Vision (3DV), Stanford, CA, USA, 25–28 October 2016; pp. 565–571. [Google Scholar]
- Suzuki, S. Topological structural analysis of digitized binary images by border following. Comput. Vision Graph. Image Process. 1985, 30, 32–46. [Google Scholar] [CrossRef]
- Lu, Y.; Hu, Y.; Xiao, J.; Liu, L.; Zhang, L.; Wang, Y. Three-Dimensional Model of the Moon with Semantic Information of Craters Based on Chang’e Data. Sensors 2021, 21, 959. [Google Scholar] [CrossRef] [PubMed]
Figure 1.
Illustration of overall framework of the proposed method. The pre-detection module takes the point cloud data transformed from DEM data as input, and outputs the preliminary prediction results. Next, the preliminary detection results are refined in the post-processing module.
Figure 1.
Illustration of overall framework of the proposed method. The pre-detection module takes the point cloud data transformed from DEM data as input, and outputs the preliminary prediction results. Next, the preliminary detection results are refined in the post-processing module.
Figure 2.
The construction process of the point cloud dataset. The projection rule is capable of completing the mapping from longitude and latitude to geographical coordinates, and the coordinate transformation rule leads to the conversion from geographic coordinates to pixel coordinates.
Figure 2.
The construction process of the point cloud dataset. The projection rule is capable of completing the mapping from longitude and latitude to geographical coordinates, and the coordinate transformation rule leads to the conversion from geographic coordinates to pixel coordinates.
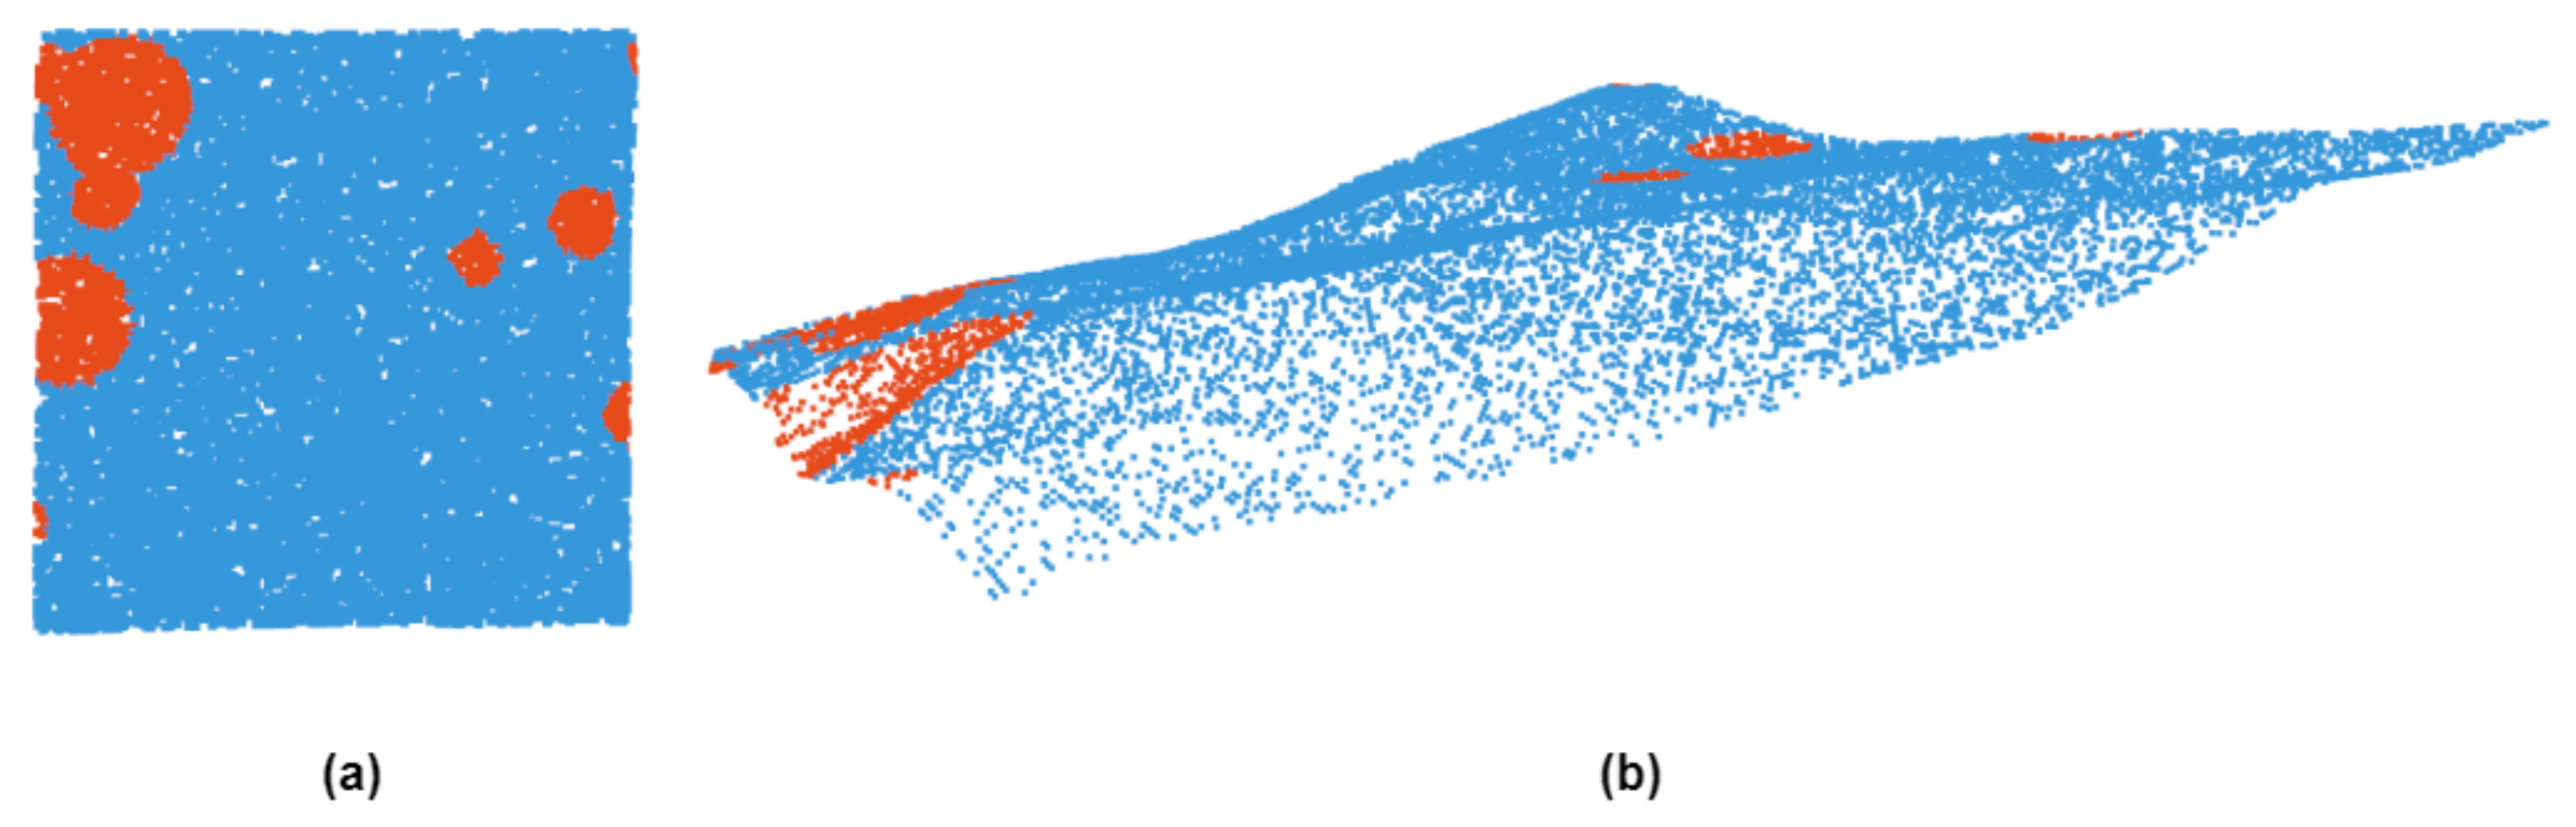
Figure 3.
Point cloud dataset. (a) shows a vertical view of an area in the point cloud dataset, and red marks the impact craters. (b) represents the point cloud data of the region from another perspective.
Figure 3.
Point cloud dataset. (a) shows a vertical view of an area in the point cloud dataset, and red marks the impact craters. (b) represents the point cloud data of the region from another perspective.
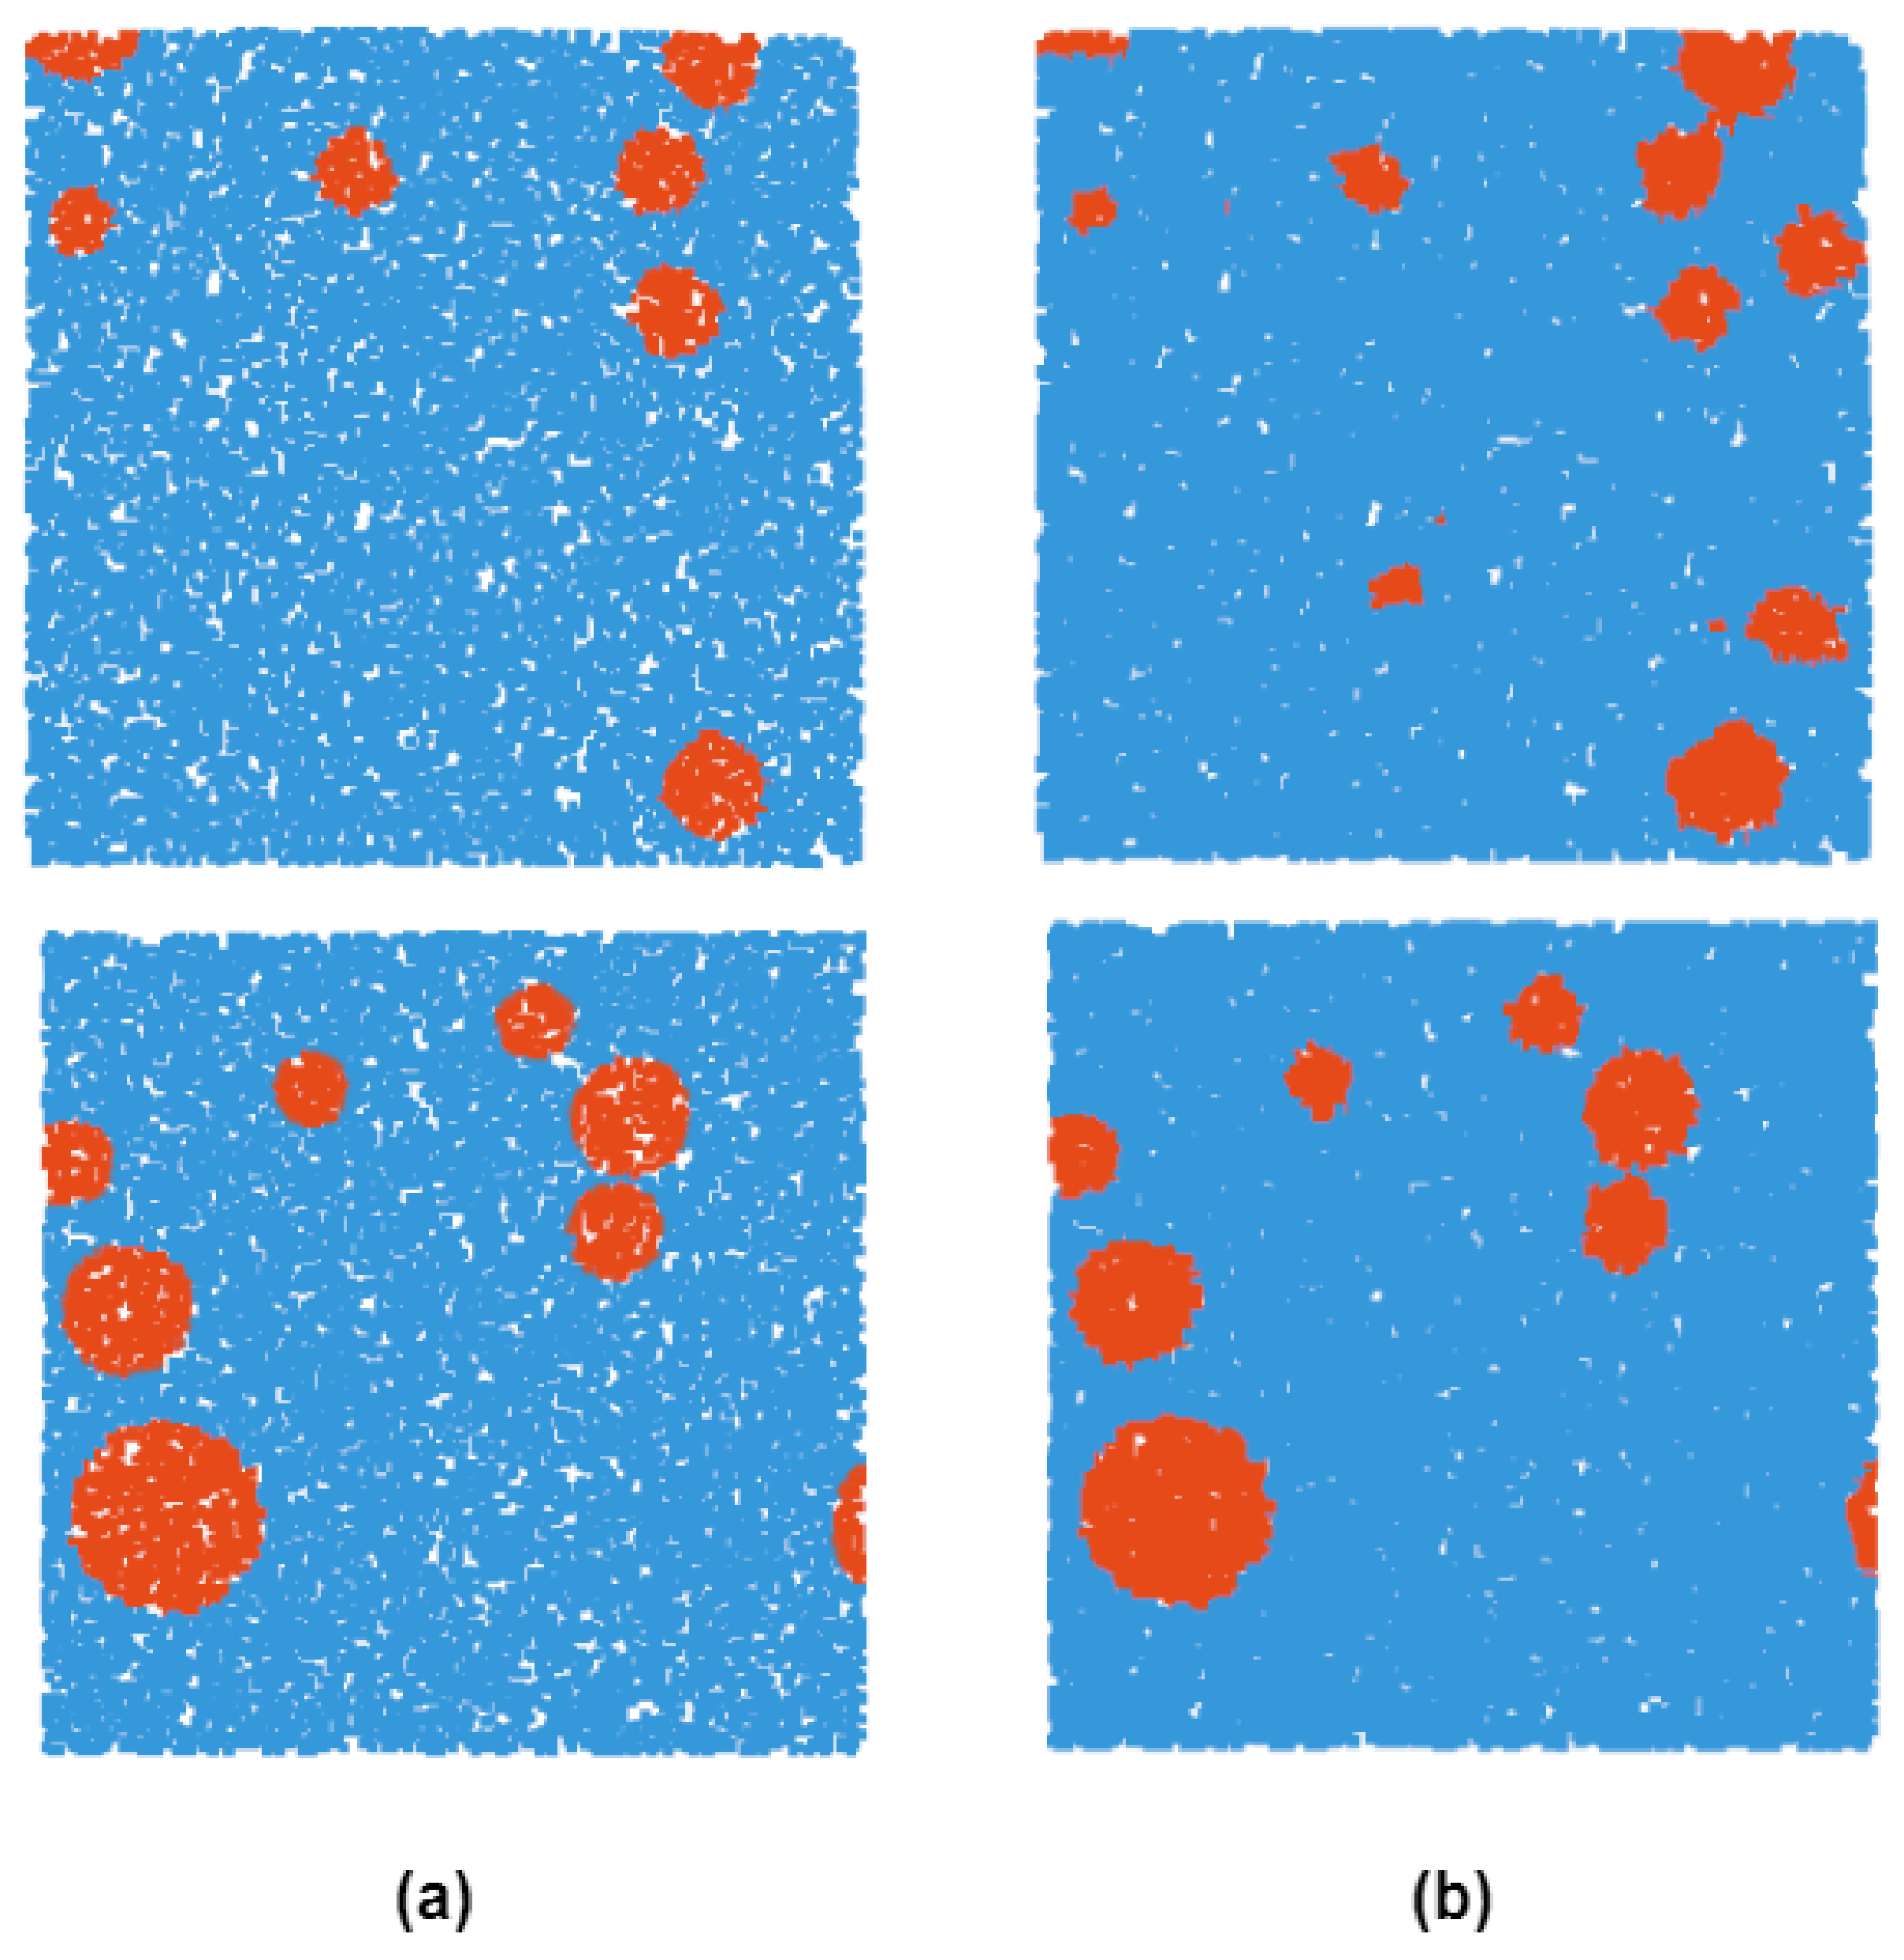
Figure 4.
Illustration of the pre-detection results. (a) shows the ground truth in the dataset. (b) represents the preliminary detection result after the point cloud semantic segmentation.
Figure 4.
Illustration of the pre-detection results. (a) shows the ground truth in the dataset. (b) represents the preliminary detection result after the point cloud semantic segmentation.
Figure 5.
The overall architecture of the proposed network. The colored arrows represent the different operations, and the boxes with the same color as the arrows represent the results of the corresponding operations. The network receives point cloud as input, and the final output is . Where, represents the number of categories. The cyan box represents the loss function we used, is the Focal loss and is the Dice loss.
Figure 6.
The details of the network architecture of GFE-Net. The input point features go through GCNet and shared MLP to extract high-level features with global information. Furthermore, a shared MLP branch is used to update the original low-level feature of local information. After that, the high-level features and the low-level features are combined with a merge operation to avoid the lack of low-level feature information.
Figure 7.
Heat map of point cloud dataset of the moon. In (a), there are impact craters and in the upper left corner and the lower right corner, respectively. From other perspectives, (b,c) show that the boundary of is not as obvious as .
Figure 7.
Heat map of point cloud dataset of the moon. In (a), there are impact craters and in the upper left corner and the lower right corner, respectively. From other perspectives, (b,c) show that the boundary of is not as obvious as .
Figure 8.
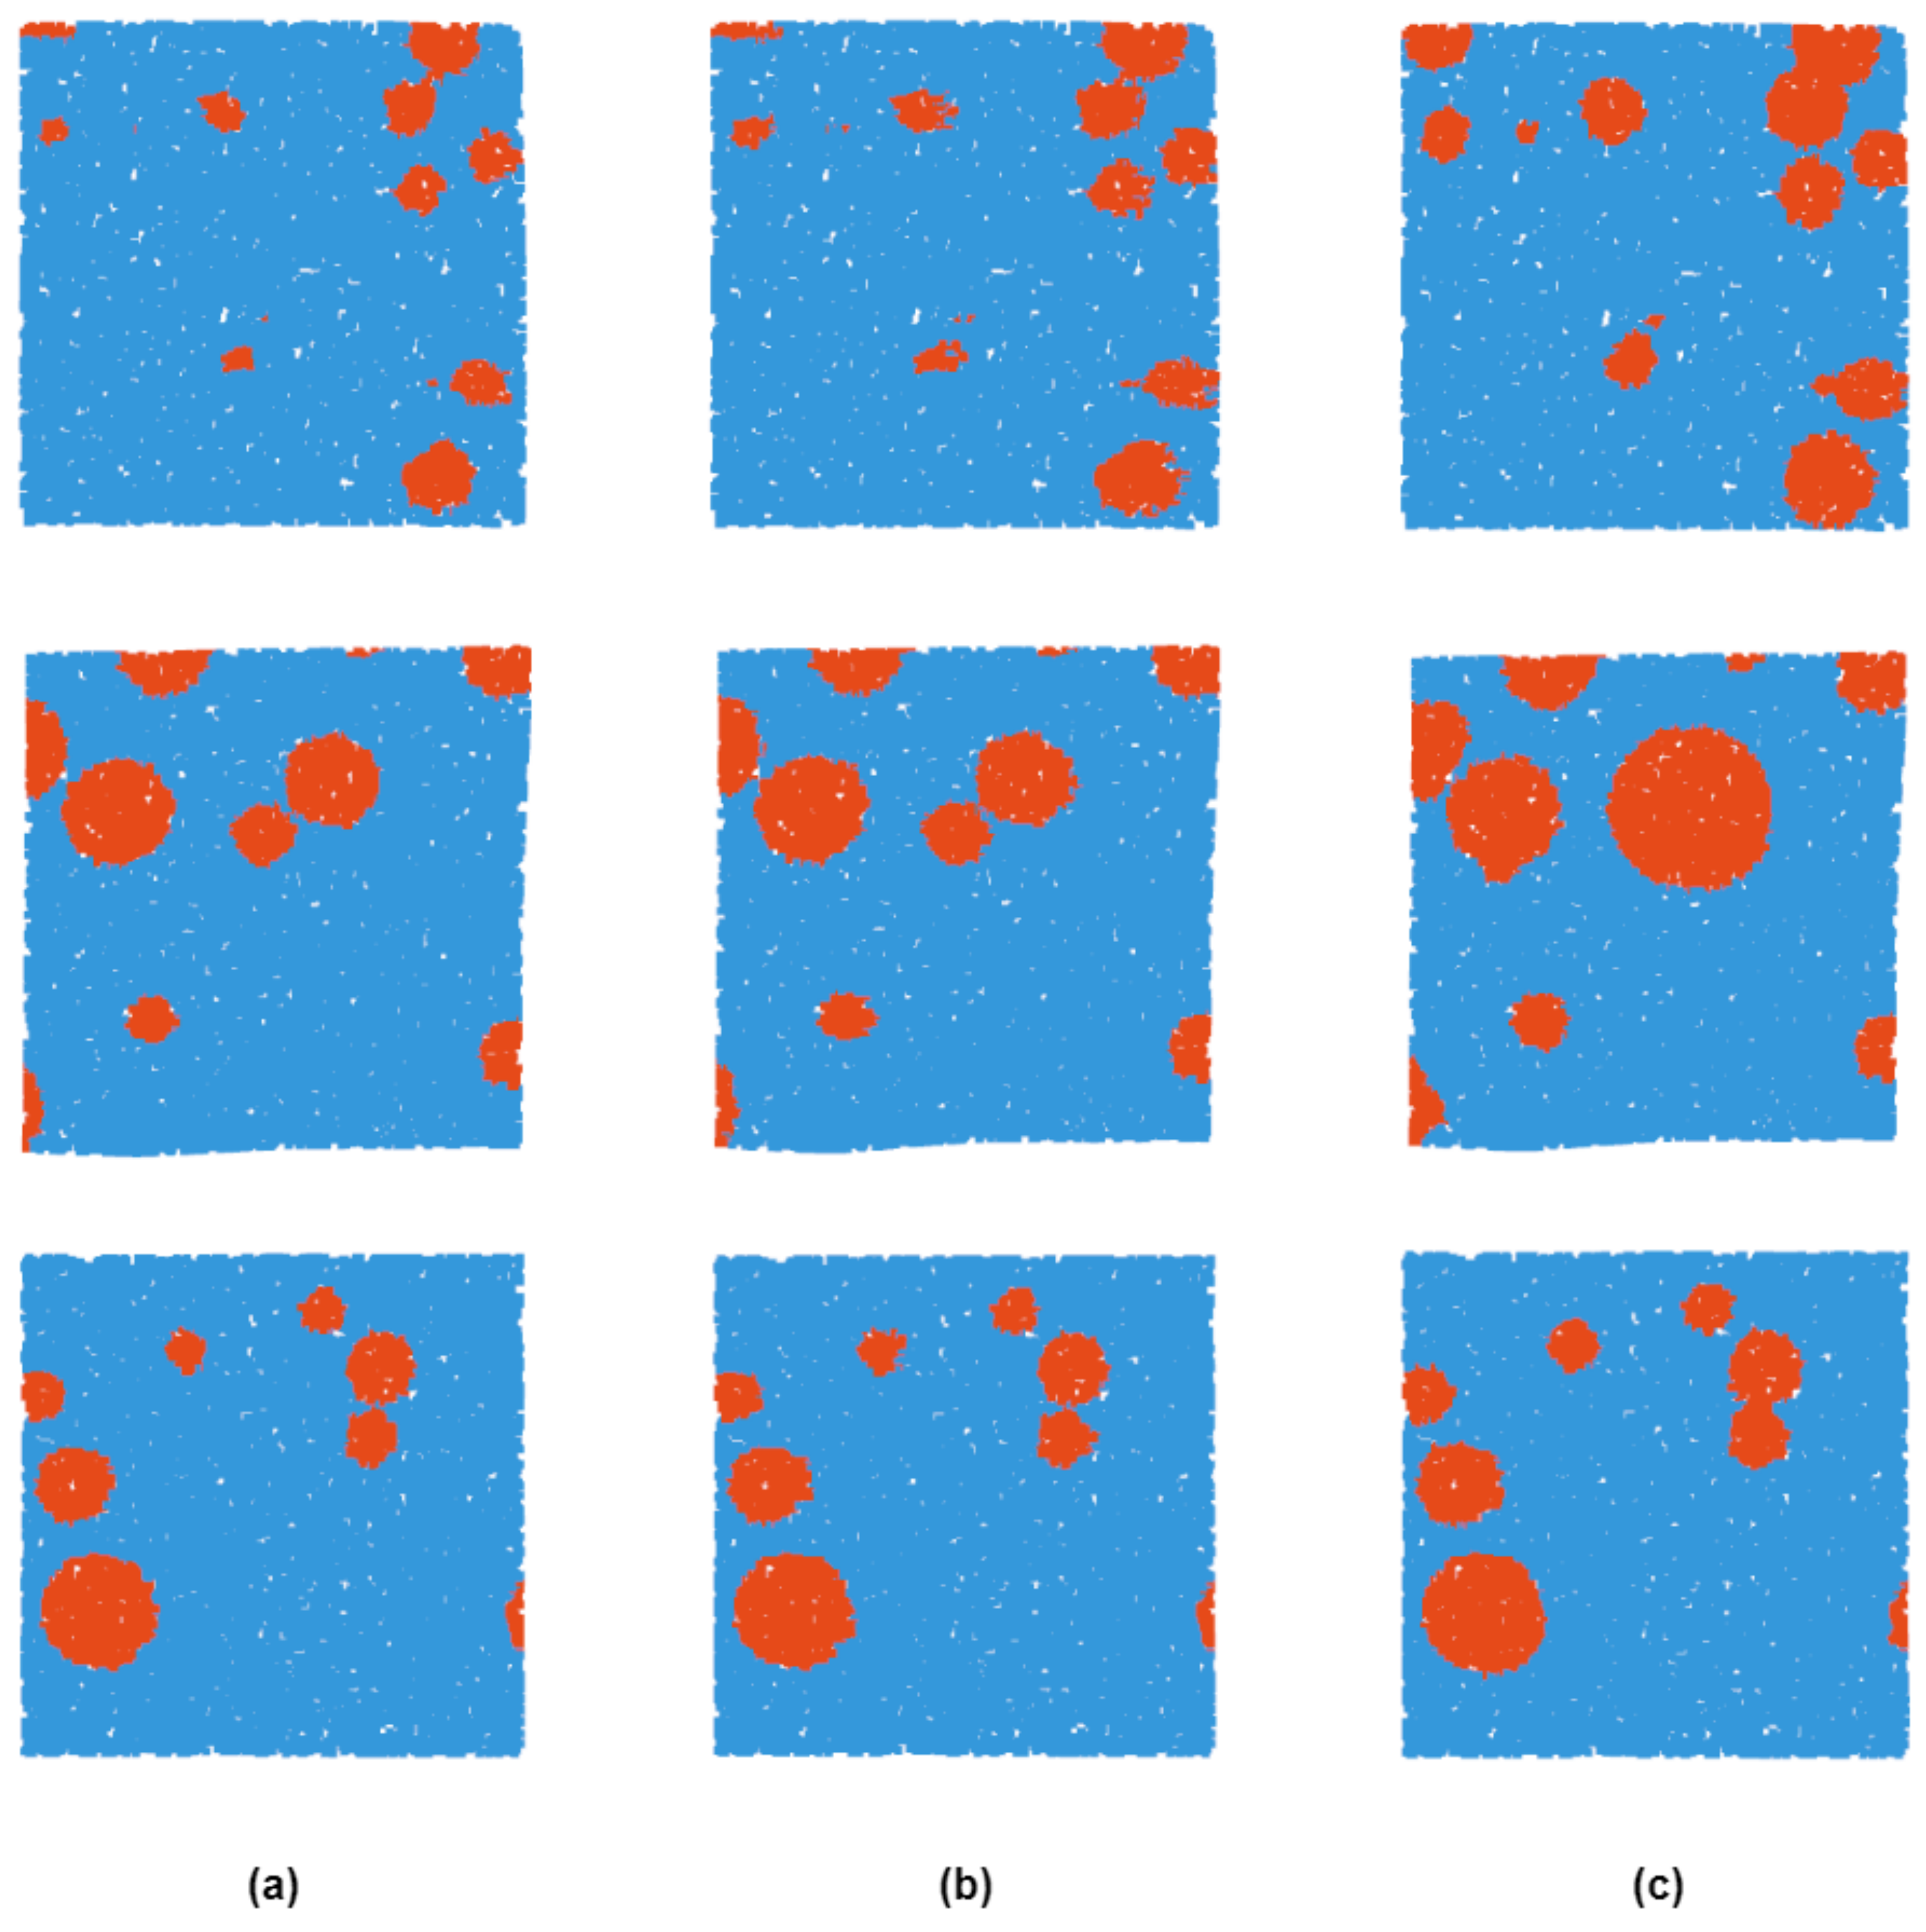
Illustration of the post-processing results. (a) shows the preliminary detection results of the pre-detection module. The result of (a) after Dilating Processing is shown in (b). (c) is the final detection result after Boundary Extraction. As indicated from the image on the first line, the Post-Processing method is capable of improving the situation that the detection results are concentrated in the center of the impact crater. As shown in the three lines, for the effective preliminary detection results, the Post-Processing module does not exert much impact.
Figure 8.
Illustration of the post-processing results. (a) shows the preliminary detection results of the pre-detection module. The result of (a) after Dilating Processing is shown in (b). (c) is the final detection result after Boundary Extraction. As indicated from the image on the first line, the Post-Processing method is capable of improving the situation that the detection results are concentrated in the center of the impact crater. As shown in the three lines, for the effective preliminary detection results, the Post-Processing module does not exert much impact.
Table 1.
Quantitative results of different point cloud semantic segmentation methods on our test dataset. The Point-level Precision (), the Point-level Recall (), the Point-level score () and the mean IoU () are reported.
Table 1.
Quantitative results of different point cloud semantic segmentation methods on our test dataset. The Point-level Precision (), the Point-level Recall (), the Point-level score () and the mean IoU () are reported.
| Model | | | | |
|---|
| Pointnet [34] | 0.6357 | 0.4013 | 0.4921 | 0.3263 |
| Pointnet++ [35] | 0.4781 | 0.5764 | 0.5583 | 0.3538 |
| Pointnet++ with Transformer | 0.6299 | 0.5091 | 0.5631 | 0.3919 |
| Ours (only Pre-Detection) | 0.5767 | 0.6096 | 0.5927 | 0.4211 |
Table 2.
Quantitative results of Post-Processing.The Point-level score () and the mean IoU () are reported.
Table 2.
Quantitative results of Post-Processing.The Point-level score () and the mean IoU () are reported.
| Model | | |
|---|
| Ours (Only Pre-Detection) | 0.5927 | 0.4211 |
| Ours (After Post-Processing) | 0.6047 | 0.4334 |
Table 3.
Accuracy metrics on our test dataset. Crater-level Precision (), Crater-level Recall (), Crater-level score () and new crater percentage () are reported.
Table 3.
Accuracy metrics on our test dataset. Crater-level Precision (), Crater-level Recall (), Crater-level score () and new crater percentage () are reported.
| Model | | | | |
|---|
| Silburt [1] | 0.6194 | 0.8732 | 0.7247 | 0.2327 |
| Ours | 0.6037 | 0.9274 | 0.7313 | 0.2816 |
| Publisher’s Note: MDPI stays neutral with regard to jurisdictional claims in published maps and institutional affiliations. |
© 2021 by the authors. Licensee MDPI, Basel, Switzerland. This article is an open access article distributed under the terms and conditions of the Creative Commons Attribution (CC BY) license (https://creativecommons.org/licenses/by/4.0/).


