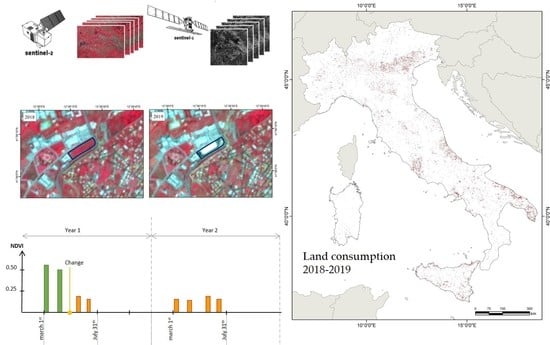
Land Consumption Monitoring with SAR Data and Multispectral Indices
Abstract
1. Introduction
1.1. Definitions of Land Consumption
1.2. Soil Protection Policy and Actions
1.3. Monitoring Land Consumption through Remote Sensing
2. Materials and Methods
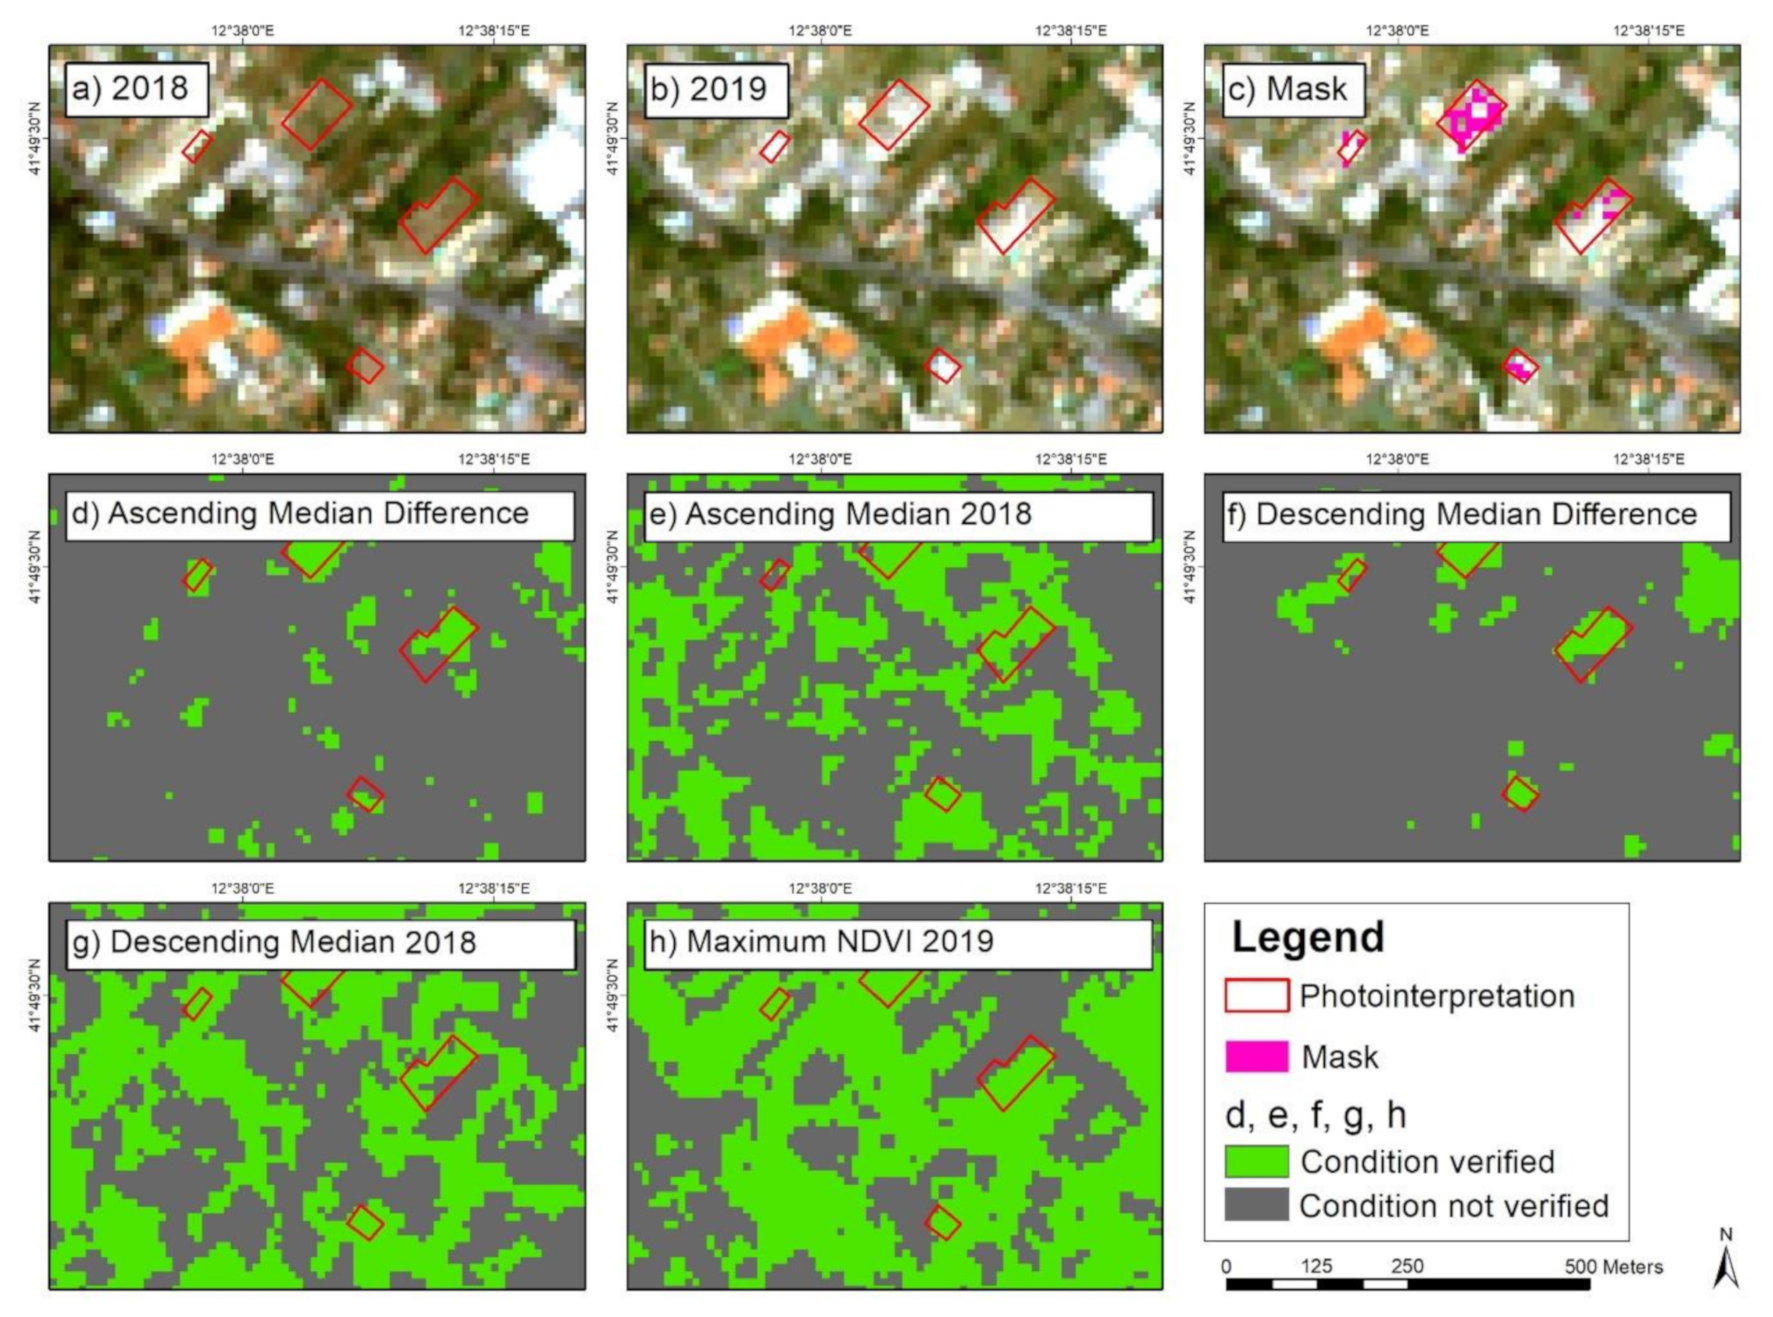
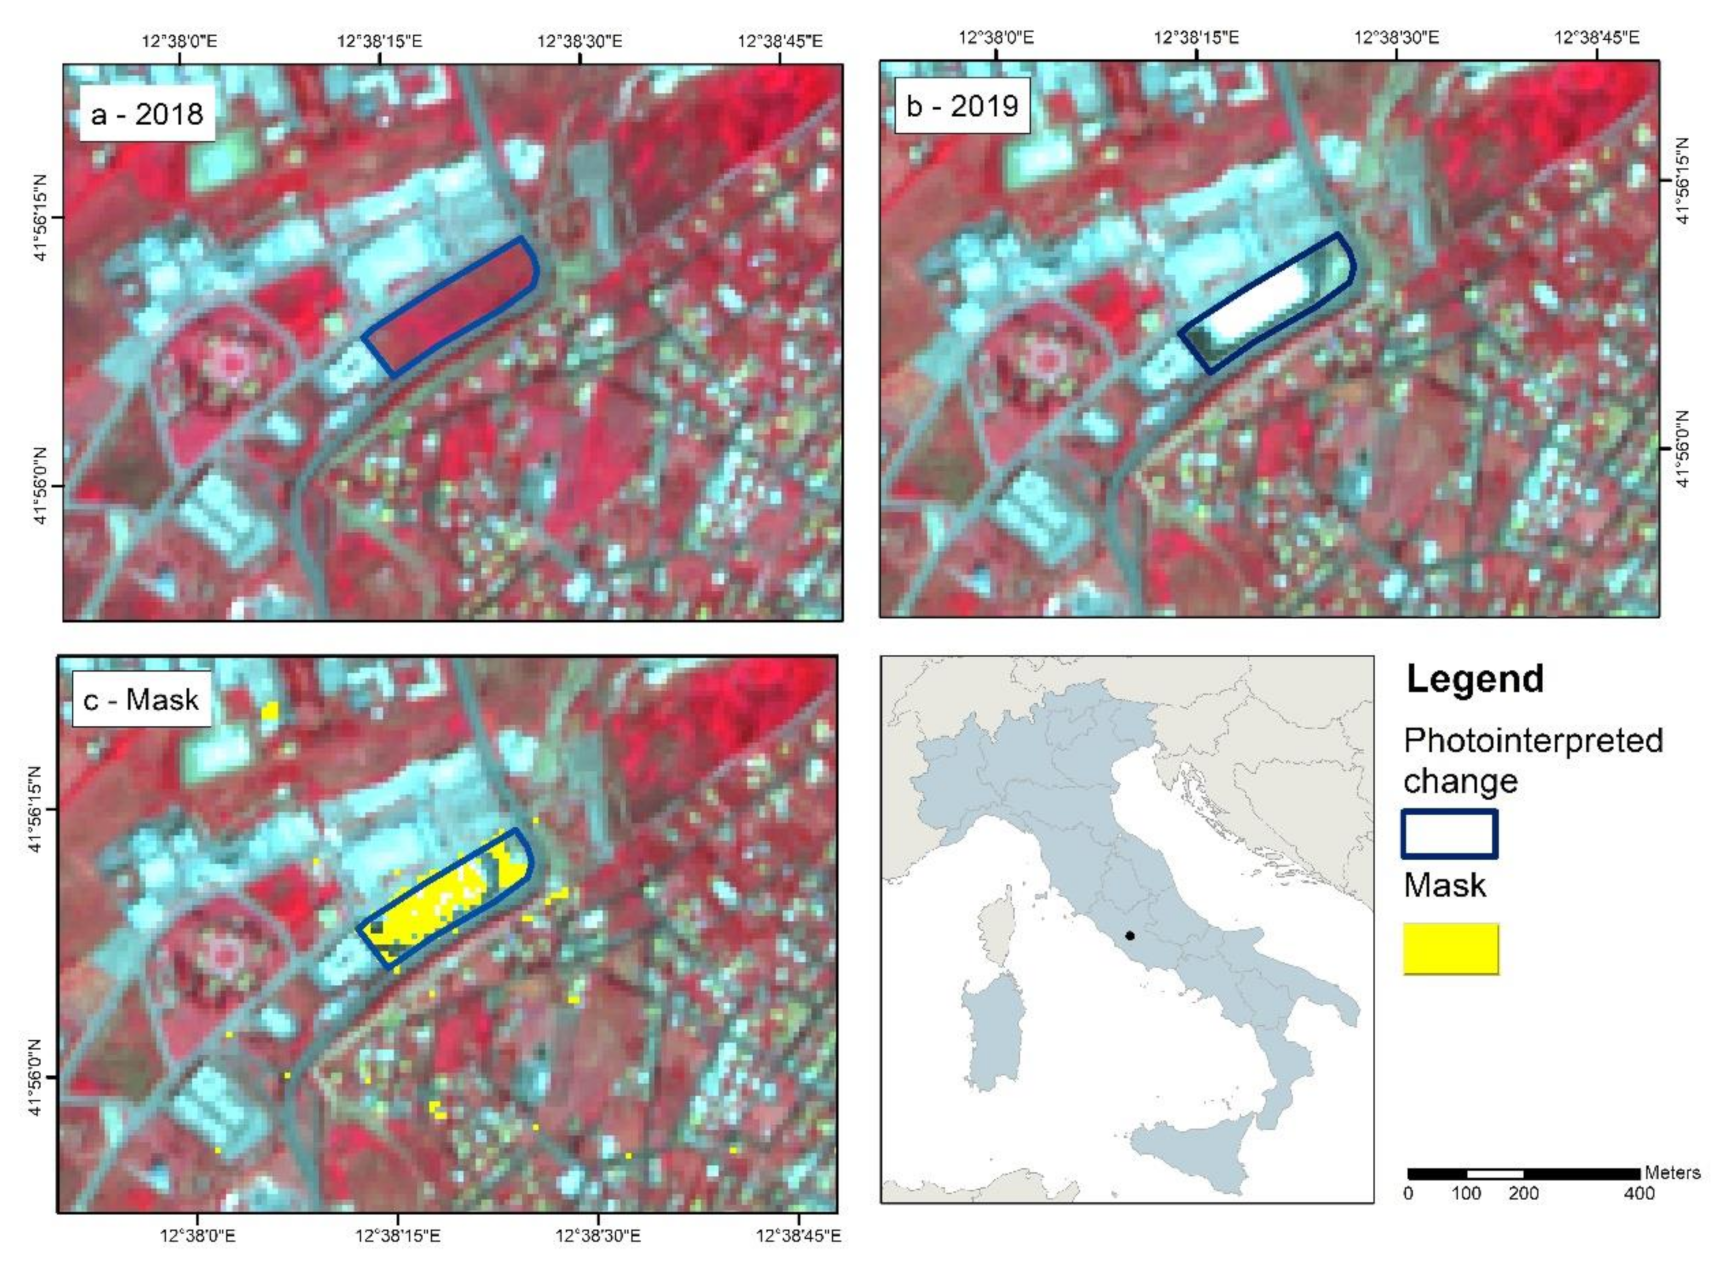
- Land consumption can follow the removal of vegetation cover, if present before the change, and, therefore, causes a decrease in vegetation indices, such as NDVI.
- Built-up areas, such as buildings, infrastructures, or even construction sites, are characterized by high backscattering values, due to multiple reflections or the double-bounce effect [47]. Therefore, land consumption can increase the backscatter if the land cover is characterized by low or intermediate roughness, such as low-vegetation and bare soils before changing.
- Land consumption can be detected if at least one of the above assumptions is verified.
2.1. Images Preprocessing
2.1.1. Sentinel-1
- Application of orbit file;
- Removal of GRD border noise (low intensity and invalid data);
- Thermal noise removal to reduce discontinuities between sub-swaths;
- Backscatter intensity calculation using radiometric calibration;
- Terrain correction (orthorectification using the SRTM 30-meter DEM);
- Conversion of backscatter coefficient to dB.
2.1.2. Sentinel-2
2.2. Detection of Changes Caused by Land Consumption
- Sentinel-2 images to calculate NDVI differences in the two years for changes involving the removal of vegetation cover; Sentinel-1 GRD was also used to improve the detection.
- Sentinel-1 GRD to calculate differences in backscatters caused by buildings, infrastructures or construction sites.
2.2.1. Land Consumption Related to the Removal of Vegetation
- -
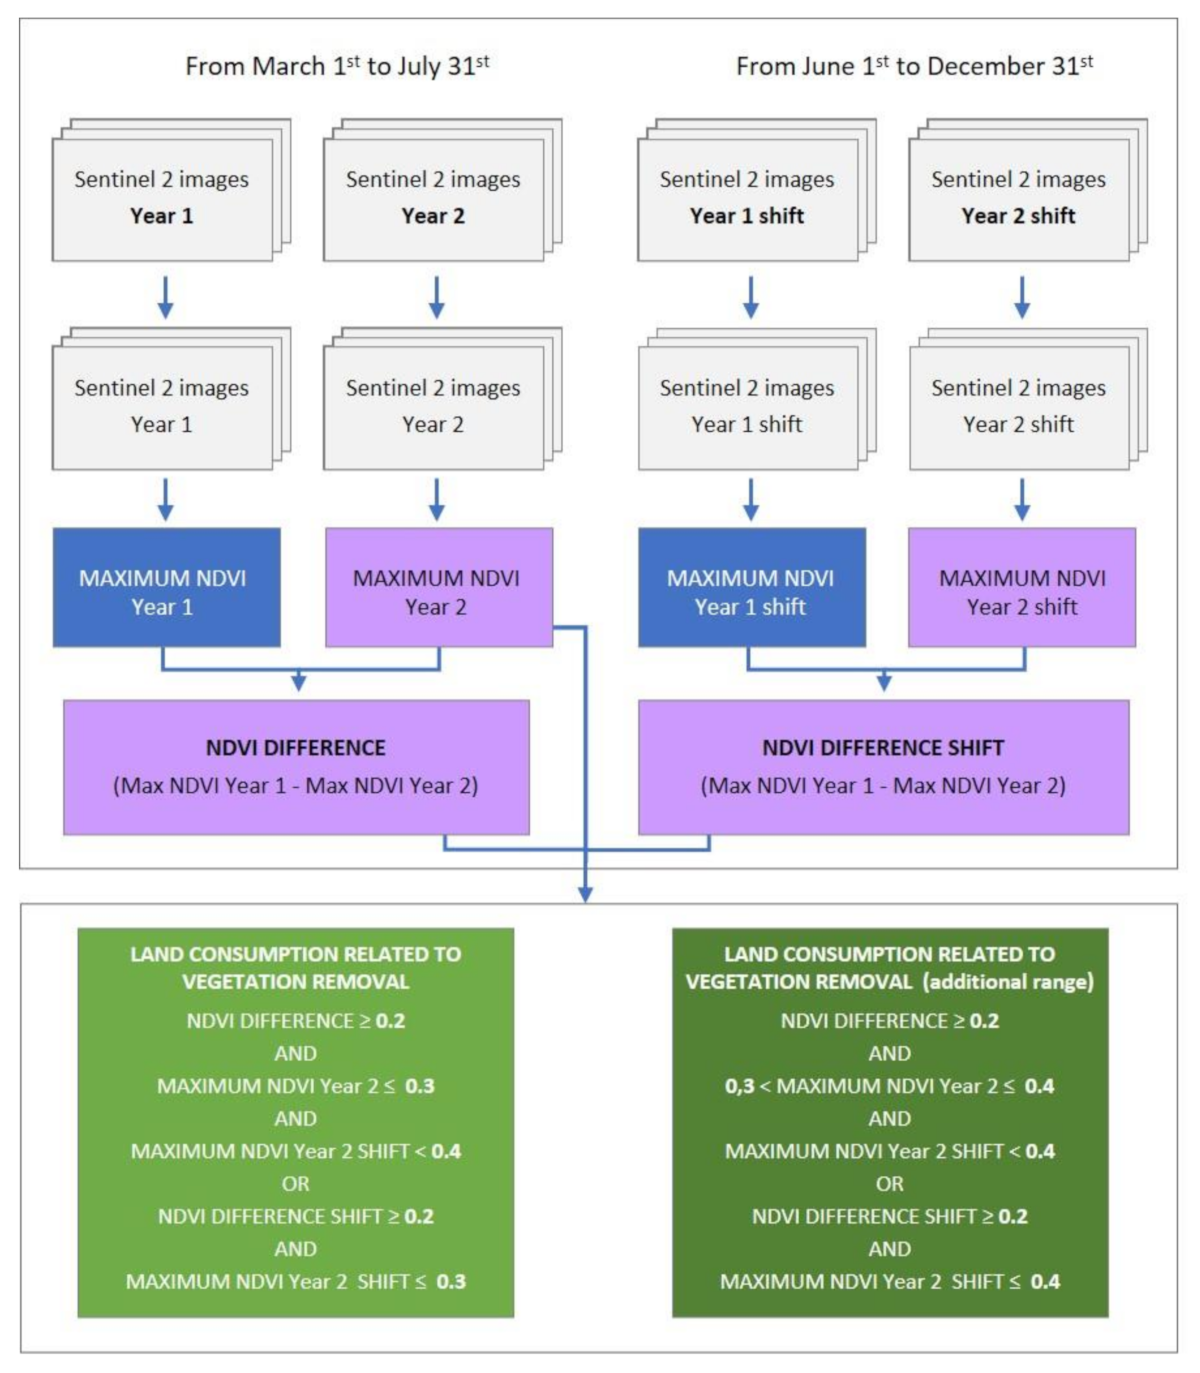
- In the first approach, potential changes related to the application of only the two basic conditions are identified for the period between 1st March and 31st July.
- -
- In the second approach, a third condition is added, in order to filter commission errors related to seasonal variation of vegetation cover in agricultural areas. The reference period is still between 1st March and 31st July.
- -
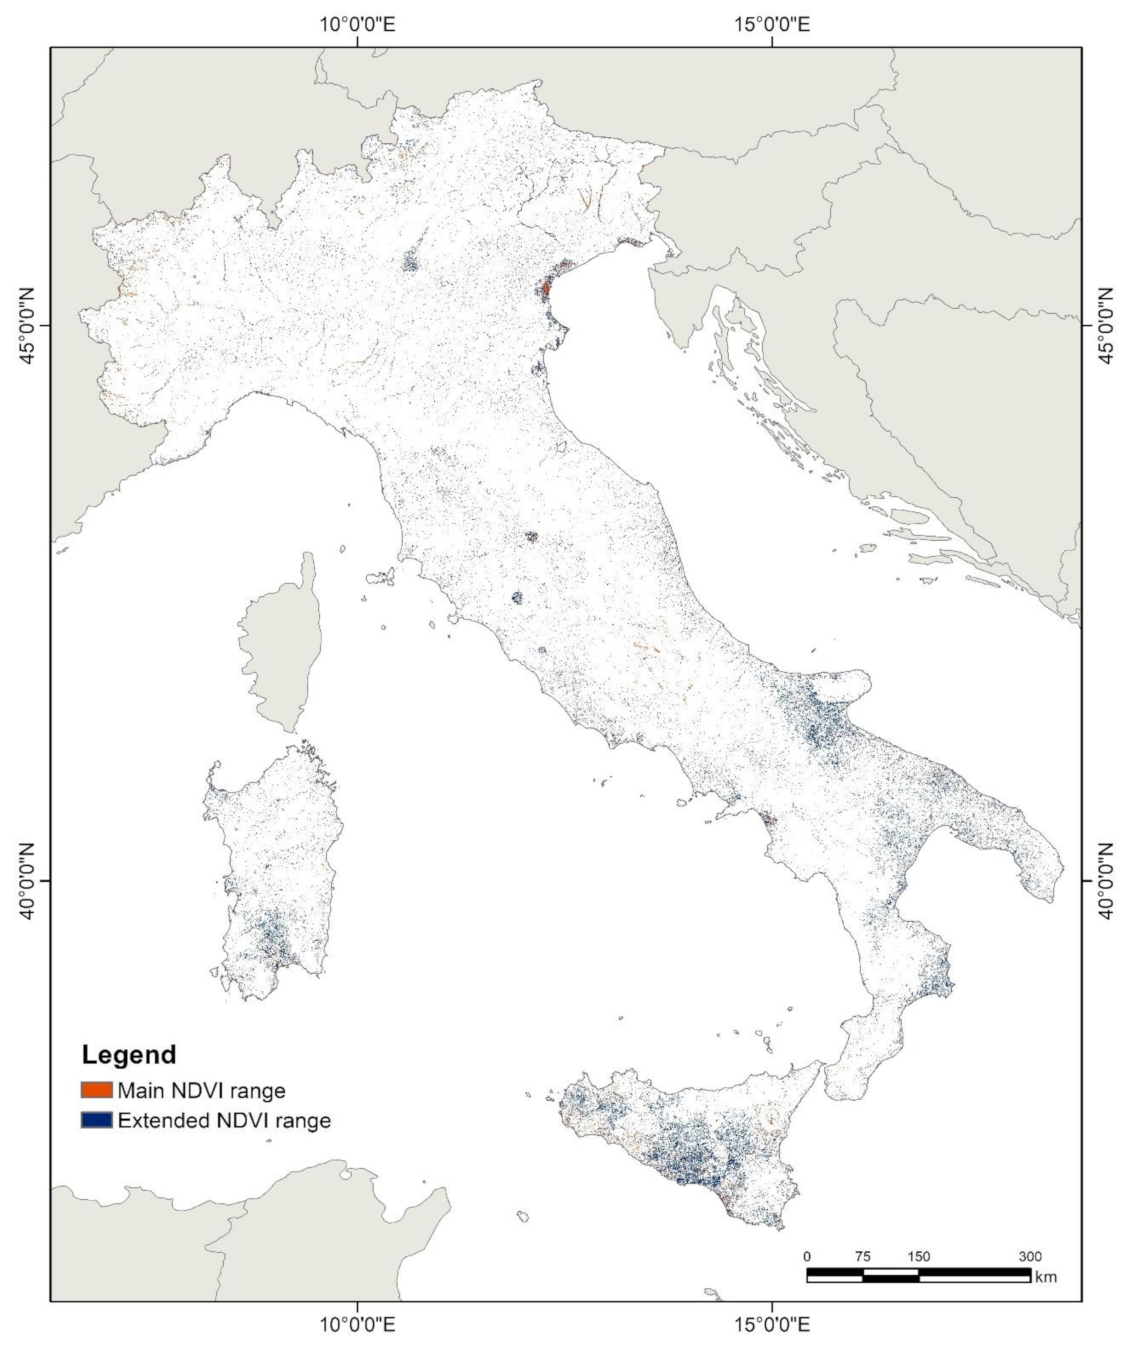
- The third approach applies the two basic conditions, varying the reference period to evaluate how the amplitude of the reference period influences the identification of changes. In particular, in addition to the period between 1st March and 31st July, the period from 1st June to 31st December is considered.
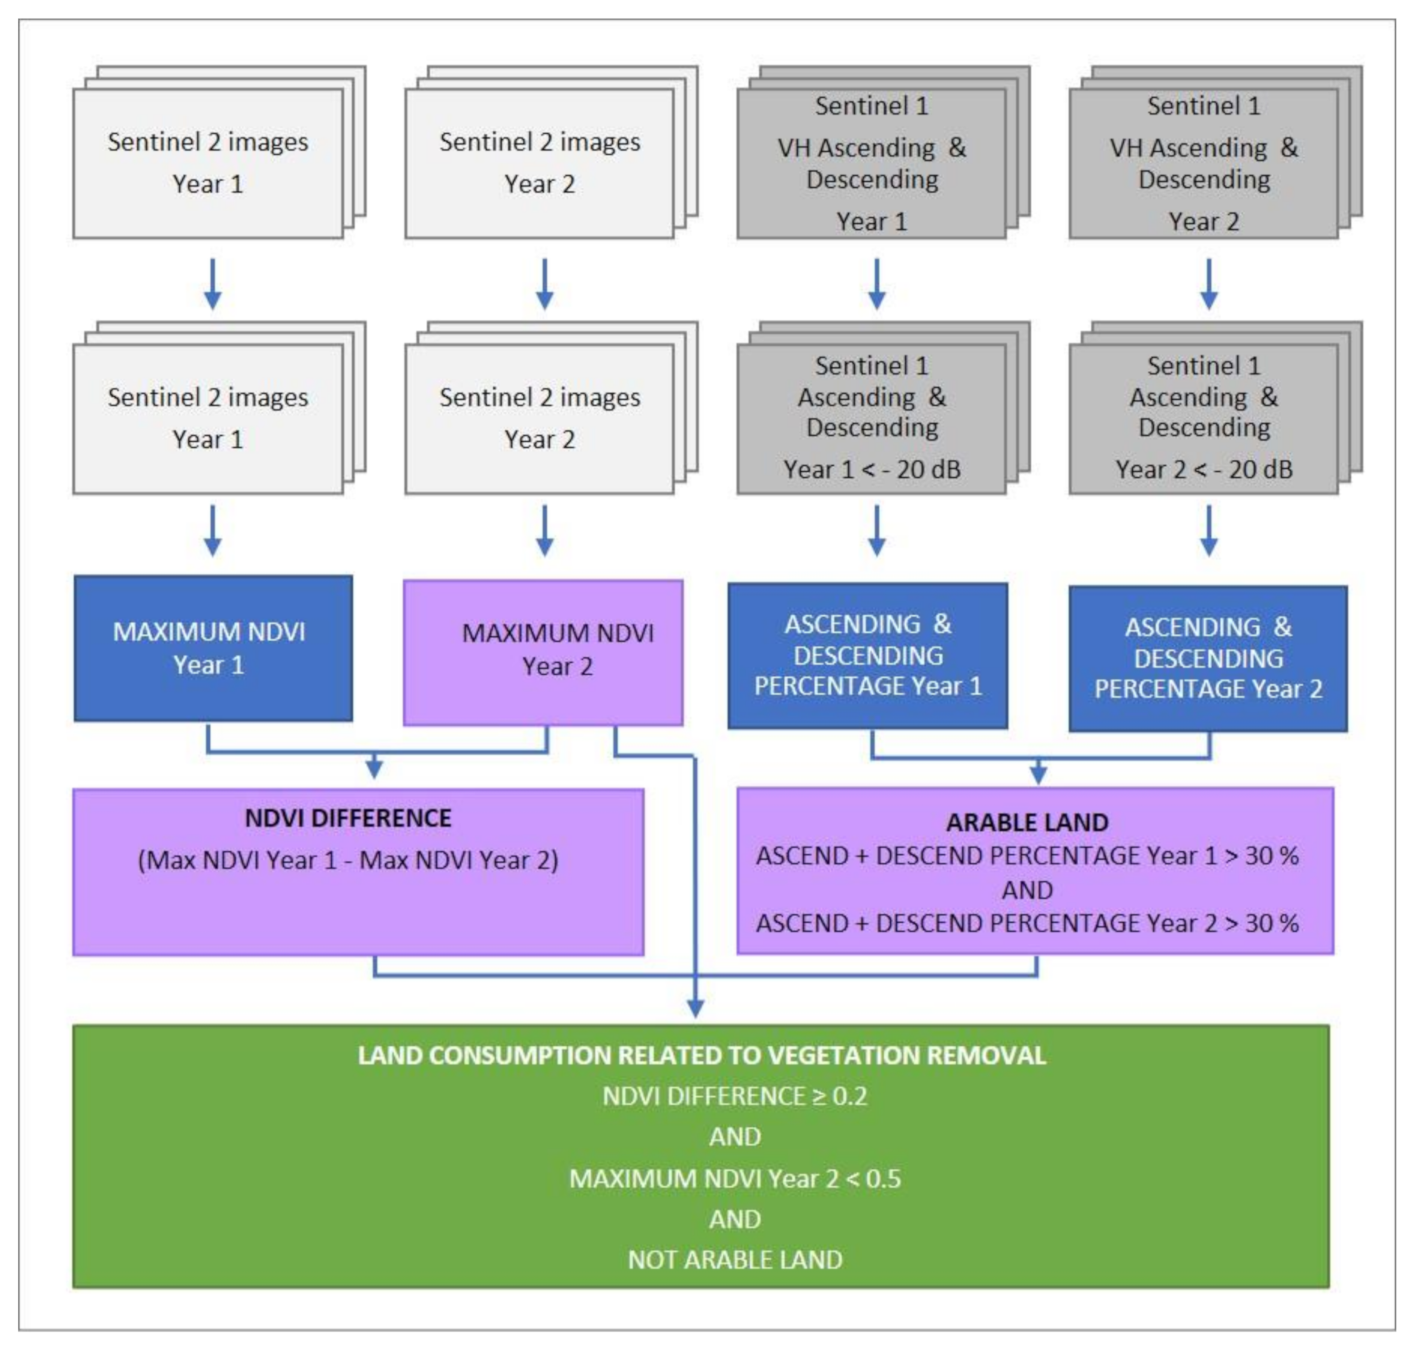
- First, the NDVI was calculated for every image;
- The maximum NDVI value per pixel was calculated for each year, obtaining two rasters (MAXIMUM NDVI rasters);
- These 2 maximum NDVI rasters were used to calculate a raster of NDVI difference between the 2 years (NDVI DIFFERENCE = MAXIMUM NDVI Year 1–MAXIMUM NDVI Year 2);
- Starting from the products of points 2 and 3, a binary mask was created where both conditions are met.
- Four collections of Sentinel-1 VH images were distinguished by ascending and descending orbit and by the 2 years of acquisition:
- Ascending year 1;
- Descending year 1;
- Ascending year 2;
- Descending year 2.
- 2.
- A raster was created for each of the four collections, indicating the number of times the backscatter was <−20 dB for each pixel.
- Ascending percentage year 1;
- Descending percentage year 1;
- Ascending percentage year 2;
- Descending percentage year 2.
2.2.2. Land Consumption Related to Buildings and Infrastructures
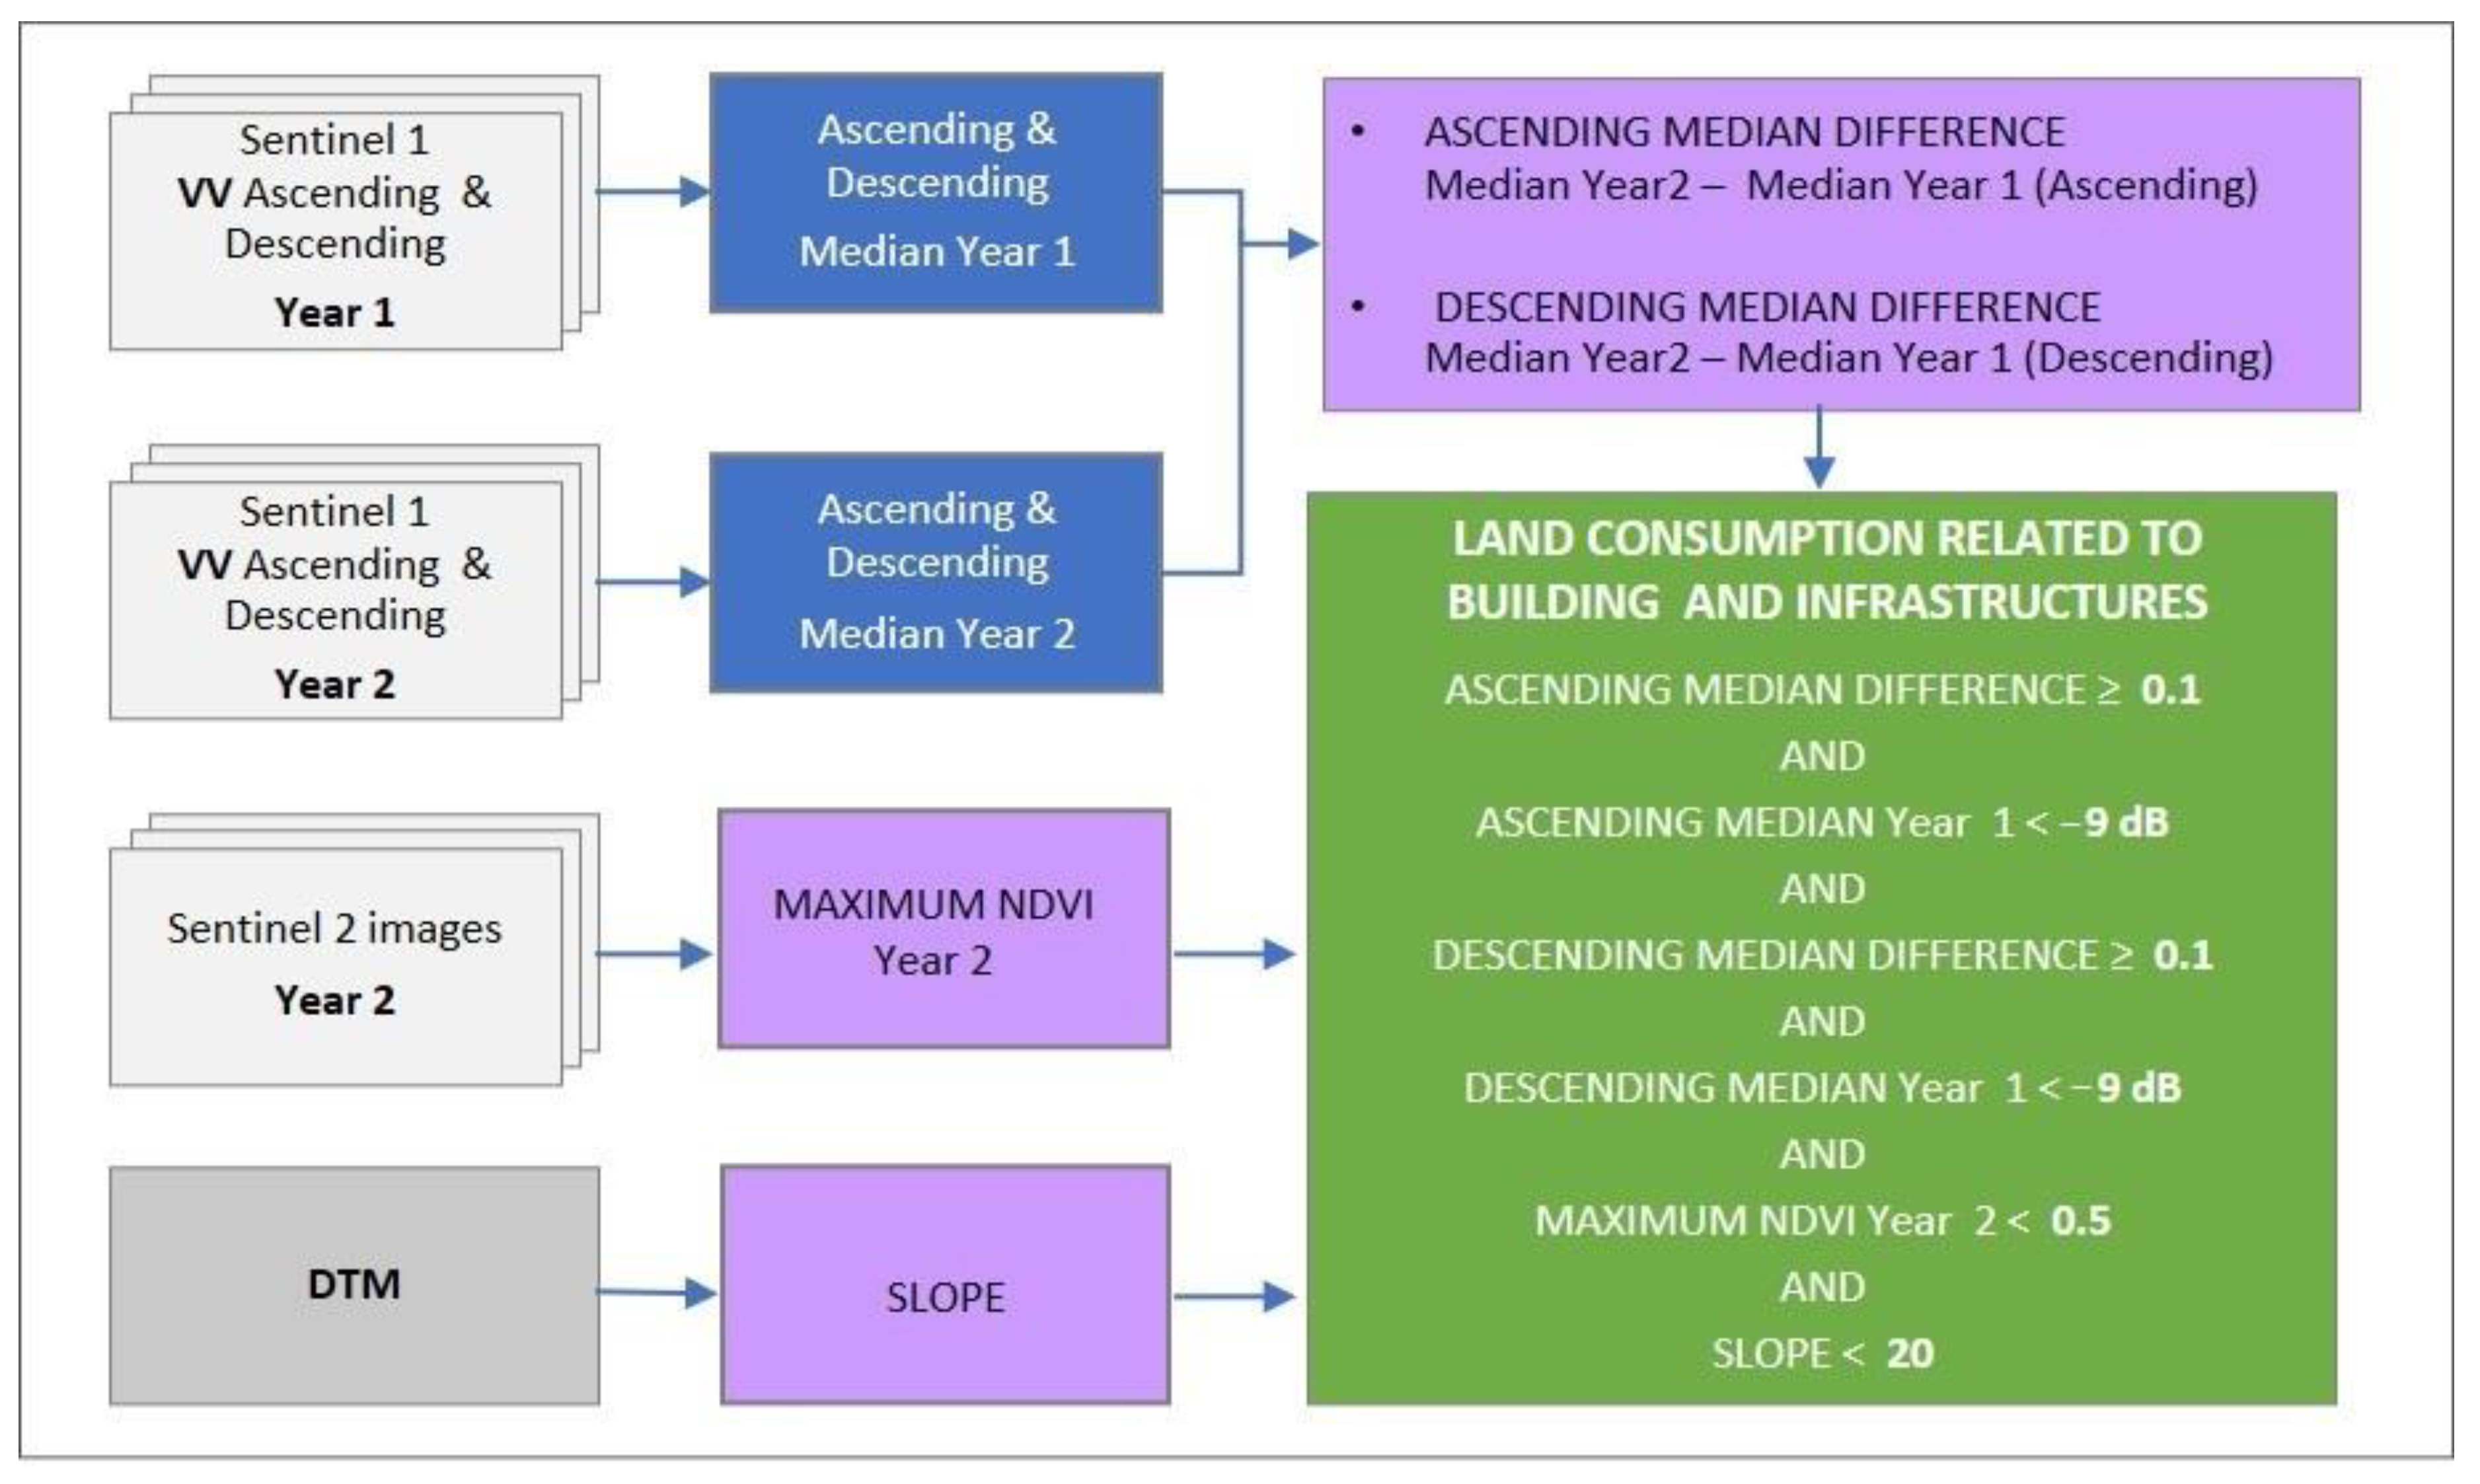
- Four collections of Sentinel-1 VV images were distinguished by ascending and descending orbit and the 2 years of acquisition.
- For each collection, the median was calculated and converted the dB to natural values, obtaining 4 rasters:
- ASCENDING MEAN year 1;
- DESCENDING MEAN year 1;
- ASCENDING MEAN year 2;
- DESCENDING MEAN year 2.
- 3.
- Slope in degrees was calculated from the SRTM DEM (Shuttle Radar Topography Mission) Version 4 [56], in order to exclude areas whose backscatter values are influenced by high slope.
3. Results
Comparison with the Real Changes Photointerpreted by ISPRA-SNPA
4. Discussion
5. Conclusions
Author Contributions
Funding
Institutional Review Board Statement
Informed Consent Statement
Data Availability Statement
Conflicts of Interest
Appendix A
| Land Consumption (Land Take) | The replacement of a non-artificial land cover to an artificial land cover, both permanent and reversible [13], as explained below. Artificial surfaces that have been changed by, or are under the influence of, human activities resulting in a land consumption process can be sealed or non-sealed [13,64]. We refer to the portion of territory undergoing this process as land consumed. |
| Permanent Land Consumption (Soil Sealing) | The part of the space that is covered with artificial constructions, such as a building, or surfaces, such as a pavement. It includes buildings, paved roads, railways, airports (paved areas), ports (paved areas), other paved or sealed surfaces, waste dumps and paved greenhouses. It can be considered as Sealed Artificial Surfaces and Constructions. As defined in the Land Cover Component of the Eagle Matrix class 1.1.1 [64]. |
| Reversible Land Consumption | Any process where natural surface material has been replaced by artificial material or where natural material has been removed from, forming a non-impervious and non-built-up surface as stated in the Eagle class 1.1.2 Non-sealed Artificial Surface [64]. It includes soil compaction; excavation; temporary impervious coverage, e.g., unpaved roads, construction sites, courtyards or sports fields; permanent deposits of material; photovoltaic fields; and quarries not yet restored. |
| Land Cover | The physical and biological cover of the Earth’s surface, including artificial surfaces, agricultural areas, forests, (semi)natural areas, wetlands and water bodies. It is an abstraction of reality as the Earth´s surface is populated with landscape elements. [65] |
| Land Use | The territory characterized according to its current and future planned functional dimension or socioeconomic purpose (e.g., residential, industrial, commercial, agricultural, forestry and recreational). Land Use is different from Land Cover, dedicated to the description of the surface of the Earth by its (bio)physical characteristics [65]. |
| Strategic Documents and Policy Guidelines | Year | Soil Aspects | Objectives and Targets | Target Year |
|---|---|---|---|---|
| Thematic strategy on the protection of soil [1] | 2006 | Prevent further degradation of soil, preserve its functions and restore degraded soil + integrate soil protection into relevant EU policies. | Soil Directive | N/A |
| Roadmap to a resource efficient Europe (EU) [15] | 2011 | Reduce soil erosion, increase soil organic matter and promote remedial work on contaminated sites. | Achieve no net land take by 2050. | 2020 /2050 |
| Soil Sealing Guidelines [16] | 2012 | Guidelines explicitly focus on limiting, mitigating and compensating for the effects of soil sealing. | N/A | |
| The Seventh Environment Action Programme (7th EAP) [17] | 2013 | EU policies help to achieve no net land take by 2050. | Achieve no net land take by 2050. | 2050 |
| The 2030 Agenda for Sustainable Development and its 17 Sustainable Development Goals (SDGs), United Nations [18] | 2015 | The agenda points to 17 Sustainable Development Goals (SDGs), and 169 associated targets on the theme of protection, conservation and sustainable management of natural resources. Goal 15.3 "land degradation neutrality" Goal 11 “Make cities and human settlements inclusive, safe, resilient and sustainable “. | Target 15.3.1: by 2030, achieve a land degradation-neutral world; target 11.3.1: by 2030, the increase in the population should be aligned to the expansion of built-up area; target 11.7: by 2030 to “provide universal access to safe, inclusive and accessible, green and public spaces...". | 2030 |
| The European Green Deal [3] | 2019 | The European Green Deal is a response to tackle climate change growth and environmental degradation and aims at a revision of relevant legislative measures to deliver on the increased climate ambition, following the review of land use and land use change and forestry regulation. | ||
| EU biodiversity strategy [4] | 2020 | The strategy contains specific actions to protect nature and reverse the degradation of ecosystems and aims to prevent the loss of biodiversity and ecosystem services in the EU by 2030; it includes positive implications for a wide number of soil threats and functions. | Legally protect a minimum of 30% of the EU’s land and (sea) area; restore degraded ecosystems by adopting sustainable soil management practices limiting urban sprawl and greening urban and peri-urban areas. | 2030 |
| Healthy soils – new EU soil strategy [2] | 2020 | Update of the current soil strategy to address soil degradation (currently under public consultation), protect soil fertility, reduce erosion and sealing, increase organic matter, identify contaminated sites, restore degraded soils. | Achieve land degradation neutrality by 2030; reduce the rate of land take, urban sprawl and sealing to achieve no net land take by 2050. | 2030 and 2050 |
| Caring for soil is caring for life [19] | 2020 | Proposal to the European Commission to reduce land degradation, conserve and increase soil organic carbon stocks, no net soil sealing, re-use of urban soil for urban development, reduce soil pollution and enhance restoration, prevent erosion, improve soil structure, reduce the EU global footprint on soils, increase soil literacy in society across Member States. | Target 1.1: 50% of degraded land is restored; Target 3.1: switch from 2.4% to no net soil sealing; Target 3.2: the current rate of soil re-use is increased from current 13 to 50% to help meet the EU target of no net land take by 2050; Target 5.1: stop erosion on 30-50% of land with unsustainable erosion rates. | 2030 |
| Farm to Fork Strategy [5] | 2020 | Accelerate our transition to a sustainable food system that should have a neutral or positive environmental impact, help to mitigate climate change, reverse the loss of biodiversity; all actions will contribute to improve soil protection. | Ensuring that the food chain, covering food production, transport, distribution, marketingand consumption have a neutral or positive environmental impact. | |
| Land Degradation Neutrality -Unccd [20] | 2015 | Halt the ongoing loss of healthy land through degradation. | Reaching the state whereby the amount and quality of land resources necessary to support ecosystem functions and services remains stable or increases within specified temporal and spatial scales and ecosystems. | 2030 |
References
- European Commission. Thematic Strategy for Soil Protection, COM(2006)231; European Commission: Bruxelles, Belgium, 2006. [Google Scholar]
- European Commission. Roadmap, New Soil Strategy—Healthy Soil for a Healthy Life; European Commission: Bruxelles, Belgium, 2020. [Google Scholar]
- European Commission. The European Green Deal, COM(2019) 640 Final; European Commission: Bruxelles, Belgium, 2019. [Google Scholar]
- European Commission. EU Biodiversity Strategy for 2030—Bringing Nature Back into our Lives, COM(2020) 380 Final; European Commission: Bruxelles, Belgium, 2020. [Google Scholar]
- European Commission. A Farm to Fork Strategy for a Fair, Healthy and Environmentally-Friendly Food System, COM(2020) 381 Final; European Commission: Bruxelles, Belgium, 2020. [Google Scholar]
- Scholes, R.J.; Montanarella, L.; Brainich, E.; Barger, N.; Ten Brink, B.; Cantele, M.; Erasmus, B.; Fisher, J.; Gardner, T.; Holland, T.G. IPBES (2018): Summary for Policymakers of the Assessment Report on Land Degradation and Restoration of the Intergovernmental Science-Policy Platform on Biodiversity and Ecosystem Services; The Intergovernmental Platform on Biodiversity and Ecosystem: Bonn, Germany, 2018. [Google Scholar]
- Gardi, C.; Panagos, P.; Van Liedekerke, M.; Bosco, C.; De Brogniez, D. Land take and food security: Assessment of land take on the agricultural production in Europe. J. Environ. Plan. Manag. 2015, 58, 898–912. [Google Scholar] [CrossRef]
- Imhoff, M.; Lahouari, B.; Taylor, R.; Colby, L.; Robert, H.; William, L. Global patterns in human consumption of net primary production. Nature 2004, 429, 867–870. [Google Scholar] [CrossRef] [PubMed]
- Bennett, A.F.; Saunders, D.A. Habitat fragmentation and landscape change. Conserv. Biol. All 2010, 93, 1544–1550. [Google Scholar]
- Ruby, E. How Urbanization Affects the Water Cycle. California Water and Land Use Partnership. Available online: http://www.coastal.ca.gov/nps/watercyclefacts.pdf (accessed on 7 December 2020).
- EEA. The European Environment—State and Outlook 2020 Knowledge for Transition to a Sustainable Europe; European Environment Agency: Copenhagen, Denmark, 2019. [Google Scholar]
- Arnold, S.; Kosztra, B.; Banko, G.; Milenov, P.; Smith, G.; Hazeu, G. Explanatory Documentation of the EAGLE Concept. European Environment Agency: Copenhagen, Denmark. 2020. Available online: https://land.copernicus.eu/eagle/files/explanatory-documentation/eagle-concept-explanatory-documentation-version-3-1-4-12-2020/view (accessed on 4 March 2021).
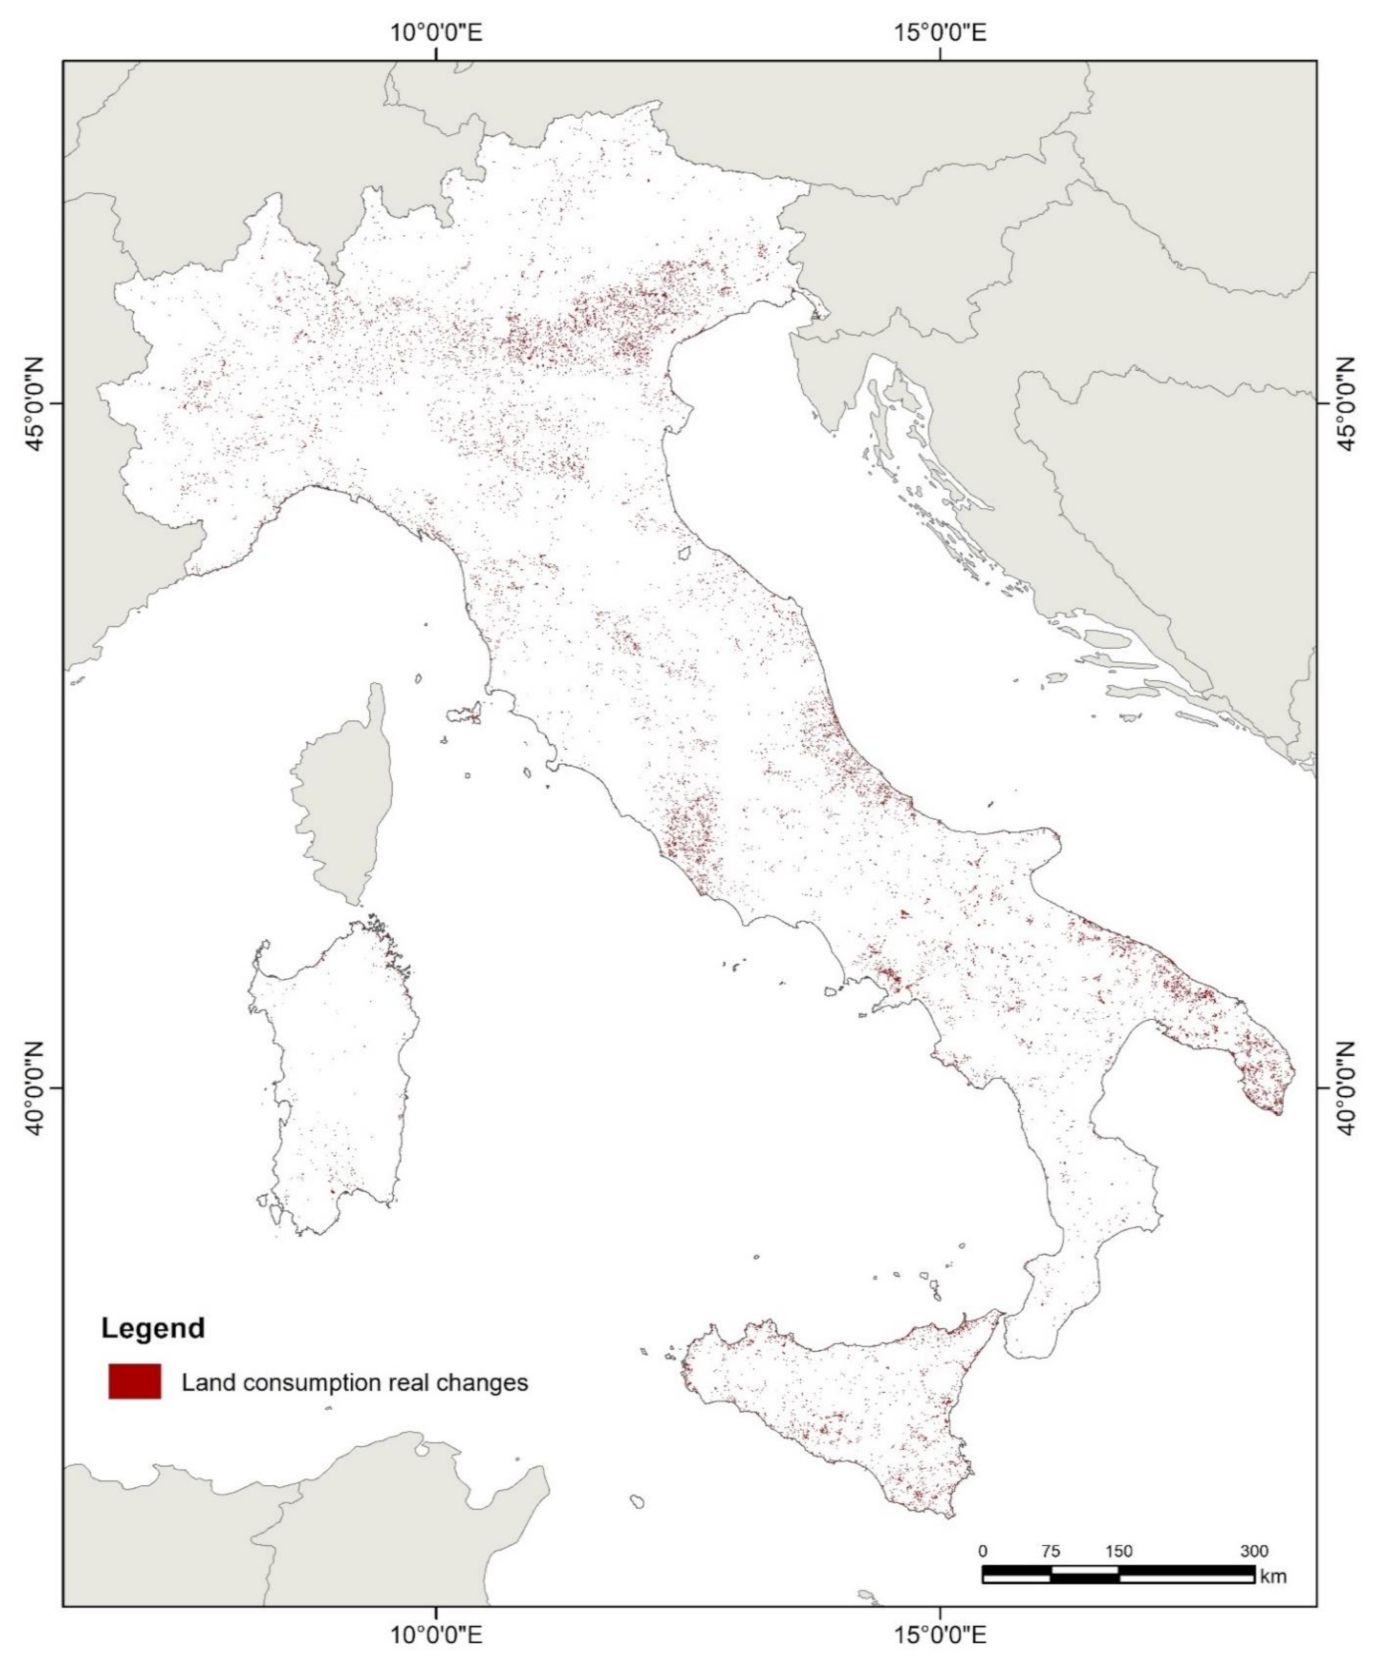
- Strollo, A.; Smiraglia, D.; Bruno, R.; Assennato, F.; Congedo, L.; De Fioravante, P.; Giuliani, C.; Marinosci, I.; Riitano, N.; Munafò, M. Land consumption in Italy. J. Maps 2020, 16, 113–123. [Google Scholar] [CrossRef]
- European Parliament, Council of the European Union. European Union Decision No 1386/2013/EU of the European Parliament and of the Council of 20 November 2013 on a General Union Environment Action Programme to 2020 “Living well, within the limits of our planet. Off. J. Eur. Union 2013, 353, 171–200. [Google Scholar]
- European Parliament, Council of the European Union. European Commision Parliament Commission Delegated Regulation (EU) No 1159/2013 of 12 July 2013. Off. J. Eur. Union 2013, 309, 1–6. [Google Scholar]
- Lefebvre, A.; Sannier, C.; Corpetti, T. Monitoring urban areas with Sentinel-2A data: Application to the update of the Copernicus high resolution layer imperviousness degree. Remote Sens. 2016, 8, 606. [Google Scholar] [CrossRef]
- Forkuor, G.; Dimobe, K.; Serme, I.; Tondoh, J.E. Landsat-8 vs. Sentinel-2: Examining the added value of sentinel-2’s red-edge bands to land-use and land-cover mapping in Burkina Faso. GIScience Remote Sens. 2018, 55, 331–354. [Google Scholar] [CrossRef]
- Singh, A. Review article digital change detection techniques using remotely-sensed data. Int. J. Remote Sens. 1989, 10, 989–1003. [Google Scholar] [CrossRef]
- Coppin, P.; Jonckheere, I.; Nackaerts, K.; Muys, B.; Lambin, E. Review ArticleDigital change detection methods in ecosystem monitoring: A review. Int. J. Remote Sens. 2004, 25, 1565–1596. [Google Scholar] [CrossRef]
- Reba, M.; Seto, K.C. A systematic review and assessment of algorithms to detect, characterize, and monitor urban land change. Remote Sens. Environ. 2020, 242, 111739. [Google Scholar] [CrossRef]
- Zhu, Z. Change detection using landsat time series: A review of frequencies, preprocessing, algorithms, and applications. ISPRS J. Photogramm. Remote Sens. 2017, 130, 370–384. [Google Scholar] [CrossRef]
- Ban, Y.; Yousif, O. Change detection techniques: A review. In Multitemporal Remote Sensing; Springer: Berlin/Heidelberg, Germany, 2016; pp. 19–43. [Google Scholar]
- Radke, R.J.; Andra, S.; Al-Kofahi, O.; Roysam, B. Image change detection algorithms: A systematic survey. IEEE Trans. Image Process. 2005, 14, 294–307. [Google Scholar] [CrossRef]
- Hussain, M.; Chen, D.; Cheng, A.; Wei, H.; Stanley, D. Change detection from remotely sensed images: From pixel-based to object-based approaches. ISPRS J. Photogramm. Remote Sens. 2013, 80, 91–106. [Google Scholar] [CrossRef]
- Lu, D.; Li, G.; Moran, E. Current situation and needs of change detection techniques. Int. J. Image Data Fusion 2014, 5, 13–38. [Google Scholar] [CrossRef]
- Lu, D.; Mausel, P.; Brondizio, E.; Moran, E. Change detection techniques. Int. J. Remote Sens. 2004, 25, 2365–2401. [Google Scholar] [CrossRef]
- Tewkesbury, A.P.; Comber, A.J.; Tate, N.J.; Lamb, A.; Fisher, P.F. A critical synthesis of remotely sensed optical image change detection techniques. Remote Sens. Environ. 2015, 160, 1–14. [Google Scholar] [CrossRef]
- Karantzalos, K. Recent advances on 2D and 3D change detection in urban environments from remote sensing data. In Computational Approaches for Urban Environments; Springer: Berlin/Heidelberg, Germany, 2015; pp. 237–272. [Google Scholar]
- Hansen, M.C.; Loveland, T.R. A review of large area monitoring of land cover change using Landsat data. Remote Sens. Environ. 2012, 122, 66–74. [Google Scholar] [CrossRef]
- Gamba, P.; Dell’Acqua, F. Change detection in urban areas: Spatial and temporal scales. In Multitemporal Remote Sensing; Springer: Berlin/Heidelberg, Germany, 2016; pp. 45–61. [Google Scholar]
- Moser, G.; Serpico, S.B. Generalized minimum-error thresholding for unsupervised change detection from SAR amplitude imagery. IEEE Trans. Geosci. Remote Sens. 2006, 44, 2972–2982. [Google Scholar] [CrossRef]
- He, C.; Wei, A.; Shi, P.; Zhang, Q.; Zhao, Y. Detecting land-use/land-cover change in rural–urban fringe areas using extended change-vector analysis. Int. J. Appl. Earth Obs. Geoinf. 2011, 13, 572–585. [Google Scholar] [CrossRef]
- Bovolo, F.; Bruzzone, L. A split-based approach to unsupervised change detection in large-size multitemporal images: Application to tsunami-damage assessment. IEEE Trans. Geosci. Remote Sens. 2007, 45, 1658–1670. [Google Scholar] [CrossRef]
- Thonfeld, F.; Feilhauer, H.; Braun, M.; Menz, G. Robust Change Vector Analysis (RCVA) for multi-sensor very high resolution optical satellite data. Int. J. Appl. Earth Obs. Geoinf. 2016, 50, 131–140. [Google Scholar] [CrossRef]
- Deng, J.S.; Wang, K.; Deng, Y.H.; Qi, G.J. PCA-based land-use change detection and analysis using multitemporal and multisensor satellite data. Int. J. Remote Sens. 2008, 29, 4823–4838. [Google Scholar] [CrossRef]
- Volpi, M.; Tuia, D.; Bovolo, F.; Kanevski, M.; Bruzzone, L. Supervised change detection in VHR images using contextual information and support vector machines. Int. J. Appl. Earth Obs. Geoinf. 2013, 20, 77–85. [Google Scholar] [CrossRef]
- Nemmour, H.; Chibani, Y. Multiple support vector machines for land cover change detection: An application for mapping urban extensions. ISPRS J. Photogramm. Remote Sens. 2006, 61, 125–133. [Google Scholar] [CrossRef]
- Ban, Y.; Webber, L.; Gamba, P.; Paganini, M. EO4Urban: Sentinel-1A SAR and Sentinel-2A MSI data for global urban services. In Proceedings of the 2017 Joint Urban Remote Sensing Event (JURSE), Dubai, United Arab Emirates, 6–8 March 2017; pp. 1–4. [Google Scholar]
- Pesaresi, M.; Corbane, C.; Julea, A.; Florczyk, A.J.; Syrris, V.; Soille, P. Assessment of the added-value of sentinel-2 for detecting built-up areas. Remote Sens. 2016, 8, 299. [Google Scholar] [CrossRef]
- Haas, J.; Ban, Y. Sentinel-1A SAR and sentinel-2A MSI data fusion for urban ecosystem service mapping. Remote Sens. Appl. Soc. Environ. 2017, 8, 41–53. [Google Scholar] [CrossRef]
- Goldblatt, R.; Deininger, K.; Hanson, G. Utilizing publicly available satellite data for urban research: Mapping built-up land cover and land use in Ho Chi Minh City, Vietnam. Dev. Eng. 2018, 3, 83–99. [Google Scholar] [CrossRef]
- Celik, N. Change detection of urban areas in Ankara through Google Earth engine. In Proceedings of the 2018 41st International Conference on Telecommunications and Signal Processing (TSP), Athens, Greece, 4–6 July 2018; pp. 1–5. [Google Scholar]
- Sun, Z.; Xu, R.; Du, W.; Wang, L.; Lu, D. High-resolution urban land mapping in China from sentinel 1A/2 imagery based on Google Earth Engine. Remote Sens. 2019, 11, 752. [Google Scholar] [CrossRef]
- Iannelli, G.C.; Gamba, P. Jointly exploiting Sentinel-1 and Sentinel-2 for urban mapping. In Proceedings of the IGARSS 2018–2018 IEEE International Geoscience and Remote Sensing Symposium, Valencia, Spain, 22–27 July 2018; pp. 8209–8212. [Google Scholar]
- Munafò, M. Consumo di Suolo, Dinamiche Territoriali e Servizi Ecosistemici. Available online: https://www.snpambiente.it/wp-content/uploads/2019/09/Rapporto_consumo_di_suolo_20190917-1.pdf (accessed on 4 March 2021).
- Joshi, N.; Baumann, M.; Ehammer, A.; Fensholt, R.; Grogan, K.; Hostert, P.; Jepsen, M.R.; Kuemmerle, T.; Meyfroidt, P.; Mitchard, E.T.A.; et al. A review of the application of optical and radar remote sensing data fusion to land use mapping and monitoring. Remote Sens. 2016, 8, 70. [Google Scholar] [CrossRef]
- Cao, Y.; Su, C.; Yang, G. Detecting the number of buildings in a single high-resolution SAR image. Eur. J. Remote Sens. 2014, 47, 513–535. [Google Scholar] [CrossRef]
- Nezry, E. Adaptive speckle filtering in radar imagery. In Land Applications of Radar Remote Sensing; IntechOpen: London, UK, 2014; pp. 1–55. [Google Scholar]
- Holtgrave, A.K.; Röder, N.; Ackermann, A.; Erasmi, S.; Kleinschmit, B. Comparing Sentinel-1 and -2 data and indices for agricultural land use monitoring. Remote Sens. 2020, 12, 2919. [Google Scholar] [CrossRef]
- Hoskera, A.K.; Nico, G.; Irshad Ahmed, M.; Whitbread, A. Accuracies of soil moisture estimations using a semi-empirical model over bare soil agricultural croplands from sentinel-1 SAR data. Remote Sens. 2020, 12, 1664. [Google Scholar] [CrossRef]
- Coluzzi, R.; Imbrenda, V.; Lanfredi, M.; Simoniello, T. A first assessment of the Sentinel 2 Level 1-C cloud mask product to support informed surface analyses. Remote Sens. Environ. 2018, 217, 426–443. [Google Scholar] [CrossRef]
- Spadoni, G.L.; Cavalli, A.; Congedo, L.; Munafò, M. Analysis of Normalized Difference Vegetation Index (NDVI) multi-temporal series for the production of forest cartography. Remote Sens. Appl. Soc. Environ. 2020, 20, 100419. [Google Scholar]
- Ballère, M.; Bouvet, A.; Mermoz, S.; Le Toan, T.; Koleck, T.; Bedeau, C.; André, M.; Forestier, E.; Frison, P.-L.; Lardeux, C. SAR data for tropical forest disturbance alerts in French Guiana: Benefit over optical imagery. Remote Sens. Environ. 2021, 252, 112159. [Google Scholar] [CrossRef]
- Formaggio, A.R.; Epiphanio, J.C.N.; Simões, M.D.S. Radarsat backscattering from an agricultural scene. Pesq. Agropec. Bras. 2001, 36, 823–830. [Google Scholar] [CrossRef][Green Version]
- Koppel, K.; Zalite, K.; Voormansik, K.; Jagdhuber, T. Sensitivity of Sentinel-1 backscatter to characteristics of buildings. Int. J. Remote Sens. 2017, 38, 6298–6318. [Google Scholar] [CrossRef]
- Jarvis, A.; Guevara, E.; Reuter, H.I.; Nelson, A.D. Hole-filled SRTM for the globe: Version 4: Data grid; GIAR Consortium for Spatial Information: Washington, DC, USA, 2008. Available online: http://srtm.csi.cgiar.org/ (accessed on 15 February 2021).
- Munafò, M. Consumo di Suolo, Dinamiche Territoriali e Servizi Ecosistemici. Edizione 2020; SNPA: Rome, Italy, 2020; p. 291. ISBN 9788844810139. [Google Scholar]
- Büttner, G.; Kostztra, B.; Soukup, T.; Sousa, A.; Langanke, T. CLC2018 Technical Guidelines; European Environment Agency: Copenhagen, Denmark, 2017; pp. 1–60. [Google Scholar]
- European Commission for European Mapping Guide Urban Atlas, 2016, 1–39. Available online: https://land.copernicus.eu/user-corner/technical-library/urban-atlas-mapping-guide (accessed on 28 February 2021).
- Lefebvre, A.; Beaugendre, N.; Pennec, A.; Sannier, C.; Corpetti, T. Using data fusion to update built-up areas of the 2012 European High-Resolution Layer Imperviousness. In Proceedings of the 33rd EARSeL Symposium Conference, Matera, Italy, 3–6 June 2013; Volume 36, p. 321328. [Google Scholar]
- Pesaresi, M.; Huadong, G.; Blaes, X.; Ehrlich, D.; Ferri, S.; Gueguen, L.; Halkia, M.; Kauffmann, M.; Kemper, T.; Lu, L.; et al. A global human settlement layer from optical HR/VHR RS data: Concept and first results. IEEE J. Sel. Top. Appl. Earth Obs. Remote Sens. 2013, 6, 2102–2131. [Google Scholar] [CrossRef]
- Esch, T.; Heldens, W.; Hirner, A.; Keil, M.; Marconcini, M.; Roth, A.; Zeidler, J.; Dech, S.; Strano, E. Breaking new ground in mapping human settlements from space—The Global Urban Footprint. ISPRS J. Photogramm. Remote Sens. 2017, 134, 30–42. [Google Scholar] [CrossRef]
- Brown de Colstoun, E.C.; Huang, C.; Wang, P.; Tilton, J.C.; Tan, B.; Phillips, J.; Niemczura, S.; Ling, P.-Y.; Wolfe, R.E. Global Man-Made Impervious Surface (GMIS) Dataset From Landsat 2017; NASA Socioeconomic Data and Applications Center: Palisades, NY, USA, 2017. [Google Scholar]
- Arnold, S.; Kosztra, B.; Banko, G.; Milenov, P.; Smith, G.; Hazeu, G. Explanatory Content Documentation of the EAGLE Concept [2021, version 3.1]. Available online: https://land.copernicus.eu/eagle/content-documentation-of-the-eagle-concept/manual/eagle-explanatory-documentation-v3-1-version-2021 (accessed on 4 March 2021).
- European Parliament and of the Council of the European Union. Directive 2007/2/EC of the European Parliament and of the Council of 14 March 2007 establishing an Infrastructure for Spatial Information in the European Community (INSPIRE); European Parliament and of the Council of the European Union: Bruxelles, Belgium, 2007; pp. 1–14. [Google Scholar]



| Data | CORINE Land Cover | High Resolution Layers | Urban Atlas |
|---|---|---|---|
| Type of information | Land use/Land cover map (44 classes, with 3 level) | Percentage of sealed area | High-resolution Land use/Land cover map (27 classes) |
| Coverage | EU 39 | EU 39 | 788 FUAS |
| Minimum Mapping Unit | 25 ha and 5 ha (changes) | 20 m (pixel), 10 m only 2018 | 17 urban classes 0.25 ha 10 rural classes 1 ha |
| Reference year | 1990, 2000, 2006, 2012, 2018 | 2006, 2009, 2012 and 2018 (under validation) | 2006, 2012, 2018 |
| Approach | Undetected Changes | Detected Changes | Total | Percentage Of Detection |
|---|---|---|---|---|
| First | 16245 | 16702 | 32947 | 50.7 |
| Second | 22742 | 10205 | 32947 | 31.0 |
| Third | 13257 | 19690 | 32947 | 59.8 |
| Approach | Not Detected Changes | Detected Changes | Total | Percentage Of Detection |
|---|---|---|---|---|
| First | 10163 | 14572 | 24735 | 58.9 |
| Second | 15426 | 9309 | 24735 | 37.6 |
| Third | 7332 | 17403 | 24735 | 70.4 |
| Class of Area | Not Detected Changes | Detected Changes | Percentage of Detection |
|---|---|---|---|
| ≤100 m2 | 11983 | 11304 | 48.5 |
| between 100 m2 and 500 m2 | 1126 | 6236 | 84.7 |
| between 500 m2 and 1000 m2 | 113 | 1205 | 91.4 |
| between 1000 m2 and 1500 m2 | 22 | 420 | 95.0 |
| between 1500 m2 and 2000 m2 | 3 | 188 | 98.4 |
| >2000 m2 | 10 | 337 | 97.1 |
Publisher’s Note: MDPI stays neutral with regard to jurisdictional claims in published maps and institutional affiliations. |
© 2021 by the authors. Licensee MDPI, Basel, Switzerland. This article is an open access article distributed under the terms and conditions of the Creative Commons Attribution (CC BY) license (https://creativecommons.org/licenses/by/4.0/).
Share and Cite
Luti, T.; De Fioravante, P.; Marinosci, I.; Strollo, A.; Riitano, N.; Falanga, V.; Mariani, L.; Congedo, L.; Munafò, M. Land Consumption Monitoring with SAR Data and Multispectral Indices. Remote Sens. 2021, 13, 1586. https://doi.org/10.3390/rs13081586
Luti T, De Fioravante P, Marinosci I, Strollo A, Riitano N, Falanga V, Mariani L, Congedo L, Munafò M. Land Consumption Monitoring with SAR Data and Multispectral Indices. Remote Sensing. 2021; 13(8):1586. https://doi.org/10.3390/rs13081586
Chicago/Turabian StyleLuti, Tania, Paolo De Fioravante, Ines Marinosci, Andrea Strollo, Nicola Riitano, Valentina Falanga, Lorella Mariani, Luca Congedo, and Michele Munafò. 2021. "Land Consumption Monitoring with SAR Data and Multispectral Indices" Remote Sensing 13, no. 8: 1586. https://doi.org/10.3390/rs13081586
APA StyleLuti, T., De Fioravante, P., Marinosci, I., Strollo, A., Riitano, N., Falanga, V., Mariani, L., Congedo, L., & Munafò, M. (2021). Land Consumption Monitoring with SAR Data and Multispectral Indices. Remote Sensing, 13(8), 1586. https://doi.org/10.3390/rs13081586


