
Earth Observation for Sustainable Infrastructure: A Review


Abstract
1. Introduction
2. Concepts of Sustainable Infrastructure
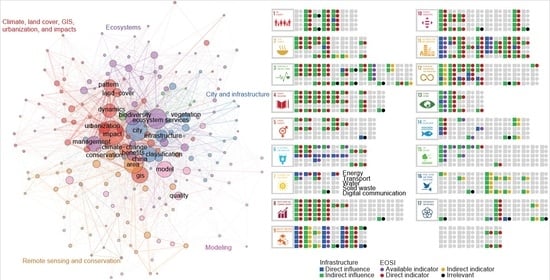
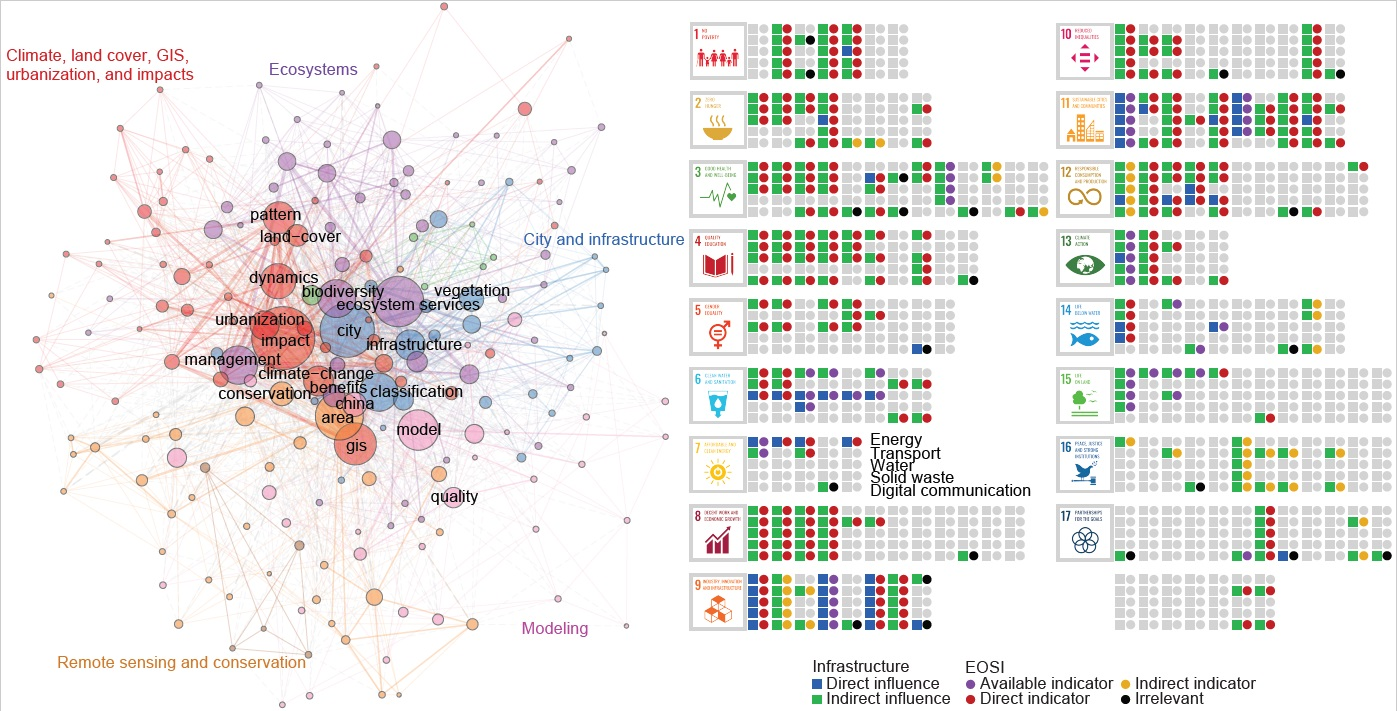
3. Trends of Earth Observation for Sustainable Infrastructure (EOSI)
3.1. Data and Methods
- Topic (including title, abstract, and keywords): ((sustainab* OR green) AND infrastructure AND (“remote sensing” OR “Earth observation”))
- Publication Years: Before 2020 (inclusive)
- Research Areas: Areas in environment, geosiences, engineering, computer sciences and mathematics.
- Document types: Article and review
- Language: English
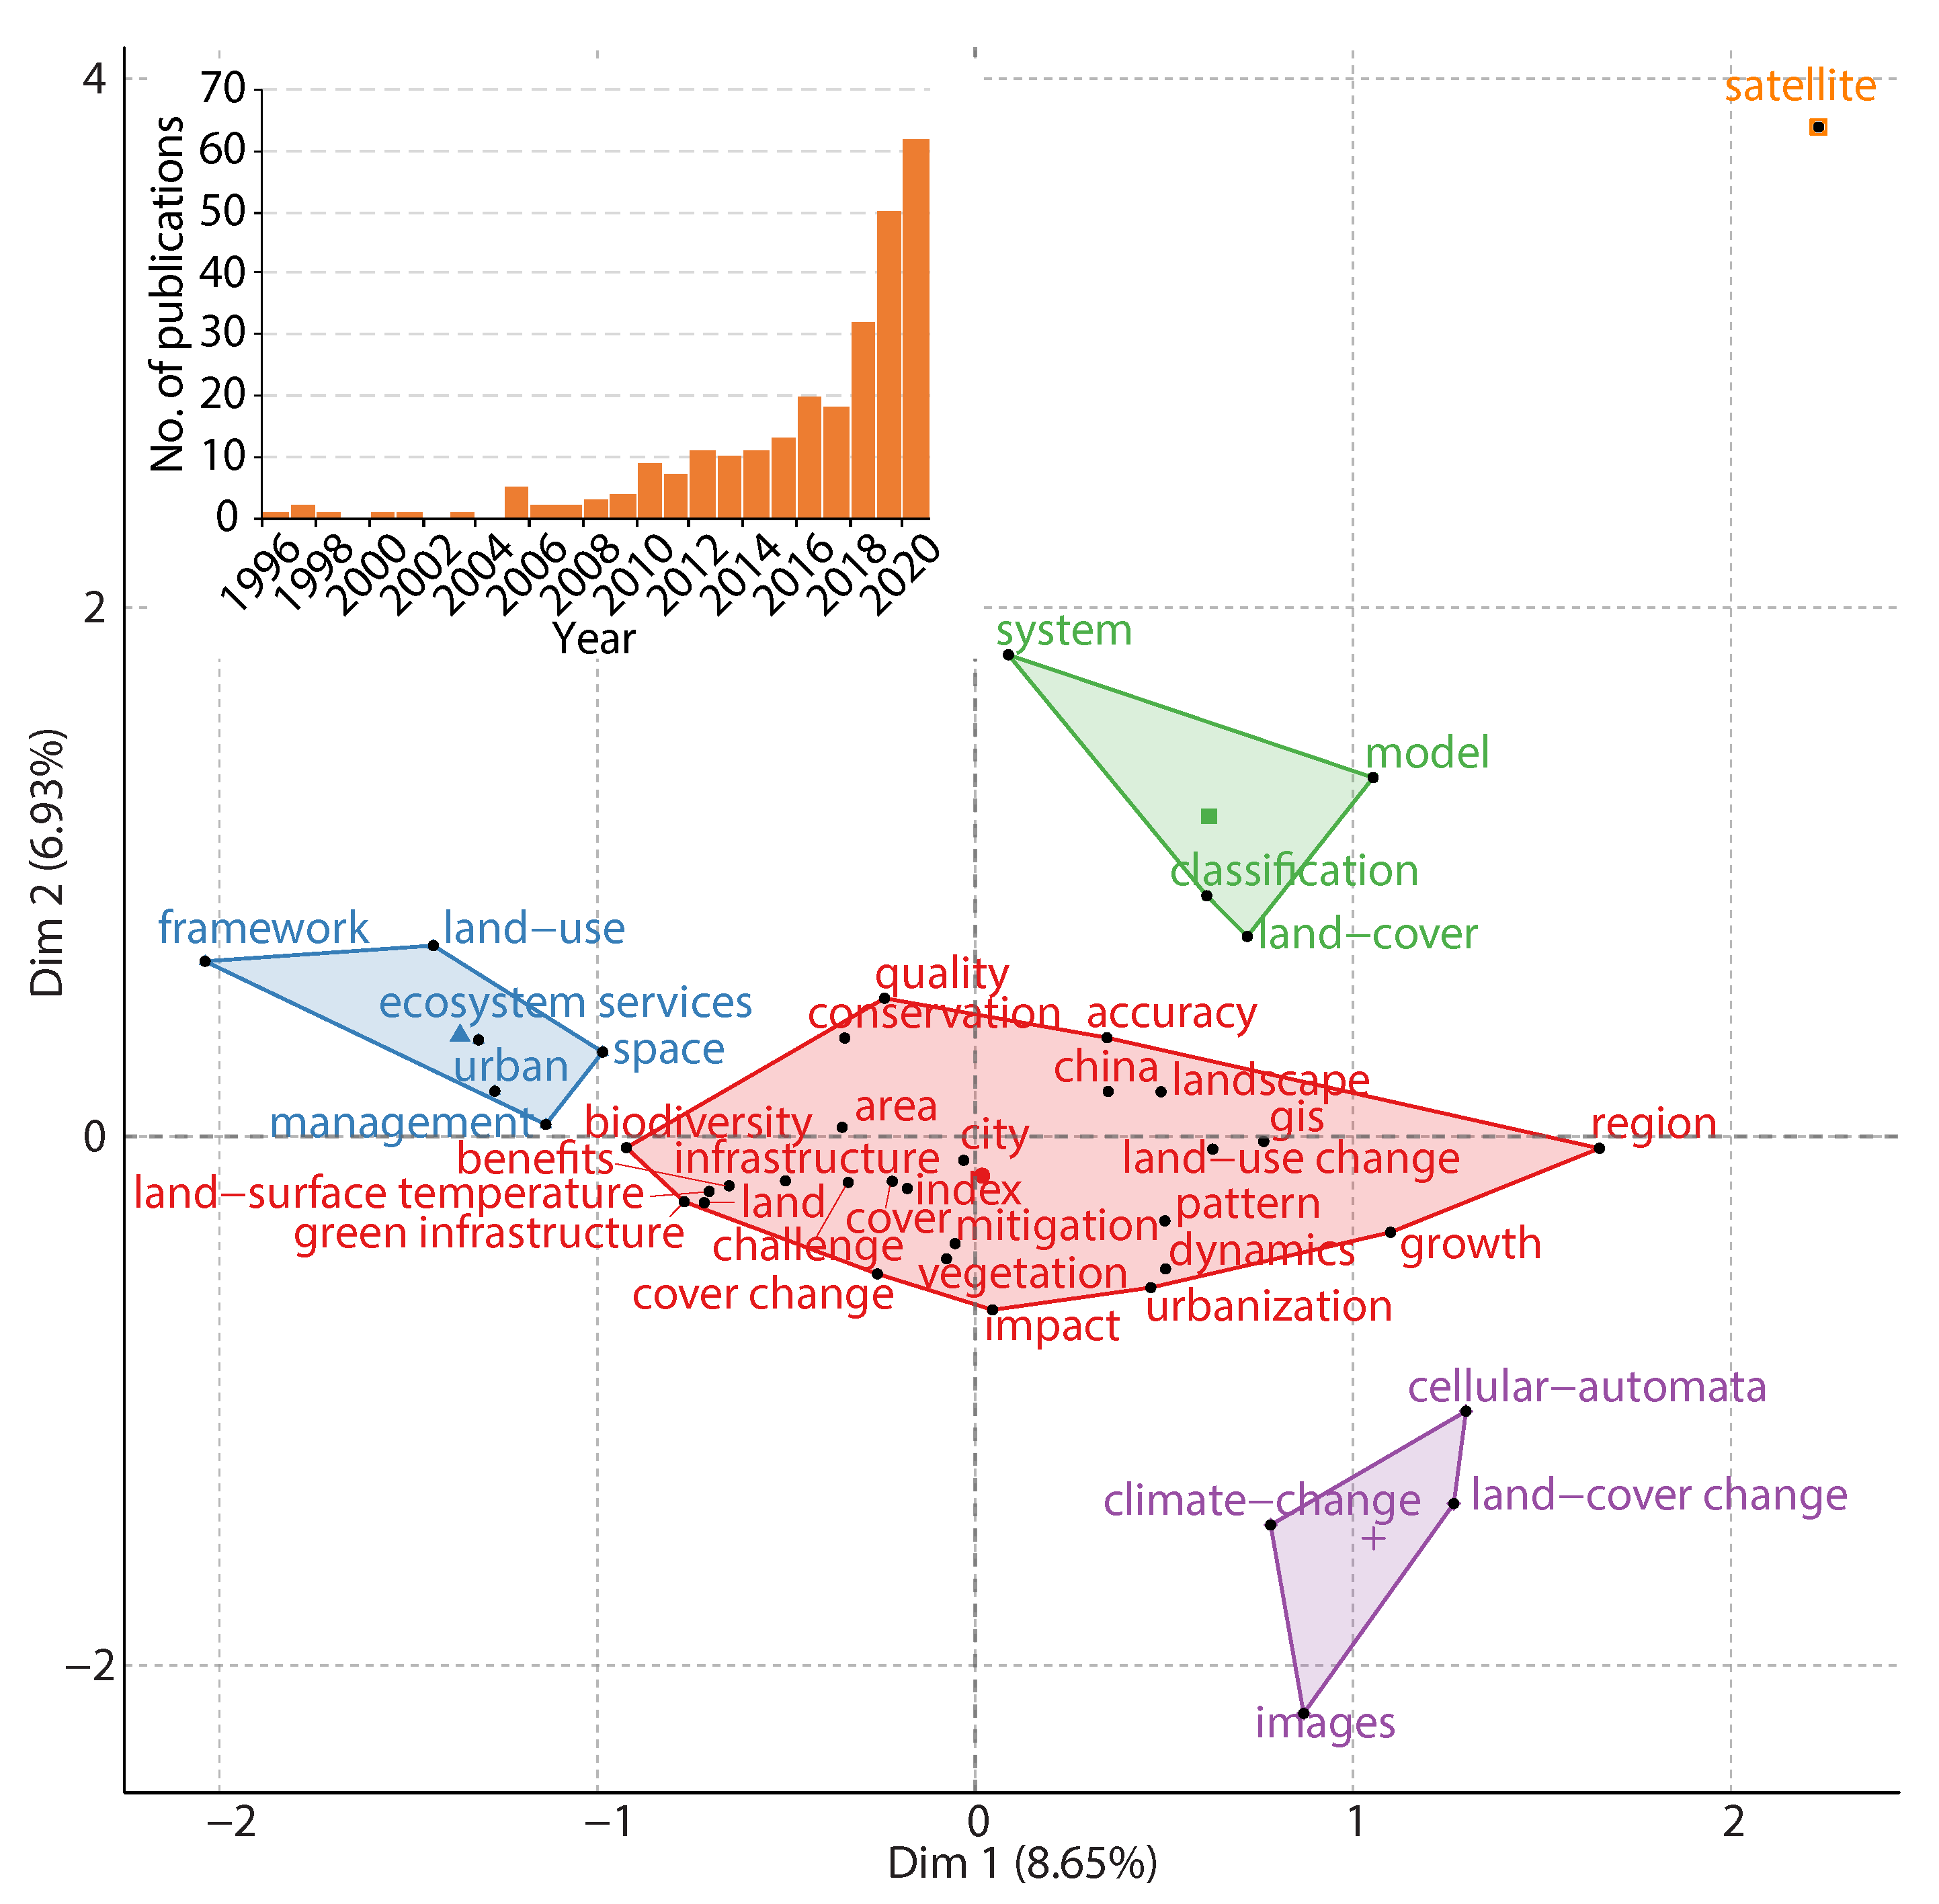
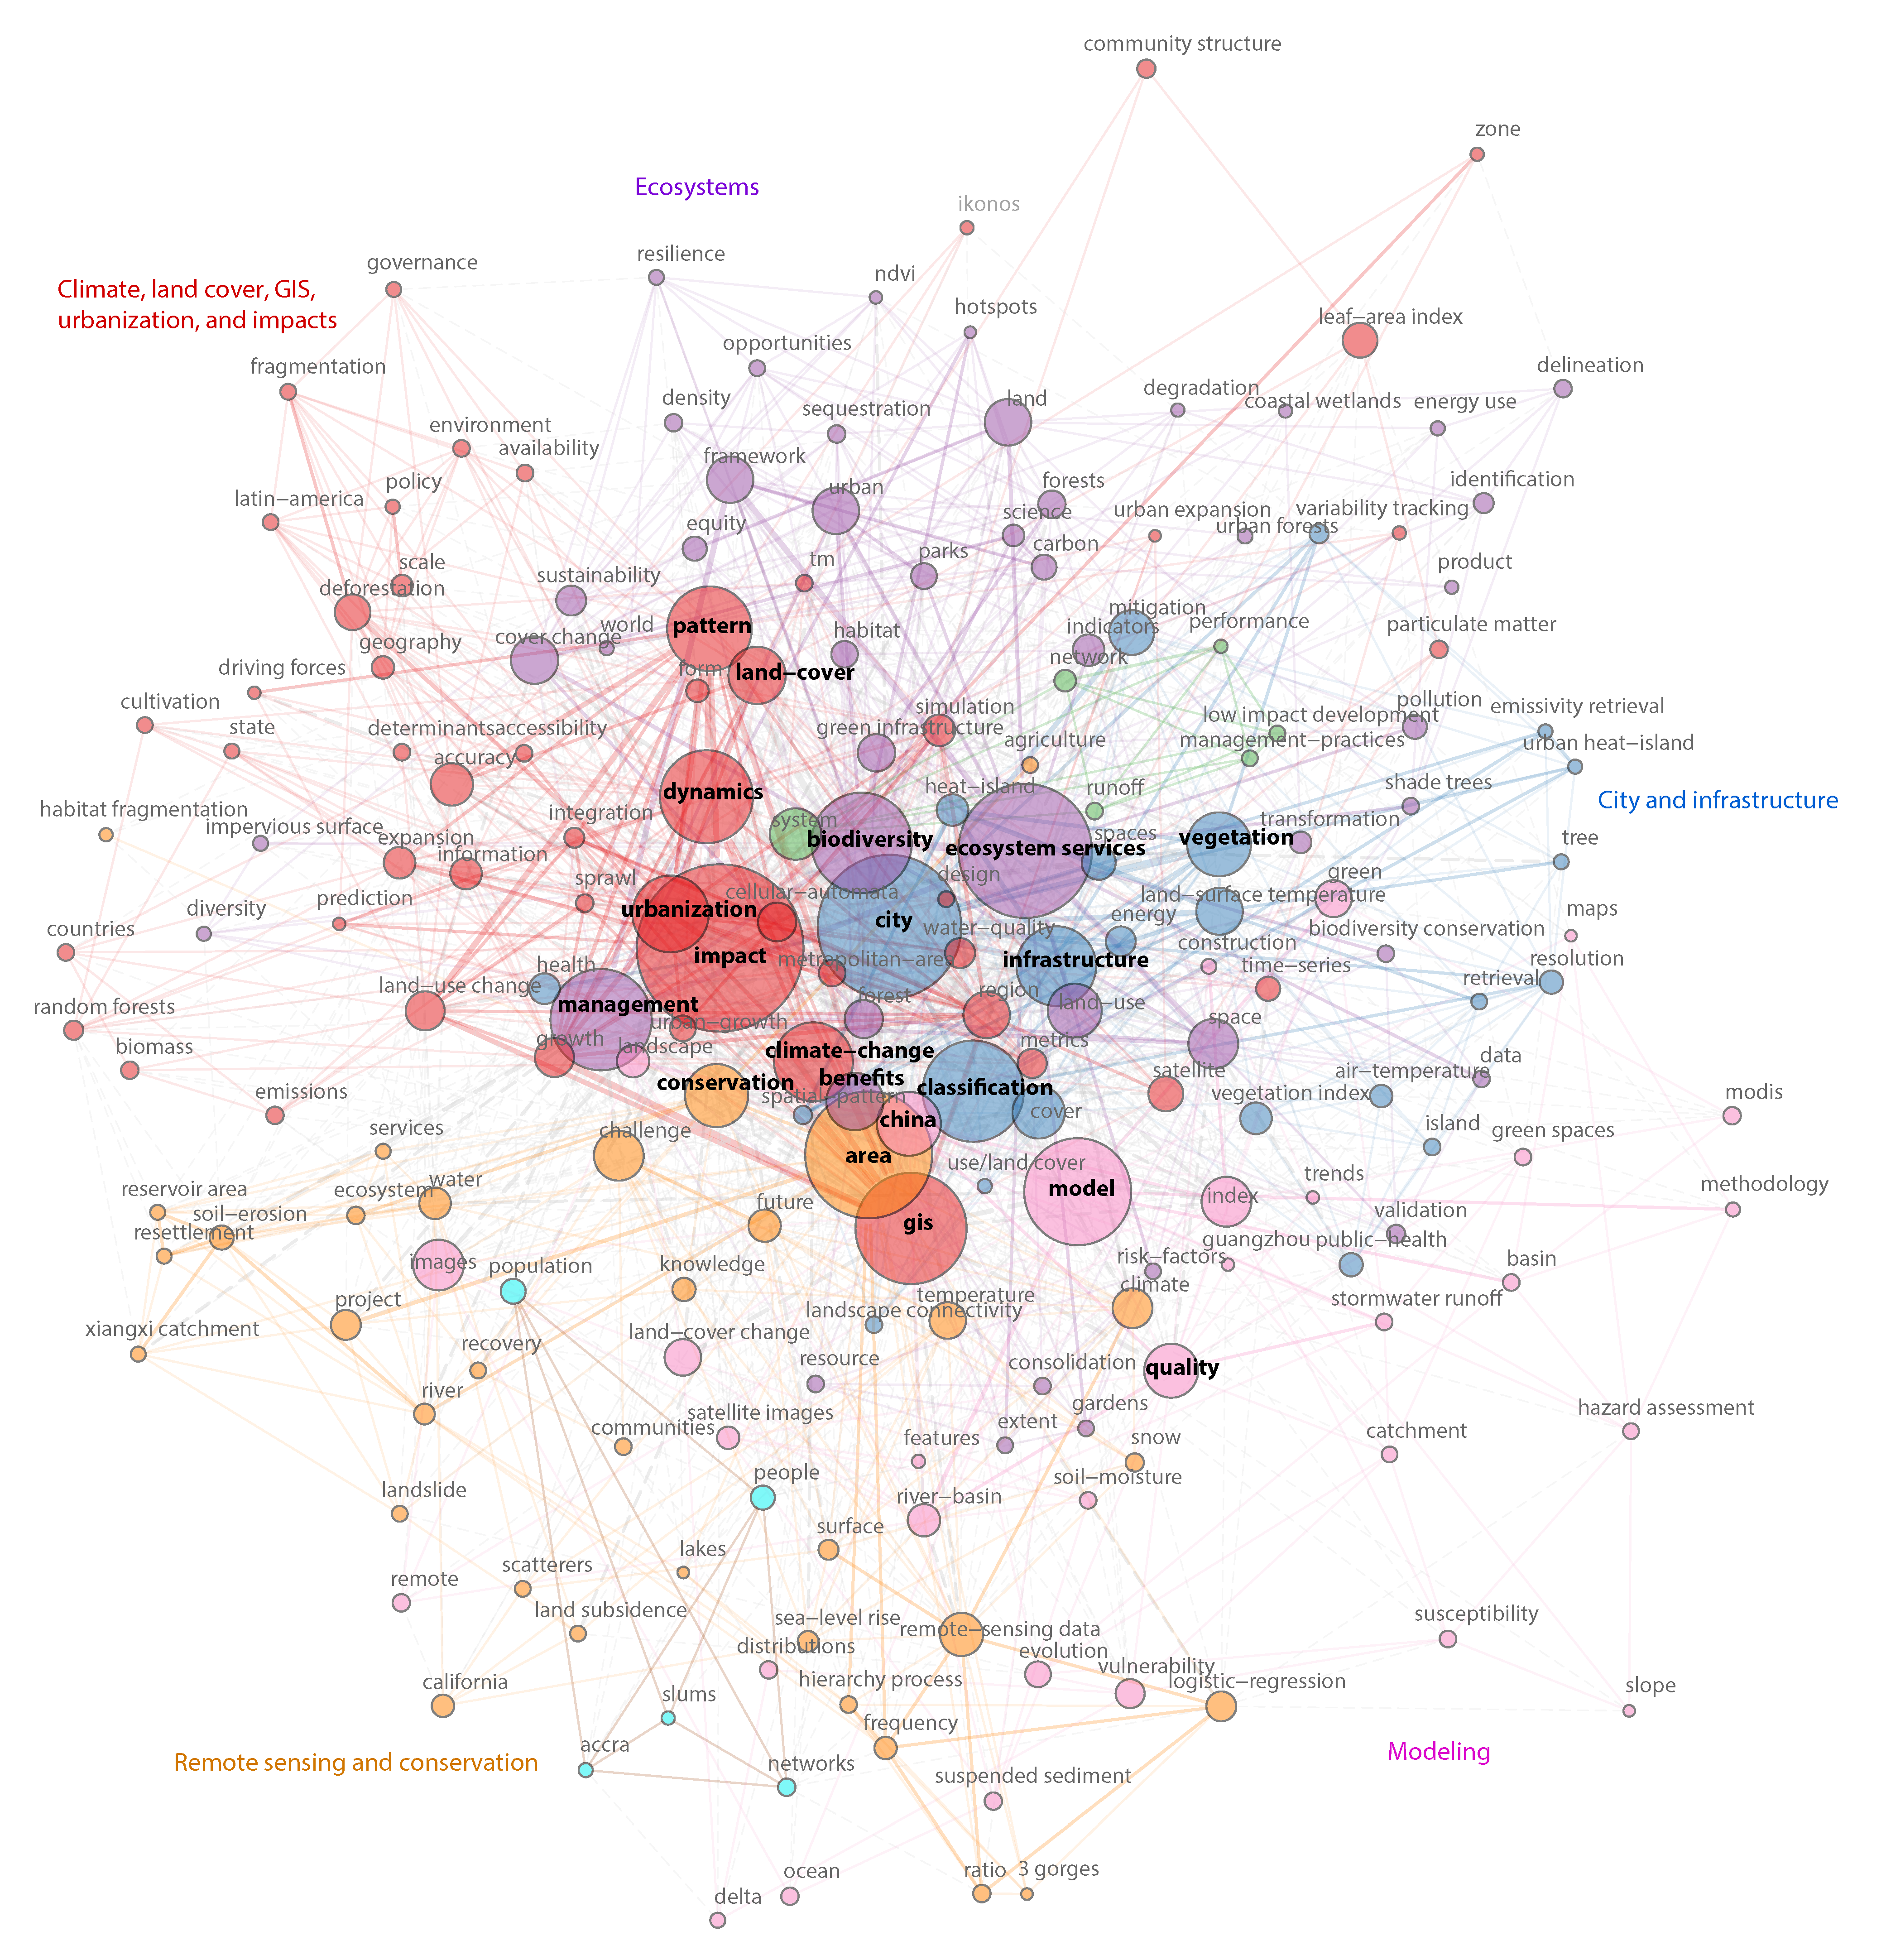
3.2. Analysis
4. EOSI and Sustainable Development Goals (SDGs)
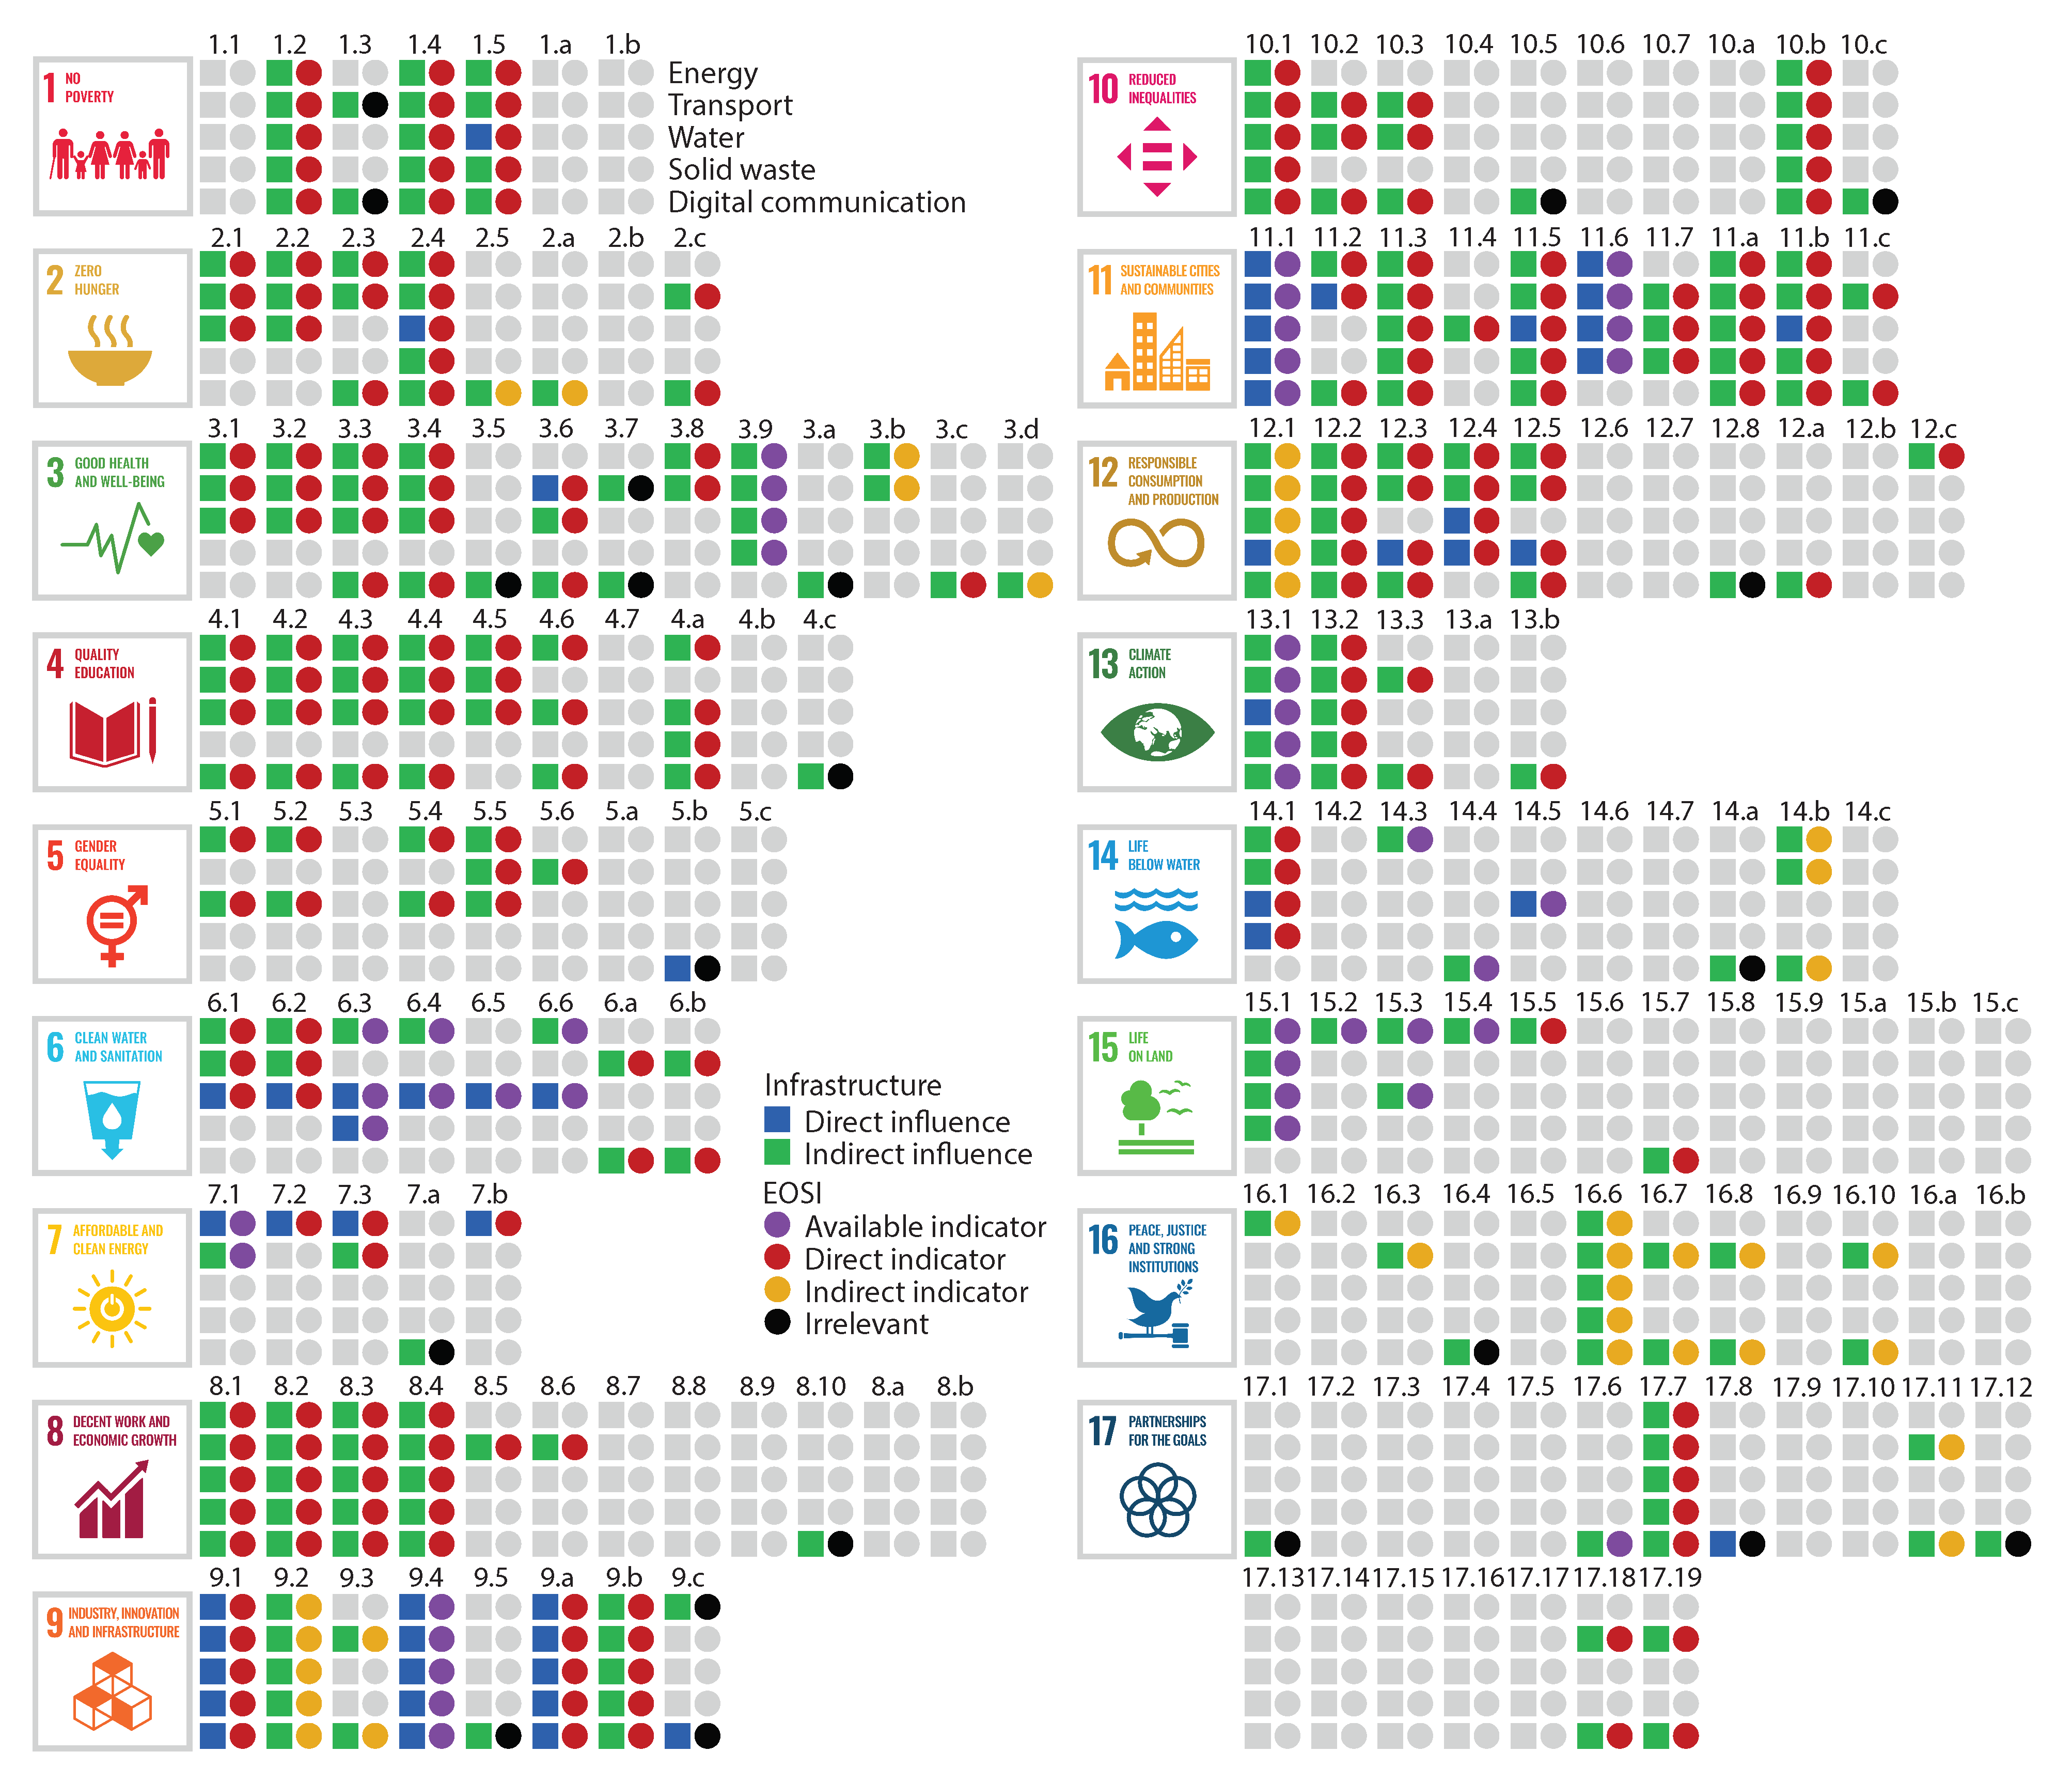
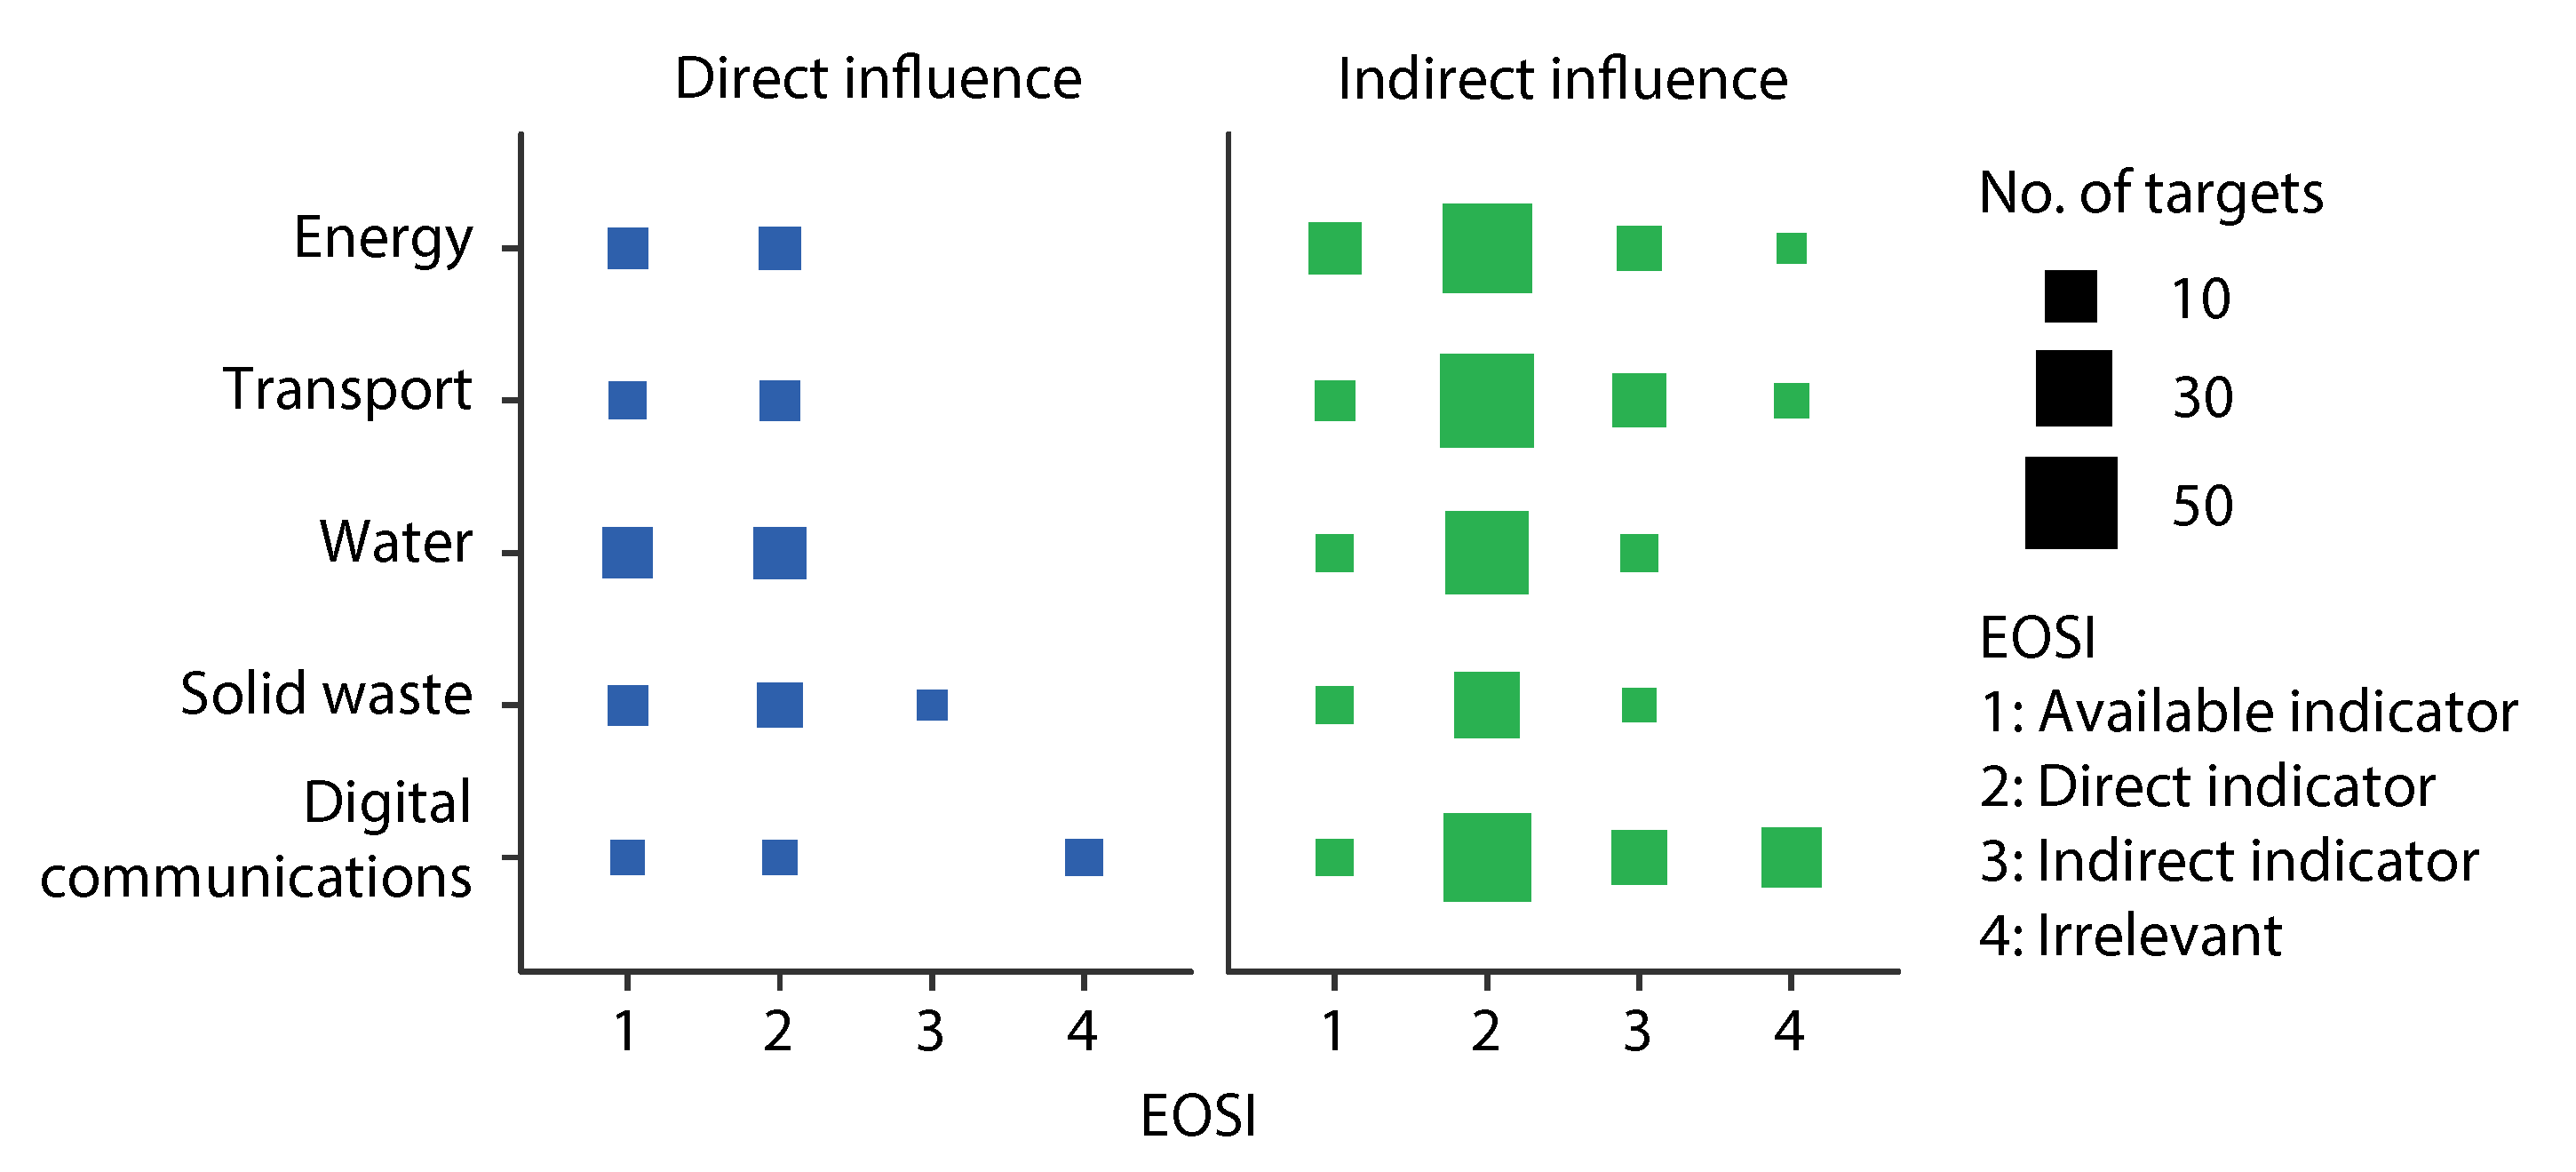
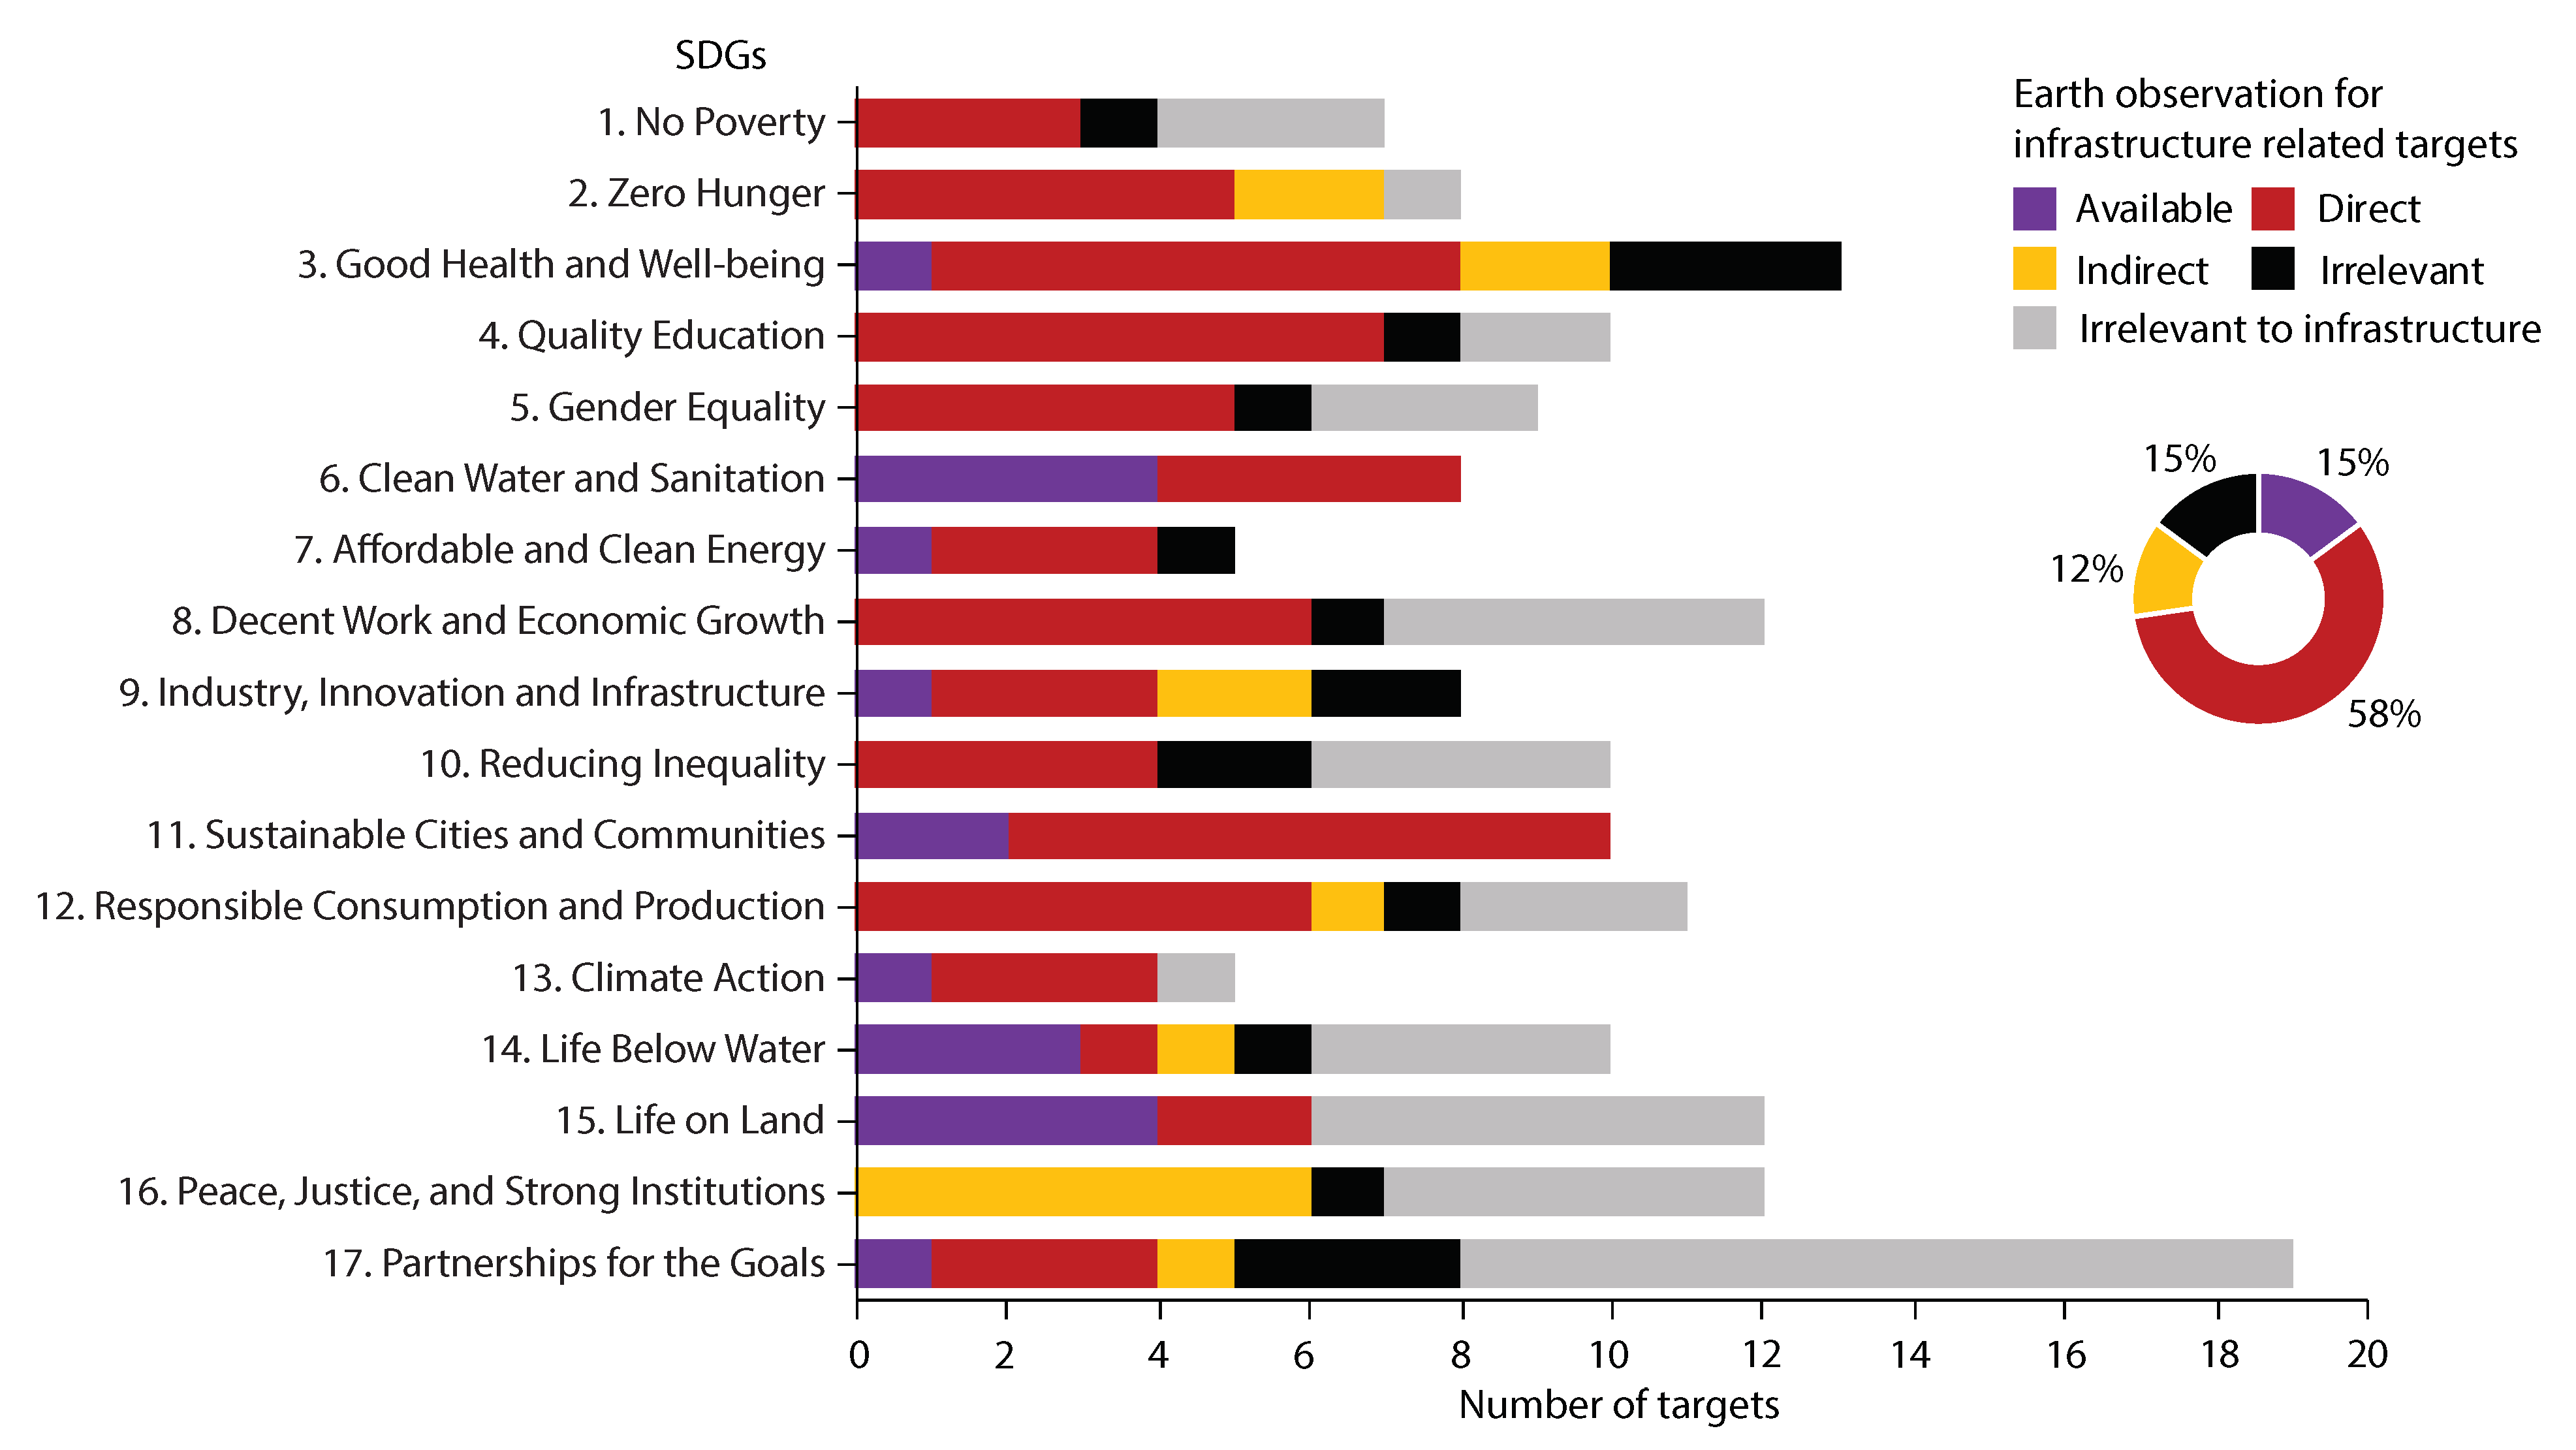
4.1. Concepts and Scope
- If Earth observation data has been used in the Global SDG Indicators Database?
- –
- If “Yes”, the EOSI is an available indicator.
- –
- If “No”, are there any direct relationships between EOSI and SDG targets according to case studies in literature?
- ∗
- If “Yes”, the EOSI is a direct indicator that can be potentially used in SDG targets.
- ∗
- If “No”, are there any indirect relationships between EOSI and SDG targets according to case studies in literature?
- ·
- If “Yes”, the EOSI is an indirect indicator that can be potentially used to support achieving SDG targets.
- ·
- If “No”, the EOSI is an irrelevant indicator.
4.2. Analysis
5. Typical Cases of EOSI
6. Challenges and Future Directions
7. Conclusions
Supplementary Materials
Author Contributions
Funding
Institutional Review Board Statement
Informed Consent Statement
Data Availability Statement
Conflicts of Interest
References
- Thacker, S.; Adshead, D.; Fay, M.; Hallegatte, S.; Harvey, M.; Meller, H.; O’Regan, N.; Rozenberg, J.; Watkins, G.; Hall, J.W. Infrastructure for sustainable development. Nat. Sustain. 2019, 2, 324–331. [Google Scholar] [CrossRef]
- Koks, E.E.; Rozenberg, J.; Zorn, C.; Tariverdi, M.; Vousdoukas, M.; Fraser, S.; Hall, J.; Hallegatte, S. A global multi-hazard risk analysis of road and railway infrastructure assets. Nat. Commun. 2019, 10, 1–11. [Google Scholar] [CrossRef] [PubMed]
- Asensio, O.I.; Alvarez, K.; Dror, A.; Wenzel, E.; Hollauer, C.; Ha, S. Real-time data from mobile platforms to evaluate sustainable transportation infrastructure. Nat. Sustain. 2020, 3, 1–9. [Google Scholar] [CrossRef]
- Bebbington, A.; Chicchon, A.; Cuba, N.; Greenspan, E.; Hecht, S.; Bebbington, D.H.; Kandel, S.; Osborne, T.; Ray, R.; Rogan, J.; et al. Opinion: Priorities for governing large-scale infrastructure in the tropics. Proc. Natl. Acad. Sci. USA 2020, 117, 21829–21833. [Google Scholar] [CrossRef] [PubMed]
- Chester, M.; Underwood, B.S.; Allenby, B.; Garcia, M.; Samaras, C.; Markolf, S.; Sanders, K.; Preston, B.; Miller, T.R. Infrastructure resilience to navigate increasingly uncertain and complex conditions in the Anthropocene. Npj Urban Sustain. 2021, 1, 1–6. [Google Scholar] [CrossRef]
- UN General Assembly. Transforming Our World: The 2030 Agenda for Sustainable Development; UN General Assembly: New York, NY, USA, 2015. [Google Scholar]
- Hosonuma, N.; Herold, M.; De Sy, V.; De Fries, R.S.; Brockhaus, M.; Verchot, L.; Angelsen, A.; Romijn, E. An assessment of deforestation and forest degradation drivers in developing countries. Environ. Res. Lett. 2012, 7, 044009. [Google Scholar] [CrossRef]
- Bebbington, A.J.; Bebbington, D.H.; Sauls, L.A.; Rogan, J.; Agrawal, S.; Gamboa, C.; Imhof, A.; Johnson, K.; Rosa, H.; Royo, A.; et al. Resource extraction and infrastructure threaten forest cover and community rights. Proc. Natl. Acad. Sci. USA 2018, 115, 13164–13173. [Google Scholar] [CrossRef]
- Galatowitsch, S.M. Natural and anthropogenic drivers of wetland change. In The Wetland Book II: Distribution, Description, and Conservation; Springer Nature: Berlin/Heidelberg, Germany, 2018; pp. 359–367. [Google Scholar]
- Balaguera, A.; Carvajal, G.I.; Albertí, J.; Fullana-i Palmer, P. Life cycle assessment of road construction alternative materials: A literature review. Resour. Conserv. Recycl. 2018, 132, 37–48. [Google Scholar] [CrossRef]
- Sun, C.; Luo, Y.; Li, J. Urban traffic infrastructure investment and air pollution: Evidence from the 83 cities in China. J. Clean. Prod. 2018, 172, 488–496. [Google Scholar] [CrossRef]
- zu Ermgassen, S.O.S.E.; Utamiputri, P.; Bennun, L.; Edwards, S.; Bull, J.W. The role of “no net loss” policies in conserving biodiversity threatened by the global infrastructure boom. One Earth 2019, 1, 305–315. [Google Scholar] [CrossRef]
- Underwood, B.S.; Guido, Z.; Gudipudi, P.; Feinberg, Y. Increased costs to US pavement infrastructure from future temperature rise. Nat. Clim. Chang. 2017, 7, 704–707. [Google Scholar] [CrossRef]
- Du, H.; Liu, D.; Lu, Z.; Crittenden, J.; Mao, G.; Wang, S.; Zou, H. Research Development on Sustainable Urban Infrastructure From 1991 to 2017: A Bibliometric Analysis to Inform Future Innovations. Earth’s Future 2019, 7, 718–733. [Google Scholar] [CrossRef]
- Herweijer, C.; Combes, B.; Gawel, A.; Larsen, A.E.; Davies, M.; Wrigley, J.; Donnelly, M. Unlocking Technology for the Global Goals; World Economic Forum, PwC: Cologny, Switzerland, 2020. [Google Scholar]
- Di Vaio, A.; Varriale, L. Blockchain technology in supply chain management for sustainable performance: Evidence from the airport industry. Int. J. Inf. Manag. 2020, 52, 102014. [Google Scholar] [CrossRef]
- Edwards, R.W.; Celia, M.A. Infrastructure to enable deployment of carbon capture, utilization, and storage in the United States. Proc. Natl. Acad. Sci. USA 2018, 115, E8815–E8824. [Google Scholar] [CrossRef] [PubMed]
- Vinuesa, R.; Azizpour, H.; Leite, I.; Balaam, M.; Dignum, V.; Domisch, S.; Felländer, A.; Langhans, S.D.; Tegmark, M.; Nerini, F.F. The role of artificial intelligence in achieving the Sustainable Development Goals. Nat. Commun. 2020, 11, 1–10. [Google Scholar] [CrossRef] [PubMed]
- Ahmad, T.; Zhang, D.; Huang, C.; Zhang, H.; Dai, N.; Song, Y.; Chen, H. Artificial Intelligence in Sustainable Energy Industry: Status Quo, Challenges and Opportunities. J. Clean. Prod. 2021, 289, 125834. [Google Scholar] [CrossRef]
- Oshri, B.; Hu, A.; Adelson, P.; Chen, X.; Dupas, P.; Weinstein, J.; Burke, M.; Lobell, D.; Ermon, S. Infrastructure quality assessment in africa using satellite imagery and deep learning. In Proceedings of the 24th ACM SIGKDD International Conference on Knowledge Discovery & Data Mining, London, UK, 19–23 August 2018; pp. 616–625. [Google Scholar]
- Alreshidi, E. Smart sustainable agriculture (SSA) solution underpinned by internet of things (IoT) and artificial intelligence (AI). Int. J. Adv. Comput. Sci. Appl. 2019, 5. [Google Scholar] [CrossRef]
- Dogo, E.M.; Salami, A.F.; Nwulu, N.I.; Aigbavboa, C.O. Blockchain and internet of things-based technologies for intelligent water management system. In Artificial Intelligence in IoT; Springer: Berlin/Heidelberg, Germany, 2019; pp. 129–150. [Google Scholar]
- Singh, S.K.; Jeong, Y.S.; Park, J.H. A deep learning-based IoT-oriented infrastructure for secure smart city. Sustain. Cities Soc. 2020, 60, 102252. [Google Scholar] [CrossRef]
- Song, Y.; Wang, X.; Tan, Y.; Wu, P.; Sutrisna, M.; Cheng, J.C.; Hampson, K. Trends and opportunities of BIM-GIS integration in the architecture, engineering and construction industry: A review from a spatio-temporal statistical perspective. ISPRS Int. J. Geo-Inf. 2017, 6, 397. [Google Scholar] [CrossRef]
- Neupane, B.; Horanont, T.; Aryal, J. Deep Learning-Based Semantic Segmentation of Urban Features in Satellite Images: A Review and Meta-Analysis. Remote Sens. 2021, 13, 808. [Google Scholar] [CrossRef]
- Sefrin, O.; Riese, F.M.; Keller, S. Deep Learning for Land Cover Change Detection. Remote Sens. 2021, 13, 78. [Google Scholar] [CrossRef]
- Shojaei, A.; Wang, J.; Fenner, A. Exploring the feasibility of blockchain technology as an infrastructure for improving built asset sustainability. Built Environ. Proj. Asset Manag. 2019, 10, 184–199. [Google Scholar] [CrossRef]
- Li, S. Application of blockchain technology in smart city infrastructure. In Proceedings of the 2018 IEEE International Conference on Smart Internet of Things (SmartIoT), Xi’an, China, 17–19 August 2018; pp. 276–2766. [Google Scholar]
- Zhang, Y.; Guindon, B. Using satellite remote sensing to survey transport-related urban sustainability: Part 1: Methodologies for indicator quantification. Int. J. Appl. Earth Obs. Geoinf. 2006, 8, 149–164. [Google Scholar] [CrossRef]
- Rausch, L.; Friesen, J.; Altherr, L.C.; Meck, M.; Pelz, P.F. A holistic concept to design optimal water supply infrastructures for informal settlements using remote sensing data. Remote Sens. 2018, 10, 216. [Google Scholar] [CrossRef]
- Bonczak, B.; Kontokosta, C.E. Large-scale parameterization of 3D building morphology in complex urban landscapes using aerial LiDAR and city administrative data. Comput. Environ. Urban Syst. 2019, 73, 126–142. [Google Scholar] [CrossRef]
- Lacasse, S. Innovation Reduces Risk for Sustainable Infrastructure. In CIGOS 2019, Innovation for Sustainable Infrastructure; Springer: Berlin/Heidelberg, Germany, 2020; pp. 45–56. [Google Scholar]
- Sestras, P.; Bilasco, S.; Roșca, S.; Dudic, B.; Hysa, A.; Spalevi, V. Geodetic and UAV Monitoring in the Sustainable Management of Shallow Landslides and Erosion of a Susceptible Urban Environment. Remote Sens. 2021, 13, 385. [Google Scholar] [CrossRef]
- Dimitrov, S.; Georgiev, G.; Georgieva, M.; Gluschkova, M.; Chepisheva, V.; Mirchev, P.; Zhiyanski, M. Integrated assessment of urban green infrastructure condition in Karlovo urban area by in-situ observations and remote sensing. One Ecosyst. 2018, 3, e21610. [Google Scholar] [CrossRef]
- Mattinzioli, T.; Sol-Sánchez, M.; Martínez, G.; Rubio-Gámez, M. A critical review of roadway sustainable rating systems. Sustain. Cities Soc. 2020, 63, 102447. [Google Scholar] [CrossRef]
- Franklin, S.E. Remote Sensing for Sustainable Forest Management; CRC Press: Boca Raton, FL, USA, 2001. [Google Scholar]
- Foody, G.M. Remote sensing of tropical forest environments: Towards the monitoring of environmental resources for sustainable development. Int. J. Remote Sens. 2003, 24, 4035–4046. [Google Scholar] [CrossRef]
- Cochran, F.; Daniel, J.; Jackson, L.; Neale, A. Earth observation-based ecosystem services indicators for national and subnational reporting of the sustainable development goals. Remote Sens. Environ. 2020, 244, 111796. [Google Scholar] [CrossRef]
- Im, J. Earth observations and geographic information science for sustainable development goals. GISci. Remote Sens. 2020, 57, 591–592. [Google Scholar] [CrossRef]
- Yigitcanlar, T.; Dur, F. Developing a sustainability assessment model: The sustainable infrastructure, land-use, environment and transport model. Sustainability 2010, 2, 321–340. [Google Scholar] [CrossRef]
- Cumming, T.L.; Shackleton, R.T.; Förster, J.; Dini, J.; Khan, A.; Gumula, M.; Kubiszewski, I. Achieving the national development agenda and the Sustainable Development Goals (SDGs) through investment in ecological infrastructure: A case study of South Africa. Ecosyst. Serv. 2017, 27, 253–260. [Google Scholar] [CrossRef]
- Song, Y.; Wright, G.; Wu, P.; Thatcher, D.; McHugh, T.; Li, Q.; Li, S.J.; Wang, X. Segment-based spatial analysis for assessing road infrastructure performance using monitoring observations and remote sensing data. Remote Sens. 2018, 10, 1696. [Google Scholar] [CrossRef]
- Song, Y.; Thatcher, D.; Li, Q.; McHugh, T.; Wu, P. Developing sustainable road infrastructure performance indicators using a model-driven fuzzy spatial multi-criteria decision making method. Renew. Sustain. Energy Rev. 2021, 138, 110538. [Google Scholar] [CrossRef]
- Ramaswami, A.; Weible, C.; Main, D.; Heikkila, T.; Siddiki, S.; Duvall, A.; Pattison, A.; Bernard, M. A social-ecological-infrastructural systems framework for interdisciplinary study of sustainable city systems: An integrative curriculum across seven major disciplines. J. Ind. Ecol. 2012, 16, 801–813. [Google Scholar] [CrossRef]
- Grabowski, Z.; Matsler, A.; Thiel, C.; McPhillips, L.; Hum, R.; Bradshaw, A.; Miller, T.; Redman, C. Infrastructures as socio-eco-technical systems: Five considerations for interdisciplinary dialogue. J. Infrastruct. Syst. 2017, 23, 02517002. [Google Scholar] [CrossRef]
- Bassi, A.M.; McDougal, K.; Uzsoki, D. Sustainable Asset Valuation Tool; International Institute for Sustainable Development: Winnipeg, MB, Canada, 2017. [Google Scholar]
- Choguill, C.L. Ten steps to sustainable infrastructure. Habitat Int. 1996, 20, 389–404. [Google Scholar] [CrossRef]
- Lu, Z.; Peña-Mora, F.; Wang, X.R.; Shen, C.Q.; Riaz, Z. Social impact project finance: An innovative and sustainable infrastructure financing framework. Procedia Eng. 2015, 123, 300–307. [Google Scholar] [CrossRef][Green Version]
- Adesina, A.; Awoyera, P. Utilization of biomass energy in cement production: A pathway towards sustainable infrastructure. In Renewable Energy and Sustainable Buildings; Springer: Berlin/Heidelberg, Germany, 2020; pp. 791–799. [Google Scholar]
- Diaz-Sarachaga, J.M.; Jato-Espino, D.; Castro-Fresno, D. Methodology for the development of a new Sustainable Infrastructure Rating System for Developing Countries (SIRSDEC). Environ. Sci. Policy 2017, 69, 65–72. [Google Scholar] [CrossRef]
- Guo, Y.; Tian, J.; Chen, L. Managing energy infrastructure to decarbonize industrial parks in China. Nat. Commun. 2020, 11, 1–9. [Google Scholar] [CrossRef]
- Kadefors, A.; Lingegård, S.; Uppenberg, S.; Alkan-Olsson, J.; Balian, D. Designing and implementing procurement requirements for carbon reduction in infrastructure construction–international overview and experiences. J. Environ. Plan. Manag. 2021, 64, 611–634. [Google Scholar] [CrossRef]
- Wei, T.; Chen, S. Dynamic energy and carbon footprints of urban transportation infrastructures: Differentiating between existing and newly-built assets. Appl. Energy 2020, 277, 115554. [Google Scholar] [CrossRef]
- Elliott, R.M.; Motzny, A.E.; Majd, S.; Chavez, F.J.V.; Laimer, D.; Orlove, B.S.; Culligan, P.J. Identifying linkages between urban green infrastructure and ecosystem services using an expert opinion methodology. Ambio 2020, 49, 569–583. [Google Scholar] [CrossRef]
- Aria, M.; Cuccurullo, C. bibliometrix: An R-tool for comprehensive science mapping analysis. J. Informetr. 2017, 11, 959–975. [Google Scholar] [CrossRef]
- Xie, J.; Chen, H.; Liao, Z.; Gu, X.; Zhu, D.; Zhang, J. An integrated assessment of urban flooding mitigation strategies for robust decision making. Environ. Model. Softw. 2017, 95, 143–155. [Google Scholar] [CrossRef]
- Zhang, K.; Chui, T.F.M. Linking hydrological and bioecological benefits of green infrastructures across spatial scales—A literature review. Sci. Total Environ. 2019, 646, 1219–1231. [Google Scholar] [CrossRef]
- Randall, M.; Fensholt, R.; Zhang, Y.; Bergen Jensen, M. Geographic object based image analysis of worldview-3 imagery for urban hydrologic modelling at the catchment scale. Water 2019, 11, 1133. [Google Scholar] [CrossRef]
- Waage, J.; Yap, C.; Bell, S.; Levy, C.; Mace, G.; Pegram, T.; Unterhalter, E.; Dasandi, N.; Hudson, D.; Kock, R.; et al. Governing the UN Sustainable Development Goals: Interactions, infrastructures, and institutions. Lancet Glob. Health 2015, 3, e251–e252. [Google Scholar] [CrossRef]
- Estoque, R.C. A review of the sustainability concept and the state of SDG monitoring using remote sensing. Remote Sens. 2020, 12, 1770. [Google Scholar] [CrossRef]
- Department of Economic and Social Affairs (DESA), United Nations. Global SDG Indicators Database. 2021. Available online: https://unstats.un.org/sdgs/indicators/database/ (accessed on 20 February 2021).
- Prince, S.D. Challenges for remote sensing of the Sustainable Development Goal SDG 15.3. 1 productivity indicator. Remote Sens. Environ. 2019, 234, 111428. [Google Scholar] [CrossRef]
- Chirici, G. Earth observation for the implementation of Sustainable Development Goals: The role of the European Journal of Remote Sensing. Eur. J. Remote Sens. 2020, 53, i–ii. [Google Scholar] [CrossRef]
- Hakimdavar, R.; Hubbard, A.; Policelli, F.; Pickens, A.; Hansen, M.; Fatoyinbo, T.; Lagomasino, D.; Pahlevan, N.; Unninayar, S.; Kavvada, A.; et al. Monitoring water-related ecosystems with earth observation data in support of Sustainable Development Goal (SDG) 6 reporting. Remote Sens. 2020, 12, 1634. [Google Scholar] [CrossRef]
- Ishtiaque, A.; Masrur, A.; Rabby, Y.W.; Jerin, T.; Dewan, A. Remote sensing-based research for monitoring progress towards SDG 15 in Bangladesh: A review. Remote Sens. 2020, 12, 691. [Google Scholar] [CrossRef]
- United Nations. Report of the World Summit for Social Development; Technical Report; United Nations: New York, NY, USA, 1995. [Google Scholar]
- Watmough, G.R.; Marcinko, C.L.; Sullivan, C.; Tschirhart, K.; Mutuo, P.K.; Palm, C.A.; Svenning, J.C. Socioecologically informed use of remote sensing data to predict rural household poverty. Proc. Natl. Acad. Sci. USA 2019, 116, 1213–1218. [Google Scholar] [CrossRef]
- Okwi, P.O.; Ndeng’e, G.; Kristjanson, P.; Arunga, M.; Notenbaert, A.; Omolo, A.; Henninger, N.; Benson, T.; Kariuki, P.; Owuor, J. Spatial determinants of poverty in rural Kenya. Proc. Natl. Acad. Sci. USA 2007, 104, 16769–16774. [Google Scholar] [CrossRef] [PubMed]
- Gannon, C.A.; Liu, Z. Poverty and Transport; Technical Report; World Bank: Washington, DC, USA, 1997. [Google Scholar]
- Velaga, N.R.; Beecroft, M.; Nelson, J.D.; Corsar, D.; Edwards, P. Transport poverty meets the digital divide: Accessibility and connectivity in rural communities. J. Transp. Geogr. 2012, 21, 102–112. [Google Scholar] [CrossRef]
- Song, Y.; Tan, Y.; Song, Y.; Wu, P.; Cheng, J.C.; Kim, M.J.; Wang, X. Spatial and temporal variations of spatial population accessibility to public hospitals: A case study of rural–urban comparison. GISci. Remote Sens. 2018, 55, 718–744. [Google Scholar] [CrossRef]
- García, L.; Rodríguez, D.; Wijnen, M.; Pakulski, I. Earth Observation for Water Resources Management: Current Use and Future Opportunities for the Water Sector; The World Bank: Washington, DC, USA, 2016. [Google Scholar]
- Mohammedshum, A.; Gebresilassiea, M.; Rulindaa, C.; Kahsaya, G.; Tesfay, M. Application of geographic information system and remote sensing in effective solid waste disposal sites selection in Wukro Town, Tigray, Ethiopia. Int. Arch. Photogramm. Remote Sens. Spat. Inf. Sci. 2014, 40-2, 115–119. [Google Scholar] [CrossRef]
- Taubenböck, H.; Staab, J.; Zhu, X.X.; Geiß, C.; Dech, S.; Wurm, M. Are the poor digitally left behind? Indications of urban divides based on remote sensing and twitter data. ISPRS Int. J. Geo-Inf. 2018, 7, 304. [Google Scholar] [CrossRef]
- Wasowski, J.; Bovenga, F.; Nutricato, R.; Nitti, D.O.; Chiaradia, M.T. High resolution satellite multi-temporal interferometry for monitoring infrastructure instability hazards. Innov. Infrastruct. Solut. 2017, 2, 1–9. [Google Scholar] [CrossRef]
- Karthikeyan, L.; Chawla, I.; Mishra, A.K. A review of remote sensing applications in agriculture for food security: Crop growth and yield, irrigation, and crop losses. J. Hydrol. 2020, 586, 124905. [Google Scholar] [CrossRef]
- Koppa, A.; Gebremichael, M. Improving the Applicability of Hydrologic Models for Food–Energy–Water Nexus Studies Using Remote Sensing Data. Remote Sens. 2020, 12, 599. [Google Scholar] [CrossRef]
- Brown, M.E.; Grace, K.; Shively, G.; Johnson, K.B.; Carroll, M. Using satellite remote sensing and household survey data to assess human health and nutrition response to environmental change. Popul. Environ. 2014, 36, 48–72. [Google Scholar] [CrossRef] [PubMed]
- Vittuari, M.; Pagani, M.; Johnson, T.G.; De Menna, F. Impacts and costs of embodied and nutritional energy of food waste in the US food system: Distribution and consumption (Part B). J. Clean. Prod. 2020, 252, 119857. [Google Scholar] [CrossRef]
- Llanto, G.M. The Impact of Infrastructure on Agricultural Productivity; Technical Report, PIDS Discussion Paper Series; PIDS: Makati, Philippine, 2012. [Google Scholar]
- Bakht, Z. Poverty Impact of Rural Roads and Markets Improvement & Maintenance Project of Bangladesh; India Habitat Centre: New Delhi, India, 2000. [Google Scholar]
- Deichmann, U.; Goyal, A.; Mishra, D. Will Digital Technologies Transform Agriculture in Developing Countries; The World Bank: Washington, DC, USA, 2016. [Google Scholar]
- Abdullahi, H.S.; Mahieddine, F.; Sheriff, R.E. Technology impact on agricultural productivity: A review of precision agriculture using unmanned aerial vehicles. In Proceedings of the International Conference on Wireless and Satellite Systems, Bradford, UK, 6–7 July 2015; pp. 388–400. [Google Scholar]
- Seelan, S.K.; Laguette, S.; Casady, G.M.; Seielstad, G.A. Remote sensing applications for precision agriculture: A learning community approach. Remote Sens. Environ. 2003, 88, 157–169. [Google Scholar] [CrossRef]
- Liaghat, S.; Balasundram, S.K. A review: The role of remote sensing in precision agriculture. Am. J. Agric. Biol. Sci. 2010, 5, 50–55. [Google Scholar] [CrossRef]
- Mulla, D.J. Twenty five years of remote sensing in precision agriculture: Key advances and remaining knowledge gaps. Biosyst. Eng. 2013, 114, 358–371. [Google Scholar] [CrossRef]
- Weiss, M.; Jacob, F.; Duveiller, G. Remote sensing for agricultural applications: A meta-review. Remote Sens. Environ. 2020, 236, 111402. [Google Scholar] [CrossRef]
- Benami, E.; Jin, Z.; Carter, M.R.; Ghosh, A.; Hijmans, R.J.; Hobbs, A.; Kenduiywo, B.; Lobell, D.B. Uniting remote sensing, crop modelling and economics for agricultural risk management. Nat. Rev. Earth Environ. 2021, 1–20. [Google Scholar] [CrossRef]
- Vihervaara, P.; Auvinen, A.P.; Mononen, L.; Törmä, M.; Ahlroth, P.; Anttila, S.; Böttcher, K.; Forsius, M.; Heino, J.; Heliölä, J.; et al. How essential biodiversity variables and remote sensing can help national biodiversity monitoring. Glob. Ecol. Conserv. 2017, 10, 43–59. [Google Scholar] [CrossRef]
- Wang, R.; Gamon, J.A. Remote sensing of terrestrial plant biodiversity. Remote Sens. Environ. 2019, 231, 111218. [Google Scholar] [CrossRef]
- Arastounia, M. Automated recognition of railroad infrastructure in rural areas from LiDAR data. Remote Sens. 2015, 7, 14916–14938. [Google Scholar] [CrossRef]
- Chrysoulakis, N.; Grimmond, S.; Feigenwinter, C.; Lindberg, F.; Gastellu-Etchegorry, J.P.; Marconcini, M.; Mitraka, Z.; Stagakis, S.; Crawford, B.; Olofson, F.; et al. Urban energy exchanges monitoring from space. Sci. Rep. 2018, 8, 1–8. [Google Scholar] [CrossRef] [PubMed]
- Chen, Y.; Han, D. Water quality monitoring in smart city: A pilot project. Autom. Constr. 2018, 89, 307–316. [Google Scholar] [CrossRef]
- Salam, A. Internet of Things for Sustainable Community Development; Springer: Berlin/Heidelberg, Germany, 2020. [Google Scholar]
- Zhang, Y.; Lu, Y.; Zhang, D.; Shang, L.; Wang, D. Risksens: A multi-view learning approach to identifying risky traffic locations in intelligent transportation systems using social and remote sensing. In Proceedings of the 2018 IEEE International Conference on Big Data (Big Data), Seattle, WA, USA, 10–13 December 2018; pp. 1544–1553. [Google Scholar]
- Pérez, J.A.; Gonçalves, G.R.; Rangel, J.M.G.; Ortega, P.F. Accuracy and effectiveness of orthophotos obtained from low cost UASs video imagery for traffic accident scenes documentation. Adv. Eng. Softw. 2019, 132, 47–54. [Google Scholar] [CrossRef]
- Sohn, S.Y.; Lee, S.H. Data fusion, ensemble and clustering to improve the classification accuracy for the severity of road traffic accidents in Korea. Saf. Sci. 2003, 41, 1–14. [Google Scholar] [CrossRef]
- Pu, Q.; Yoo, E.H.; Rothstein, D.H.; Cairo, S.; Malemo, L. Improving the spatial accessibility of healthcare in North Kivu, Democratic Republic of Congo. Appl. Geogr. 2020, 121, 102262. [Google Scholar] [CrossRef]
- World Health Organisation, United Nations Children Fund. State of the World’s Vaccines and Immunisation; Technical Report; World Health Organisation: Geneva, Switzerland, 2009. [Google Scholar]
- Walter, T.F. The Spatial Distribution of Health Services in Zambia; IGC: London, UK, 2018. [Google Scholar]
- Song, Y.; Ge, Y.; Wang, J.; Ren, Z.; Liao, Y.; Peng, J. Spatial distribution estimation of malaria in northern China and its scenarios in 2020, 2030, 2040 and 2050. Malar. J. 2016, 15, 1–16. [Google Scholar] [CrossRef]
- Adimi, F.; Soebiyanto, R.P.; Safi, N.; Kiang, R. Towards malaria risk prediction in Afghanistan using remote sensing. Malar. J. 2010, 9, 1–11. [Google Scholar] [CrossRef]
- Hay, S.I.; Snow, R.W. The Malaria Atlas Project: Developing Global Maps of Malaria Risk. PLoS Med. 2006, 3, e473. [Google Scholar] [CrossRef] [PubMed]
- Queiroz, M.V.A.B.; Sampaio, R.M.B.; Sampaio, L.M.B. Dynamic efficiency of primary education in Brazil: Socioeconomic and infrastructure influence on school performance. Socio-Econ. Plan. Sci. 2020, 70, 100738. [Google Scholar] [CrossRef]
- Ergüzen, A.; Erdal, E.; Ünver, M.; Özcan, A. Improving Technological Infrastructure of Distance Education through Trustworthy Platform-Independent Virtual Software Application Pools. Appl. Sci. 2021, 11, 1214. [Google Scholar] [CrossRef]
- Chaklader, S.; Alam, J.; Islam, M.; Sabbir, A.S. Bridging Digital Divide: ‘Village wireless LAN’, a low cost network infrastructure solution for digital communication, information dissemination & education in rural Bangladesh. In Proceedings of the 2013 2nd International Conference on Advances in Electrical Engineering (ICAEE), Dkaka, Bangladesh, 19–21 December 2013; pp. 277–281. [Google Scholar]
- Briceno, C.; Estache, A.; Shafik, N.T. Infrastructure Services in Developing Countries: Access, Quality, Costs, and Policy Reform; The World Bank: Washington, DC, USA, 2004. [Google Scholar]
- Bussemakers, C.; van Oosterhout, K.; Kraaykamp, G.; Spierings, N. Women’s worldwide education–employment connection: A multilevel analysis of the moderating impact of economic, political, and cultural contexts. World Dev. 2017, 99, 28–41. [Google Scholar] [CrossRef]
- Qi, B.; Wang, X.; Sutton, P. Can Nighttime Satellite Imagery Inform Our Understanding of Education Inequality? Remote Sens. 2021, 13, 843. [Google Scholar] [CrossRef]
- Asbury, Z.; Aly, M.H. A geospatial study of the drought impact on surface water reservoirs: Study cases from Texas, USA. GISci. Remote Sens. 2019, 56, 894–910. [Google Scholar] [CrossRef]
- Mulligan, M.; van Soesbergen, A.; Hole, D.G.; Brooks, T.M.; Burke, S.; Hutton, J. Mapping nature’s contribution to SDG 6 and implications for other SDGs at policy relevant scales. Remote Sens. Environ. 2020, 239, 111671. [Google Scholar] [CrossRef]
- Hsu, T.T.D.; Mitsch, W.J.; Martin, J.F.; Lee, J. Towards sustainable protection of public health: The role of an urban wetland as a frontline safeguard of pathogen and antibiotic resistance spread. Ecol. Eng. 2017, 108, 547–555. [Google Scholar] [CrossRef]
- Masoud, A.A. Renewable energy and water sustainability: Lessons learnt from TUISR19. Environ. Sci. Pollut. Res. 2020, 27, 32153–32156. [Google Scholar] [CrossRef]
- Abdelwahab, S.; Hamdaoui, B.; Guizani, M.; Rayes, A. Enabling smart cloud services through remote sensing: An internet of everything enabler. IEEE Internet Things J. 2014, 1, 276–288. [Google Scholar] [CrossRef]
- Valbuena, R.; Hernando, A.; Manzanera, J.A.; Görgens, E.B.; Almeida, D.R.; Silva, C.A.; García-Abril, A. Evaluating observed versus predicted forest biomass: R-squared, index of agreement or maximal information coefficient? Eur. J. Remote Sens. 2019, 52, 345–358. [Google Scholar] [CrossRef]
- Duren, R.M.; Miller, C.E. Measuring the carbon emissions of megacities. Nat. Clim. Chang. 2012, 2, 560–562. [Google Scholar] [CrossRef]
- Wang, G.; Han, Q.; de Vries, B. A geographic carbon emission estimating framework on the city scale. J. Clean. Prod. 2020, 244, 118793. [Google Scholar] [CrossRef]
- Habib, S.M.; Suliman, A.E.R.E.; Al Nahry, A.H.; Abd El Rahman, E.N. Spatial modeling for the optimum site selection of solar photovoltaics power plant in the northwest coast of Egypt. Remote Sens. Appl. Soc. Environ. 2020, 18, 100313. [Google Scholar] [CrossRef]
- Gašparović, I.; Gašparović, M. Determining optimal solar power plant locations based on remote sensing and GIS methods: A case study from Croatia. Remote Sens. 2019, 11, 1481. [Google Scholar] [CrossRef]
- Jangid, J.; Bera, A.K.; Joseph, M.; Singh, V.; Singh, T.; Pradhan, B.; Das, S. Potential zones identification for harvesting wind energy resources in desert region of India—A multi criteria evaluation approach using remote sensing and GIS. Renew. Sustain. Energy Rev. 2016, 65, 1–10. [Google Scholar] [CrossRef]
- Li, G.; Weng, Q. Measuring the quality of life in city of Indianapolis by integration of remote sensing and census data. Int. J. Remote Sens. 2007, 28, 249–267. [Google Scholar] [CrossRef]
- Field, C.B.; Randerson, J.T.; Malmström, C.M. Global net primary production: Combining ecology and remote sensing. Remote Sens. Environ. 1995, 51, 74–88. [Google Scholar] [CrossRef]
- Nelson, M.; Odum, H.; Brown, M.; Alling, A. “Living off the land”: Resource efficiency of wetland wastewater treatment. Adv. Space Res. 2001, 27, 1547–1556. [Google Scholar] [CrossRef]
- Ilie, C.M.; Brovelli, M.A.; Coetzee, S. Monitoring SDG 9 with global open data and open software—A case study from rural Tanzania. In Proceedings of the ISPRS Geospatial Week 2019, Enschede, The Netherlands, 10–14 June 2019; Volume 42, pp. 1551–1558. [Google Scholar]
- Jia, Z.; Wu, M.; Niu, Z.; Tang, B.; Mu, Y. Monitoring of UN sustainable development goal SDG-9.1. 1: Study of Algerian “Belt and Road” expressways constructed by China. PeerJ 2020, 8, e8953. [Google Scholar] [CrossRef]
- Arowosafe, O.; Ceranic, B.; Dean, A. A sustainable infrastructure delivery model: Value added strategy in the Nigerian construction industry. In Proceedings of the 31st Annual ARCOM Conference, Lincoln, UK, 7–9 September 2015. [Google Scholar]
- Chatterjee, S.; Turnovsky, S.J. Infrastructure and inequality. Eur. Econ. Rev. 2012, 56, 1730–1745. [Google Scholar] [CrossRef]
- Zolfaghari, M.; Kabiri, M.; Saadatmanesh, H. Impact of socio-economic infrastructure investments on income inequality in Iran. J. Policy Model. 2020, 42, 1146–1168. [Google Scholar] [CrossRef]
- Yang, F.; Zhang, S.; Sun, C. Energy infrastructure investment and regional inequality: Evidence from China’s power grid. Sci. Total Environ. 2020, 749, 142384. [Google Scholar] [CrossRef]
- Medeiros, V.; Ribeiro, R.S.M.; do Amaral, P.V.M. Infrastructure and household poverty in Brazil: A regional approach using multilevel models. World Dev. 2021, 137, 105118. [Google Scholar] [CrossRef]
- Wu, R.; Yang, D.; Dong, J.; Zhang, L.; Xia, F. Regional inequality in China based on NPP-VIIRS night-time light imagery. Remote Sens. 2018, 10, 240. [Google Scholar] [CrossRef]
- Wu, S.S.; Qiu, X.; Wang, L. Population estimation methods in GIS and remote sensing: A review. GISci. Remote Sens. 2005, 42, 80–96. [Google Scholar] [CrossRef]
- Jensen, J.R.; Cowen, D.C. Remote sensing of urban/suburban infrastructure and socio-economic attributes. Photogramm. Eng. Remote Sens. 1999, 65, 611–622. [Google Scholar]
- Warth, G.; Braun, A.; Assmann, O.; Fleckenstein, K.; Hochschild, V. Prediction of socio-economic indicators for urban planning using VHR satellite imagery and spatial analysis. Remote Sens. 2020, 12, 1730. [Google Scholar] [CrossRef]
- Wang, L.; Diao, C.; Xian, G.; Yin, D.; Lu, Y.; Zou, S.; Erickson, T.A. A summary of the special issue on remote sensing of land change science with Google earth engine. Remote Sens. Environ. 2020, 248, 112002. [Google Scholar] [CrossRef]
- Levin, N.; Kyba, C.C.; Zhang, Q.; de Miguel, A.S.; Román, M.O.; Li, X.; Portnov, B.A.; Molthan, A.L.; Jechow, A.; Miller, S.D.; et al. Remote sensing of night lights: A review and an outlook for the future. Remote Sens. Environ. 2020, 237, 111443. [Google Scholar] [CrossRef]
- Elfadaly, A.; Lasaponara, R. Cultural heritage management using remote sensing data and GIS techniques around the archaeological area of ancient Jeddah in Jeddah City, Saudi Arabia. Sustainability 2020, 12, 240. [Google Scholar] [CrossRef]
- Ulvi, A. Documentation, Three-Dimensional (3D) Modelling and visualization of cultural heritage by using Unmanned Aerial Vehicle (UAV) photogrammetry and terrestrial laser scanners. Int. J. Remote Sens. 2021, 42, 1994–2021. [Google Scholar] [CrossRef]
- Trier, Ø.D.; Reksten, J.H.; Løseth, K. Automated mapping of cultural heritage in Norway from airborne lidar data using faster R-CNN. Int. J. Appl. Earth Obs. Geoinf. 2021, 95, 102241. [Google Scholar] [CrossRef]
- Guo, H.; Liu, L.; Lei, L.; Wu, Y.; Li, L.; Zhang, B.; Zuo, Z.; Li, Z. Dynamic analysis of the Wenchuan Earthquake disaster and reconstruction with 3-year remote sensing data. Int. J. Digit. Earth 2010, 3, 355–364. [Google Scholar] [CrossRef]
- Tralli, D.M.; Blom, R.G.; Zlotnicki, V.; Donnellan, A.; Evans, D.L. Satellite remote sensing of earthquake, volcano, flood, landslide and coastal inundation hazards. ISPRS J. Photogramm. Remote Sens. 2005, 59, 185–198. [Google Scholar] [CrossRef]
- Wicht, M.; Kuffer, M. The continuous built-up area extracted from ISS night-time lights to compare the amount of urban green areas across European cities. Eur. J. Remote Sens. 2019, 52, 58–73. [Google Scholar] [CrossRef]
- Helbich, M.; Yao, Y.; Liu, Y.; Zhang, J.; Liu, P.; Wang, R. Using deep learning to examine street view green and blue spaces and their associations with geriatric depression in Beijing, China. Environ. Int. 2019, 126, 107–117. [Google Scholar] [CrossRef]
- Lu, Y. Using Google Street View to investigate the association between street greenery and physical activity. Landsc. Urban Plan. 2019, 191, 103435. [Google Scholar] [CrossRef]
- Verbyla, D.L. Satellite Remote Sensing of Natural Resources; CRC Press: Boca Raton, FL, USA, 1995; Volume 4. [Google Scholar]
- Pettorelli, N. Satellite Remote Sensing and the Management of Natural Resources; Oxford University Press: Oxford, UK, 2019. [Google Scholar]
- Singh, A. Remote sensing and GIS applications for municipal waste management. J. Environ. Manag. 2019, 243, 22–29. [Google Scholar] [CrossRef]
- Al-Hanbali, A.; Alsaaideh, B.; Kondoh, A. Using GIS-based weighted linear combination analysis and remote sensing techniques to select optimum solid waste disposal sites within Mafraq City, Jordan. J. Geogr. Inf. Syst. 2011, 3, 267. [Google Scholar] [CrossRef]
- Cusworth, D.H.; Duren, R.M.; Thorpe, A.K.; Tseng, E.; Thompson, D.; Guha, A.; Newman, S.; Foster, K.T.; Miller, C.E. Using remote sensing to detect, validate, and quantify methane emissions from California solid waste operations. Environ. Res. Lett. 2020, 15, 5. [Google Scholar] [CrossRef]
- Wei, L.; Zhang, Y.; Zhao, Z.; Zhong, X.; Liu, S.; Mao, Y.; Li, J. Analysis of mining waste dump site stability based on multiple remote sensing technologies. Remote Sens. 2018, 10, 2025. [Google Scholar] [CrossRef]
- Yang, H.; Ma, M.; Thompson, J.R.; Flower, R.J. Waste management, informal recycling, environmental pollution and public health. J. Epidemiol. Community Health 2018, 72, 237–243. [Google Scholar] [CrossRef]
- Scarlat, N.; Motola, V.; Dallemand, J.F.; Monforti-Ferrario, F.; Mofor, L. Evaluation of energy potential of municipal solid waste from African urban areas. Renew. Sustain. Energy Rev. 2015, 50, 1269–1286. [Google Scholar] [CrossRef]
- Xiao, H.; Tang, Z.; Tan, Y.; Yi, L. The Spatial Distribution and Potential for Energy Recovery of Urban-Rural Wastes in Guangdong Province, Southern China. In IOP Conference Series: Earth and Environmental Science; IOP Publishing: Bristol, UK, 2020; Volume 555, p. 1. [Google Scholar]
- Tanguy, A.; Glaus, M.; Laforest, V.; Villot, J.; Hausler, R. A spatial analysis of hierarchical waste transport structures under growing demand. Waste Manag. Res. 2016, 34, 1064–1073. [Google Scholar] [CrossRef]
- van Zalk, J.; Behrens, P. The spatial extent of renewable and non-renewable power generation: A review and meta-analysis of power densities and their application in the US. Energy Policy 2018, 123, 83–91. [Google Scholar] [CrossRef]
- Yang, J.; Gong, P.; Fu, R.; Zhang, M.; Chen, J.; Liang, S.; Xu, B.; Shi, J.; Dickinson, R. The role of satellite remote sensing in climate change studies. Nat. Clim. Chang. 2013, 3, 875–883. [Google Scholar] [CrossRef]
- Kelman, I.; West, J.J. Climate change and small island developing states: A critical review. Ecol. Environ. Anthropol. 2009, 5, 1–16. [Google Scholar]
- Clark, C.D. Satellite remote sensing of marine pollution. Int. J. Remote Sens. 1993, 14, 2985–3004. [Google Scholar] [CrossRef]
- Hafeez, S.; Wong, M.S.; Abbas, S.; Kwok, C.Y.T.; Nichol, J.; Lee, K.H.; Tang, D.; Pun, L. Detection and monitoring of marine pollution using remote sensing technologies. In Monitoring of Marine Pollution; Books on Demand: Norderstedt, Germany, 2018. [Google Scholar]
- Davaasuren, N.; Marino, A.; Boardman, C.; Alparone, M.; Nunziata, F.; Ackermann, N.; Hajnsek, I. Detecting microplastics pollution in world oceans using SAR remote sensing. In Proceedings of the IGARSS, Valencia, Spain, 22–27 July 2018; pp. 938–941. [Google Scholar]
- McCarthy, M.J.; Colna, K.E.; El-Mezayen, M.M.; Laureano-Rosario, A.E.; Méndez-Lázaro, P.; Otis, D.B.; Toro-Farmer, G.; Vega-Rodriguez, M.; Muller-Karger, F.E. Satellite remote sensing for coastal management: A review of successful applications. Environ. Manag. 2017, 60, 323–339. [Google Scholar] [CrossRef] [PubMed]
- Zhou, W.; Yang, H.; Huang, L.; Chen, C.; Lin, X.; Hu, Z.; Li, J. Grassland degradation remote sensing monitoring and driving factors quantitative assessment in China from 1982 to 2010. Ecol. Indic. 2017, 83, 303–313. [Google Scholar] [CrossRef]
- Mitchell, A.L.; Rosenqvist, A.; Mora, B. Current remote sensing approaches to monitoring forest degradation in support of countries measurement, reporting and verification (MRV) systems for REDD+. Carbon Balance Manag. 2017, 12, 1–22. [Google Scholar] [CrossRef] [PubMed]
- Shen, G.; Yang, X.; Jin, Y.; Xu, B.; Zhou, Q. Remote sensing and evaluation of the wetland ecological degradation process of the Zoige Plateau Wetland in China. Ecol. Indic. 2019, 104, 48–58. [Google Scholar] [CrossRef]
- Huang, T.; Zhou, L.; Zhou, M. Key Technologies and Applications of Wild Animal Satellite Tracking. In Journal of Physics: Conference Series; IOP Publishing: Bristol, UK, 2021; Volume 1757, p. 1. [Google Scholar]
- Linchant, J.; Lisein, J.; Semeki, J.; Lejeune, P.; Vermeulen, C. Are unmanned aircraft systems (UAS s) the future of wildlife monitoring? A review of accomplishments and challenges. Mammal Rev. 2015, 45, 239–252. [Google Scholar] [CrossRef]
- Peterson, R.D.; Krivo, L.J. Divergent Social Worlds: Neighborhood Crime and the Racial-Spatial Divide; Russell Sage Foundation: New York, NY, USA, 2010. [Google Scholar]
- Gorman, D.M.; Speer, P.W.; Gruenewald, P.J.; Labouvie, E.W. Spatial dynamics of alcohol availability, neighborhood structure and violent crime. J. Stud. Alcohol 2001, 62, 628–636. [Google Scholar] [CrossRef]
- Lilford, R.; Kyobutungi, C.; Ndugwa, R.; Sartori, J.; Watson, S.I.; Sliuzas, R.; Kuffer, M.; Hofer, T.; de Albuquerque, J.P.; Ezeh, A. Because space matters: Conceptual framework to help distinguish slum from non-slum urban areas. BMJ Glob. Health 2019, 4, e001267. [Google Scholar] [CrossRef]
- Friesen, J.; Friesen, V.; Dietrich, I.; Pelz, P.F. Slums, space, and state of health—A link between settlement morphology and health data. Int. J. Environ. Res. Public Health 2020, 17, 2022. [Google Scholar] [CrossRef]
- Kuffer, M.; Thomson, D.R.; Boo, G.; Mahabir, R.; Grippa, T.; Vanhuysse, S.; Engstrom, R.; Ndugwa, R.; Makau, J.; Darin, E.; et al. The role of earth observation in an integrated deprived area mapping “System” for low-to-middle income countries. Remote Sens. 2020, 12, 982. [Google Scholar] [CrossRef]
- Tonne, C.; Adair, L.; Adlakha, D.; Anguelovski, I.; Belesova, K.; Berger, M.; Brelsford, C.; Dadvand, P.; Dimitrova, A.; Giles-Corti, B.; et al. Defining pathways to healthy sustainable urban development. Environ. Int. 2021, 146, 106236. [Google Scholar] [CrossRef]
- Aquilino, M.; Tarantino, C.; Adamo, M.; Barbanente, A.; Blonda, P. Earth Observation for the Implementation of Sustainable Development Goal 11 Indicators at Local Scale: Monitoring of the Migrant Population Distribution. Remote Sens. 2020, 12, 950. [Google Scholar] [CrossRef]
- Kuffer, M.; Wang, J.; Nagenborg, M.; Pfeffer, K.; Kohli, D.; Sliuzas, R.; Persello, C. The scope of earth-observation to improve the consistency of the SDG slum indicator. ISPRS Int. J. Geo-Inf. 2018, 7, 428. [Google Scholar] [CrossRef]
- Wang, Y.; Huang, C.; Feng, Y.; Zhao, M.; Gu, J. Using Earth Observation for Monitoring SDG 11.3. 1-Ratio of Land Consumption Rate to Population Growth Rate in Mainland China. Remote Sens. 2020, 12, 357. [Google Scholar] [CrossRef]
- Li, C.; Cai, G.; Du, M. Big Data Supported the Identification of Urban Land Efficiency in Eurasia by Indicator SDG 11.3. 1. ISPRS Int. J. Geo-Inf. 2021, 10, 64. [Google Scholar] [CrossRef]
- Melchiorri, M.; Pesaresi, M.; Florczyk, A.J.; Corbane, C.; Kemper, T. Principles and applications of the global human settlement layer as baseline for the land use efficiency indicator—SDG 11.3. 1. ISPRS Int. J. Geo-Inf. 2019, 8, 96. [Google Scholar] [CrossRef]
- Cai, G.; Zhang, J.; Du, M.; Li, C.; Peng, S. Identification of urban land use efficiency by indicator-SDG 11.3. 1. PLoS ONE 2020, 15, e0244318. [Google Scholar] [CrossRef] [PubMed]
- Schiavina, M.; Melchiorri, M.; Corbane, C.; Florczyk, A.J.; Freire, S.; Pesaresi, M.; Kemper, T. Multi-scale estimation of land use efficiency (SDG 11.3. 1) across 25 years using global open and free data. Sustainability 2019, 11, 5674. [Google Scholar] [CrossRef]
- Estache, A. Infrastructure: A Survey of Recent and Upcoming Issues; World Bank Mimeo: Washington, DC, USA, 2006. [Google Scholar]
- Estache, A.; Garsous, G. The Impact of Infrastructure on Growth in Developing Countries; IFC Economics Notes; IFC: Washington, DC, USA, 2012; Volume 1. [Google Scholar]
- Song, Y.; Wang, J.; Ge, Y.; Xu, C. An optimal parameters-based geographical detector model enhances geographic characteristics of explanatory variables for spatial heterogeneity analysis: Cases with different types of spatial data. GISci. Remote Sens. 2020, 57, 593–610. [Google Scholar] [CrossRef]
- Alves, A.; Gersonius, B.; Kapelan, Z.; Vojinovic, Z.; Sanchez, A. Assessing the Co-Benefits of green-blue-grey infrastructure for sustainable urban flood risk management. J. Environ. Manag. 2019, 239, 244–254. [Google Scholar] [CrossRef]
- Raei, E.; Alizadeh, M.R.; Nikoo, M.R.; Adamowski, J. Multi-objective decision-making for green infrastructure planning (LID-BMPs) in urban storm water management under uncertainty. J. Hydrol. 2019, 579, 124091. [Google Scholar] [CrossRef]
- Zhang, H.; Deng, Q. Deep learning based fossil-fuel power plant monitoring in high resolution remote sensing images: A comparative study. Remote Sens. 2019, 11, 1117. [Google Scholar] [CrossRef]
- Bovensmann, H.; Buchwitz, M.; Burrows, J.; Reuter, M.; Krings, T.; Gerilowski, K.; Schneising, O.; Heymann, J.; Tretner, A.; Erzinger, J. A remote sensing technique for global monitoring of power plant CO2 emissions from space and related applications. Atmos. Meas. Tech. 2010, 3, 781–811. [Google Scholar] [CrossRef]
- Coskun, H.G.; Alganci, U.; Eris, E.; Agıralioglu, N.; Cigizoglu, H.K.; Yilmaz, L.; Toprak, Z.F. Remote sensing and GIS innovation with hydrologic modelling for hydroelectric power plant (HPP) in poorly gauged basins. Water Resour. Manag. 2010, 24, 3757–3772. [Google Scholar] [CrossRef]
- Chamanehpour, E. Site selection of wind power plant using multi-criteria decision-making methods in GIS: A case study. Comput. Ecol. Softw. 2017, 7, 49. [Google Scholar]
- Chen, C.; Shi, P.; Mao, Q. Application of remote sensing techniques for monitoring the thermal pollution of cooling-water discharge from nuclear power plant. J. Environ. Sci. Health Part A 2003, 38, 1659–1668. [Google Scholar] [CrossRef] [PubMed]
- Tang, D.; Kester, D.R.; Wang, Z.; Lian, J.; Kawamura, H. AVHRR satellite remote sensing and shipboard measurements of the thermal plume from the Daya Bay, nuclear power station, China. Remote Sens. Environ. 2003, 84, 506–515. [Google Scholar] [CrossRef]
- Calvert, K.; Pearce, J.M.; Mabee, W.E. Toward renewable energy geo-information infrastructures: Applications of GIScience and remote sensing that build institutional capacity. Renew. Sustain. Energy Rev. 2013, 18, 416–429. [Google Scholar] [CrossRef]
- Giuliani, G.; Petri, E.; Interwies, E.; Vysna, V.; Guigoz, Y.; Ray, N.; Dickie, I. Modelling Accessibility to Urban Green Areas Using Open Earth Observations Data: A Novel Approach to Support the Urban SDG in Four European Cities. Remote Sens. 2021, 13, 422. [Google Scholar] [CrossRef]
- Song, Y.; Fu, L. Do charitable foundations spend money where people need it most? A spatial analysis of China. ISPRS Int. J. Geo-Inf. 2018, 7, 100. [Google Scholar] [CrossRef]
- Kumar, D.; Singh, R.; Kaur, R. SDG 9: Case Study–Infrastructure Assessment for Sustainable Development. In Spatial Information Technology for Sustainable Development Goals; Springer: Berlin/Heidelberg, Germany, 2019; pp. 157–167. [Google Scholar]
- Song, Y.; Wu, P.; Gilmore, D.; Li, Q. A Spatial Heterogeneity-Based Segmentation Model for Analyzing Road Deterioration Network Data in Multi-Scale Infrastructure Systems. IEEE Trans. Intell. Transp. Syst. 2020. [Google Scholar] [CrossRef]
- Song, Y.; Wu, P. An Interactive Detector for Spatial Associations. Int. J. Geogr. Inf. Sci. 2021. [Google Scholar] [CrossRef]
- Delanka-Pedige, H.; Munasinghe-Arachchige, S.; Abeysiriwardana-Arachchige, I.; Nirmalakhandan, N. Wastewater infrastructure for sustainable cities: Assessment based on UN sustainable development goals (SDGs). Int. J. Sustain. Dev. World Ecol. 2020, 1–7. [Google Scholar] [CrossRef]
- Zhang, Q.; Liu, S.; Wang, T.; Dai, X.; Baninla, Y.; Nakatani, J.; Moriguchi, Y. Urbanization impacts on greenhouse gas (GHG) emissions of the water infrastructure in China: Trade-offs among sustainable development goals (SDGs). J. Clean. Prod. 2019, 232, 474–486. [Google Scholar] [CrossRef]
- Petrova-Antonova, D.; Sylvia, I. Methodological framework for digital transition and performance assessment of smart cities. In Proceedings of the 2019 4th International Conference on Smart and Sustainable Technologies (SpliTech), Split, Croatia, 18–21 June 2019; pp. 1–4. [Google Scholar]
- Sudmanns, M.; Tiede, D.; Lang, S.; Bergstedt, H.; Trost, G.; Augustin, H.; Baraldi, A.; Blaschke, T. Big Earth data: Disruptive changes in Earth observation data management and analysis? Int. J. Digit. Earth 2020, 13, 832–850. [Google Scholar] [CrossRef] [PubMed]
- Shao, Z.; Sumari, N.S.; Portnov, A.; Ujoh, F.; Musakwa, W.; Mandela, P.J. Urban sprawl and its impact on sustainable urban development: A combination of remote sensing and social media data. Geo-Spat. Inf. Sci. 2020, 1–15. [Google Scholar] [CrossRef]
- Yu, B.; Shi, K.; Hu, Y.; Huang, C.; Chen, Z.; Wu, J. Poverty evaluation using NPP-VIIRS nighttime light composite data at the county level in China. IEEE J. Sel. Top. Appl. Earth Obs. Remote Sens. 2015, 8, 1217–1229. [Google Scholar] [CrossRef]
- Elvidge, C.D.; Sutton, P.C.; Ghosh, T.; Tuttle, B.T.; Baugh, K.E.; Bhaduri, B.; Bright, E. A global poverty map derived from satellite data. Comput. Geosci. 2009, 35, 1652–1660. [Google Scholar] [CrossRef]
- Jean, N.; Burke, M.; Xie, M.; Davis, W.M.; Lobell, D.B.; Ermon, S. Combining satellite imagery and machine learning to predict poverty. Science 2016, 353, 790–794. [Google Scholar] [CrossRef] [PubMed]
- Gorelick, N.; Hancher, M.; Dixon, M.; Ilyushchenko, S.; Thau, D.; Moore, R. Google Earth Engine: Planetary-scale geospatial analysis for everyone. Remote Sens. Environ. 2017, 202, 18–27. [Google Scholar] [CrossRef]
- Tamiminia, H.; Salehi, B.; Mahdianpari, M.; Quackenbush, L.; Adeli, S.; Brisco, B. Google Earth Engine for geo-big data applications: A meta-analysis and systematic review. ISPRS J. Photogramm. Remote Sens. 2020, 164, 152–170. [Google Scholar] [CrossRef]
- Tiwari, V.; Kumar, V.; Matin, M.A.; Thapa, A.; Ellenburg, W.L.; Gupta, N.; Thapa, S. Flood inundation mapping-Kerala 2018; Harnessing the power of SAR, automatic threshold detection method and Google Earth Engine. PLoS ONE 2020, 15, e0237324. [Google Scholar] [CrossRef]
- Ravanelli, R.; Nascetti, A.; Cirigliano, R.V.; Di Rico, C.; Leuzzi, G.; Monti, P.; Crespi, M. Monitoring the impact of land cover change on surface urban heat island through Google Earth Engine: Proposal of a global methodology, first applications and problems. Remote Sens. 2018, 10, 1488. [Google Scholar] [CrossRef]
- Li, Q.; Qiu, C.; Ma, L.; Schmitt, M.; Zhu, X.X. Mapping the land cover of Africa at 10 m resolution from multi-source remote sensing data with Google Earth Engine. Remote Sens. 2020, 12, 602. [Google Scholar] [CrossRef]
- Tsai, Y.H.; Stow, D.; Chen, H.L.; Lewison, R.; An, L.; Shi, L. Mapping vegetation and land use types in fanjingshan national nature reserve using google earth engine. Remote Sens. 2018, 10, 927. [Google Scholar] [CrossRef]
- Scheip, C.M.; Wegmann, K.W. HazMapper: A global open-source natural hazard mapping application in Google Earth Engine. Nat. Hazards Earth Syst. Sci. Discuss. 2020, 1–25. [Google Scholar] [CrossRef]
- Mansell, P.; Philbin, S.P.; Broyd, T.; Nicholson, I. Assessing the impact of infrastructure projects on global sustainable development goals. In Proceedings of the Institution of Civil Engineers-Engineering Sustainability; Thomas Telford Ltd.: London, UK, 2019; Volume 173, pp. 196–212. [Google Scholar]
- Mansell, P.; Philbin, S.P.; Konstantinou, E. Delivering UN Sustainable Development Goals’ Impact on Infrastructure Projects: An Empirical Study of Senior Executives in the UK Construction Sector. Sustainability 2020, 12, 7998. [Google Scholar] [CrossRef]
- Hallegatte, S. Storm damages and inter-city trade. Nat. Sustain. 2020, 1–2. [Google Scholar] [CrossRef]
- Petrova, E. Natural hazard impacts on transport infrastructure in Russia. Nat. Hazards Earth Syst. Sci. 2020, 20, 1969–1983. [Google Scholar] [CrossRef]
- Achillopoulou, D.V.; Mitoulis, S.A.; Argyroudis, S.A.; Wang, Y. Monitoring of transport infrastructure exposed to multiple hazards: A roadmap for building resilience. Sci. Total Environ. 2020, 746, 141001. [Google Scholar] [CrossRef] [PubMed]
- Qiang, Y.; Huang, Q.; Xu, J. Observing community resilience from space: Using nighttime lights to model economic disturbance and recovery pattern in natural disaster. Sustain. Cities Soc. 2020, 57, 102115. [Google Scholar] [CrossRef]
- Kumar, N. Closing the Gaps in Social and Physical Infrastructure for Achieving Sustainable Development Goals in Asia and the Pacific. Millenn. Asia 2019, 10, 372–394. [Google Scholar] [CrossRef]
- Gurara, D.; Klyuev, V.; Mwase, N.; Presbitero, A.F. Trends and challenges in infrastructure investment in developing countries. Int. Dev. Policy Rev. Int. Polit. Dév. 2018. [Google Scholar] [CrossRef]
- Fuldauer, L.I.; Ives, M.C.; Adshead, D.; Thacker, S.; Hall, J.W. Participatory planning of the future of waste management in small island developing states to deliver on the Sustainable Development Goals. J. Clean. Prod. 2019, 223, 147–162. [Google Scholar] [CrossRef]
- Contreras, C. Creating a Common Language: How Does the Sustainable Infrastructure Criteria Compare to the SDGs? In Proceedings of the International Conference on Sustainable Infrastructure 2019: Leading Resilient Communities through the 21st Century. American Society of Civil Engineers, Reston, VA, USA, 11–13 June 2019; pp. 671–688. [Google Scholar]
- Adshead, D.; Thacker, S.; Fuldauer, L.I.; Hall, J.W. Delivering on the Sustainable Development Goals through long-term infrastructure planning. Glob. Environ. Chang. 2019, 59, 101975. [Google Scholar] [CrossRef]
- Merry, S.E. The Sustainable Development Goals confront the infrastructure of measurement. Glob. Policy 2019, 10, 146–148. [Google Scholar] [CrossRef]


Publisher’s Note: MDPI stays neutral with regard to jurisdictional claims in published maps and institutional affiliations. |
© 2021 by the authors. Licensee MDPI, Basel, Switzerland. This article is an open access article distributed under the terms and conditions of the Creative Commons Attribution (CC BY) license (https://creativecommons.org/licenses/by/4.0/).
Share and Cite
Song, Y.; Wu, P. Earth Observation for Sustainable Infrastructure: A Review. Remote Sens. 2021, 13, 1528. https://doi.org/10.3390/rs13081528
Song Y, Wu P. Earth Observation for Sustainable Infrastructure: A Review. Remote Sensing. 2021; 13(8):1528. https://doi.org/10.3390/rs13081528
Chicago/Turabian StyleSong, Yongze, and Peng Wu. 2021. "Earth Observation for Sustainable Infrastructure: A Review" Remote Sensing 13, no. 8: 1528. https://doi.org/10.3390/rs13081528
APA StyleSong, Y., & Wu, P. (2021). Earth Observation for Sustainable Infrastructure: A Review. Remote Sensing, 13(8), 1528. https://doi.org/10.3390/rs13081528