Article

R-DFS: A Coverage Path Planning Approach Based on Region Optimal Decomposition

1
Logistics Engineering College, Shanghai Maritime University, Shanghai 201306, China
2
Naval Academy Research Institute, F-29240 Lanvéoc, France
3
School of Medical Information Engineering, Guangzhou University of Chinese Medicine, Guangzhou 510006, China
*
Author to whom correspondence should be addressed.
Remote Sens. 2021, 13(8), 1525; https://doi.org/10.3390/rs13081525
Submission received: 7 January 2021 / Revised: 25 March 2021 / Accepted: 29 March 2021 / Published: 15 April 2021

Abstract

:
Most Coverage Path Planning (CPP) strategies based on the minimum width of a concave polygonal area are very likely to generate non-optimal paths with many turns. This paper introduces a CPP method based on a Region Optimal Decomposition (ROD) that overcomes this limitation when applied to the path planning of an Unmanned Aerial Vehicle (UAV) in a port environment. The principle of the approach is to first apply a ROD to a Google Earth image of a port and combining the resulting sub-regions by an improved Depth-First-Search (DFS) algorithm. Finally, a genetic algorithm determines the traversal order of all sub-regions. The simulation experiments show that the combination of ROD and improved DFS algorithm can reduce the number of turns by 4.34%, increase the coverage rate by more than 10%, and shorten the non-working distance by about 29.91%. Overall, the whole approach provides a sound solution for the CPP and operations of UAVs in port environments.

1. Introduction

A multi-rotor Unmanned Aerial Vehicle (UAV) has many advantages, such as small size, high reliability, and hovering [1], and has been widely used in many fields of production, safety, and maintenance operations in many domains, such as agricultural plant protection [2], film and television shooting [3], structure detection [4], and river inspection [5]. Amongst the many tasks an UAV might perform, path planning is an optimization problem that can be divided into two categories. The first one is the common path planning problem from point to point [6], and whose main purpose is to find a collision-free path from the start point to the end point. The second one is coverage path planning (CPP) [7], in which the main task is to search all areas except obstacles in the working area, such as sweeping robots, industrial detection robots, and agricultural robots [8,9,10].
In a wharf yard environment, a full coverage inspection of a given region is regularly performed. As a manual inspection is often time-consuming and the cost of a helicopter inspection too expensive, a valuable option is to use a camera-equipped UAV to conduct a coverage inspection in the port, but this implies to design and implement a sound UAV CPP algorithm [11].
The search for an optimal direction and motion are the two factors largely affecting the design of a CPP. In particular, direction has a greater impact on the UAV energy consumption, while the minimum width is generally used as the basis for selecting the search direction. Current and main methods applied to determine the convex polygon’s minimum width are the rotary caliper [12] and vertex perpendicular methods [13]. The rotating calipers method can quickly obtain the minimum width of a convex polygonal area. However, compared with the vertex perpendicular method, the process of the rotating caliper algorithm is complicated. The CPP motion approaches can be categorized into spiral patterns [14,15], random patterns and Back-and-Forth (BF) patterns [16]. The spiral pattern is only suitable for convex polygonal areas, while the random pattern usually generates more non-appropriate paths that only cover a part of the detection area. While searching for a complete coverage of a port path planning problem, the BF pattern is likely to generate non-optimal paths resulting in a waste of time and energy.
Therefore, this paper introduces a Region Optimal Decomposition (ROD) method to decompose the concave polygonal areas. When applied to a free space decomposition, the ROD method can be categorized into cell decomposition [17,18,19,20,21] and grid algorithms [22,23,24,25]. The algorithms based on a cell decomposition divide a given area into smaller areas, and then cover the resulting cell areas through a safe path. Overall, the principles of a cell decomposition method are relatively straightforward and easy to implement. The grid-based method uses a series of regular grids to decompose a given area but its interest is mainly appropriate in search areas with regular shapes [26]. A recent work suggested a method that divides the search area by the working radius of an unmanned equipment [27].
So far, it appears that most of the coverage algorithms are only applicable to convex polygons, while a concave polygon should be decomposed into multiple convex polygons. For example, a concave polygon can be decomposed into multiple convex polygons using a “top-down” trapezoidal decomposition, but there is a risk of excessive decomposition [28]. Nielsen et al. introduced a new convex decomposition method, which achieved the segmentation of the sub-regions by extending the two edges where the concave corners are located [29], but a larger number of sub-regions is likely to be generated. A Voronoi-based path generation algorithm under the condition that the UAV flight distance is limited has been developed, but this method cannot completely cover the search areas [30]. Huang et al. [31] proposed an MSA decomposition method of minimum height sum to solve the problem that the optimal line sweep decomposition method cannot obtain the minimum number of turns. However, this method uses enumeration to determine the sum of the minimum heights of all sub-regions, which is cumbersome. Li et al. [32] introduced an enhanced exact cellular decomposition method that merges adjacent sub-regions with similar width directions, which greatly reduced the number of sub-region combination schemes. However, decomposing concave polygons parallel to the convex edges generates too many sub-regions. Torres et al. [12] developed a concave and convex decomposition method for concave polygons, which greatly reduces the number of sub-regions, but this method did not consider the minimum number of turns. Overall, most concave polygon decomposition methods cannot solve the problem of the large number of sub-regions and the complex combination of sub-regions.
After decomposing a search area, the next step is to determine the traversal order of the sub-regions. For instance, the bottom of the bridge can be divided according to the risk level, so that genetic algorithms can be used to find a path that can cover the most dangerous area, but this method is only suitable for areas with regular shapes [33]. The Pattern Search (PS), the Genetic Algorithm (GA), and the Particle Swarm Optimization (PSO) performances have been studied and compared for convex and non-convex polygonal areas. The experimental results show that the performance of PS is much better than the other two algorithms, but the overlap ratio of the coverage area has not been considered [34]. The discrete particle swarm optimization algorithm is used to simplify the search problem to the traveling salesman problem (TSP). However, the layout of the camera and the acquisition of features are not described [35].
Overall, most of the above studies did not conduct in-depth research on the decomposition of concave polygonal regions and the merging of sub-regions, nor did they discuss the optimal CPP algorithm to reduce the number of UAV turns. The research developed in this paper is based on a wharf yard with irregular concave polygonal areas as the target. First, an improved DFS algorithm optimizes the concave polygonal area’s segmentation to minimize the number of sub-regions and reduce the sub-regions to be merged. Secondly, the minimum width method determines the search direction of each sub-region to reduce the number of turns of the UAV. Third, the UAV’s coverage path width is determined by the flight height and camera parameters of the UAV. Finally, a genetic algorithm determines the UAV’s traversal order in all sub-regions after segmentation. Our contributions are summarized as follows.
  • A method capable of completely decomposing a concave polygonal region into convex polygonal sub-regions.
  • A DFS algorithm that merges sub-regions, thereby reducing the number of UAV turns.
  • Characterizing the TSP problem by the centers of gravity of the convex polygonal sub-regions.
The rest of the paper is organized as follows. Section 2 introduces the principles behind the CPP of a convex polygonal region. Section 3 develops the CPP of concave polygonal regions. Section 4 introduces the determination of the traversal sequence of each sub-region. Finally, Section 5 presents the simulation results, while Section 6 concludes the paper and draws some conclusions.

2. CPP of a Convex Polygon Region

2.1. Environmental Modeling

To simplify the geographical environment background of the port, relevant information of the port is derived from a remote sensing map. Since the areas covered by the UAV are considered as a polygon, the boundary and vertices of detection area 1 obtained from Google Earth Maps are shown in Figure 1.
The geodetic coordinates of each vertex of detection area 1 are given in Table 1. shown in Table 1 (i.e., latitude and longitude of each vertex).
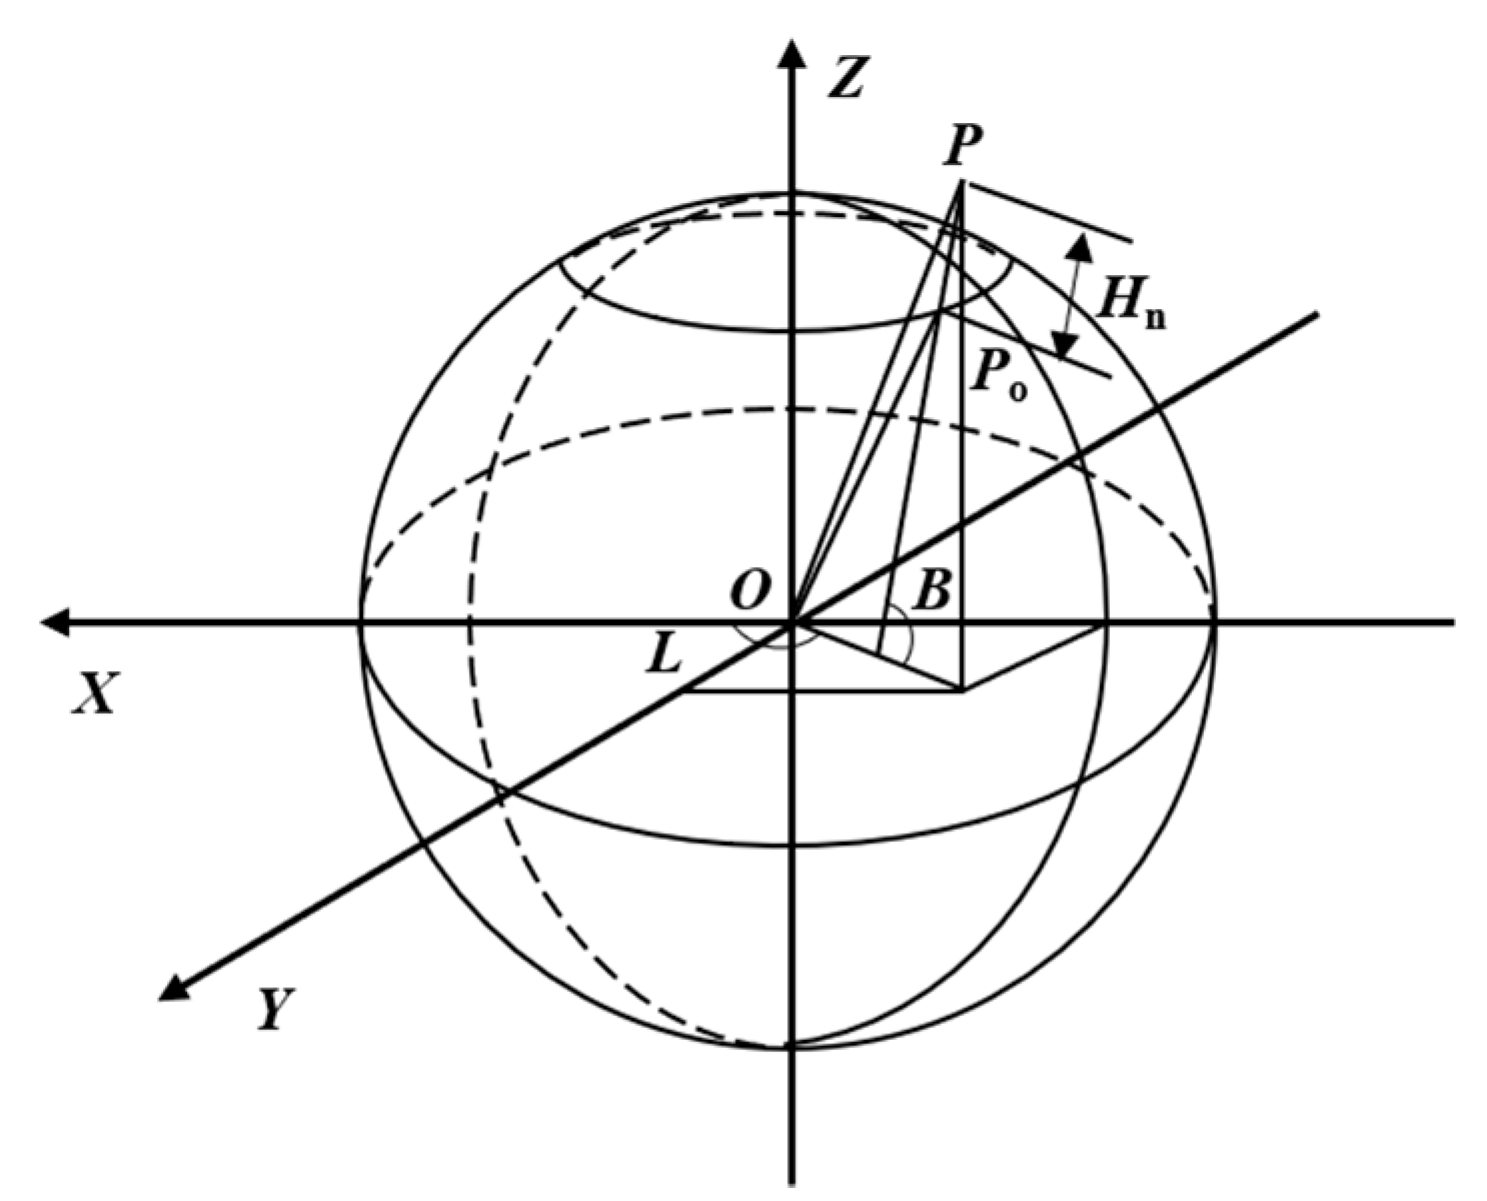
In order to construct the area map of detection area 1 and generate the coverage path in the simulation environment, the vertices of the detection area 1 need to be converted from geodetic coordinates to rectangular coordinates. As shown in Figure 2, P is a point in the geodetic coordinate system, and P 0 is the projection point of P in the rectangular coordinate system. According to the projection principle of a point into a rectangular coordinate system, the coordinates of the point in the rectangular coordinate system can be obtained. Let ( B , L , H ) denote the geodetic coordinate of the point P on Google Earth Maps, while ( x , y , z ) denotes the coordinate of P in a rectangular coordinates system. The formula for transforming from the geodetic coordinate system to the rectangular coordinate system is as follows:
{ X = ( N + H n ) cos B cos L Y = ( N + H n ) cos B sin L Z = [ N ( 1 e 2 ) + H n ] sin B ,
where N is the radius of curvature at latitude B ; e is the ellipsoid first eccentricity.
The radius of curvature N can be solved by Equations (2) and (3):
N = a ( 1 e 2 sin 2 φ ) 1 2 ,
e 2 = a 2 + b 2 2 ,
where a denotes the long radius of the ellipsoid; b is the short radius of the ellipsoid.
The rectangular coordinates of each vertex of the detection area 1 (see Table 2) can be obtained by Equations (1).
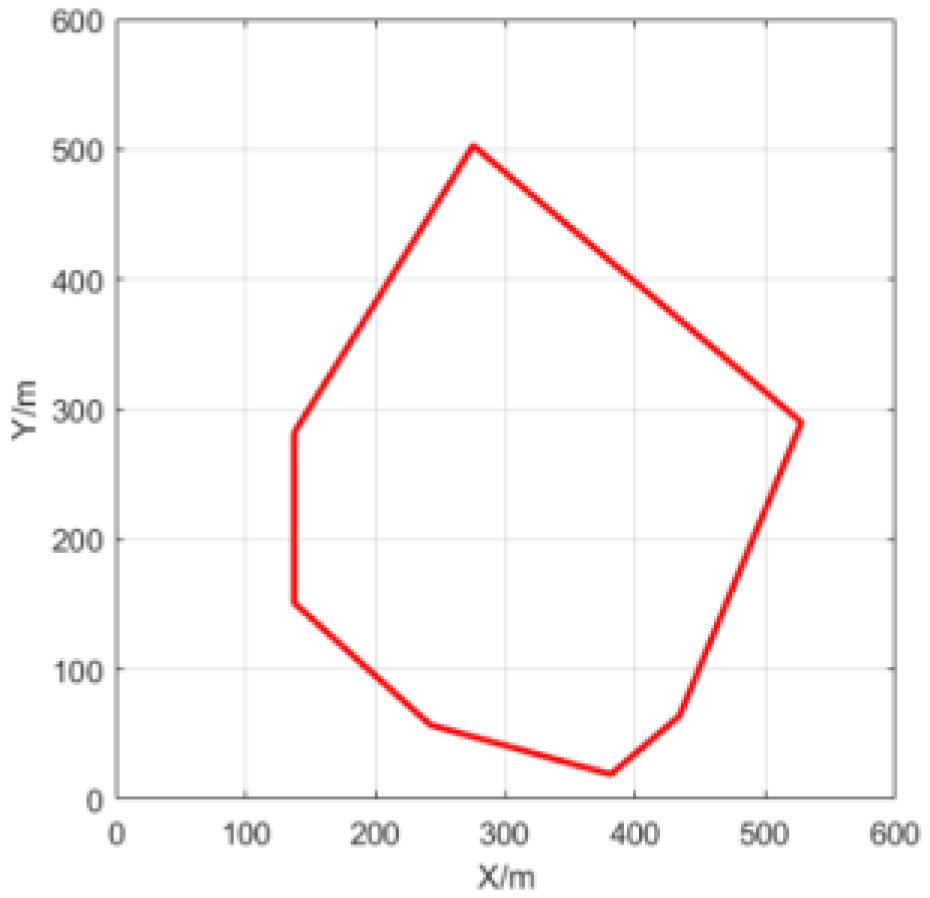
Substituting the rectangular coordinates of the vertices into the simulation environment, the area map 1 for the UAV CPP can be constructed, as shown in Figure 3.

2.2. Selection of Coverage Pattern

Compared with a mobile robot, the working environment of the UAV has some specific peculiarities. We assume that the UAV does not need to avoid obstacles in the CPP. There are three most common patterns to cover an inspection area: Back-and-Forth (BF), random, and spiral, as shown in Figure 4.
The spiral pattern is only suitable for convex polygonal areas, while the random pattern generates much more non-working paths. Clearly, it is more appropriate to choose the BF pattern for a port area.
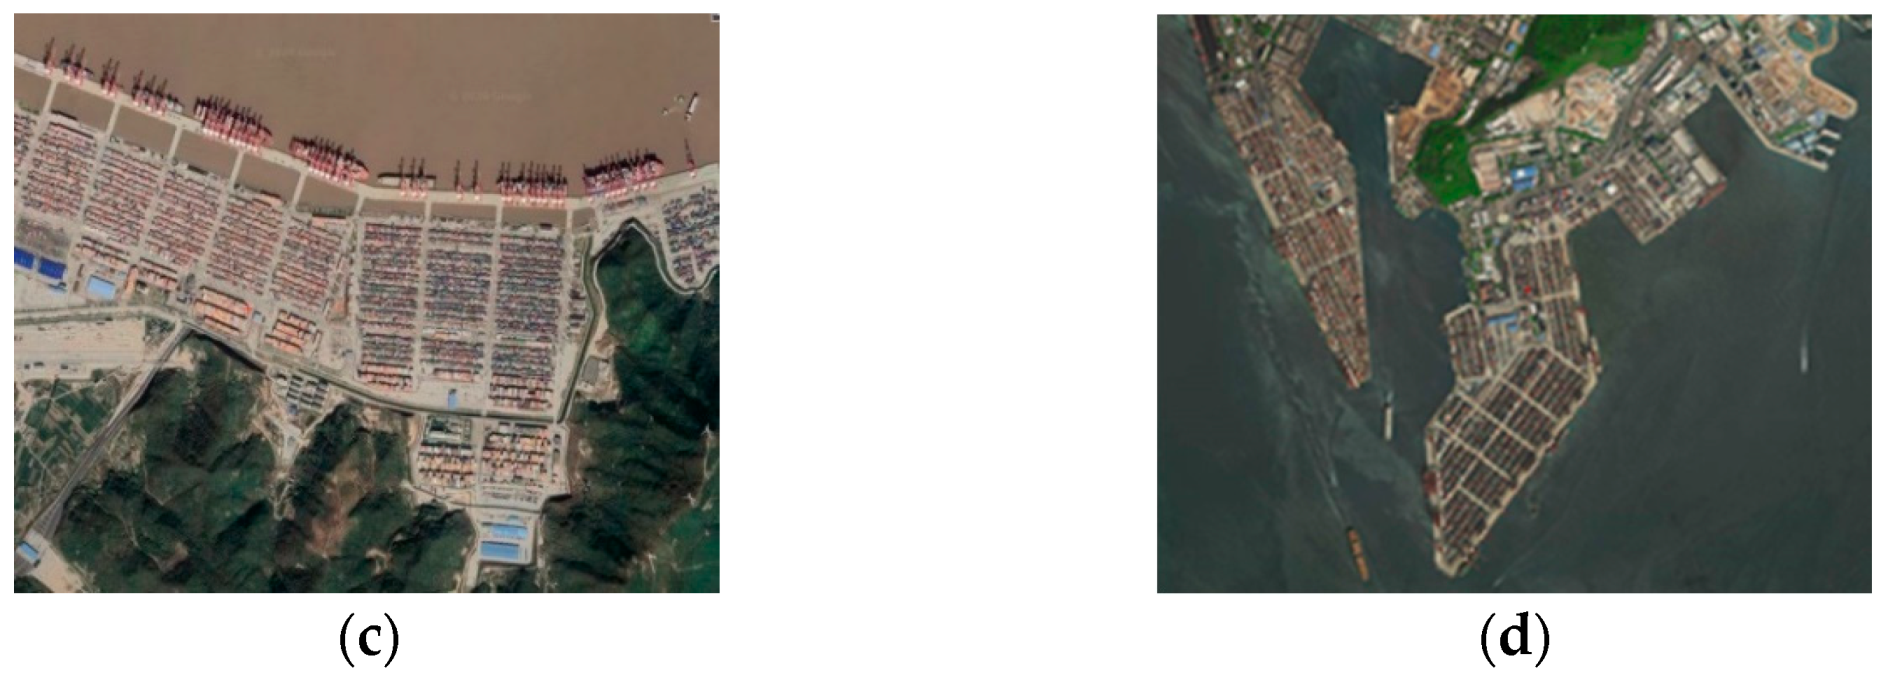
Figure 5 shows some examples of polygonal areas of the Yantian Port, Yangshan Port, Ningbo Port, and Shenzhen Port.

2.3. Determination of Projected Width

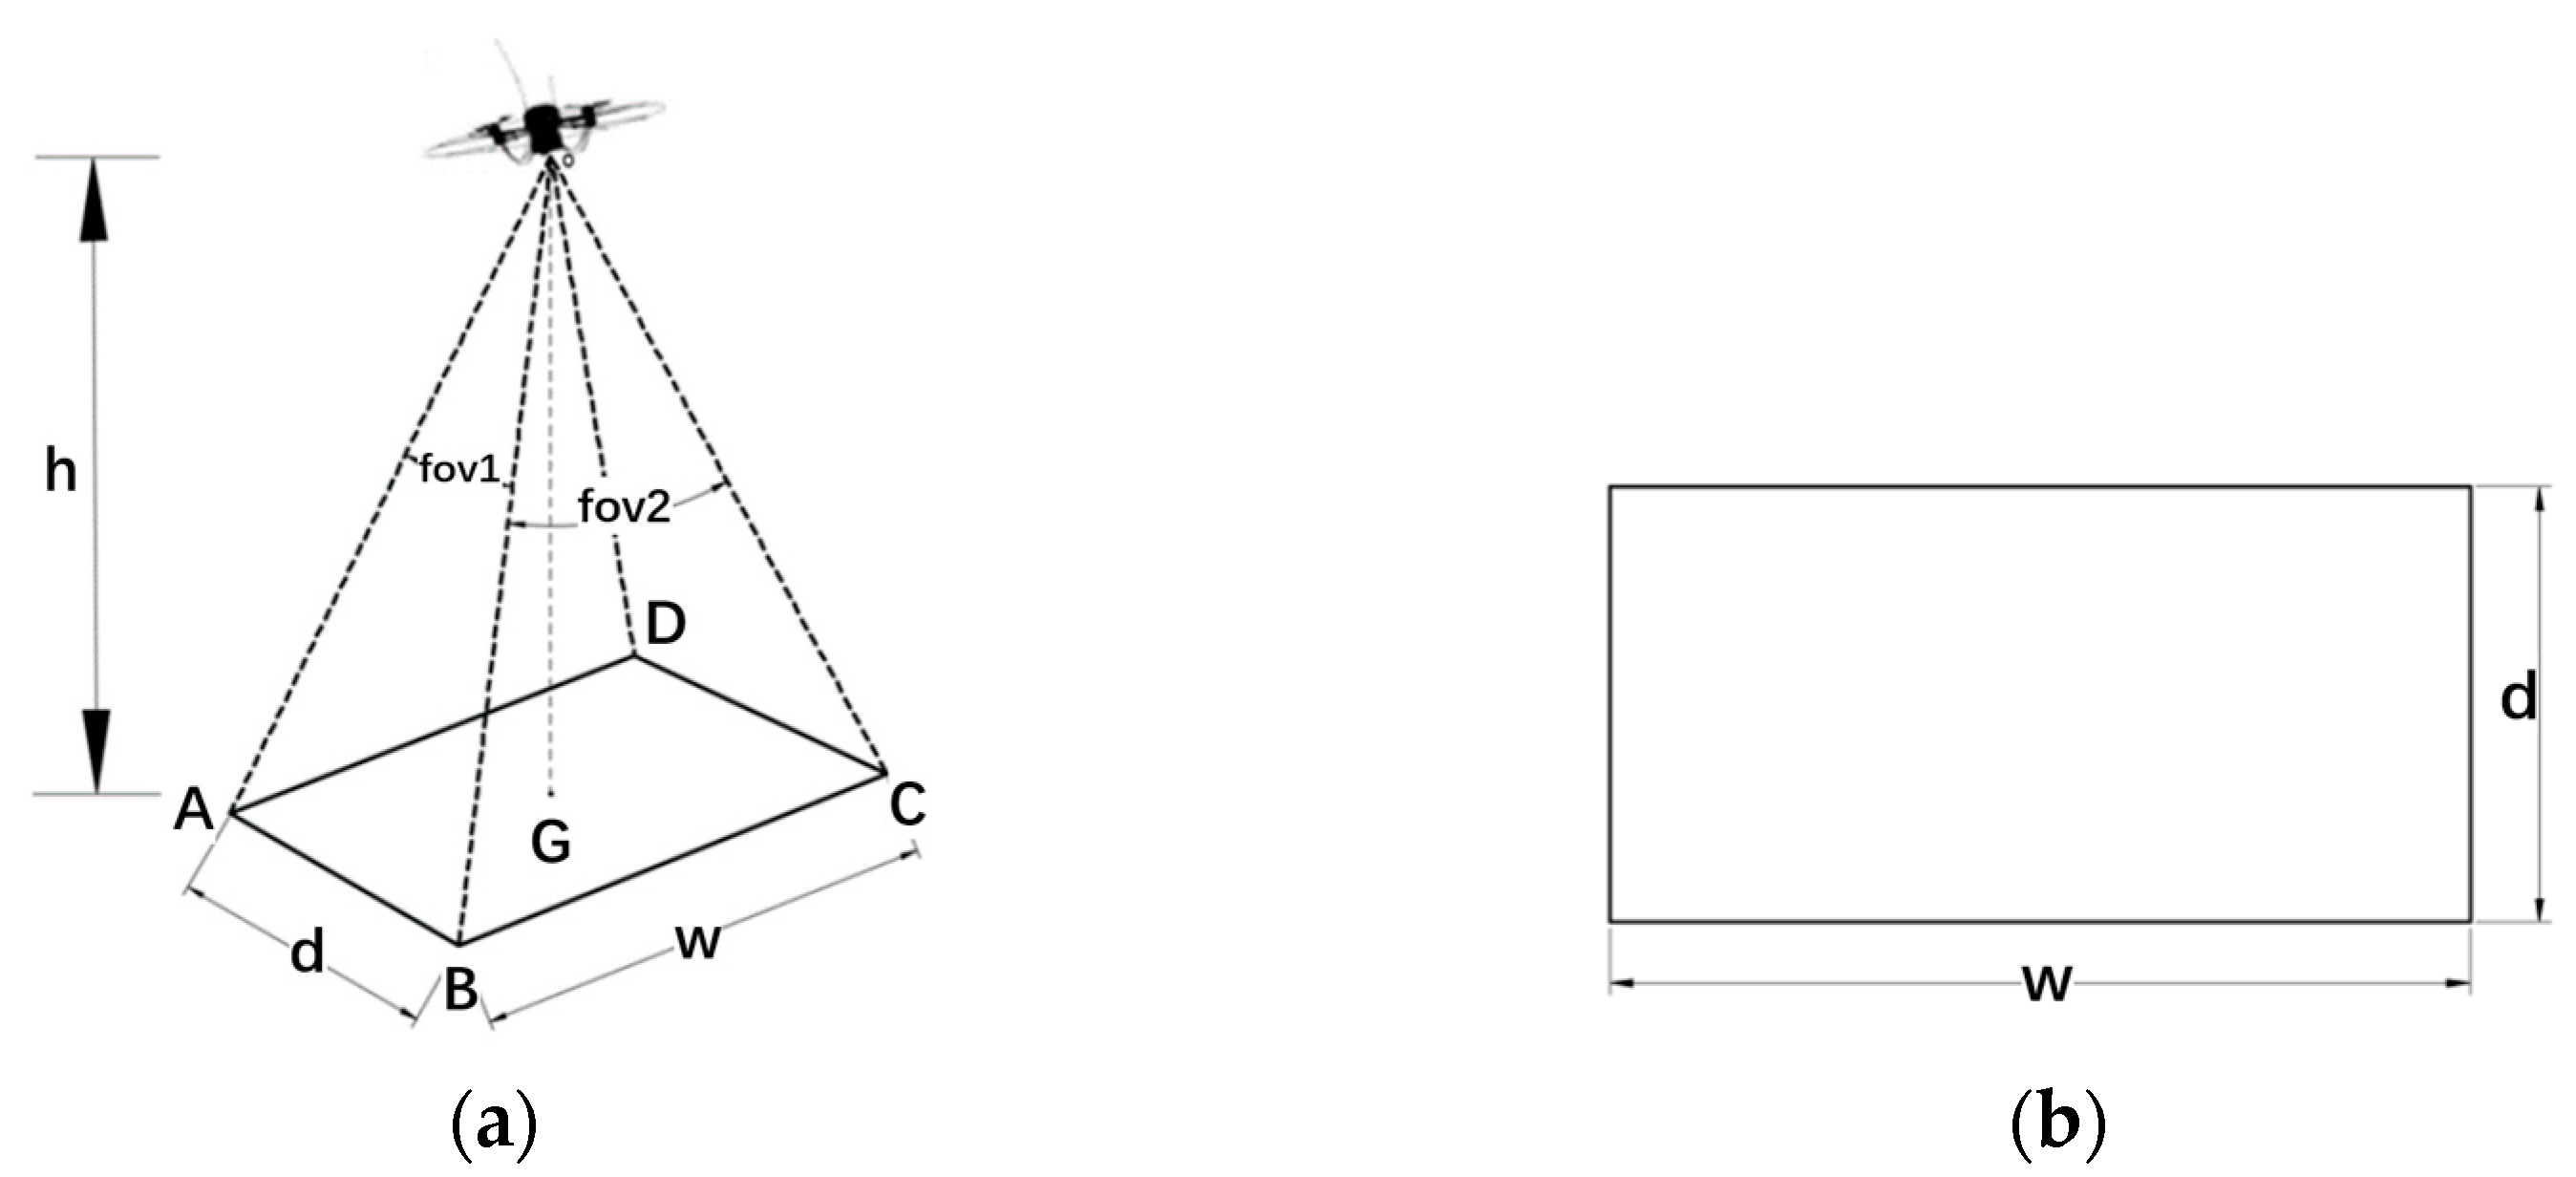
The principle behind an aerial remote UAV photograph and imaging process is shown in Figure 6a.
The top view of the UAV photography is shown in Figure 6b. Equation (4) can be used to calculate the length of projected area w and the width of the projected area d,
{ w = 2 h tan ( f o v 1 / 2 ) d = 2 h tan ( f o v 2 / 2 ) ,
where h is the UAV’s flight altitude, fov1 is the vertical field of view, fov2 is the horizontal field of view.
To guarantee the integrity of the photos, the overlap between two consecutive projected areas is allowed during the flight of an UAV, as shown in Figure 7. It is necessary to calculate the horizontal displacement l x and vertical displacement l y when the UAV is moving and shooting. The calculation formula of the l x and l y between two continuous projected areas is as follows:
{ l x = w w r x l y = d d r y ,
where r x denotes the horizontal coincidence degree, and r y is the longitudinal coincidence degree.

2.4. UAV Search Direction

The search direction of the UAV is crucial for CPP. Different search directions will generate the coverage path with different numbers of turns and path length, as shown in Figure 8.
Figure 8a takes the rectangle’s width direction as the search direction, and Figure 5b takes the length direction of the rectangle as the search direction. The optimal search direction is usually perpendicular to the minimum width direction of the polygon.
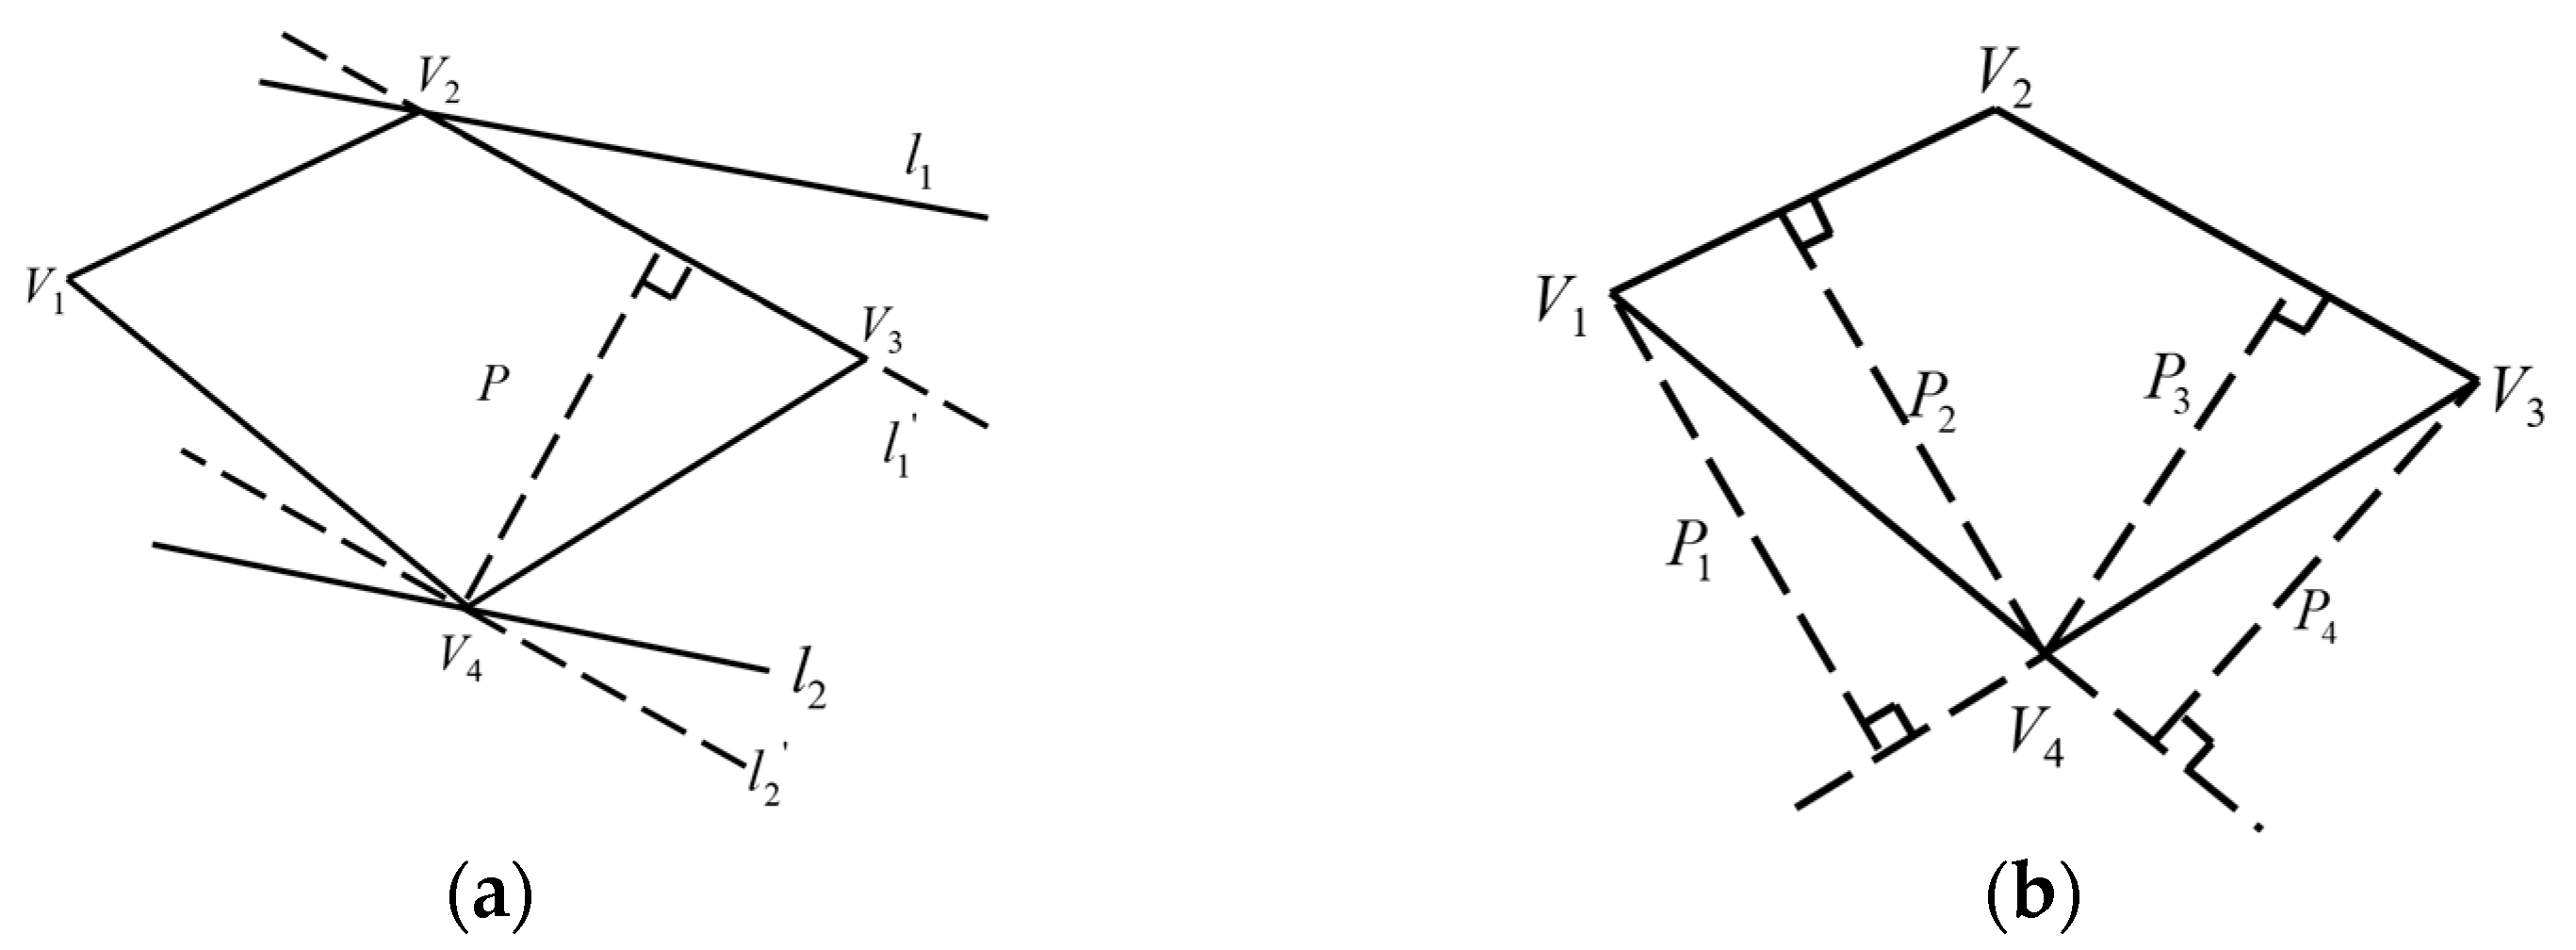
The methods used to determine the minimum width of convex polygons mainly include the rotating caliper and the vertex vertical methods.
The rotary caliper method can determine the width of a polygon through two parallel lines. Rotating the two parallel lines at the same time until one of them coincides with the edge of the polygon. Calculating the perpendicular distance between the two parallel lines to get the width P of the convex polygon, as shown in Figure 9a.
The vertex perpendicular algorithm calculates the farthest vertical distance from each edge of the polygon to the polygon’s vertex. Therefore, the shortest vertical distance can be as the polygon’s minimum width P . This is shown in Figure 9b. The calculation formula of width P n is as follows:
P n = | ( y m y m + 1 ) x n + ( x m + 1 x m ) y n + x m y m + 1 y m x m + 1 ( y m y m + 1 ) 2 ( x m x m + 1 ) 2 | ,
where ( x m ,   y m ) and ( x m + 1 ,   y m + 1 ) are the coordinates of the two endpoints V m and V m + 1 forming a straight line, ( x n ,   y n ) are the coordinates of the vertex V n of the perpendicular.
The calculation of the number of turns T needs to comply with two principles. First, the distance between the starting point and the boundary is defined as half of the working width. Second, when forming the last straight line, if the distance between the track and the boundary is greater than the width of the coverage area, one more turn is needed to achieve coverage. The number of turns T can be calculated by Equation (7):
T = 2 ( P d 1 ) ,
where P is the minimum width of the polygonal area, d is the width of the projected area.

3. CPP of Concave Polygon Area

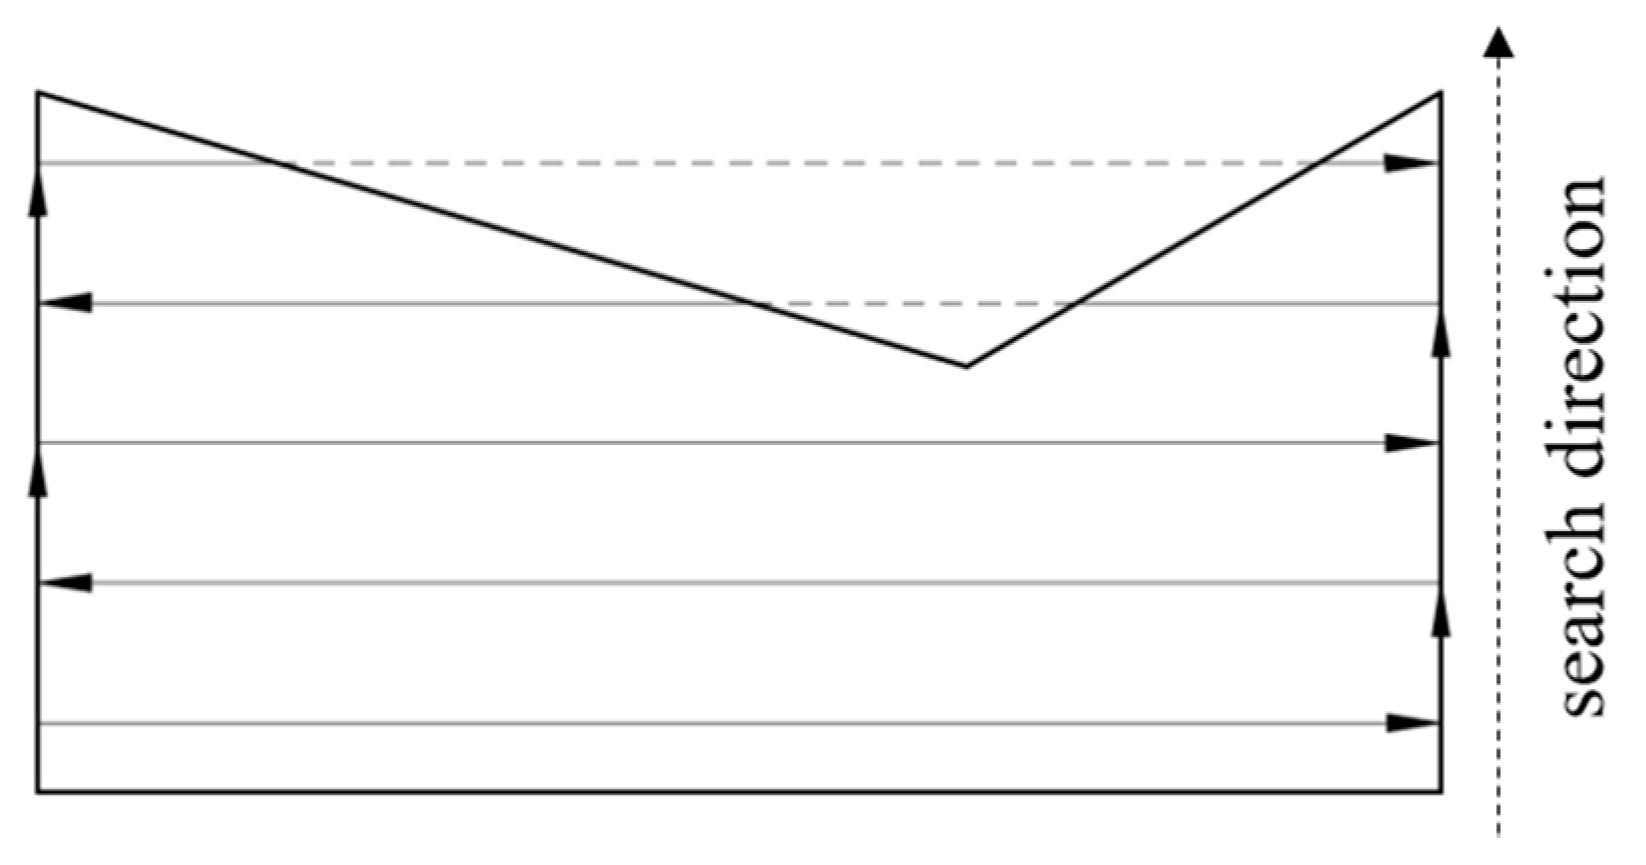
The contour of the wharf yard is irregular and there are many concave corners. If the whole area is covered by the BF path in a fixed direction, this may generate more non-working distance, which will increase the energy consumption.
As shown in Figure 10, when the UAV passes through the concave corner area of the concave polygon, it will produce a non-working path, that is, the path indicated by the dashed line in the figure. Therefore, it is necessary to decompose the concave polygonal area and then cover the convex sub-regions, so as to realize the CPP of the concave polygonal area.
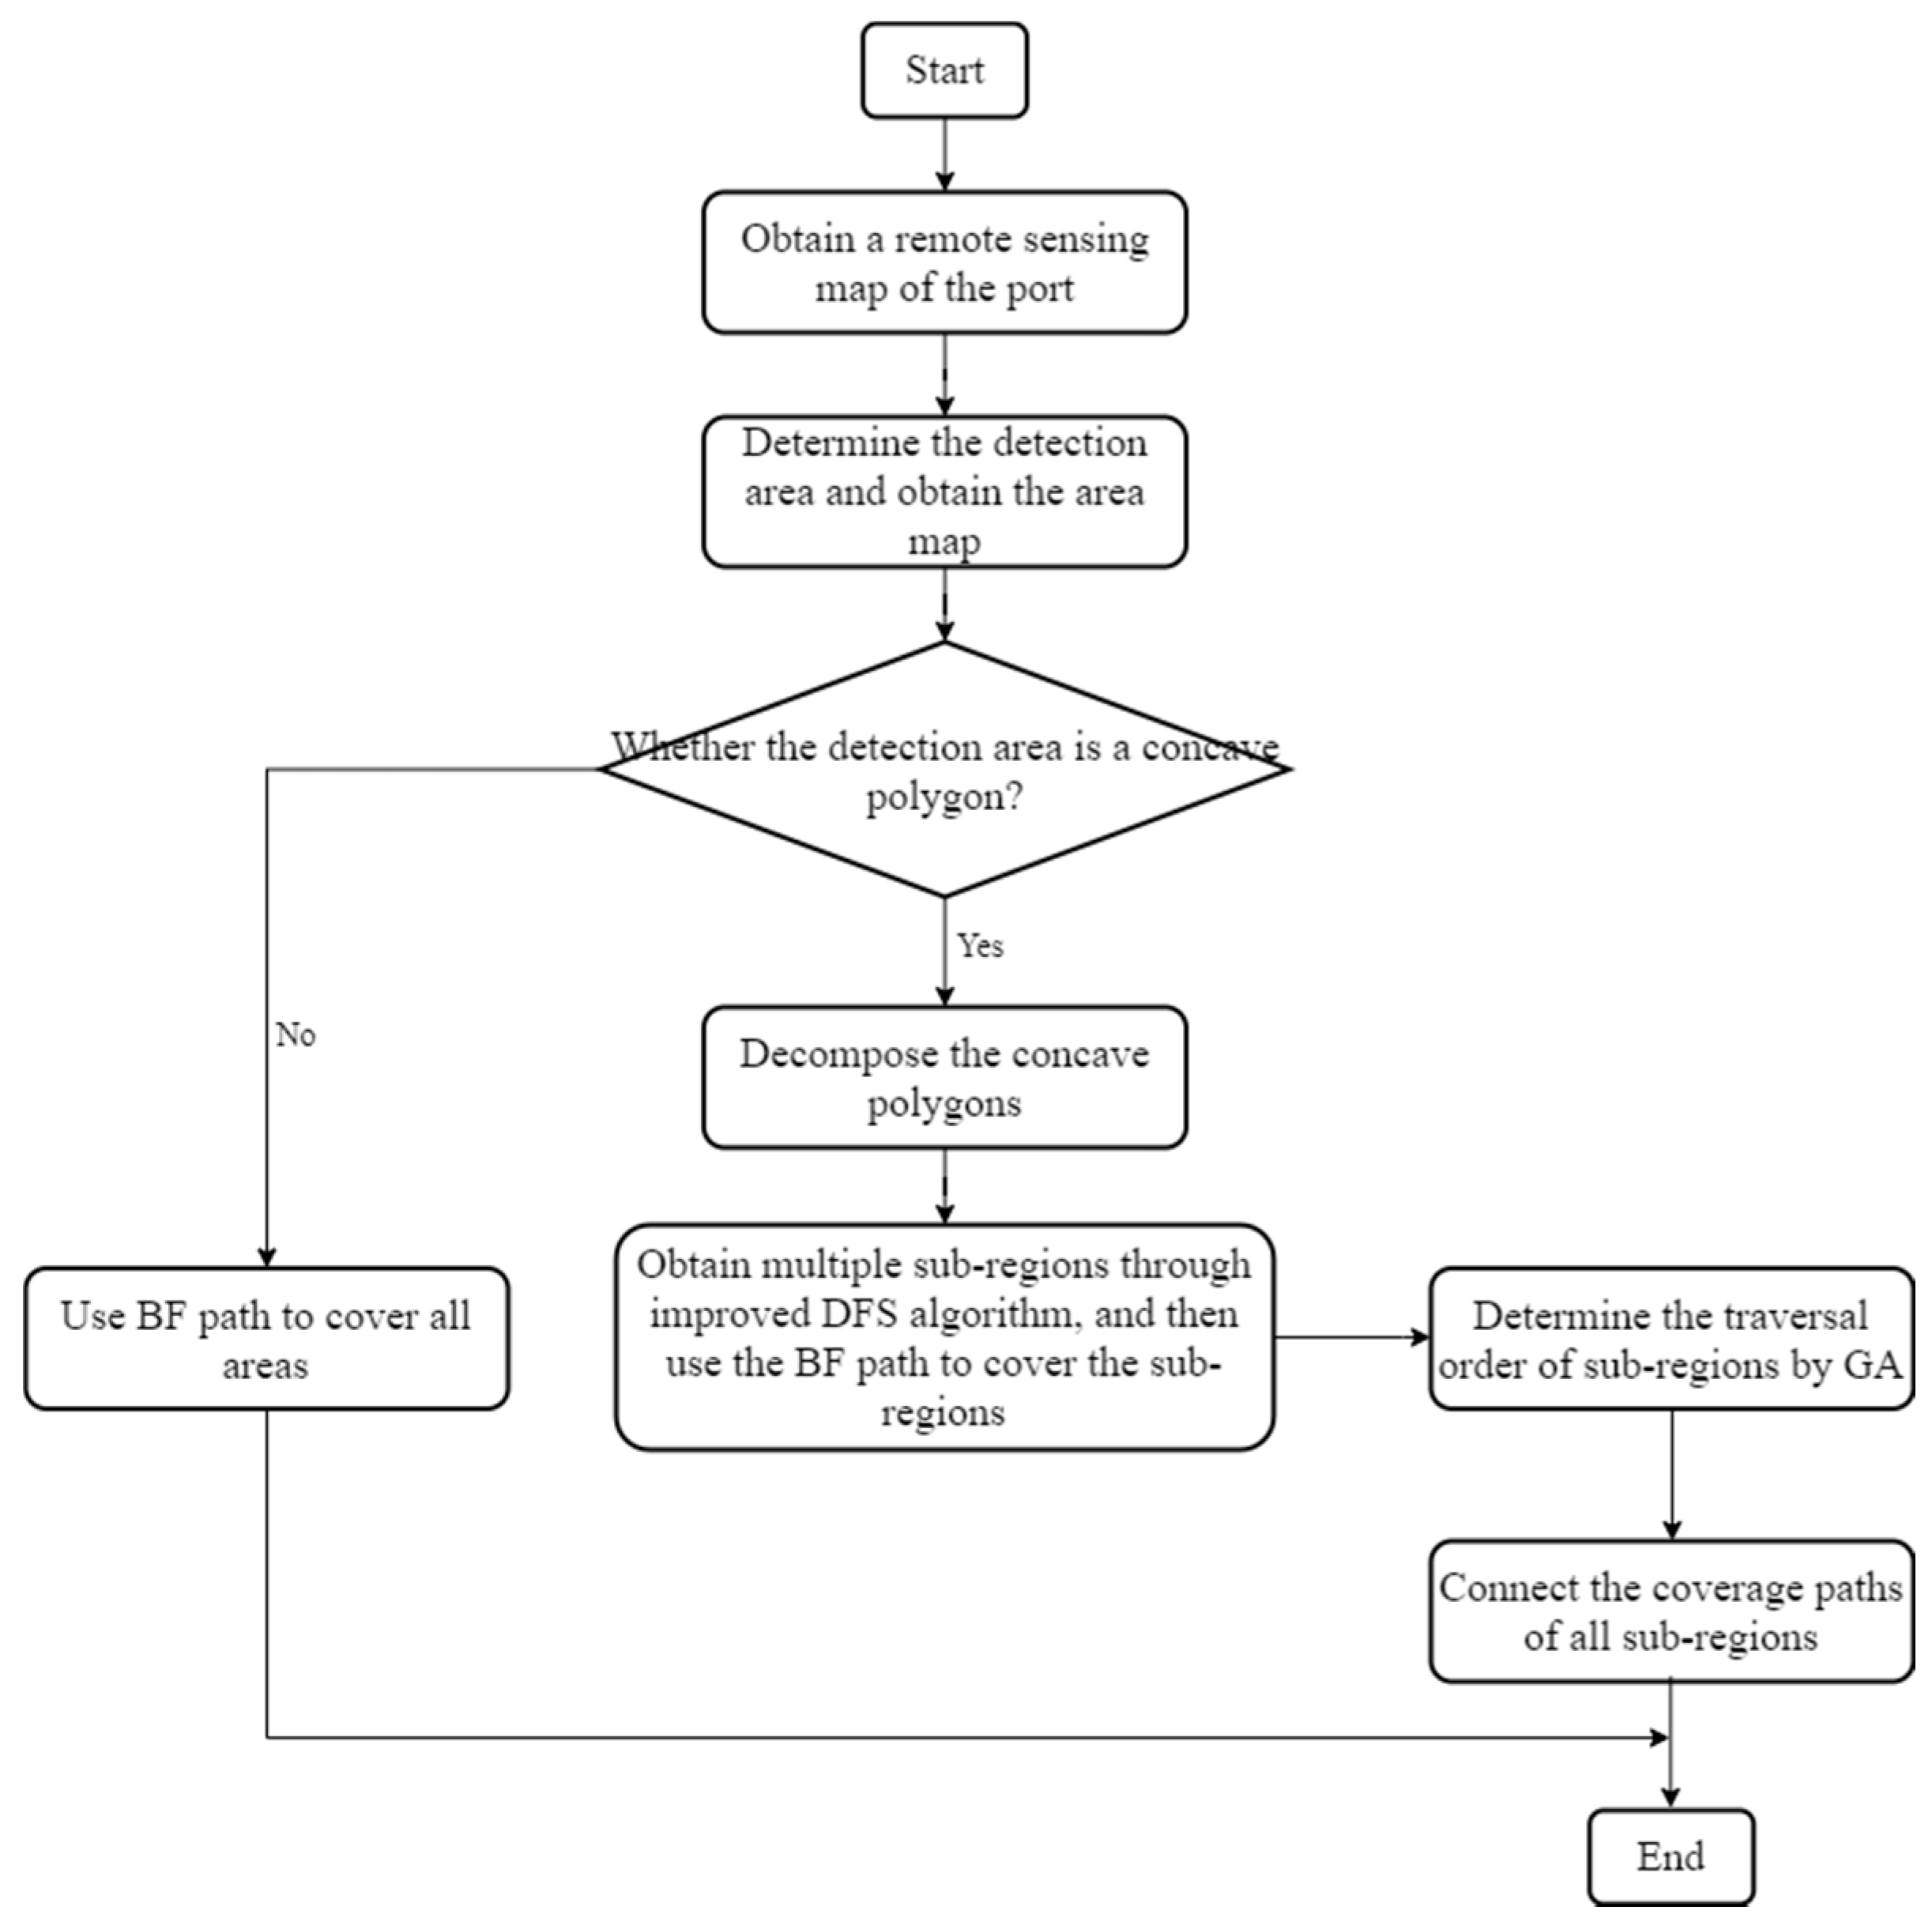
Figure 11 denotes the entire process of the CPP in the port area. The following sections mainly describe the different methods used in the above flowchart. It mainly includes three parts, including the decomposition of concave polygons, a preliminary merge of sub-regions, and derivation of the traversal order of the sub-regions.

3.1. Decomposition of Concave Polygon Area

The location of the concave point needs to be determined before the concave polygon is decomposed. The coordinates of vertex V i are ( x i , y i ) , then the coordinates of the two adjacent vertices V i 1 and V i + 1 are ( x i 1 , y i 1 ) and, ( x i + 1 , y i + 1 ) , respectively. The vector outer product of the vertex V i is defined as follows:
S ( V i ) = V i 1 V i × V i V i + 1 = | x i 1 y i 1 1 x i y i 1 x i + 1 y i + 1 1 | ,
If S ( V i ) < 0 then the vertex V i is the convex vertex; if S ( V i ) > 0 then the vertex V i is the concave vertex; if S ( V i ) = 0 then the two edges constituting the vertex are collinear, and the three vertexes V i 1 , V i , and V i + 1 are collinear, this being hardly the case.
Decomposing a concave polygon is to extend the two edges forming the concave vertex until they intersect the concave polygon boundary. Therefore, the resulting sub-regions are all concave polygons. For a concave polygonal area, it has at least one concave corner. As shown in Figure 12a, the vertices V 2 , V 4 , and V 8 are concave vertices, and other vertices are convex vertices.
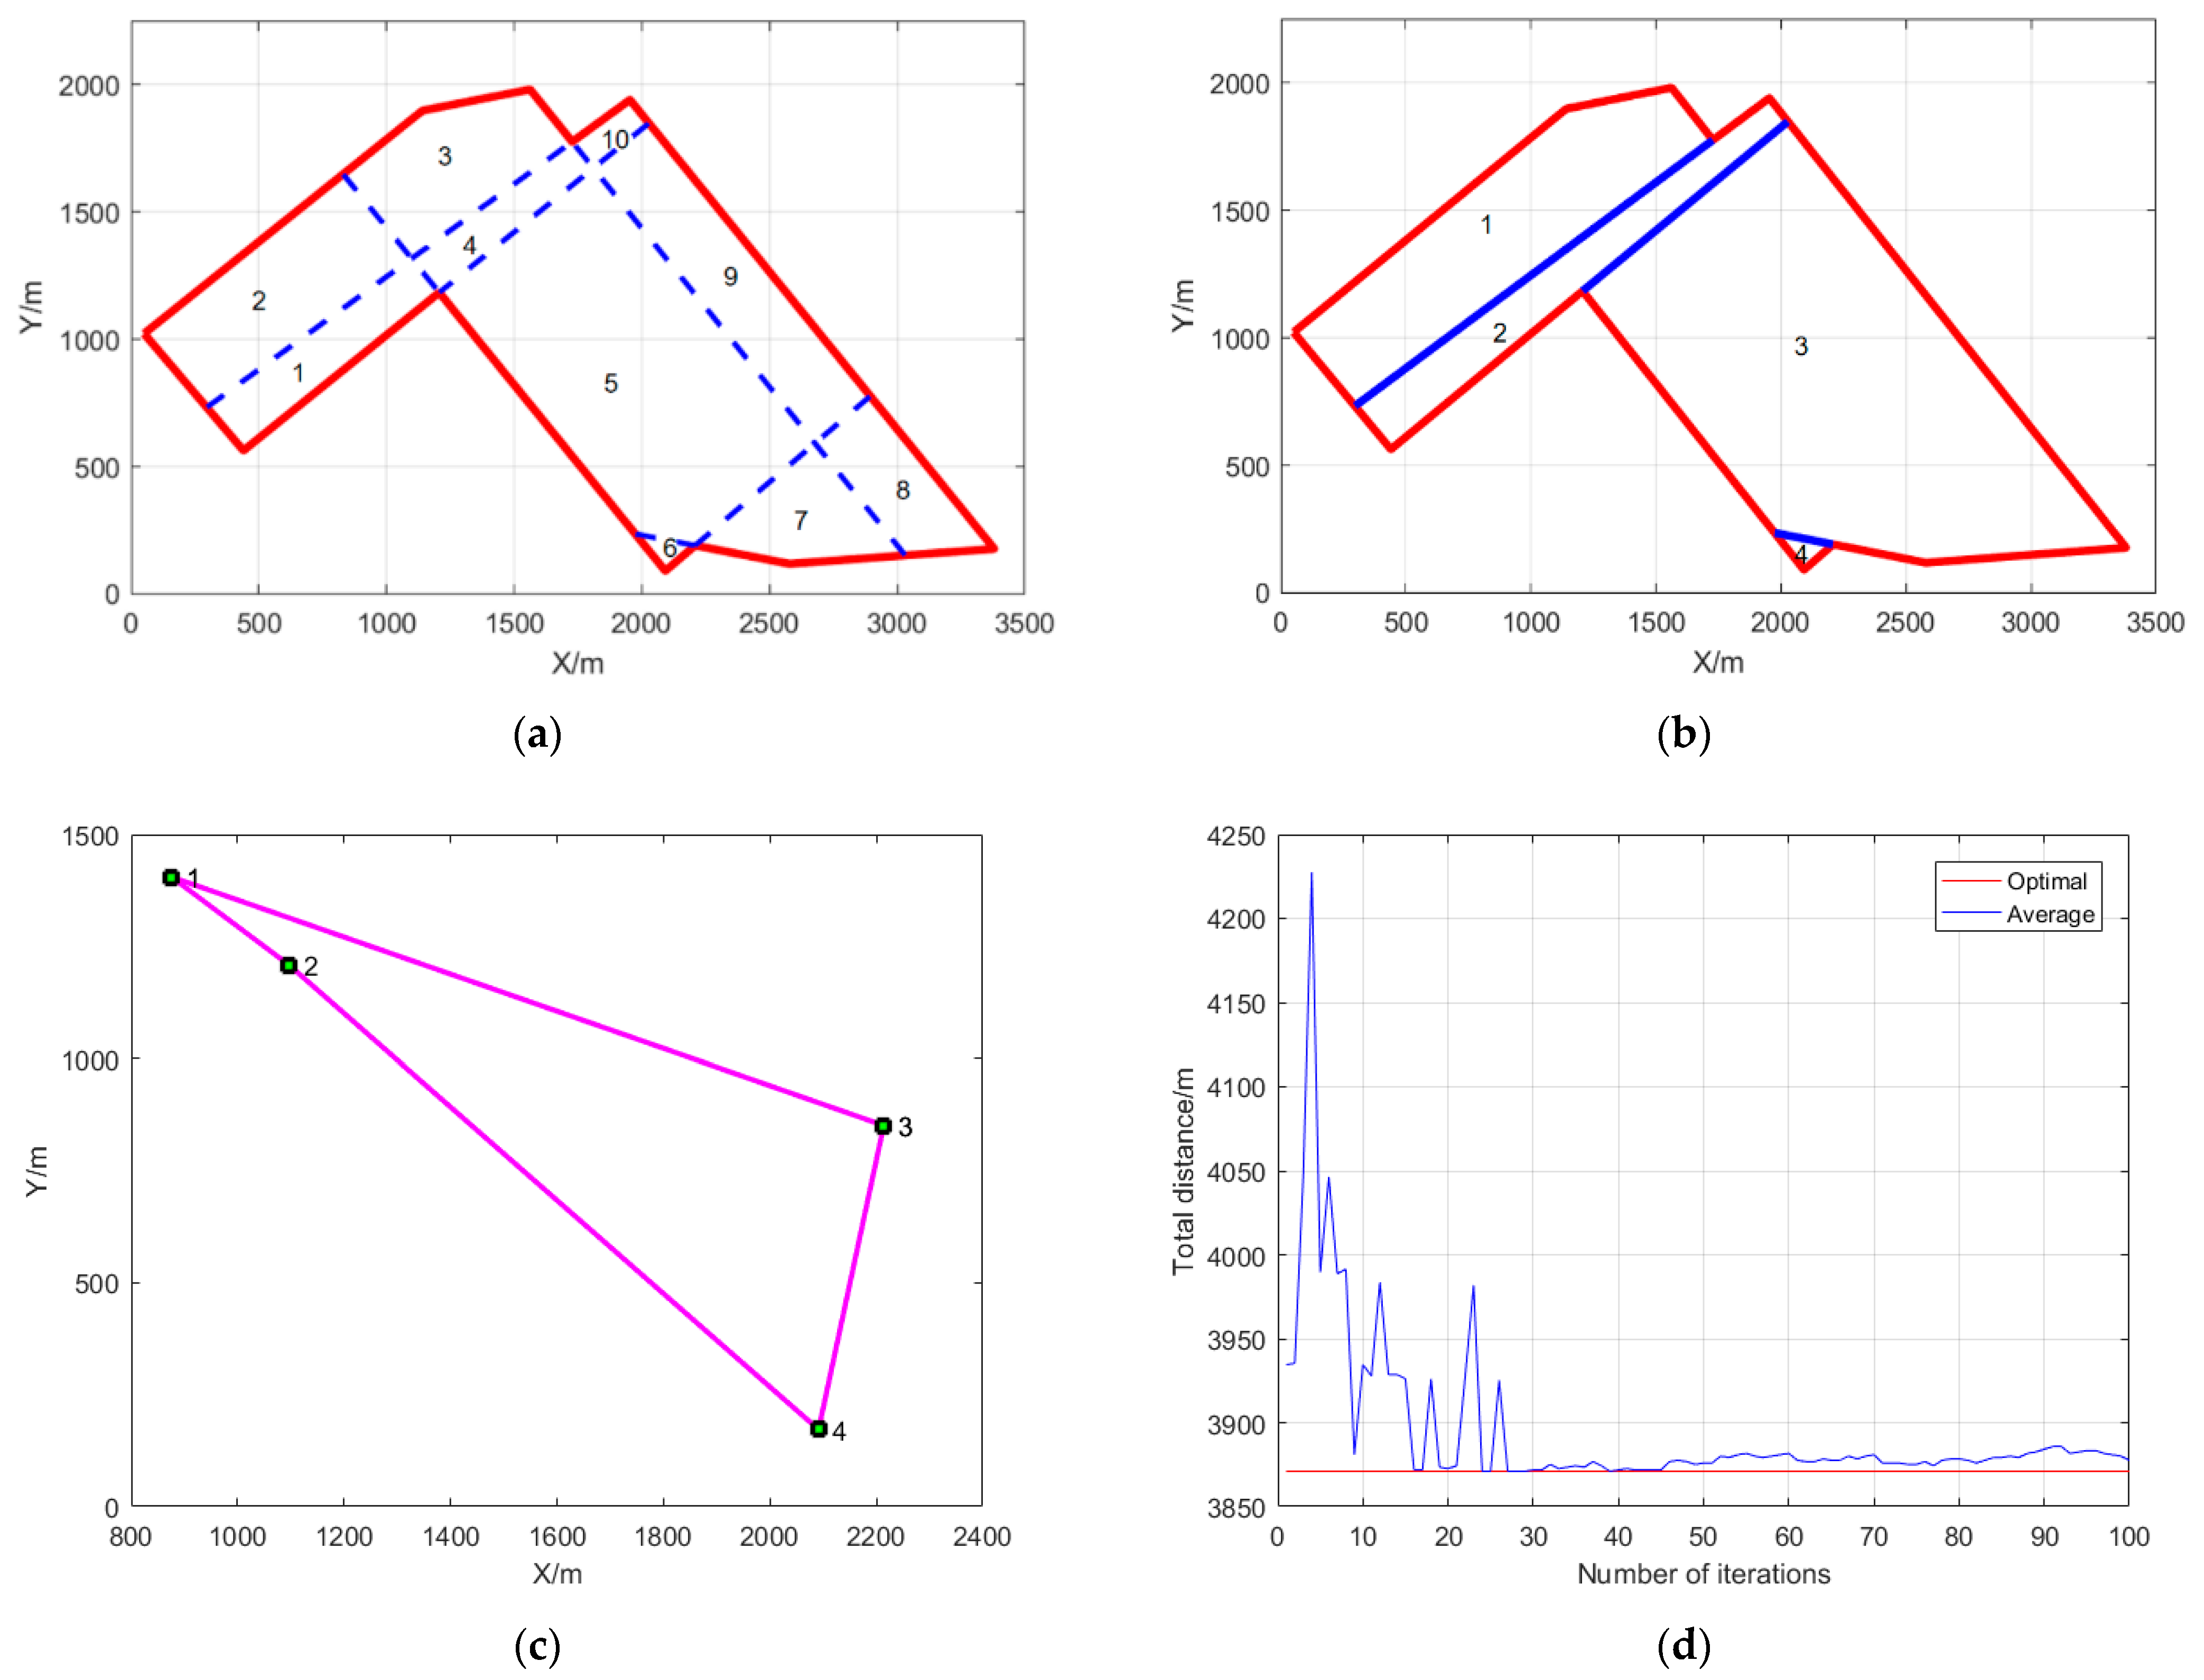
Figure 12b shows the decomposition diagram of a concave polygonal area, which decomposes a concave polygon into 10 small convex polygons. The two edges of the concave vertices V 2 , V 4 , and V 8 are extended, so that 10 convex polygon sub-regions can be obtained. Overall, the number of sub-regions is related to the shape of the concave polygon and the number of concave points. In Figure 12c, nodes with different numbers correspond to different sub-regions. The two convex polygonal sub-regions connected with the same solid point have a diagonal relationship at the concave corner. For example, sub-region 3 and sub-region 10 have a diagonal relationship.

3.2. Improved DFS Algorithm

The undirected graph can represent the positional relationship between the sub-regions. Taking any node as a starting point, a feasible sub-region merging scheme is obtained by traversing all nodes, and then the sub-regions are merged in a certain order. If there is no new node that meets the requirements, the search ends.
Therefore, the sub-regions corresponding to the searched nodes that meet the requirements can be merged to obtain a larger area. However, in order to ensure that the merged area is still a convex polygon, the sub-regions cannot be merged when the following two cases occur.
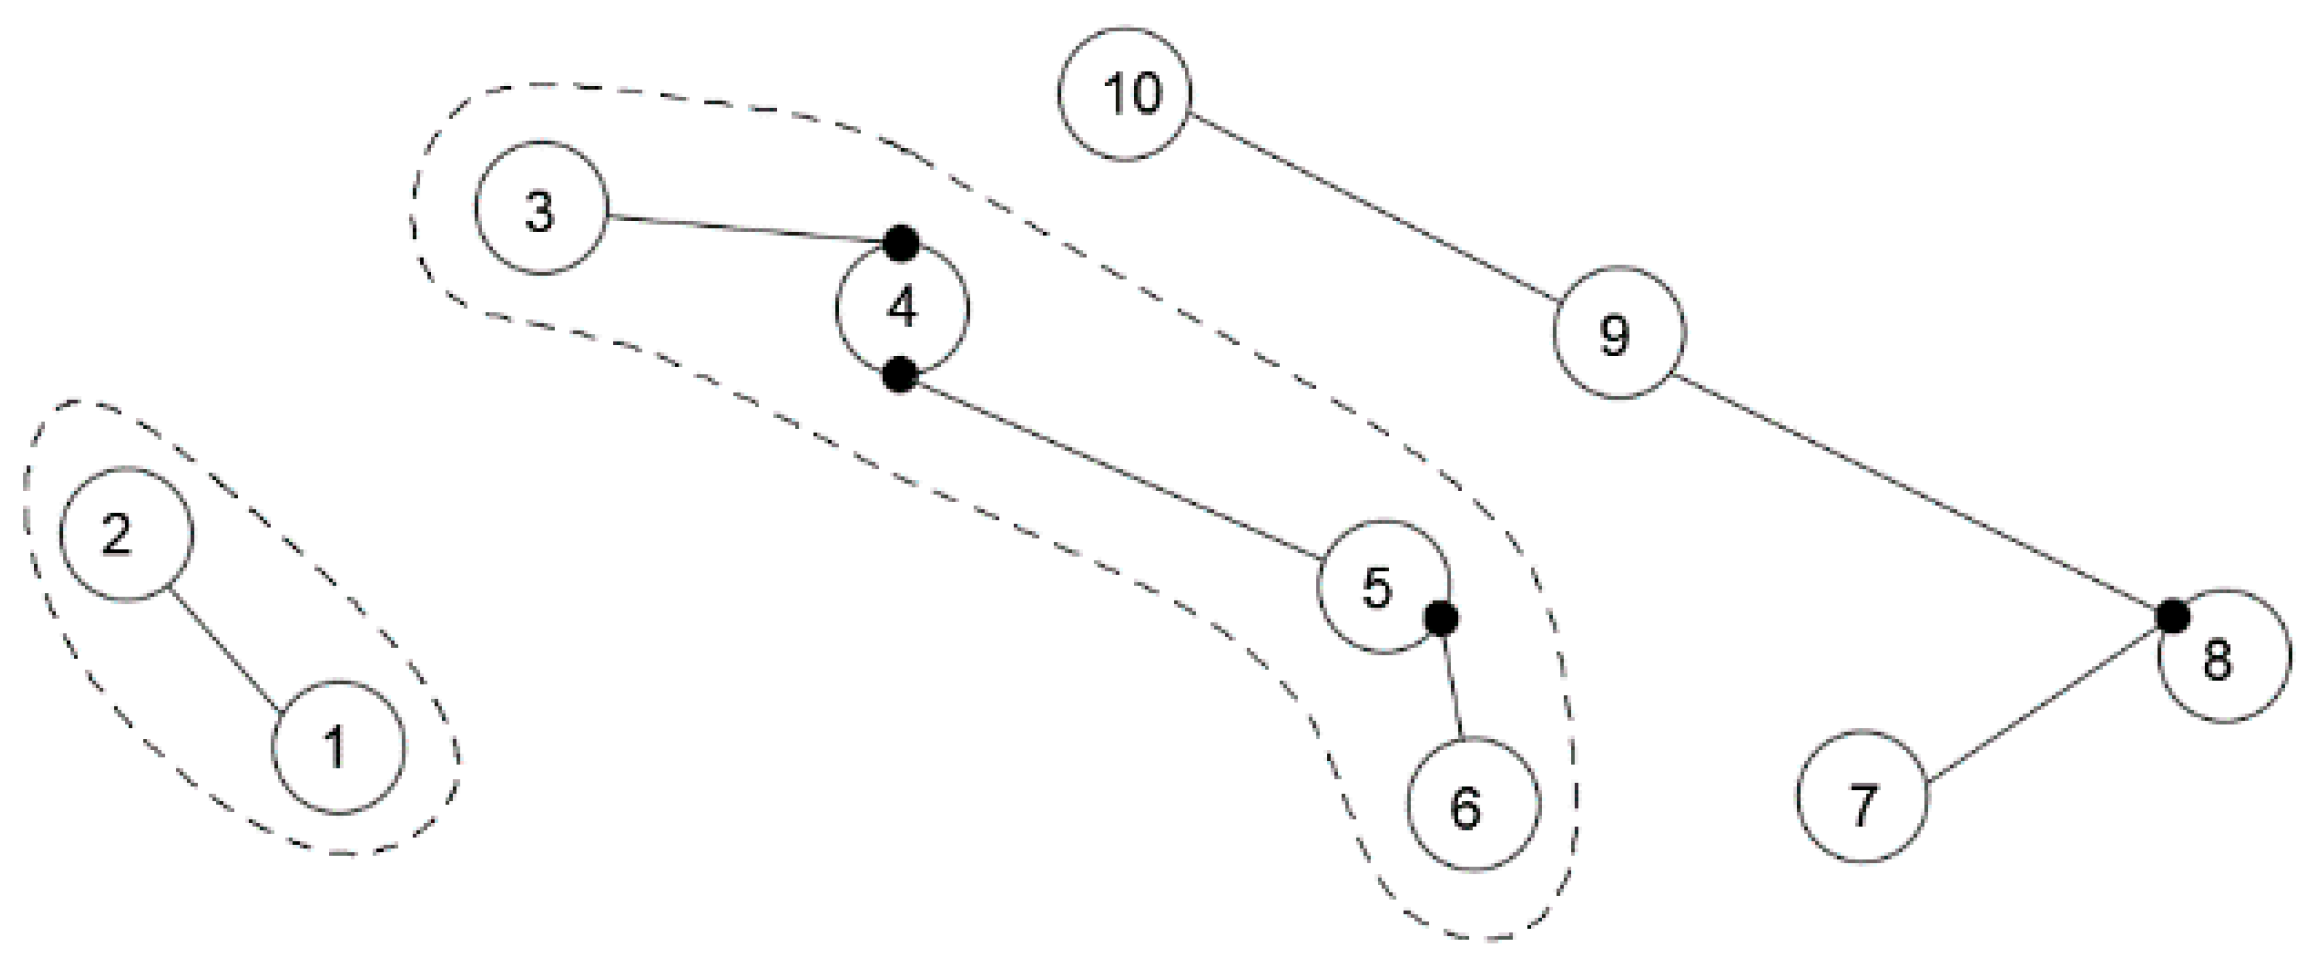
(1) Case 1: in an undirected graph, two nodes are connected to the same node, but they are not connected to each other. In Figure 13a, the nodes 3 and 10 are connected to node 4, but nodes 3 and 10 are not connected.
In Figure 13b, the sub-region 3 corresponding to node 3 cannot be merged with the sub-region 10 corresponding to node 10.
(2) Case 2: in an undirected graph, four nodes are connected to form a ring. When three of these nodes have been visited, it is necessary to determine whether the fourth node can be visited. If not, the three sub-regions corresponding to the three nodes cannot be merged.
As shown in Figure 14a, the nodes 1, 2, 3, and 4 are connected to each other to form a closed loop. If nodes 3, 4, and 1 can be accessed, but node 2 cannot be accessed, then the three sub-regions 3, 4, and 1 will form a concave polygonal area, as shown in Figure 14b.
The priority of case 1 is higher than that of case 1. Therefore, the improved DFS algorithm can be described by the following steps:
Step 1: Decompose a concave polygonal area into multiple convex polygon sub-regions.
Step 2: Establish an undirected graph representing the positional relationship between sub-regions.
Step 3: Select any node as the start node and store it in the “Visited queue”.
Step 4: According to the “right-hand principle”, priority is given to the node on the right. Then search in the counterclockwise direction. Finally, one or more “Unvisited queues” are obtained.
Step 5: Save the “Unvisited queue” to the “Unvisited group”.
Step 6: If there are multiple “Unvisited queues”, it is necessary to judge the “Unvisited queues” in the “group” and remove them from the “Unvisited groups”. Finally, the “Unvisited queue” becomes a “Visited queue”.
Step 7: If the current “Visited queue” cannot be merged, return to Step 4; if it does, save the “Visited group” to the “Invalid node group”, and then execute Step 8.
Step 8: If the “Unvisited group” is empty, the search process will be terminated; if not, return to Step 5.
The flowchart of the improved DFS algorithm is shown in Figure 15.
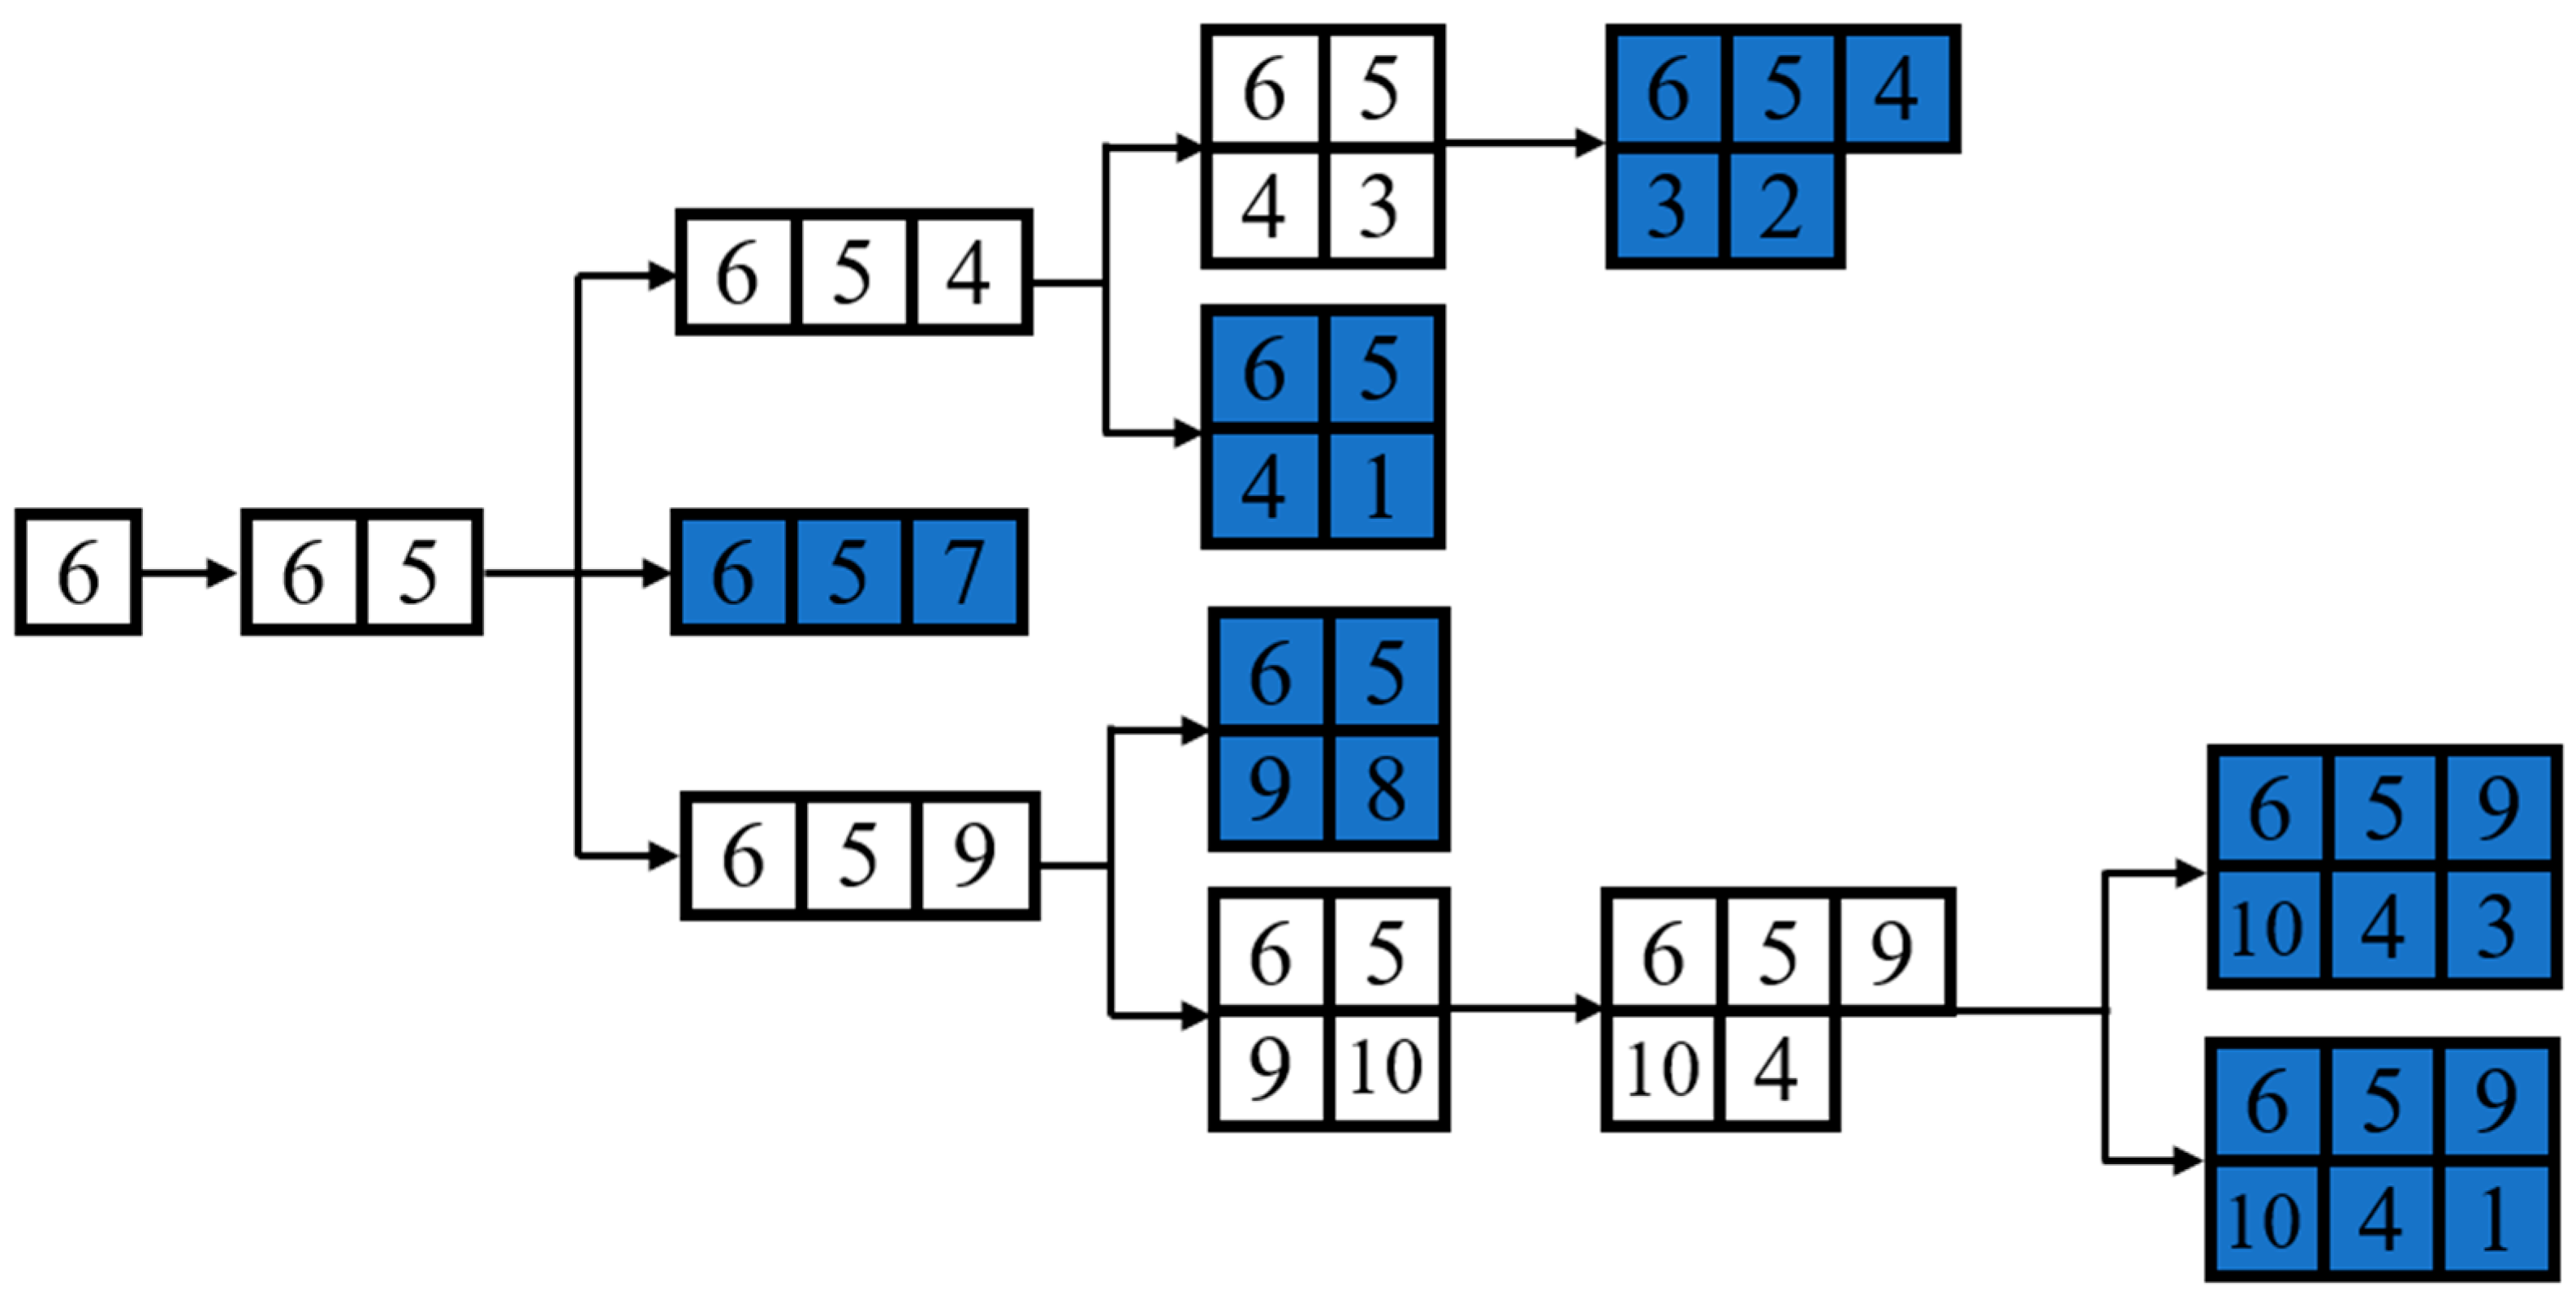
Taking Figure 12c as an example, take node 6 as the start point of the search, and only the node 5 is connected with node 6, so that node 5 is accessed. The nodes 4, 9, and 7 are associated with node 5. According to the “right-hand principle”, node 7 is given priority, and then node 9 and node 4 are searched in a counterclockwise direction. At this time, queues 6-5-7, 6-5-9, and 6-5-4 of the accessed nodes will be formed. When accessing the first queue 6-5-7 from left to right, node 7 meets condition 1. Therefore, node 7 cannot be accessed, and the corresponding region 7 cannot be merged. Then access the second queue 6-5-9 and found node 9 can be accessed. Using the node 9 as the start point, then search according to the “right-hand principle” and “counterclockwise order” to access the queues 6-5-9-8 and 6-5-9-10. The node 8 meets the merging requirements, and then the queue 6-5-9-8-7 to be accessed is searched. It can be found that the node 7 meets case 2 so that it cannot be accessed at this time, and delete the queue 6-5-9-8-7. According to the above steps, we can get that the queue 6-5-4-3 first meets the sub-region merging condition.
After getting the nodes of a queue that can be merged, it can be decomposed from the complete connected graph. This process is called the decomposition of a connected graph. As shown in Figure 13, nodes 6, 5, 4, and 3 are decomposed from the connected graph and included with dashed lines, indicating that these nodes can be merged, and the remaining nodes stay in the original connected state. In the decomposition process, node 1 and node 2 are only connected to be merged. After decomposition, the areas corresponding to the remaining nodes 10, 9, 8, and 7 still have concave corners. Therefore, the connected graph formed by these four nodes has a common solid point at node 8, and then the remaining areas are searched by the depth-first-search algorithm.
Figure 16 shows the search queues obtained by searching the remaining nodes with node 6 as the start point. Circling the identified sub-regions that can be synthesized with dotted lines, such as sub-regions 1 and 2, sub-regions 3, 4, 5, and 6 in Figure 16. The remaining sub-regions 7, 8, 9, and 10 cannot be merged.
The blue rectangle in Figure 17 indicates the queues that cannot be accessed, such as queues 6-5-4-1 and 6-5-9-8; the white rectangle indicates the queues that can be accessed, such as queue 6-5-9-10 -4 and 6-5-4-3.
It can be seen from Figure 17 that starting from node 6, the queues with the largest number of combined small regions include queues 6-5-9-10 -4 and 6-5-4-3. According to these two queues, the undirected graph of sub-regions can be decomposed, and the decomposition result is shown in Figure 18.
Figure 18a–d indicates the possibility of merging all the sub-regions. The graph on the right shows the undirected graph of the sub-regions, and the left represents the merging graph of the sub-regions. Figure 18a,b presents the two possible combinations of merging the remaining regions after merging sub-regions 1 and 2, sub-regions 3, 4, 5, and 6. Figure 18c,d indicates two possibilities of merging the remaining sub-regions.
Starting from any node in the undirected graph, a solution to merge sub-regions can be found. Therefore, in order to determine the optimal solution for merging sub-regions, it is necessary to use all nodes in the undirected graph as the starting point of the search to find all merging solutions that meet the conditions. Then repeat the decomposition of the undirected graph and the search of effective paths until there are no unvisited nodes in the undirected graph. As shown in Table 3, all schemes where nodes can be merged are given.
Table 3 shows 13 different effective access queues, and one can obtain the corresponding 13 different connected graph decompositions and sub-region merging results.
When the numbers of turns of the UAV in different merger schemes are similar, the solution with the shortest connection path between sub-regions needs to be selected as the optimal solution.
In order to minimize the sum of the transition distances connecting all sub-regions, the traversal sequence of all sub-regions needs to be determined first. Determining the traversal order between sub-regions is a TSP problem, and polygonal regions with different geometric shapes need to be used as mass points. Therefore, this leads us to select the center of gravity of each polygon to represent the position of each sub-region in the space, thereby reducing the complexity of the problem.
The formula for the center of gravity of a polygon is as follows:
x = i = 2 n 1 ( x 1 + x i + x i + 1 ) | x 1 y 1 1 x i y y 1 x i + 1 y i + 1 1 | 3 i = 2 n 1 | x 1 y 1 1 x i y y 1 x i + 1 y i + 1 1 | , y = i = 2 n 1 ( y 1 + y i + y i + 1 ) | x 1 y 1 1 x i y y 1 x i + 1 y i + 1 1 | 3 i = 2 n 1 | x 1 y 1 1 x i y y 1 x i + 1 y i + 1 1 | ,
where n is the number of vertices of the polygon, ( x , y ) are the coordinate of the center of gravity of the polygon, ( x i ,   y i ) are the coordinates of the polygon vertex V i .

3.3. Algorithms Comparison

In order to illustrate the effectiveness of the improved DFS algorithm, it is compared with the line sweep decomposition, MSA decomposition, and enhanced exact cellular decomposition methods. The comparison criteria mainly include the number of sub-regions and the minimum height of the sub-region.
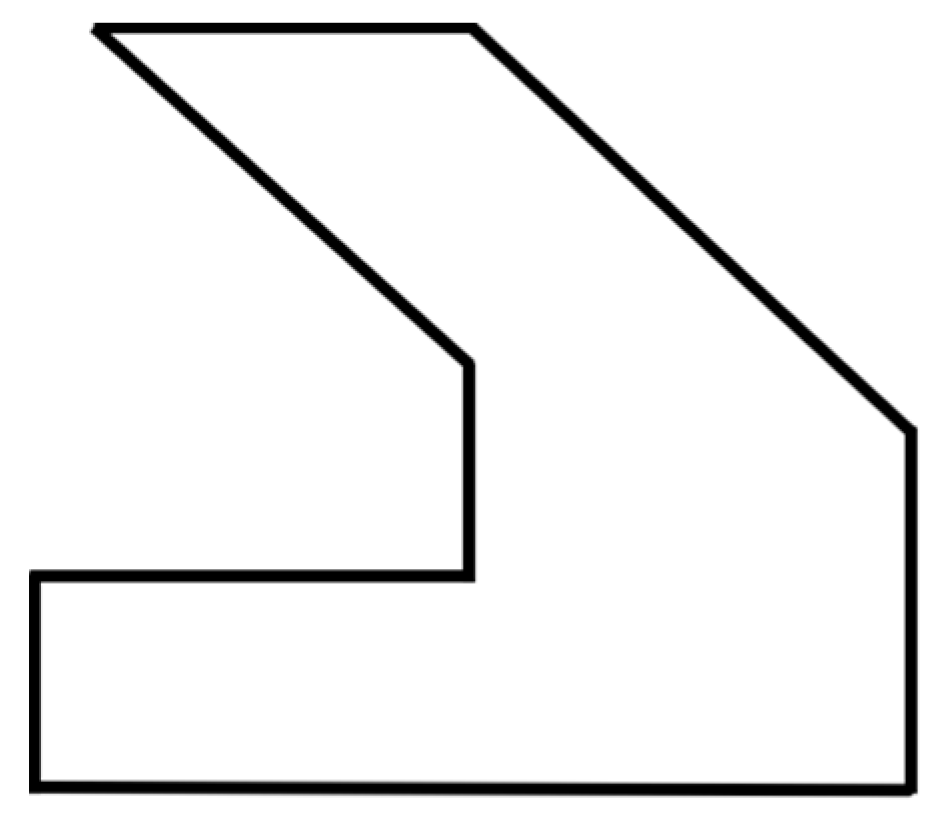
Figure 19 shows a given concave polygon, which will be processed by the four different decomposition methods.
The sub-pictures (a–d) in Figure 20 are the schematic diagrams of the decomposition results of the four decomposition methods in the concave polygonal area, in which the blue dashed line indicates the dividing line between the sub-regions, the arrow indicates the optimal search direction of the sub-region.
It can be seen from Table 4 that considering the number of sub-regions, the combination type of sub-regions, and the minimum height of sub-regions, the improved DFS algorithm performs better than the other three methods.

4. Traversal Order between Sub-Regions

4.1. Determination of the Traversal Order of Sub-Regions

After merging the sub-regions, the next step is to determine the traversal order of the merged sub-regions. The traversal order between regions can be regarded as solving the TSP. Due to the small number of sub-regions that need to be traversed, the TSP problem can be solved by any of the PS, GA and PSO algorithms. This paper retains the GA to solve the traversal order of each region. The GA generally has the following steps:
(1) Coding: encode the working sub-regions according to the integer coding method, which is helpful to determine the traversal order of the sub-regions.
(2) Initial population: generally, there are two initialization methods. One is entirely random; the other is to select the population purposefully according to the existing information. According to the current experience, the number of initial populations is generally between 4 n ~ 6 n , where n is the number of merged regions.
(3) Fitness function: the GA basically does not use external information in the evolutionary search process, it is only based on the fitness function, using the fitness value of each individual in the population to search for. This should search for the traversal order that produces the shortest path to express, the fitness function can be expressed as follows:
f ( R i ) = 1 i = 1 n 1 D ( V i , V j ) + D ( V n , V 1 ) ,
where D ( V i , V j ) is the Euclidean distance between any two nodes, D ( V n , V 1 ) is the Euclidean distance from the last node to the starting node, f ( R i ) represents the reciprocal of the length of the first path. After traversing n nodes and returning to the start node, it is necessary to find the best chromosome to maximize the value of f ( R i ) .
(4) Selection operation: a genetic algorithm simulates the process of human selection, so that excellent individuals will be selected from a group and retained, but the relatively poor individuals will be eliminated. This paper uses the roulette wheel selection method.
(5) Cross operation: the cross operation is mainly divided into two parts; one is to determine the location of intersection; the other is to exchange the positions of some structures. This paper retains the partial matching crossover operation, which is more convenient and can better inherit the father generation’s excellent genes to the next generation.
(6) Mutation operation: the mutation operation is an effective method to form a new generation. It also stimulates the mutation process of individuals. Here, the probability of mutation is tiny; usually, a value of less than 0.5 is selected.

4.2. Coverage Strategy for Subregions

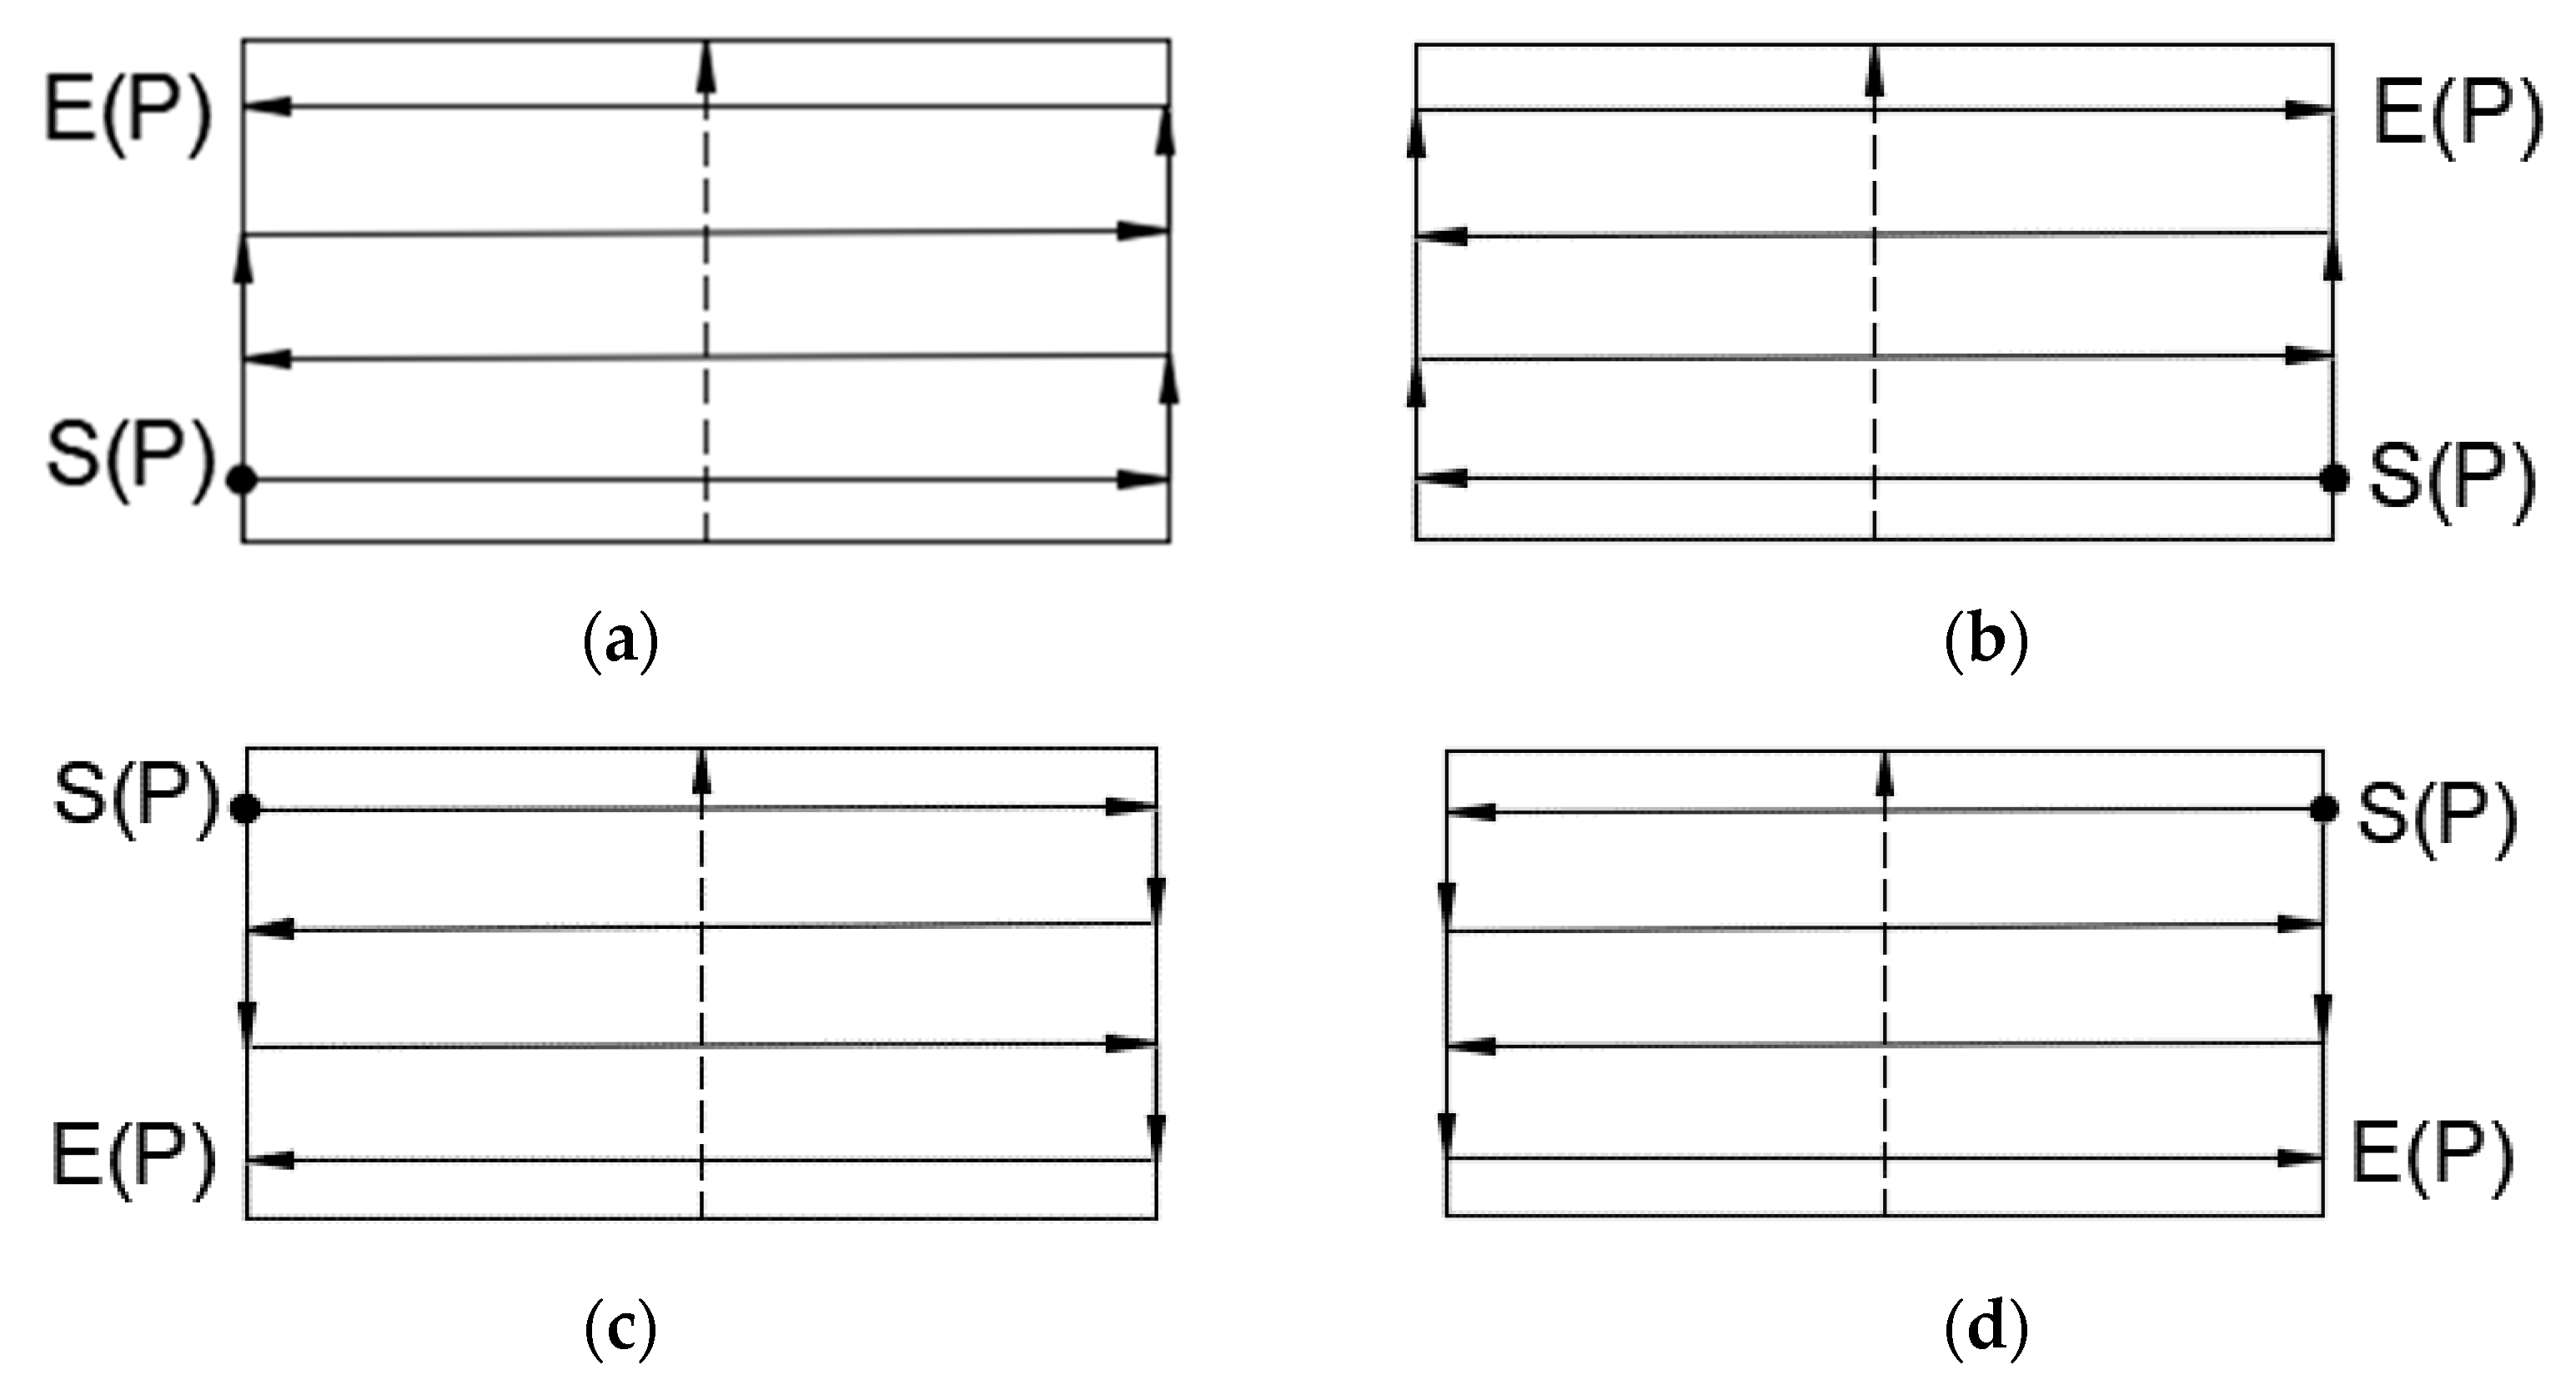
Since all the sub-regions are convex polygons, each convex polygonal area’s search direction can be determined according to the minimum width of the convex polygon. On this basis, this paper considers four covering strategies for convex polygons, taking the rectangular region in Figure 21 as an example, the S ( P ) is the start point of the area to be covered, and the E ( P ) is the end point of the area to be covered.
The total connection distance T ( P ) is
T ( P ) = d ( S ( P 1 ) , E ( P 1 ) ) + + d ( S ( P j ) , E ( P j ) ) + d ( S ( P n ) , E ( P n ) ) ,
where P j is one of the four coverage strategies, which is expressed as
P j = { a , b , c , d } ,
where a , b , c , and d represent the four different coverage modes in Figure 21.

5. Simulation and Analysis

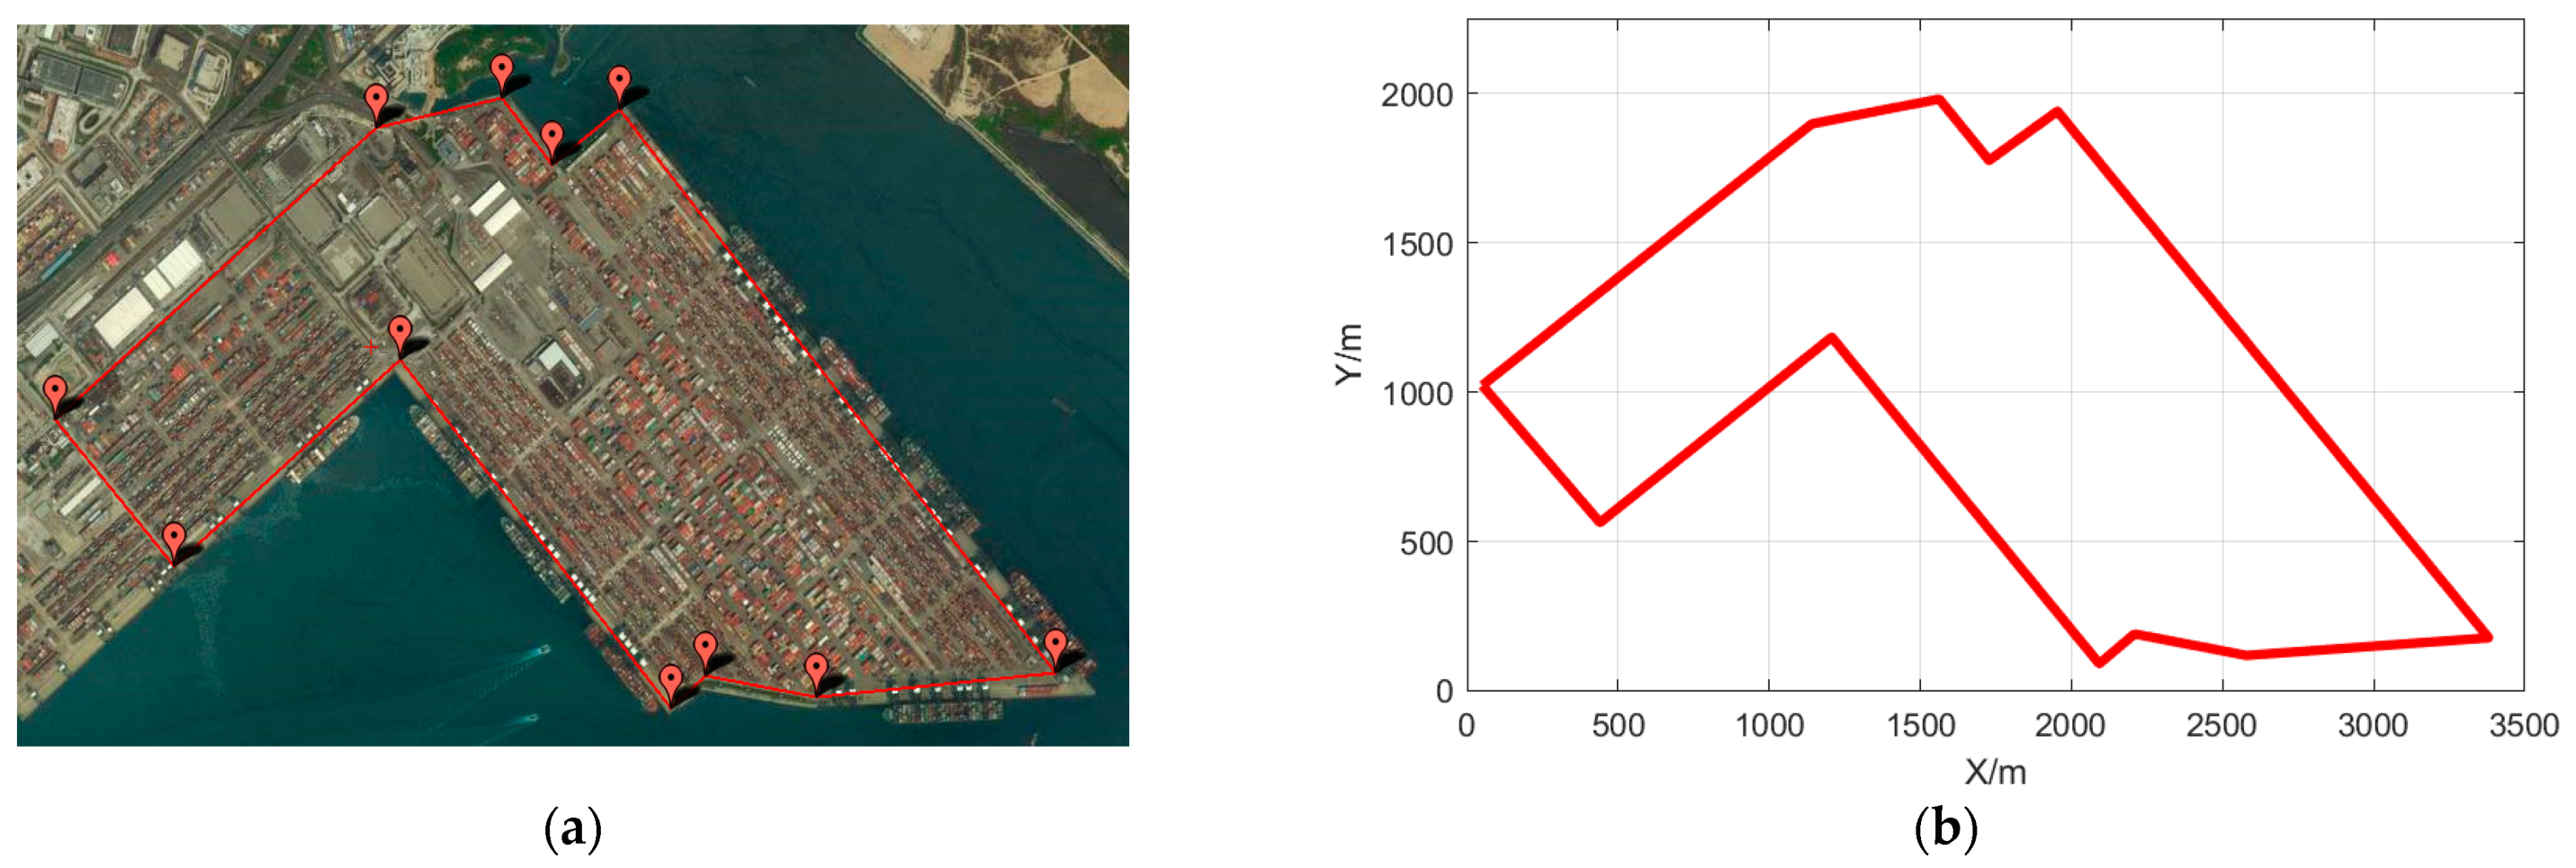
In the Yantian Port’s remote sensing map, a detection area 2 is used as the working area, as shown in Figure 22a. After transforming the coordinates of detection area 2 in Figure 22a, the environment model shown in Figure 22b is obtained.
Based on the application of the improved DFS algorithm, there are 13 different sub-region merging results, then the minimum turns of these 13 results are analyzed. After calculating each sub-region’s minimum width in each scheme, the minimum number of turns can be obtained. Table 5 shows the number of turns corresponding to each sub-region.
It can be seen from the above table that the number of turns obtained in the four schemes 7, 9, 11, and 13 is the same. Moreover, the genetic algorithm determines the shortest traversal path of these four schemes, according to each region’s barycentric coordinates. Since the number of sub-regions to be traversed is small, the UAV can traverse the shortest distance of all sub-regions without specific modifications to the GA parameters.
Table 6 shows the value range of each parameter in the GA. In this paper, the initial population size i n n is 24, the maximum iteration time g n M a x is 100, the crossover probability P c is 0.8, and the mutation probability P m is 0.2.
Table 7 shows the total distance of the center of gravity of all sub-regions in the four schemes 7, 9, 11, and 13. Among them, the shortest total distance is scheme 9, so sub-regions can be merged according to scheme 9.
Figure 23 shows the decomposition and merging diagram of the work area in scheme 9. After decomposing the working area in Figure 23a, a schematic diagram of 10 small regions is obtained. Figure 23b is a schematic diagram of 4 sub-regions obtained by merging 10 small regions by the improved DFS algorithm.
The minimum barycenter traversal distance given by No. 9 is 3871.02 m. To express the traversal order conveniently, the original small areas 2 and 3 are merged into a large area “1”, small areas 1,4, and 10 are merged into the large area “2”, small areas 5,7,8, and 9 are merged into the large area “3”, and the small area 6 is regarded as a separate area “4”. The corresponding traversal order here can be 1-2-4-3-1. The UAV can complete the coverage shooting task of each area according to this traversal order and finally return to the starting point.
Regarding scheme 9, the locations of the center of gravity of the four sub-regions are shown in Figure 23c. The positions of points 1, 2, 3, and 4 correspond to the center of gravity of sub-regions 1, 2, 3, and 4 in Figure 23b. Figure 23c is the shortest distance connection graph between regions generated by the genetic algorithm. The data in Figure 23d show that the genetic algorithm can obtain the traversal order of the shortest distance of the four sub-regions after one iteration.
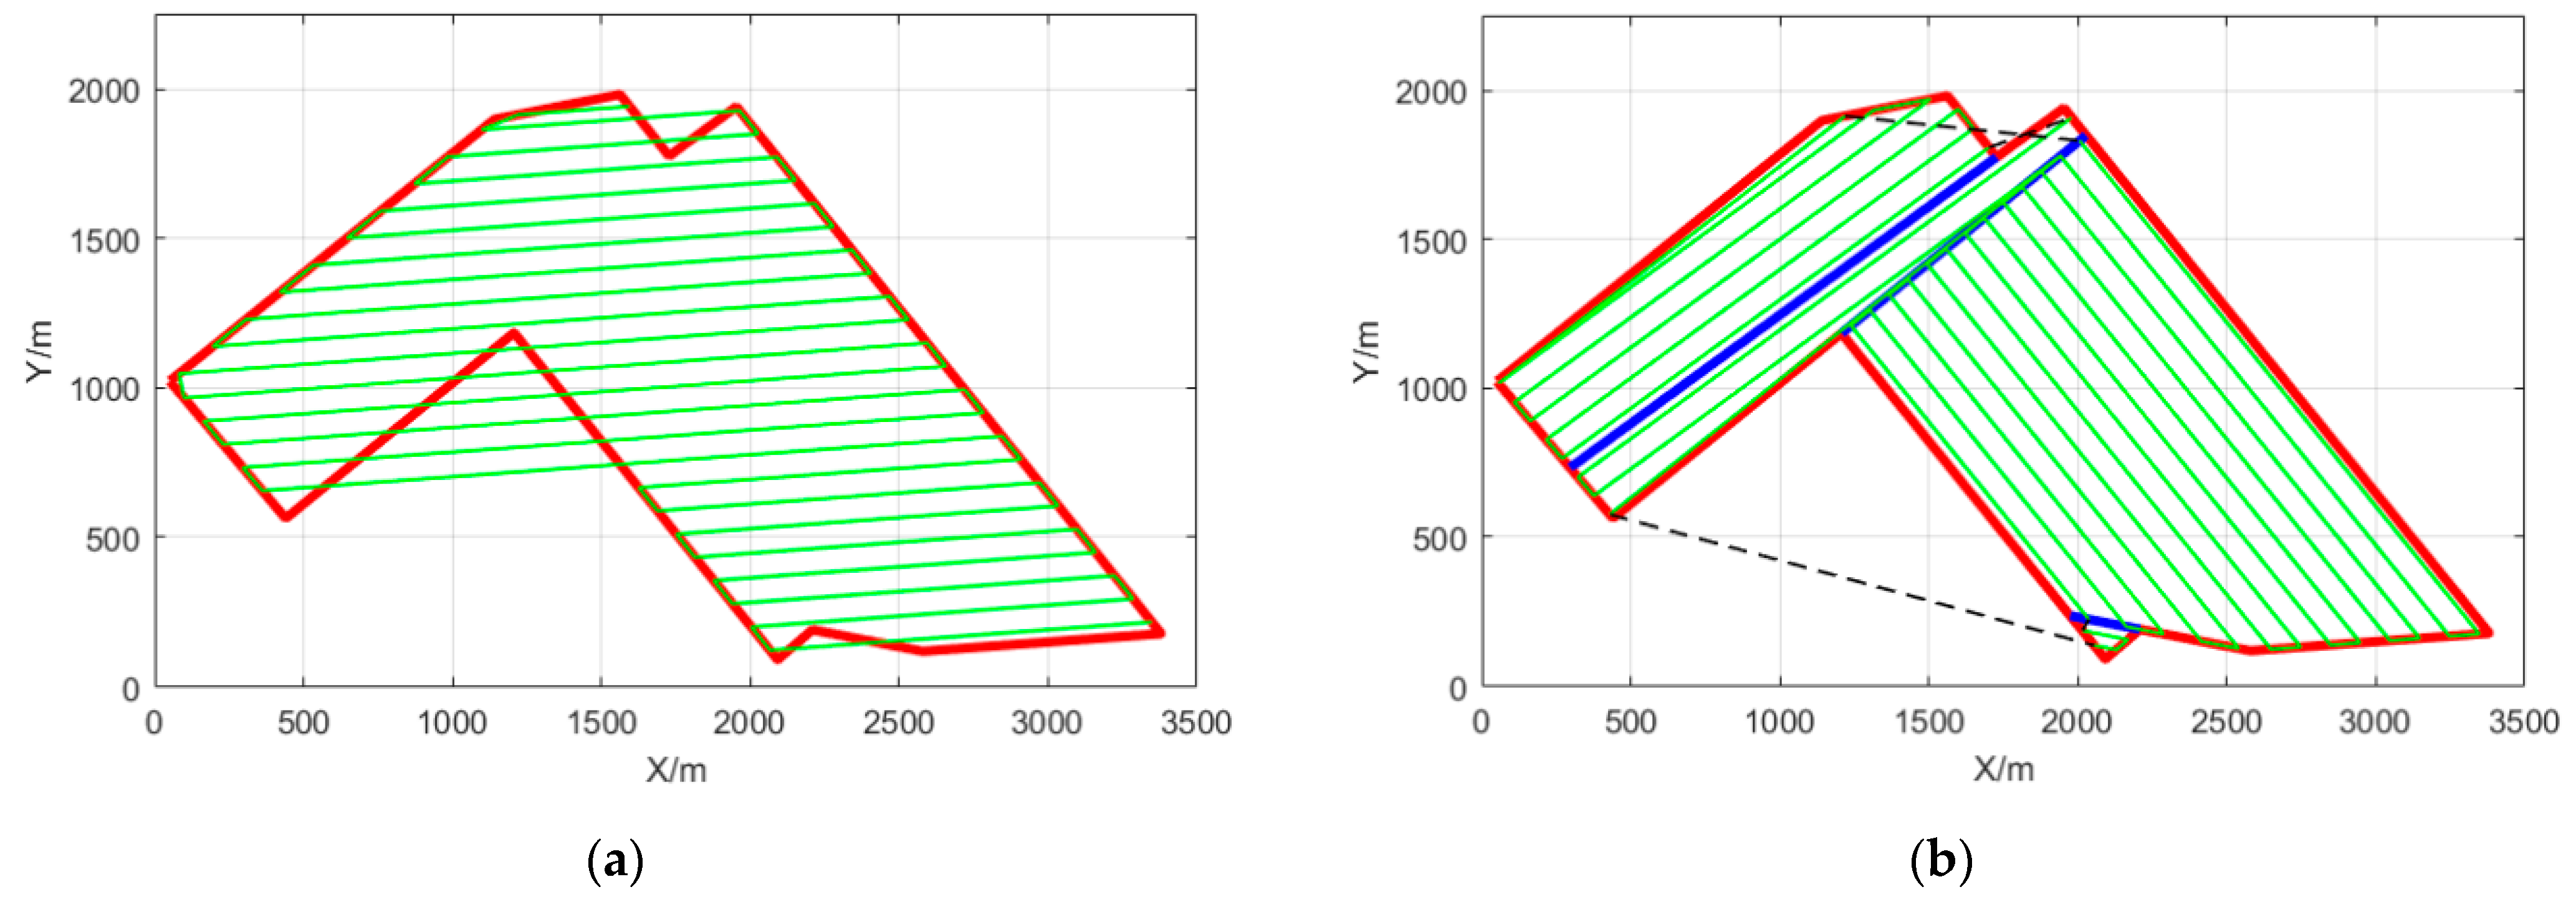
Figure 24 a, b shows the coverage path of the concave polygonal area before and after ROD. In Figure 24, the red line represents the outline of the Yantian port, and the blue line represents the dividing line between different sub-regions, the green line represents the coverage path of UAV in each area, and the black dotted line represents the connecting path of each coverage path. In the actual flight, it is necessary to place the UAV near the green path as the start point of the UAV.
In fact, the CPP approach is general enough to be applied to different UAV setups. So far, the main parameters consider the UAV flying height and speed. Further work will consider additional UAV specific parameters such as energy consumption and flight control under wind disturbance. Suppose that the UAV is equipped with the Sony A6000 camera, the specific parameters of this camera are shown in Table 8. The flight altitude of the UAV is 100 m while its flight speed is 12 m/s. The coincidence rate of the front and rear images as well as the left and right images are 30%, and the horizontal field of view of the UAV aerial photography is generally 45 degrees. According to the above information, and Equations (1) and (2), the coverage width w of the UAV can be obtained. After calculation, the coverage width w of the UAV is 82.25 m.
One of the innovations of this paper is to introduce a method of region optimization decomposition to reduce non-working paths, thereby improving the coverage search efficiency of the UAVs. Therefore, the evaluation should be oriented towards the relevant parameters of the BF path before and after the region optimization decomposition.
Merely comparing the length of the total distance and the non-working path before and after ROD cannot explain that the coverage path after ROD performs better. Therefore, coverage rate and search time are the two parameters considered to compare the path after ROD.
The search time T is used to describe the search efficiency of the UAV, which can be calculated by the following formula:
T = l t o t a l V ,
where l t o t a l is the total distance traveled by the UAV, V is the flight speed of the UAV.
The coverage rate τ is proposed to describe the effect of CPP, the coverage rate τ can be calculated as follows:
τ = l w o r k i n g l t o t a l ,
where l w o r k i n g is the total distance of the UAV in the search area.
Compared with the coverage path before the decomposition, the number of turns, the length of the working path, and the length of the non-working path are significantly reduced. The detailed comparison data before and after ROD are shown in Table 9.
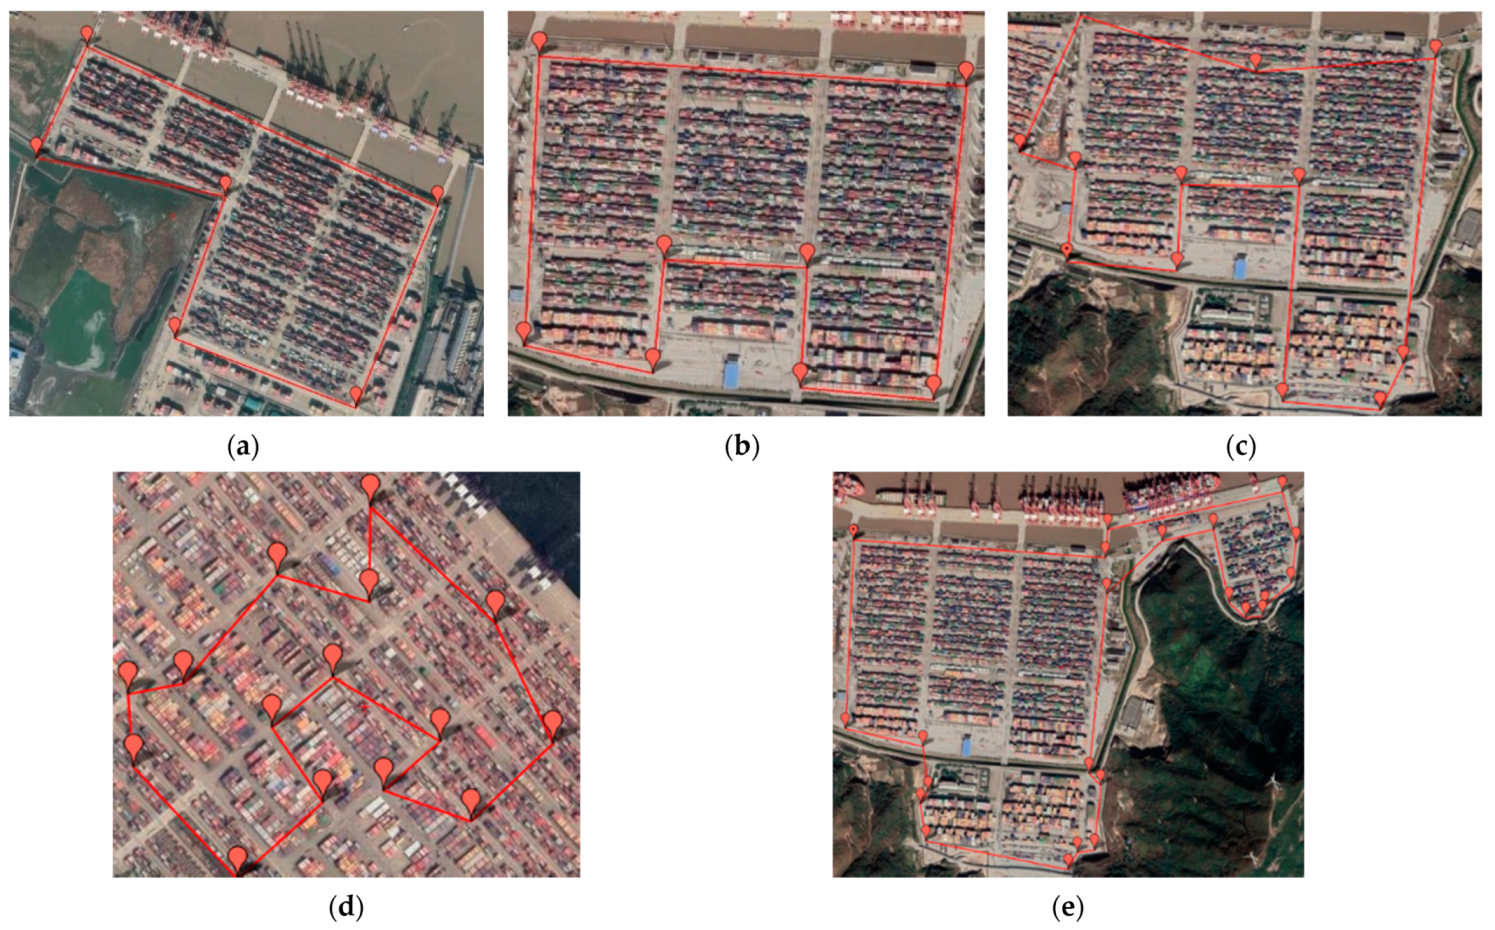
In order to illustrate the genericity of this method, five polygonal regions of different ports are selected as the working areas, as shown in Figure 25.
The five remote sensing maps illustrated in Figure 25 are from different ports. A given area in a port can be divided into different concave polygons according to inspection needs, and then the CPP of these scenes can be studied. By optimizing the decomposition of these concave polygonal regions, the superiority of the suggested method proposed can be further discussed.
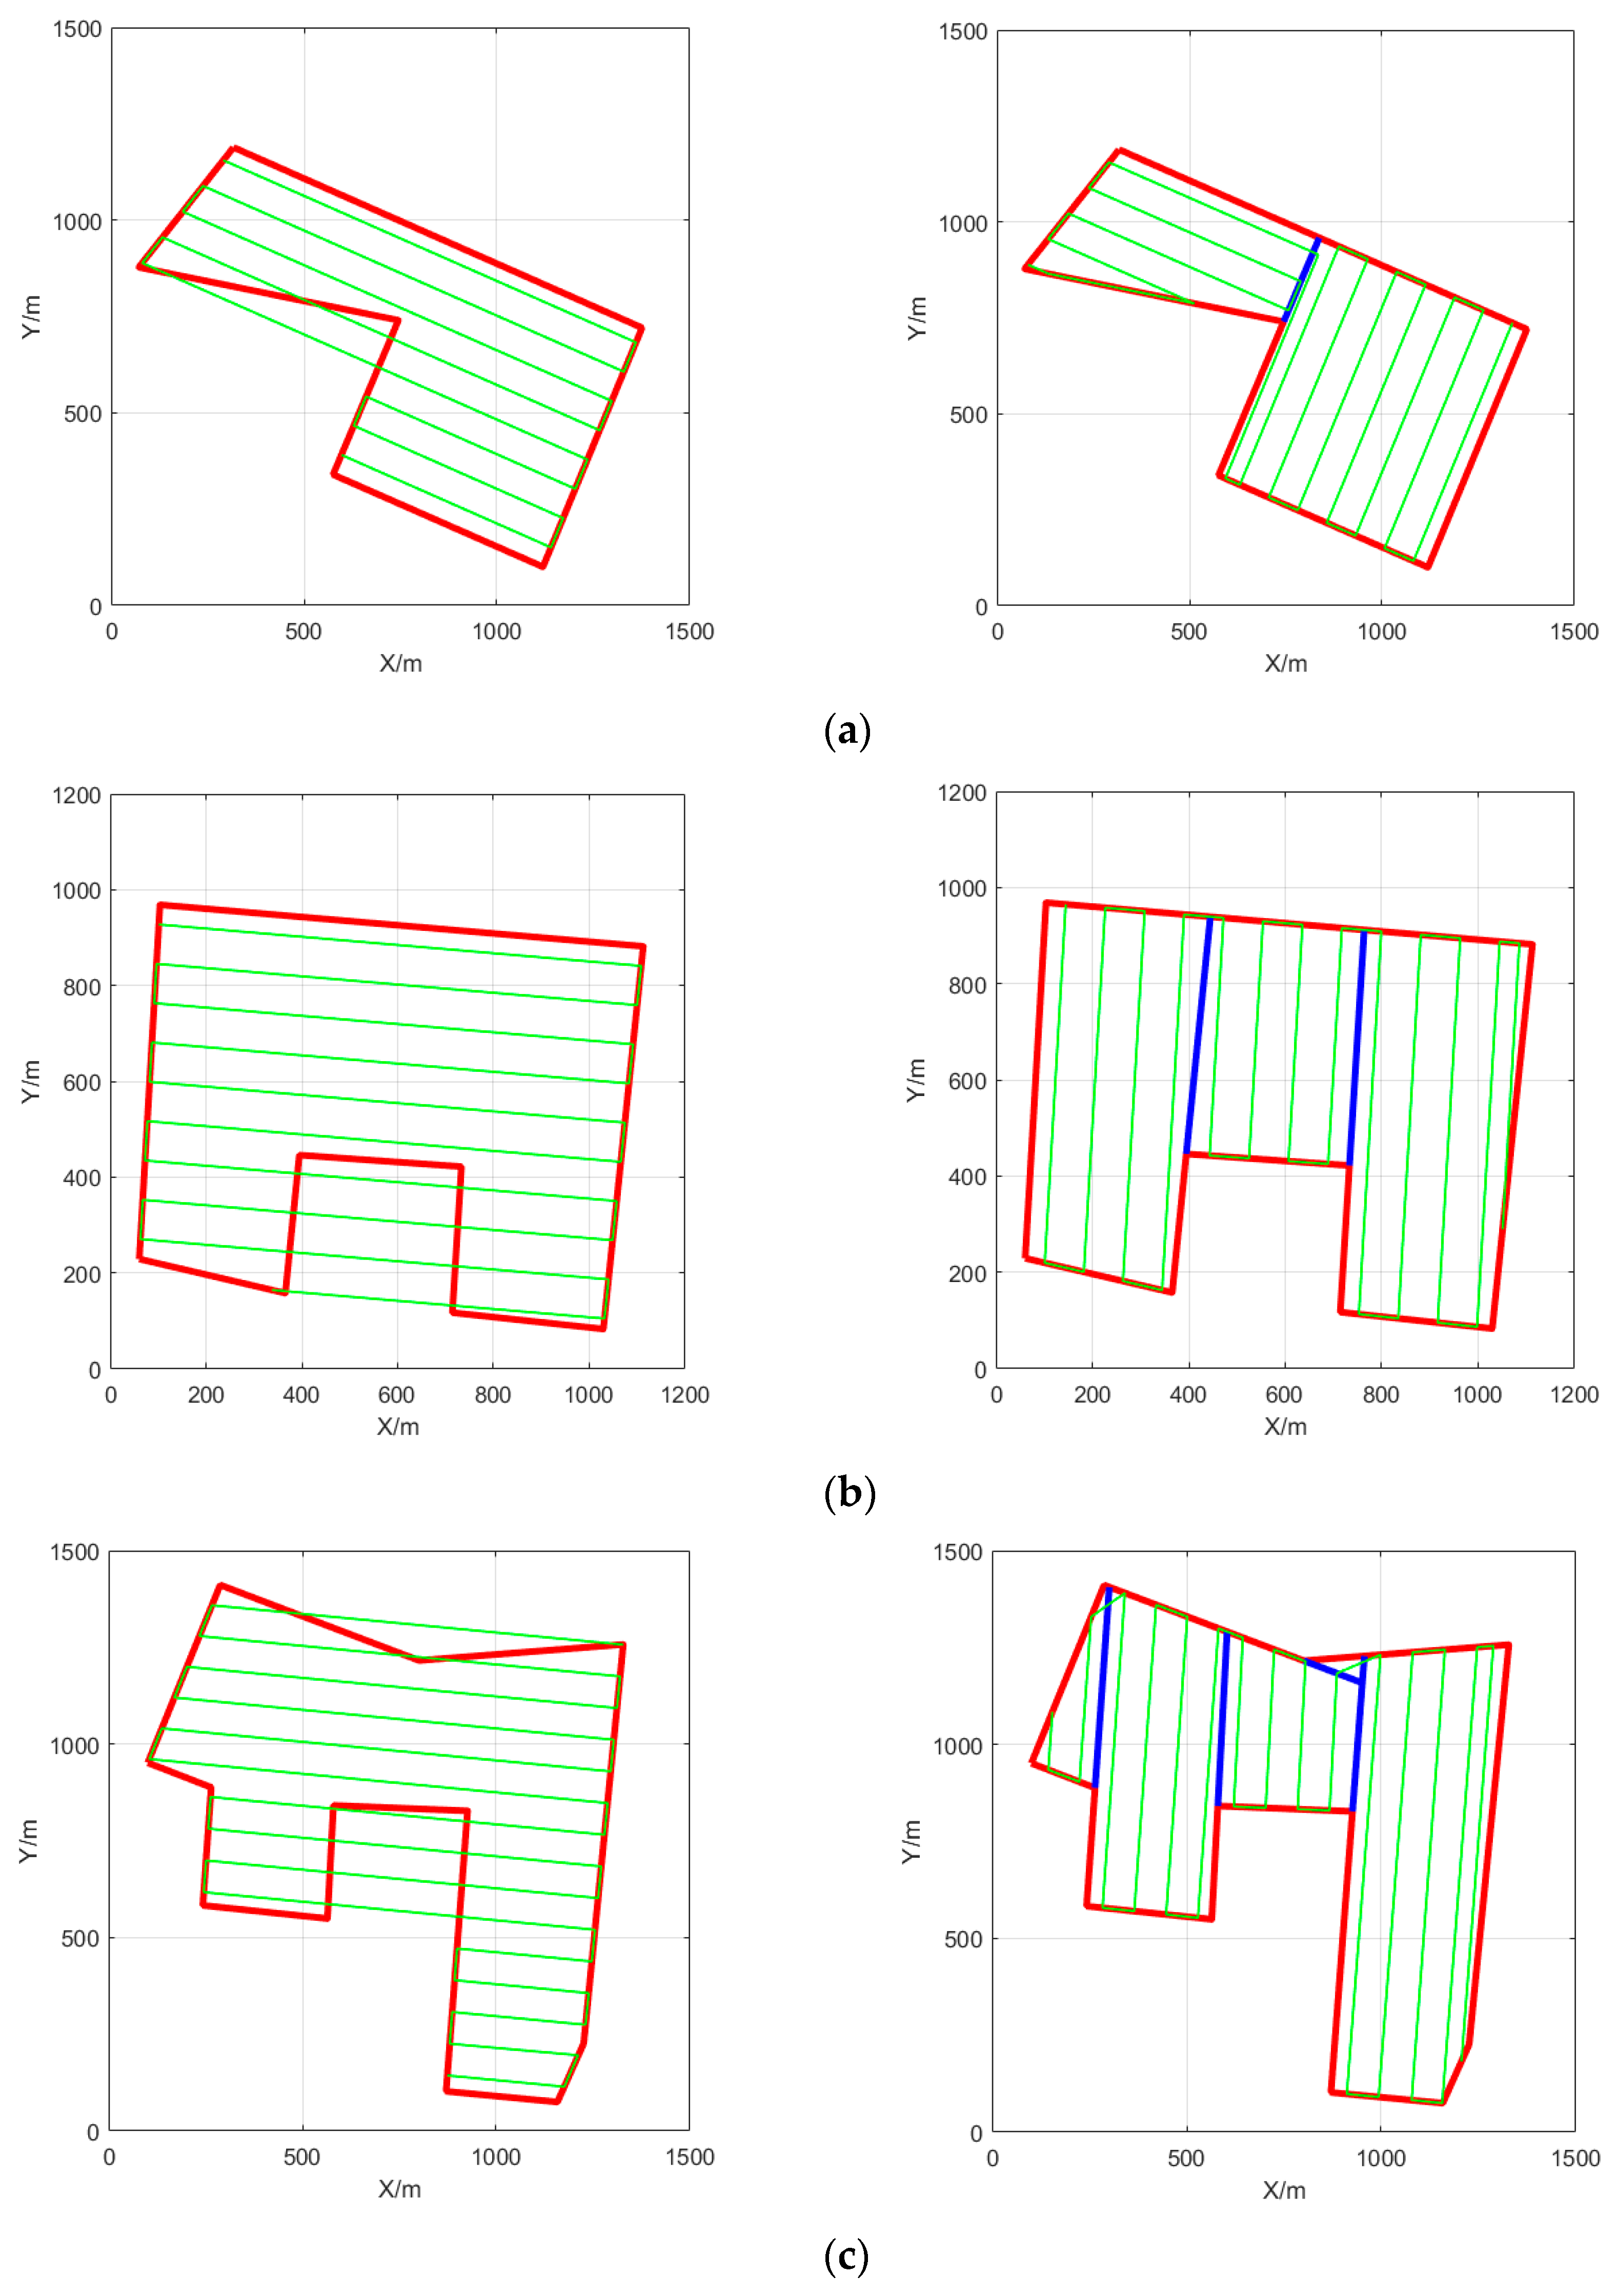
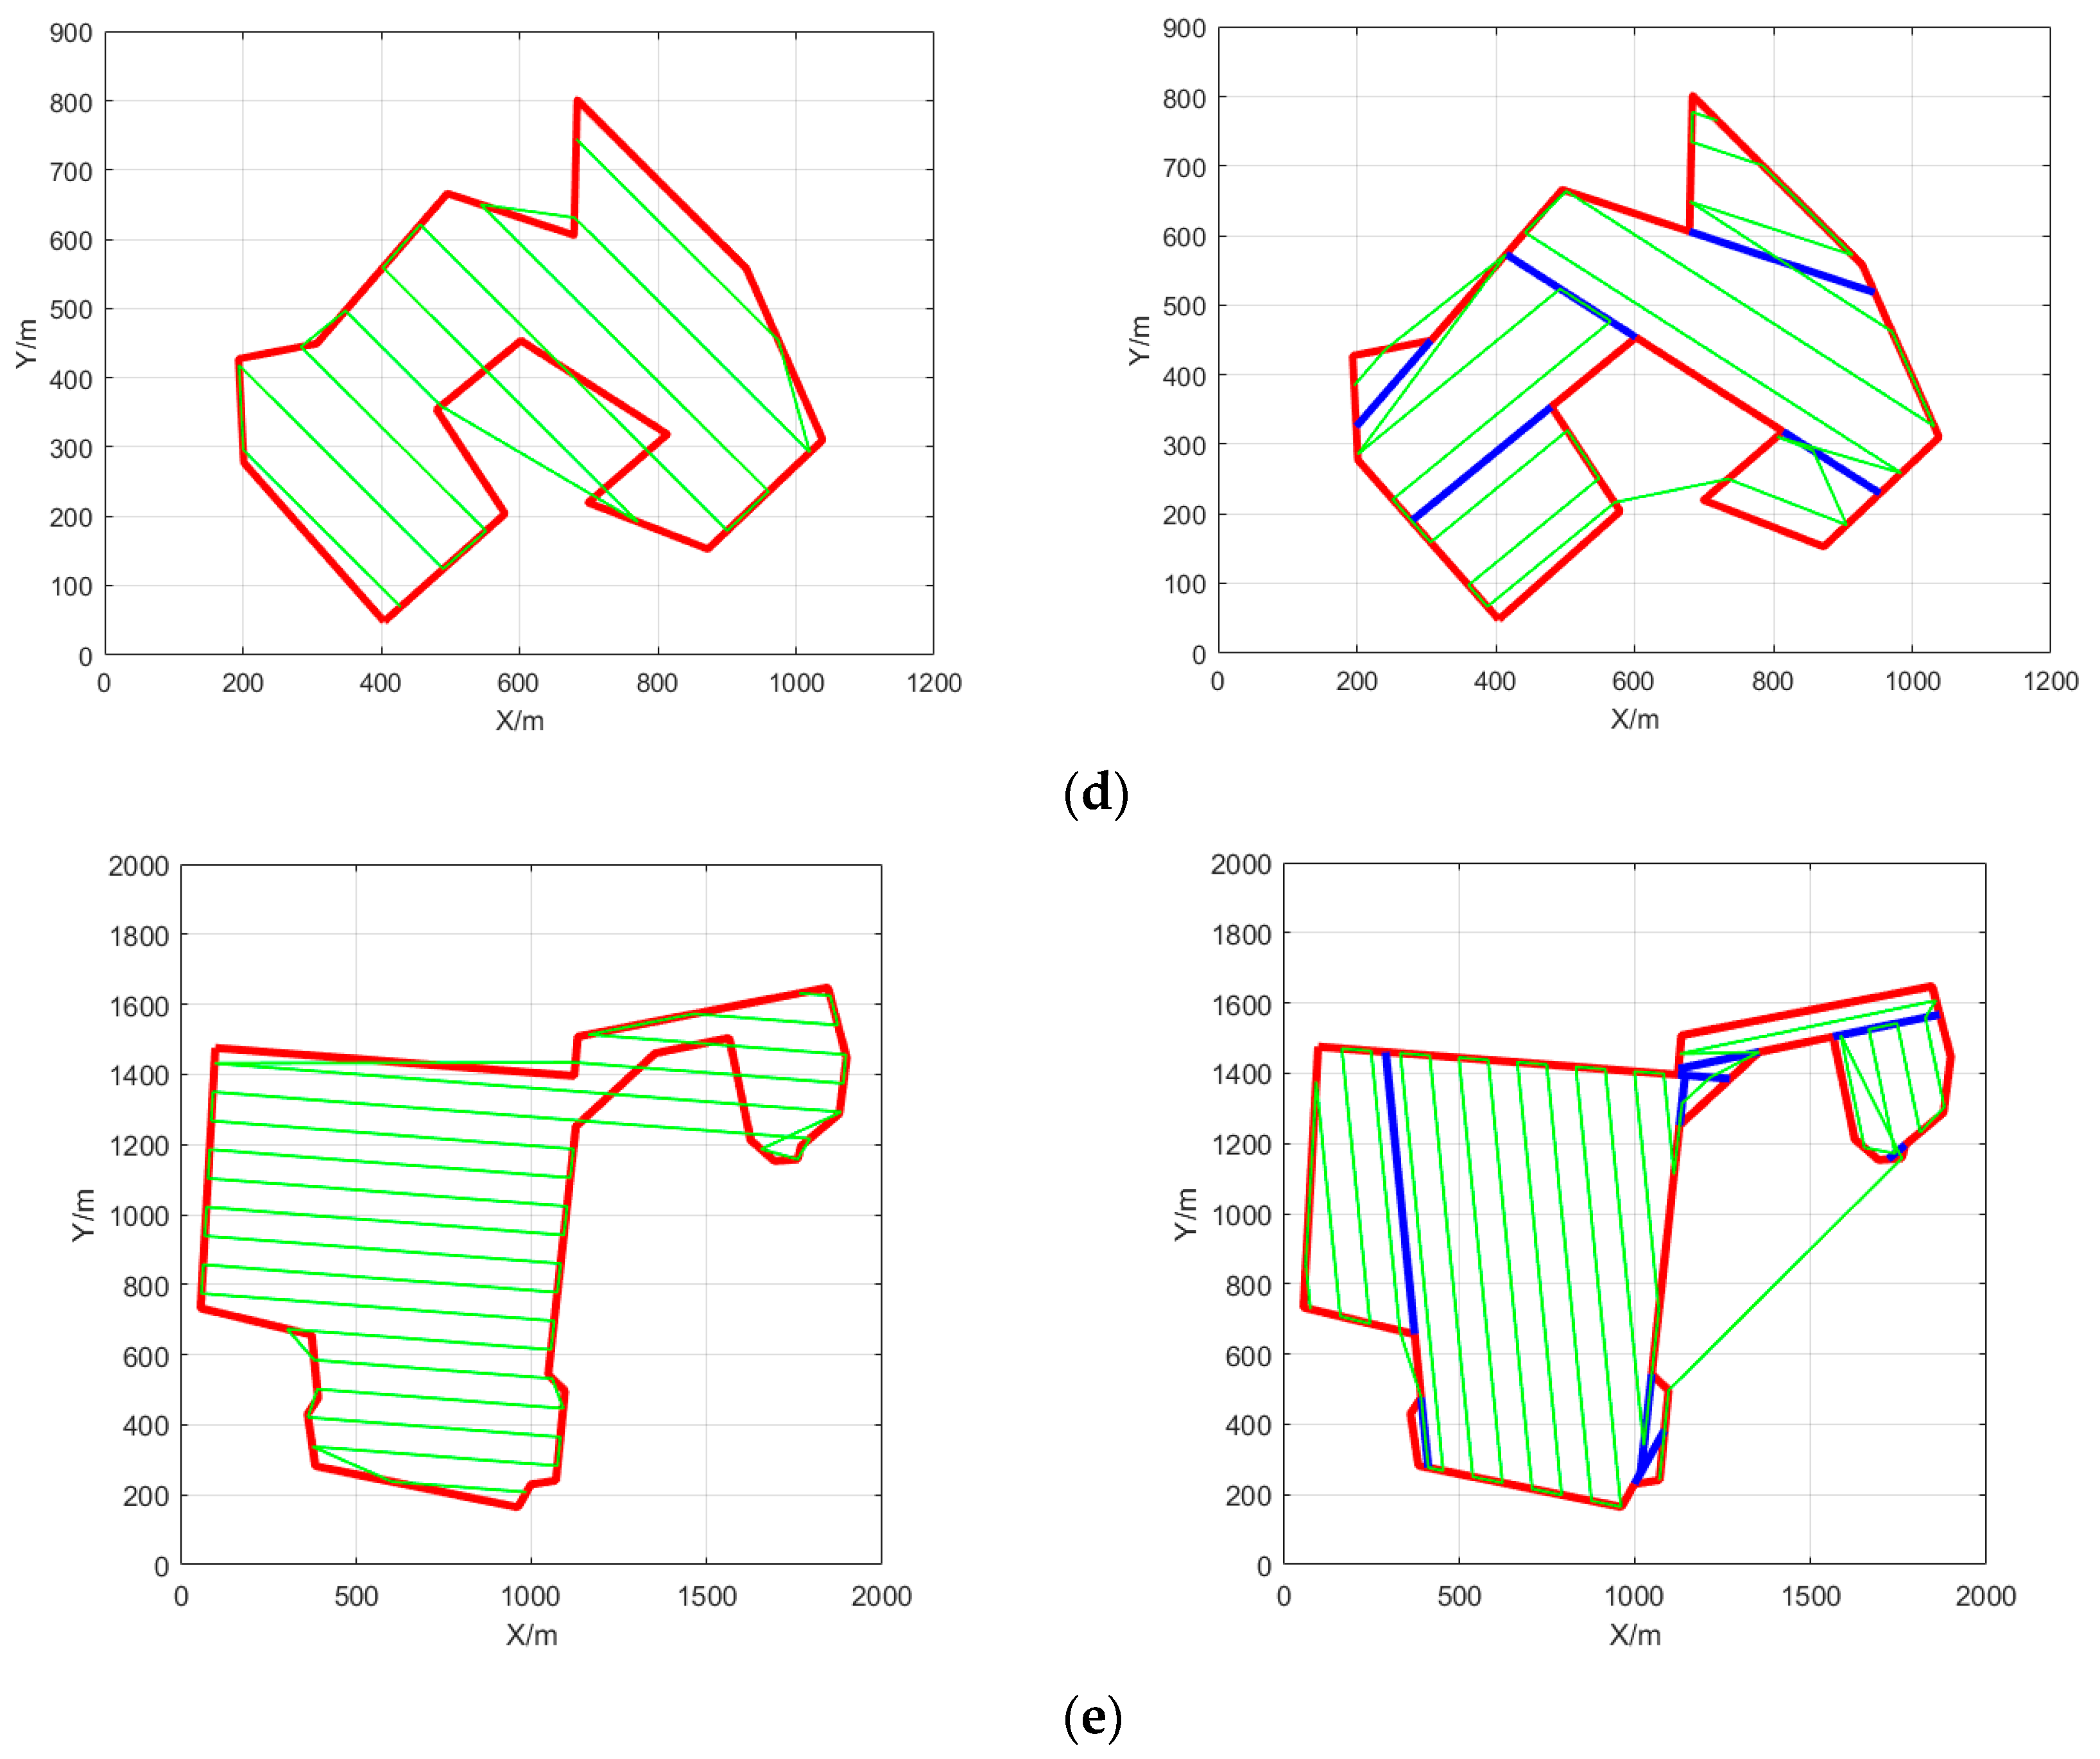
The coverage paths of the five polygonal regions before and after ROD are shown in Figure 26. The left picture is the coverage path before ROD, while the right picture is the coverage path after ROD. The areas before and after the decomposition are covered by the BF path. It can be clearly seen that after ROD, the length of the non-working path in the coverage path is significantly reduced. Similarly, the total length of the coverage path after ROD is much smaller than the coverage path before ROD.
It can be seen from Table 10 that since the UAV’s flight direction before ROD is arbitrary, the coverage path will produce additional non-working distances. We compare the number of turns of the path before and after ROD, the length of the working path, the length of the non-working distance, the total distance, the search time, and the coverage rate to illustrate the superiority of the algorithm. The path after ROD greatly reduces the non-working distance, such as area E, in which the non-working distance is reduced by 45.04%, the search time is reduced by more than 4%, and the coverage area is increased by more than 10%.

6. Conclusions

This paper introduces a CPP approach based on an optimal decomposition of concave polygons. The main idea of this method is to effectively reduce the number of sub-regions by applying an improved DFS algorithm. In order to optimize the search order of the sub-regions, we apply a genetic algorithm. Moreover, we compare the coverage path of the concave polygon port map before and after the area decomposition. It then clearly appears that the length of the coverage path after ROD is significantly reduced.
The experiments show that the approach is particularly suitable for irregular areas such as wharf yards. However, there are still many constraints to consider. For instance, we did not so far consider the influence of wind disturbances on path planning. Wind disturbance is a factor that cannot be ignored, and the impact of wind disturbances on path planning will be studied in our future work. Secondly, comparison before and after area decomposition is mainly carried out from the path length, without specific energy consumption, so the energy consumption of coverage planning is also a future research issue to consider.

Author Contributions

Conceptualization, G.T. and C.T.; methodology, G.T. and C.T.; software, G.T.; validation, G.T., C.T. and H.Z.; formal analysis, G.T.; investigation, G.T., C.T., H.Z. and C.C.; resources, G.T.; data curation, G.T. and C.T.; writing—original draft preparation, G.T.; writing—review and editing, C.C. and S.M.; visualization, C.T.; supervision, G.T.; project administration, G.T.; funding acquisition, S.M. All authors have read and agreed to the published version of the manuscript.

Funding

This research was funded in part by the National Natural Science Foundation of China under Grant 82004259, in part by the GuangDong Basic and Applied Basic Research Foundation under Grant 2020A1515110503, in part by the Young Talent Training Project of Guangzhou University of Chinese Medicine under Grant QNYC20190110.

Institutional Review Board Statement

Not applicable.

Informed Consent Statement

Not applicable.

Data Availability Statement

The data that support the findings of this study are available from the corresponding author upon reasonable request.

Conflicts of Interest

The authors declare no conflict of interest.

References

  1. Floreano, D.; Wood, R.J. Science, technology and the future of small autonomous drones. Nature 2015, 521, 460–466. [Google Scholar] [CrossRef] [PubMed] [Green Version]
  2. Comba, L.; Biglia, A.; Ricauda Aimonino, D.; Gay, P. Unsupervised detection of vineyards by 3D point-cloud UAV photogrammetry for precision agriculture. Comput. Electron. Agric. 2018, 155, 84–95. [Google Scholar] [CrossRef]
  3. Battulwar, R.; Winkelmaier, G.; Valencia, J.; Naghadehi, M.Z.; Peik, B.; Abbasi, B.; Parvin, B.; Sattarvand, J. A Practical Methodology for Generating High-Resolution 3D Models of Open-Pit Slopes Using UAVs: Flight Path Planning and Optimization. Remote Sens. 2020, 12, 2283. [Google Scholar] [CrossRef]
  4. Erdelj, M.; Saif, O.; Natalizio, E.; Fantoni, I. UAVs that fly forever: Uninterrupted structural inspection through automatic UAV replacement. Ad. Hoc. Netw. 2019, 94, 101612. [Google Scholar] [CrossRef] [Green Version]
  5. Yao, P.; Xie, Z.; Ren, P. Optimal UAV Route Planning for Coverage Search of Stationary Target in River. IEEE Trans. Control Syst. Technol. 2019, 27, 822–829. [Google Scholar] [CrossRef]
  6. Devaurs, D.; Simeon, T.; Cortes, J. Optimal Path Planning in Complex Cost Spaces with Sampling-Based Algorithms. IEEE Trans. Autom. Sci. Eng. 2016, 13, 415–424. [Google Scholar] [CrossRef] [Green Version]
  7. Ellefsen, K.O.; Lepikson, H.A.; Albiez, J.C. Multiobjective coverage path planning: Enabling automated inspection of complex, real-world structures. Appl. Soft Comput. 2017, 61, 264–282. [Google Scholar] [CrossRef] [Green Version]
  8. Krishna Lakshmanan, A.; Elara Mohan, R.; Ramalingam, B.; Vu Le, A.; Veerajagadeshwar, P.; Tiwari, K.; Ilyas, M. Complete coverage path planning using reinforcement learning for Tetromino based cleaning and maintenance robot. Autom. Constr. 2020, 112, 103078. [Google Scholar] [CrossRef]
  9. Macleod, C.N.; Dobie, G.; Pierce, S.G.; Summan, R.; Morozov, M. Machining-Based Coverage Path Planning for Automated Structural Inspection. IEEE Trans. Autom. Sci. Eng. 2018, 15, 202–213. [Google Scholar] [CrossRef] [Green Version]
  10. Hameed, I.A.; La Cour-Harbo, A.; Osen, O.L. Side-to-side 3D coverage path planning approach for agricultural robots to minimize skip/overlap areas between swaths. Robot. Autonom. Syst. 2016, 76, 36–45. [Google Scholar] [CrossRef]
  11. Cabreira, T.; Brisolara, L.; Ferreira, P.R., Jr. Survey on Coverage Path Planning with Unmanned Aerial Vehicles. Drones 2019, 3, 4. [Google Scholar] [CrossRef] [Green Version]
  12. Vasquez-Gomez, J.I.; Marciano-Melchor, M.; Valentin, L.; Herrera-Lozada, J.C. Coverage Path Planning for 2D Convex Regions. J. Intell. Robot. Syst. 2020, 97, 81–94. [Google Scholar] [CrossRef]
  13. Torres, M.; Pelta, D.A.; Verdegay, J.L.; Torres, J.C. Coverage path planning with unmanned aerial vehicles for 3D terrain reconstruction. Expert Syst. Appl. 2016, 55, 441–451. [Google Scholar] [CrossRef]
  14. Wu, C.; Dai, C.; Gong, X.; Liu, Y.-J.; Wang, J.; Gu, X.D.; Wang, C.C.L. Energy-Efficient Coverage Path Planning for General Terrain Surfaces. IEEE Robot. Autom. Lett. 2019, 4, 2584–2591. [Google Scholar] [CrossRef]
  15. Cabreira, T.M.; Franco, C.D.; Ferreira, P.R.; Buttazzo, G.C. Energy-Aware Spiral Coverage Path Planning for UAV Photogrammetric Applications. IEEE Robot. Autom. Lett. 2018, 3, 3662–3668. [Google Scholar] [CrossRef]
  16. Jensen, M.F.; Bochtis, D.; Sørensen, C.G. Coverage planning for capacitated field operations, part II: Optimisation. Biosyst. Eng. 2015, 139, 149–164. [Google Scholar] [CrossRef]
  17. Bogaerts, B.; Sels, S.; Vanlanduit, S.; Penne, R. A Gradient-Based Inspection Path Optimization Approach. IEEE Robot. Autom. Lett. 2018, 3, 2646–2653. [Google Scholar] [CrossRef]
  18. Nilsson, R.S.; Zhou, K. Method and bench-marking framework for coverage path planning in arable farming. Biosyst. Eng. 2020, 198, 248–265. [Google Scholar] [CrossRef]
  19. Samaniego, F.; Sanchis, J.; García-Nieto, S.; Simarro, R. Recursive Rewarding Modified Adaptive Cell Decomposition (RR-MACD): A Dynamic Path Planning Algorithm for UAVs. Electronics 2019, 8, 306. [Google Scholar] [CrossRef] [Green Version]
  20. Nair, V.G.; Guruprasad, K.R. MR-SimExCoverage: Multi-robot Simultaneous Exploration and Coverage. Comput. Electr. Eng. 2020, 85, 106680. [Google Scholar] [CrossRef]
  21. Guastella, D.C.; Cantelli, L.; Giammello, G.; Melita, C.D.; Spatino, G.; Muscato, G. Complete coverage path planning for aerial vehicle flocks deployed in outdoor environments. Comput. Electr. Eng. 2019, 75, 189–201. [Google Scholar] [CrossRef]
  22. Song, J.; Gupta, S. ε*: An Online Coverage Path Planning Algorithm. IEEE Trans. Robot. 2018, 34, 526–533. [Google Scholar] [CrossRef]
  23. Kan, X.; Teng, H.; Karydis, K. Online Exploration and Coverage Planning in Unknown Obstacle-Cluttered Environments. IEEE Robot. Autom. Lett. 2020, 5, 5969–5976. [Google Scholar] [CrossRef]
  24. Bircher, A.; Kamel, M.; Alexis, K.; Burri, M.; Oettershagen, P.; Omari, S.; Mantel, T.; Siegwart, R. Three-dimensional coverage path planning via viewpoint resampling and tour optimization for aerial robots. Auton. Robots 2016, 40, 1059–1078. [Google Scholar] [CrossRef]
  25. Ghaddar, A.; Merei, A.; Natalizio, E. PPS: Energy-Aware Grid-Based Coverage Path Planning for UAVs Using Area Partitioning in the Presence of NFZs. Sensors 2020, 20, 3742. [Google Scholar] [CrossRef]
  26. Xie, L.; Xue, S.; Zhang, J.; Zhang, M.; Tian, W.; Haugen, S. A path planning approach based on multi-direction A* algorithm for ships navigating within wind farm waters. Ocean Eng. 2019, 184, 311–322. [Google Scholar] [CrossRef]
  27. Han, G.; Zhou, Z.; Zhang, T.; Wang, H.; Liu, L.; Peng, Y.; Guizani, M. Ant-Colony-Based Complete-Coverage Path-Planning Algorithm for Underwater Gliders in Ocean Areas with Thermoclines. IEEE Trans. Veh. Technol. 2020, 69, 8959–8971. [Google Scholar] [CrossRef]
  28. Coombes, M.; Fletcher, T.; Chen, W.-H.; Liu, C. Optimal Polygon Decomposition for UAV Survey Coverage Path Planning in Wind. Sensors 2018, 18, 2132. [Google Scholar] [CrossRef] [Green Version]
  29. Nielsen, L.D.; Sung, I.; Nielsen, P. Convex Decomposition for a Coverage Path Planning for Autonomous Vehicles: Interior Extension of Edges. Sensors 2019, 19, 4165. [Google Scholar] [CrossRef] [Green Version]
  30. Jensen-Nau, K.R.; Hermans, T.; Leang, K.K. Near-Optimal Area-Coverage Path Planning of Energy-Constrained Aerial Robots with Application in Autonomous Environmental Monitoring. IEEE Trans. Autom. Sci. Eng. 2020. [Google Scholar] [CrossRef]
  31. Huang, W.H. Optimal line-sweep-based decompositions for coverage algorithms. In Proceedings of the 2001 ICRA IEEE International Conference on Robotics and Automation, Seoul, Korea, 21–26 May 2001. [Google Scholar]
  32. Li, Y.; Chen, H.; Joo Er, M.; Wang, X. Coverage path planning for UAVs based on enhanced exact cellular decomposition method. Mechatronics 2011, 21, 876–885. [Google Scholar] [CrossRef]
  33. Bolourian, N.; Hammad, A. LiDAR-equipped UAV path planning considering potential locations of defects for bridge inspection. Autom. Constr. 2020, 117, 103250. [Google Scholar] [CrossRef]
  34. Mansouri, S.S.; Kanellakis, C.; Georgoulas, G.; Kominiak, D.; Gustafsson, T.; Nikolakopoulos, G. 2D visual area coverage and path planning coupled with camera footprints. Control Eng. Pract. 2018, 75, 1–16. [Google Scholar] [CrossRef]
  35. Phung, M.D.; Quach, C.H.; Dinh, T.H.; Ha, Q. Enhanced discrete particle swarm optimization path planning for UAV vision-based surface inspection. Autom. Constr. 2017, 81, 25–33. [Google Scholar] [CrossRef]
Figure 1. Remote sensing map of detection area 1.
Remotesensing 13 01525 g001
Figure 2. Geodetic coordinate system to the rectangular coordinate system.
Remotesensing 13 01525 g002
Figure 3. Area map 1 in a simulation environment.
Remotesensing 13 01525 g003
Figure 4. Three common coverage patterns. (a) Back-and-forth; (b) spiral; (c) random.
Remotesensing 13 01525 g004
Figure 5. Satellite map of the port. (a) Yantian Port; (b) Yangshan Port; (c) Ningbo Port; (d) Shenzhen Port.
Remotesensing 13 01525 g005aRemotesensing 13 01525 g005b
Figure 6. A simplified model of Unmanned Aerial Vehicle (UAV) photography. (a) Main view of UAV aerial photography; (b) top view of UAV photography.
Remotesensing 13 01525 g006
Figure 7. The overlap of the projected area in the horizontal and vertical directions.
Remotesensing 13 01525 g007
Figure 8. Different search direction of UAV. (a) Vertical search direction; (b) horizontal search direction.
Remotesensing 13 01525 g008
Figure 9. Method to determine the minimum width of convex polygon. (a) Rotary caliper method; (b) vertex perpendicular method.
Remotesensing 13 01525 g009
Figure 10. Coverage path of concave polygonal area before decomposition.
Remotesensing 13 01525 g010
Figure 11. Flowchart of CPP for a port area.
Remotesensing 13 01525 g011
Figure 12. Decomposition of the concave polygons. (a) Concave polygonal area; (b) decomposition of concave polygonal area; (c) undirected graph of sub-regions.
Remotesensing 13 01525 g012
Figure 13. Case 1. (a) Undirected graph of three nodes; (b) merging graph of three sub-regions.
Remotesensing 13 01525 g013
Figure 14. Case 2. (a) Undirected graph of four nodes; (b) merging graph of three sub-regions.
Remotesensing 13 01525 g014
Figure 15. Flowchart of the improved DFS algorithm.
Remotesensing 13 01525 g015
Figure 16. Decomposition of undirected graphs.
Remotesensing 13 01525 g016
Figure 17. Schematic diagram of a search queue starting from node 6.
Remotesensing 13 01525 g017
Figure 18. Undirected graph decomposition and sub-region merging based on node 6. (a) Scheme 1; (b) scheme 2; (c) scheme 3; (d) scheme 4.
Remotesensing 13 01525 g018
Figure 19. Concave polygonal area.
Remotesensing 13 01525 g019
Figure 20. Four different decomposition methods. (a) Line sweep decomposition methods; (b) MSA decomposition method; (c) enhanced exact cellular decomposition method; (d) improved DFS method.
Remotesensing 13 01525 g020
Figure 21. Four different coverage strategies. (a) Search direction 1; (b) search direction 2; (c) search direction 3; (d) search direction 4.
Remotesensing 13 01525 g021
Figure 22. Remote sensing map and area map of the detection area 2. (a) Remote sensing map of detection area 2; (b) area map 2.
Remotesensing 13 01525 g022
Figure 23. Decomposition and consolidation of detection area 2. (a) Decomposition of detection area 2; (b) consolidation of detection area 2; (c) schematic diagram of gravity center of detection area 2; (d) iterative process of the genetic algorithm.
Remotesensing 13 01525 g023
Figure 24. Coverage path before and after ROD. (a) Coverage path before ROD; (b) coverage path after ROD.
Remotesensing 13 01525 g024
Figure 25. Five different shapes of detection areas. (a) Area A; (b) area B; (c) area C; (d) area D; (e) area E.
Remotesensing 13 01525 g025
Figure 26. Coverage path of five areas before and after ROD. (a) Path comparison of area A; (b) path comparison of area B; (c) path comparison of area C; (d) path comparison of area D; (e) path comparison of area E.
Remotesensing 13 01525 g026aRemotesensing 13 01525 g026b
Table 1. Geodetic coordinates of the vertex of detection area 1.
Vertex Latitude   ( B / o E ) Longitude   ( L / o N )
V 1 30.598914122.130204
V 2 30.597834122.130161
V 3 30.596985122.131277
V 4 30.596736122.132810
V 5 30.597059122.133250
V 6 30.598914122.134119
V 7 30.600769122.131598
Table 2. Rectangular coordinate of the vertices of detection area 1.
Vertex Abscissa   ( x / m ) Ordinate   ( y / m )
V 1 137.041282.073
V 2 137.041151.113
V 3 242.18157.954
V 4 381.02419.121
V 5 434.28164.257
V 6 528.112290.218
V 7 275.239503.332
Table 3. All accessible node queues.
Serial NumberAccessible Node Queue
16-5-4-3, 1-2, 8-9-10, 7
26-5-4-3, 1-2, 7-8, 9-10
36-5-9-10-4, 2-3, 1, 7-8
46-5-9-10-4, 1-2, 3, 7-8
51-2-3-4, 5-6-9, 7-8, 10
61-2-3-4, 10, 5-9-8-7, 6
71-2-3-4, 6, 8-9-10, 5-7
81-2-3-4, 7, 5-6, 8-9-10
91-4-10, 2-3, 5-7-8-9, 6
101-4-10, 2-3, 6-5-9, 7-8
113-4-5-7, 6, 1-2, 8-9-10
124-5-7-8-9-10, 6, 1-2, 3
134-5-7-8-9-10, 6, 2-3, 1
Table 4. Comparison of parameters between different algorithms.
ParametersLine SweepMSAEnhanced Exact Cellular Decomposition Improved DFS
Number of sub-regions1686
Types of sub-region combinations39107
Minimum height of the sub-region5.314.4054.8454.405
Table 5. The number of turns for each scheme.
Serial NumberNumber of Turns
156
262
362
472
564
648
744
856
944
1062
1144
1256
1344
Table 6. Range of genetic algorithm parameters.
ParameterSet ValueInfluence of Set Value
Population size i n n 20~100The i n n is too small, errors will easily occur; the i n n is too large, the stability will decrease.
Maximum iteration times g n M a x 100~500The g n M a x is too small, it is not easy to converge; the g n M a x is too large, it will cause waste.
Crossover probability P c 0.4~0.99The P c is too small, the population cannot be updated effectively; the P c is too large, the randomness will increase.
Mutation probability P m 0.0001~0.1The P m is too small, the population diversity will deteriorate; the P m is too large, the higher-order mode will be destroyed.
Table 7. The total distance to traverse the center of gravity of all sub-regions in the four schemes.
Serial NumberDistance/m
74358.76
93817.02
114578.41
134153.53
Table 8. Sony A6000 camera parameters.
Camera SpecificationsCamera Detail
CameraSony A6000
Camera dimension120.0 mm × 66.9 mm × 45.1 mm
Camera weight285 g
Mega pixels24.3
Type of camera sensor23.5 mm × 15.6 mm (APS-C)
Speed of shutter0.00025 to 30 s
Speed of flash sync0.00625 s
Table 9. Path comparison of detection area 2 before and after ROD.
Path ParametersBefore RODAfter RODPercentage Reduction/%
Number of turns46444.34
Working distance/m39,616.8739,263.830.89
Non-Working distance/m4014.842813.8129.91
Total distance/m43,631.7142,077.643.56
Search time/s3635.983506.473.56
Coverage rate/%90.893.3−2.5
Table 10. Path comparison of five different areas before and after ROD.
Area
Number
Path
Parameters
Before
ROD
After
ROD
Percentage
Reduction/%
ANumber of turns1423−64.29
Working distance/m7527.267593.360.88
Non-working distance/m844.600-
Total distance/m8371.867593.369.30
Search time/s697.66632.789.31
Coverage rate/%89.910010.1
BNumber of turns1824−33.33
Working distance/m9184.599517.803.63
Non-working distance/m1378.850-
Total distance/m10,563.449517.809.90
Search time/s880.29793.159.91
Coverage rate/%86.910013.1
CNumber of turns28280
Working distance/m11,553.4911,524.430.25
Non-working distance/m2232.880-
Total distance/m13,786.3711,524.4316.41
Search time/s1148.86960.3616.41
Coverage rate/%83.810016.2
DNumber of turns1626−62.5
Working distance/m4134.824159.71−0.60
Non-working distance/m890.19553.8837.78
Total distance/m5025.014713.596.20
Search time/s418.75392.806.21
Coverage rate/%82.310017.7
ENumber of turns3742−13.5
Working distance/m18,654.9018,574.660.43
Non-working distance/m2069.051137.0945.04
Total distance/m20,723.9519,711.754.88
Search time/s1726.991642.654.88
Coverage rate/%9010010
Publisher’s Note: MDPI stays neutral with regard to jurisdictional claims in published maps and institutional affiliations.