1. Introduction
The development of an architectural element is usually based on public planning aimed at preserving and bringing citizens closer to the restored element, but in a parallel and inherent way, it can also become the epicenter of a series of economic and social activities. That a property influences its environment in the social or economic field is clear, but the extent to which the rehabilitation of a building generates synergies capable of boosting local development or gentrification processes is not so obvious.
Local development and gentrification have been studied separately as almost antagonistic processes. Local development is based on the continuous improvement of available resources and particularly of natural resources and of historical and cultural heritage buildings, because this can contribute to the area having a greater competitive advantage and the well-being of the population [
1] by enabling the establishment of new businesses and jobs and, ultimately, a social transformation. Gentrification processes, in contrast, tend to focus on the expulsion or exit of social classes with fewer resources from a neighborhood due to the increase in rents and changes in the commercial structure and, ultimately, a general increase in prices. Both of these processes have a common factor, namely, local economic and social transformation.
The success of the rehabilitation of a property from the local and social economic standpoint lies in the participation of citizens and public and private entities that, within their scope of action, can make decisions about their own assets that have a direct impact on their surroundings [
2].
The aim of this article is to study the influence that the recovery of buildings can exert on their surroundings, transforming adjacent businesses and initiating parallel processes of gentrification and local development. A correct interpretation of the relationship between heritage, society, and business is one of the challenges that urban recovery policy must overcome and it is thus necessary to understand the mechanisms that lead to local economic development associated with unique architectural elements. Within the framework of the research that supports this article, economic and architectural analysis of source documents prepared by local administrations was used. This is in addition to sampling as a result of direct observation.
To study these processes, the article is structured as follows: first, the theoretical debate between local development and gentrification is described. Secondly, an analysis is carried out regarding the transformation of the adjacent area following the rehabilitation of a singular building located in one of three cities located on the Spanish Mediterranean coast (Barcelona, Valencia, and Almeria). Finally, the conclusions and limitations of the investigation are presented.
2. State of the Art: Gentrification and Local Development
The literature which studies gentrification and local development as part of the same process is not abundant because these processes have generally been investigated as opposite sides of the same coin. Studies on gentrification processes have generally considered them to be harmful or contain detrimental elements that cause loss of social identity and commercial transformation in a society primarily based on economic factors. In contrast, studies on local development are usually associated with the gradual enhancement of material or intangible elements of an area which improve the quality of life of its residents.
The term gentrification, coined in 1964 by Ruth Glass [
3] after observing changes in the social structure and the real estate market of London when the working classes were displaced by a thriving middle class, has since been used to refer to movements linked to its economic development that provoke the entry and exit of different populations in neighborhoods. Thus, gentrification processes are considered from two perspectives—the social and the economic.
A notable part of the literature on gentrification has considered that social and cultural patterns form the foundation of changes in neighborhoods that are not merely economic [
4,
5,
6,
7]. However, a significant number of researchers have argued that gentrification is a capital movement, highlighting the economic and commercial transformation of neighborhoods and cities [
8,
9,
10].
Although the gentrification of a neighborhood can be a vital tool for urban renewal and can create opportunities by changing market forces through the establishment of new businesses and increasing the sales in existing businesses [
11,
12], as previously mentioned, most authors highlight the undesirable consequences of the process, such as unemployment or the increase in rental prices for ethnic and low-income minorities living in high-density neighborhoods [
13,
14]. However, it is important not to confuse gentrification with speculation, because whether or not there is a direct relationship between these terms remains controversial [
3,
15].
In contrast, local development is understood to be a set of ground-up actions from the area itself that promote socio-economic development [
1,
16], improve incomes, and increase employment opportunities and the quality of life of the inhabitants [
17]. It also encompasses not only a chain of economic factors that influence the prosperity of a certain area, but also a series of geophysical, social, and economic characteristics that create a certain “breeding ground” that facilitates the proliferation of activities that result in the well-being of an area [
18,
19].
Local economic development strategies [
5,
20] envisage the geographical area, not as a simple space or a mere functional support, but as an agent of social transformation, where the socially organized territory and its social, cultural, and historical features are also very important aspects.
The fact that development experiences in similar environments can produce totally different results shows the difficulty of finding a common thread in the activities that promote local development. Moreover, economic growth in areas, which in principle are not developed [
21,
22], can lead to optimal local development while at the same time be considered a clear failure in terms of the sustainable development model of that same region. Thus, development strategy plans must consider economic and social dimensions to obtain satisfactory results [
23,
24].
The above notwithstanding, even when the population enjoys a favorable geographical enclave, adequate raw materials, and sufficient institutional support, if the entrepreneurial population does not trust the generation of their own employment and the creation of companies that create opportunities for the future, all efforts will be in vain. This will result in businesses being forced to transfer to other locations as part of the classic gentrification process. The actions carried out on a property, from a holistic point of view, can affect the quality of life of the population and transform the local production system. Accordingly, entrepreneurial initiatives are stimulated as a result of the improvement in the quality of the basic infrastructures, thus signaling the beginning of a virtuous (or vicious) circle of development.
Gentrification and local development share common features because both are processes of social transformation which can lead to substantial improvements in the commercial fabric of an area. These processes can arise spontaneously, although they could also be planned. The biggest difference between the two processes is subjective. In contrast to local development initiatives, gentrification does not consider the settlement of the population in the territory, nor is their participation in the transformative process considered to be a priority.
From the perspective of the rehabilitation or enhancement of heritage structures, it is generally accepted that urban or local development needs to be accompanied by a program of actions and investments, agreed upon between the different administrations, in order to revitalize the historic space and a general development of the local area.
This multidimensional approach to the city brings together socio-spatial and political dimensions [
25] and requires both intervention and recovery of the existing structures, in addition to social and political elements [
26] (e.g., the quality of housing, the environment, or the real needs of the affected population).
Authors such as Friedmann [
27], Campbell [
28], Leigh and Blakely [
29] and Jewson and MacGregor [
30], among others, stress that, together with physical factors, the progress obtained by the exploitation of a resource is linked to the political attitude of local authorities because private activity is often attracted by the granting of subsidies and public aid.
Property itself is an endogenous resource available to local development, which itself promotes an economically attractive environment. Microenterprises housed within the renovated building are linked to the pre-existing commercial fabric of local businesses [
31], encouraging change, innovation, and creative destruction.
One of the problems with urban rehabilitations is that the revaluation that an area experiences after a public investment usually has an economic impact by increasing the price of homes and rental properties [
32], producing the expulsion or displacement of local businesses and the original resident population [
33]. These businesses are later replaced by others with greater purchasing power that do not have roots in the area, endangering the intrinsic social networks in the neighborhood or locality, and generating a class conflict associated with urban transformation with an imposition of the dominant strata of social and market rules, that is, a negative gentrifying process. However, much more important than the destruction of jobs in obsolete activities, it is important to replace those activities with new ones, of higher quality and productive differentiation, which are more environmentally sustainable [
34]; in short, a positive gentrification process [
31,
35].
When we add to all the above the phenomenon of the touristification of urban spaces [
36], changes in the dynamics of neighborhoods occur which can interfere in the relationships of social actors, producing new forms of sociability. Thus, associated gentrification should be taken into account as a side effect characterized by uncertain results [
37]. The key to the success of tourism as a sustainable activity from a social point of view does not lie in the transformation of society and local culture in favor of tourism development, but rather, the activity must be integrated into existing social and productive schema.
Urban recovery from the functional perspective needs clearly defined urban projects and an integral vision of the heritage system with business activity as their main ally. Local development policies that are committed to a potentiality based on architectural projects and the development of services and industries for urban revitalization [
31] can engender entrepreneurial movements related to tourism-cultural sectors.
The rehabilitation of an architectural heritage structure may be the basis on which business or tourism activities are developed [
38], but by itself does not constitute a process of business concentration or a gentrifying tourist attraction.
3. The Use of Neural Computing Techniques in the Scientific Literature
The use of neural computing techniques is not new in the scientific literature. The work in the fields of classification, approximation of functions, and identification of notable elements within images and complex data sets has become a distinctive feature of research in recent years. Since the 1990s, the use of these techniques has been extended to all fields of science and technology.
Neural networks are classification systems based on models in which the distribution of the sample is unknown and in which there is little, changing or, in some cases, contradictory knowledge (
Figure 1). Its architecture is based on the available knowledge of the nervous system of animals, mathematical models related to the approximation of functions, statistics and information theory, and to the field of physics and statistical mechanics.
A relevant feature of these types of tools is their ability to generalize and find the underlying representation in the sample of the content domain being studied.
Current data interpretation and analysis systems use a wide range of neural network architectures.
Self-organizing maps are neural networks with matrix architecture and competitive learning. The structure of this classification technique [
39,
40] has been developed from the perceptual model of vision in humans and has proven to be a powerful classification and clustering tool when there is no knowledge of the distribution of probability of the sample to be classified even when the application domain uses a different metric from the Euclidean following the schema of Martínez et al. [
41].
In an attempt to simulate the nervous structure of the retina of a mammal, a self-organizing map is formed by a set of elements, also referred to analogously as neurons, which are spatially arranged in a mesh and which exhibit, among others features, the property of locality, wherein every element of the mesh (neuron) has neighboring elements with which it shares common characteristics regarding how to act when an entry occurs. Each of these neurons has an internal structure (called a reference vector) with a dimension and structure identical to that of the input samples.
In a self-organizing map, for a given input, only one of these neurons can be activated. This is achieved by adapting their internal structure by means of an iterative training procedure, whereby each neuron, when presented with an input that has a similar internal structure, adapts its own structure to become even more similar, and modifies the structure of neighboring neurons to distance them from the activated neuron.
This process increases the probability that, for a given input, it is only that neuron that is activated, and not those in its vicinity.
It has also been shown to be convergent to a solution when the number of iterations is “high enough” to stabilize the modifications in the network.
The training of a self-organizing map is an iterative process in which a set of training samples are presented successively to the network, and, for each of these, the network reacts by adapting the internal structure of the element to one that more closely resembles the input while at the same time changing the internal structure of other elements in its vicinity in order to prevent them from being activated by said input.
This process is repeated for all the samples in a set, and a sufficient number of times so that the variations in the internal structure of the network elements are not significant. At that time, a state of equilibrium will have been reached and the network is ready to go into the operational phase.
Thus, it could be said that this iterative process is convergent and generates a consistent classification related to the distances of the vectors involved in the training.
4. Materials and Methods
Self-organizing maps have been applied extensively in the field of science and technology. They have been used by Hung and Tsai [
42], Froement et al. [
43], and Munoz [
44] for the analysis of economic models; Hewitson and Grane [
45] and Song et al. [
46] in climatology studies; and Liu and Bai [
47] for the analysis of problems in engineering and systems theory.
Our initial hypothesis is that when the rehabilitation of a singular building is carried out in an urban center, a double process is generated: first, local development as a form of sustainable economic impulse, and second, commercial gentrification due to renewed business activity.
To verify the validity of the proposition, significant data on business activity has been observed and collected, including variations in the commercial premises, their refurbishments, the degree of occupancy, and the average price of homes in the area of influence of the property.
4.1. Selection of Singular Buildings
The selection of properties (
Table 1) that serves as the basis of this study took into account the following parameters:
Location: To attain a more homogenized study, where the externalities could be similar, the selection was limited to Spanish provincial capitals located on the Mediterranean coast. The aim is that elements such as tourist pressure, meteorology, or social conditions should not distort the research. In addition, the properties are all located in or near the city center.
Demography: The three cities were chosen for their representativeness in terms of their population. Barcelona widely exceeds one million residents, whereas Valencia is slightly less than half a million. Almeria, meanwhile, represents the “middle” city [
48]. Results were extrapolated to populations regardless of their size.
Type of property: The buildings were constructed at the beginning of the 20th century and were totally or partially restored before 2013. The choice of this year is based on the fact that it is considered the final year of the economic crisis during the study period (2008–2018). In addition, buildings were sought which shared similar artistic and architectural styles.
Table 1.
Factsheet about the singular buildings studied.
Table 1.
Factsheet about the singular buildings studied.
| Name of Building | Casa Fuster |
| Year of Construction | 1910 | Year of renovation | 2004 and 2017 |
| City | Barcelona | Population | 1,620,809 |
| Distance to City center | 3 km | Current Use | Hotel |
| Other notable characteristics: |
- -
Facade restored in 2017. - -
Located in the Paseo de Gracia in Barcelona. - -
Luxury Hotel.
|
| Name of Building | Marqués del Turia 12 |
| Year of Construction | 1920 | Year of renovation | 2012 |
| City | Valencia | Population | 787,808 |
| Distance to City center | 1 km | Current Use | Commercial and office space |
| Other notable characteristics: |
- -
Located in Gran Vía Marques del Turia, part of the Valencia’s urban expansion plan of 1884.
|
| Name of Building | Casa de las Mariposas |
| Year of Construction | 1912 | Year of renovation | 2010 |
| City | Almería | Population | 195,389 |
| Distance to City center | 0 m. | Current Use | Corporate |
| Other notable characteristics: |
- -
Corporate headquarters of a financial entity. - -
Frequently used by the municipal council for public events.
|
4.2. Data Acquisition and Geographic Radius of the Study
As with the selection of buildings, information on the average price of rent and sale of commercial premises and flats in the area was prepared according to the data provided by companies specialized in property valuation and real estate web portals.
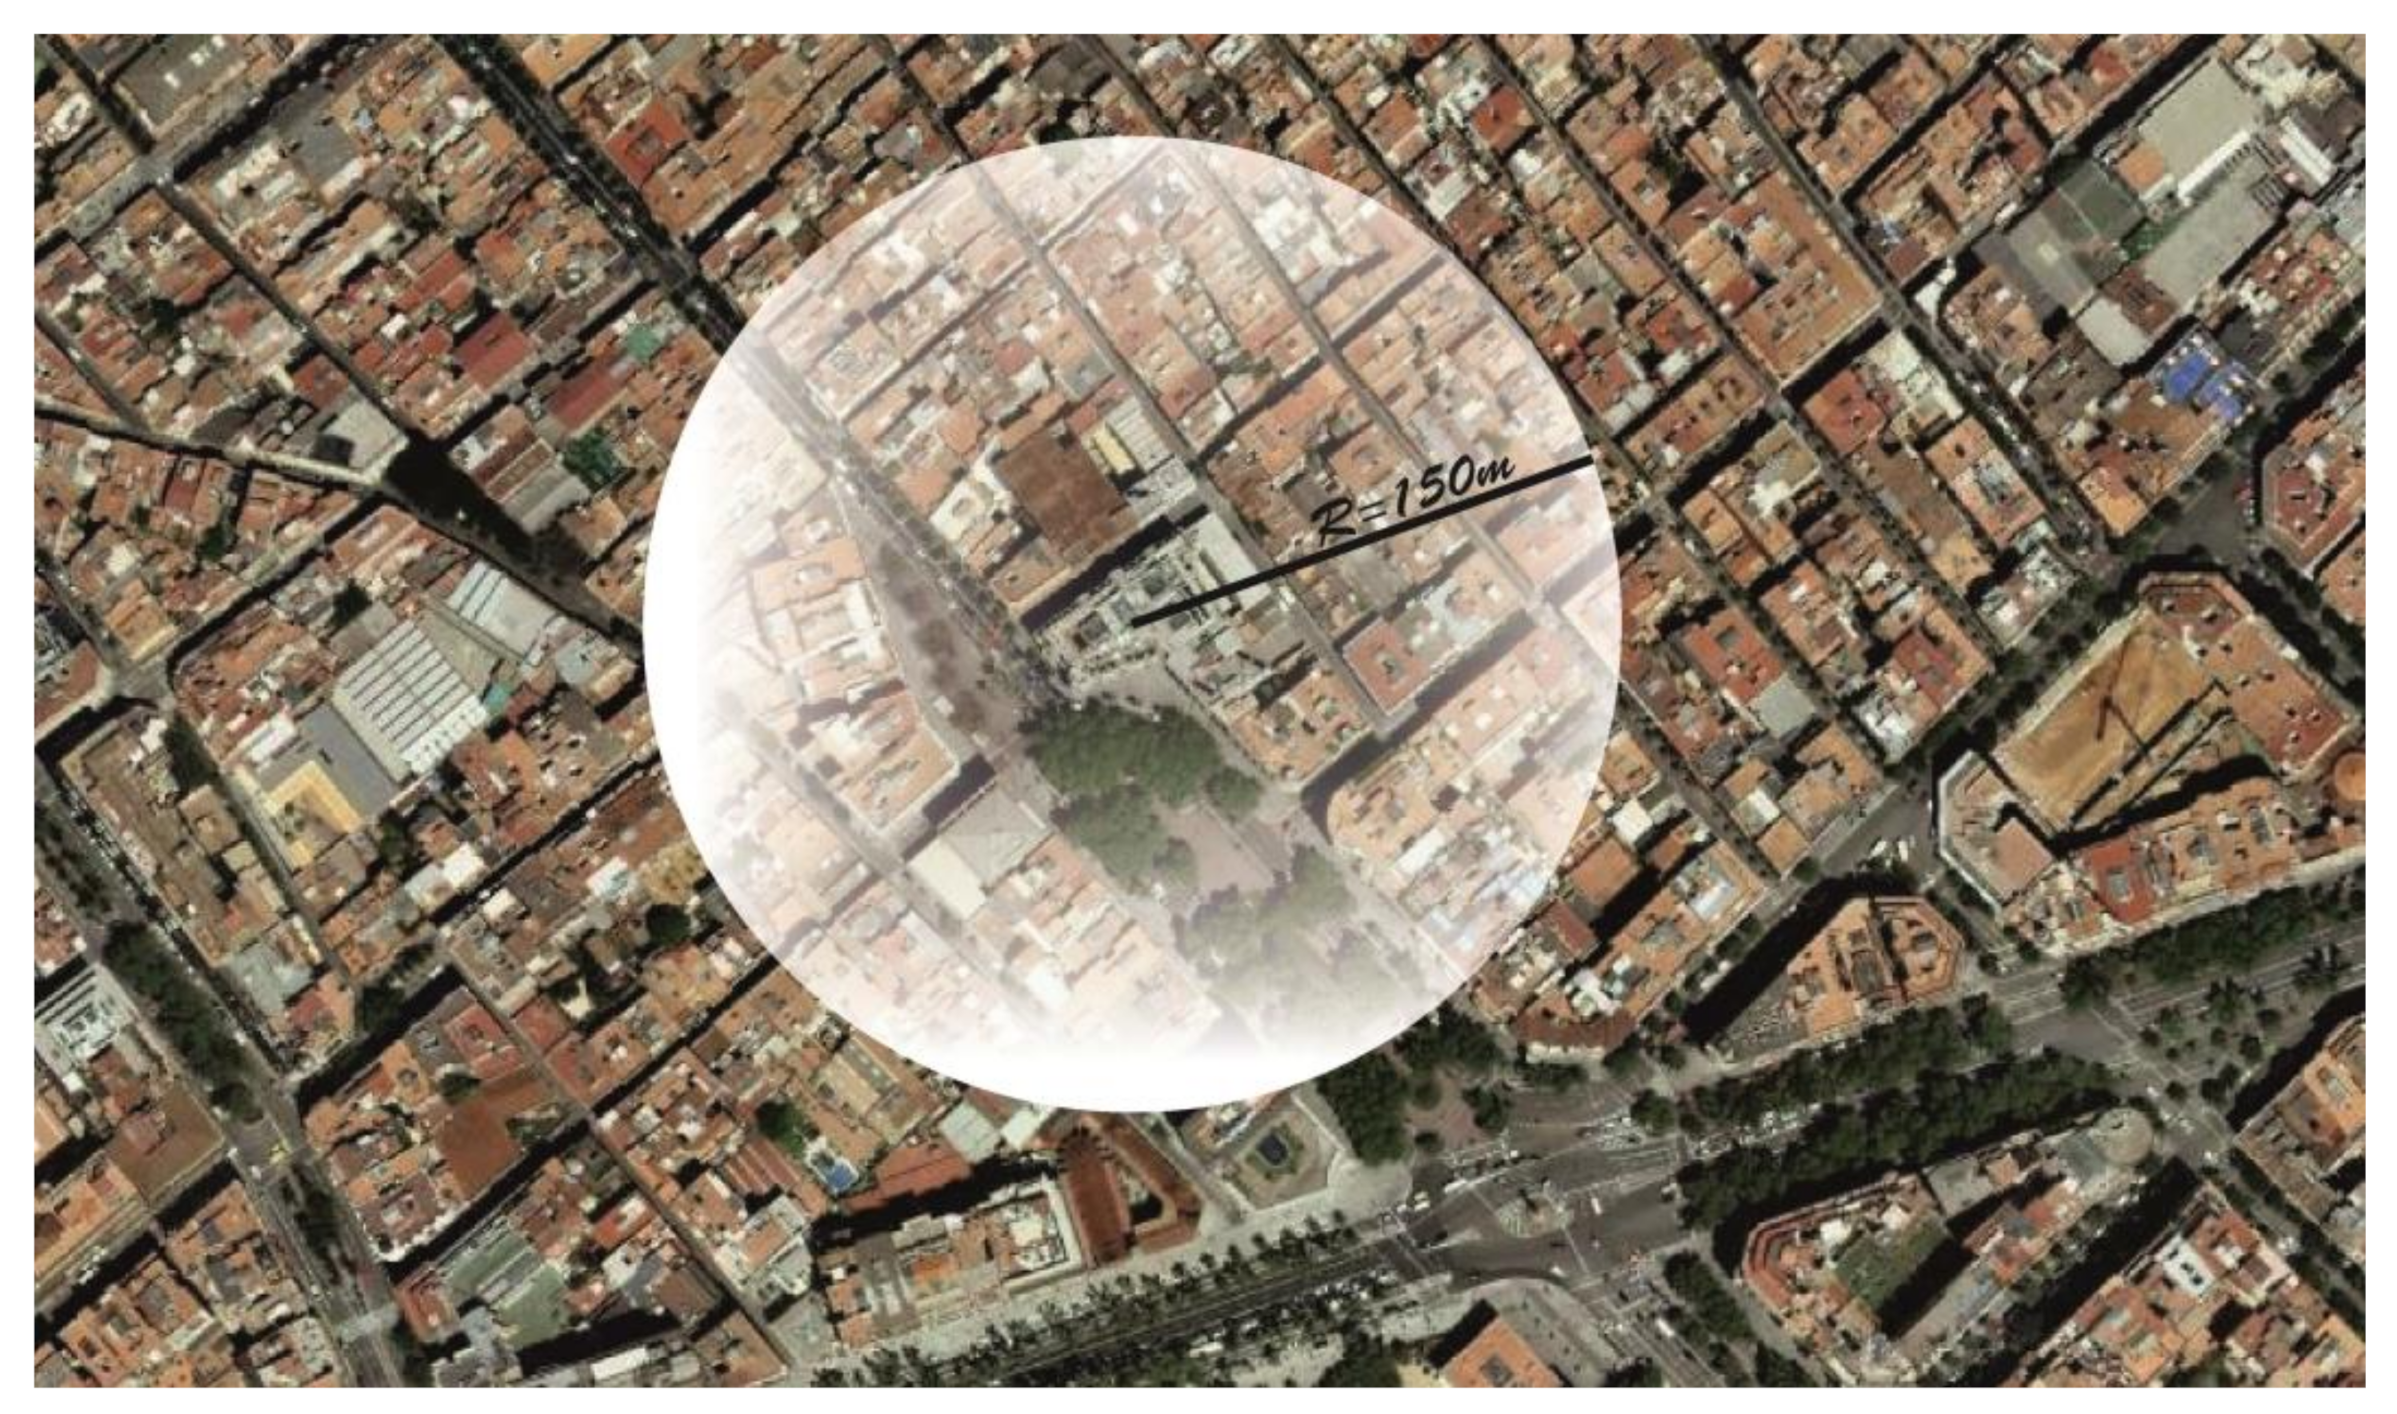
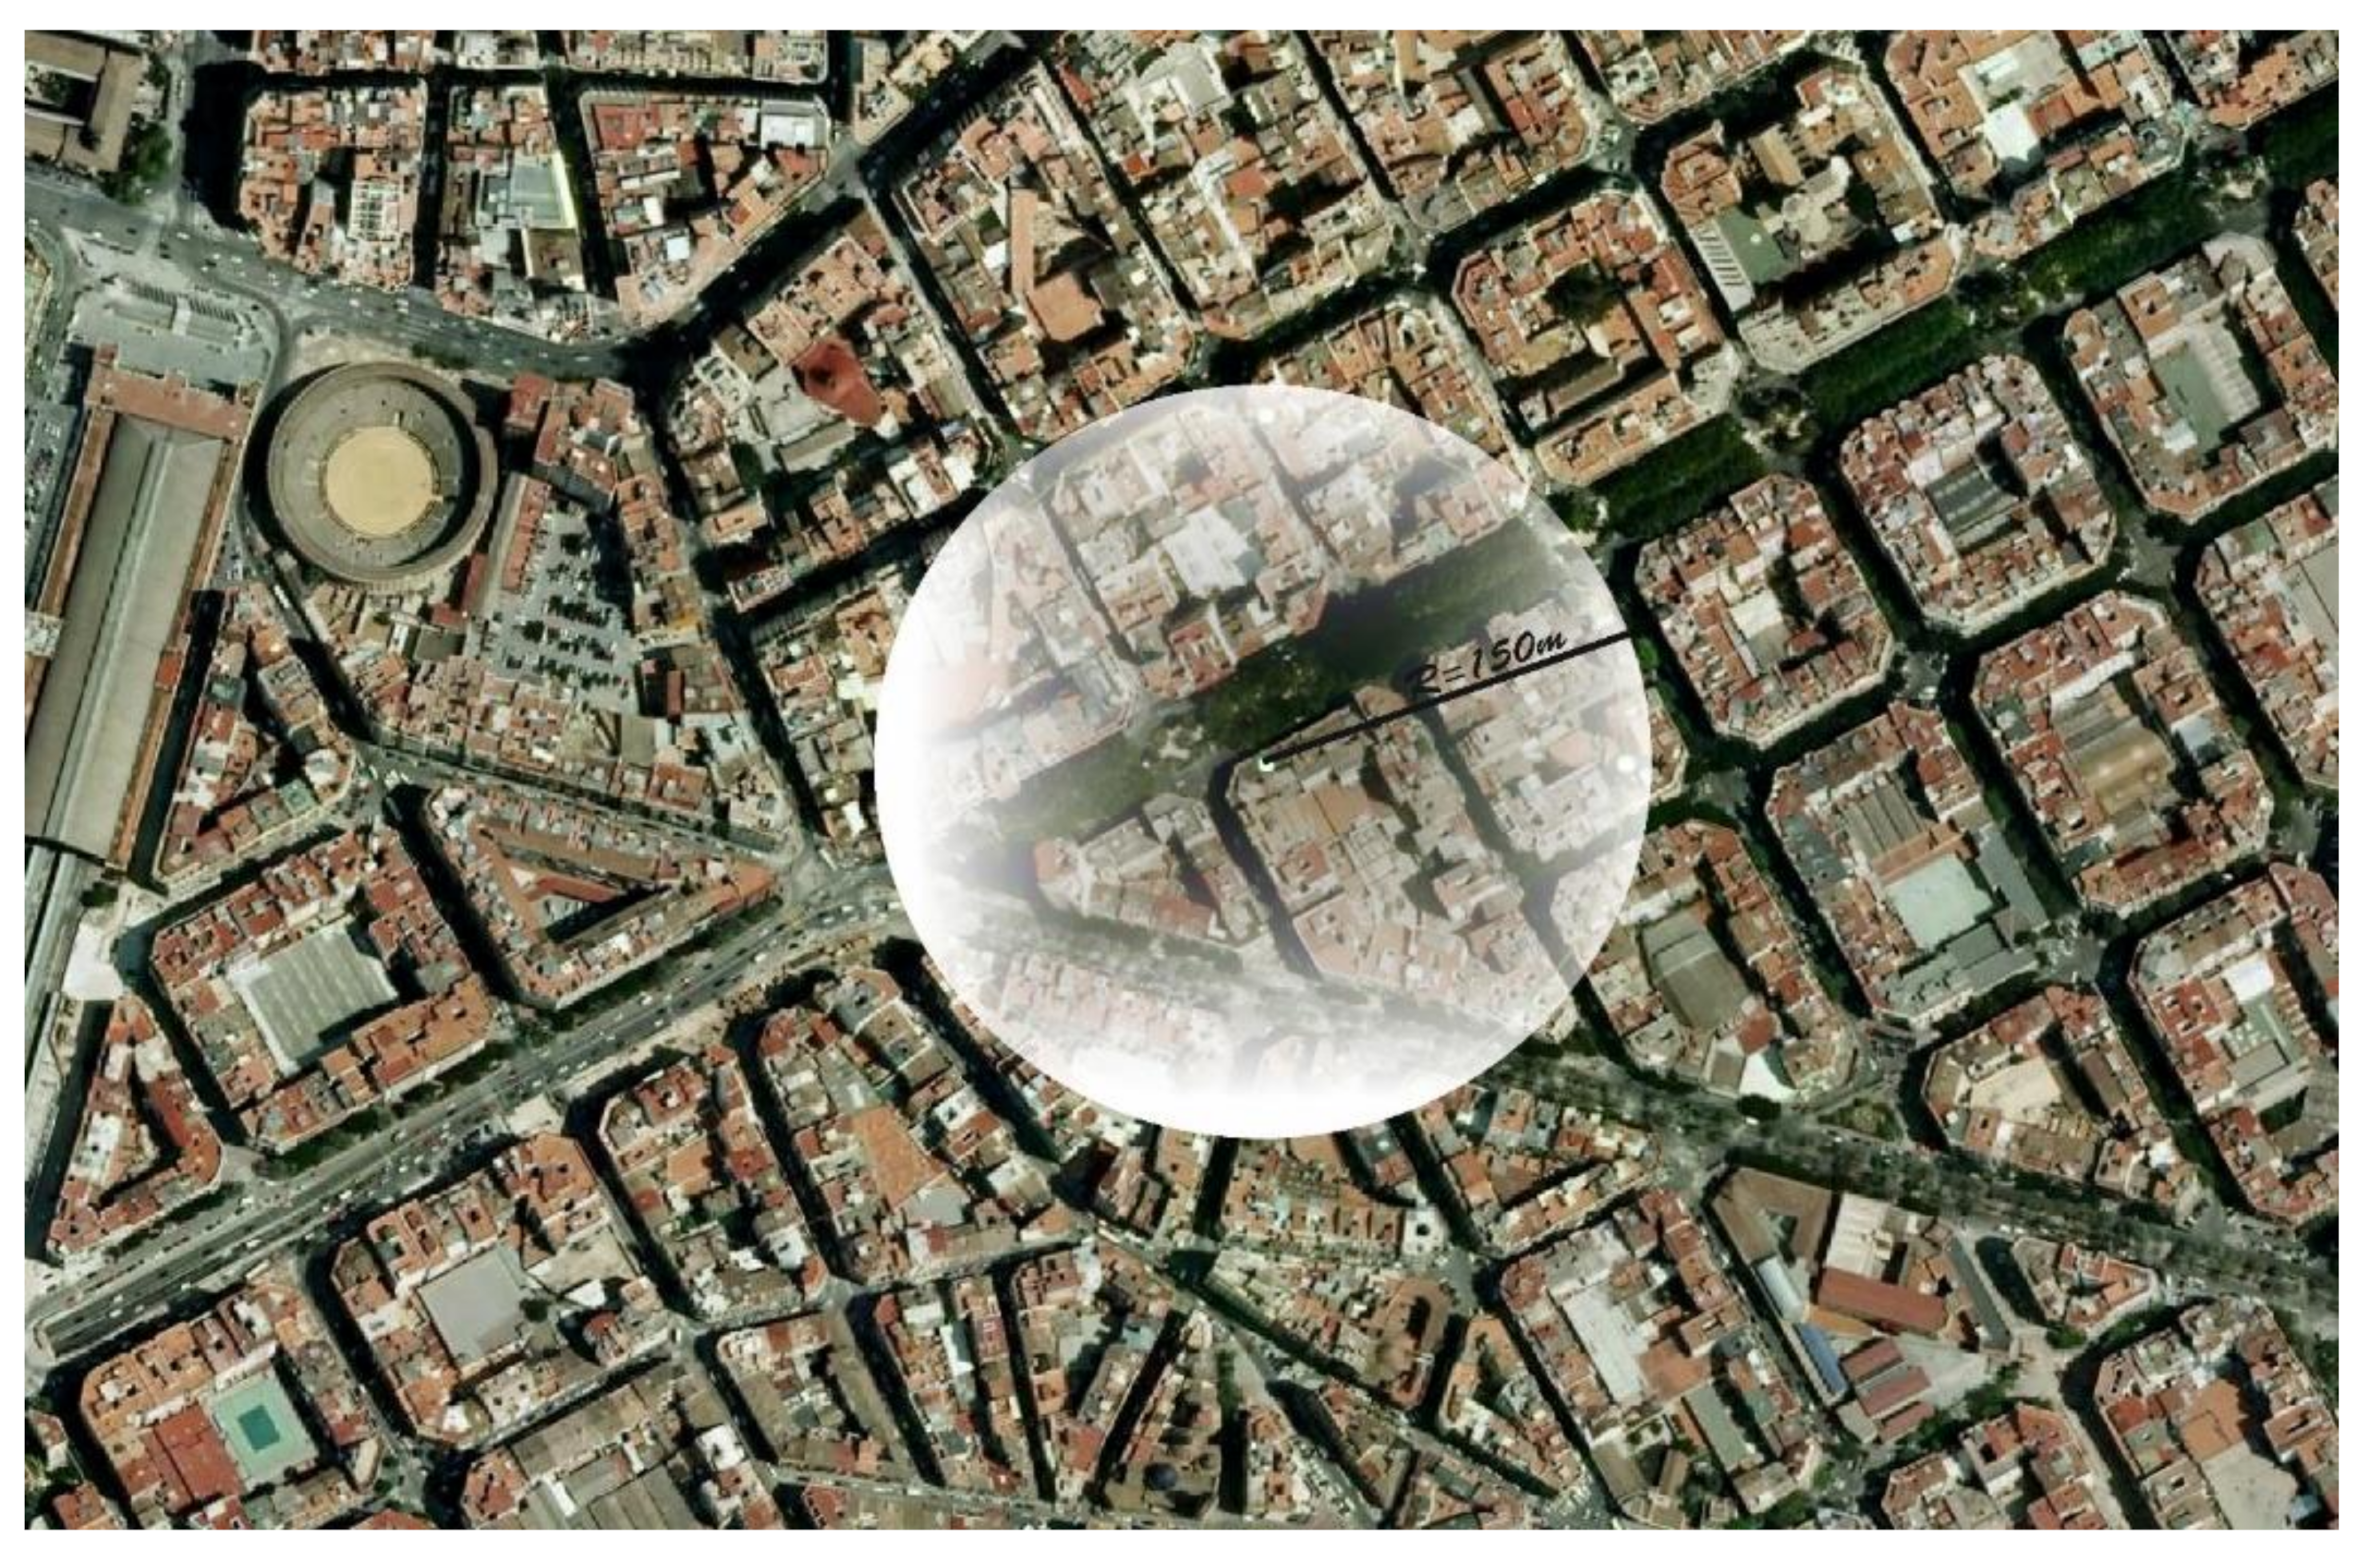
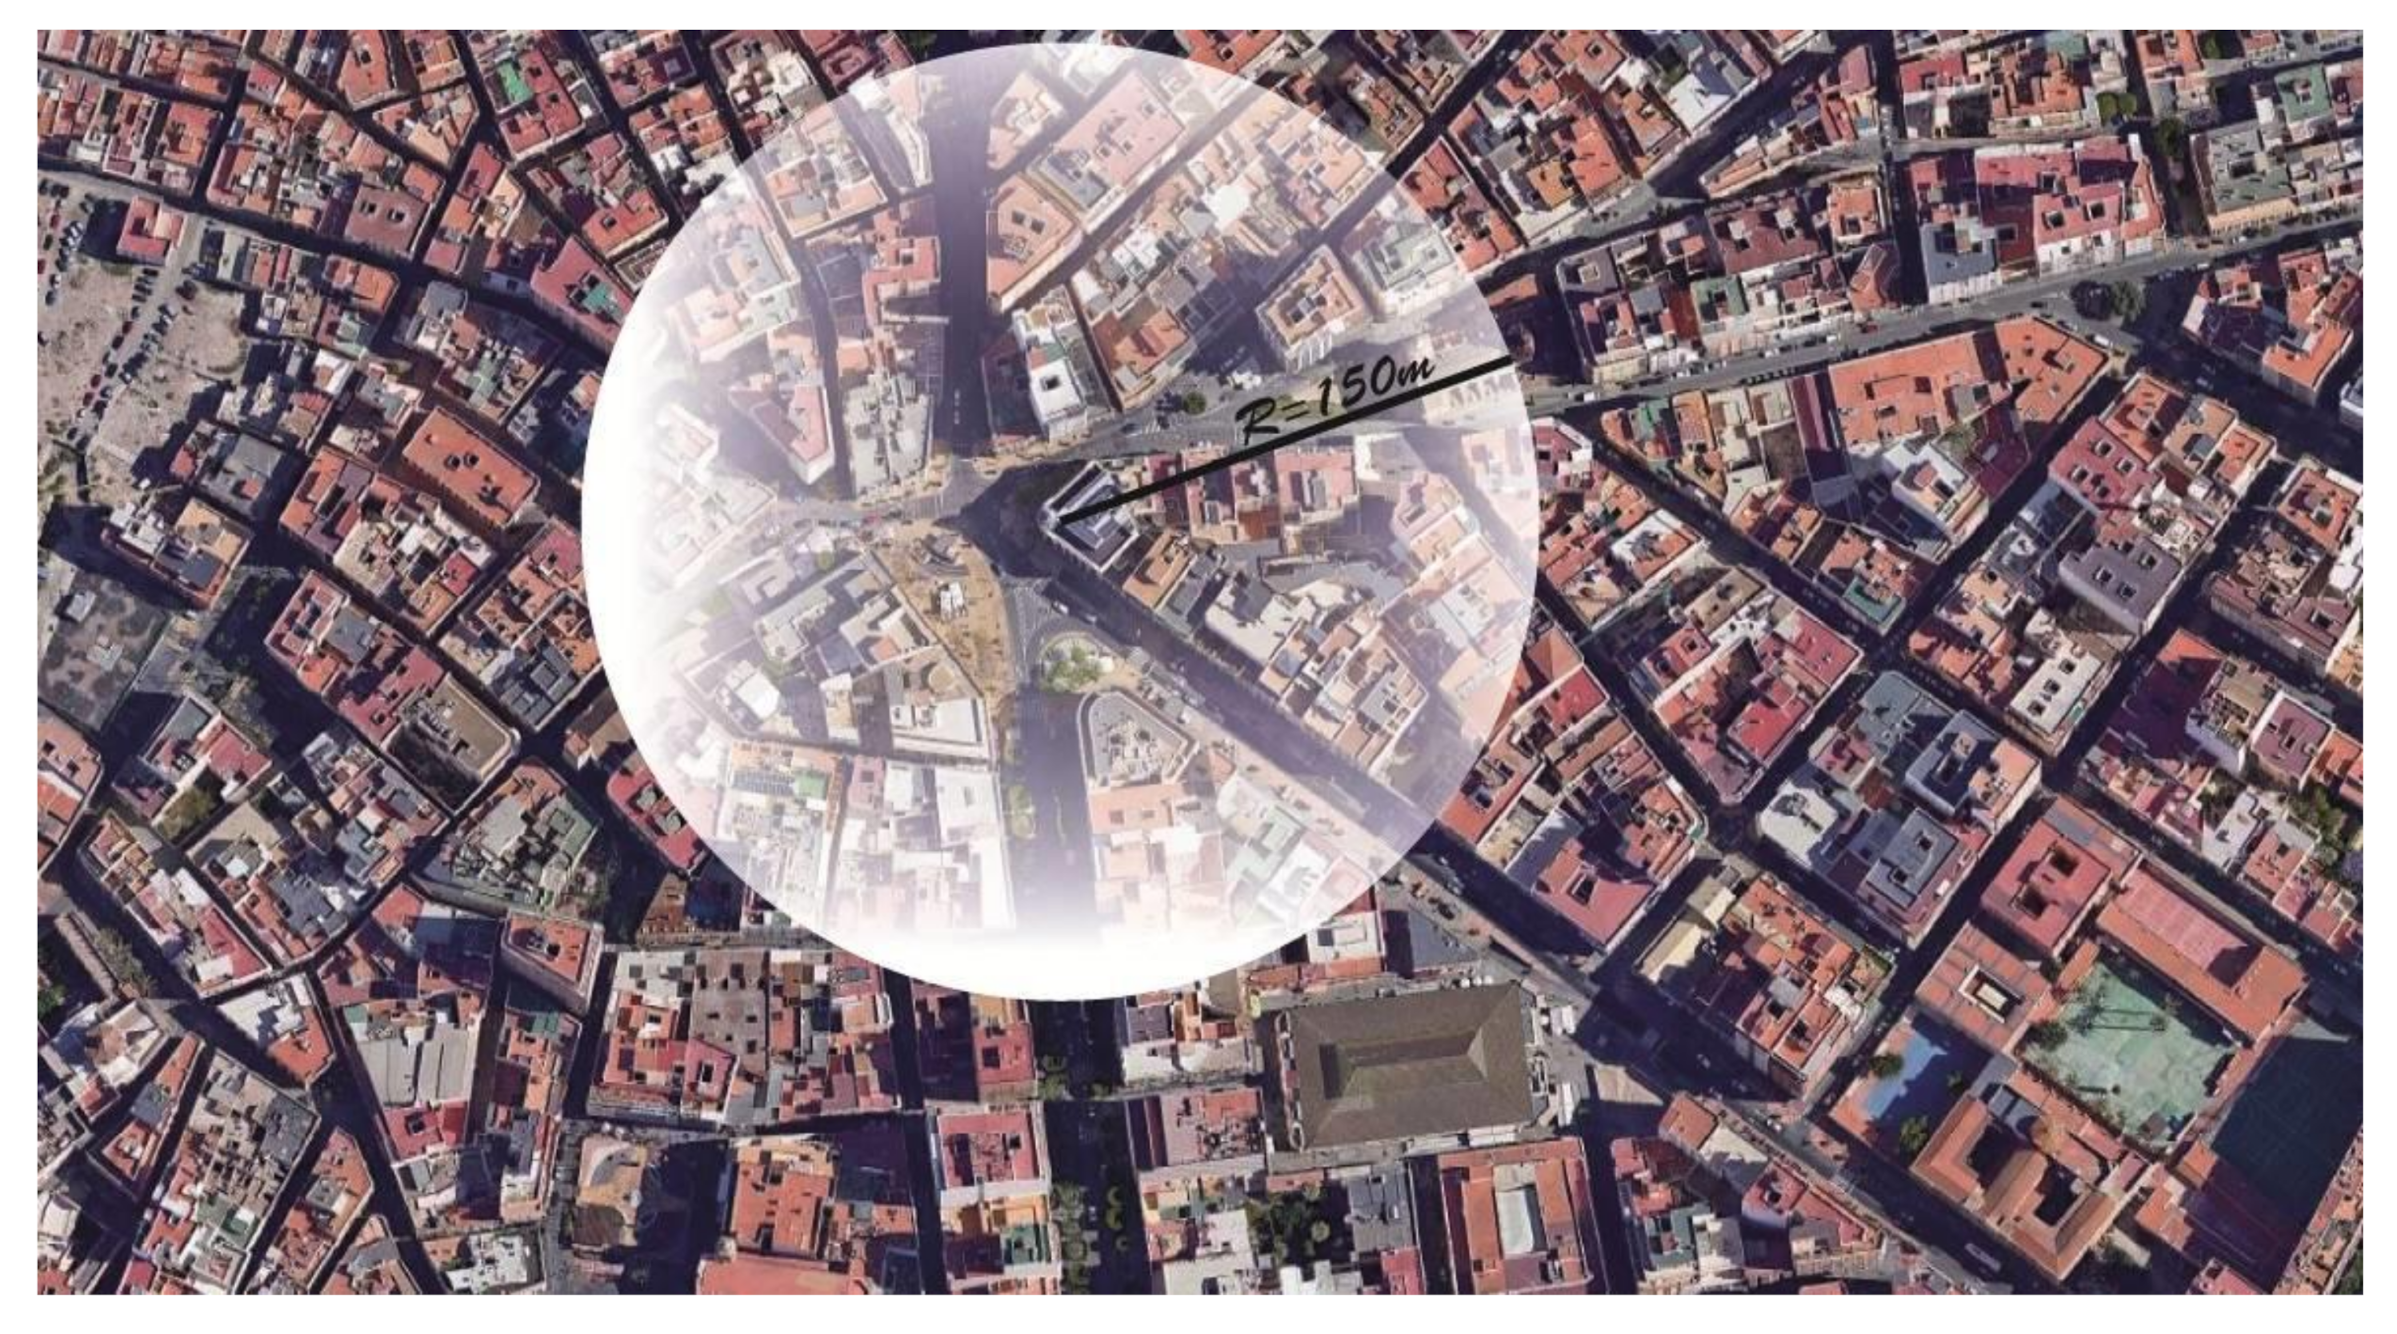
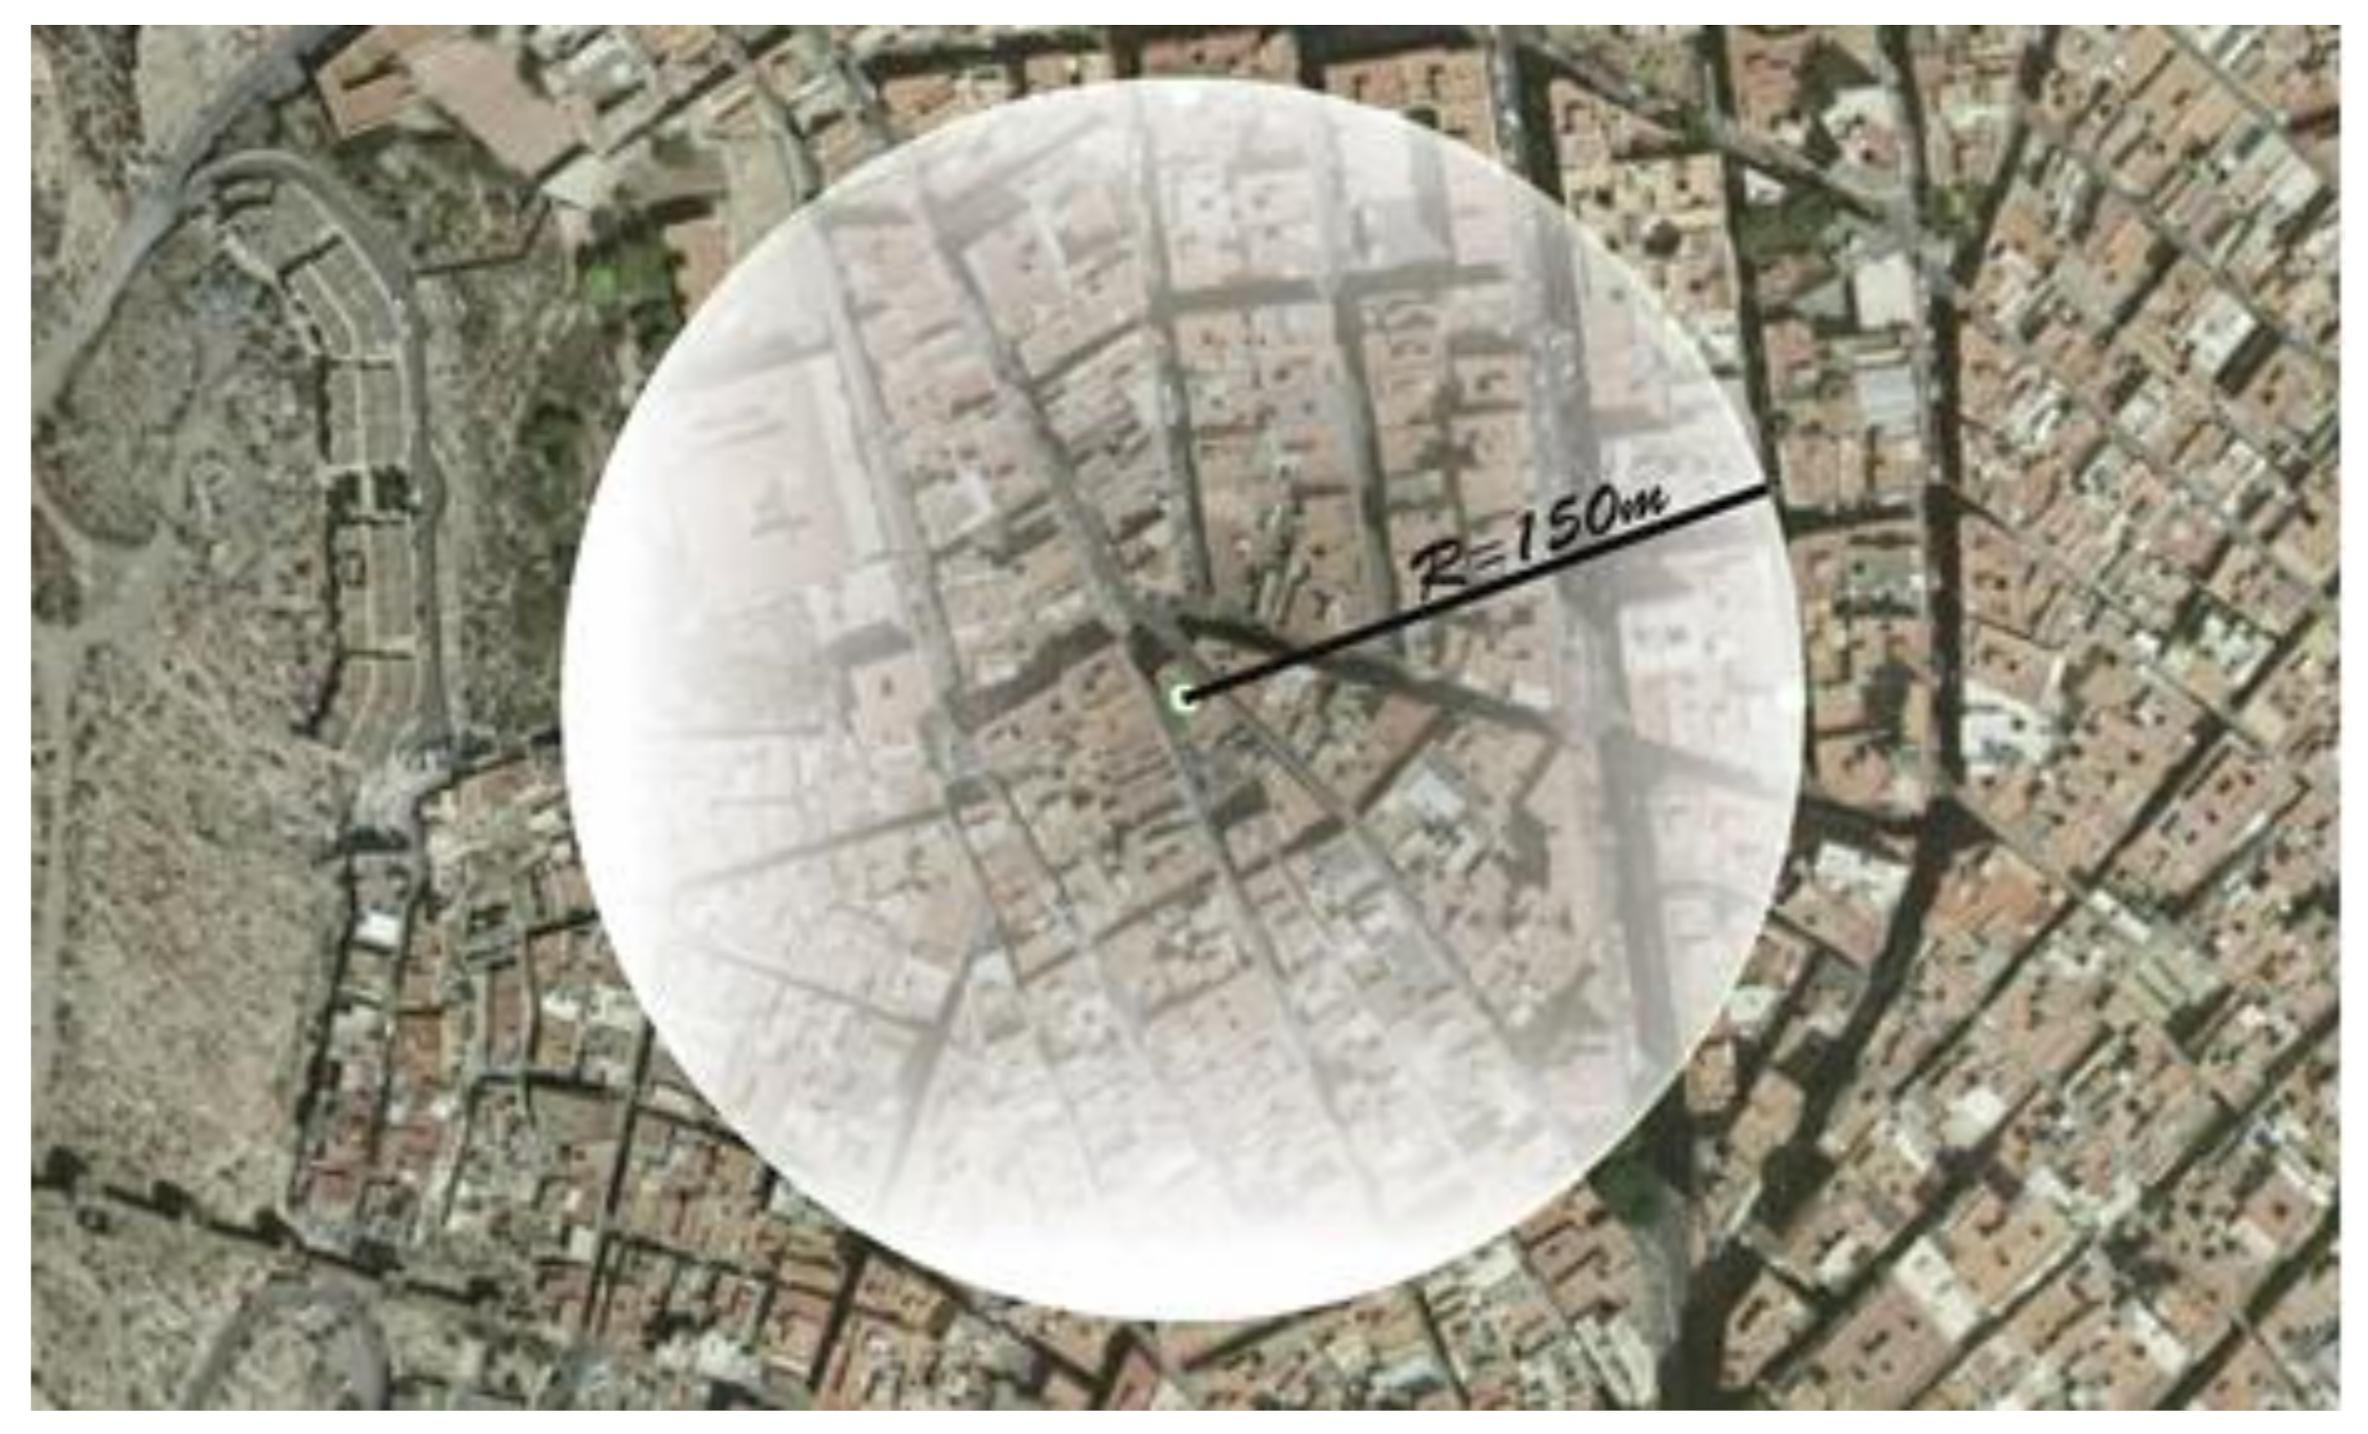
The control area was determined to be a radius of 150 m from the rehabilitated property. This distance was based on the investigations of Tan and Tan [
49], Waddell [
50], Nikilaos, Dimitra and Agapi [
51], and Ray [
52] that follow this same longitudinal criterion according to visual, transport, and visual impact elements.
Data on the activities of commercial premises at street level, including changes in occupancy, were obtained by means of direct examination using Google Street View®. This program allows us to transport ourselves in situ to a location in 2008 and check its real evolution (in images) and mechanize the search in two-year periods until 2018.
A total of 565 business premises were analyzed with the following distribution: 198 are located in Barcelona, 35% of the total sample (
Figure 2); 174 are located in Valencia, which accounts for 30% (
Figure 3); 138 in Almería, 25% (
Figure 4); and 55 in a neutral area that we named “Dummie” and accounts for 10% of the properties studied (
Figure 5). This dummy area serves as a control and verification parameter of the results obtained.
Each of the 565 sample items was designated to 35 variables related to the type of occupation in each year, the sum of the years occupied, the variation in occupation, the size of said variation, and the type of occupation during the years studied (up to 131 different types of use after simplifying the type of occupation to eliminate spurious differences related to the name of the activity). The variables also included a time series, from 2008 to 2018 (11 years), and variables related to the street environment: type of road (whether open to vehicle traffic or pedestrian only); number of lanes of road traffic (one to four lanes); presence of parking spaces in front of the premises (yes or no); sidewalk dimension (narrow, less than 2 m; normal, between 2 and 5 m; wide, more than 5 m; and squares, open spaces).
With regards to the variable related to the types of occupancy of the commercial premises, a prior processing step was carried out which consisted of:
- -
Re-labeling of the type of use in each of the commercial premises. A numerical value was given to each type of use to facilitate further processing.
- -
Re-labeling using a numerical value to reflect changes in occupancy over time, again, necessary for further processing.
- -
Calculation of the variation in the occupancy of the commercial premises over time. Each change of use, from one year to another, is labeled with a 1.
- -
Sum of the total occupancy of each of the commercial premises, throughout the period of time studied.
- -
Sum of the total variation in both use and occupancy of the commercial premises throughout the period of time studied.
- -
Calculation of the mode of use, which takes into account both occupancy and use, of each of the commercial premises, for a specified time.
Once the aforementioned information was attained we proceeded to classify the premises using self-organizing maps with relevance to the following working hypotheses:
Hypothesis 1 (H1). The level of occupancy is significant. A classification process will be developed using re-labeled occupancy data.
Hypothesis 2 (H2). The level of variation is significant. A classification system of similar commercial premises is developed.
Hypothesis 3 (H3). The type of occupancy is significant per se.
Hypothesis 4 (H4). The sum of the variation, the occupancy and the mode of occupancy, taking into account occupancy and use of the premises, are significant.
The following procedure was carried out for all four working hypotheses:
To train the self-organizing map, we chose a set of characteristics from all those obtained in the analysis performed.
Using MATLAB as a tool, and its Neural Networks Toolbox, we carried out a series of experiments based on the number of items that each sample represents. We also needed a map that could explicitly represent the sample groupings of the impact maps. Given these assumptions, we used several structures (8 × 8, 10 × 10, and 12 × 12), although there was no obvious improvement in the representation beyond the 64 elements in the network or if a longer execution time was used to carry out the training. In addition, a hexagonal neighborhood model was used to improve the procedure for calculating the neighborhood between elements of the network, and carried out the training looking for stability in the operation of the network. This stability was achieved when the variation of the internal structure of the network elements was, on average, less than 0.1. After some tests with 1000, 2000, and 5000 iterations, we opted for the third option (5000) to carry out the training in order to ensure the stability of the network.
The training process consisted of two phases: a rapid phase, in which significant variation of the internal structure of the network elements was permitted, and a precision stage, in which there was very little variation in the internal structure of the network during the training process. To this end, 90% of the training process was carried out in the first stage and 10% in the second.
We created a self-organizing map with 64 neurons arranged in an 8 × 8 square mesh. In these, the neighborhood was measured using a Euclidean distance measure. We took the set of samples from each city and applied the training procedure 5000 times to stabilize the behavior of the network (that of one of the cities being studied, or failing that, the samples from Almería in which there was no proof of rehabilitation/construction of singular buildings). This training method was carried out to address the network with unknown data from other cities and to analyze their behavior.
- 3.
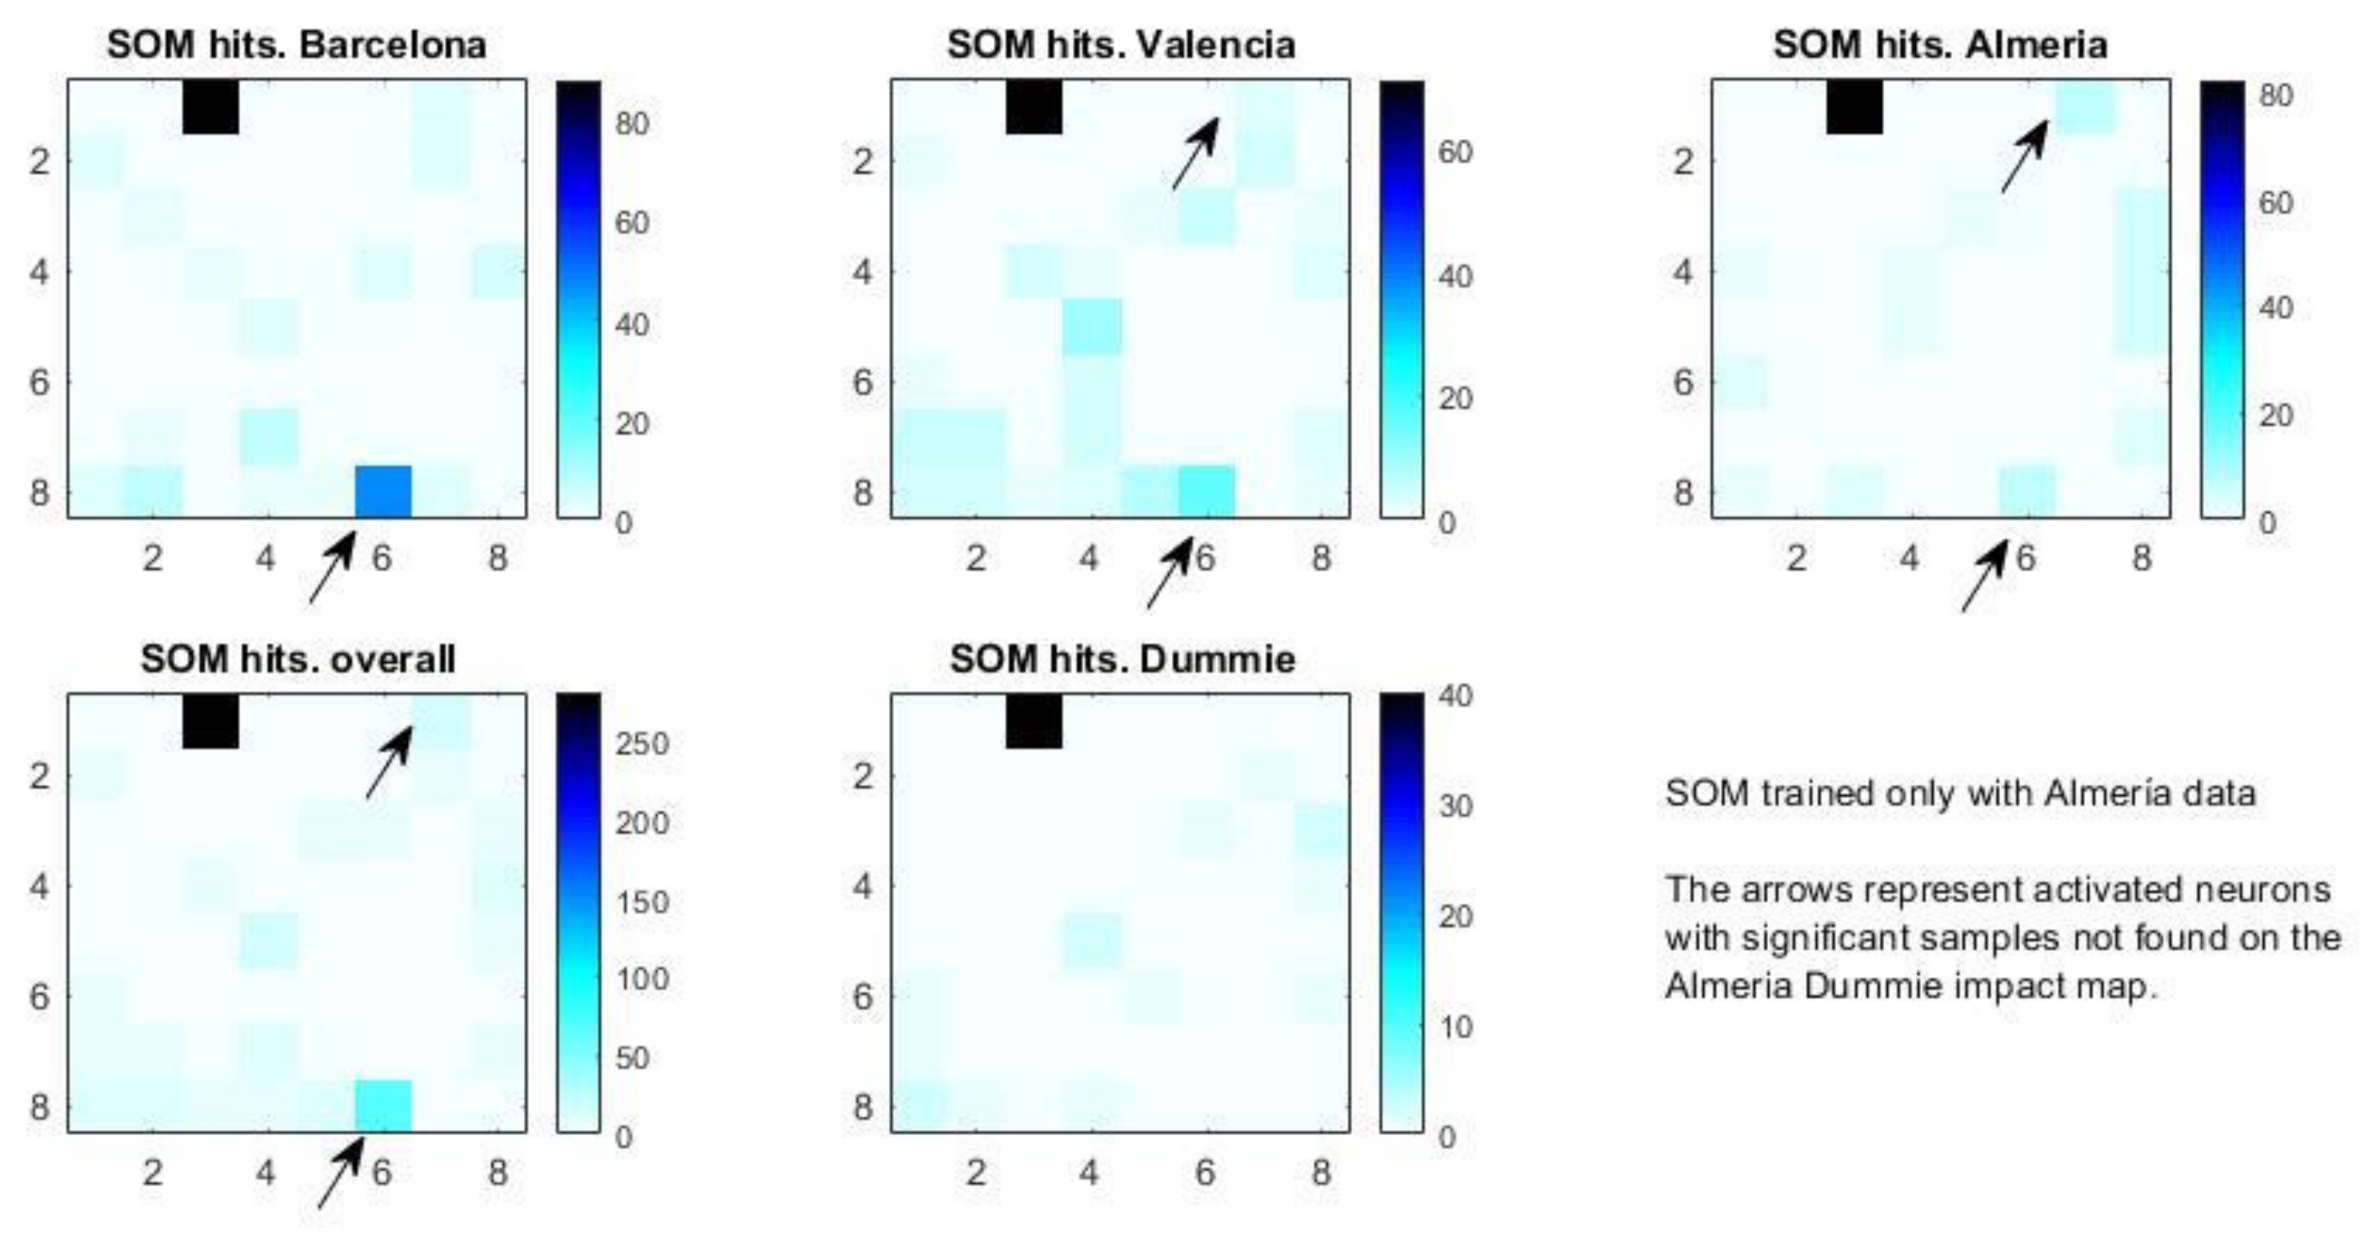
Visualization of the results using impact maps. An impact map is a representation of how the self-organizing map is activated when presented with a set of samples. Each input generates an activation, and the count of all of them, by map element, and their representation using color indices, is a very useful tool to determine how the network behaves given a set of samples. Each element of the network is activated in one or more samples that have similar statistical characteristics. In addition to these maps, we used a distance map, indicating the Euclidean distance for each element of the network from its neighbors. These maps tell us how “far” from their neighbors each element has become after the training process. In this way we can observe the level of separation between the sample subgroups generated by the map. Both maps are invaluable tools for studying sample clustering generated by the neural network.
One common mistake that can often occur is when the distance between the different neurons is not taken into account when carrying out the analysis of the classification in the impact maps. As the accuracy of the classification is measured by the distance maps between neurons in addition to the impact maps, it makes little sense to measure impact without also taking into account the second measurement regarding distance.
- 4.
Detection of “distinctive” activation points in the self-organizing maps and characteristics of the locations of the commercial premises which could cause the activations on the maps. The distinctive activation points are those neurons that have been activated by a subgroup of samples, that appear in all cities with urban development and that do not appear in the impact map of the set of control samples.
- 5.
Analysis of the characteristics or attributes of these commercial premises.
Not all hypotheses offered significant results. We will develop, therefore, those hypotheses that present relevant results, that is, Hypotheses 1 and 4.
5. Results
5.1. Hypothesis 1. Occupancy Model
For this work, we selected 11 characteristics corresponding to the representation of the occupation of each of the premises, throughout the period of time studied. Each sample, therefore, was characterized by a vector with a dimension of 11. The data set was used as a training set for a self-organizing network with the characteristics indicated above. After applying the training procedure to the data from one city, the data from the rest of the cities were used as test data of the trained network to observe how the network activations are arranged in each city. The impact maps of this analysis are shown in
Figure 6.
The impact maps show activated groups in certain neurons that are characteristic of the samples in which a singular building has been rehabilitated. The distance grows significantly around the reference neuron, indicating a very different type of model from the rest of the samples. In order to understand the name of each element in the network, these are numbered from 1 to 64, arranged in 8 columns by 8 rows. The first element in the network (please note that the term neuron and network element are used interchangeably to refer to each of the elements that make up the self-organizing map) is in the upper left corner and the last element in the lower right corner.
The activation of element 48 in the network represents 12.3% of the sample, a significant number of commercial premises (70). Of these properties, 47 are located in the city of Barcelona, 16 in Valencia, and seven in Almería. These properties share similar patterns and sequences of occupancy.
In the triennium periods comprising 2009–2011 and 2015–2017, the commercial premises remained closed. With regards to the period between 2012 and 2014, there was a single opening which closed the following year.
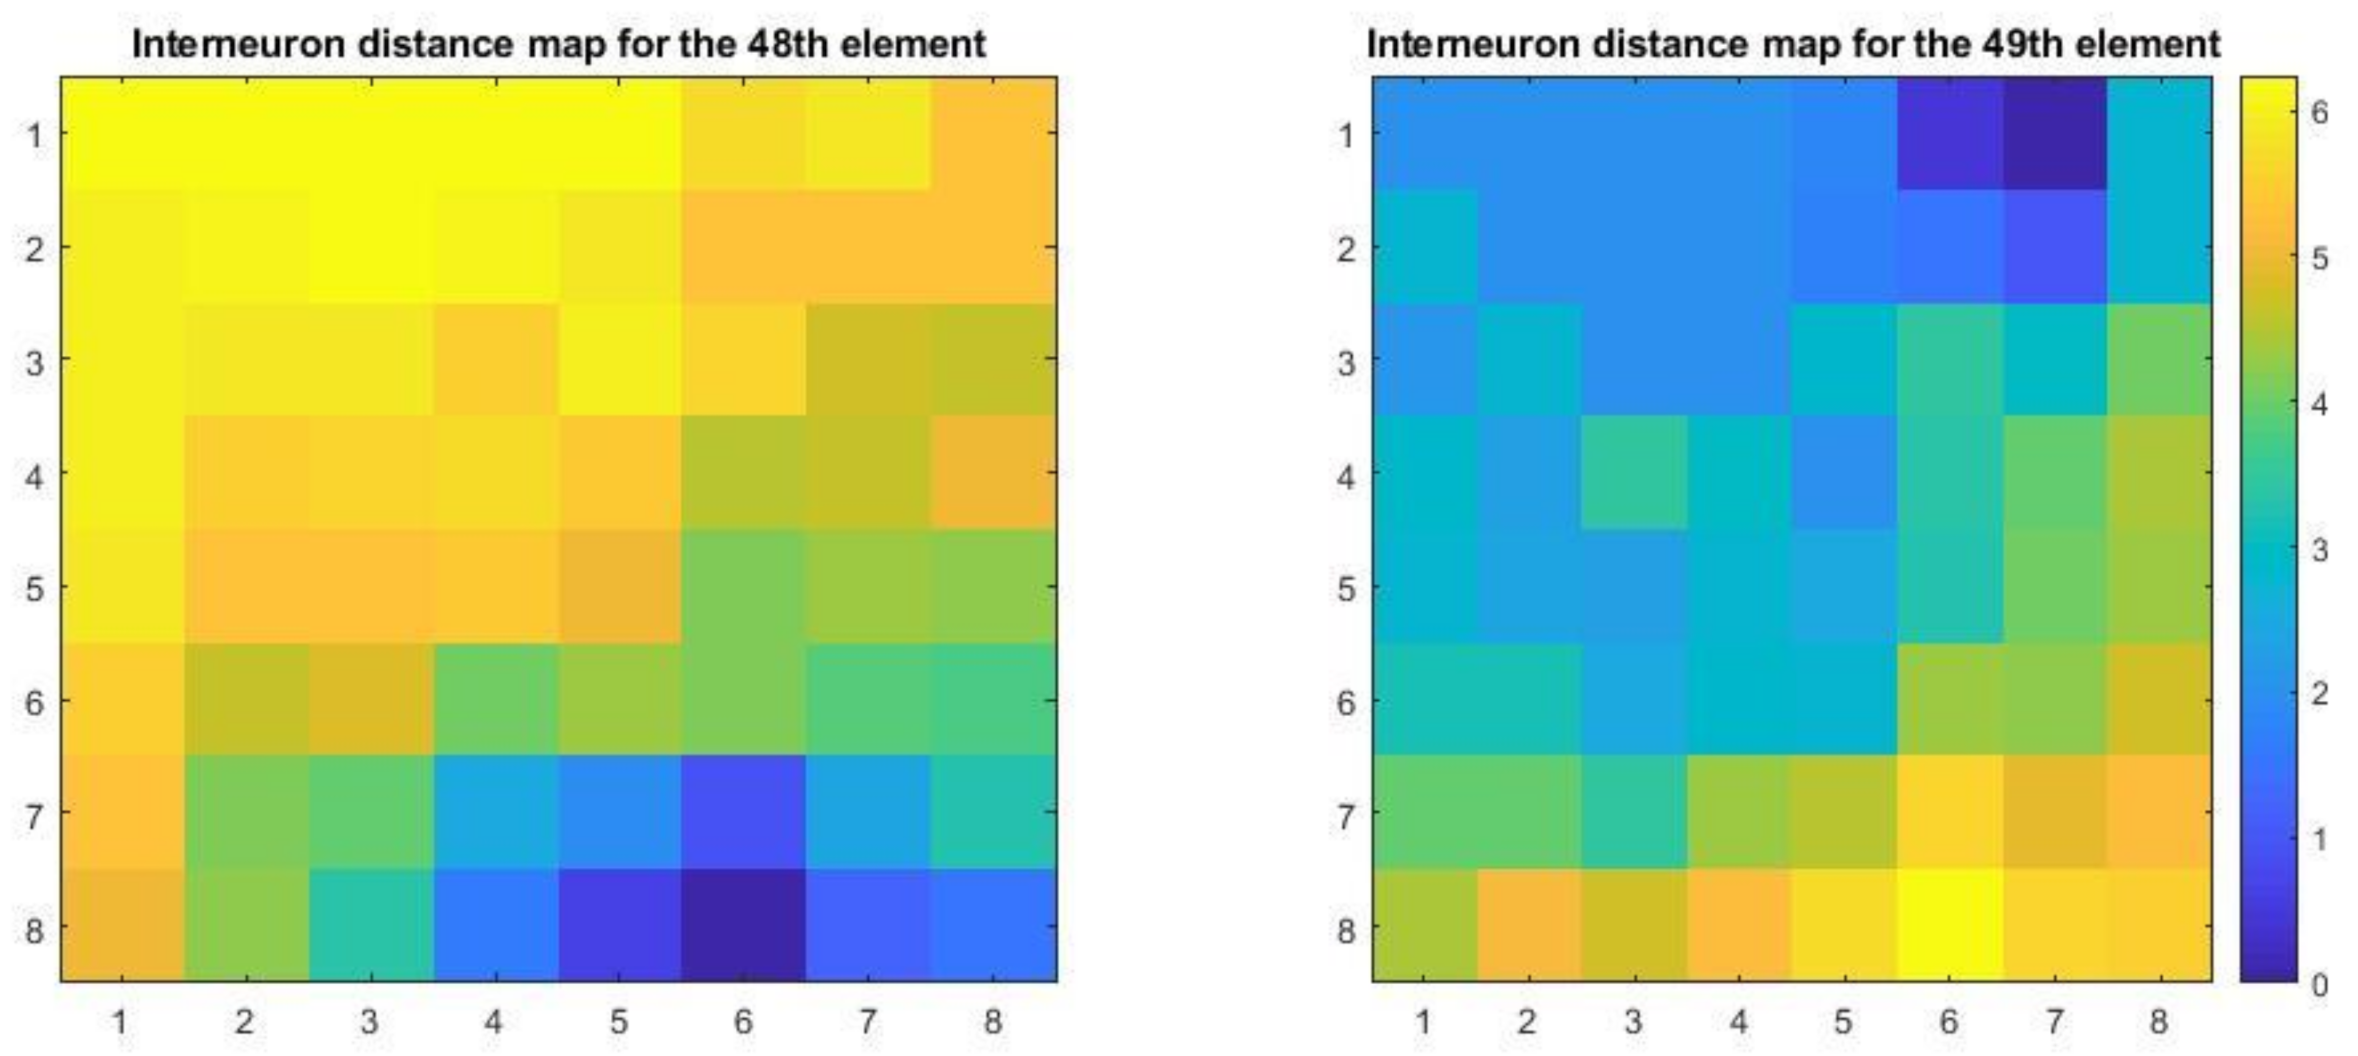
In contrast, the activation of the network element 49 (
Figure 7) corresponds to 14 commercial premises (2.4%), of which four are located in Barcelona, three in Valencia, and another seven in Almería. These premises share a common attribute in that they have always housed some type of business activity. However, between 2013 and 2014 the properties changed their business activity, closing and then reopening in the same year.
The distance between neurons indicates the difference between the elements that activate that neuron and the rest of the elements of the problem area. This measure serves to quantify the difference between one set of data compared to the remaining sets. Thus, we can see that elements 48 and 49 of the network are relatively close together and that both are quite separated from the rest of the data groupings (which occur on the opposite part of the map).
5.2. Hypothesis 4: Classification Based on Total Occupancy, Total Variation in Occupancy and Most Common Type of Use of a Given Location
For this hypothesis, we analyzed the premises being studied with reference to the data on total occupation, total variation in use, and type of occupation. In this case, the dimension of the input vector is 3.
We then proceeded with the training of the neural network with the same characteristics as in the previous case (
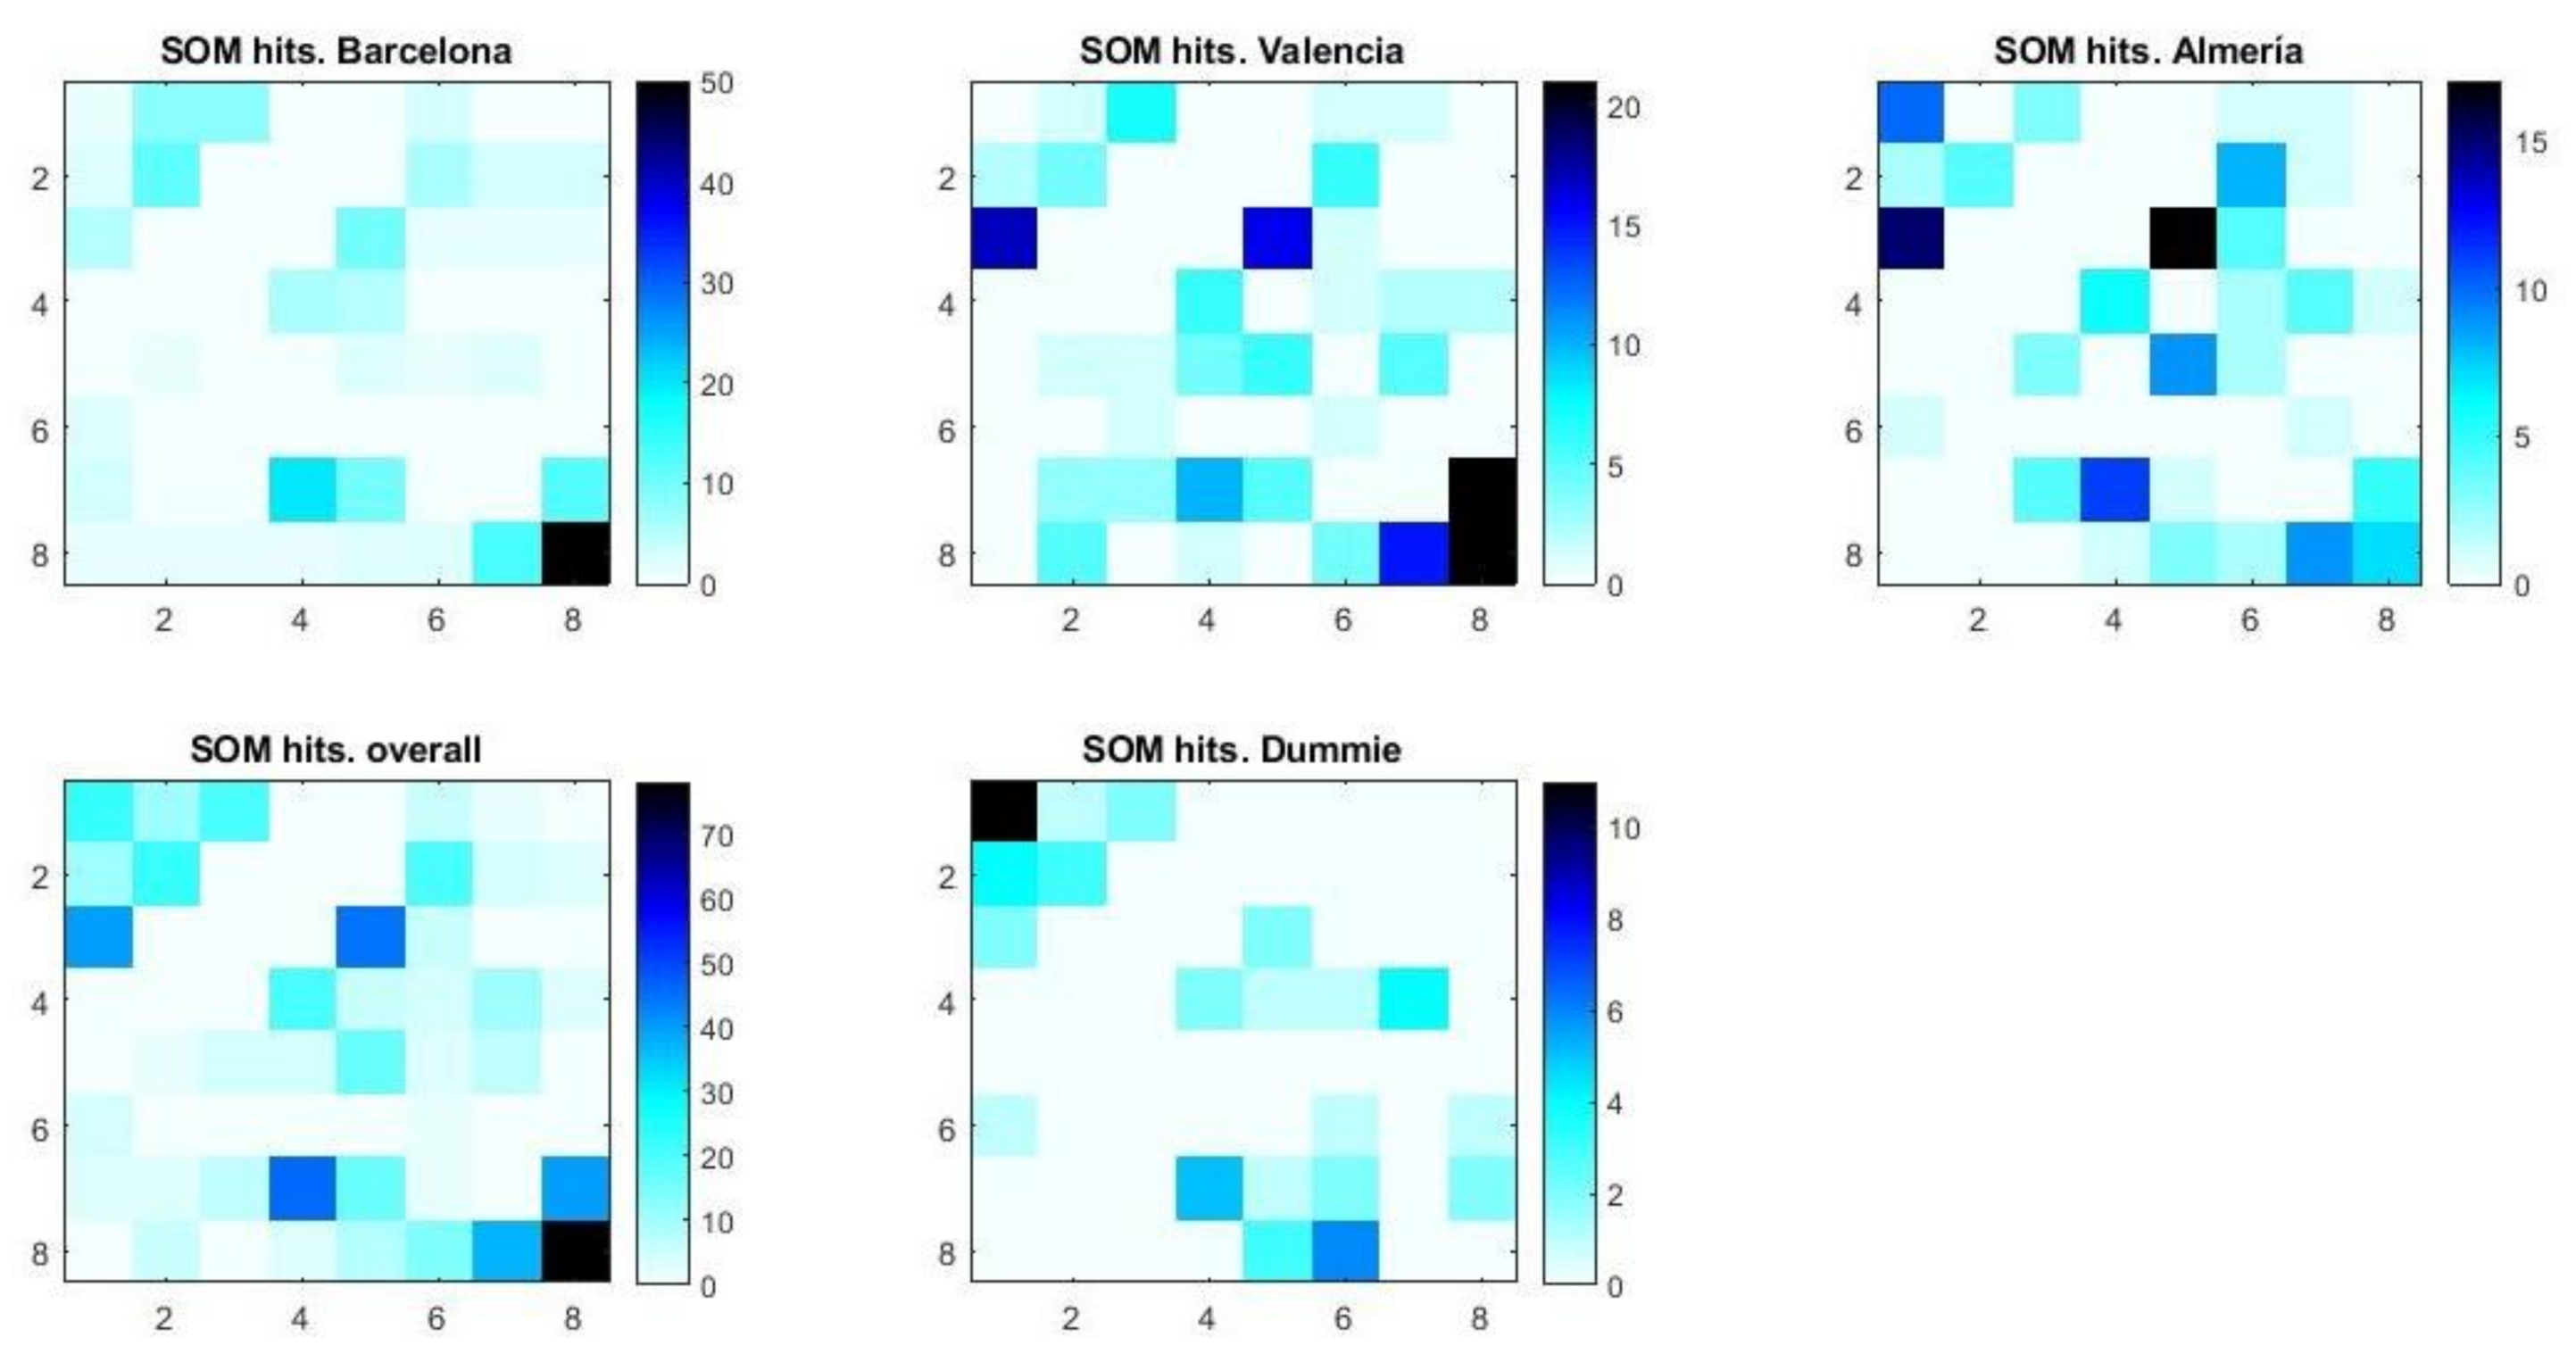
Figure 6). In this instance, the trained neural network generated the impact maps shown in
Figure 8.
As in the previous case, a classification system was developed based exclusively on city data in order to extrapolate this classification to unknown data (the remaining cities). The results show impact groups related to the commercial properties being studied but that do not appear in the “Dummie” sample.
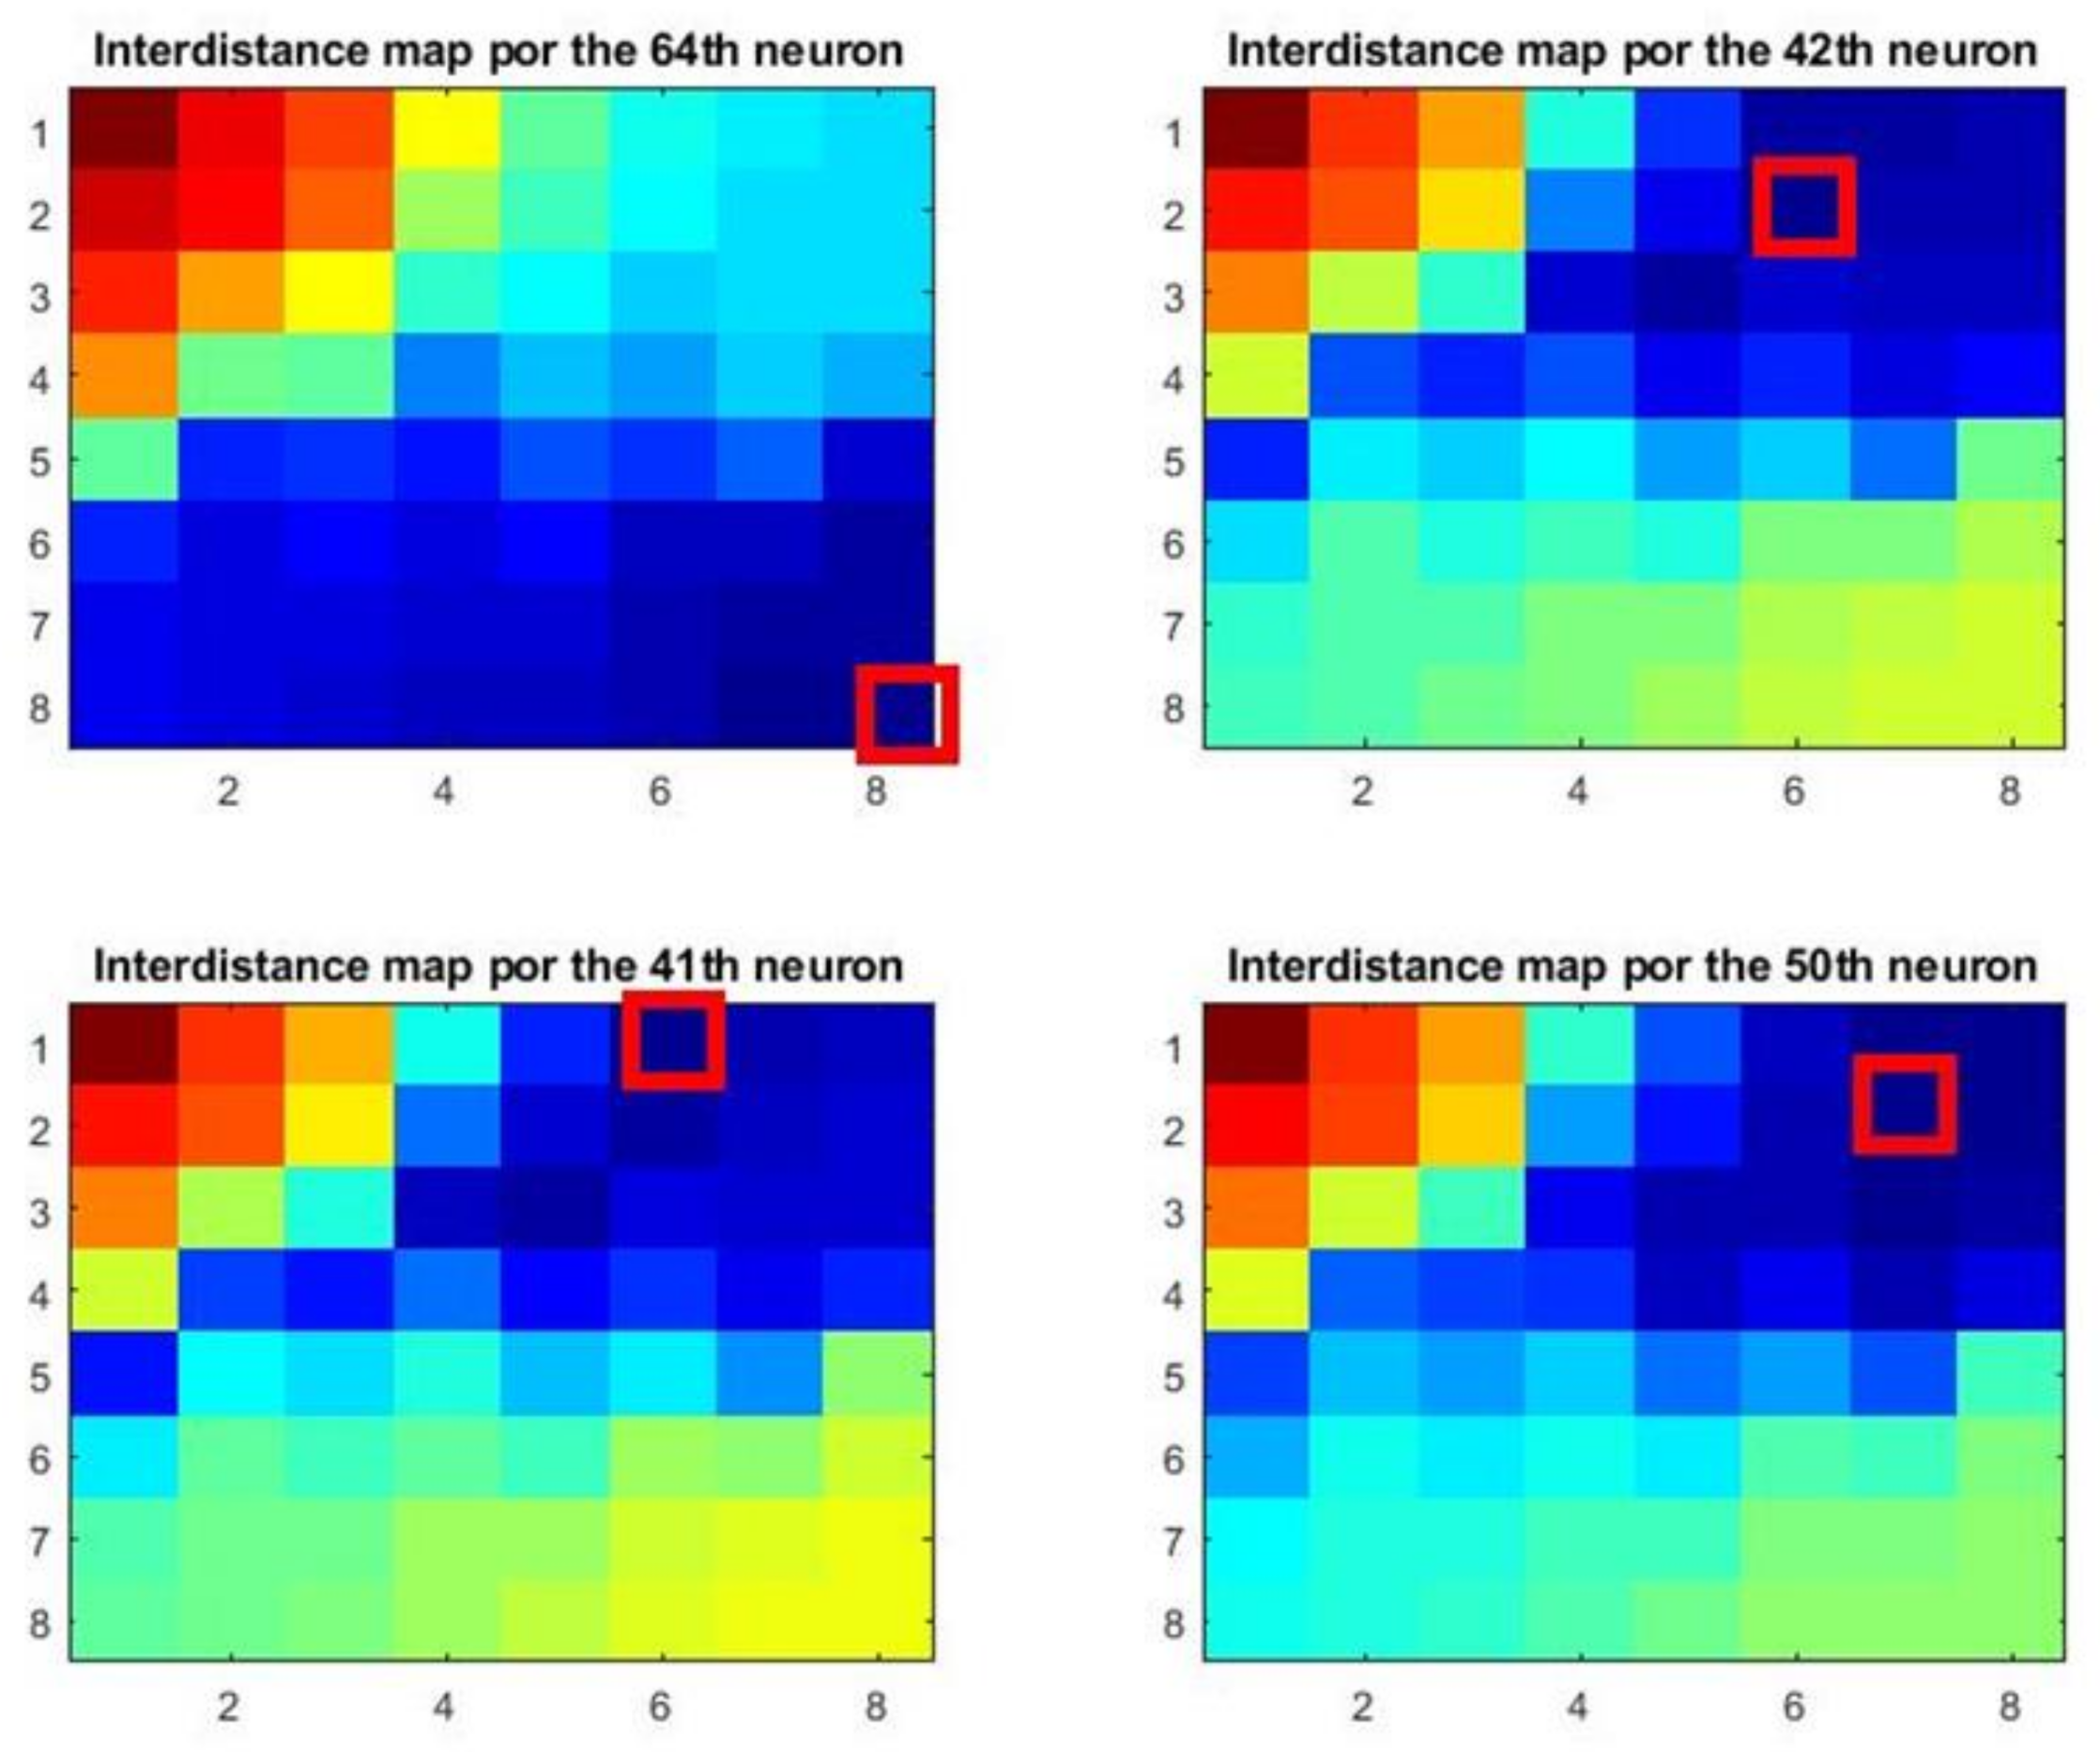
In relation to the remaining elements and with a view to understanding how the distance between these elements affects other clusters, a study of the distances between the neurons that group those distinctive impacts was carried out. The following images (
Figure 9) depict the spacings (interdistance) between elements as distinctive impacts.
The calculated distances of neurons with distinctive impacts can be observed. In the case of elements 41, 42, and 50 of the network we find that the distance maps are very similar and the distances between them are small. This confirms that the three groups pertain to commercial premises with some common characteristics. It also confirms that the activation of one of these three neurons is the result of the existence of secondary characteristics. In the case of element 64, the distance is exclusively linked with the neurons in the opposite corner, which indicates that the dominant characteristic of the properties that activate this element is also dominant in most of the other properties that activate the upper left corner of the map.
Of the total 565 commercial properties, elements 41 and 50 correspond to five and four commercial properties, respectively. As this represents less than 1% of the total sample, these properties are considered to be non-significant. Element 42, in contrast, although corresponding to a total of 20 commercial properties, displays characteristics which are related to the business activity carried out in these premises, in this case, fashion retail. However, because it does not represent a high percentage of the sample it does not lend itself to establishing a hypothesis.
However, the behavior of network element 64 produced interesting results because 78 of the 565 commercial properties (13.8%) were activated with 50 premises located in Barcelona, 21 in Valencia, and seven in Almería. Their behavior is similar, in terms of occupancy levels during the period being studied, with 64 of these 78 (82%) never having had any activity at all, while seven properties (9%) opened and closed in the same year. The remaining commercial properties opened in 2018. In confirmation of this result, it can be seen that only three out of the 565 properties have never opened and are not related to element 64, but rather belong to the control sample (“Dummie”).
6. Conclusions
Local development and gentrification processes are linked and can be triggered by the actions, sometimes unintentional, of either public or private actors. Our study used a primary data collection methodology with Google Street View, which was later analyzed through neural networks, and verified that real estate undertakings engender similar economic patterns of behavior as in the other businesses in the areas of influence.
An understanding of these patterns can lead to more effective policies to revitalize city centers, tackle depopulation of rural towns or improve measures to boost local entrepreneurship and the commercial fabric of an area. As a result of the analysis via neural networks we have been able to find properties with common relationships and behaviors, and that share similar patterns and characteristics in the commercial premises adjacent to singular buildings.
The first conclusion is related to the existence of premises that behave in an anti-cyclical economic manner.
The commercial attractiveness of an area led to new businesses opening during the financial crisis (2012–2014) (element 48) in commercial premises that had previously not housed any type of business activity. That is, the properties had remained closed during the 2009–2011 and 2015–2017 trienniums, but then underwent both an opening and closing of a business between 2012–2014.
Commercial properties displaying such anti-cyclical behaviors are those that commenced their activity during the period of greatest economic decline. Paradoxically, this singular opening of premises also entails an almost immediate closure of the same. Thus, it can be deduced that the attractiveness of an area was a feature that appealed to businesses, making entrepreneurs think that, due to the particular location of these properties, they could achieve greater success. However, this attractiveness is not enough to save the business from the influence of other external factors (inadequacy of the property for a given activity, entrepreneurial inexperience, lack of foresight…).
This proposition is confirmed by the opposite behavior displayed by network element 49, which during the same period, showed commercial properties that enjoyed a constant and permanent business activity, closing and then reopening with a different business activity. This fact leads us to think that there are some premises that, regardless of the economic cycle, are always able to maintain an optimal level of business occupancy.
The second conclusion is related to the presence of low potential or “unfortunate” commercial properties.
Commercial premises with low occupancy levels, do not usually respond positively when a new business opens. This would seem to confirm the popular belief that there are unfortunate properties that are “jinxed”, where the businesses that are housed within them do not thrive. The activation of network element 64, in terms of occupancy, variation, and use of the commercial premises shows that those properties that remain closed for a long period tend to be occupied for less than a year. This conclusion is also confirmed by the control sample (“Dummie”).
Although it was not possible to directly verify the influence of a singular property on the commercial fabric of the area, it seems clear that the commercial behaviors in terms of occupancy and activity are similar. Therefore, this study will be useful for future research as an example of using this new methodology.
This study may be of special interest to investors and entrepreneurs, because it opens doors to future research areas that that could effectively identify real estate with business potential.
7. Limitations and Future Lines of Research
While we recognize that there are limitations in the investigation, it is hoped that these do not significantly alter the results obtained. For example, the data collection was limited to companies that have commercial premises located at street level and does not take into account businesses located on other floors of the buildings in the areas of influence. In addition, the temporality of the photos sourced from Google Street View does not provide a homogeneous view of all the streets studied.
Economic development and social integration resulting from the rehabilitation of buildings in urban centers depends on several factors, such as the alteration or continuity of use of the entire building. Nevertheless, this point was not taken into account in this article. This question could be addressed in future research.
As another possible future line of research, we propose the inclusion of sociological factors, which could take into account the characteristics of the social fabric and verify their influence on the survival of retail trade and on local development. In the same sense, it would be worth studying whether the influence of the gentrifying process can alleviate the urban exodus from the city center to the suburbs or other population movements.
Furthermore, it would be interesting to apply the methodology to the study of commercial trends and the evolution of the real estate market in areas of urban development or the impact of commercially motivated urban revitalization on specific urban spaces.

