Technical Note

Assessing CALIOP-Derived Planetary Boundary Layer Height Using Ground-Based Lidar

1
School of Earth and Environmental Sciences, Seoul National University, Seoul 08826, Korea
2
NASA Langley Research Center, Hampton, VA 23681, USA
3
National Institute for Environmental Studies, Tsukuba 305-8506, Japan
*
Author to whom correspondence should be addressed.
Remote Sens. 2021, 13(8), 1496; https://doi.org/10.3390/rs13081496
Submission received: 9 February 2021 / Revised: 7 April 2021 / Accepted: 8 April 2021 / Published: 13 April 2021
(This article belongs to the Section Atmospheric Remote Sensing)

Abstract

:
Coincident profiles from the space-borne and ground-based lidar measurements provide a unique opportunity to estimate the planetary boundary layer height (PBLH). In this study, PBLHs derived from the Cloud-Aerosol Lidar with Orthogonal Polarization (CALIOP) were assessed by comparing them with those obtained from the ground-based lidar at Seoul National University (SNU) in Korea for both day and night from 2006 to 2019, and sounding data. CALIOP-derived PBLHs using wavelet covariance transform (WCT) are generally higher than those derived from the SNU lidar for both day and night. The difference in PBLH tends to increase as the signal-to-noise ratio for CALIOP decreases. The difference also increases as aerosol optical depth increases, implying that the PBLH estimated from CALIOP could be higher than that determined from the SNU lidar because of the signal attenuation within the aerosol layer under optically thick aerosol layer conditions. The higher PBLH for CALIOP in this study is mainly attributed to multiple aerosol layers. After eliminating multilayer cases, the PBLHs estimated from both the lidars showed significantly improved agreement: a mean difference of 0.09 km (R = 0.81) for daytime and 0.25 km (R = 0.51) for nighttime. The results from this study suggest that PBL detection using CALIOP is reliable for daytime if multilayer cases are removed. For nighttime, PBLHs derived from the SNU lidar and CALIOP showed a relatively large difference in frequency distribution compared with sounding data. It suggests that further investigations are needed for nighttime PBLHs, such as investigations about discriminating the residual layer and the difference between lidar-derived PBLH based on the aerosol layer and thermally derived PBLH from radiosonde data for the stable boundary layer during the nighttime.

Graphical Abstract

1. Introduction

The planetary boundary layer (PBL), as the lowest part of the troposphere, plays an important role in the exchanges of energy, momentum, moisture, gases, and aerosols between the earth surface and free atmosphere [1]. The PBL height (PBLH), therefore, is a key parameter in air quality modeling, as PBL disperses surface-emitted pollutants and acts as a barrier to the pollutants by preventing their transport to the free atmosphere [2,3,4,5]. As aerosols tend to mix well in PBL, especially for convective PBL conditions during daytime, and the aerosol concentration rapidly decreases above PBL, both ground-based and space-borne lidar measurements have been widely used for PBLH detection (e.g., [6,7,8,9,10]).
The vertical profiles of elastic backscatter from the Cloud-Aerosol Lidar with Orthogonal Polarization (CALIOP) onboard Cloud-Aerosol Lidar and Infrared Pathfinder Satellite Observation (CALIPSO) have been widely used for PBLH estimation [11,12,13]. CALIOP can be useful to produce PBLHs on global and regional scales, including where ground-based or radiosonde observations are not available. Jordan et al. [11] derived PBLHs from CALIOP in the western hemisphere and over Africa and compared them with PBLHs obtained from the GEOS-5 Modern Era Reanalysis for Research and Applications (MERRA) model. They found correlation coefficients in the range of 0.47–0.73. McGrath-Spangler and Denning [14] estimated the spatial pattern of midday summertime PBLHs over North America using five-year CALIOP data and showed that CALIOP-derived PBLHs are generally consistent but shallower than MERRA reanalysis and Aircraft Meteorological Data Reporting estimates. Leventidou et al. [15] compared PBLHs derived from CALIOP with the European Center for Medium-Range Weather Forecasts and radiosonde observations and found a high correlation of 0.82 upon eliminating dust cases.
PBLHs obtained from CALIOP and ground-based lidar measurements have been compared [16,17,18,19]. Wu et al. [16] compared PBLHs estimated from CALIOP and ground-based lidar measurements in eastern US and found a good agreement with a correlation coefficient greater than 0.7. A similar result of correlation (0.73) was obtained by Liu et al. [17] at the Semi-Arid Climate and Environment Observatory of Lanzhou University, China, whereas slightly lower correlation coefficients of 0.59 at Beijing and 0.65 at Jinhua were reported by Zhang et al. [18]. Su et al. [19] also found similar correlation coefficients of 0.6–0.7 between CALIOP and ground-based lidar PBLHs in Hong Kong. Most of these studies reported reasonable agreement in PBLH between CALIOP and ground-based lidar estimates; however, detailed discussions about the reasons for the difference in PBLH are fairly insufficient. Moreover, the comparison was mostly focused on daytime only, with a limited number of collocated data pairs (mostly several tens of data pairs only for a few years or less). Due to the narrow coverage across the track for CALIOP, most previous studies had horizontal distance farther than several tens of kilometer from the station to the CALIPSO ground track, which can induce uncertainties for the comparison.
The lidar located at Seoul National University (SNU) was ideally located within 10 km of the CALIPSO ground track for both day and night for 14 years from 2006 to 2019 [20,21]. In this study, PBLHs estimated from CALIOP and ground-based SNU lidar measurements were compared using more than 500 collocated and nearly simultaneous data pairs (203 pairs after removing cases with clouds and totally attenuated signals) for both day and night. We assessed CALIOP-derived PBLHs using collocated ground-based lidar profiles and discuss in detail the possible reasons for discrepancy in PBLH. Section 2 introduces data from CALIOP and ground-based lidar and the data-selection method for the comparison. A PBLH detection method is described in Section 3. In Section 4, comparison results are discussed, focusing on the possible reasons for the discrepancy in PBLH between CALIOP and ground-based lidar estimates.

2. Data

2.1. Space-Borne Lidar CALIOP Onboard CALIPSO

CALIOP is a space-borne lidar system operating at two wavelengths of 532 and 1064 nm and a depolarization channel at 532 nm and provides horizontal and vertical distributions of aerosols and clouds over the globe [22]. In this study, the CALIOP level 1B (333 m in horizontal resolution) and level 2 aerosol profile (5 km in horizontal resolution) products (version 4) were used [23,24,25].
The total attenuated backscatter (TAB) at 532 nm, one of the primary data from the CALIOP level 1B profile product, is a calibrated, range-corrected, laser-energy-normalized, and baseline-subtracted lidar return signal. It has different horizontal and vertical resolutions for different altitude regimes. For the altitude ranging from −0.5 to 8.3 km, considered in this study, the horizontal and vertical resolutions were 333 m and 30 m, respectively. The vertical feature mask (VFM) from the CALIOP level 2 profile product was used to eliminate the totally attenuated TAB profiles near the surface.

2.2. Ground-Based Lidar

The ground-based elastic aerosol lidar system in SNU (126.95°E, 37.46°N, 90 m) has two wavelengths of 532 and 1064 nm with a depolarization measurement at 532 nm. It has been operating continuously since March 2006 as a part of the Asian Dust and Aerosol Lidar Observation Network (AD-Net) [26,27,28,29]. The laser energy is 50 mJ per pulse with a repetition frequency of 10 Hz. The lidar signal is overlap-corrected and fully overlapped at around 500 m. It provides TAB at 532 nm with vertical and temporal resolutions of 30 m and 15 min, respectively (on for 5 min and off for 10 min).

2.3. Collocation and Data Selection

CALIPSO passes within 10 km of SNU twice every 16 days at approximately 04:50 UTC (13:50 KST; Korea Standard Time) during the day and 17:40 UTC (02:40 KST) during the night. A total of 540 profiles of CALIOP over SNU (265 for daytime and 275 for nighttime) were collected for comparison from 2006 to 2019. Figure 1 shows the locations of the SNU lidar site and all CALIPSO ground tracks used in this study. The collocated data pair is defined as a pair of SNU lidar profiles that are closest (less than 5 min) to the CALIPSO overpass time and the average of the closest 30 CALIOP profiles (10 km average in horizontal) to SNU, as shown in Figure 1 with red lines.
Totally attenuated CALIOP TAB profiles cannot be used to determine PBLH. These were thus excluded from this study using VFM from the CALIOP level 2 profile product.
Although clouds are mostly responsible for totally attenuated signals near the surface, TAB profiles with transparent clouds at high altitudes can still be used for PBLH determination. Thus, clouds above 3 km from the surface were not removed if the signal was not totally attenuated. Clouds below 3 km, however, can affect the determination of PBLH and were thus excluded. Small fragmented clouds are often detected by the CALIOP level 2 cloud layer product with a horizontal resolution of 333 m, although they are not reported by VFM in 5-km resolution. TAB profiles including these small clouds below 3 km were also removed.

3. PBLH Determination Method

Various methods to detect PBLH from lidar measurements, using aerosols as proxy, have been suggested in the literature. PBLH can be determined from lidar backscatter signals by subjective visual inspection [30,31]. Melfi et al. [32] used a threshold (backscatter signal exceeds the clear atmosphere signal by a small arbitrary value) to determine PBLH. The vertical gradient of a lidar backscatter profile is used to detect PBLH from lidar measurements—first derivative [33,34,35,36] and second derivative of the backscatter profile [37], first derivative of the logarithmic backscatter profile [38,39], and vertical gradient of the idealized profile instead of the original backscatter profile [40,41,42,43] have been used. PBLH detection methods using the maximum variance (or maximum standard deviation; MSD) of the backscatter signal [17,18,19,44] and wavelet covariance transform (WCT) [45,46,47,48,49] are also widely used.
PBLH detection from CALIOP measurements uses a similar method to that with ground-based lidar, as described above. The MSD method is frequently used to determine PBLH from CALIOP TAB profiles [11,12,14,17]. Wu et al. [16] used the WCT method and Su et al. [19] used both MSD and WCT methods. Some other studies used the estimated aerosol backscatter [50] or CALIOP level 2 aerosol layer height product [15] rather than the CALIOP level 1B profile product.
For the direct comparison of PBLH detection between CALIOP and ground-based lidar, WCT and MSD methods were preliminarily considered in this study. Both these methods are simple, stable, and widely applied for both CALIOP and ground-based lidar measurements. Although no significant difference was observed between WCT and MSD methods after testing, we selected the WCT method to determine PBLH to focus on the comparison between CALIOP and the SNU lidar. Su et al. [19] also reported that WCT performs slightly better than MSD for comparison among CALIOP, ground-based lidar, and radiosonde.
The WCT method uses the Haar function [51], defined as
h ( z b a ) = { + 1 :   b a 2 z b 1 :   b z b + a 2 0 : e l s e w h e r e , ,
where z is altitude, a is the spatial extent or “dilation”, and b is the centered location of the Haar function or the “translation” of the function. The covariance transform of the Haar function is defined as
W f ( a , b ) = 1 a b a s e t o p f ( z ) h ( z b a ) d z ,
where top and base are the lower and upper limits of the TAB profile and f(z) denotes the TAB profiles of CALIOP and SNU lidar. PBLH is determined to be the altitude at which Wf is maximum. Here, a is the key parameter for the WCT method and generally ranges between 100–1000 m for ground-based lidar [19]. In this study, a was selected as 300 m for both SNU lidar and CALIOP, which is consistent with previous studies [13,19,52]. The TAB signals at the lowest level of 150 m for both CALIOP and SNU lidar were not used in order to minimize uncertainty due to the surface contamination (for CALIOP) and insufficient overlap correction (for SNU lidar). Thus, PBLHs were determined from 300 m (lowest level + a/2) to 3 km above the ground.
TAB profiles from the SNU lidar had high signal-to-noise ratios (SNRs), sufficient to detect PBLH near the surface, whereas CALIOP TAB profiles were considerably noisier. To increase SNR for the CALIOP data, we averaged the CALIOP TAB profiles vertically with a moving window of 10 levels (300 m).

4. Results and Discussion

4.1. PBLH Estimation: CALIOP Versus Ground-Based SNU Lidar

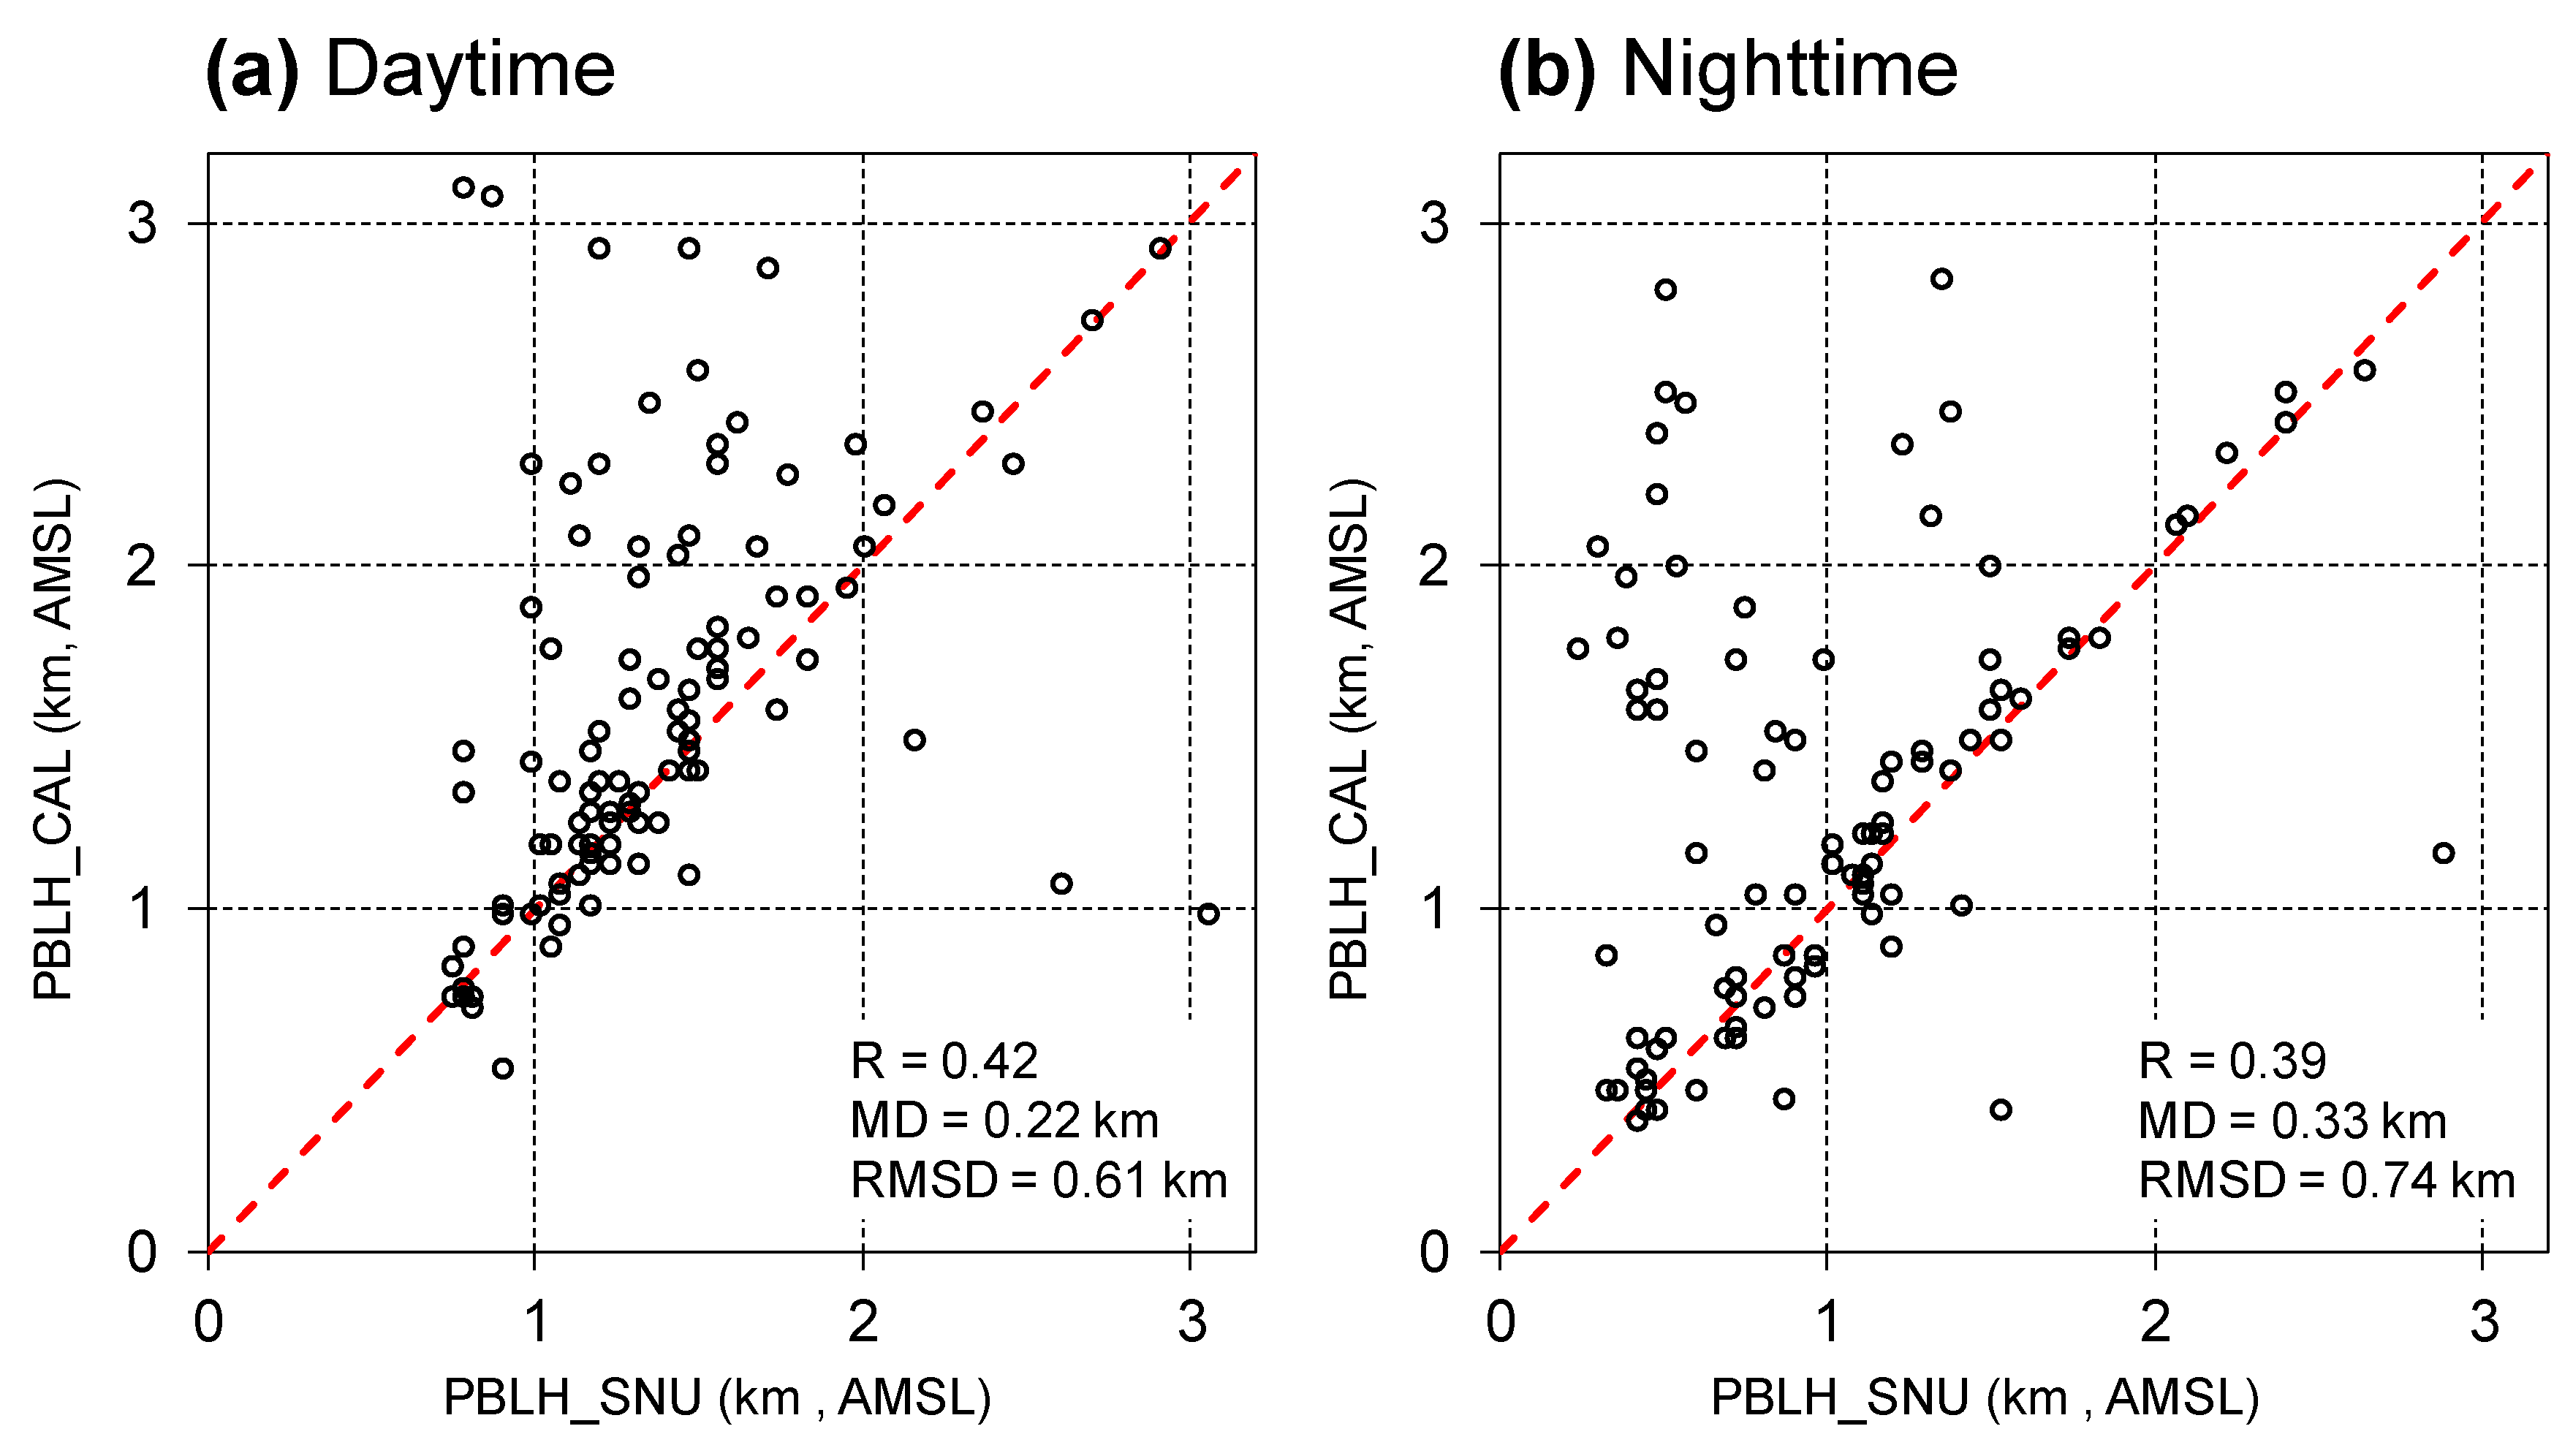
Among the 540 collocated data pairs of the SNU lidar and CALIPSO tracks (Figure 1), 203 (105 for daytime and 98 for nighttime) profiles were selected for comparison after filtering out the total attenuated signals and clouds below 3 km above the ground level. Figure 2 shows the PBLHs determined from SNU lidar and CALIOP measurements, respectively, using the WCT method for day and night. The mean (± standard deviation) PBLHs for daytime (nighttime) are 1.38 ± 0.45 (1.01 ± 0.56) km and 1.60 ± 0.59 (1.34 ± 0.64) km for ground-based SNU lidar and CALIOP, respectively, with a mean difference of 0.22 ± 0.57 (0.33 ± 0.66) km. Note that the PBLHs shown hereafter are altitudes above the mean sea level (AMSL). The surface elevation of the SNU lidar site is 90 m AMSL, and those of the CALIOP profiles vary from a few meters to several hundred meters with the mean ± SD and median of 120 ± 102 m and 83 m, respectively, for all CALIOP profiles used in this study. A few cases showed that the PBLH determined from ground-based SNU lidar was lower than the surface elevation of the CALIOP profiles and were thus removed from this study. It should be noted that the effect of elevated aerosol layers is not considered in Figure 2. The well-known drawback of estimating PBLH from lidar measurements is the selection of the top of an elevated aerosol layer as PBLH, instead the selection of the true PBLH [53]. Several methods to improve PBLH detection under multilayer conditions have been proposed [54,55,56]. Some of our results in Figure 2 may suffer from this drawback. The effect of multilayer cases is discussed later in Section 4.2.
From the respective PBLHs determined from the two lidars, it is evident that more than 60% of the data pairs are concentrated near the 1:1 line, with a difference less than ±200 m for both day and night. Data pairs with a large difference are mostly located on the upper left side of the 1:1 line in Figure 2, indicating that the PBLHs determined by CALIOP (PBLH_CAL) are higher than those determined by SNU lidar (PBLH_SNU). CALIOP may satisfactorily detect an elevated aerosol layer top but fails to detect a low aerosol layer, which is detected by the up-looking, ground-based SNU lidar. Cases with PBLH_CAL higher than PBLH_SNU are more frequent for nighttime compared with daytime, as shown in Figure 2b. As PBLH is lower during nighttime compared with daytime, CALIOP has more chances of failing to detect lower aerosol layers near the surface at night.

4.2. Effects of Multiple Aerosol Layers and Signal Attenuation on PBLH Determination

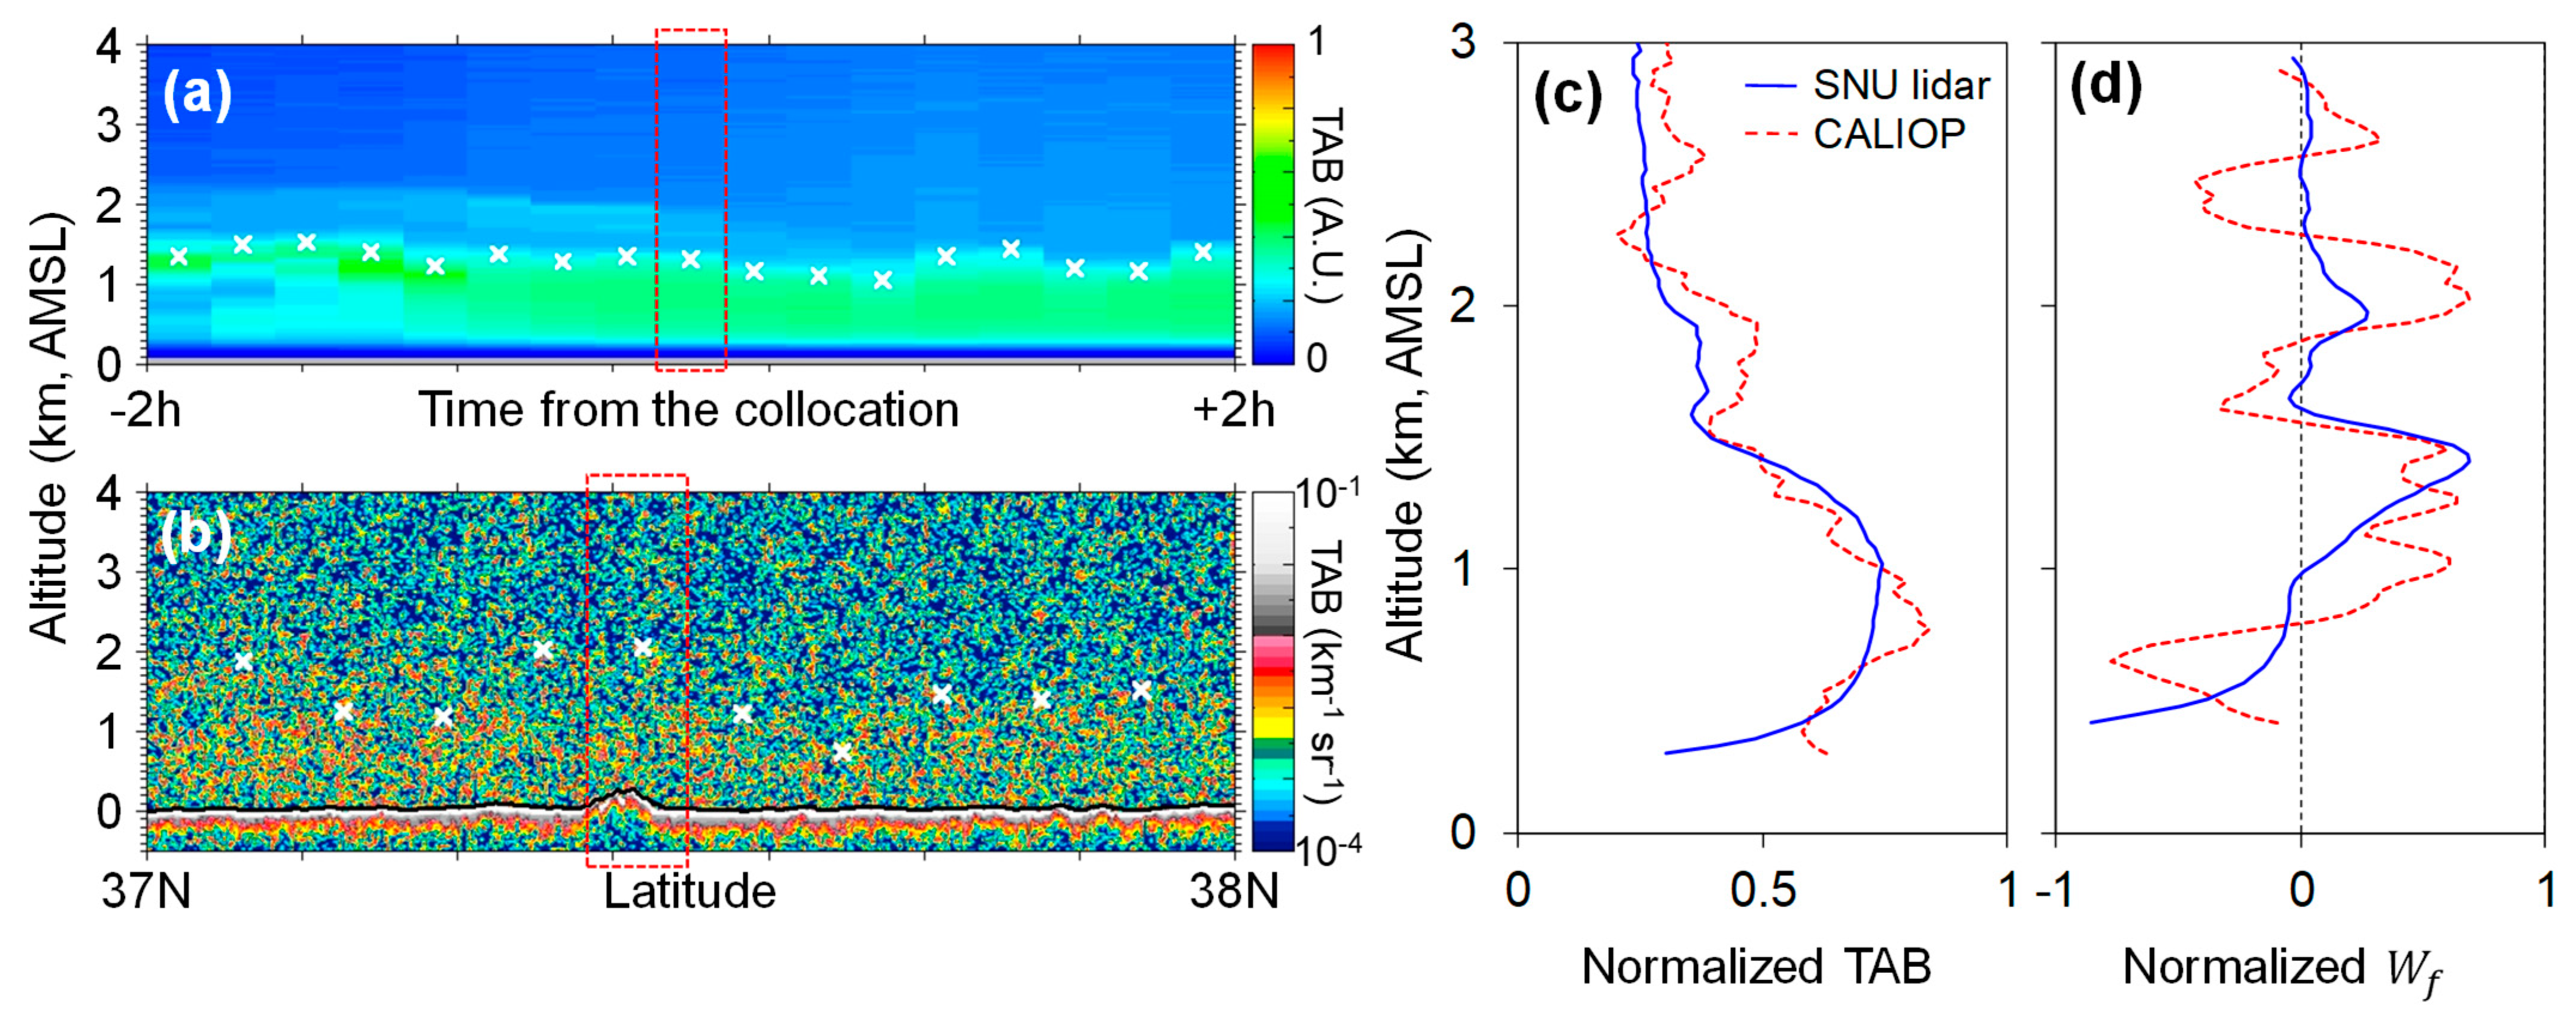
Figure 3 shows an example of a collocated data pair showing higher PBLH for CALIOP than that for the SNU lidar. An aerosol layer is seen from the SNU lidar measurements from surface to approximately 1.5 km (see Figure 3a). The measurement from CALIOP (see Figure 3b), however, is considerably noisier, which makes it difficult to determine the top of the aerosol layer. Figure 3c shows collocated TAB profiles from SNU lidar and CALIOP (red dashed boxes in Figure 3a,b respectively). For comparison, the profiles of the SNU lidar and CALIOP were normalized to have a similar intensity for aerosol layer below 1.5 km. Despite the noise, the TAB profile from CALIOP reasonably matches with that of the SNU lidar. For a weak aerosol layer from 1.5 to 2 km, however, the TAB coefficient shows a relatively larger difference between CALIOP and the SNU lidar compared to the lower aerosol layer below 1.5 km. This difference results in different Wf s between the two instruments, as shown in Figure 3d, which directly impacts the determination of the PBLH. The SNU lidar achieves its maximum Wf at an altitude of 1.4 km, which is determined to be PBLH, whereas the maximum Wf for CALIOP is located at the top of the elevated layer (2.0 km). The case in Figure 3 shows that the TAB profiles of CALIOP are more sensitive to the upper aerosol layer and nosier than those of the ground-based SNU lidar. As a result, CALIOP is more likely to find PBLH at the top of an elevated aerosol layer than the ground-based SNU lidar.
Even if both CALIOP and the SNU lidar detect the same aerosol layer, PBLHs determined by the two instruments can be different because of the signal attenuation within aerosol layers. Figure 4 shows a case for an extremely thick aerosol layer near the surface. The level 2 CALIOP aerosol product shows that aerosol optical depth (AOD) at 532 nm for an aerosol layer from the surface to 1.8 km is 1.46, which is more than four times higher than the mean AOD of 0.33 for all the cases considered in this study. In Figure 4a,b, both the SNU lidar and CALIOP detect an aerosol layer at the same altitude of approximately 2 km from the surface, although the TAB signals of CALIOP rapidly decrease while passing through the aerosol layer (see Figure 4c). Consequently, the determined PBLHs are different, i.e., 1.6 km (CALIOP) and 0.4 km (SNU lidar), as if each instrument detects completely different aerosol layers (see Figure 4d). Although this is an extraordinary case, it suggests that PBLHs determined from the ground-based up-looking SNU lidar can be lower than those estimated from down-looking CALIOP, owing to the attenuation within optically thick aerosol layers.
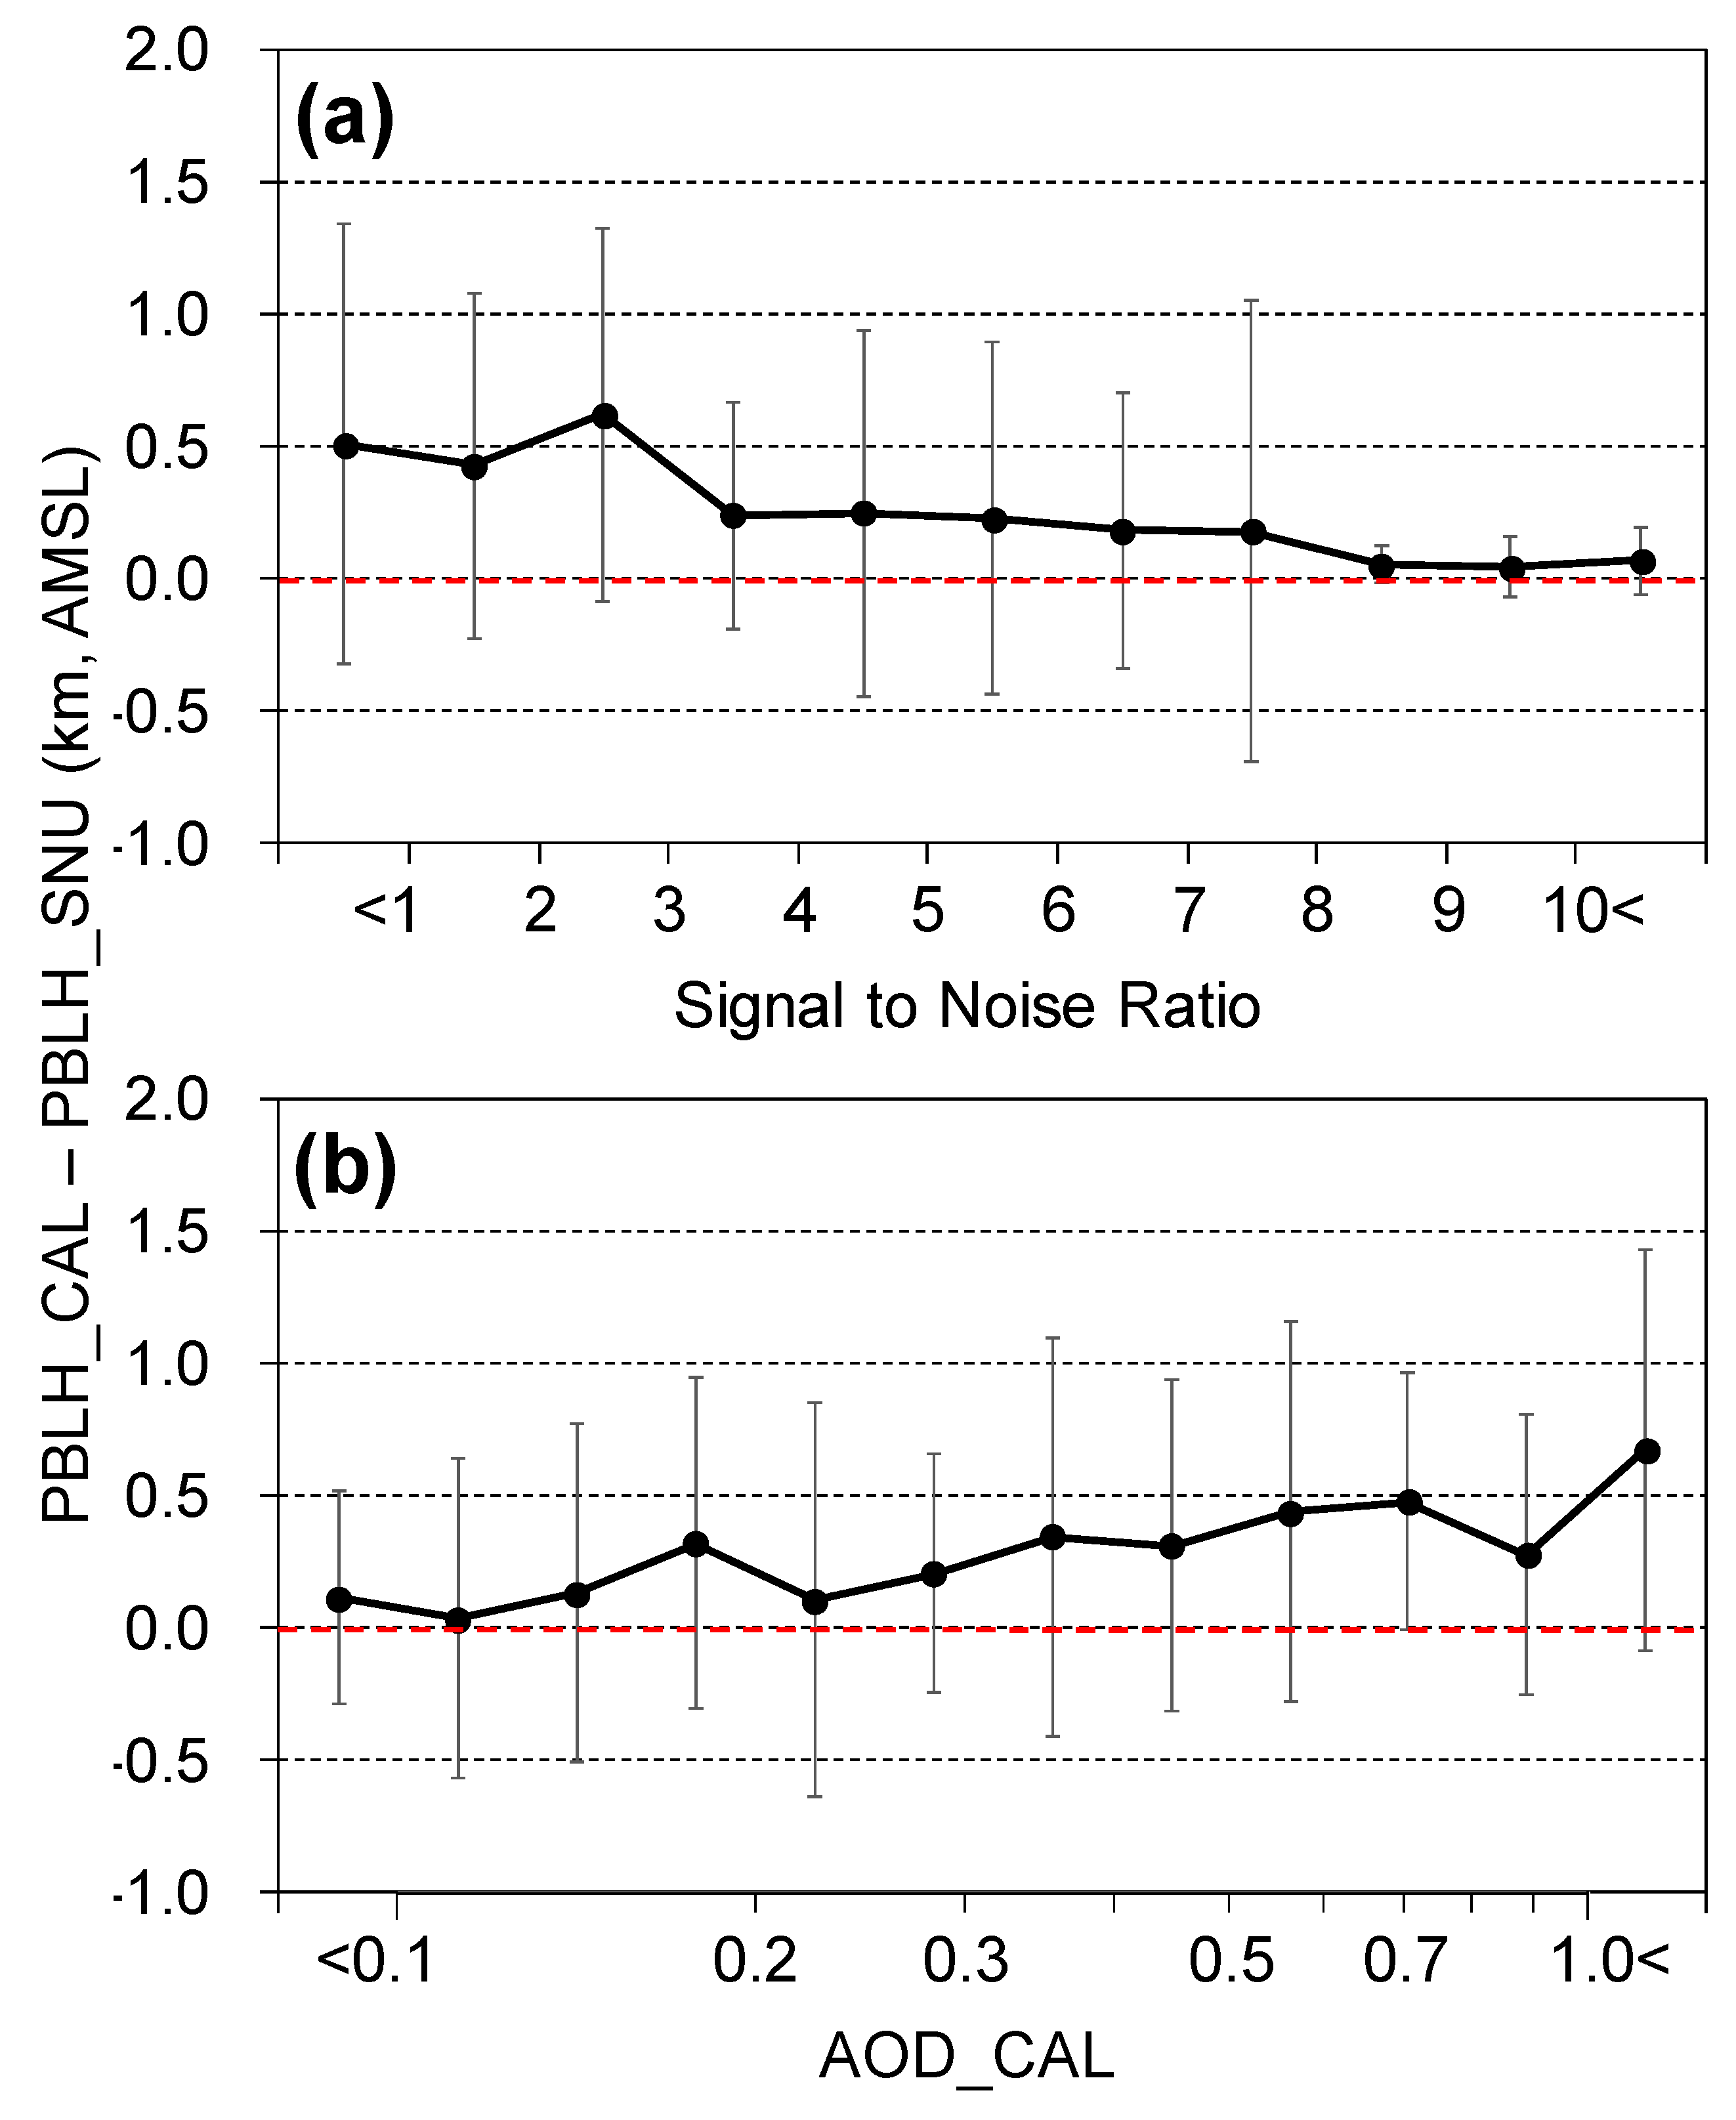
Figure 5a shows PBLH differences depending on SNR of the CALIOP TAB intensities at PBL. The SNR shown in Figure 5a is simply defined as the ratio of mean TAB intensity (molecular contribution removed) in the PBL to the standard deviation of TAB intensity of free atmosphere above the PBL. Clearly, the PBLH difference increases as the SNR decreases. The relation between PBLH difference and AOD is shown in Figure 5b. PBLH_CAL tends to be higher than PBLH_SNU as AOD increases. Su et al. [19] reported that the uncertainties in PBLHs derived from CALIOP and ground-based lidar increase when aerosol loading is low, contrary to the observation made in this study. They suggested that the low SNR for a CALIOP TAB profile is likely associated with low aerosol loading and responsible for errors in PBLH detection. Their suggestion is partly consistent with this study, i.e., the low SNR of the CALIOP profile is responsible for the large PBLH difference. However, our results suggest that low aerosol loading is not necessarily responsible for a large difference in PBLH. A better agreement for low aerosol loading, unlike the result from Su et al. [19], may be attributed to higher SNRs for the CALIOP profiles used in this study. As mentioned above, we smoothed the TAB profiles from CALIOP to increase the SNR. Multiple aerosol layer cases are likely to have larger AOD and may contribute to the increase of PBLH difference as AOD increases. The signal attenuation for an optically thick aerosol layer, as described in Figure 4, is also responsible for the large PBLH differences with large AODs. Therefore, based on the result from Figure 5, it can be said that PBLHs determined from CALIOP and ground-based lidar have better agreement for lower aerosol loading, as long as the SNR for CALIOP TAB profiles is sufficiently high to detect aerosol layers.
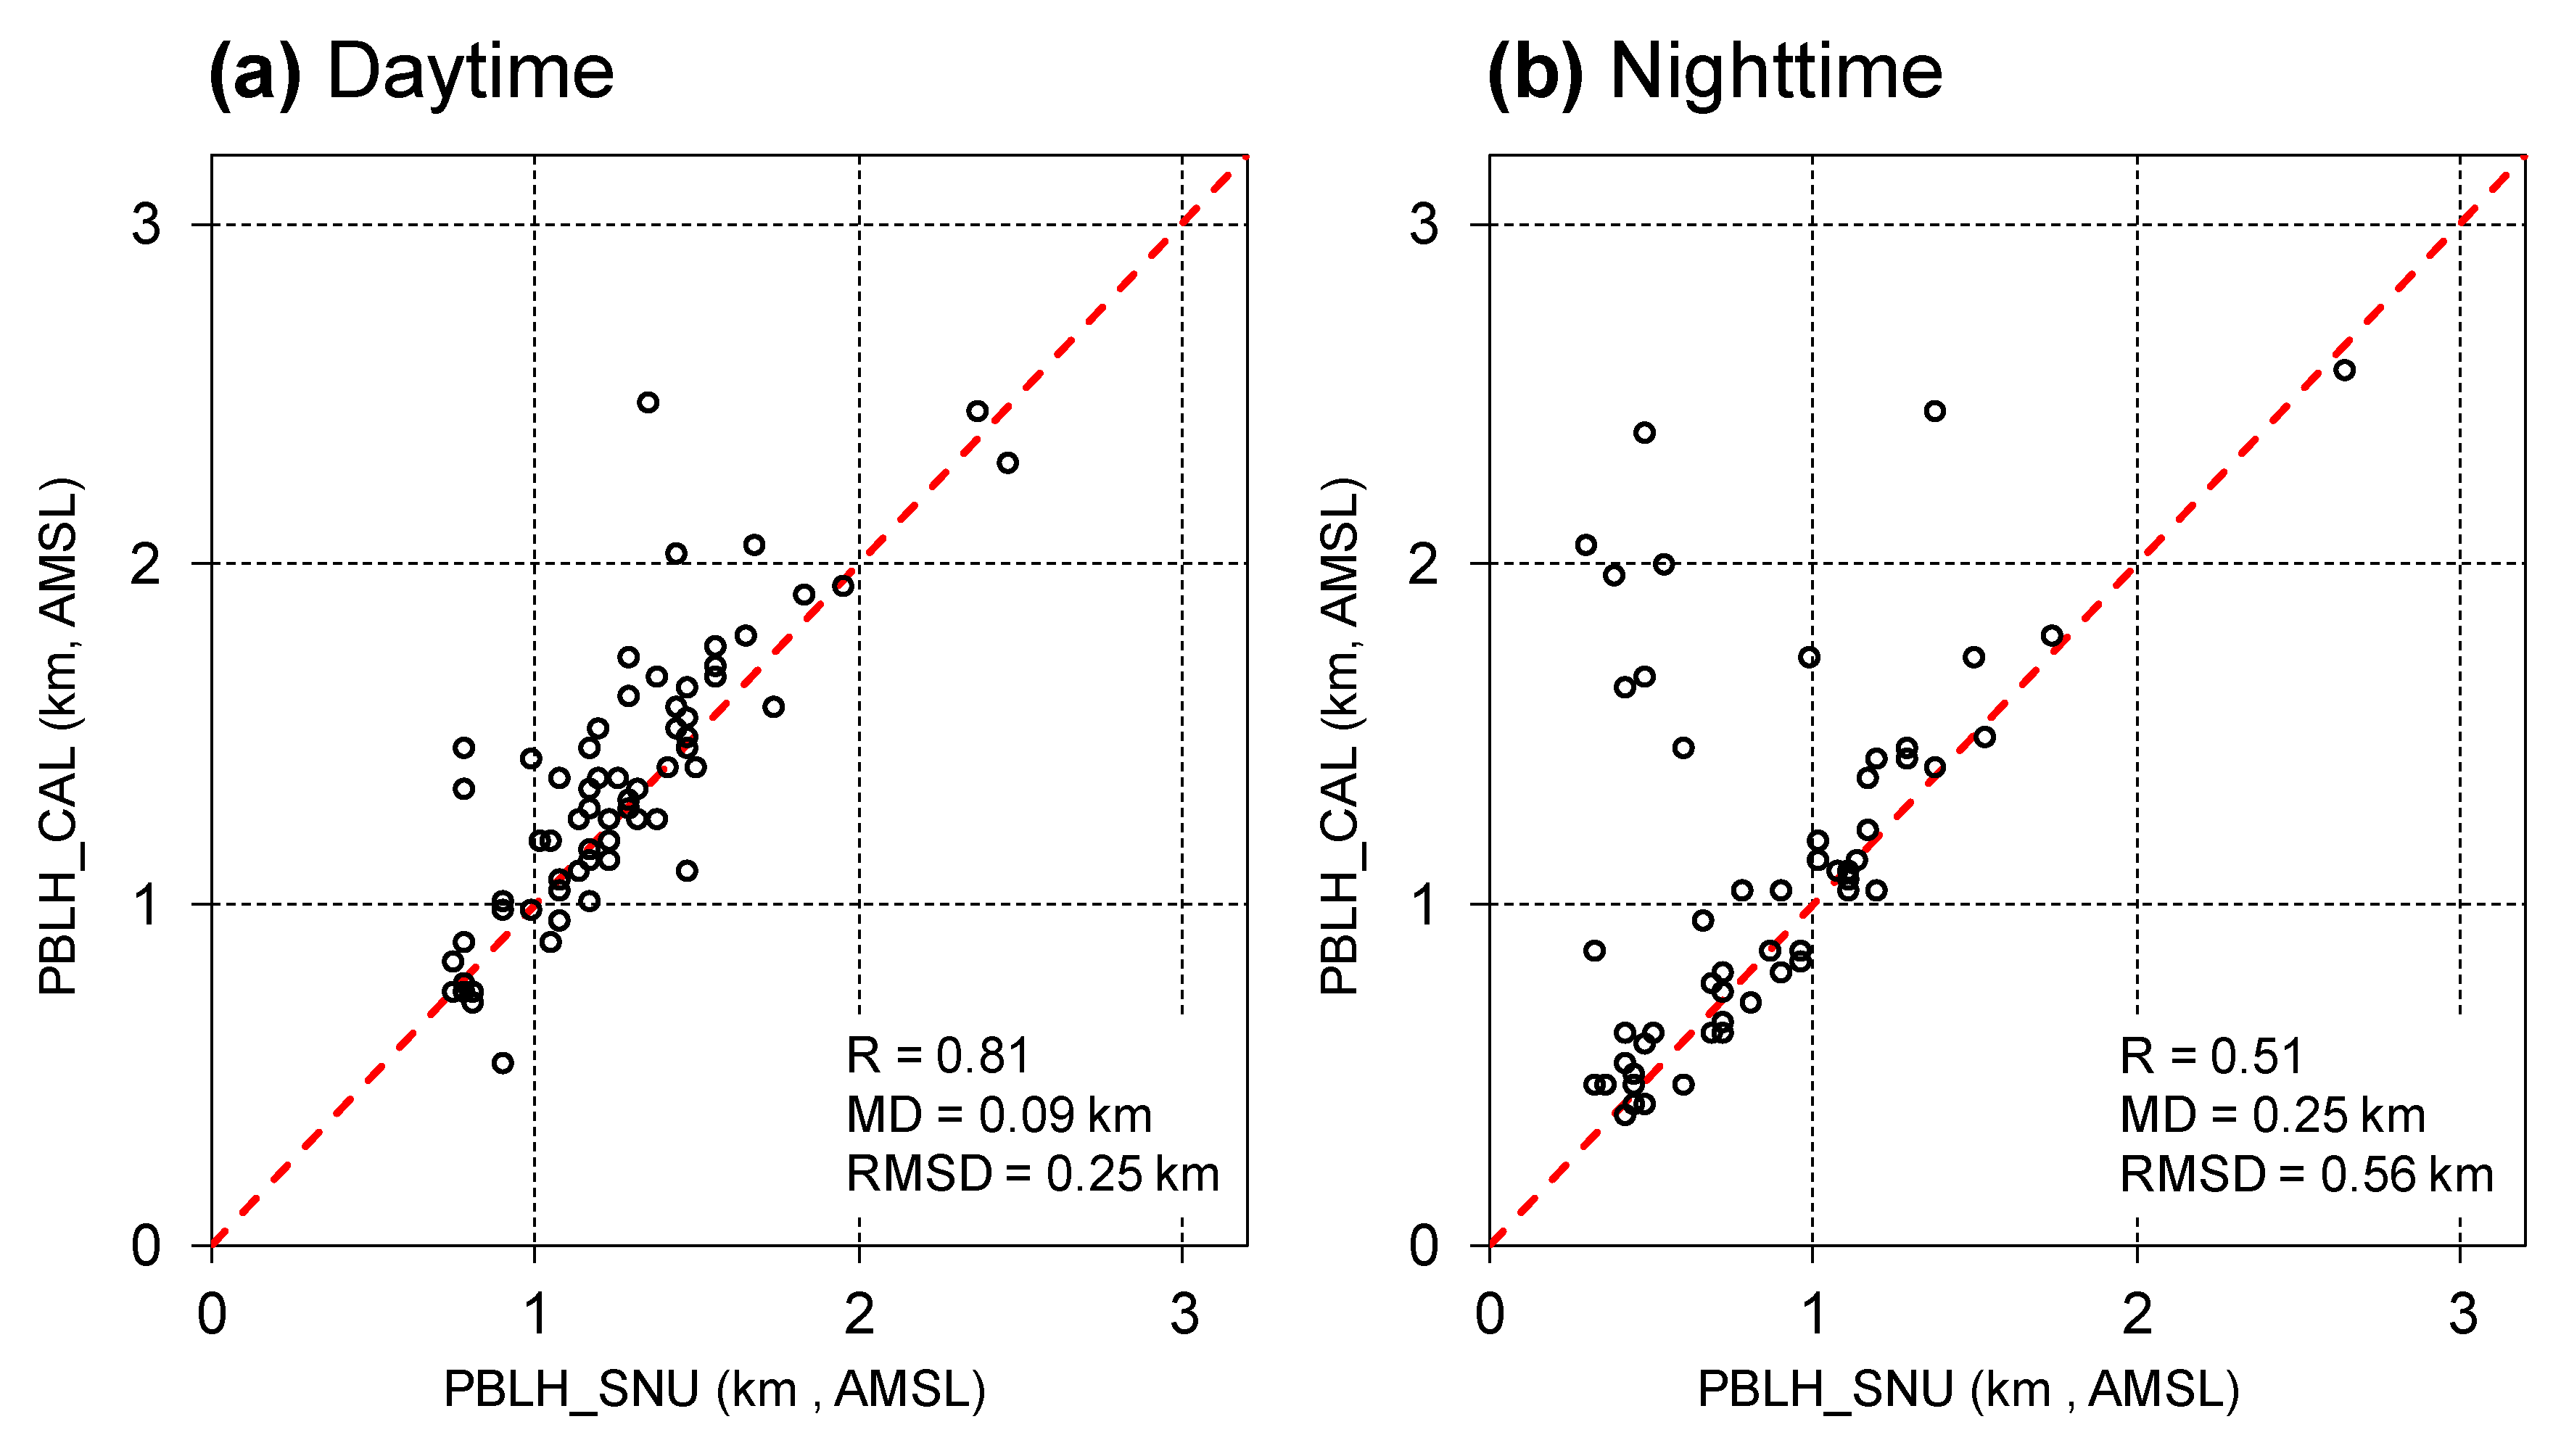
Due to the fact that high discrepancies in PBLH between the CALIOP and the SNU lidar estimates are likely attributed to elevated aerosol layers, as shown in Figure 3, PBLHs were compared using only “single aerosol layer” cases for both the instruments (Figure 6). A case is defined as a “single aerosol layer” when there is no additional local peak in either Wf profile below the determined PBLH. In Figure 3d, for example, PBLH_SNU is determined to be 1.4 km, and Wf (blue solid line) has no other peaks below that altitude. Although a weak elevated layer exists from 1.5 to 2 km, the TAB profile from the SNU lidar is considered as a single aerosol layer in this case. For CALIOP, however, Wf (red dashed line) achieves its maximum at an altitude of 2 km, which is determined to be PBLH, but Wf has additional minor peaks at approximately 1–1.5 km. Accordingly, this scenario is defined as a multilayer case and was thus removed from the comparison shown in Figure 6.
An additional 80 data pairs were removed after filtering out multilayer cases, and 67 (56) data pairs remained for daytime (nighttime). Although several cases with large differences are still shown for nighttime, the PBLHs from the two instruments have better agreement in Figure 6 compared with Figure 2. The mean (± standard deviation) PBLHs for daytime (nighttime) were 1.27 ± 0.34 (0.84 ± 0.44) km and 1.35 ± 0.40 (1.09 ± 0.56) km for the SNU lidar and CALIOP, respectively, with a mean difference of 0.09 ± 0.24 (0.25 ± 0.50) km. Correlation coefficients increased from 0.42 to 0.81 and 0.38 to 0.51 for daytime and nighttime, respectively, which is comparable with previous studies shown in Introduction (range of 0.6–0.7 [16,17,18,19]). This significant improvement in agreement of PBLH between the two instruments after removing multilayer cases indicates that the large differences shown in Figure 5 are likely to be related to multilayer cases. CALIOP has a higher probability of determining an elevated aerosol layer as PBL under noisy conditions (see Figure 5a), and multilayer cases are likely to have a higher column AOD than single layer cases (see Figure 5b).

4.3. PBLH Comparison: Lidars Versus Radiosonde

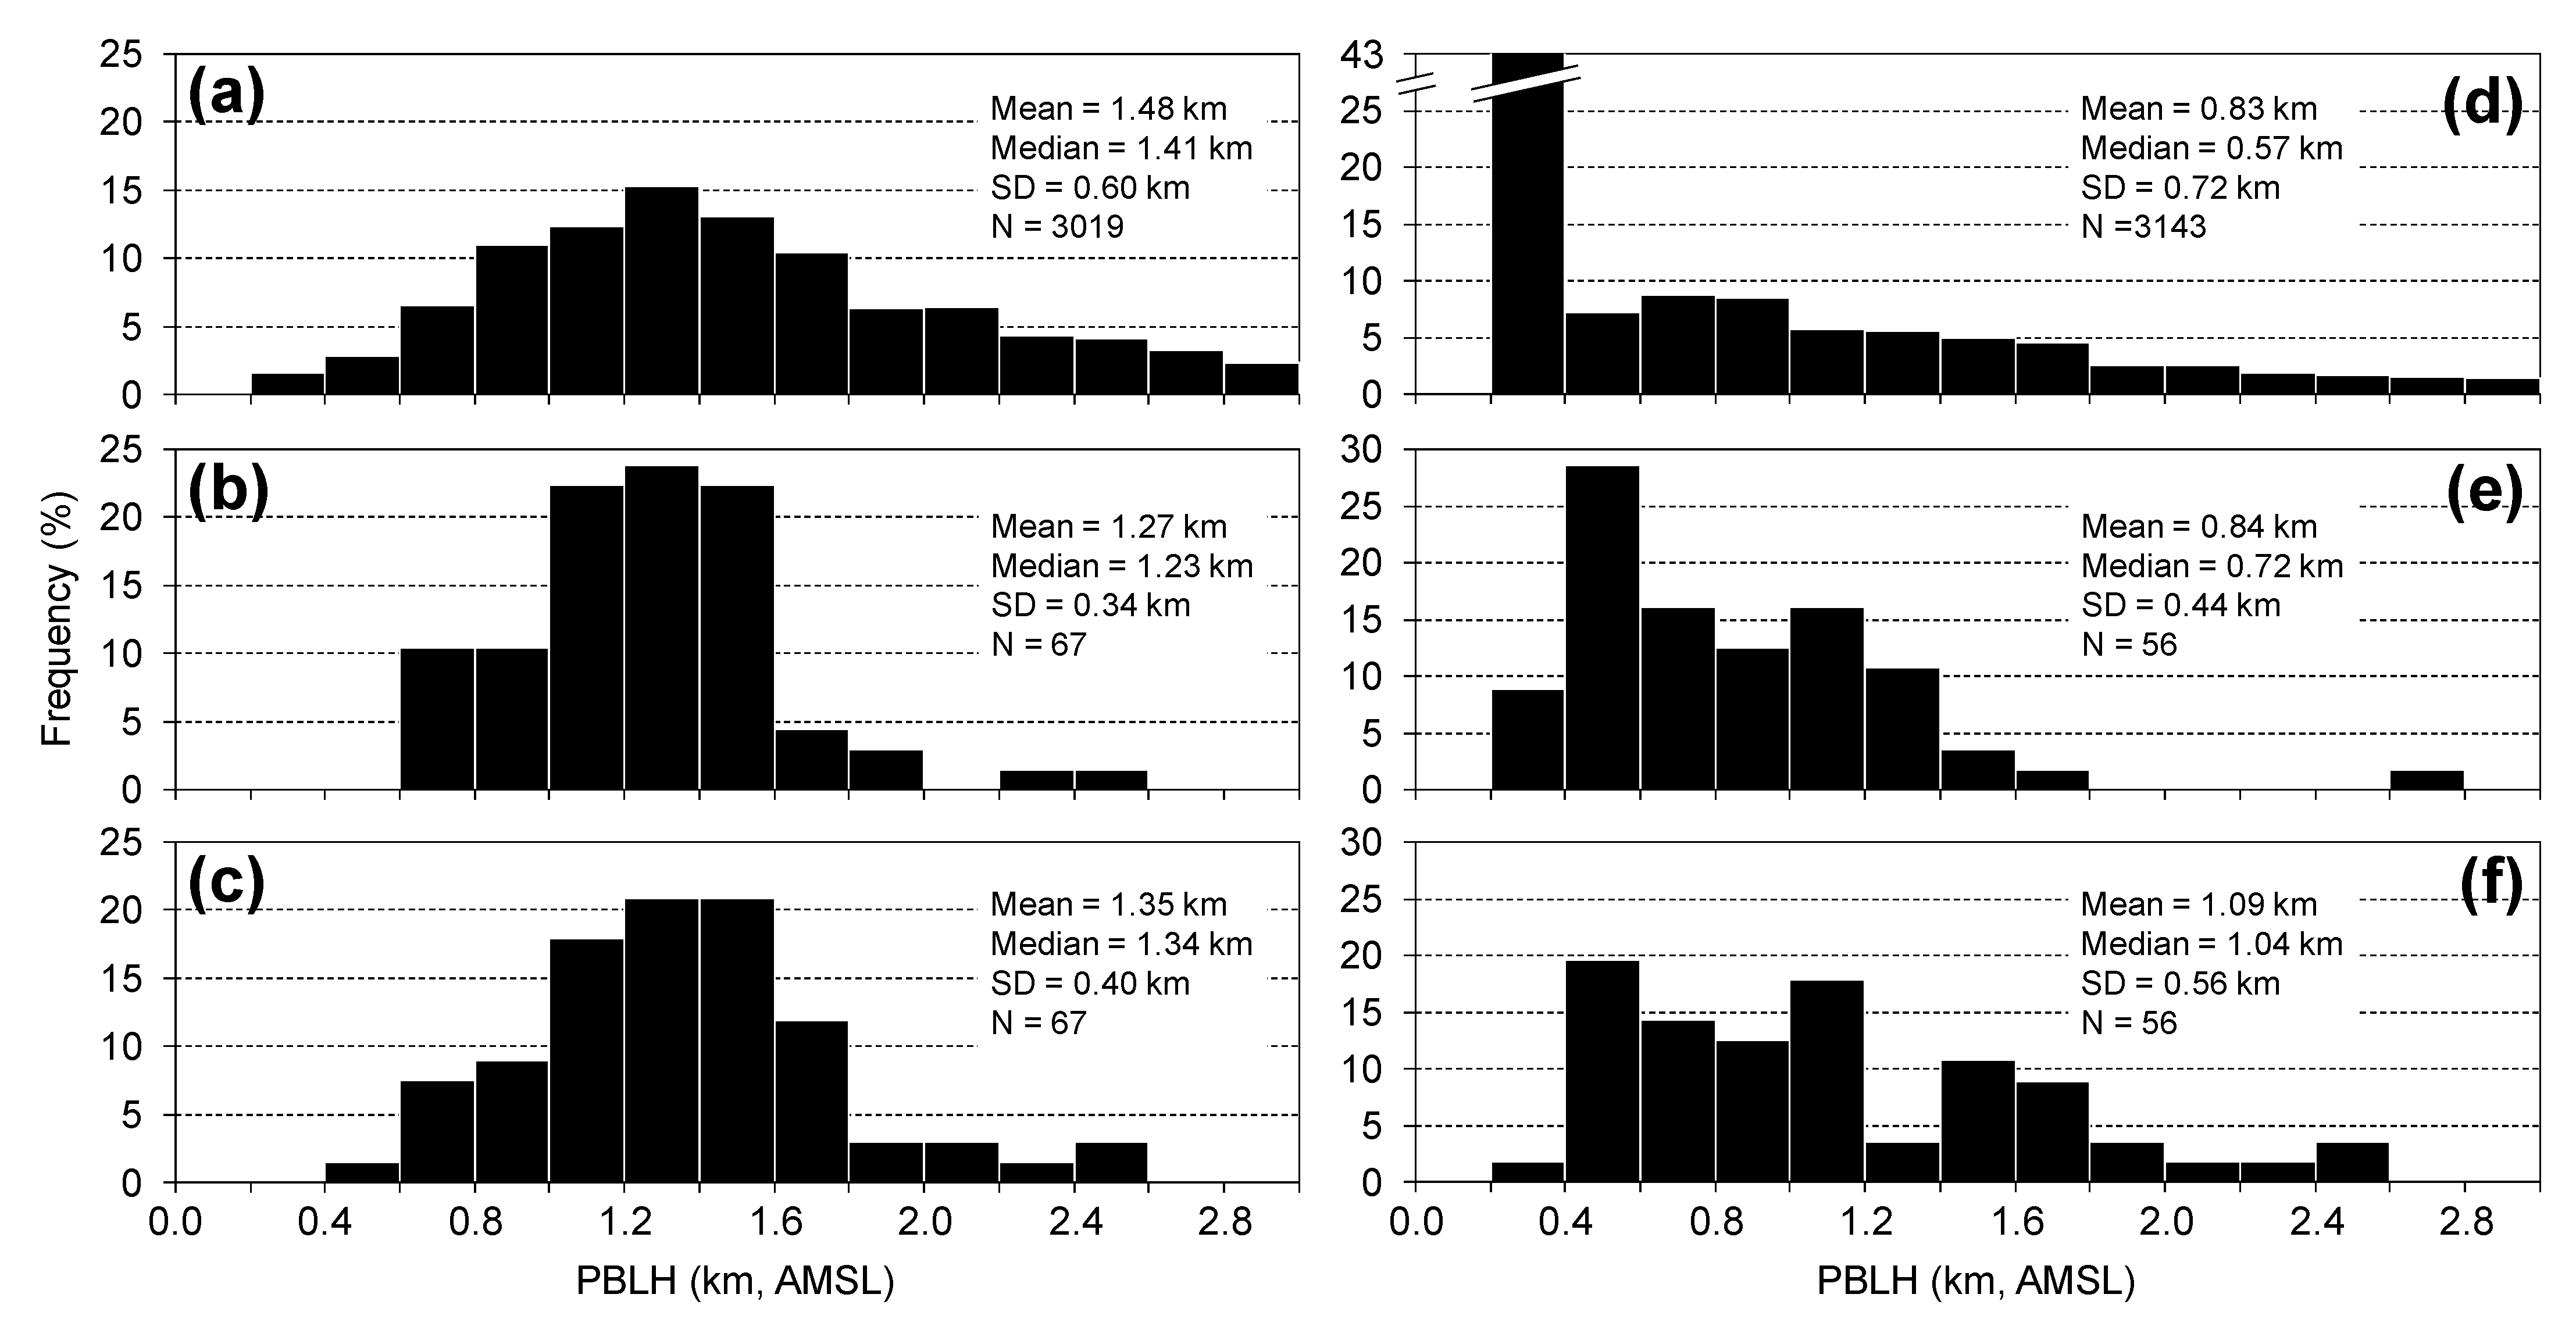
PBLHs for single aerosol layers were compared with those from the sounding data at Osan air force base (Figure 7), which is located at approximately 40 km south from the SNU lidar site with a surface elevation of 52 m, where it launches radiosondes every 6 h. Sounding data at 06:00 UTC for daytime and 18:00 UTC for nighttime were used for this comparison. Therefore, the time difference between lidar data pair and sounding data was approximately 70 min for daytime and 20 min for nighttime. WCT, the same method used for lidars, was applied to determine PBLH using potential temperature from the sounding data. To minimize the condensation or cloud effects on PBL, sounding data with relative humidity higher than 90% in the PBL were screened out. The number of sounding data points used in this study was 3019 (3143) for daytime (nighttime) during the same time as the lidar data. We note that the sounding data from Osan provide meteorological information with a fairly coarse vertical resolution, including several reference pressure levels (i.e., 1000, 925, 850 hPa, etc.) [57]. In this study, only the sounding data with more than 10 levels below 3 km were selected for PBLH determination. Seidel et al. [58] estimated PBLH using routinely operated sounding data over the globe with a method similar to that used in this study. They selected only the sounding data with more than 10 data levels at or below 500 hPa. However, an uncertainty is expected in PBLH obtained from sounding data owing to the coarse vertical resolution. This uncertainty might be responsible for unexpectedly high PBLHs for the sounding data shown in Figure 7a–d.
The mean (± standard deviation) PBLHs derived from the sounding data were 1.48 ± 0.60 and 0.83 ± 0.72 km for daytime and nighttime, respectively. Although the mean PBLH from the sounding data shows a difference of approximately 0.2 km with the SNU lidar and CALIOP (for single aerosol layer) observations for daytime, the frequency distribution (left panel in Figure 7) shows a reasonable agreement with the maximum frequency at 1.2–1.4 km. For nighttime (right panel in Figure 7), however, the SNU lidar and CALIOP frequently overestimate PBLH compared with the sounding data. Although the mean PBLHs for SNU lidar and sounding data are similar, the median values and frequency distributions show distinct differences between sounding data and lidars. This suggests that both ground-based and space-borne lidars may miss lower aerosol layers (or true PBL) and determine elevated aerosol layers as PBL during nighttime. This can happen because a residual layer frequently exists above PBL during nighttime, which cannot be properly accounted for with only lidar measurements. Another possible reason is the difference between thermally defined PBLH from sounding data and lidar-derived PBLH based on aerosol layer. The PBL for daytime is typically considered as the convective boundary layer. Since aerosols mix well in the convective boundary layer, lidar-derived PBLH for daytime tends to be similar to the thermally defined PBLH from sounding data. However, for nighttime, PBL is more likely to be classified as a stable boundary layer [52,59,60]. Thermally derived PBLHs for a stable boundary layer during nighttime are generally very low, as shown in Figure 7d, and could be lower than PBLHs derived from lidar measurements. It should be noted that the detection limits of both CALIOP and the SNU lidar for low altitude are also responsible for the PBLH differences in Figure 7 during nighttime. As a result of the overlap issue for the SNU lidar and the variation of the surface elevation for CALIOP, the lower limit for lidar-derived PBLH was 300 m in this study as mentioned in Section 3. However, 35% of nighttime PBLHs derived from the sounding data (Figure 7d) were lower than 300 m, which is one of the main reasons for the large difference in the nighttime PBLHs between lidars and radiosonde.

5. Conclusions

PBLHs were determined from ground-based SNU lidar and CALIOP measurements for comparison using the WCT method. Due to the fact that the SNU lidar was very close (within 10 km) to the CALIPSO ground track for both day and night, measurements from both the lidars provided a great opportunity to assess the performance of CALIOP in detecting PBLH. A total of 540 collocated data pairs were obtained for 14 years from 2006 to 2019, and 203 of them were selected for comparison after eliminating cases with clouds and total attenuated signals. The main findings of this study are as follows.
  • PBLH derived from CALIOP tended to be higher than that derived from ground-based lidar when using the WCT method. As a down-looking space-borne lidar system, CALIOP is more likely to determine elevated layer as PBL compared with a ground-based, up-looking lidar. Even if both the instruments detected the same aerosol layer as PBL, the PBLH estimated from CALIOP was frequently higher than the PBLH determined from the ground-based lidar, owing to signal attenuation within the aerosol layer under optically thick aerosol layer conditions.
  • The difference in PBLHs between CALIOP and ground-based lidar increased as the SNR for CALIOP TAB profile decreased. The difference also increased as AOD increased. It is noted that the mean PBLHs were always higher for CALIOP than the ground-based lidar as the difference increased.
  • The higher PBLH for CALIOP was mainly attributed to multiple aerosol layers, meaning that CALIOP determined elevated aerosol layers as PBL more frequently compared with the ground-based lidar. After eliminating multiple aerosol layer cases, the mean difference decreased from 0.22 (0.33) km to 0.09 (0.25) km and the correlation coefficient increased from 0.42 (0.39) to 0.81 (0.51) for daytime (nighttime).
  • Comparison with sounding data showed a reasonable agreement for daytime. For nighttime, however, the frequency distribution clearly showed that PBLHs estimated from the SNU lidar and CALIOP tended to be higher than those derived from the sounding data.
The results from this study suggest that the CLIOP-derived PBLHs are reliable compared with ground-based lidar and radiosonde data. However, multiple (elevated) aerosol layer cases may frequently induce biased highs for CALIOP-derived PBLHs and should be considered. Further studies would be needed for nighttime PBLHs, which show relatively larger differences between lidars and radiosondes. A difference in PBLH induced by difference approaches of lidar (aerosol layer based) and radiosonde (thermally derived) could be investigated further, especially for the stable boundary layer during nighttime.

Author Contributions

Conceptualization, S.-W.K.; methodology, M.-H.K., H.Y., S.P., and D.-H.P.; formal analysis, M.-H.K., H.Y., S.P., and D.-H.P.; investigation, M.-H.K., H.Y., S.P., and D.-H.P.; data curation, A.O., T.N., and A.S.; writing—original draft preparation, M.-H.K.; writing—review and editing, A.O., T.N., and A.S.; supervision, S.-W.K. All authors have read and agreed to the published version of the manuscript.

Funding

This research was funded by the Korea Meteorological Administration Research and Development Program under Grant KMI2018-05010, by the National Research Foundation of Korea (NRF) grant funded by the Korea government (MSIT) (Grant No. 2020R1C1C1012280), and by the Environment Research and Technology Development Fund (JPMEERF20155002/JPMEERF20205001) of the Environmental Restoration and Conservation Agency of Japan.

Data Availability Statement

The CALIOP data were obtained from the NASA Langley Atmospheric Science Data Center (https://asdc.larc.nasa.gov/project/CALIPSO; accessed date: 14 January 2020).

Conflicts of Interest

The authors declare no conflict of interest.

References

  1. Stull, R.B. An Introduction to Boundary Layer Meteorology, 1st ed.; Springer Science & Business Media: Berlin, Germany, 2012; Volume 13. [Google Scholar]
  2. Cuchiara, G.; Li, X.; Carvalho, J.; Rappenglück, B. Intercomparison of planetary boundary layer parameterization and its impacts on surface ozone concentration in the WRF/Chem model for a case study in Houston/Texas. Atmos. Environ. 2014, 96, 175–185. [Google Scholar] [CrossRef]
  3. Li, Z.; Guo, J.; Ding, A.; Liao, H.; Liu, J.; Sun, Y.; Wang, T.; Xue, H.; Zhang, H.; Zhu, B. Aerosol and boundary-layer interactions and impact on air quality. Natl. Sci. Rev. 2017, 4, 810–833. [Google Scholar] [CrossRef]
  4. Oak, Y.J.; Park, R.J.; Schroeder, J.R.; Crawford, J.H.; Blake, D.R.; Weinheimer, A.J.; Woo, J.-H.; Kim, S.-W.; Yeo, H.; Fried, A.; et al. Evaluation of simulated O3 production efficiency during the KORUS-AQ campaign: Implications for anthropogenic NOx emissions in Korea. Elem. Sci. Anthr. 2019, 7, 56. [Google Scholar] [CrossRef]
  5. Lee, K.; Yu, J.; Lee, S.; Park, M.; Hong, H.; Park, S.Y.; Choi, M.; Kim, J.; Kim, Y.; Woo, J.-H.; et al. Development of Korean air quality prediction system version 1 (KAQPS v1) with focuses on practical issues. Geosci. Model. Dev. 2020, 13, 1055–1073. [Google Scholar] [CrossRef] [Green Version]
  6. Tucker, S.C.; Senff, C.J.; Weickmann, A.M.; Brewer, W.A.; Banta, R.M.; Sandberg, S.P.; Law, D.C.; Hardesty, R.M. Doppler lidar estimation of mixing height using turbulence, shear, and aerosol profiles. J. Atmos. Ocean. Technol. 2009, 26, 673–688. [Google Scholar] [CrossRef]
  7. Yang, D.; Li, C.; Lau, A.K.-H.; Li, Y. Long-term measurement of daytime atmospheric mixing layer height over Hong Kong. J. Geophys. Res. Atmos. 2013, 118, 2422–2433. [Google Scholar] [CrossRef]
  8. Liu, B.; Ma, Y.; Gong, W.; Jian, Y.; Ming, Z. Two-wavelength Lidar inversion algorithm for determining planetary boundary layer height. J. Quant. Spectrosc. Radiat. Transf. 2018, 206, 117–124. [Google Scholar] [CrossRef]
  9. Chu, Y.; Li, J.; Li, C.; Tan, W.; Su, T.; Li, J. Seasonal and diurnal variability of planetary boundary layer height in Beijing: Inter-comparison between MPL and WRF results. Atmos. Res. 2019, 227, 1–13. [Google Scholar] [CrossRef]
  10. Park, D.-H.; Kim, S.-W.; Kim, M.-H.; Yeo, H.; Park, S.S.; Nishizawa, T.; Shimizu, A.; Kim, C.-H. Impacts of local versus long-range transported aerosols on PM10 concentrations in Seoul, Korea: An estimate based on 11-year PM10 and lidar observations. Sci. Total. Environ. 2021, 750, 141739. [Google Scholar] [CrossRef]
  11. Jordan, N.S.; Hoff, R.M.; Bacmeister, J.T. Validation of Goddard Earth Observing System-version 5 MERRA planetary boundary layer heights using CALIPSO. J. Geophys. Res. Space Phys. 2010, 115, 9–12. [Google Scholar] [CrossRef] [Green Version]
  12. McGrath-Spangler, E.L.; Denning, A.S. Global seasonal variations of midday planetary boundary layer depth from CALIPSO space-borne LIDAR. J. Geophys. Res. Atmos. 2013, 118, 1226–1233. [Google Scholar] [CrossRef]
  13. Zhu, Z.; Zhang, M.; Huang, Y.; Zhu, B.; Han, G.; Zhang, T.; Liu, B. Characteristics of the planetary boundary layer above Wuhan, China based on CALIPSO. Atmos. Res. 2018, 214, 204–212. [Google Scholar] [CrossRef]
  14. McGrath-Spangler, E.L.; Denning, A.S. Estimates of North American summertime planetary boundary layer depths derived from space-borne lidar. J. Geophys. Res. Space Phys. 2012, 117, 15101. [Google Scholar] [CrossRef] [Green Version]
  15. Leventidou, E.; Zanis, P.; Balis, D.; Giannakaki, E.; Pytharoulis, I.; Amiridis, V. Factors affecting the comparisons of planetary boundary layer height retrievals from CALIPSO, ECMWF and radiosondes over Thessaloniki, Greece. Atmos. Environ. 2013, 74, 360–366. [Google Scholar] [CrossRef]
  16. Wu, Y.; Gan, C.-M.; Cordero, L.; Gross, B.; Moshary, F.; Ahmed, S. PBL-height derivation from the CALIOP/CALIPSO and comparing with the radiosonde and ground-based lidar measurements. In Lidar Technologies, Techniques, and Measurements for Atmospheric Remote Sensing; SPIE Press: Bellingham, WA, USA, 2010; Volume 7832, p. 78320C. [Google Scholar]
  17. Liu, J.; Huang, J.; Chen, B.; Zhou, T.; Yan, H.; Jin, H.; Huang, Z.; Zhang, B. Comparisons of PBL heights derived from CALIPSO and ECMWF reanalysis data over China. J. Quant. Spectrosc. Radiat. Transf. 2015, 153, 102–112. [Google Scholar] [CrossRef]
  18. Zhang, W.; Guo, J.; Miao, Y.; Liu, H.; Zhang, Y.; Li, Z.; Zhai, P. Planetary boundary layer height from CALIOP compared to radiosonde over China. Atmos. Chem. Phys. 2016, 16, 9951–9963. [Google Scholar] [CrossRef] [Green Version]
  19. Su, T.; Li, J.; Li, C.; Xiang, P.; Lau, A.K.-H.; Guo, J.; Yang, D.; Miao, Y. An intercomparison of long-term planetary boundary layer heights retrieved from CALIPSO, ground-based lidar, and radiosonde measurements over Hong Kong. J. Geophys. Res. Atmos. 2017, 122, 3929–3943. [Google Scholar] [CrossRef]
  20. Kim, S.-W.; Berthier, S.; Raut, J.-C.; Chazette, P.; Dulac, F.; Yoon, S.-C. Validation of aerosol and cloud layer structures from the space-borne lidar CALIOP using a ground-based lidar in Seoul, Korea. Atmos. Chem. Phys. Discuss. 2008, 8, 3705–3720. [Google Scholar] [CrossRef] [Green Version]
  21. Kim, S.-W.; Chung, E.-S.; Yoon, S.-C.; Sohn, B.-J.; Sugimoto, N. Intercomparisons of cloud-top and cloud-base heights from ground-based Lidar, CloudSat and CALIPSO measurements. Int. J. Remote Sens. 2011, 32, 1179–1197. [Google Scholar] [CrossRef]
  22. Winker, D.M.; Pelon, J.; Coakley, J.A., Jr.; Ackerman, S.A.; Charlson, R.J.; Colarco, P.R.; Flamant, P.; Fu, Q.; Hoff, R.M.; Kittaka, C.; et al. The CALIPSO mission: A global 3D view of aerosols and clouds. Bull. Am. Meteorol. Soc. 2010, 91, 1211–1229. [Google Scholar] [CrossRef]
  23. Getzewich, B.J.; Vaughan, M.A.; Hunt, W.H.; Avery, M.A.; Powell, K.A.; Tackett, J.L.; Winker, D.M.; Kar, J.; Lee, K.-P.; Toth, T.D. CALIPSO lidar calibration at 532 nm: Version 4 daytime algorithm. Atmos. Meas. Tech. 2018, 11, 6309–6326. [Google Scholar] [CrossRef] [Green Version]
  24. Kar, J.; Vaughan, M.A.; Lee, K.-P.; Tackett, J.L.; Avery, M.A.; Garnier, A.; Getzewich, B.J.; Hunt, W.H.; Josset, D.; Liu, Z.; et al. CALIPSO lidar calibration at 532 nm: Version 4 nighttime algorithm. Atmos. Meas. Tech. 2018, 11, 1459–1479. [Google Scholar] [CrossRef] [PubMed] [Green Version]
  25. Kim, M.-H.; Omar, A.H.; Tackett, J.L.; Vaughan, M.A.; Winker, D.M.; Trepte, C.R.; Hu, Y.; Liu, Z.; Poole, L.R.; Pitts, M.C.; et al. The CALIPSO version 4 automated aerosol classification and lidar ratio selection algorithm. Atmos. Meas. Tech. 2018, 11, 6107–6135. [Google Scholar] [CrossRef] [Green Version]
  26. Kim, S.-W.; Yoon, S.-C.; Kim, J.; Kim, S.-Y. Seasonal and monthly variations of columnar aerosol optical properties over east Asia determined from multi-year MODIS, LIDAR, and AERONET Sun/sky radiometer measurements. Atmos. Environ. 2007, 41, 1634–1651. [Google Scholar] [CrossRef]
  27. Kim, S.-W.; Yoon, S.-C.; Kim, J.; Kang, J.-Y.; Sugimoto, N. Asian dust event observed in Seoul, Korea, during 29–31 May 2008: Analysis of transport and vertical distribution of dust particles from lidar and surface measurements. Sci. Total Environ. 2010, 408, 1707–1718. [Google Scholar] [CrossRef] [PubMed]
  28. Sugimoto, N.; Matsui, I.; Shimizu, A.; Nishizawa, T.; Hara, Y.; Xie, C.; Uno, I.; Yumimoto, K.; Wang, Z.; Yoon, S.-C. Lidar network observations of tropospheric aerosols. In Lidar Remote Sensing for Environmental Monitoring IX; SPIE Press: Bellingham, WA, USA, 2008; Volume 7153, p. 71530A. [Google Scholar]
  29. Shimizu, A.; Nishizawa, T.; Jin, Y.; Kim, S.-W.; Wang, Z.; Batdorj, D.; Sugimoto, N. Evolution of a lidar network for tropospheric aerosol detection in East Asia. Opt. Eng. 2016, 56, 031219. [Google Scholar] [CrossRef]
  30. Boers, R.; Eloranta, E.W.; Coulter, R.L. Lidar observations of mixed layer dynamics: Tests of parameterized entrainment models of mixed layer growth rate. J. Clim. Appl. Meteorol. 1984, 23, 247–266. [Google Scholar] [CrossRef]
  31. Nelson, E.; Stull, R.; Eloranta, E. A prognostic relationship for entrainment zone thickness. J. Appl. Meteorol. 1989, 28, 885–903. [Google Scholar] [CrossRef] [Green Version]
  32. Melfi, S.H.; Spinhirne, J.D.; Chou, S.H.; Palm, S.P. Lidar observations of vertically organized convection in the planetary boundary-layer over the ocean. J. Clim. Appl. Meteorol. 1985, 24, 806–821. [Google Scholar] [CrossRef]
  33. Endlich, R.; Ludwig, F.; Uthe, E. An automatic method for determining the mixing depth from lidar observations. Atmos. Environ. (1967) 1979, 13, 1051–1056. [Google Scholar] [CrossRef]
  34. Flamant, C.; Pelon, J.; Flamant, P.H.; Durand, P. Lidar determination of the entrainment zone thickness at the top of the unstable marine atmospheric boundary layer. Bound.-Layer Meteorol. 1997, 83, 247–284. [Google Scholar] [CrossRef]
  35. Hayden, K.L.; Anlauf, K.G.; Hoff, R.M.; Strapp, J.W.; Bottenheim, J.W.; Wiebe, H.A.; Froude, F.A.; Martin, J.B.; Steyn, D.G.; McKendry, I.G. The vertical chemical and meteorological structure of the boundary layer in the Lower Fraser Valley during Pacific ’93. Atmos. Environ. 1997, 31, 2089–2105. [Google Scholar] [CrossRef]
  36. He, Q.; Mao, J.; Chen, J.; Hu, Y. Observational and modeling studies of urban atmospheric boundary-layer height and its evolution mechanisms. Atmos. Environ. 2006, 40, 1064–1077. [Google Scholar] [CrossRef]
  37. Menut, L.; Flamant, C.; Pelon, J.; Flamant, P.H. Urban boundary-layer height determination from lidar measurements over the Paris area. Appl. Opt. 1999, 38, 945–954. [Google Scholar] [CrossRef]
  38. Martucci, G.; Matthey, R.; Mitev, V.; Richner, H. Comparison between backscatter lidar and radiosonde measurements of the diurnal and nocturnal stratification in the lower troposphere. J. Atmos. Ocean. Technol. 2007, 24, 1231–1244. [Google Scholar] [CrossRef] [Green Version]
  39. Summa, D.; Di Girolamo, P.; Stelitano, D.; Cacciani, M. Characterization of the planetary boundary layer height and structure by Raman lidar: Comparison of different approaches. Atmos. Meas. Tech. 2013, 6, 3515–3525. [Google Scholar] [CrossRef] [Green Version]
  40. Steyn, D.G.; Baldi, M.; Hoff, R.M. The detection of mixed layer depth and entrainment zone thickness from lidar backscatter profiles. J. Atmos. Ocean. Technol. 1999, 16, 953–959. [Google Scholar] [CrossRef]
  41. Hägeli, P.; Steyn, D.G.; Strawbridge, K.B. Spatial and temporal variability of mixed-layer depth and entrainment zone thickness. Bound.-Layer Meteorol. 2000, 97, 47–71. [Google Scholar] [CrossRef]
  42. Eresmaa, N.; Karppinen, A.; Joffre, S.M.; Räsänen, J.; Talvitie, H. Mixing height determination by ceilometer. Atmos. Chem. Phys. Discuss. 2006, 6, 1485–1493. [Google Scholar] [CrossRef] [Green Version]
  43. Sawyer, V.; Li, Z. Detection, variations and intercomparison of the planetary boundary layer depth from radiosonde, lidar and infrared spectrometer. Atmos. Environ. 2013, 79, 518–528. [Google Scholar] [CrossRef]
  44. Hooper, W.P.; Eloranta, E.W. Lidar measurements of wind in the planetary boundary layer: The method, accuracy and results from joint measurements with radiosonde and kytoon. J. Clim. Appl. Meteorol. 1986, 25, 990–1001. [Google Scholar] [CrossRef] [Green Version]
  45. Cohn, S.A.; Angevine, W.M. Boundary layer height and entrainment zone thickness measured by lidars and wind-profiling radars. J. Appl. Meteorol. 2000, 39, 1233–1247. [Google Scholar] [CrossRef]
  46. Davis, K.J.; Gamage, N.; Hagelberg, C.R.; Kiemle, C.; Lenschow, D.H.; Sullivan, P.P. An objective method for deriving atmospheric structure from airborne lidar observations. J. Atmos. Ocean. Technol. 2000, 17, 1455–1468. [Google Scholar] [CrossRef] [Green Version]
  47. Brooks, I.M. Finding boundary layer top: Application of a wavelet covariance transform to lidar backscatter profiles. J. Atmos. Ocean. Technol. 2003, 20, 1092–1105. [Google Scholar] [CrossRef] [Green Version]
  48. Lewis, J.R.; Welton, E.J.; Molod, A.M.; Joseph, E. Improved boundary layer depth retrievals from MPLNET. J. Geophys. Res. Atmos. 2013, 118, 9870–9879. [Google Scholar] [CrossRef]
  49. Nakoudi, K.; Giannakaki, E.; Dandou, A.; Tombrou, M.; Komppula, M. Planetary boundary layer height by means of lidar and numerical simulations over New Delhi, India. Atmos. Meas. Tech. 2019, 12, 2595–2610. [Google Scholar] [CrossRef] [Green Version]
  50. Lou, M.; Guo, J.; Wang, L.; Xu, H.; Chen, D.; Miao, Y.; Lv, Y.; Li, Y.; Guo, X.; Ma, S.; et al. On the relationship between aerosol and boundary layer height in summer in china under different thermodynamic conditions. Earth Space Sci. 2019, 6, 887–901. [Google Scholar] [CrossRef] [Green Version]
  51. Gamage, N.; Hagelberg, C. Detection and analysis of microfronts and associated coherent events using localized transforms. J. Atmos. Sci. 1993, 50, 750–756. [Google Scholar] [CrossRef] [Green Version]
  52. Su, T.; Li, Z.; Kahn, R. A new method to retrieve the diurnal variability of planetary boundary layer height from lidar under different thermodynamic stability conditions. Remote Sens. Environ. 2020, 237, 111519. [Google Scholar] [CrossRef]
  53. Milroy, C.; Martucci, G.; Lolli, S.; Loaec, S.; Sauvage, L.; Xueref-Rémy, I.; Lavric, J.V.; Ciais, P.; Feist, D.; Biavati, G.; et al. An assessment of pseudo-operational ground-based light detection and ranging sensors to determine the boundary-layer structure in the coastal atmosphere. Adv. Meteorol. 2012, 2012, 1–18. [Google Scholar] [CrossRef] [Green Version]
  54. Wang, W.; Gong, W.; Mao, F.; Pan, Z. an improved iterative fitting method to estimate nocturnal residual layer height. Atmosphere 2016, 7, 106. [Google Scholar] [CrossRef] [Green Version]
  55. Dang, R.; Yang, Y.; Li, H.; Hu, X.-M.; Wang, Z.; Huang, Z.; Zhou, T.; Zhang, T. Atmosphere Boundary Layer Height (ABLH) determination under multiple-layer conditions using micro-pulse lidar. Remote Sens. 2019, 11, 263. [Google Scholar] [CrossRef] [Green Version]
  56. Zhong, T.; Wang, N.; Shen, X.; Xiao, D.; Xiang, Z.; Liu, D. Determination of planetary boundary layer height with lidar signals using maximum limited height initialization and range restriction (MLHI-RR). Remote Sens. 2020, 12, 2272. [Google Scholar] [CrossRef]
  57. Kim, Y.; Kim, S.-W.; Kim, M.-H.; Yoon, S.-C. Geometric and optical properties of cirrus clouds inferred from three-year ground-based lidar and CALIOP measurements over Seoul, Korea. Atmos. Res. 2014, 139, 27–35. [Google Scholar] [CrossRef]
  58. Seidel, D.J.; Ao, C.O.; Li, K. Estimating climatological planetary boundary layer heights from radiosonde observations: Comparison of methods and uncertainty analysis. J. Geophys. Res. Space Phys. 2010, 115, 16113. [Google Scholar] [CrossRef] [Green Version]
  59. Liu, S.; Liang, X.-Z. Observed diurnal cycle climatology of planetary boundary layer height. J. Clim. 2010, 23, 5790–5809. [Google Scholar] [CrossRef]
  60. Poulos, G.S.; Blumen, W.; Fritts, D.C.; Lundquist, J.K.; Sun, J.; Burns, S.P.; Nappo, C.; Banta, R.; Newsom, R.; Cuxart, J.; et al. CASES-99: A comprehensive investigation of the stable nocturnal boundary layer. Bull. Am. Meteorol. Soc. 2000, 83, 555–582. [Google Scholar] [CrossRef]
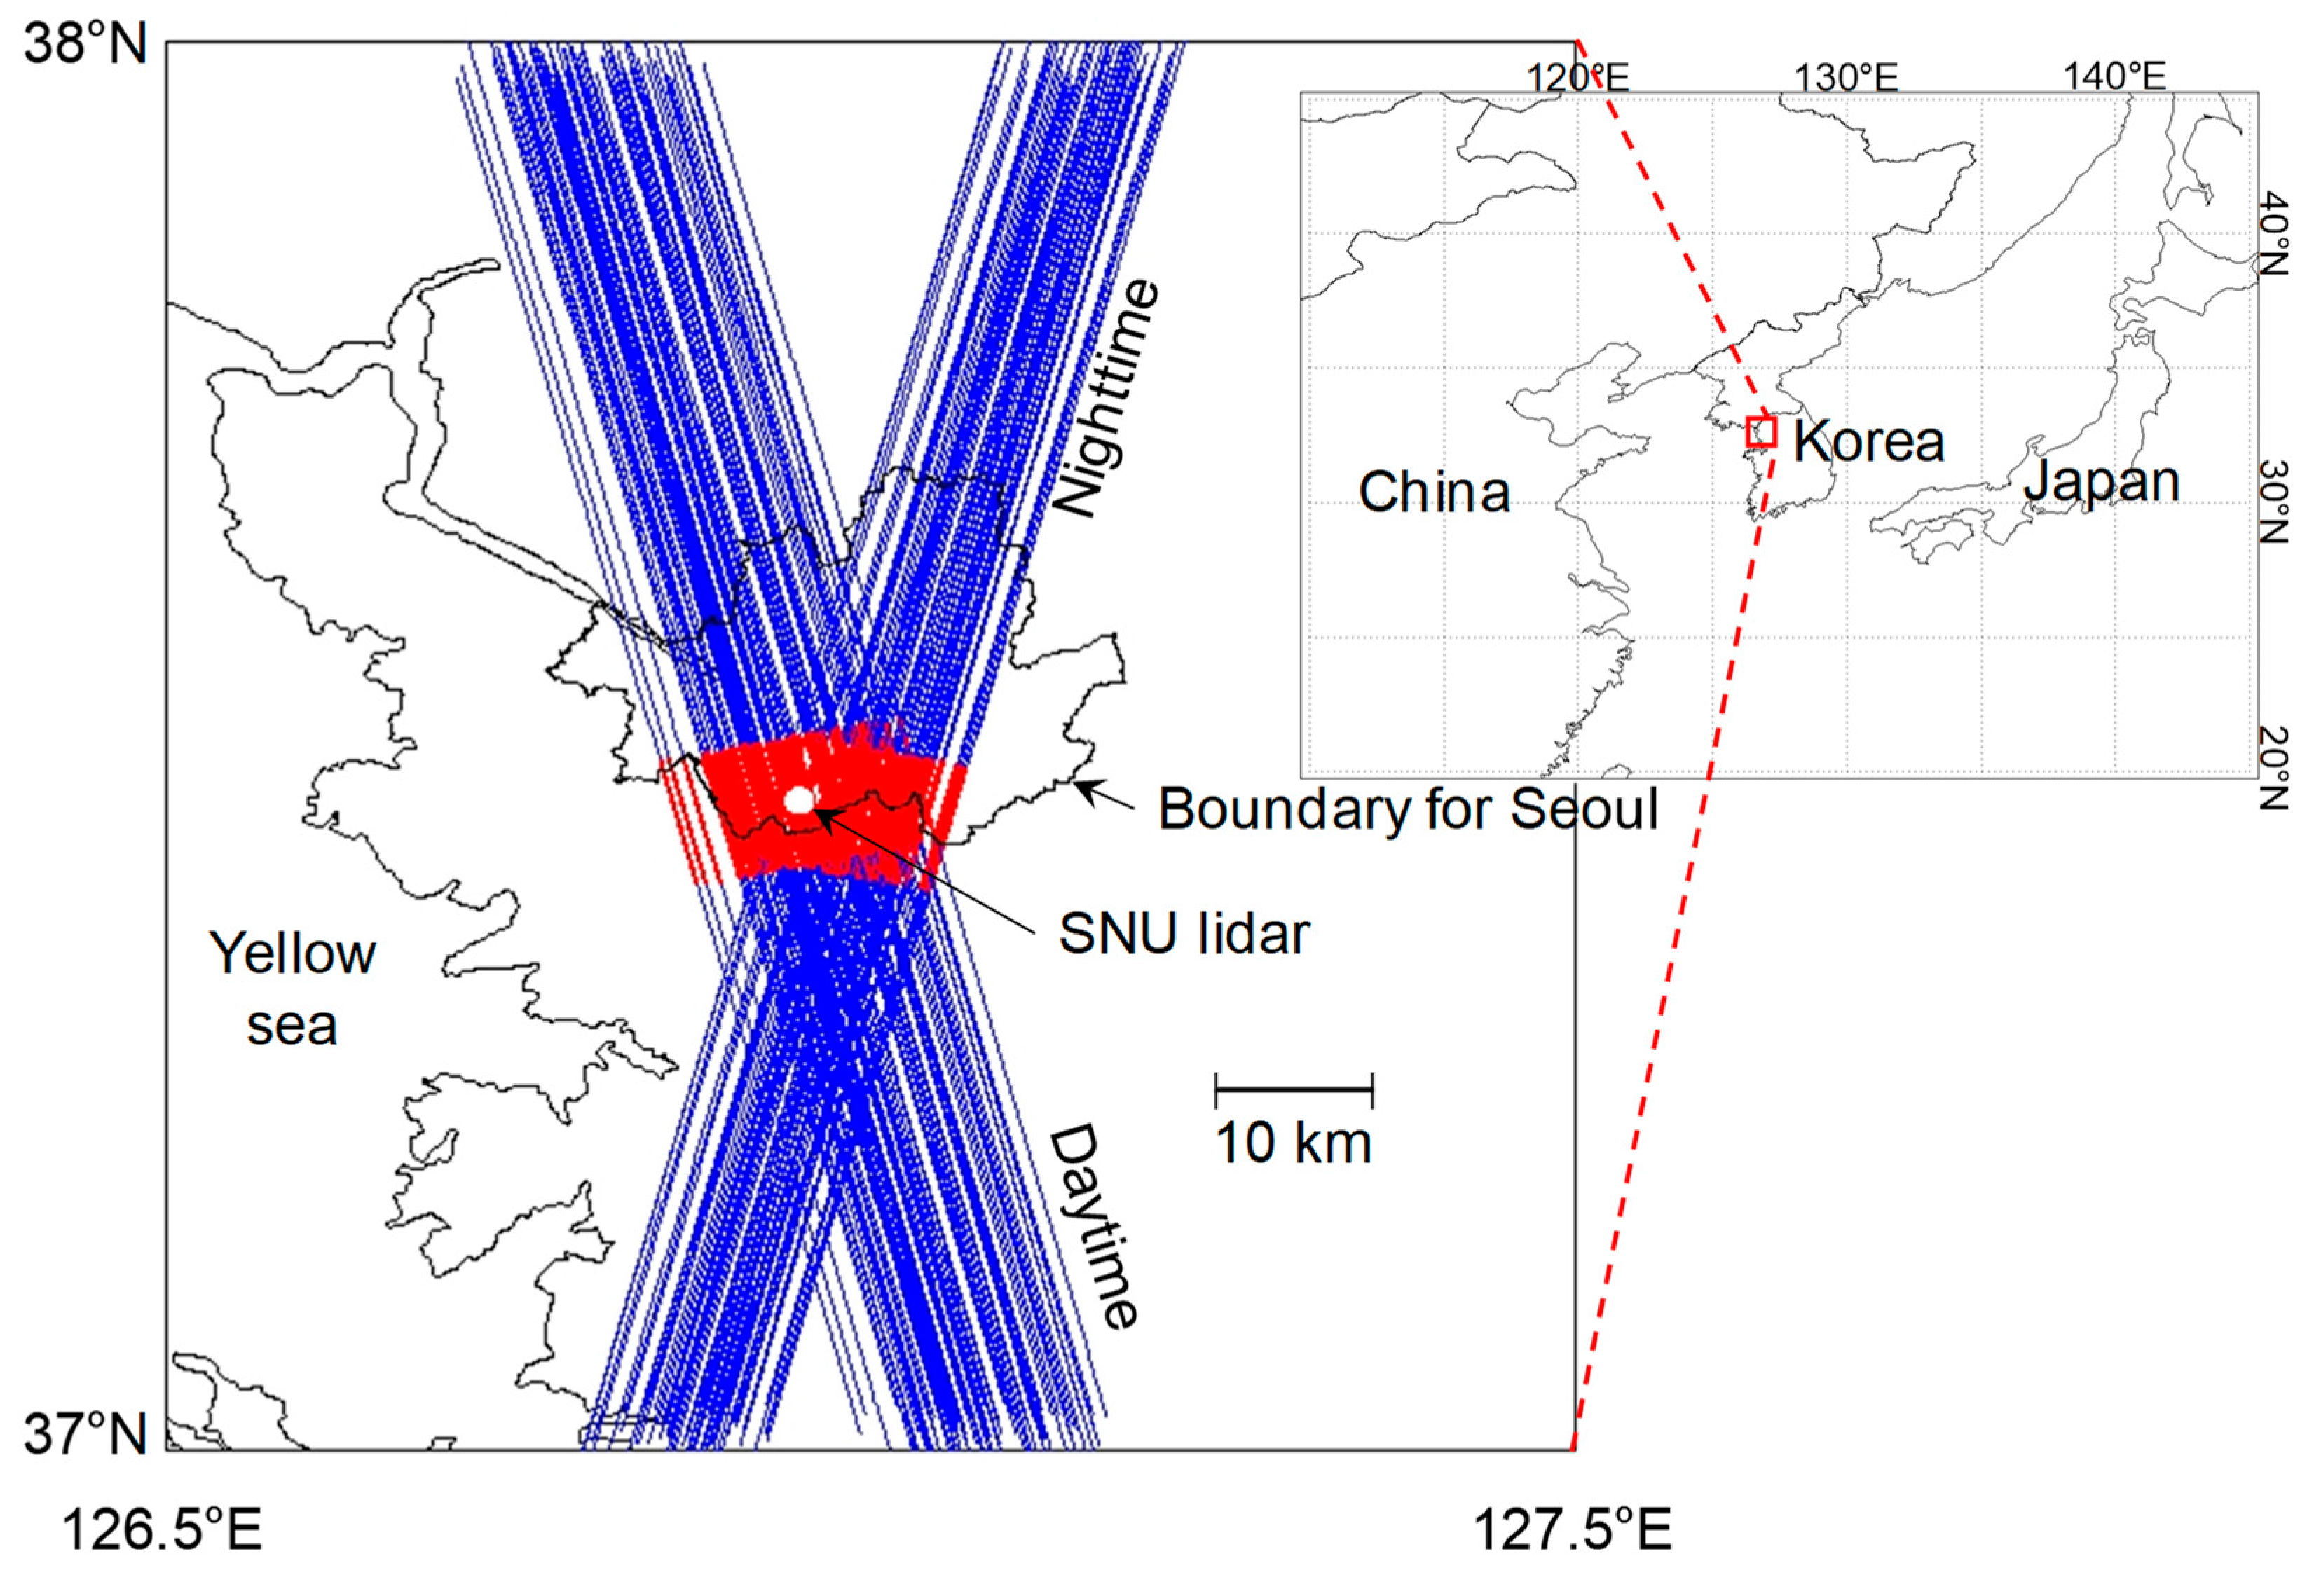
Figure 1. Locations of ground-based Seoul National University (SNU) lidar site (white dot) and all Cloud-Aerosol Lidar and Infrared Pathfinder Satellite Observation (CALIPSO) ground tracks (blue solid lines) used in this study. The upper right to lower left lines represent nighttime CALIPSO tracks and the lower right to upper left ones depict daytime tracks. The red-colored sections (10 km) indicate the Cloud-Aerosol Lidar with Orthogonal Polarization (CALIOP) profiles averaged for planetary boundary layer height (PBLH) determination.
Remotesensing 13 01496 g001
Figure 2. Scatter plots of PBLHs determined from collocated data pairs from the SNU lidar and CALIOP from 2006 to 2019 for (a) daytime and (b) nighttime. Correlation coefficient (R), mean difference (MD), and root mean square difference (RMSD) are shown together.
Remotesensing 13 01496 g002
Figure 3. Time–height plots of total attenuated backscatter (TAB) for the (a) SNU lidar and (b) CALIOP at 04:51 UTC (13:51 KST), 12 November 2013. White X marks are determined PBLH, and red boxes indicate the collocated profiles used for the comparison. The black solid line in (b) indicates surface elevation. The vertical profiles of normalized TAB and wavelet function (Wf) for the collocated profiles are shown in (c,d), respectively. The blue solid lines are for the SNU lidar and red dashed ones are for CALIOP.
Remotesensing 13 01496 g003
Figure 4. Same as Figure 3, excepting at 17:42 UTC, 24 (02:42 KST, 25) February 2014. Time–height plots of TAB for the (a) SNU lidar and (b) CALIOP, and the vertical profiles of (c) normalized TAB and (d) wavelet function (Wf) for the collocated profiles.
Remotesensing 13 01496 g004
Figure 5. PBLH difference (PBLH_CAL minus PBLH_SNU) depending on (a) the SNR of CALIOP TAB for PBL and (b) column aerosol optical depth (AOD) from the CALIOP level 2 aerosol product. The error bars indicate the standard deviation.
Remotesensing 13 01496 g005
Figure 6. Same as Figure 2 for (a) daytime and (b) nighttime, except for the “single aerosol layer” cases.
Remotesensing 13 01496 g006
Figure 7. Frequency distribution of PBLH determined from (a,d) sounding data at Osan, (b,e) SNU lidar, and (c,f) CALIOP for daytime (left) and nighttime (right). Only “single aerosol layer” cases are used for ground-based SNU lidar and CALIOP, as shown in Figure 6.
Remotesensing 13 01496 g007
Publisher’s Note: MDPI stays neutral with regard to jurisdictional claims in published maps and institutional affiliations.