Abstract
The Tibetan Plateau (TP) has profound thermal and dynamic influences on the atmospheric circulation, energy, and water cycles of the climate system, which make the clouds over the TP the forefront of atmospheric and climate science. However, the highest altitude and most complex terrain of the TP make the retrieval of cloud properties challenging. In order to understand the performance and limitations of cloud retrievals over the TP derived from the state-of-the-art Advanced Geosynchronous Radiation Imager (AGRI) onboard the new generation of Chinese Geostationary (GEO) meteorological satellites Fengyun-4 (FY-4), a three-month comparison was conducted between FY-4A/AGRI and the Moderate Resolution Imaging Spectroradiometer (MODIS) for both cloud detection and cloud top height (CTH) pixel-level retrievals. For cloud detection, the AGRI and MODIS cloud mask retrievals showed a fractional agreement of 0.93 for cloudy conditions and 0.73 for clear scenes. AGRI tended to miss lower CTH clouds due to the lack of thermal contrast between the clouds and the surface of the TP. For cloud top height retrievals, the comparison showed that on average, AGRI underestimated the CTH relative to MODIS by 1.366 ± 2.235 km, and their differences presented a trend of increasing with height.
1. Introduction
Clouds cover about 60~70% of the globe [1,2] and exert an enormous influence on weather and climate [3]. They are the prerequisite for precipitation, which are the intermediate stage between water vapor and precipitation. All moist processes in the atmosphere ultimately involve clouds, which play an important role in Earth’s water cycle [4,5]. In addition, because clouds interact so strongly with sunlight and infrared radiation, they will bring significant climate feedback. As a result, clouds play an extremely critical role in regulating the radiation budget of the Earth–atmosphere system. It can be said that clouds dominate the energy budget of the Earth. [3]. Although clouds play a fundamental role in our weather and climate, there is much that we do not know. An inadequate way of representing cloud processes has long been identified as a main source of uncertainty in climate projections [6]. To predict changes in weather and climate brings the subject of clouds back to the forefront of atmospheric science and climate science [5].
The Tibetan Plateau (TP) exerts profound impacts on the continental to global-scale climate [7,8,9], and therefore, the bulk characteristics of clouds over the TP are important for studying cloud-climate feedback and their impacts on climate change and its dynamics [10,11]. As the highest and largest plateau on Earth with a mean altitude of more than 4000 m, the TP has profound thermal and dynamic influences on the atmospheric circulation, energy, and water cycles of the climate system. It is well known to regulate the Asian monsoon and the middle Asia dry climate by acting as a vast elevated heat source and a huge natural barrier [12,13,14,15,16,17]. These factors make the cloud regimes over the Tibetan Plateau a link between the subsystems of regional weather and global climate. The diurnal variation of summer clouds over the TP not only has a great influence on local convection and precipitation processes, but is also closely related to floods in the Yangtze River Basin of China, the Asian summer monsoon, and the large scale climate regime in the Northern Hemisphere [13,16,18].
Due to the harsh natural condition of the Tibetan Plateau, few ground-based remote sensing or in situ aircraft observations of clouds have been carried out. Since the beginning of the satellite meteorology era, especially the advent of China’s Fengyun-2, Fengyun-3 series satellites, Moderate Resolution Imaging Spectroradiometer (MODIS) onboard Terra satellite, and the A-Train constellation, the ability to observe clouds over the TP has been greatly developed. In addition, the earliest satellite dataset, the International Satellite Cloud Climatology Project (ISCCP) products, also provide important information of the clouds over the TP [11]. The A-Train constellation, integrating passive remote sensors such as MODIS onboard an Aqua satellite with active remote sensors including Cloudsat and Cloud–Aerosol lidar and Infrared Pathfinder Satellite Observations (CALIPSO) provides us with a much more refined picture of clouds. The A-train satellite constellation, which has been in operation for more than ten years, is a successful way to observe clouds from multiple perspectives [19]. In recent years, many unique features and the role of clouds over the TP have been revealed from satellite observations, most of which are based on the measurements of MODIS/Terra, MODIS/Aqua, and Cloudsat/CALIPSO [10,11,20,21,22]. However, the Terra, Aqua, Cloudsat, and CALIPSO satellites are sun-synchronous satellites with low temporal resolution. They can only cross twice a day over the same area, which prohibits them from capturing the diurnal variations of clouds that vary greatly both spatially and temporally, especially in summer [23,24].
A sufficiently high temporal resolution is required to study the diurnal changes of the clouds that seriously affect the energy budget of the Earth [23,25,26,27]. In terms of temporal resolution, satellites in geostationary (GEO) orbit have an unquestionable advantage. They can continuously observe the same area, and this is undoubtedly extremely valuable for studying and monitoring clouds and their daily cycle. Fengyun-4 (FY-4) introduced a new generation of Chinese GEO meteorological satellites, with the first FY-4A launched in December 2016. The satellite’s highly improved Advanced Geosynchronous Radiation Imager (AGRI) has capabilities comparable to those of state-of-the-art imagers onboard the new generation GEO meteorological satellites such as Advanced Baseline Imager (ABI) on board the U.S. GEO Operational Environmental Satellite (GOES-R) [28] and Japan’s Advanced Himawari Imager (AHI) on board Himawari-8 [29]. Combining much higher radiation, spectrum, and spatial resolution with shortened revisit time than its predecessor, FY-4A/AGRI can provide a new level of ability to identify and track rapidly changing weather phenomena and derive quantitative products [30,31].
FY-4 will become an important component of the space-based Global Observing System (GOS) [32]. To promote better applications and popularization of FY-4 series GEO satellite data, the Fengyun GEO Algorithm Testbed (FYGAT) was developed by scientists in the FY-4 Algorithm Working Group (AWG) of the National Satellite Meteorological Center of the China Meteorological Administration (NSMC/CMA). FYGAT is a near real-time processing system that can process four types of GEO imaging sensor data including FY-4A/AGRI, Himawari-8/AHI, Meteosat Second Generation/Spinning Enhanced Visible and Infrared Imager (MSG/SEVIRI), and FY-2/Visible Infrared Spin Scan Radiometer (VISSR) for weather and climate research and applications [30,31]. This system has the ability to produce a variety of operational quantitative products including pixel-level cloud products such as cloud mask and cloud top height. These cloud products are not only critical for weather services and nowcasting applications, but are also used in the retrieval of other key products such as “clear sky radiation (CSR)” and “atmospheric motion vector (AMV)” for numerical weather forecasting. In addition to severe weather monitoring, forecasting, and NWP services [30], these science products generated by FYGAT are also used in the research of cloud climatology and cloud and precipitation microphysics [33,34].
Both weather forecast and climatology research require an understanding of the uncertainties of cloud records [35]. In order to recognize the uncertainties and limitations of the AHI, AGRI, and their cloud products based on the FYGAT algorithm in different geographical contexts, comparison and verification studies are needed. Some quantitative evaluations have been conducted. Wang et al. [31] employed MODIS as the benchmark for AGRI and AHI cloud mask validation during the 21-day period. Their results suggest that they had high consistency, and cloudy scene identification was better than that observed for clear skies for both AGRI and AHI. Lai et al. [36] compared the cloud properties from AGRI with MODIS cloud retrievals from four months. Their comparison indicates that the cloud mask and cloud phase of these two instruments were consistent, while clear differences were noticed for cloud optical thickness and cloud effective radius results. Min et al. [37] used CALIPSO to verify the AHI cloud top height for one year. Their results indicated that samples with cloud top height higher than 12.0 km were significantly underestimated, while the average underestimation of high layer clouds was about 5 km. Wang et al. [38] compared the AGRI cloud fraction and cloud top pressure products with MODIS over East Asia for a month. The results showed that the two products from AGRI and MODIS generally agreed well. From these verifications, it can be seen that cloud products based on the FYGAT algorithm generally had good performance, and were consistent with the cloud products retrieved from MODIS and CALIPSO.
Although these comparisons have provided important overall insight, they have been limited by the lack of specific evaluation of the cloud products’ performance in the TP region. Holz et al. [35] pointed out that the difficulty in characterizing cloud observation uncertainties is compounded by their strong regional dependence. The Tibetan Plateau has the highest altitude and most complex terrain in the world [18], which will make cloud retrieval more challenging, resulting in the overall evaluation results of these cloud products not applicable to TP regions.
In addition, considering the influence of observation geometry, FY-4/AGRI, located at 104.7°E, with the capability of providing a complete image of the TP, has an advantage over Himawari/AHI, located at 140.7°E, in observing the TP and clouds above it. The Himawari/AHI viewing zenith angle (VZA) of the pixels on the eastern flank of the TP reaches over 50°, and a large area in the western part of the TP is beyond its scanning range. Consequently, the cloud properties obtained from FY-4A/AGRI are very valuable for the observation and study of clouds in this area. So far, the performance of pixel-level cloud properties derived from FY-4A/AGRI over the TP has not been evaluated.
Therefore, it is necessary to verify and understand the performance and limitations of AGRI cloud products over the TP based on the FYGAT algorithm to ensure the correct interpretation of the existing and future cloud datasets obtained from the measurements of the FY-4 series GEO satellite. In this context, we investigated the performance of the AGRI cloud mask and cloud-top height over the TP by comparing it with the coincident cloud retrievals of MODIS. In this paper, an accurate and computationally efficient collocation process was developed to facilitate direct comparisons of the AGRI and MODIS level-2 cloud retrievals. We also discuss the impacts of the TP’s complex topography on the comparison results.
The rest of this paper is organized as follows. A description of the AGRI and MODIS cloud retrievals is provided in Section 2. The collocation methodology and algorithm developed for comparison is described in Section 3, followed by a comparison method. The results of three months of the TP collocated AGRI and MODIS quantitative comparisons of cloud mask and cloud top height are presented in Section 4. A discussion about the cloud retrievals’ performance distribution and the impacts of the TP’s complex topography on the comparison results is given in Section 5. Conclusions are then presented in Section 6.
2. Moderate Resolution Imaging (MODIS) and Advanced Geosynchronous Radiation Imager (AGRI) Measurements
The primary objective of this study was to assess the performances of cloud retrieval over the TP region from AGRI flown on the FY-4A platform. We compared three months (from 1 June to 31 August 2020) of collocated AGRI and MODIS pixel-level cloud mask (CM) and cloud top height (CTH) products over the area, 25°N~45°N, 70°E~105°E, following the definition of the TP region by Sato et al. [39]. Due to significant differences in the spatial and temporal sampling between AGRI and MODIS, it is necessary to collocate cloud products from these two instruments. Therefore, a collocation algorithm was designed to be computationally efficient and accurate, allowing for rapid identification of the coincident MODIS and AGRI observations.
Cloud mask and cloud top height are crucially important and fundamental cloud products. Identifying cloud pixels from background environment, known as cloud detection or cloud mask, is fundamental and critical for optical remote sensing and for subsequent accurate image analysis [31,40,41]. Generally, the cloud mask algorithm lies at the top of the data processing chain and must be versatile enough to satisfy the needs of many applications [42]. Regardless of how sophisticated the new remote sensors and their applications become, cloud mask is usually the first processing step required [43].
Cloud top height is made available to all subsequent algorithms that require knowledge of the vertical extent of the clouds. It plays a critical role in determining the cloud cover, cloud layers [44], cloud classification [4,19,45], and cloud thermodynamic phase determination [46]. The broadband radiative impact of clouds is largely determined by their height [39]. In addition, as a critical parameter, CTH products are assimilated into numerical weather prediction (NWP) models [47,48].
First, AGRI and MODIS instruments and their respective level-2 CM and CTH retrieval algorithms are presented.
2.1. Moderate Resolution Imaging (MODIS)
Since the National Aeronautics and Space Administration (NASA) launched the “Terra” satellite in 1999 and the “Aqua” satellite in 2002, MODIS has become a keystone instrument and one of the most widely used satellite remote sensing platforms in the Earth Observing System (EOS) [46,49]. MODIS measures reflected solar and emitted thermal radiation in 36 spectral channels ranging from the visible (VIS) to the infrared (IR), with a spatial resolution of 250 m (two bands), 500 m (five bands), and 1000 m (29 bands). These channels, essentially covering all of the key atmospheric bands located between 0.415 and 14.235 µm, have been carefully selected to enable advanced studies of land, ocean, and atmospheric features, which provides unique spectral and spatial capabilities for retrieving cloud properties [46,50]. MODIS cloud properties’ retrieval algorithms have evolved over the past two decades [46,49,51,52,53,54]. MODIS cloud products have been validated by comparing them with active remote sensor observations and radiance simulations [35,41,53,55], and are widely used in studies of cloud macro-microphysical and optical properties [5,10,20,56,57,58,59,60]. In addition, MODIS cloud products are also used as benchmarks or truth values for the verification and evaluation of satellite cloud products and retrieval algorithms [29,31,36,61,62].
The newest MODIS reprocessing dataset of the products, Collection 6 (C6), was completed in 2014 and 2015 for Aqua and Terra, respectively. The C6 update activity has benefited greatly from being able to compare MODIS radiance data and derived products with various sensors that compose the A-Train [54]. MODIS pixel-level (level-2) cloud products are generated on a granule basis, known as MOD06 and MYD06 for Terra and Aqua, respectively. A granule consists of 5 min of data. MOD06 and MYD06 in C6 provide the cloud parameters at a 1 km spatial resolution.
When we were working on this study, the MYD06 data (from June to August 2020) downloaded from the official MODIS website were incomplete, that is, there is a large amount of MYD06 data that are missing during that time period. In addition, to avoid the uncertainty of comparison due to the differences between Terra and Aqua in this study, only cloud products of MOD06 in Collection 6 were used as the benchmark to compare and validate the level-2 cloud products of FY-4A/AGRI based on the FYGAT algorithm.
Cloud mask is based on the contrast between the cloud and background environment. Contrast can be defined by differing signals for individual spectral bands, spectral combinations, or temporal and spatial variations of these [49]. The MODIS cloud mask algorithm employs up to 19 spectral bands to maximize reliable cloud detection [35]. In fact, the Collection 6 cloud mask algorithm uses as many as 22 bands [42]. After a series of sequential tests on the passive reflected solar and infrared observations, a degree of clear-sky confidence is assigned to the result to assess the likelihood that clouds obstruct a given pixel. Then, final cloud mask confidence (Q) is based on three thresholds (i.e., 0.66, 0.95, and 0.99). Test results can classify cloud contamination in every pixel of data as either confident clear (Q > 0.99), probably clear (Q > 0.95), probably cloudy (Q > 0.66), or cloudy (Q ≤ 0.66) [49]. Based on the comparison with three years of coincident observations, an assessment of the performance of MODIS cloud mask algorithm showed that the MODIS algorithm agrees with the combined radar and lidar from ground about 85% of the time [41]. Globally, the MODIS 1-km cloud mask and the CALIOP 1-km averaged layer product agreement is 87% for cloudy conditions for both August and February; for clear-sky conditions, the agreement is 85% (86%) for August (February) [35].
MODIS cloud top pressure (CTP) is determined using five thermal infrared bands (both day and night). The 11 µm infrared window brightness temperature data are used to estimate low clouds. Mid- to high-level clouds are derived from radiance ratios of bands located within the broad 15 µm CO2 absorption region by applying the CO2 slicing technique [53]. The theoretical basis of the CO2 slicing technique is that as the wavelength increases from 13.3 to 15 µm, the atmosphere becomes more opaque due to the absorption of CO2, resulting in the radiation obtained from these spectral bands being sensitive to different layers in the atmosphere. CTP retrieval is derived from ratios of differences in radiances between cloudy and clear-sky regions at two nearby wave lengths [63]. Once the CTP is derived, it is converted to cloud-top height and temperature through gridded temperature profiles provided by the National Centers for Environmental Prediction (NCEP) Global Forecast System (GFS). Differences between model-derived and measured clear-sky radiances are mitigated with a radiance bias adjustment to select the optimal CTP. [53]. Globally, when compared to the CALIOP 1-km products, MODIS underestimates the CTH relative to CALIOP by 1.4 ± 2.9 km; when only high clouds above 5 km are considered, the differences are found to be greater than 4 km. Some differences in CTH between MODIS and CALIOP are expected since MODIS sees into the cloud to an optical thickness of approximately 1, while CALIOP senses the cloud top [35].
2.2. Advanced Geosynchronous Radiation Imager (AGRI)
AGRI is one of the most important payloads on the FY-4A GEO meteorological satellite platform. It measures radiances at 14 spectral bands covering the range of wavelengths from 0.47 to 13.5µm. These spectral band locations are very similar to those planned for other greatly improved imagers on board the new generation of GEO meteorological satellites such as AHI on Himawari-8 [29], ABI on GOES-R [28], and the European MTG Flexible Combined Imager (FCI). The spatial resolution of AGRI at the sub-satellite point is 1 km, 2 km, and 4 km in the visible (VIS), near infrared (NIR), and other IR spectral bands, respectively [32]. FY-4A offers full-disk Earth-view coverage every 15 min with the option for more rapid regional and mesoscale observation modes. The information from AGRI will be used for many applications related to cloud and aerosol properties, severe weather, tropical cyclones and typhoons, aviation, natural hazards, land and ocean surfaces, etc. AGRI will offer the same products and information for applications over China and its adjacent regions [30,32]. Enhanced calibration accuracy of FY-4A is better than 1 K for the thermal infrared bands and 5% for the reflective solar bands, which can greatly benefit quantitative applications [32].
AGRI scientific products are generated by the product generation system (PGS) of NSMC/CMA based on FYGAT algorithms. FYGAT algorithms are partially inherited from the FY-2/VISSR algorithm and partially referenced from the GOES-R/ABI algorithm [30]. Operational cloud mask algorithm for AGRI also classifies each pixel as being either clear, probably clear, probably cloudy, or cloudy. This cloud mask algorithm combines 13 spectral and spatial uniformity tests, and two restore tests to produce a cloud mask product for every pixel of data. The restore tests refer to tests that “restore” probably cloudy pixels to clear pixels and “restore” cloudy pixels to probably cloudy pixels. The purpose of restore tests is to provide a conservative estimate on cloudiness. Specifically, the spectral tests include six infrared independent tests, three solar reflectance tests, two shortwave infrared tests, a reflectance uniformity test, and a thermal uniformity test. These tests have different thresholds over land, ocean, and snow/ice. Some of these thresholds are derived from the statistical analysis from the comparisons with collocated CALIPSO products, and some from simulated data [31].
The cloud top pressure retrieval algorithm for AGRI combines two IR window band (11 and 12 µm) observations with a single CO2 absorption band (13.5 µm) observation to estimate cloud height without large assumptions on cloud microphysics. This is the well-known CO2/Split-Window algorithm, originally designed for ABI flown on the GOES-R series [44,47]. The split-window approach is based on two window band (11 and 12 µm) observations. It can provide accurate measurements of cloud emissivity and its spectral variation, but lacks sensitivity to cloud height for optically thin cirrus [47,64]. However, the CO2/Split-Window method benefits from combining the sensitivity to cloud height offered by a CO2 channel with the sensitivity cloud microphysics offered by IR window channels [44]. First, the retrieval methodology employed the optimal estimation approach (also referred to as a 1DVAR approach) to retrieve cloud top temperature product at the pixel level; once the cloud top temperature is computed, the Numerical Weather Prediction temperature profiles are used to interpolate the values of cloud top pressure, and cloud top height. For pixels determined to be multi-layer clouds, information about the height of the surrounding low clouds is used to estimate the height of low clouds underneath higher clouds [37]. Table 1 listed the key bands used for cloud mask and cloud top height in MODIS and AGRI.

Table 1.
Moderate Resolution Imaging (MODIS)/Advanced Geosynchronous Radiation Imager (AGRI) bands used in the MODIS/AGRI cloud mask algorithm and cloud top height algorithm.
3. Collocation and Evaluation Methodology
3.1. Collocation and Evaluation Methodology
The focus of this paper was to quantify the performance of the cloud products over the TP from the recently launched AGRI onboard FY-4A by a comparison with the coincident MODIS cloud retrievals. However, there are not only significant differences in the temporal sampling between AGRI and MODIS, but also spatial sampling differences between these two instruments. First, in order to avoid uncertainties in their comparison caused by the changes of cloud properties due to different observation time, only cloud retrievals of the exactly the same start scan time of these two systems were selected for comparison. Then, the spatial collocation rule was formulated as follows. For AGRI, the cloud mask and cloud top height are generated at a 4-km resolution. For MODIS, CM, and CTH products are retrieved at 1-km resolution. Therefore, multiple MODIS ground-projected instantaneous field-of-view (GIFOV) pixels will be collocated for a single AGRI retrieval, that is, the AGRI 4-km GIFOV is the ‘‘reference’’ with multiple MODIS measurements within the AGRI GIFOV. To find the MODIS pixels within the AGRI GIFOV means that the distance between AGRI pixel and MODIS pixel is required ≤2 km (i.e., half of AGRI resolution). If it is based on a conventional method, the distance between pixels of these two sensors has to be calculated individually. The total computation time complexity will be O(N2), which requires a huge computational resource. Assuming that AGRI and MODIS each have N pixels at a certain observation time over a certain area, for any single AGRI pixel, to find those points within 2 km from it among the N MODIS pixels, N distance calculations must be carried out. As ARGI has N pixels, the total number of computation is N × N. In computer science, the time complexity of this calculation is defined as O(N2).
In order to solve this massive computation problem as well as minimize the uncertainties resulting from the spatial sampling differences, a collocation algorithm—”multiple grid matching algorithm”—was developed in this paper to facilitate comparisons of the MODIS and AGRI cloud retrievals. This multiple grid matching algorithm was designed to be computationally efficient and accurate, allowing for rapid identification of the coincident MODIS and AGRI observations. The grid can be implemented by hash table keywords in computer science. The procedure is described in detail as follows.
First, pixels of AGRI and MODIS are subsampled and placed onto an equal-angle grid over the TP. The distance between AGRI pixel and MODIS pixel in the same grid cell should be within 2 km as much as possible. Then, AGRI and MODIS pixels are scanned separately and all pixels fall into each grid cell. Those pixels within the same grid box are exactly the required matches. However, it is possible that the nearest pixel is in the adjacent grid box. The next step is adjusting the size of the grid or shifting the coordinates of the entire grid appropriately, and scanning the AGRI and MODIS samples respectively in another iteration. The target pixels (distance within 2 km) and the nearest pixel can easily fall into a new grid cell. Figure 1 outlines this process. There is no doubt that multiple grid matching can significantly improve the matching accuracy. The side effect of multiple grid matching is the possibility of duplicate matches. Therefore, a step to remove duplicates is also required. Finally, it must be verified that the distance between these matching pixels are indeed less than 2 km. This multiple grid matching algorithm can reduce the computation time complexity to O(N). Thus, this approach can be affordable with limited computational resources.
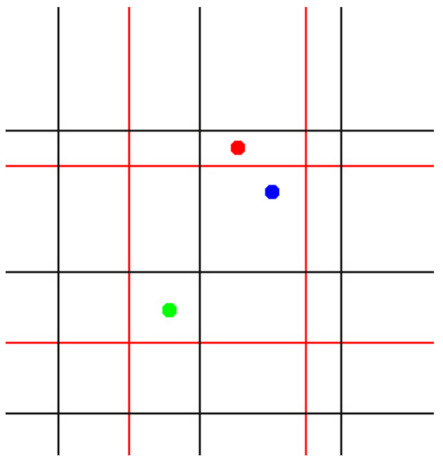
Figure 1.
Schematic diagram depicting how the Advanced Geosynchronous Radiation Imager (AGRI) pixel (the blue dot) is collocated with Moderate Resolution Imaging (MODIS) pixels (the green dot and the red dot) by using multiple grid matching methodology. These three dots represent the central position of each pixel. First, by using the grid of large size (red grid), the AGRI pixel (the blue dot) and one MODIS pixel (the green dot) can fall into the same cell (the red cell) and become collocated. However another MODIS pixel (the red dot), which is closer to the AGRI pixel than the green one, is missed by this large red grid. Then, by using the grid of small size (black grid), this MODIS pixel, which was missed last time, and the AGRI pixel can fall into a new box, the black box, and they are collocated with each other.
In addition, the MODIS scanner may view a particular MODIS FOV at an angle that departs significantly from the nadir, which may lead to increased uncertainty of the comparison. Therefore, the MODIS samples with sensor viewing zenith angle (VZA) more than 45° were filtered out. Only MODIS samples with VZA less than 45° can be used for a comparison with the AGRI samples.
3.2. Evaluation Methodology
To quantitatively compare the cloud mask results, three validation scores (i.e., Probability of Detection (POD), False-Alarm Ratio (FAR), and Hit Rate (HR)) were employed to analyze the statistics of the agreement between the two systems. The definitions are given by Wang et al. [31]:
where a and d represent the numbers of collocated samples that are all identified as cloudy and clear, respectively, by both AGRI and MODIS; b represents the number of matched samples determined as cloudy by AGRI but clear by MODIS; c represents the number of collocated samples classified as clear by AGRI but cloudy by MODIS. Note that the categories of “probably cloudy” and “probably clear” scenes are not included in the statistics here (i.e., only the pixels that classified as “cloudy” or “clear” by both AGRI and MODIS are considered here for comparison). PODcld and PODclr represent the efficiency of the AGRI cloud mask algorithm for detecting the cloudy and clear condition, respectively. The higher the POD value, the higher the efficiency. FARcld and FARclr indicate that the AGRI cloud mask algorithm misjudged collocated samples as “cloudy” and “clear”, respectively. The HR or accuracy represents the overall efficiency of the AGRI cloud mask algorithm. Specifically, HR represents the identification accuracy of AGRI’s cloud mask when only the detection results of cloud-sky and clear-sky conditions are compared, without considering the detection results of probably cloudy and probably clear conditions. At the extremes, there are two cases: (1) if the AGRI cloud mask agrees perfectly with MODIS, the POD and the HR will be one, and the FAR will be zero, while (2) no agreement results in the POD and the HR being zero, and the FAR being one.
To quantitatively compare CTH, similar to Min et al. [37], four parameters (i.e., Standard Deviation (STD), Mean Absolute Error (MAE), Mean Bias Error (MBE), and Correlation Coefficient (CC)) were used to quantify the CTH statistics of differences between AGRI and MODIS.
where and represent the AGRI CTH and MODIS CTH, respectively, and N represents the numbers of collocated samples. , , , .
Either one, or several 1-km pixel-level MODIS CTH retrievals can fall within a single 4-km AGRI CTH retrieval. Therefore, similar to Lai et al. [36], it was the distance weighted averaged MODIS CTH that was compared to the AGRI products within the AGRI 4-km FOV.
4. Results
Three months (June, July, and August 2020) of collocated AGRI and MODIS cloud detection and CTH retrievals over the TP area were compared. The three months of collocated AGRI and MODIS cloud retrievals resulted in approximately 3.2 and 1.5 million cases for cloud detection and cloud top height comparison, respectively. The results were separated by month and included statistics of the agreement with MODIS. For the comparison of the cloud mask results, only AGRI pixels where all the collocated MODIS pixels were identical (i.e., either all clear, all probably clear, all probably cloudy, or all cloudy) were included in the statistics. As a result of this requirement, approximately 37.5% of the collocated scenes were not included in the statistics, and approximately 2.0 million cases were included in the statistics in Table 2.
Table 2.
Fractional agreement, probability of detection (POD), false-alarm ratio (FAR), and hit rate (HR) scores for clear-sky and cloudy-sky conditions of AGRI cloud mask products over the TP during the periods June, July and August 2020. In the statistics, MODIS cloud mask results were used as a benchmark.
4.1. Cloud Mask
The AGRI 4-km cloud mask was evaluated using the collocated MODIS/Terra Collection 6 (i.e., MOD06) level-2 1-km cloud detection products.
As earlier discussed (Section 3.1), either one or several MODIS cloud mask retrievals can fall within a single 4-km AGRI cloud mask retrieval. In order to mitigate the uncertainty of comparison due to sub-pixel inhomogeneity [36], only AGRI pixels where all the collocated MODIS cloud mask retrievals were identical (i.e., either all clear, all probably clear, all probably cloudy, or all cloudy) were included in the statistics.
Figure 2 shows the fraction of the various identification results of the AGRI cloud mask for collocated samples when the MODIS cloud detection results were “cloudy”, “probably cloudy”, “probably clear”, and “clear” respectively. The four colors represent these four different scenes. The evaluation results are presented as a fractional agreement. Fractional agreement is similar to POD score. The difference between POD score and fractional agreement is that the POD score is calculated from the matched sample dataset that only includes the pixels classified as “cloudy” or “clear” by both AGRI and MODIS, while the fractional agreement is calculated based on all matched samples that are flagged either “cloudy”, “probably cloudy”, “probably clear”, or “clear”.
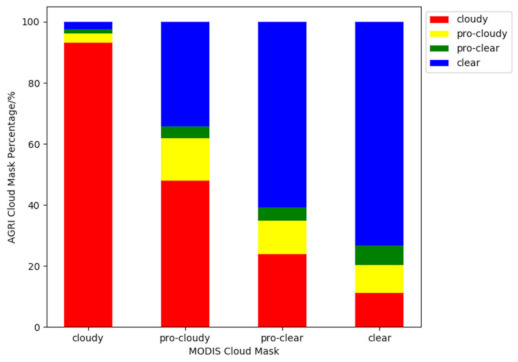
Figure 2.
The fraction of AGRI cloud mask results (i.e., cloudy, probably cloudy, probably clear, or clear) for each category of MODIS cloud mask results of matched samples. The color bar represents the different classifications of cloud mask: red, yellow, green and blue represent “cloud”, “probably cloud”, “probably clear”, and “clear”, respectively.
As shown in Figure 2, compared with the spatiotemporally collocated cloud detection results of MODIS, AGRI could identify clear and cloudy pixels with high agreement, showing good performance. Over the TP area, it was found that compared to the MODIS 1-km cloud mask, the fractional agreement of AGRI 4-km cloud mask was 0.932 for cloudy conditions. For clear-sky conditions, the fractional agreement was 0.734. However, there were distinct differences for the “probably clear” and “probably cloudy” scenes. This phenomenon is consistent with the result of the full-disk comparison [31]. These differences can mainly be attributed to the two totally different theoretical methodologies used by AGRI and MODIS for identifying “probably clear” and “probably cloudy” pixels. The MODIS Collection 6 cloud mask algorithm uses the final cloud mask confidence value based on three thresholds, as earlier mentioned (Section 2.1). In contrast, the current cloud detection algorithm for GEO satellite imagers uses spatial uniformity and two cloudy/clear restoral tests to identify “probably clear” and “probably cloudy” samples, which are closely linked to the results of neighbor pixels [31].
The TP region statistical results of the cloud mask comparison for the three months of collocated samples are presented in Table 2. The fractional agreement, POD, FAR, and HR scores of AGRI cloud mask performance were examined, and the results are separated by clear and cloudy FOVs as determined by MODIS in columns 3–9 of Table 2. Here, collocated MODIS cloud detection results were used as a benchmark. As earlier defined (Section 3.2) for POD, FAR, and HR, the categories of “probably cloudy” and “probably clear” scenes were not included in the statistics, while for the fractional agreement both in “cloudy” condition and in “clear” condition, the four scenes were all considered in the statistics. Therefore, the POD value was 0.973 for cloudy-sky conditions and 0.868 for clear-sky conditions, which was higher than the fractional agreement values (0.932 and 0.734). It should be noted that although the POD scores for cloudy conditions were higher than those for clear conditions, the FAR score was 0.093 for the cloudy condition, which was higher than that for clear-sky scene (0.04). In other words, there were more collocated samples that were misjudged as cloudy than those misjudged as clear. This finding is contrary to the result of the full-disk comparison [31]. In the full-disk comparison, FAR scores were higher for clear-sky scenes than for cloudy-sky scenes.
The results of the three months were similar. The fractional agreement and POD values were both above 0.9 under cloudy-sky conditions, while they were above 0.7 and 0.8, respectively, under clear-sky conditions. The HR scores of each month were higher than 0.9, indicating a high consistency of cloud mask between AGRI and MODIS.
In general, the AGRI cloud mask compared more favorably with MODIS cloudy scenes than for clear scenes. This result is consistent with the result of the full-disk comparison [31]. It can be inferred that AGRI cloud mask may be designed to be clear-sky conservative; that is, if there is uncertainty in the spectral tests, the AGRI cloud mask may tend to label the scene as cloudy. In addition, the AGRI cloud mask retrieval requires clear contrast between clear-sky and cloudy-sky conditions, which is dependent on both surface and atmospheric properties. The TP is associated with cold surfaces, causing low contrast between clear-sky and cloudy-sky scenes. Therefore, it is difficult to assign the pixels “clear” or “cloudy” in the algorithm confidence.
4.2. Cloud Top Height
Collocated 4-km AGRI cloud top height products were compared with MODIS 1-km CTH retrievals. As discussed earlier (Section 3.2), the distance weighted averaged pixel-level MODIS CTH retrieval was compared to the AGRI products within the AGRI 4-km FOV.
Based on this approach, CTH retrievals were collocated and compared for June, July, and August 2020. The statistical results of the comparison including mean absolute error, mean bias error, standard deviation, and correlation coefficient are presented in Table 3. The monthly comparison results were similar, with the CTH differences between AGRI and MODIS the smallest in June. For each month, the CTH difference was negative, and the average for these three months was −1.366 ± 2.235 km. The negative mean cloud top height differences (AGRI-MODIS) suggest that on average, AGRI underestimated the CTH relative to MODIS by 1.366 ± 2.235 km. The correlation coefficient value of each month was more than 0.74, indicating good correlation between the two datasets.
Table 3.
Cloud top height over the Tibetan Plateau (TP) statistics of the mean absolute error (MAE), mean bias error (MBE), standard deviation (STD), and correlation coefficient (CC) between AGRI and MODIS during the periods June, July and August 2020. MODIS cloud top height retrievals are used as a benchmark.
Figure 3 shows the validations of CTH products of AGRI for the complete collocated samples. The color bar represents the total number of matched samples in every bin at an interval of 0.25 km. It can be seen that the collocated samples were basically concentrated on the 1:1 line. There were a large number of collocated samples in the height range of 7~10 km, where the AGRI CTHs was clearly lower than that of MODIS. Mean absolute error, mean bias error, standard deviation, correlation coefficient, and the number of collocated samples for the whole period was also marked, which was 1.776 km, −1.366 km, 2.235 km, and 0.759, respectively.
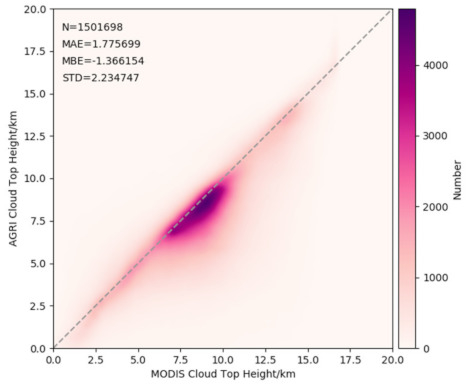
Figure 3.
Validation of cloud top height (CTH) products of AGRI over the TP based MODIS CTH retrievals during the periods June, July, and August 2020. The color bar represents the number of collocated samples in every bin at an interval of 0.25 km, and the dashed line is the one-to-one ratio line. The total number of collocated samples (N), mean absolute error (MAE), mean bias error (MBE), standard deviation (STD), and correlation coefficient (CC) are marked in the upper left corner.
To further investigate the CTH differences between AGRI and MODIS at different height, the layered MAE, MBE, and STD at an interval of 1 km for collocated samples are presented in Figure 4. It can be seen that the MAE, MBE, and STD of CTH between AGRI and MODIS showed an obvious trend of error increasing with height, and finally reached the maximum MAE and STD (MBE minimum) value at approximately 12 km. For clouds with a top height above 12 km, the MAE, MBE, and STD fluctuated slightly with height; and for clouds with a top height above about 14 km, the differences in CTH between AGRI and MODIS decreased rapidly. The large negative differences were associated with high clouds with CTH in the range of approximately 12 to 14 km. The positive differences were associated with low-level clouds (<4.5 km).
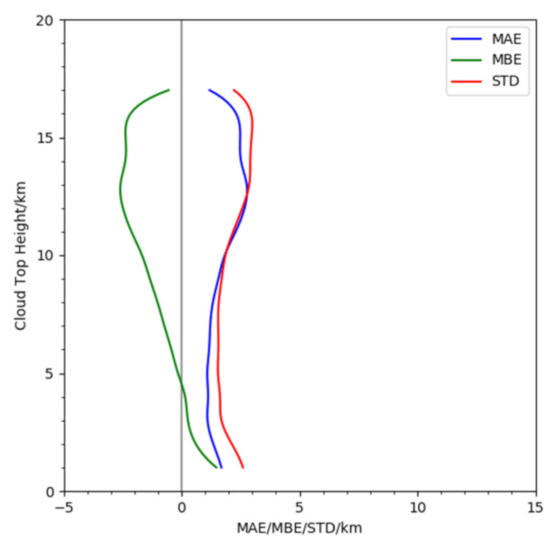
Figure 4.
MAE (blue line), MBE (green line), and STD (red line) of AGRI CTH in different layers at an interval of 1 km for the same dataset in Figure 3.
5. Discussion
Interpretation of the cloud mask and cloud top height retrieval comparison results is complex. Biases and uncertainties result from a combination of spectral sensitivity differences and systematic algorithm biases from AGRI and MODIS as well as uncertainties from the spatial sampling differences. In addition, AGRI and MODIS cloud mask and cloud top height retrieval performance are dependent on both surface, cloud, and atmospheric properties. The complicated cloud regimes over the TP with complex terrain can increase the complexity of the interpretation of the comparison results.
To further investigate the performance of the AGRI cloud mask over the TP, the AGRI cloud mask agreement distribution separated for cloudy-sky and clear-sky scenes is presented in Figure 5. Three months of collocated samples of the same dataset in Table 2 were divided into 0.5° grid boxes. As shown in Figure 5, each grid box presents the fractional agreement in cloudy-sky (Figure 5a)/clear-sky (Figure 5b) conditions for all the matched samples within the box. The spatial distribution of the matching sample size was also presented for clear-sky (Figure 5c) and cloudy-sky (Figure 5d) conditions.
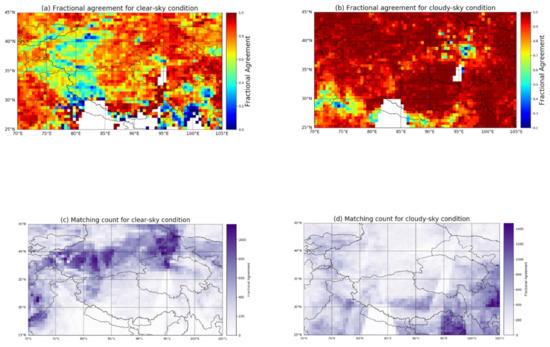
Figure 5.
Fractional agreement between AGRI 4-km and MODIS 1-km cloud mask separated (a) for clear-sky scenes and (b) for cloudy-sky scenes is presented. Spatial distribution of the collocated sample size for (c) clear-sky scenes and (d) cloudy-sky scenes is also presented. The fractional agreement was calculated at a 0.5° resolution based on three months (June, July, and August 2020) of collocated samples of the same dataset with Table 2. A grid cell with perfect agreement between AGRI and MODIS will have a fractional agreement of 1 (red), while boxes of poorer agreement are colored blue. Blank space means that there are no matched pixels under the corresponding conditions.
The largest differences over the southern part of the TP (25°N~29°N, 79°E~102°E) for the clear-sky condition were partially due to sampling with only dozens or even fewer samples within a grid box instead of several hundred or even more than a thousand, as in other grid boxes. In summer, the warm and humid monsoon frequently reached the steep southern slope of the TP, making convective cloud system dominate there [22,65], therefore, there were few MODIS clear pixels during the summer monsoon season over those areas (Figure 5c). Surprisingly, there was poor agreement for clear sky conditions over the western part of the TP (36°N~40°N, 75°E~85°E, the area where China’s largest desert, the Taklimakan Desert, and largest basin, Tarim Basin, are located). Although it is expected that the desert and basin area should be associated with warm surfaces, causing high thermal contrast between clouds and the surface, leading to better clear-sky detection; in fact, the differences over the under clear-sky condition were obvious. This is likely due to the fact that AGRI thresholds of the infrared tests are not applicable for the desert area, leading to poor agreement. It was found that cloud occurrence frequencies obtained from AGRI reached the peak at night and were the least during the day over that area. Radiation cooling at night will cause a significant temperature drop in desert areas. Additionally, the low temperature of the desert at night results in poor thermal contrast between the clouds and surface, which will increase the difficulty for cloudy-sky/clear-sky detection. It is necessary to further study what caused these differences in future work.
It is obvious that AGRI and MODIS were in better agreement for cloudy scenes than for clear-sky scenes. The fractional agreement was better than 0.9 over much of the TP for cloudy-sky condition. While AGRI and MODIS were generally in good agreement under this circumstance, there were some small regions located in the southern, southwestern, and northeastern part of the TP with poor agreement. To help interpret similarities and differences, Figure 6 presents the averaged MODIS cloud top height for two separated conditions: (1) for those cases where both MODIS and AGRI identify cloud scenes; and (2) for those cases where the MODIS 1-km cloud mask identifies cloud scenes but AGRI misses (i.e., AGRI flags them as clear or probably clear or probably cloudy). It should be noted that the 1-km pixel-level MODIS cloud top heights were first weighted averaged through Equation (10) to derive the cloud top height of the collocated sample, and then the MODIS cloud top height of each grid cell was derived by averaging all matched sample MODIS CTH within the grid box. The weighted average cloud height approach is to better characterize the cloud top height of those clouds that AGRI missed.
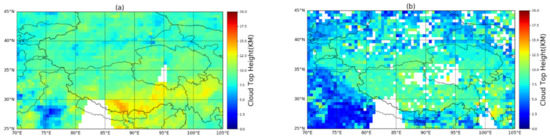
Figure 6.
The MODIS CTHs of the collocated samples (of the same dataset with Figure 5) where (a) both MODIS and AGRI flags them as cloudy, and (b) MODIS flags them as cloudy but AGRI labels them as clear or probably clear or probably cloudy, are averaged over a 0.5° grid cell. Blank space means there are no matched pixels under the corresponding conditions.
By comparing Figure 6a with Figure 6b, it can be found that clouds that can be simultaneously detected by both MODIS and AGRI were those with higher CTH. The higher CTH in Figure 6a was most pronounced for the southeastern part of the TP (25°N~32°N, 85°E~105°E). This is due to the unique large topography of the TP that causes significant thermal–dynamic forcing on the atmosphere in summer over the steep southern slope and makes this region associated with frequent convective activities in summer [66,67]. For these convective clouds with high CTH (>12 km), AGRI and MODIS can obtain good agreement. AGRI tends to miss low CTH clouds (<5 km), which is more pronounced at lower altitudes (<4 km) in areas located away from the center part of the TP, particularly in the southwest TP. In addition, for the central region of the TP (29°N~36°N, 79°E~97°E) (i.e., the main part of the TP with an altitude of ≥4 km), the clouds missed by AGRI had a relatively lower CTH than those identified by both approaches over the same areas. This is likely due to the lack of thermal contrast between the clouds and the surface. The cloud top is usually colder than the surface, and will be colder with increasing cloud top height. A good contrast between clouds and surface will benefit cloud detection. The TP is associated with cold surfaces, so the higher the elevation, the colder. The cold background conditions of the TP make cloud and clear scene discrimination problematic, especially for the low CTH clouds that are relatively warmer than high CTH clouds over it.
Figure 7 presents the mean absolute error and mean bias error of AGRI cloud top height compared with MODIS CTH separated into grid cells. Three months (June, July, and August 2020) of collocated samples of the same dataset with Table 3 were divided into 0.5° grid cells. As shown in Figure 7, each grid box presents the MAE (Figure 7a) and MBE (Figure 7b) for all the matched samples within the box.
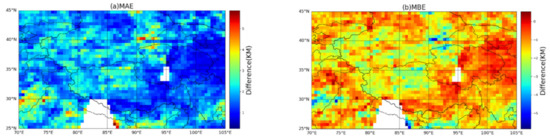
Figure 7.
A 0.5° grid of the (a) mean cloud top height absolute error (MAE) and (b) mean cloud top height bias error (MBE) are presented. For each 0.5° grid box, the mean of all the collocated differences (AGRI-MODIS) within the box was calculated based on the same dataset with Table 3. In (a), the deep blue value shows that AGRI and MODIS have the same cloud top height results, while the red values represent that there are large CTH differences between these two systems; in (b), a negative difference (blue) results when the mean AGRI cloud top height was lower than MODIS, while the deep red values represent AGRI overestimating the cloud top height relative to MODIS (the maximum bias value was 0.564 km). Blank space means that there were no matched pixels under the corresponding conditions.
It can be found that the MAE presented a similar pattern of CTH disagreement distribution with MBE. In general, there were few CTH differences, especially over the eastern part of the TP. The largest differences were due to significant underestimation by AGRI occurring over the southern, southwestern, and northern region of the TP (Figure 7b). The pattern of large disagreement distribution over the southern (25°N~27°N, 86°E~95°E) and southwestern (28°N~32°N, 70°E~75°E) part of the TP was similar to the high CTH (>12 km) cloud distribution characteristic in Figure 6a. Therefore, the clouds with high CTH (>12 km) resulted in the large underestimations over the southern and southwestern part of the TP by AGRI. In summer, the TP is usually considered an “air pump” due to its higher surface temperature compared with surrounding regions [13], intensifying atmospheric instability induced by the South Asian Monsoon. These combined effects generate a high number of high altitude cirrus and deep convective clouds over the TP, especially the southern part of the TP [10,20,33]. These largest CTH differences in the southern and southwestern part are likely due to AGRI underestimating the high cloud top heights (CTH > 12 km) relative to MODIS as revealed by statistics shown in Figure 4.
6. Conclusions
This paper compared the FY-4A/AGRI and Terra/MODIS Collection 6 pixel-level cloud mask and cloud top height results over the Tibetan Plateau to better understand the cloud products’ performance and characteristics of the new generation GEO satellite imager FY-4A/AGRI. Additionally, MODIS cloud retrievals were used as benchmarks. To facilitate the comparison, an accurate and computationally efficient collocation algorithm was developed. The comparison was conducted for the period of June, July, and August 2020. The comparison results showed that in general, the AGRI cloud mask over the TP is reliable for cloudy conditions. On average, AGRI underestimates the cloud top heights. For cloud detection, the two approaches (AGRI and MODIS) showed a fractional agreement of 0.93 for cloudy conditions, and 0.73 for clear-sky scenes when the MODIS cloud mask retrievals were used as a benchmark. However, there were distinct differences for “probably clear” and “probably cloudy” scenes, mainly due to the two totally different theoretical methodologies used by AGRI and MODIS. The agreement was generally better for cloudy conditions than for clear scenes. Significant disagreement found in the southern part of the TP for clear-sky conditions can be partially attributed to only a few clear pixels during the summer monsoon season over that region. The largest disagreement for cloudy-sky scenes occurred in some small regions located in the southern, southwestern, and northeastern part of the TP. AGRI and MODIS can obtain good agreement for detecting clouds with higher CTH, and AGRI tends to miss lower CTH clouds due to the lack of thermal contrast between the clouds and the surface of the TP.
For cloud top height products, the comparison shows that the mean cloud top height differences (AGRI-MODIS) were negative (−1.366 ± 2.235 km), suggesting that on average, AGRI underestimates the CTH relative to MODIS. The CTH differences between AGRI and MODIS showed an obvious trend of increasing error with height, and reached the largest difference at approximately 12 km. In general, there were few CTH differences, especially over the eastern part of the TP. The largest differences due to significant underestimation by AGRI occurred over small areas located in the southern, southwestern, and northern part of the TP. For the southern and southwestern part of the TP, the obvious CTH differences can be partially attributed to the CTH underestimation of clouds with high CTH (>12 km).
Author Contributions
Conceptualization, W.X. and D.L.; Methodology, W.X.; Software, W.X.; Validation, W.X.; Formal analysis, W.X.; Investigation, W.X.; Resources, D.L.; Data curation, W.X.; Writing—original draft preparation, W.X.; Writing—review and editing, W.X.; Visualization, W.X.; Supervision, D.L.; Project administration, D.L.; Funding acquisition, D.L. Both authors have read and agreed to the published version of the manuscript.
Funding
This research was funded by the Key Research Project of Frontier Science of Chinese Academy of Sciences (QYZDY-SSW-DQC027), the National Key R&D Program of China (2018YFC1506605), the Second Tibetan Plateau Scientific Expedition and Research Program (STEP, 2019QZKK0604), and the Strategic Priority Research Program of the Chinese Academy of Sciences (XDA17010103).
Data Availability Statement
The Terra/MODIS MOD06 cloud products were collected from the official NASA Goddard MODIS website (https://modis.gsfc.nasa.gov/data/dataprod/mod06.php (accessed on 29 January 2020)). The Fengyun-4A/AGRI cloud products were collected from the official Fengyun Satellite Data Center of NSMC/CMA (http://satellite.nsmc.org.cn/portalsite/default.aspx?currentculture=en-US (accessed on 29 January 2020)).
Acknowledgments
The authors are grateful to David Hudak from Environment and Climate Change of Canada for his very helpful suggestions. We would also like to thank Min Min from Sun Yat-Sen University for useful discussions. The authors would like to acknowledge NASA and NSMC/CMA for freely providing the MODIS and AGRI cloud products online.
Conflicts of Interest
The authors declare no conflict of interest.
References
- Wielicki, B.A.; Parker, L. On the determination of cloud cover from satellite sensors—The effect of sensor spatial-resolution. J. Geophys. Res. Atmos. 1992, 97, 12799–12823. [Google Scholar] [CrossRef]
- Stubenrauch, C.J.; Rossow, W.B.; Kinne, S.; Ackerman, S.; Cesana, G.; Chepfer, H.; Di Girolamo, L.; Getzewich, B.; Guignard, A.; Heidinger, A.; et al. Assessment of global cloud datasets from satellites: Project and database initiated by the gewex radiation panel. Bull. Am. Meteorol. Soc. 2013, 94, 1031–1049. [Google Scholar] [CrossRef]
- Stephens, G.L.; Vane, D.G.; Boain, R.J.; Mace, G.G.; Sassen, K.; Wang, Z.E.; Illingworth, A.J.; O’Connor, E.J.; Rossow, W.B.; Durden, S.L.; et al. The cloudsat mission and the a-train—A new dimension of space-based observations of clouds and precipitation. Bull. Am. Meteorol. Soc. 2002, 83, 1771–1790. [Google Scholar] [CrossRef]
- Rossow, W.B.; Schiffer, R.A. Advances in understanding clouds from isccp. Bull. Am. Meteorol. Soc. 1999, 80, 2261–2287. [Google Scholar] [CrossRef]
- Stephens, G.L.; Christensen, M.; Andrews, T.; Haywood, J.; Malavelle, F.F.; Suzuki, K.; Jing, X.W.; Lebsock, M.; Li, J.L.F.; Takahashi, H.; et al. Cloud physics from space. Q. J. R. Meteorol. Soc. 2019, 145, 2854–2875. [Google Scholar] [CrossRef]
- Boucher, O.; Randall, D.; Artaxo, P.; Bretherton, C.; Feingold, G.; Forster, P.; Kerminen, V.-M.; Kondo, Y.; Lia, H.; Lohmann, U.; et al. Clouds and aerosols. In Climate Change 2013: The Physical Science Basis. Contribution of Working Group i to the Fifth Assessment Report of the Intergovernmental Panel on Climate Change; Cambridge University Press: Cambridge, UK, 2013. [Google Scholar]
- Sato, T. Impact of diabatic heating over the tibetan plateau on subsidence over northeast Asian arid region. Geophys. Res. Lett. 2005, 32. [Google Scholar] [CrossRef]
- Kutzbach, J.E.; Guetter, P.J.; Ruddiman, W.F.; Prell, W.L. Sensitivity of climate to late cenozoic uplift in southern asia and the american west—Numerical experiments. J. Geophys. Res. Atmos. 1989, 94, 18393–18407. [Google Scholar] [CrossRef]
- Yanai, M.H.; Li, C.F.; Song, Z.S. Seasonal heating of the tibetan plateau and its effects on the evolution of the asian summer monsoon. J. Meteorol. Soc. Jpn. 1992, 70, 319–351. [Google Scholar] [CrossRef]
- Chen, B.D.; Liu, X.D. Seasonal migration of cirrus clouds over the asian monsoon regions and the tibetan plateau measured from modis/terra. Geophys. Res. Lett. 2005, 32. [Google Scholar] [CrossRef]
- Yu, R.C.; Wang, B.; Zhou, T.J. Climate effects of the deep continental stratus clouds generated by the tibetan plateau. J. Clim. 2004, 17, 2702–2713. [Google Scholar] [CrossRef]
- Tao, S.Y.; Ding, Y.H. Observational evidence of the influence of the qinghai-xizang (tibet) plateau on the occurrence of heavy rain and severe convective storms in China. Bull. Am. Meteorol. Soc. 1981, 62, 23–30. [Google Scholar] [CrossRef]
- Wu, G.; Duan, A.; Liu, Y.; Mao, J.; Ren, R.; Bao, Q.; He, B.; Liu, B.; Hu, W. Tibetan plateau climate dynamics: Recent research progress and outlook. Natl. Sci. Rev. 2015, 2, 100–116. [Google Scholar] [CrossRef]
- Wu, G.; Liu, Y.; Wang, T.; Wan, R.; Liu, X.; Li, W.; Wang, Z.; Zhang, Q.; Duan, A.; Liang, X. The influence of mechanical and thermal forcing by the tibetan plateau on asian climate. J. Hydrometeorol. 2007, 8, 770–789. [Google Scholar] [CrossRef]
- He, B.; Wu, G.; Liu, Y.; Bao, Q. Astronomical and hydrological perspective of mountain impacts on the asian summer monsoon. Sci. Rep. 2015, 5, 1–12. [Google Scholar] [CrossRef]
- Xu, X.; Lu, C.; Shi, X.; Ding, Y. Large-scale topography of China: A factor for the seasonal progression of the meiyu rainband? J. Geophys. Res. Atmos. 2010, 115. [Google Scholar] [CrossRef]
- Xu, X.; Lu, C.; Shi, X.; Gao, S. World water tower: An atmospheric perspective. Geophys. Res. Lett. 2008, 35. [Google Scholar] [CrossRef]
- Fu, Y.; Ma, Y.; Zhong, L.; Yang, Y.; Guo, X.; Wang, C.; Xu, X.; Yang, K.; Xu, X.; Liu, L.; et al. Land-surface processes and summer-cloud-precipitation characteristics in the tibetan plateau and their effects on downstream weather: A review and perspective. Natl. Sci. Rev. 2020, 7, 500–515. [Google Scholar] [CrossRef]
- Stephens, G.; Winker, D.; Pelon, J.; Trepte, C.; Vane, D.; Yuhas, C.; L’Ecuyer, T.; Lebsock, M. Cloudsat and calipso within the a-train: Ten years of actively observing the earth system. Bull. Am. Meteorol. Soc. 2018, 99, 569–581. [Google Scholar] [CrossRef]
- Gao, B.C.; Yang, P.; Guo, G.; Park, S.K.; Wiscombe, W.J.; Chen, B. Measurements of water vapor and high clouds over the tibetan plateau with the terra modis instrument. IEEE Trans. Geosci. Remote Sens. 2003, 41, 895–900. [Google Scholar]
- Yafei, Y.; Xiaocong, W.; Yimin, L. Cloud vertical structures associated with precipitation magnitudes over the tibetan plateau and its neighboring regions. Atmos. Ocean. Sci. Lett. 2018, 11, 44–53. [Google Scholar]
- Yan, Y.F.; Liu, Y.M.; Lu, J.H. Cloud vertical structure, precipitation, and cloud radiative effects over tibetan plateau and its neighboring regions. J. Geophys. Res. Atmos. 2016, 121, 5864–5877. [Google Scholar] [CrossRef]
- Rossow, W.B.; Cairns, B. Monitoring changes of clouds. Clim. Chang. 1995, 31, 305–347. [Google Scholar] [CrossRef]
- Wang, Y.; Zhao, C. Can modis cloud fraction fully represent the diurnal and seasonal variations at doe arm sgp and manus sites? J. Geophys. Res. Atmos. 2017, 122, 329–343. [Google Scholar] [CrossRef]
- Lei, Y.; Letu, H.; Shang, H.; Shi, J. Cloud cover over the tibetan plateau and eastern China: A comparison of era5 and era-interim with satellite observations. Clim. Dyn. 2020, 54, 2941–2957. [Google Scholar] [CrossRef]
- Yin, J.; Porporato, A. Diurnal cloud cycle biases in climate models. Nat. Commun. 2017, 8, 2269. [Google Scholar] [CrossRef] [PubMed]
- Yin, J.; Porporato, A. Radiative effects of daily cycle of cloud frequency in past and future climates. Clim. Dyn. 2020, 54, 1625–1637. [Google Scholar] [CrossRef]
- Schmit, T.J.; Griffith, P.; Gunshor, M.M.; Daniels, J.M.; Goodman, S.J.; Lebair, W.J. A closer look at the abi on the goes-r series. Bull. Am. Meteorol. Soc. 2017, 98, 681–698. [Google Scholar] [CrossRef]
- Bessho, K.; Date, K.; Hayashi, M.; Ikeda, A.; Imai, T.; Inoue, H.; Kumagai, Y.; Miyakawa, T.; Murata, H.; Ohno, T.; et al. An introduction to himawari-8/9-japan’s new-generation geostationary meteorological satellites. J. Meteorol. Soc. Jpn. 2016, 94, 151–183. [Google Scholar] [CrossRef]
- Min, M.; Wu, C.; Li, C.; Liu, H.; Xu, N.; Wu, X.; Chen, L.; Wang, F.; Sun, F.; Qin, D.; et al. Developing the science product algorithm testbed for Chinese next-generation geostationary meteorological satellites: Fengyun-4 series. J. Meteorol. Res. 2017, 31, 708–719. [Google Scholar] [CrossRef]
- Wang, X.; Min, M.; Wang, F.; Guo, J.; Li, B.; Tang, S. Intercomparisons of cloud mask products among fengyun-4a, himawari-8, and modis. IEEE Trans. Geosci. Remote Sens. 2019, 57, 8827–8839. [Google Scholar] [CrossRef]
- Yang, J.; Zhang, Z.; Wei, C.; Lu, F.; Guo, Q. Introducing the new generation of Chinese geostationary weather satellites, fengyun-4. Bull. Am. Meteorol. Soc. 2017, 98, 1637–1658. [Google Scholar] [CrossRef]
- Chen, D.D.; Guo, J.P.; Wang, H.Q.; Li, J.; Min, M.; Zhao, W.H.; Yao, D. The cloud top distribution and diurnal variation of clouds over east Asia: Preliminary results from advanced himawari imager. J. Geophys. Res. Atmos. 2018, 123, 3724–3739. [Google Scholar] [CrossRef]
- Chen, Y.; Li, W.; Chen, S.; Zhang, A.; Fu, Y. Linkage between the vertical evolution of clouds and droplet growth modes as seen from fy-4a agri and gpm dpr. Geophys. Res. Lett. 2020, 47, e2020GL088312. [Google Scholar] [CrossRef]
- Holz, R.E.; Ackerman, S.A.; Nagle, F.W.; Frey, R.; Dutcher, S.; Kuehn, R.E.; Vaughan, M.A.; Baum, B. Global moderate resolution imaging spectroradiometer (modis) cloud detection and height evaluation using caliop. J. Geophys. Res. Atmos. 2008, 113. [Google Scholar] [CrossRef]
- Lai, R.; Teng, S.; Yi, B.; Letu, H.; Min, M.; Tang, S.; Liu, C. Comparison of cloud properties from himawari-8 and fengyun-4a geostationary satellite radiometers with modis cloud retrievals. Remote Sens. 2019, 11, 1703. [Google Scholar] [CrossRef]
- Min, M.; Li, J.; Wang, F.; Liu, Z.; Menzel, W.P. Retrieval of cloud top properties from advanced geostationary satellite imager measurements based on machine learning algorithms. Remote Sens. Environ. 2020, 239, 111616. [Google Scholar] [CrossRef]
- Wang, T.; Luo, J.L.; Liang, J.L.; Wang, B.J.; Tian, W.S.; Chen, X.Y. Comparisons of agri/fy-4a cloud fraction and cloud top pressure with modis/terra measurements over east Asia. J. Meteorol. Res. 2019, 33, 705–719. [Google Scholar] [CrossRef]
- Sato, T.; Miura, H.; Satoh, M. Spring diurnal cycle of clouds over tibetan plateau: Global cloud-resolving simulations and satellite observations. Geophys. Res. Lett. 2007, 34. [Google Scholar] [CrossRef]
- Kotarba, A.Z. Impact of moderate resolution imaging spectroradiometer (modis) cloud mask interpretation on cloud amount estimation. J. Geophys. Res. Atmos. 2015, 120, 8971–8986. [Google Scholar] [CrossRef]
- Ackerman, S.A.; Holz, R.E.; Frey, R.; Eloranta, E.W.; Maddux, B.C.; McGill, M. Cloud detection with modis. Part ii: Validation. J. Atmos. Ocean. Technol. 2008, 25, 1073–1086. [Google Scholar] [CrossRef]
- Ackerman, S.; Frey, R.; Strabala, K.; Liu, Y.; Gumley, L.; Baum, B.; Menzel, P. Discriminating Clear-Sky from Cloud with Modis Algorithm Theoretical Basis Document (mod35) v6.1; Cooperative Institute for Meteorological Satellite Studies, University of Wisconsin: Madison, WI, USA, 2010. [Google Scholar]
- Qin, Y.; Steven, A.D.L.; Schroeder, T.; McVicar, T.R.; Huang, J.; Cope, M.; Zhou, S. Cloud cover in the australian region: Development and validation of a cloud masking, classification and optical depth retrieval algorithm for the advanced himawari imager. Front. Environ. Sci. 2019, 7, 20. [Google Scholar] [CrossRef]
- Heidinger, A. GOES-R Algorithm Theoretical Basis Document (ATBD)-ABI Cloud Height; NOAA/NESDIS Center for Satellite Applications and Research: 2012, version 3.0. pp. 1–77. Available online: https://www.goes-r.gov/resources/docs.html (accessed on 29 January 2020).
- Cesana, G.; Del Genio, A.D.; Chepfer, H. The cumulus and stratocumulus cloudsat-calipso dataset (casccad). Earth Syst. Sci. Data 2019, 11, 1745–1764. [Google Scholar] [CrossRef]
- Platnick, S.; Meyer, K.G.; King, M.D.; Wind, G.; Amarasinghe, N.; Marchant, B.; Arnold, G.T.; Zhang, Z.; Hubanks, P.A.; Holz, R.E.; et al. The modis cloud optical and microphysical products: Collection 6 updates and examples from terra and aqua. IEEE Trans. Geosci. Remote Sens. 2017, 55, 502–525. [Google Scholar] [CrossRef] [PubMed]
- Heidinger, A.K.; Pavolonis, M.J.; Holz, R.E.; Baum, B.A.; Berthier, S. Using calipso to explore the sensitivity to cirrus height in the infrared observations from npoess/viirs and goes-r/abi. J. Geophys. Res. Atmos. 2010, 115. [Google Scholar] [CrossRef]
- Okamoto, K.; McNally, A.P.; Bell, W. Progress towards the assimilation of all-sky infrared radiances: An evaluation of cloud effects. Q. J. R. Meteorol. Soc. 2014, 140, 1603–1614. [Google Scholar] [CrossRef]
- Frey, R.A.; Ackerman, S.A.; Liu, Y.; Strabala, K.I.; Zhang, H.; Key, J.R.; Wang, X. Cloud detection with modis. Part i: Improvements in the modis cloud mask for collection 5. J. Atmos. Ocean. Technol. 2008, 25, 1057–1072. [Google Scholar] [CrossRef]
- King, M.D.; Menzel, W.P.; Kaufman, Y.J.; Tanre, D.; Gao, B.C.; Platnick, S.; Ackerman, S.A.; Remer, L.A.; Pincus, R.; Hubanks, P.A. Cloud and aerosol properties, precipitable water, and profiles of temperature and water vapor from modis. IEEE Trans. Geosci. Remote Sens. 2003, 41, 442–458. [Google Scholar] [CrossRef]
- Yang, P.; Zhang, L.; Hong, G.; Nasiri, S.L.; Baum, B.A.; Huang, H.-L.; King, M.D.; Platnick, S. Differences between collection 4 and 5 modis ice cloud optical/microphysical products and their impact on radiative forcing simulations. IEEE Trans. Geosci. Remote Sens. 2007, 45, 2886–2899. [Google Scholar] [CrossRef]
- Ackerman, S.A.; Strabala, K.I.; Menzel, W.P.; Frey, R.A.; Moeller, C.C.; Gumley, L.E. Discriminating clear sky from clouds with modis. J. Geophys. Res. Atmos. 1998, 103, 32141–32157. [Google Scholar] [CrossRef]
- Menzel, W.P.; Frey, R.A.; Zhang, H.; Wylie, D.P.; Moeller, C.C.; Holz, R.E.; Maddux, B.; Baum, B.A.; Strabala, K.I.; Gumley, L.E. Modis global cloud-top pressure and amount estimation: Algorithm description and results. J. Appl. Meteorol. Climatol. 2008, 47, 1175–1198. [Google Scholar] [CrossRef]
- Baum, B.A.; Menzel, W.P.; Frey, R.A.; Tobin, D.C.; Holz, R.E.; Ackerman, S.A.; Heidinger, A.K.; Yang, P. Modis cloud-top property refinements for collection 6. J. Appl. Meteorol. Climatol. 2012, 51, 1145–1163. [Google Scholar] [CrossRef]
- Ham, S.-H.; Sohn, B.-J.; Yang, P.; Baum, B.A. Assessment of the quality of modis cloud products from radiance simulations. J. Appl. Meteorol. Climatol. 2009, 48, 1591–1612. [Google Scholar] [CrossRef]
- King, M.D.; Platnick, S.; Menzel, W.P.; Ackerman, S.A.; Hubanks, P.A. Spatial and temporal distribution of clouds observed by modis onboard the terra and aqua satellites. IEEE Trans. Geosci. Remote Sens. 2013, 51, 3826–3852. [Google Scholar] [CrossRef]
- Oreopoulos, L.; Cho, N.; Lee, D.; Kato, S.; Huffman, G.J. An examination of the nature of global modis cloud regimes. J. Geophys. Res. Atmos. 2014, 119, 8362–8383. [Google Scholar] [CrossRef]
- Hong, G.; Yang, P.; Gao, B.-C.; Baum, B.A.; Hu, Y.X.; King, M.D.; Platnick, S. High cloud properties from three years of modis terra and aqua collection-4 data over the tropics. J. Appl. Meteorol. Climatol. 2007, 46, 1840–1856. [Google Scholar] [CrossRef]
- Meyer, K.; Yang, P.; Gao, B.-C. Tropical ice cloud optical depth, ice water path, and frequency fields inferred from the modis level-3 data. Atmos. Res. 2007, 85, 171–182. [Google Scholar] [CrossRef]
- Yuan, T.; Li, Z. General macro- and microphysical properties of deep convective clouds as observed by modis. J. Clim. 2010, 23, 3457–3473. [Google Scholar] [CrossRef]
- Zou, X.L.; Da, C. An objective regional cloud mask algorithm for goes infrared imager radiance assimilation. J. Geophys. Res. Atmos. 2014, 119, 6666–6680. [Google Scholar] [CrossRef]
- Zhuge, X.; Zou, X. Test of a modified infrared-only abi cloud mask algorithm for ahi radiance observations. J. Appl. Meteorol. Climatol. 2016, 55, 2529–2546. [Google Scholar] [CrossRef]
- Smith, W.L.; Platt, C.M.R. Comparison of satellite-deduced cloud heights with indications from radiosonde and ground-based laser measurements. J. Appl. Meteorol. 1978, 17, 1796–1802. [Google Scholar] [CrossRef]
- Heidinger, A.K.; Pavolonis, M.J. Gazing at cirrus clouds for 25 years through a split window. Part i: Methodology. J. Appl. Meteorol. Climatol. 2009, 48, 1100–1116. [Google Scholar] [CrossRef]
- Yan, Y.; Liu, Y. Vertical structures of convective and stratiform clouds in boreal summer over the tibetan plateau and its neighboring regions. Adv. Atmos. Sci. 2019, 36, 1089–1102. [Google Scholar] [CrossRef]
- Yu, L.; Fu, Y.; Yang, Y.; Pan, X.; Tan, R. Trumpet-shaped topography modulation of the frequency, vertical structures, and water path of cloud systems in the summertime over the southeastern tibetan plateau: A perspective of daytime-nighttime differences. J. Geophys. Res. Atmos. 2020, 125, e2019JD031803. [Google Scholar] [CrossRef]
- Luo, Y.; Zhang, R.; Qian, W.; Luo, Z.; Hu, X. Intercomparison of deep convection over the tibetan plateau-asian monsoon region and subtropical north america in boreal summer using cloudsat/calipso data. J. Clim. 2011, 24, 2164–2177. [Google Scholar] [CrossRef]


Publisher’s Note: MDPI stays neutral with regard to jurisdictional claims in published maps and institutional affiliations. |
© 2021 by the authors. Licensee MDPI, Basel, Switzerland. This article is an open access article distributed under the terms and conditions of the Creative Commons Attribution (CC BY) license (https://creativecommons.org/licenses/by/4.0/).