Abstract
A seamless mosaic has been constructed including a 3D terrain model at 50 m grid-spacing and a corresponding terrain-corrected orthoimage at 12.5 m using a novel approach applied to ESA Mars Express High Resolution Stereo Camera orbital (HRSC) images of Mars. This method consists of blending and harmonising 3D models and normalising reflectance to a global albedo map. Eleven HRSC image sets were processed to Digital Terrain Models (DTM) based on an opensource stereo photogrammetric package called CASP-GO and merged with 71 published DTMs from the HRSC team. In order to achieve high quality and complete DTM coverage, a new method was developed to combine data derived from different stereo matching approaches to achieve a uniform outcome. This new approach was developed for high-accuracy data fusion of different DTMs at dissimilar grid-spacing and provenance which employs joint 3D and image co-registration, and B-spline fitting against the global Mars Orbiter Laser Altimeter (MOLA) standard reference. Each HRSC strip is normalised against a global albedo map to ensure that the very different lighting conditions could be corrected and resulting in a tiled set of seamless mosaics. The final 3D terrain model is compared against the MOLA height reference and the results shown of this intercomparison both in altitude and planum. Visualisation and access mechanisms to the final open access products are described.
Keywords:
3D reconstruction; stereo; co-registration; 3D co-alignment; DTM; mosaic; HRSC; Valles Marineris; CASP-GO 1. Introduction
Valles Marineris on Mars are the largest system of canyons in the Solar System. The system is more than 4,000 km long, 200 km wide, and up to 10 km deep with respect to the surrounding plateaus. Because of their sheer size Valles Marineris have been a subject of growing number of studies since the Viking era and we now know that they have been subject to a wide variety of processes throughout their history. Estimated to be approximately 3.5 Ga old [1], the superstructure is related to tectonic rifting of the crust related in part to the loading induced by the Tharsis Volcanic province [1,2,3,4]. This overall tectonic structure has been modified by outflows [5,6,7,8], fluvial processes [7,9,10,11] (delta, melas), volcanic processes [12,13,14], aeolian processes [15,16,17] and it also thought to contain evidence of glacial modification [18,19]. Its extreme topographic relief influences the atmospheric circulation and creates weather systems unique to the canyon [20,21]. Vast sediment accumulations have formed on its floor, whose geochemical signature attests to standing bodies of water in the past [9,21,22,23,24]. Giant rock avalanches have affected the walls throughout its history, e.g., [25,26,27,28], and whose study has been influential in understanding landslides throughout the Solar System [29,30,31]. The Valles Marineris also host a particularly high concentration of Recurring Slope Lineae (RSL, e.g., [32]), which could be signs of liquid water seeps at the present-day [33]. These low albedo streaks are diminutive compared to the canyon, being that they usually only attain hundreds of metres in length for metres to tens of metres in width. Their downslope growth during the warmest times of year and annual fading strongly suggests the involvement of liquid water, which is usually unstable under current Martian conditions. Studying the examples in Valles Marineris has been key to understanding the conditions required for RSL growth and their seasonality with different slope expositions [32,34,35,36].
3D mapping is essential to improving our understanding of the geology and geomorphology of Valles Marineris. A key aspect of this mapping is to construct a base-map of co-aligned 3D and mosaiced terrain-corrected images covering the area.
One of the options is to employ the Mars Orbiter Laser Altimeter (MOLA) Digital Terrain Model (DTM) [37] which provides global 3D information of Mars at a resolution of 463 m/pixel. However, the inter-track spacing of MOLA tracks is ~4 km at the equator so such a DTM contains many interpolated points. While the MOLA DTM at 463 m/gridpoint is considered to be the most precise topographic map of Mars to date and provides nearly 100% coverage of the planet, we believe the better option is to exploit co-aligned High Resolution Stereo Camera (HRSC) [38] stereo products at a much higher spatial resolution. HRSC is now on its 20,000+ orbits aboard Mars Express imaging and has covered ~98% of the Martian surface at a spatial resolution higher than 100 m/pixel. The German Aerospace Centre (Deutsches Zentrum für Luft- und Raumfahrt; DLR) processes HRSC stereo images to level 4 (see http://europlanet.dlr.de/fileadmin/pictures/hrsc/HRSC_Fact_Sheet_V5.pdf (accessed on 21 March 2021)) DTMs, at 50–150 m/pixel resolution, which now cover ~50% of the planet’s surface. At Valles Marineris, the DLR HRSC level 4 strip DTMs cover a large proportion of the canyons, leaving only a few gaps of unprocessed or not acquired orbital strip data. However, it should be noted that Valles Marineris also suffers from frequent fog events, obscuring part of the valley bottom, making the DTM production process difficult for some of the single-strip stereo images at this area.
In this work, we filled the gaps in the pre-existing DLR-generated HRSC products by creating a further 11 HRSC single-strip DTMs and Ortho-Rectified Images (ORIs), hereafter referred to University College London (UCL) level 4 DTMs/ORIs, using HRSC level 2 (radiometrically-calibrated but not map-projected; http://europlanet.dlr.de/fileadmin/pictures/hrsc/HRSC_Fact_Sheet_V5.pdf (accessed on 21 March 2021)) stereo images. These UCL level 4 DTMs and ORIs were then co-registered with the existing DLR HRSC level 4 DTMs and ORIs to allow seamless mosaicing of the whole of Valles Marineris. A key component is to ensure that all DTMs have a common reference system, which in our case is the MOLA DTM. The UCL and DLR HRSC level 4 DTMs are co-aligned with the MOLA DTM to provide precise topographic information for future geological studies.
The 3D reconstruction pipeline employed in our work is a hybrid version of CASP-GO, which was developed within the completed EU FP-7 iMars (http://www.i-mars.eu (accessed on 21 March 2021)) project for NASA Mars Reconnaissance Orbiter (MRO) ConTeXt camera (CTX) and High Resolution Imaging Science Experiment (HiRISE) stereo images. The UCL CASP-GO DTM system was previously used to produce planet-wide CTX DTMs [39]. In this work, we improve the original CASP-GO CTX pipeline to produce optimised HRSC DTMs. Moreover, rather than employ bundle block adjustment, which requires specialist photogrammetry skills and processing of a bundle of data together, we employ a more brute force approach here given that a global reference 3D model and existing DLR level 4 products exist. This is performed using a method familiar from terrestrial laser scanning which employs 3D point cloud alignment and is performed in parallel with feature-based matching of images to ensure global congruency. After processing overlapping 3D information and co-registering overlapping images with existing HRSC level 4 DTMs, ORIs, and MOLA data, we have been able to build a seamless HRSC DTM mosaic that covers the whole of Valles Marineris.
Finally, HRSC level 4 and the newly processed ORIs are Lambertian reflectance corrected and brightness-referenced to a global albedo map produced by the Thermal Emission Spectrometer (TES) on the Mars Global Surveyor (MGS) [40]. This allows us to bring the HRSC image strips into mutual consistency of absolute surface brightness despite variations in atmospheric optical scattering at different observation times to achieve a near-seamless mosaic [41].
The rest of this paper is structured as follows. In Section 1.1, we review the datasets employed and the relevant previous work follows in Section 1.2. In Section 2.1, details of the input and reference data are provided. From Section 2.2, Section 2.3, Section 2.4, Section 2.5 and Section 2.6, we describe technical details step-by-step for all the methods that are involved in this work, in the order of single-strip HRSC DTM production, HRSC-to-HRSC and HRSC-to-MOLA 3D co-alignments and mosaicing, HRSC ORI production, and subsequent photometric correction and mosaicing of ORIs. In particular, Section 2.2 reviews the CASP-GO pipelines which are used as backbone 3D mapping software in this work. In Section 2.3, we introduce the hybrid HRSC DTM processing chain for single-strip HRSC DTM production, followed in Section 2.4, by an introduction into the joint 3D and image co-registration processing chain for HRSC-to-HRSC and HRSC-to-MOLA co-alignment. In Section 2.5, we introduce the automated image co-registration and orthorectification method, followed in Section 2.6, with the ORI photometric correction and subsequent mosaicing. The final resultant DTM and ORI mosaic are shown in Section 3, along with quality and accuracy evaluations, and data access information. Issues or limitations of the proposed methods and resultant products are discussed in Section 4. Finally, in Section 5, we summarise the work presented and examine some possibilities for the future.
1.1. Datasets
In this work, we use the MOLA areoid (https://pds-geosciences.wustl.edu/missions/mgs/megdr.html (accessed on 21 March 2021)) data as our baseline reference system (both spatially and vertically). MOLA (from 1997 to 2001) was one of the five instruments onboard MGS that measured the time-of-flight of laser pulses at 1064 nm, over the distance from the spacecraft to the Martian surface. Individual MOLA laser tracks were interpolated and extrapolated, and corrected, by the MOLA team to produce a global DTM of Mars at 463 m grid spacing [37], which is available through the NASA Planetary Database System (PDS; https://pds-geosciences.wustl.edu/missions/mgs/megdr.html (accessed on 21 March 2021)).
The HRSC stereo imaging instrument onboard the ESA’s Mars Express (MeX) spacecraft is still orbiting Mars having acquired its first images in January 2004. HRSC was designed for photogrammetric mapping of the topography of the Martian surface via continuous acquisition of stereo push-broom images from multiple angles on a single orbital pass. HRSC captures multi-angular and multi-colour images mostly at 12.5–100 m pixel-scale over various swath-widths, providing near global (~98%) coverage of the Martian surface at 12.5–100 m/pixel. The DLR processed HRSC level 4 DTMs cover as of the time of submission ~50% of the Martian surface. In this work, we use the HRSC level 2 stereo images for UCL level 4 DTM processing and the DLR HRSC level 4 DTMs (version 50 and higher) [42] for co-registration, co-alignment with MOLA, and mosaicing. It should be noted that only the nadir image is captured at 12.5 m with the off-nadir stereo channels usually captured 2 times coarser at 25 m.
1.2. Previous Work
In [39], we previously compared the quality and performance of CTX DTMs produced using different existing planetary 3D reconstruction software and introduced the CASP-GO system, which is based on the open-source NASA Ames Stereo Pipeline (ASP) [43], tie-point based multi-resolution image co-registration [44], the Gotcha [45] sub-pixel refinement method, and other optimisation algorithms. The CASP-GO system produces high quality DTMs in terms of improved completeness and accuracy, as well as minimising matching and interpolation artefacts.
For HRSC data, DLR generate HRSC single-strip DTMs [42] in a sinusoidal projection system at 50–150 m grid-spacing for level-4 products. More recently, DLR have developed a level-5 processing chain to produce a large (>100 strip) HRSC DTM mosaics with the Leibniz University of Hanover and Free University of Berlin (FUB) for several United States Geological Survey (USGS) quadrangles (http://hrscteam.dlr.de/HMC30/ (accessed on 21 March 2021)) including the MC11 (0–30° N, 0–45° W) map quadrangle in an Equidistant Cylindrical projection system at 50 m grid spacing. For the Valles Marineris area, which is mainly in the MC18 (0–30° S, 45°–90° W) quadrangle and partially in the MC17 (0–30° S, 90°–135° W) and MC19 (0–30° S, 0–45° W) quadrangles, there are 71 pre-existing DLR HRSC level 4 single-strip DTMs available on the ESA-PSA site.
DLR processing of the raw HRSC level-2 data includes radiometric de-calibration, noise reduction, image matching, geo-referencing, photogrammetric processing and along-track Bundle Adjustment (BA). The final products are labelled as “Level-4 v50+” when they reach a satisfactory level of quality [42]. The co-registration of HRSC DTM and MOLA DTM is checked using average height differences and usually reveal residual horizontal offsets smaller than the grid spacing of the HRSC DTM and residual vertical offsets below 10 m [42]. In addition, bundle block adjustment and joint interpolation of multi-scale 3D point data sets are used for DTM mosaicing. For the ORI mosaic, [46] describes the standard DLR method using single strip scaling (to calibrated radiances), brightness normalisation according to Lambert reflection, and local contrast adjustment and brightness adjustment to the MGS’s TES albedo [39,41].
Another related work on wide area HRSC DTM/ORI production and mosaicing is [47], in which the authors demonstrated the production of a HRSC DTM and ORI mosaic for the south polar region using the DLR/NASA VICAR (https://www-mipl.jpl.nasa.gov/vicar_os/v1.0/vicar-docs/VICAR_guide_1.0.pdf (accessed on 21 March 2021)) based pipeline and brightness correction through a high altitude HRSC reference image as well as the use of the 128 m/pixel MOLA DTM to provide height normalisation. In this previous work, individual HRSC orbital strips were separately bundle-adjusted by FUB due to little coverage of DLR HRSC products [47].
2. Materials and Methods
2.1. Data Preparation
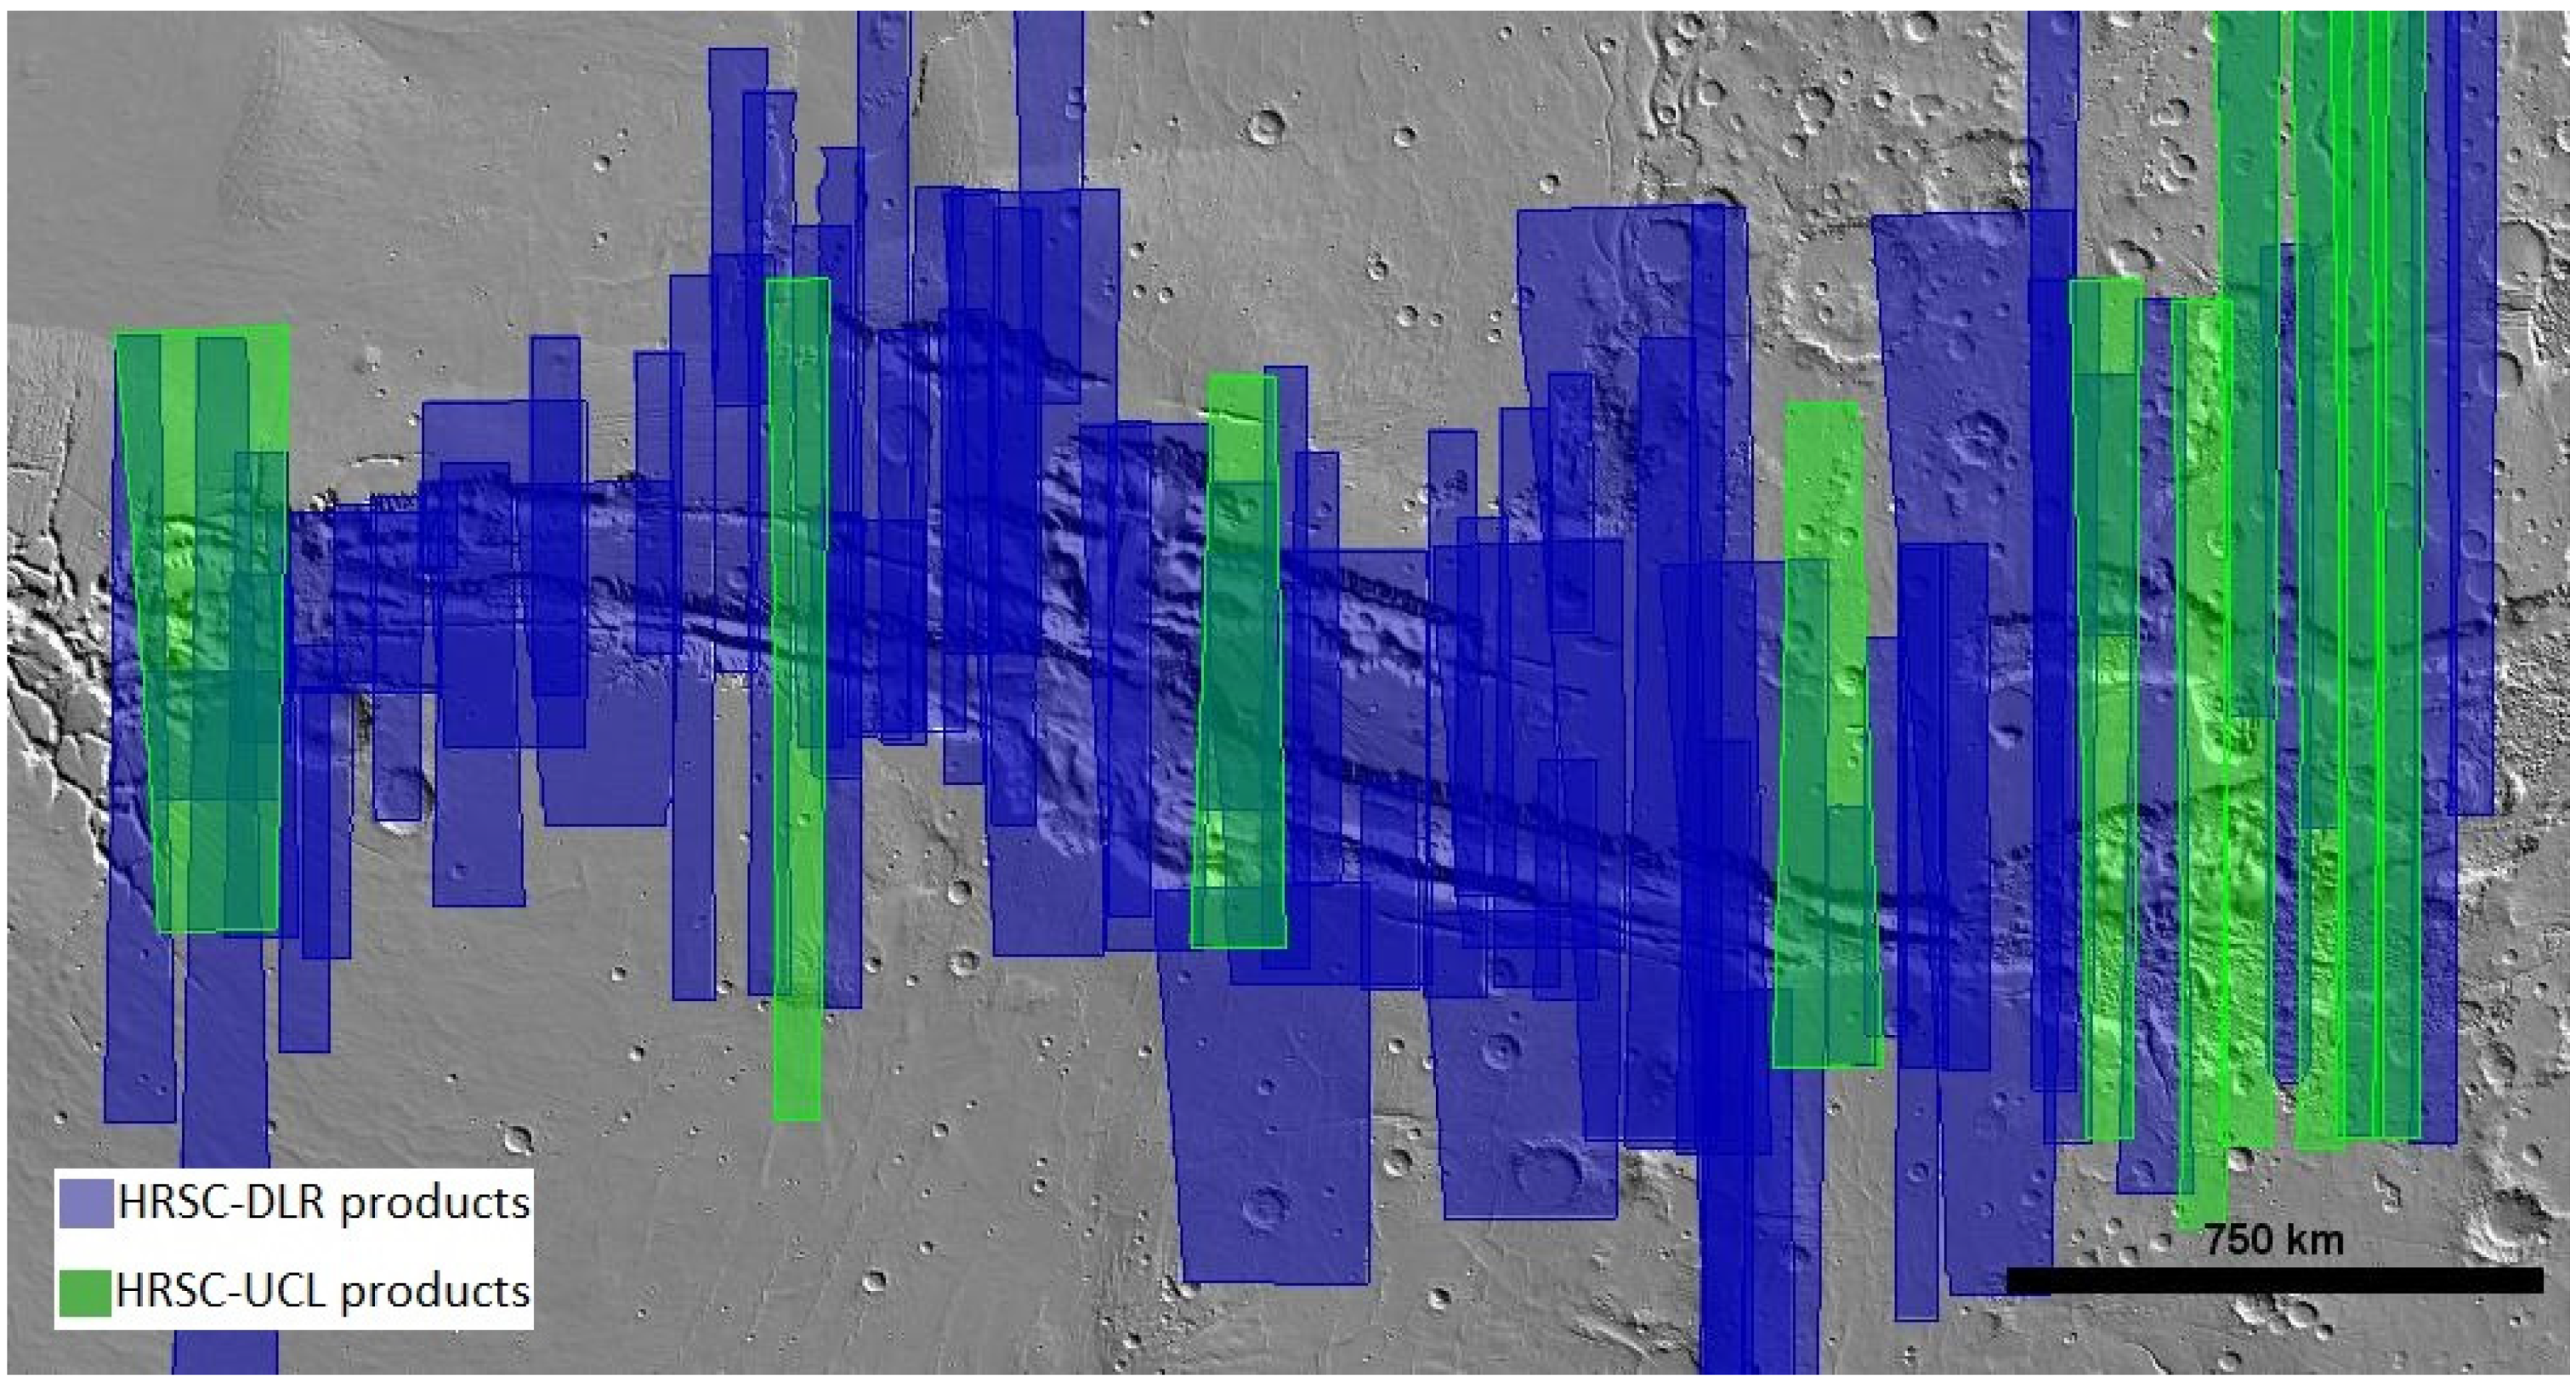
For HRSC, 71 DLR processed HRSC level 4 DTMs and ORIs were available until April 2020. These include 57 with DTMs at 50 m/pixel and ORIs at 12.5 m/pixel; 6 with DTMs at 100 m/pixel and ORIs at 25 m/pixel and 8 with DTMs at 150 m/pixel and ORIs at 50 m/pixel. A list of the image IDs with download links are provided as Supplementary Material. The 71 DLR HRSC level 4 DTMs cover most of the Valles Marineris region but leave several significant gaps. Therefore, we checked all available HRSC level 2 images and selected a set of 11 HRSC level 2 stereo pairs at 12.5 m/pixel to be processed to DTMs and mosaiced at 50 m/pixel. The corresponding level 2 HRSC orbit IDs are h2112_0000, h2123_0000, h2134_0000, h2211_0000, h2145_0000, h2178_0000, h1896_0000, h0438_0000, h3195_0000, h2182_0000, h2402_0001. The image footprints of the HRSC DLR products and UCL products are shown in Figure 1.
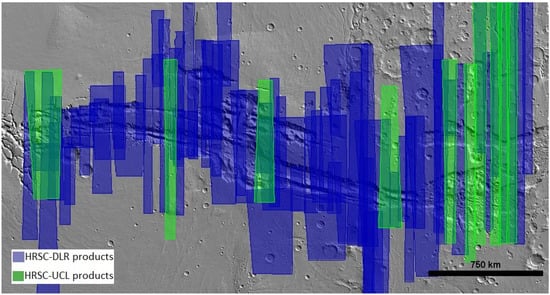
Figure 1.
Image footprints showing coverage of the DLR HRSC level 4 products and level 2 images (UCL processed level 4 products) at Valles Marineris.
2.2. The ASP and CASP-GO Auto-DTM Generation System
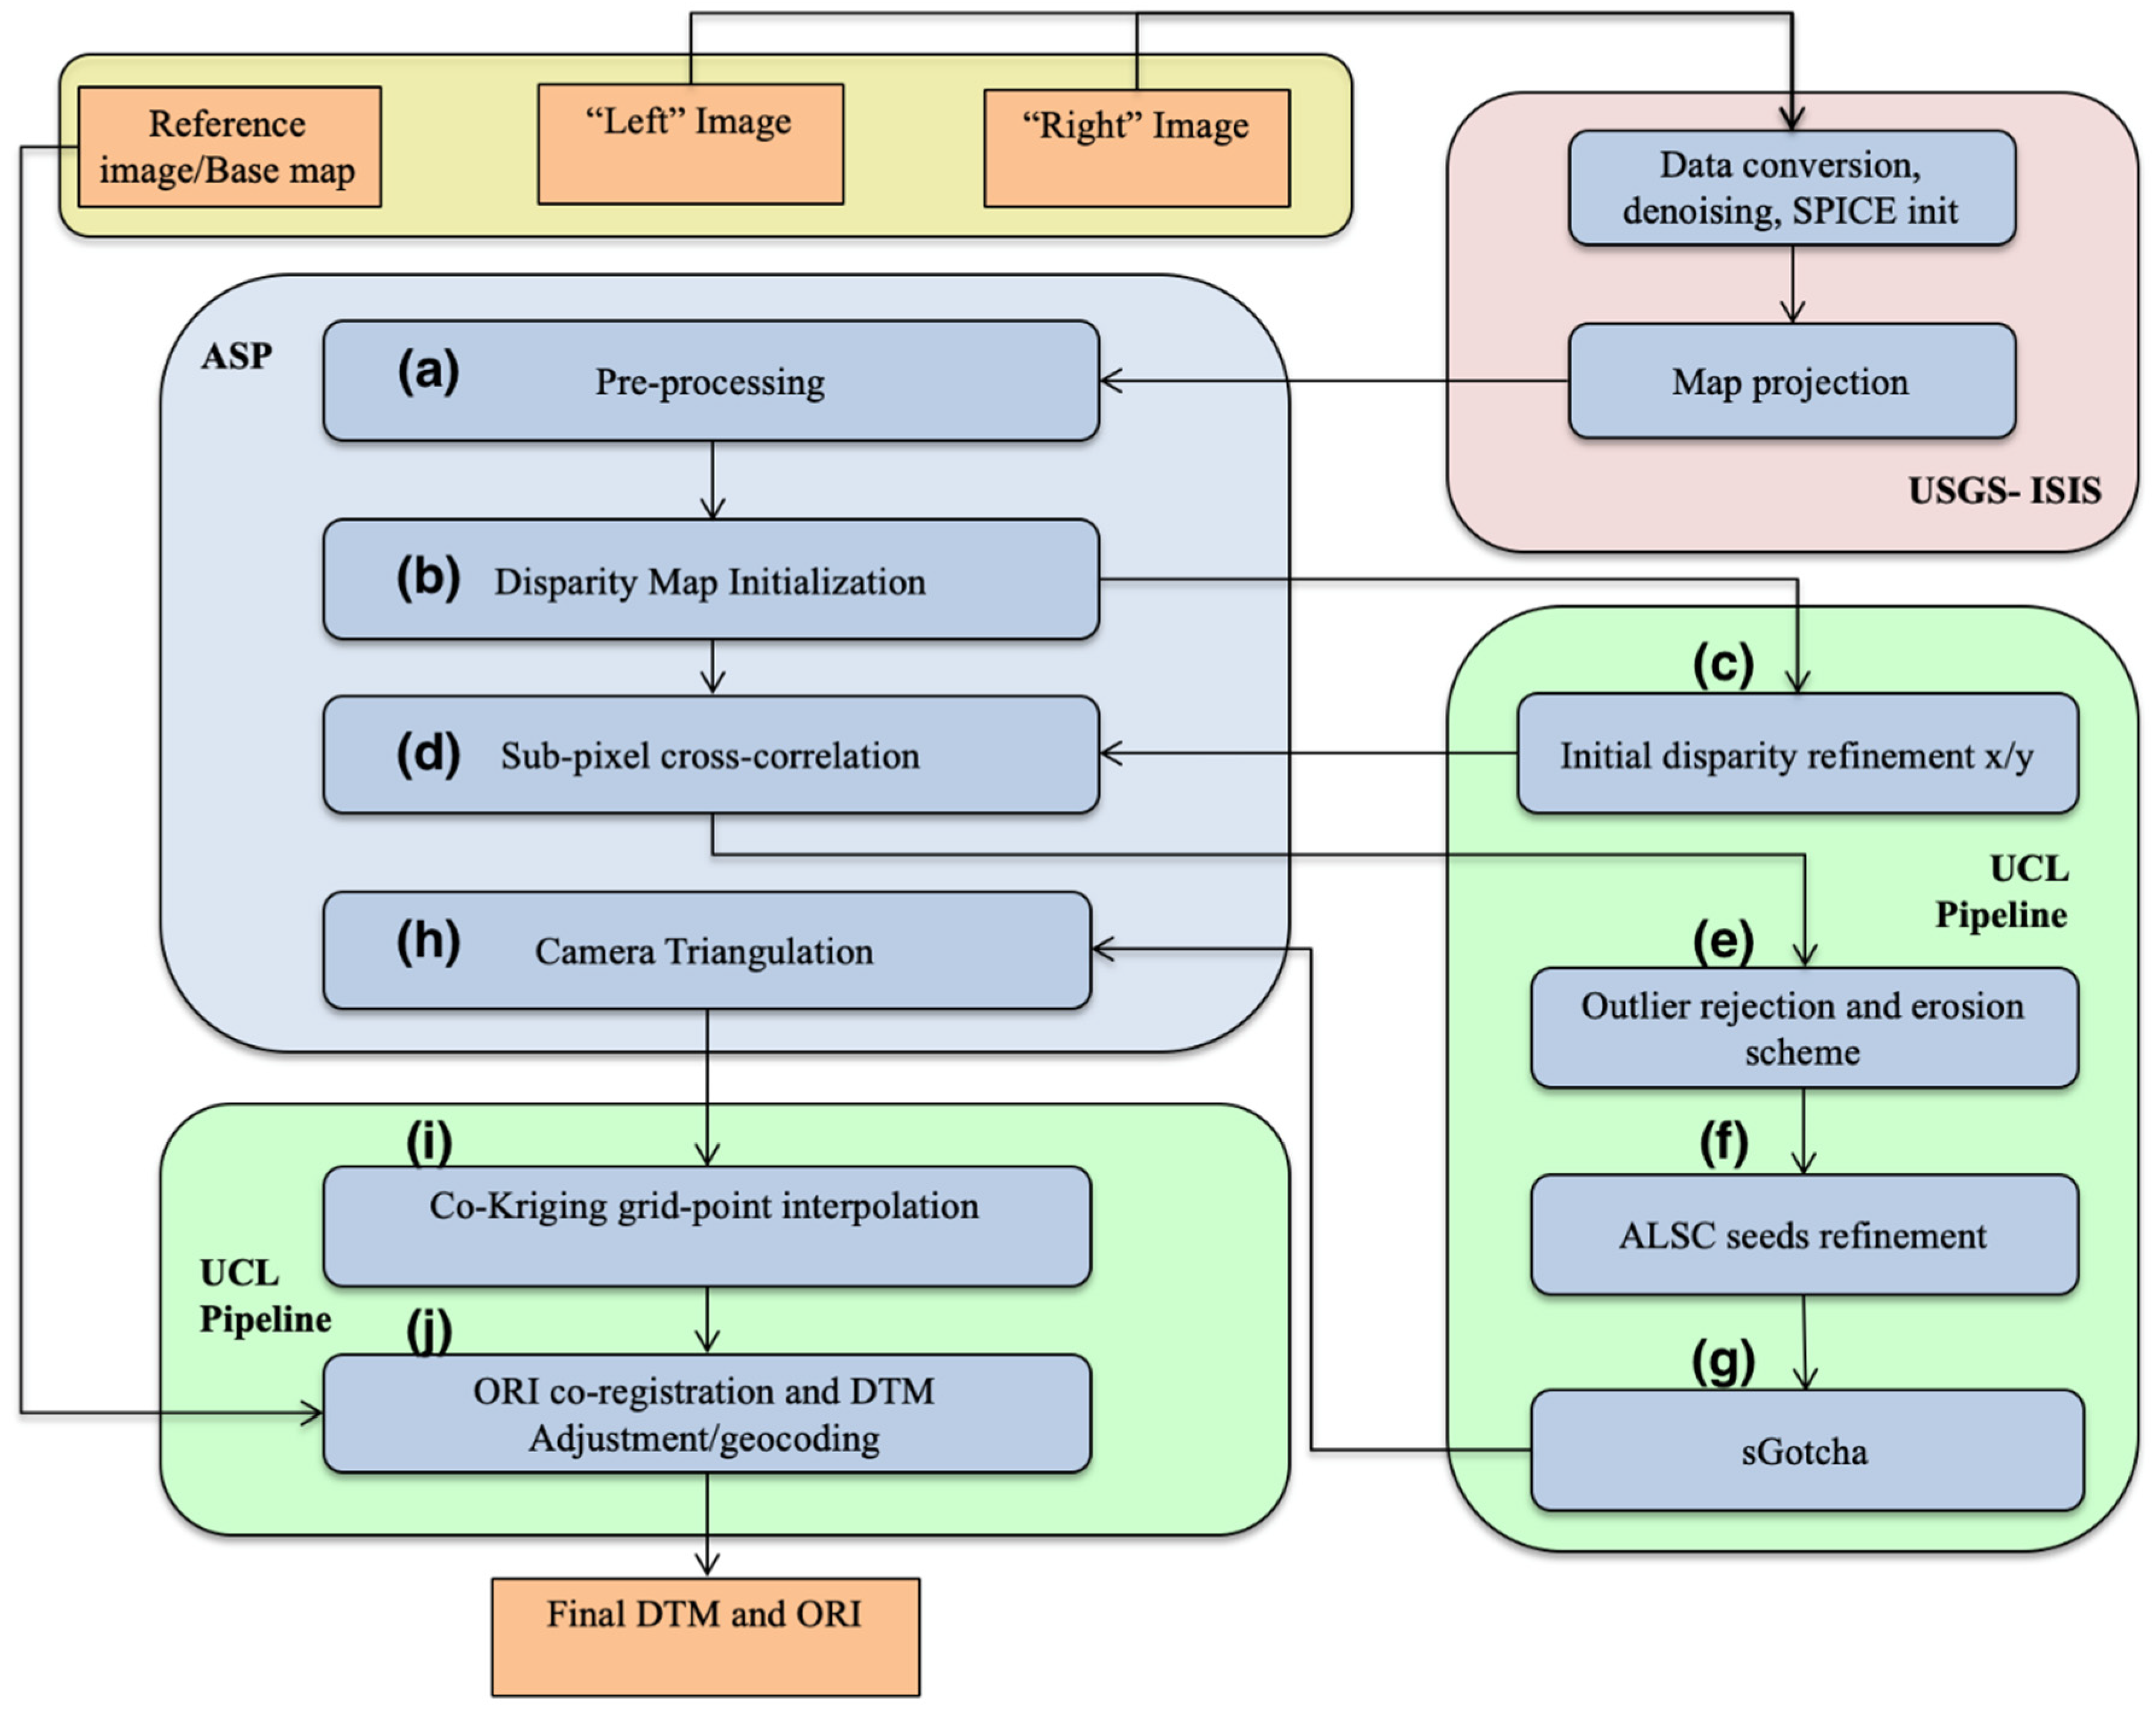
The Ames Stereo Pipeline (hereafter referred to as ASP) software was developed by the Intelligent Robotics Group at the NASA Ames Research Center, Mountain View, CA [43]. ASP is a suite of open-source automated geodesy and stereo-photogrammetry tools designed for processing planetary imagery captured either from planetary (robotic) orbiters or landers or from Earth observing satellites. The CASP-GO pipeline is based on the ASP framework with specific enhancements, dealing with matching artefacts, gaps, and co-alignment issues, from in-house software previously developed at the Imaging Group at UCL. CASP-GO uses the ASP I/O interface and takes USGS Integrated Software for Imagers and Spectrometers (USGS-ISIS) formatted stereo images (see Figure 2; see explanation of the USGS-ISIS Cube format in https://isis.astrogeology.usgs.gov/documents/LogicalCubeFormatGuide/LogicalCubeFormatGuide.html (accessed on 21 March 2021)) and a reference base map as inputs. Converting from raw HRSC PDS data into the USGS-ISIS formatted Cube includes the process of format conversion, image pre-denoising, SPICE (see https://naif.jpl.nasa.gov/naif/spiceconcept.html (accessed on 21 March 2021)) kernel initialisation, and map projection processes (see https://isis.astrogeology.usgs.gov/Application/index.html#Mars_Express (accessed on 21 March 2021)). The core matching algorithm uses a combination of cross-correlation and a 5 th generation of adaptive least squares correlation (ALSC) and region growing matcher called Gotcha [45], which provides accurate and robust sub-pixel conjugate points.
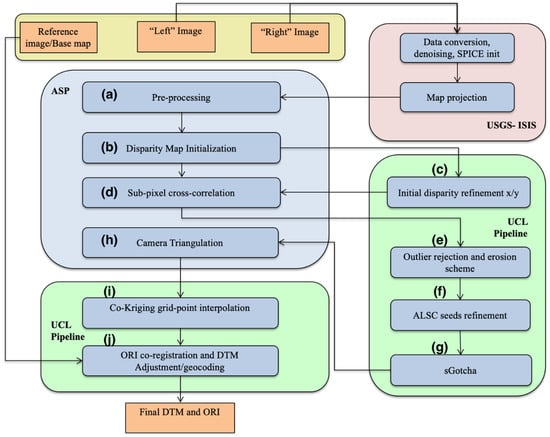
Figure 2.
Flow diagram of the UCL CASP-GO auto-DTM processing system. Grey indicates the ASP system, green for UCL processing, and pink for USGS-ISIS processing.
The complete CASP-GO workflow (see Figure 2) for DTM production includes the following 10 steps which are shown in the aforementioned figure and described as follows: (a) ASP image pre-processing including image enhancement (e.g., Laplacian of Gaussian filtering and image normalisation) and stereo rectification; (b) ASP disparity map initialisation using coarse cross-correlation; (c) UCL fast Maximum Likelihood (f-ML) matching and the construction of a “float” initial disparity map; (d) ASP Bayes Expectation Maximisation (EM) weighted affine adaptive sub-pixel cross-correlation; (e) UCL re-defined outlier rejection and gap erosion scheme to detect, remove and eliminate mis-matched and unreliable disparity values; (f) UCL ALSC sub-pixel refinement for previous matches; (g) UCL Gotcha based densification method for filling-in disparity gaps; (h) ASP camera triangulation and DTM creation; (i) UCL co-kriging grid-point interpolation and calculation of height uncertainties for interpolations; (j) UCL ORI co-registration/geocoding with reference to the input base map and DTM adjustment. A detailed description of each of these processing steps can be found in [39]. This processing chain operates without any user interaction and was shown in [39] to be sufficiently robust that it worked without any manual intervention for over 5000 CTX stereo-pairs.
2.3. The Hybrid Stereo Processing Chain
As previously mentioned in [39], different DTMs from different stereo pipelines always display different kinds of matching artefacts or gaps. Although these can be partially reduced with down-sampling and interpolation, minimising matching artefacts and better matching coverage are the keys to obtain a high quality DTM with the best possible resolution (finest details).
The quality of the final disparity map used for camera triangulation dominates the quality of the final DTM and is mostly determined by the matching blocks in a DTM pipeline. As the stereo matching algorithms have become more mature over the past decade, practical matching issues mostly come from one or more natural issues of the stereo inputs, for example, robustness to illumination differences, noise level differences, changes or degradations in surface textures, a good stereo convergence angle, and the differences in their native resolutions (although raw images are generally resampled to a fixed resolution in planetary imaging, the individual image clarity still varies within the same instrument over the same region). How well a stereo matching algorithm can handle these different types of input issues ultimately determines the quality of the resulting DTM. Although some matching algorithms are more robust to bad quality inputs or differences in image conditions, there is not a single algorithm that can handle all different types of input issues.
In particular, the ASP Bayes EM optimised cross-correlation matching method is a collection of algorithms that are based on image cross-correlation but has been augmented and tuned in efforts to produce more accurate results and obtain robustness over many different input issues. These optimisations, on top of the general “cross-correlation” method, include a coarse-to-fine (pyramidal) approach, filtering, segmentation (tiling), searching-range optimisation that are based on pre-processing feature matching, and finally the Bayes EM subpixel refinement to adapt to affine and noise variations. The ASP Bayes EM optimised cross-correlation matching method has shown robustness to image noise and good performance on semi-low to highly textured areas, but it is more likely to be affected by the differences in local lighting conditions and contrast, and has poor performance on very-low to non-textured regions (e.g., strongly shaded regions). Also, the ASP Bayes EM optimised cross-correlation matching method is generally robust to many different planetary observation instruments but has some inherent issues from the local (window-based) matching methods, such as block (staircase) artefacts.
On the other hand, the ASP More Global Matching (MGM) method is based on the semi-global matching (SGM) algorithm [48] and the original MGM algorithm that is described in [49]. MGM has been optimised during its implementation in ASP, in terms of 2 D disparity search (instead of 1 D search), multi-resolution hierarchical search, and smoothing of high frequency artefacts for textureless regions. The ASP MGM based matching method has shown less robustness to different instruments (compared to Bayes EM optimised cross-correlation) but has very high matching accuracy and good performance on textureless regions as well as steep slopes. Also, the ASP MGM based matching method has shown higher robustness to handling differences in lighting conditions and contrasts, however, it may produce seam artefacts and diagonal artefacts for large (continuous) low textured regions.
Finally, the UCL Gotcha matcher [45], which was introduced in [39] as a complementary matching algorithm to the ASP Bayes EM optimised cross-correlation matching method, starts from a group of MSA-SIFT “corner” features and gradually grows to their neighbouring pixels with local constraints. The Gotcha matcher is not suitable for global matching due to its high computational cost but is able to produce high accuracy matching results for small images/regions. The Gotcha matcher often produces over-smoothed results on low textured regions, but on the other hand, has shown robustness to local illumination differences, perspective degradations, and a sub-optimal stereo convergence angle. Also, there is no known systematic artefact from Gotcha [45] but it requires a clean (artefact-free) initial matching result as input (from tie-points or other stereo matching disparity maps).
In this work, we experimented with a hybrid method based on CASP-GO and the ASP’s new MGM matcher in order to try to exploit the strengths of different matching algorithms whilst minimising the artefacts to produce the best possible quality DTM. The three matching algorithms in the proposed hybrid method contain two local methods and one global method. They provide solutions for different conditions and difficult regions of HRSC stereo images. Although it may not always be feasible to have three parallel algorithms in a general 3D mapping task, the proposed hybrid method has demonstrated better overall performance compared to the three methods alone.
The proposed HRSC hybrid DTM processing chain follows the standard USGS-ISIS/ASP data I/O methods and takes ISIS formatted HRSC level 2 stereo images as inputs. The same ASP pre-processing methods that were described in [43] and more specifically in [39] are also used.
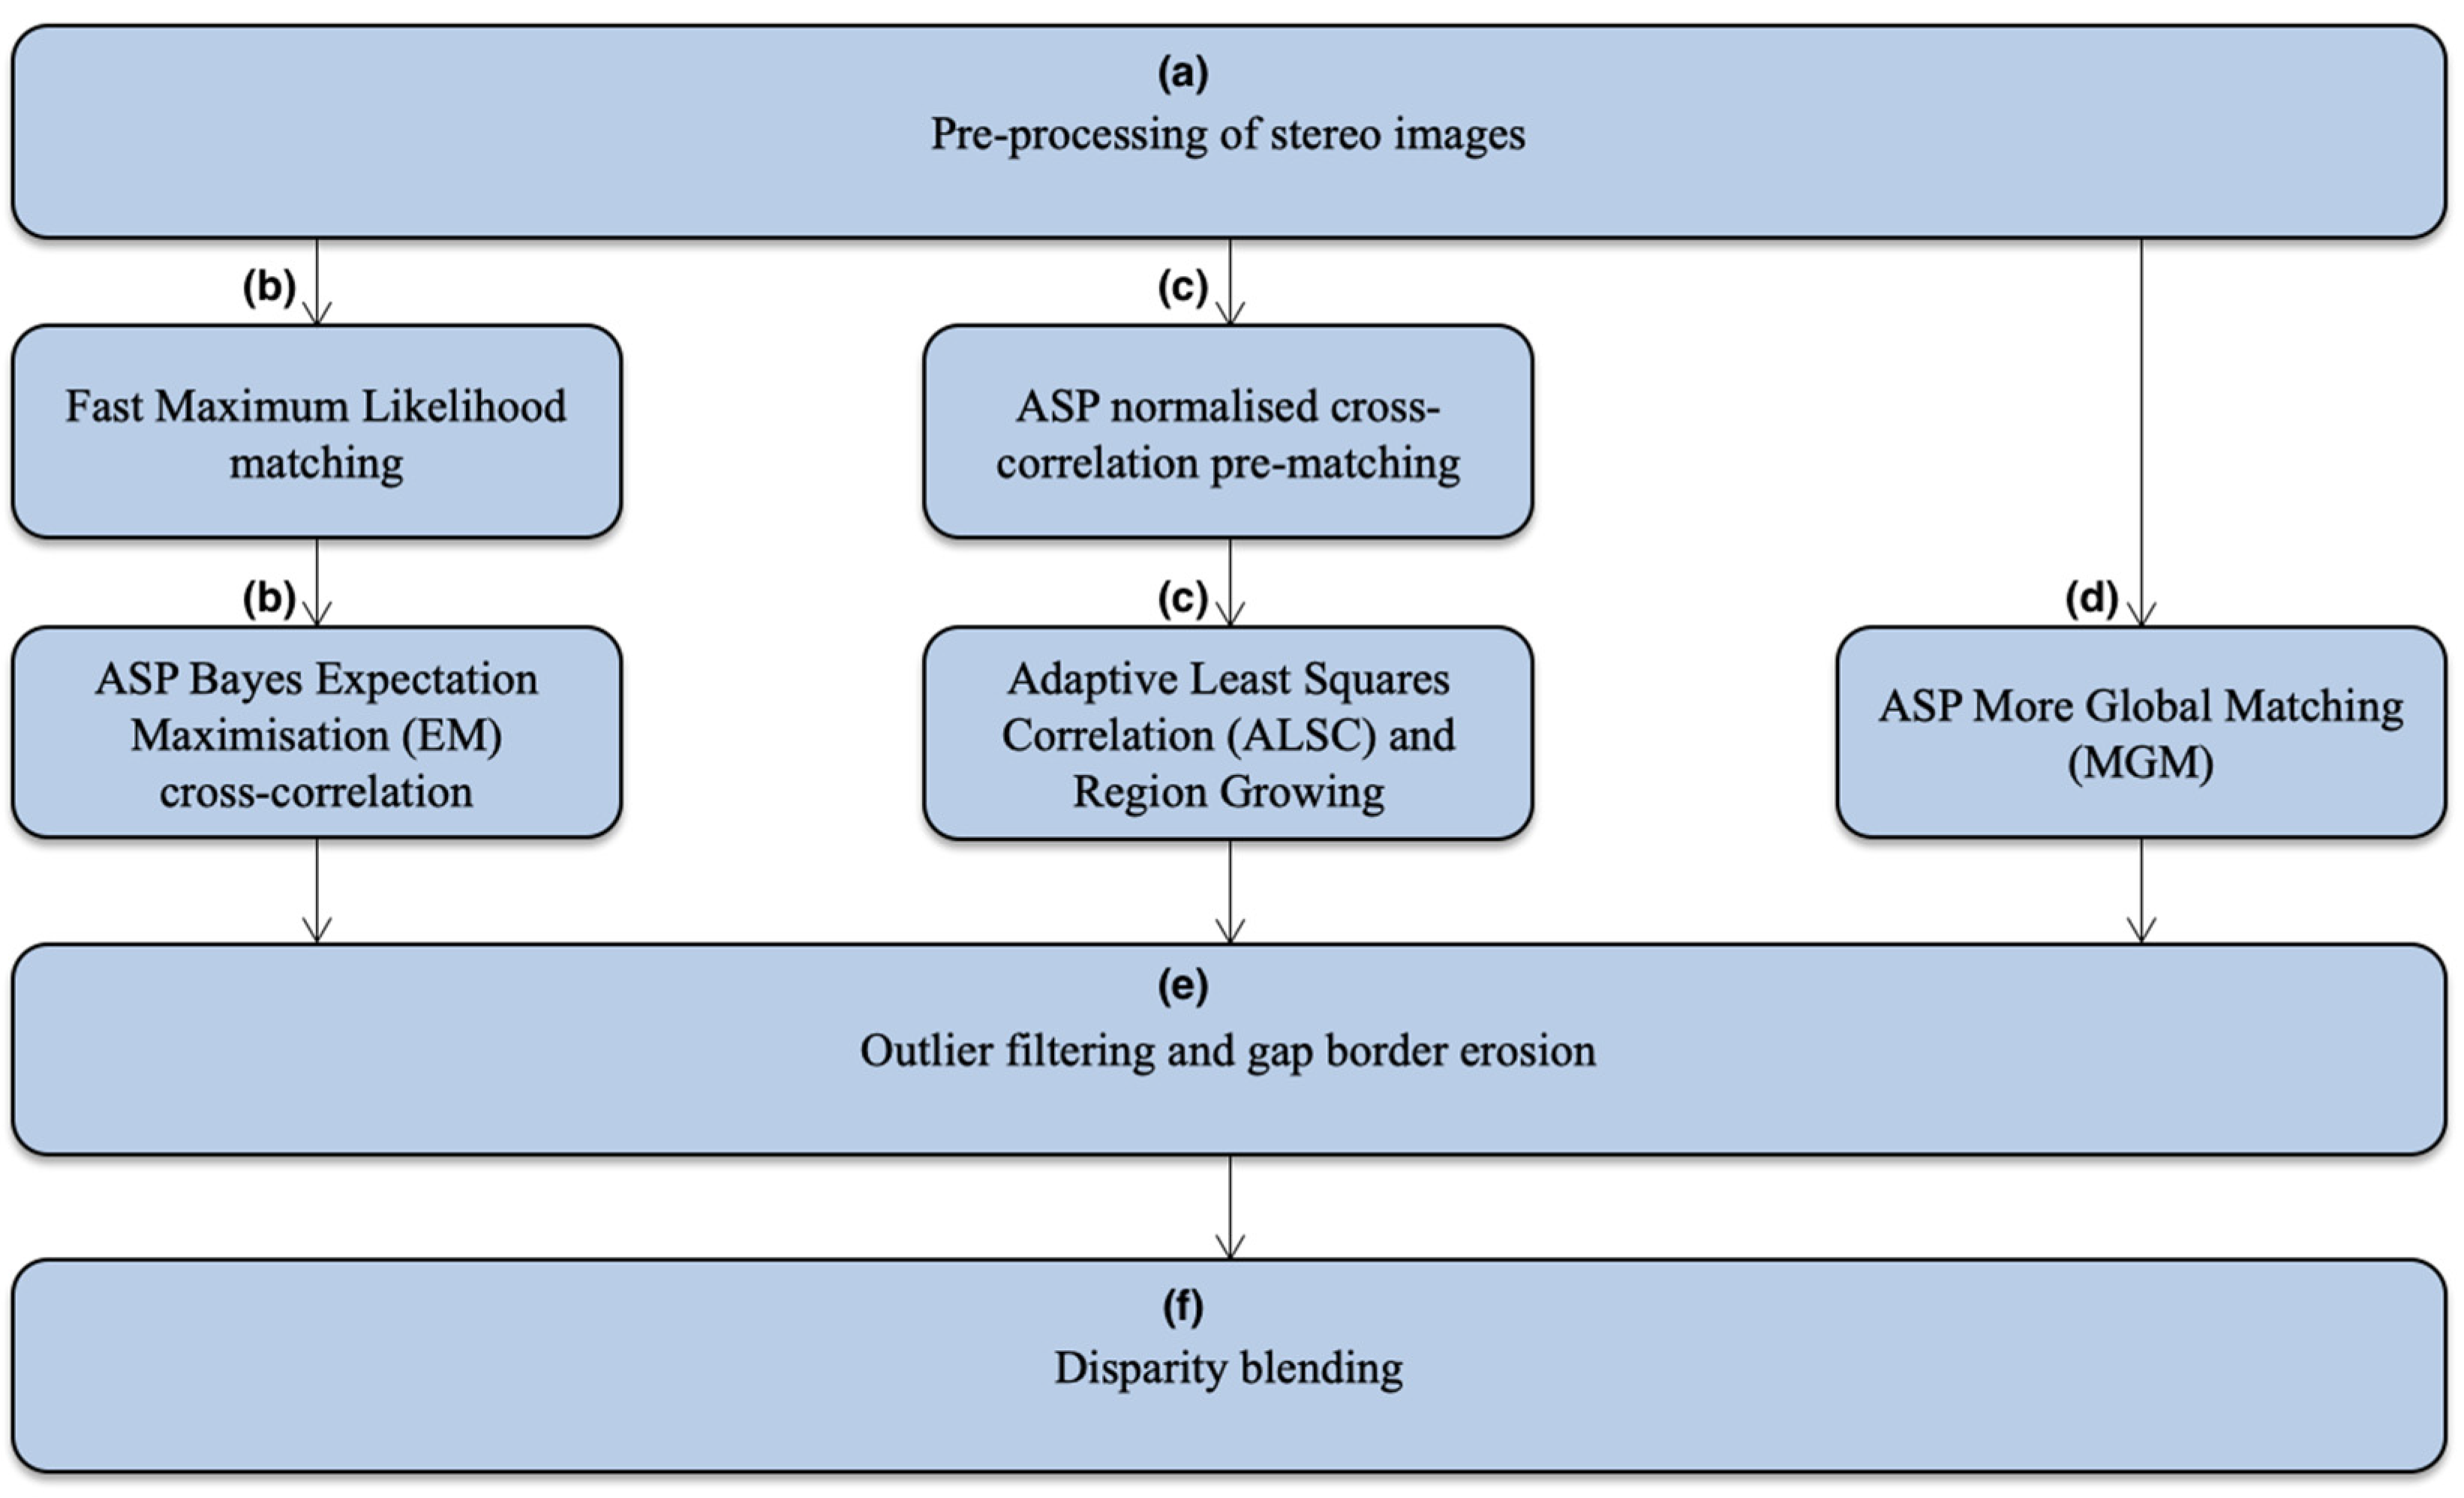
The complete HRSC hybrid DTM processing chain, is shown in Figure 3, and has the following 6 steps, replacing the original steps (a) to (g) in Figure 2: (a) ASP stereo pre-processing (image normalisation, Laplacian of Gaussian filtering, initial feature matching to decide a searching range); (b) application of the fast-Maximum Likelihood (f-ML) matching to build a “float” initial disparity map (see [39] for more details) and then application of the ASP Bayes EM weighted affine adaptive sub-pixel cross-correlation matching to refine the disparity map; (c) in parallel to (b), Gotcha matcher is applied based on an initial disparity map created from the ASP Normalised Cross-Correlation (NCC) method; (d) in parallel to (b) and (c), the ASP MGM matcher is directly applied to the pre-processed stereo inputs; (e) application of a slightly stricter outlier filtering and border erosion scheme to remove potential bad-matches, as we have three disparity maps from three matching methods in parallel; (f) finally, the three disparity maps are blended together using a “closest-to-median” scheme (described in the next paragraph). Note that the closest-to-median blending is able to discard a bad-match by considering the three matching results and neighbouring disparities but is highly dependent on (e) to discard the majority of bad-matches.
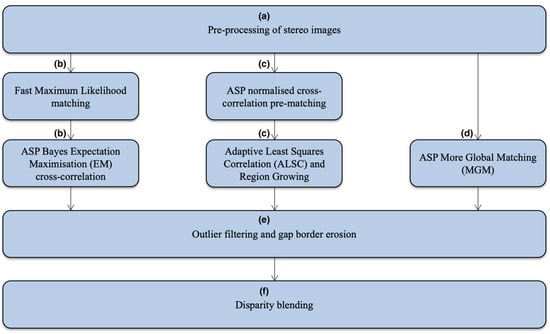
Figure 3.
Flow diagram of the HRSC hybrid DTM processing chain using a combination of cross-correlation (ASP), Gotcha (UCL), and MGM (ASP). Note that this flow diagram expands step (a) to (g) of Figure 2.
The closest-to-median blending scheme can be described in the following steps: (a) for any given pixel at (x,y), we have three X-direction disparity values, denoted as dx_1(x,y), dx_2(x,y), dx_3(x,y), and three Y-direction disparity values, denoted as dy_1(x,y), dy_2(x,y), dy_3(x,y), from the three disparity maps; (b) Sort the three x disparity values into each of their 8 adjacent (neighbouring) disparity values. Note that any of the disparity values and their 8 nearest neighbours could be “Nodata” if the matcher fails at that location or at a neighbouring location. “Nodata” is not counted in later steps; (c) Forcibly remove 4 “outliers” that are present at the two ends of the sorted vector from (b) and calculate a median; (d) Any of the three X-direction disparity values, i.e. dx_1(x,y), dx_2(x,y), dx_3(x,y), that are closest to the median from (c) is set as the final blended disparity value. If any of them is “Nodata” or was removed at (c), they will not be counted in this step. If all three of dx_1(x,y), dx_2(x,y), dx_3(x,y) are “Nodata” or were removed at (c), the median value calculated at (c) will be set as the final disparity value for this pixel; (e) Repeat (b)–(d) for Y-direction disparities.
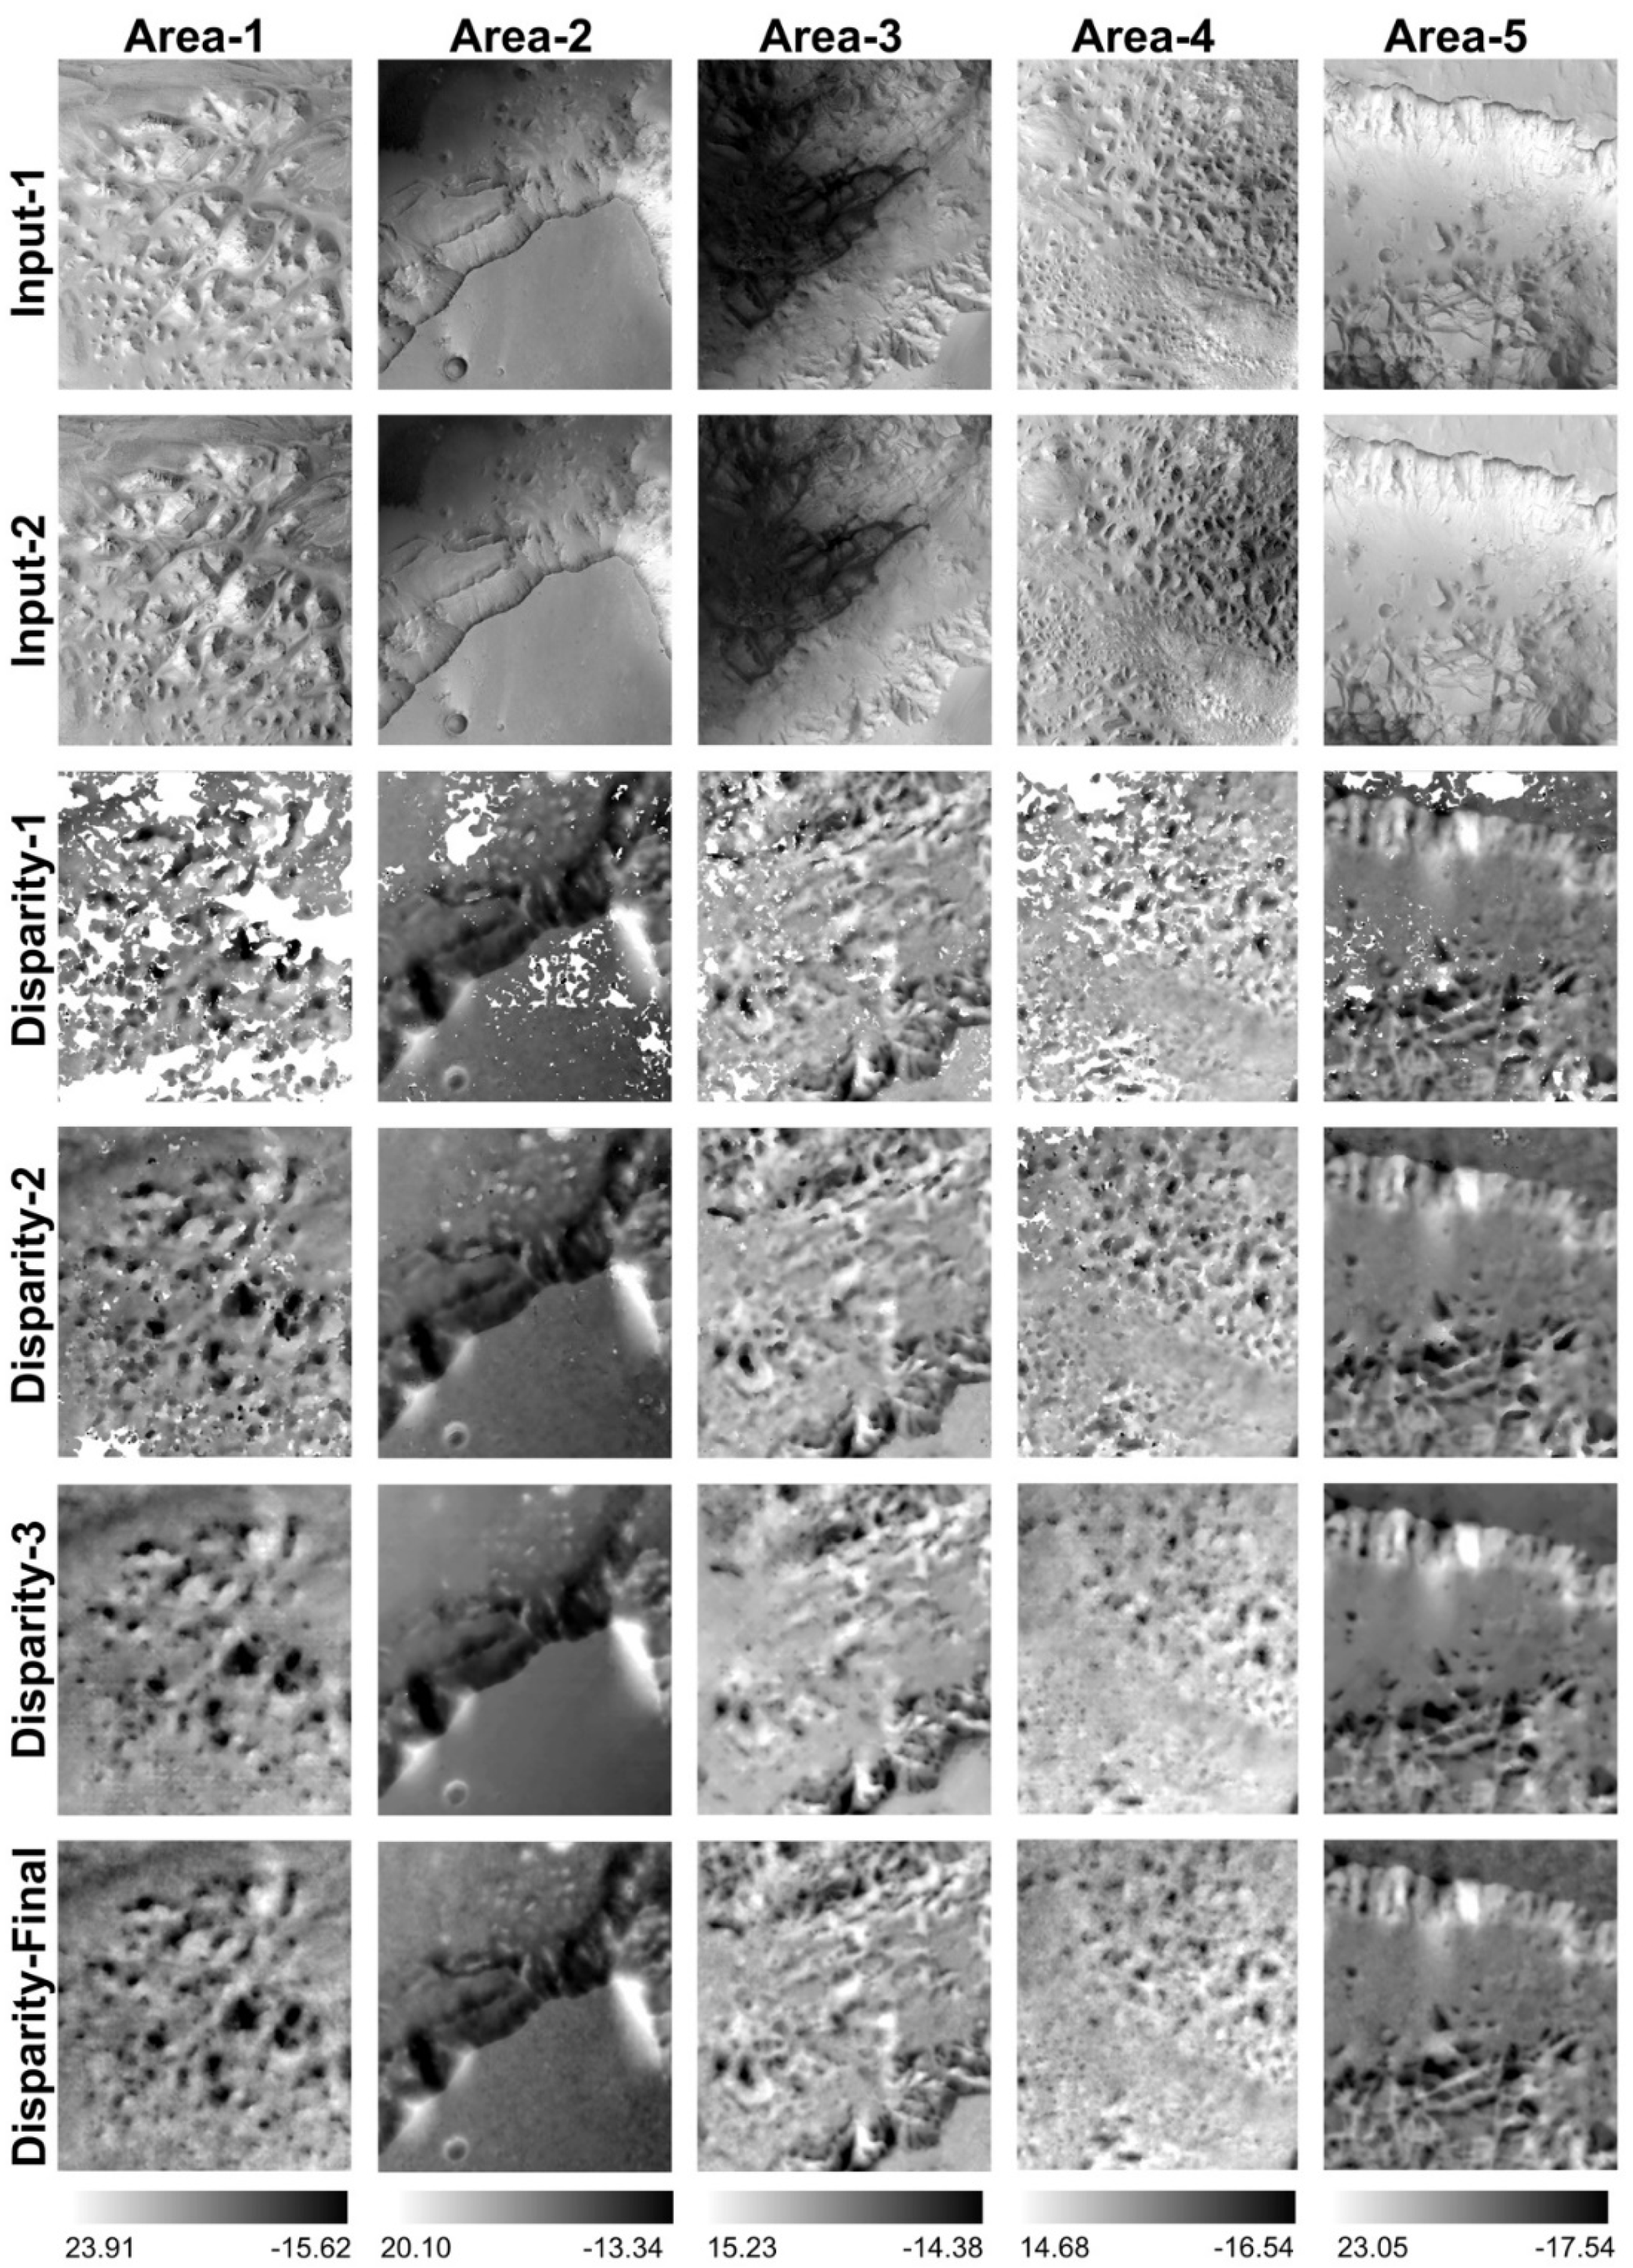
The advantages of using the hybrid matching system are demonstrated in Figure 4 for 5 different areas that are cropped from one of the HRSC single-strip (h2145_0000) stereo images displaying the X-direction disparity maps (dx) as examples. These examples show different characteristics of the stereo inputs, including (Area-1) hills and dunes with illumination differences and high noise-levels; (Area-2) low-textured flat surfaces, cliffs with good contrast, and small and medium sized craters; (Area-3) heavily shaded regions and steep slopes; (Area-4) sand dunes with contrast differences; (Area-5) bright cliffs and flat rocks with little contrast differences. The results are shown of the 5 cropped areas from the input HRSC level 2 stereo image, the X-disparity maps from the 3 different (afore-described) matching algorithms alone, and the final merged X-disparity map using the proposed hybrid system.
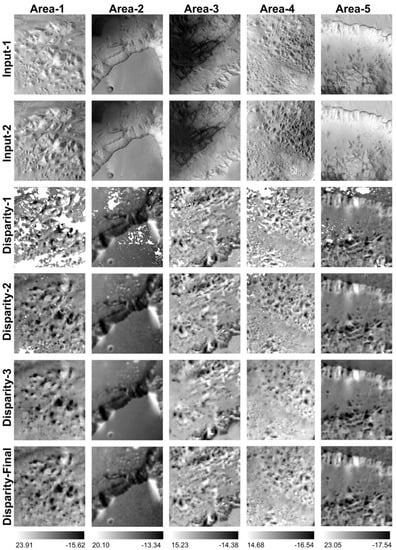
Figure 4.
Examples of stereo input images and their corresponding resultant x-disparity maps using the 3 matchers (shown in Figure 3) standalone (Disparity-1, Disparity-2, Disparity-3) and merged using the Hybrid DTM processing scheme (Disparity-Final), for 5 different cropped areas, demonstrated using h2145_0000 (location can be found from Figure 8).
We can observe (images at original resolution are provided in supplementary data) that, in general, the f-ML + Bayes EM cross-correlation method (Disparity-1) is able to capture finer texture details but has more gaps (failed matching), the NCC + Gotcha method (Disparity-2) shows higher completeness (fewer gaps) but slightly less detail (smoother), while the MGM method (Disparity-3) shows good overall quality and completeness, but with less detail and some artefacts resulting from inherent (un-smoothed) SGM [48] issues (diagonal lines/8-path streaking artefact [49]). Nevertheless, each of the three methods separately are subject to their own advantages and disadvantages given different types of terrains, lighting and contrast conditions/differences, noise, low-textured and high-textured surfaces. The final merged disparity (Disparity-final), using the afore-described “closest-to-median” scheme shows the highest quality, i.e., best overall completeness and level of detail, and the least artefacts.
2.4. DTM Height Correction and Mosaicing
Following the successful creation of 11 single-strip HRSC DTMs, the next stage focuses on spatial and vertical alignment of the new HRSC DTMs to existing DLR HRSC DTMs and ultimately to the only global Mars co-ordinate reference, the MOLA DTM. Within the DLR streamlined system, co-alignment of HRSC DTMs and MOLA is achieved using Bundle Adjustment (BA) and Sequential Photogrammetric Adjustment (SPA) [46]. More specifically, BA uses tie-points and least squares adjustment to model systematic and random errors in a single mathematical model to correct the 3D geometry, whereas SPA takes a comprehensive set of adjustment procedures and iteratively refines the 3D geometry. The SPA procedures [46] include (a) minimising 3D intersection error for individual points; (b) calculation of mean lateral and vertical shifts to MOLA to correct orbit position; (c) calculation of along-track vertical deviations to MOLA to correct pitch angle; and (d) calculation of systematic across-track tilts to MOLA to correct roll angles.
In this work, we propose an alternative method to perform HRSC-to-HRSC and HRSC-to-MOLA co-alignment using a joint 3D and image co-registration procedure. The joint 3D and image co-registration process uses existing image and 3D data as references, and corrects a target image and 3D data simultaneously, according to image-to-image co-registration for spatial transformation and 3D-to-3D co-alignment for vertical transformation. This method uses a combination of image co-registration and 3D co-alignment techniques and, we believe, is more intuitive and straightforward than traditional photogrammetric modelling approaches. The joint 3D and image co-registration method also guarantees high co-alignment accuracy both globally and locally. However, it is only applicable when there is partial overlap between the target data and reference data, e.g., adjustment of new HRSC single-strip products to fill in gaps of already corrected HRSC single-strip products. The method can also be used for CTX-to-HRSC, CTX-to-CTX, HiRISE-to-CTX, and HiRISE-to-HiRISE co-alignment and mosaicing. However, for a “blind” HRSC-to-MOLA alignment task (without supporting reference HRSC products), we still suggest following the DLR BA and SPA procedures.
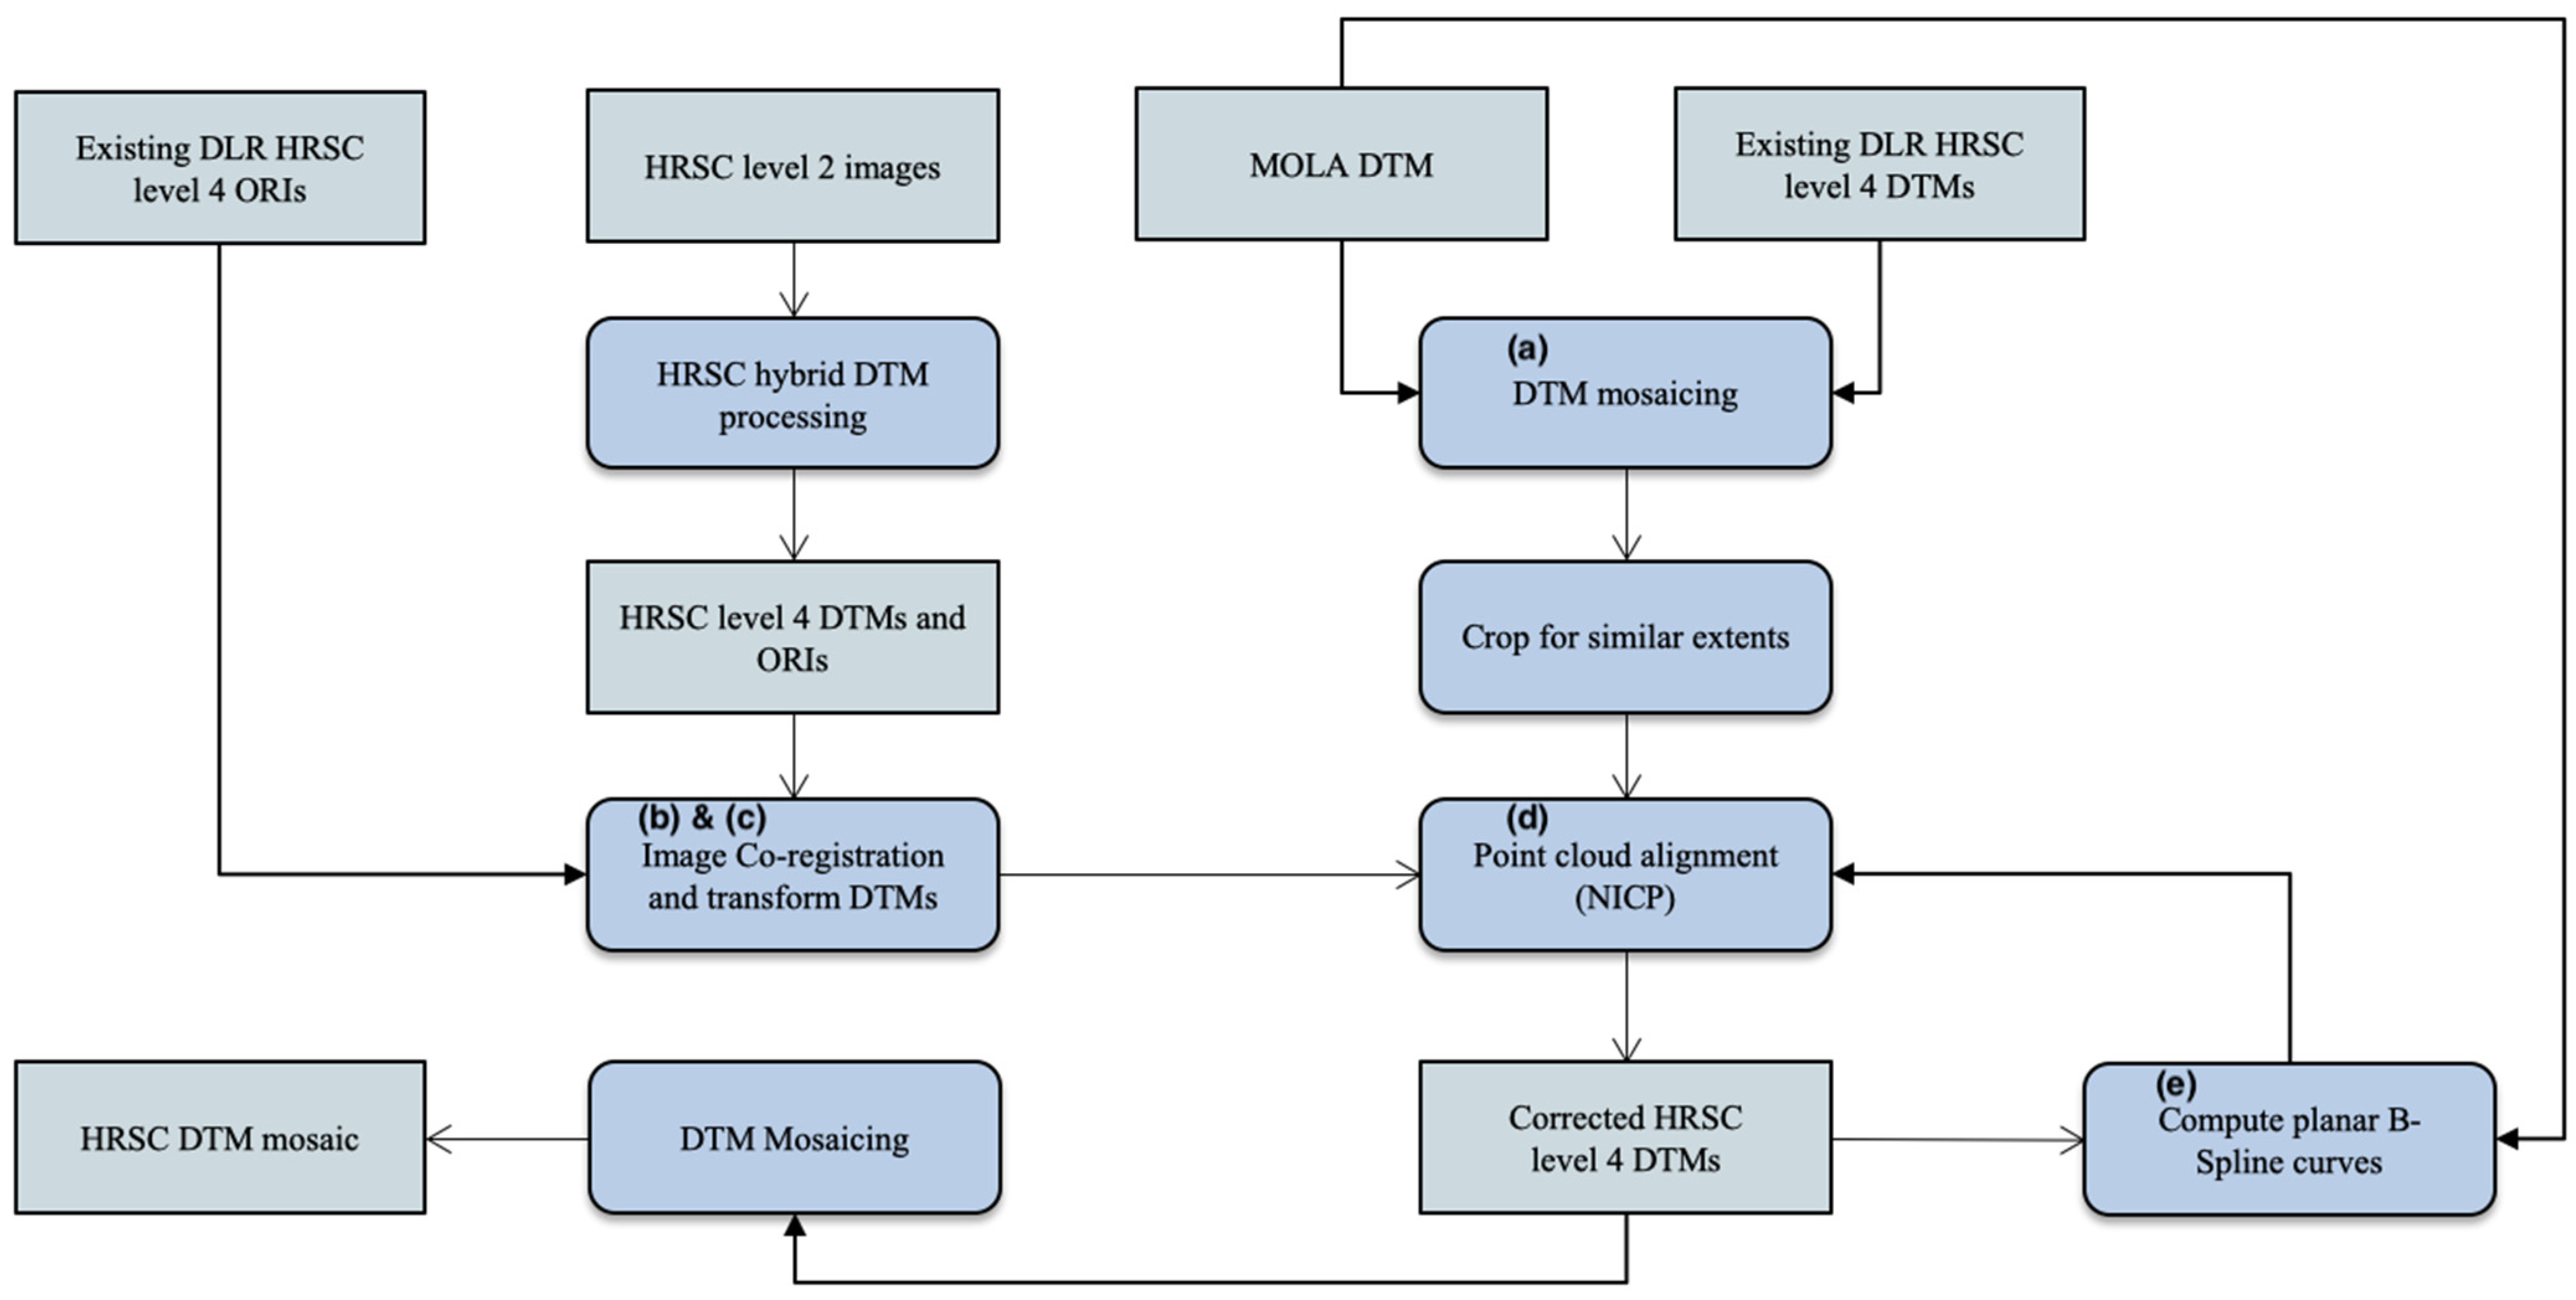
The overall processing chain for the joint 3D and image co-registration method is illustrated in Figure 5. The joint 3D and image co-registration method takes our processed HRSC ORIs and DTMs, MOLA DTM, and the existing DLR HRSC level 4 v50+ ORIs and DTMs as inputs, corrects both the UCL HRSC level 4 single-strip ORIs and DTMs as well as the existing DLR HRSC single-strip level-4 DTMs, and creates a DTM mosaic for the whole area. This is achieved through the 5 steps shown in Figure 5 with annotated labels relating to the following:
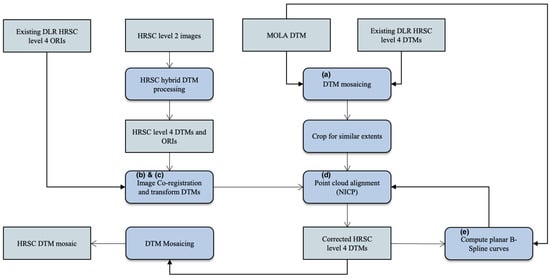
Figure 5.
Flow diagram of the joint 3D and image co-registration processing chain for HRSC-to-HRSC and HRSC-to-MOLA co-alignment.
(a) Firstly, a cropped version of the MOLA DTM is upsampled to 50 m/pixel and mosaiced with the existing DLR HRSC level 4 DTMs for ease of computation. In this step, we have prepared a reference DTM mosaic, for follow-up steps, covering the target DTMs, consisting of both high-resolution regions that come from the original DLR HRSC level 4 DTMs and lower resolution (smoother) regions that were filled with up-sampled MOLA DTMs, together covering the target UCL HRSC level 4 DTMs.
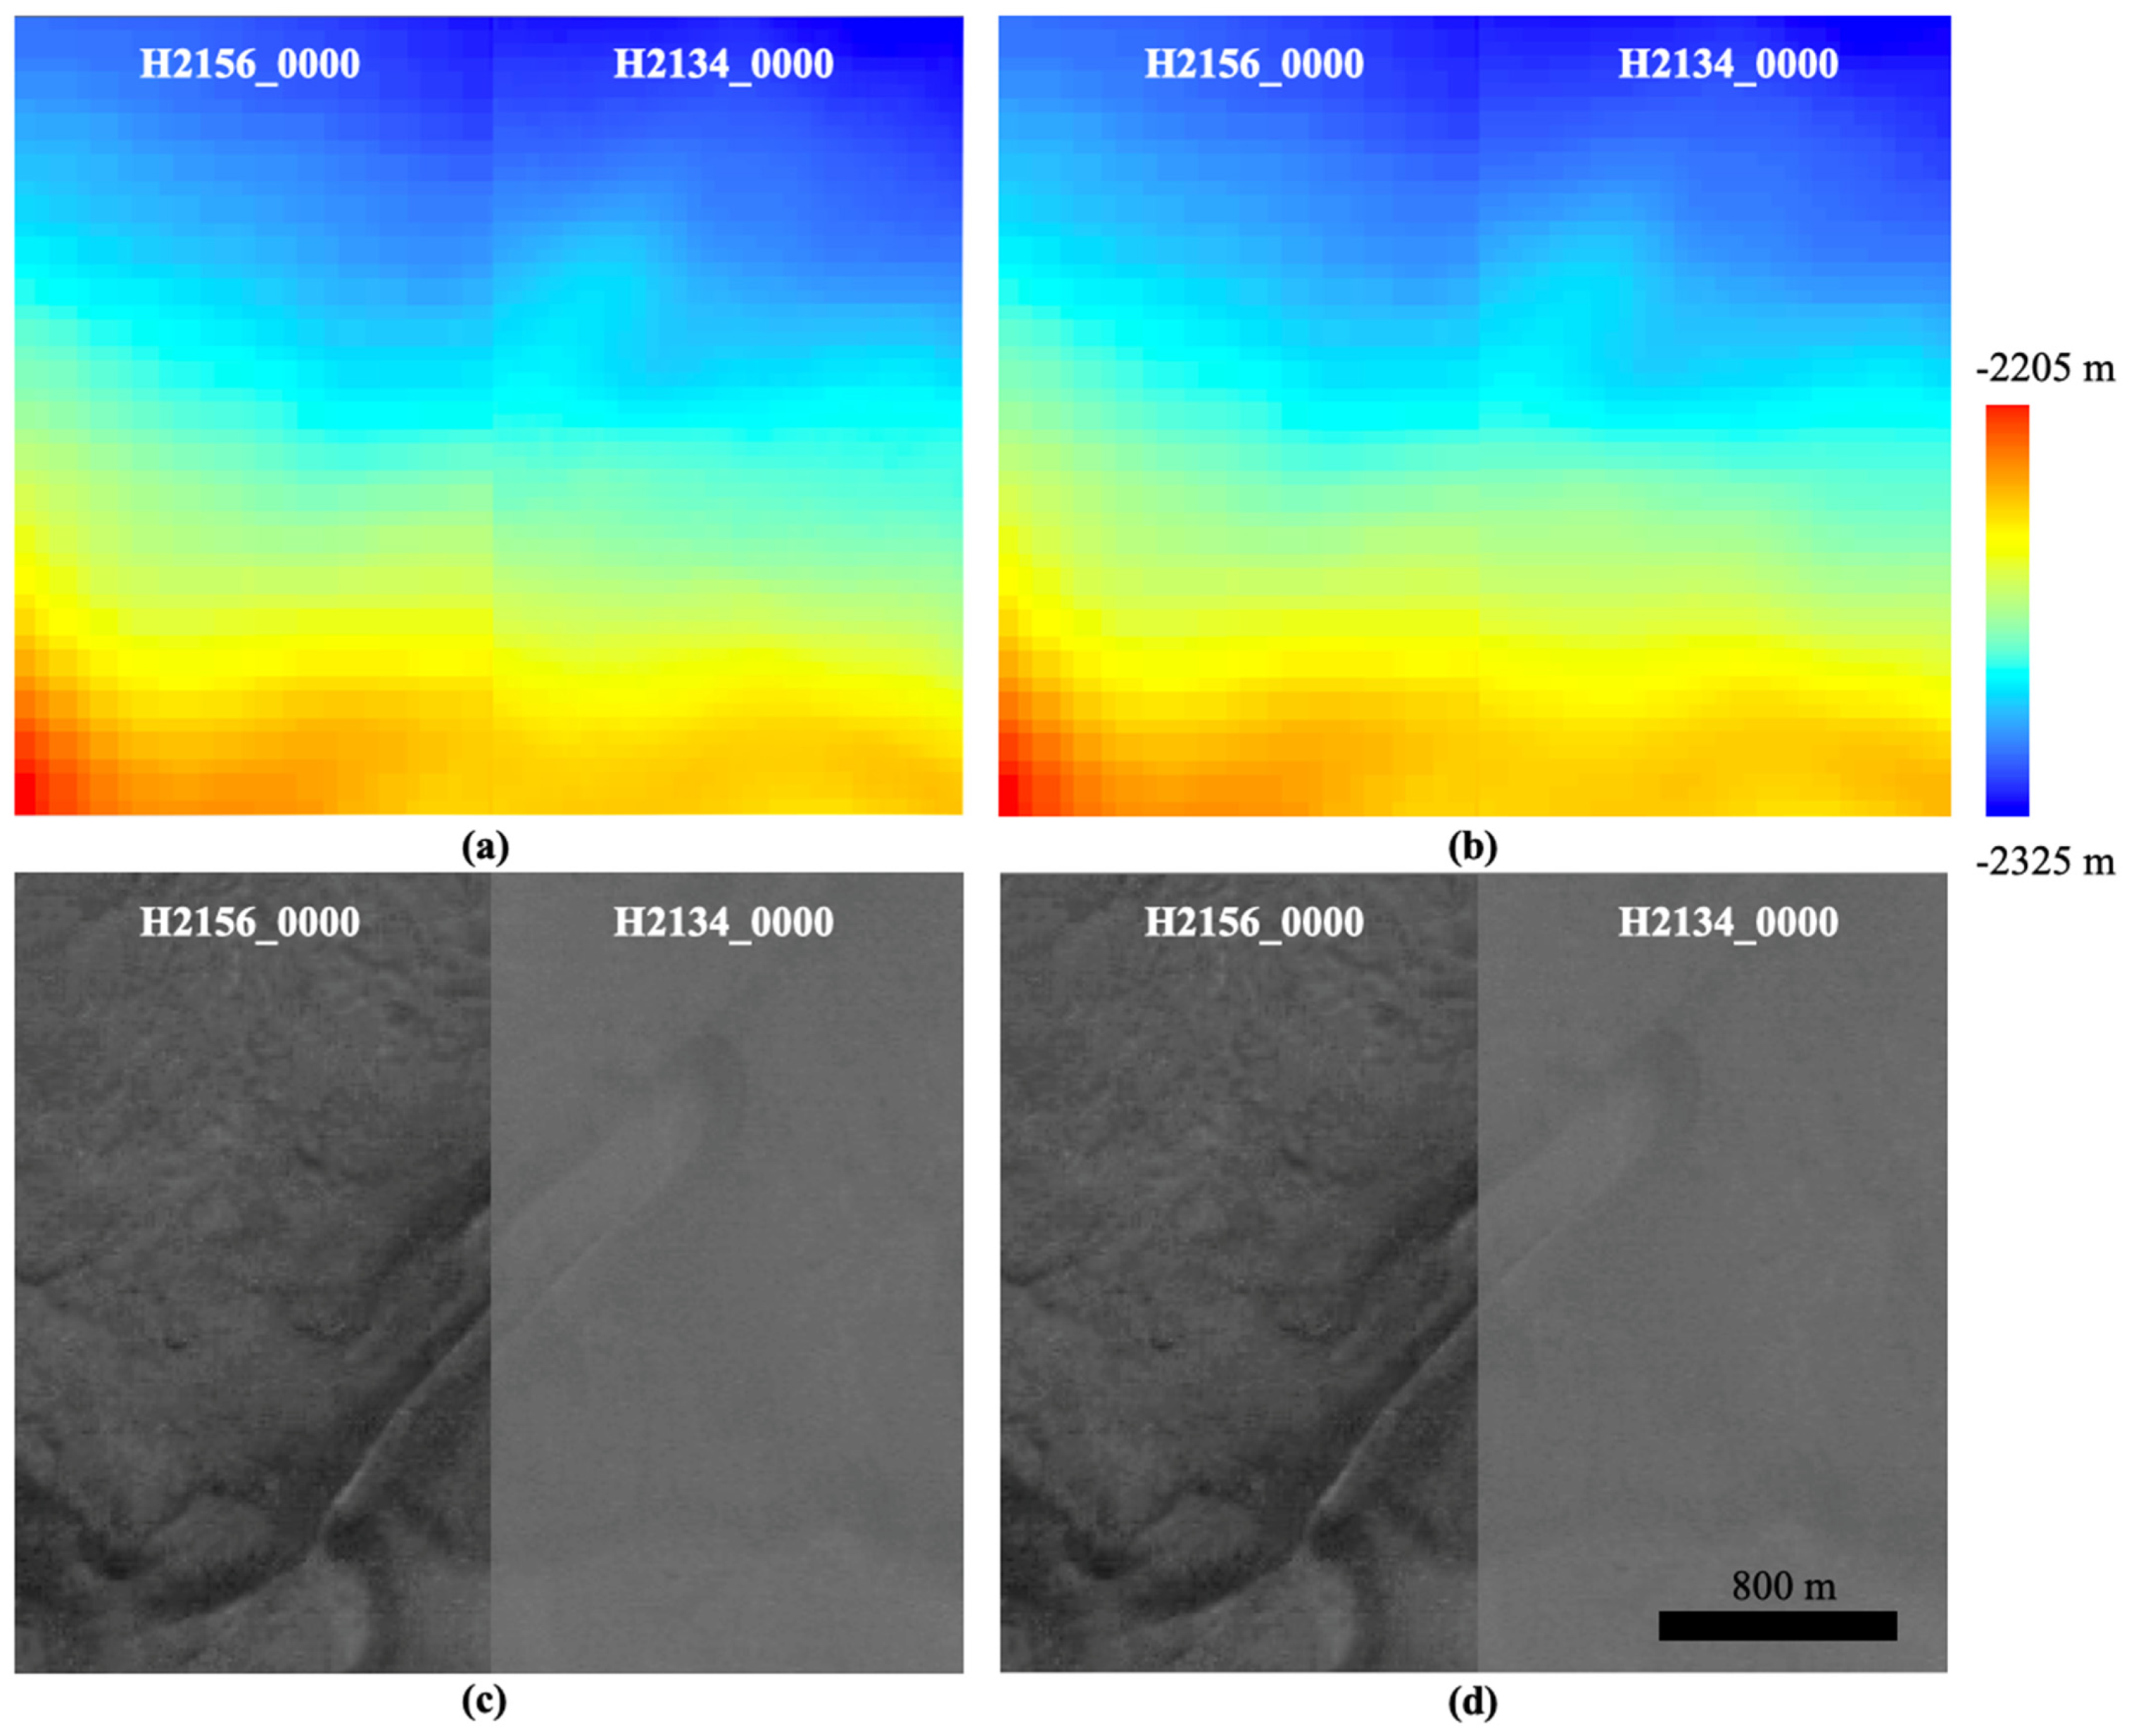
(b) Co-registration of the UCL HRSC level 4 ORIs with existing DLR HRSC level 4 ORIs for overlapping regions and recording of the spatial correspondences for all 2 D points (P), here denoted as TP (dX0, dY0), for the next step. The ORI co-registrations are performed using Mutual Shape Adapted Scale Invariant Feature Transform (MSA-SIFT), which was introduced in [44] and was also implemented as part of the CASP-GO pipeline [39]. Note that the reason for using image co-registration prior to 3D co-alignment is that images always have higher spatial resolution with more detailed textures comparing to any derived stereo-derived DTM, and thus result in more accurate spatial adjustments than simply performing a point-cloud alignment using Iterative Closest Point (ICP) based methods. Figure 6 shows that the 3D co-alignment results for using point-cloud alignment only and using the proposed joint 3D and image co-registration method. We can see that in both cases, the two HRSC DTMs are “co-aligned” at the DTM scale and could be “seamlessly” blended together. However, when looking at the ORIs, which are at a finer scale of resolution, the differences become much more obvious.
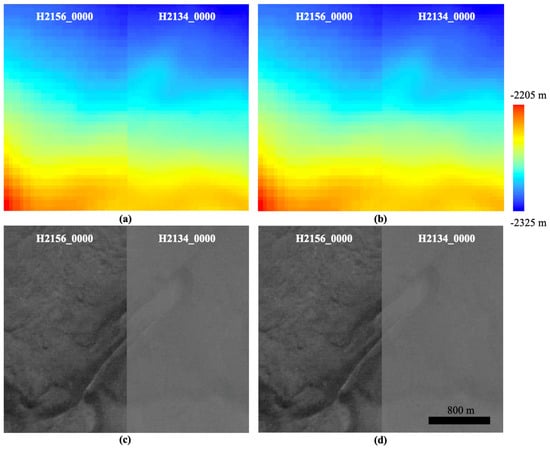
Figure 6.
Side-by-side view of colourised DTM (top) and ORI (bottom) of DLR HRSC level 4 data (H2156_0000) and the overlapping UCL HRSC level 4 data (H2134_0000). (a,c): H2156_0000 DTM with point cloud alignment applied using the ASP’s “pc_align” function, to the target DTM (H2134_0000), and the same transformation is applied to the ORI. (b,d): H2156_0000 DTM with the joint 3D and image co-registration as described in the text, to the target DTM (H2134_0000), and the same transformation is applied to the ORI.
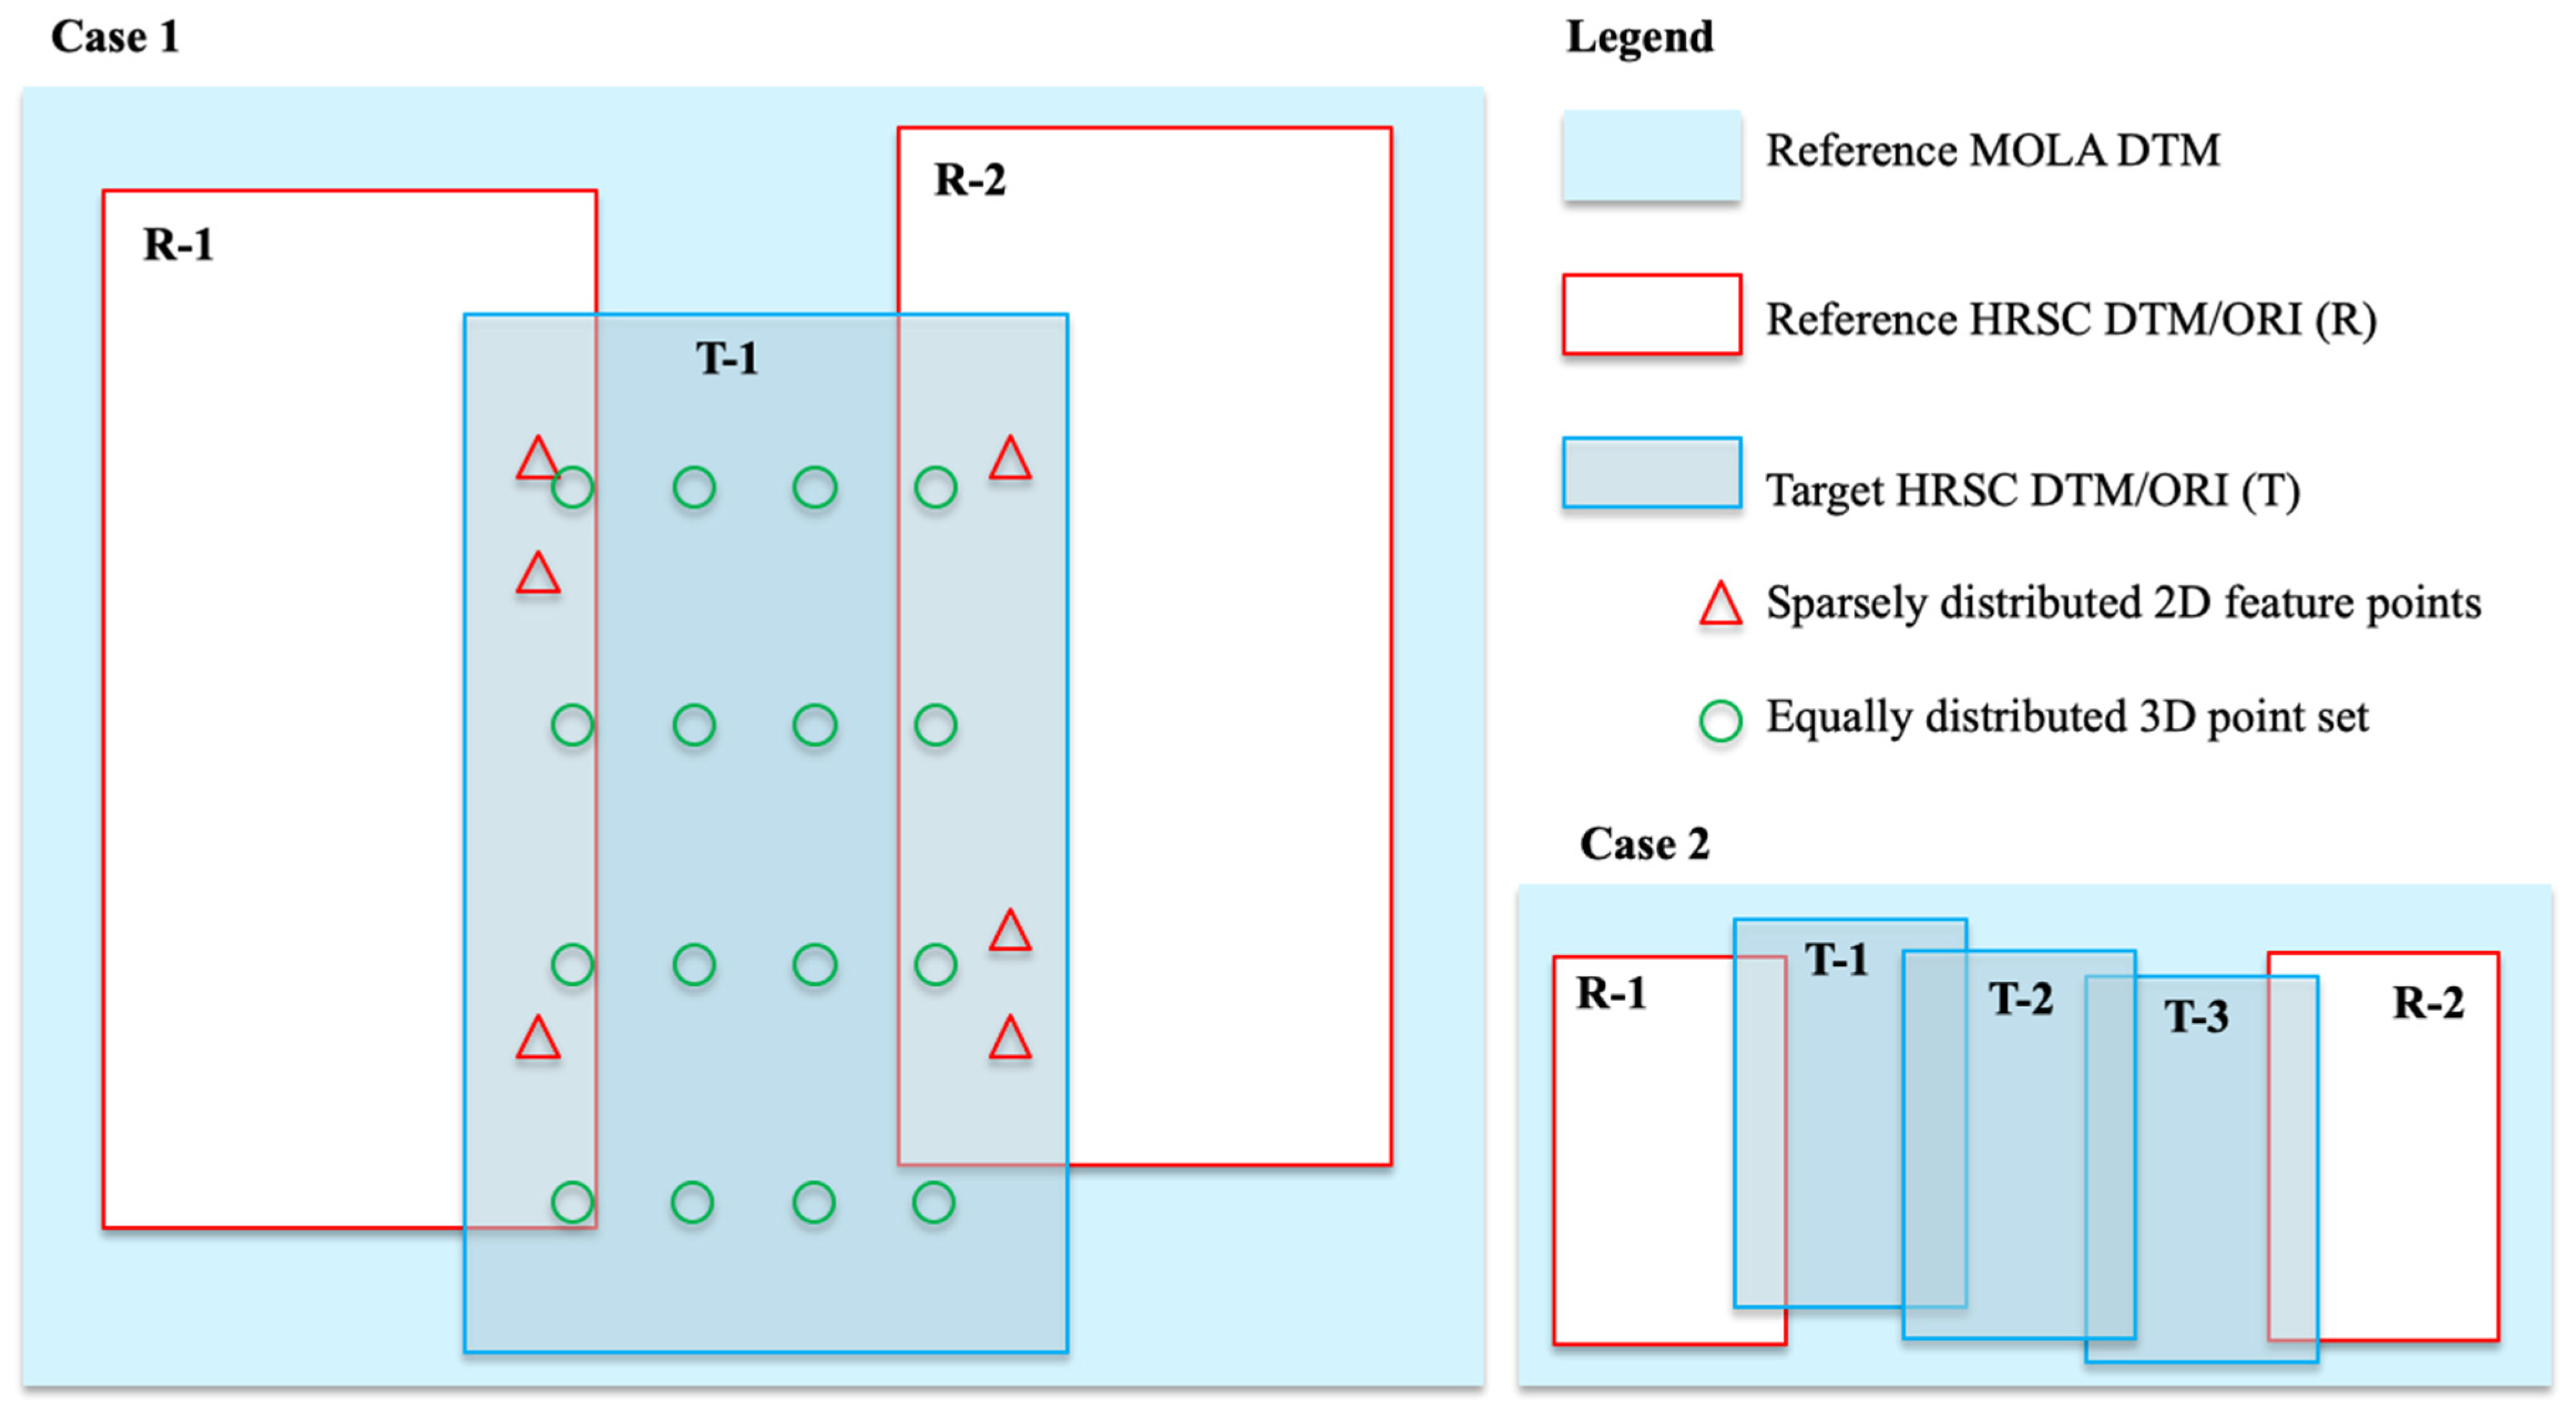
(c) Take the spatial correspondences from (b), assuming an initial vertical transformation equals to the absolute difference of height values for the corresponding 2 D points, P, here denoted as dZ0, as the initial transformation, i.e., TP (dX0, dY0, dZ0), adding equally distributed initial transformations as TO (0, 0, 0) for 3D points (O), and iteratively perform a Non-rigid Iterative Closest Point (NICP) fitting process. The final correspondences between the target UCL HRSC level 4 DTMs (before co-alignment) and the reference DTM mosaic created at step (a) is recorded as TQ (dX, dY, dZ) for all 3D points (Q; Q=P+O). Note that the final set of 3D correspondences TQ (dX, dY, dZ) is denser than the initial set of transformations TP (dX0, dY0, dZ0), as it has added in equally distributed initial “correspondences”, i.e., TO, between HRSC and MOLA DTM, where there is no overlapping HRSC ORIs (see Figure 7 for an intuitive illustration), but it is still only a subset (we use between 1/50 and 1/100) of the total HRSC DTM 3D points due to computational limitations.
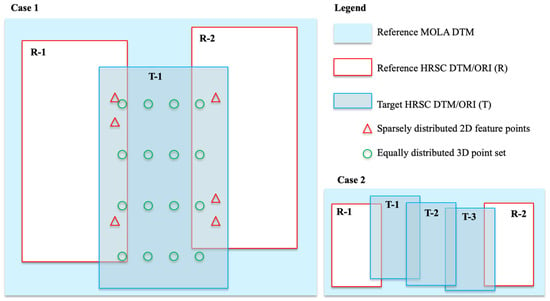
Figure 7.
Illustration of the relation between target HRSC DTM/ORI, and Reference HRSC DTM/ORI and MOLA DTM within the joint 3D and image co-registration process.
(d) Non-rigid point cloud transformation is performed for the target UCL HRSC level 4 DTMs according to TQ (dX, dY, dZ) and a corresponding spatial transformation is performed for the target UCL HRSC level 4 ORIs according to TQ (dX, dY). Note that in most of the cases for this work, the target HRSC DTM/ORI have overlapping reference HRSC DTMs/ORIs orbital strips on either side. However, where more than one new orbital strip is needed to span a gap, we co-align these one at a time, first selecting at each step, the strip that has the greatest overlap with the data already in place. Then the corrected HRSC DTM/ORI is used as the reference for subsequent co-alignment of the target HRSC DTM/ORI that previously has smaller or no overlapping area. See Figure 7 for a schematic representation, i.e., in case 2, we start from Target-1 (T-1) and Target-3 (T3) HRSC DTM/ORI, then correct T-2 using the corrected T-1, T-3 and MOLA DTM as references.
(e) Finally, the differences between MOLA DTM and each corrected UCL HRSC level 4 DTMs as well as the existing DLR HRSC level 4 DTMs are checked for any remaining systematic issues, e.g., jitter issues or “warped edges”. A B-Spline fitting algorithm is used to correct any remaining systematic issues. The B-Spline fitting algorithm uses the computed planar B-Spline surface to represent the HRSC and MOLA DTMs, and then uses the same NICP method that is used in step (c) and (d) to fit the two B-Spline surfaces, and then applies the calculated non-rigid transformation to do a final correction of all HRSC DTMs (both DLR & UCL).
More specifically, the NICP algorithm used in step (c) and (d) is based on the Optimal Step NICP (OS-NICP) method [50] which is briefly described as follows. Firstly, assign one initial affine 3 × 4 transformation matrix and a weight term (w) to each 3D correspondence in Q, to model the distance between the target and reference 3D point clouds. Note that the weights are set to 0 for the target 3D points where no corresponding reference 3D points can be found. The weighted distance term and two additional regularisation terms together form the cost function of OS-NICP (sum of the three terms). The two regularisation terms are the stiffness term to penalise transformations of neighbouring 3D points, and the landmark term to initialise and penalise the transformations of landmarks. The landmarks, in our case, are the 3D correspondences calculated via HRSC ORI-to-ORI co-registration, i.e., TP (dX0, dY0, dZ0). OS-NICP iteratively finds the optimal 3D correspondences TQ, while lowering the stiffness weights (to allow more localised transformations), until the cost function is minimised. Note that the correct alignment can also be found without landmarks in OS-NICP with a wider range of initial conditions.
In the last step (e), a B-Spline fitting algorithm is used to remove any remaining systematic errors for both the UCL and DLR HRSC level 4 DTMs. The motivation for this step is based on our observation that some systematic errors still exist for both the DLR HRSC level 4 DTMs (after BA/SPA correction) and the UCL HRSC level 4 DTMs (after the joint 3D and image co-registration process). Considering two DTMs with the same resolution, size, and zero noise, if they are spatially co-registered, then the absolute height difference between the two DTMs would be the theoretical transformation to co-align each point of the two DTMs. However, we cannot use an absolute difference mapping to perform point-to-point corrections for HRSC DTM against MOLA DTM in our case, since that will remove all the details in the higher resolution HRSC DTM and make it identical to the MOLA DTM. Therefore, in this work, we propose using a B-Spline fitting algorithm to correct remaining systematic errors in both the DLR and UCL HRSC level 4 DTMs.
The B-Spline fitting algorithm firstly computes two planar B-Spline surfaces, to represent the large-scale topography of HRSC and MOLA DTMs at a density of 2 km/pixel (~5 times the MOLA scale), then fit the two planar curves with NICP, and finally apply the calculated non-rigid transformation to the HRSC DTMs. In terms of computing the planar B-Spline curve representations, we used the asymmetric distance minimisation method described in [51] (implementation available through the Point Cloud Library’s Surface module at: http://pointclouds.org/documentation/tutorials/#surface (accessed on 21 March 2021)).
A high-level workflow for fitting a B-Spline surface to the point-clouds has the following 4 steps: (1) initialise the B-Spline surface by calculating a bounding circle of the target point cloud and set the initial control points; (2) increase the number of control-points and subsequently fit the refined B-spline surface; (3) project the target point-cloud into the parametric domain using the closest points to the B-spline surface and cut off the overlapping regions of the surface; (4) repeat (2) and (3) until the desired density of control points is reached.
Finally, the updated UCL and DLR HRSC level 4 DTMs are used to create a mosaic for the whole Valles Marineris area. We use the ASP “priority-blending” method to create the mosaic, in which case, DTMs are blended in the order of highest-to-lowest resolutions.
2.5. Automated Co-Registration and Orthorectification
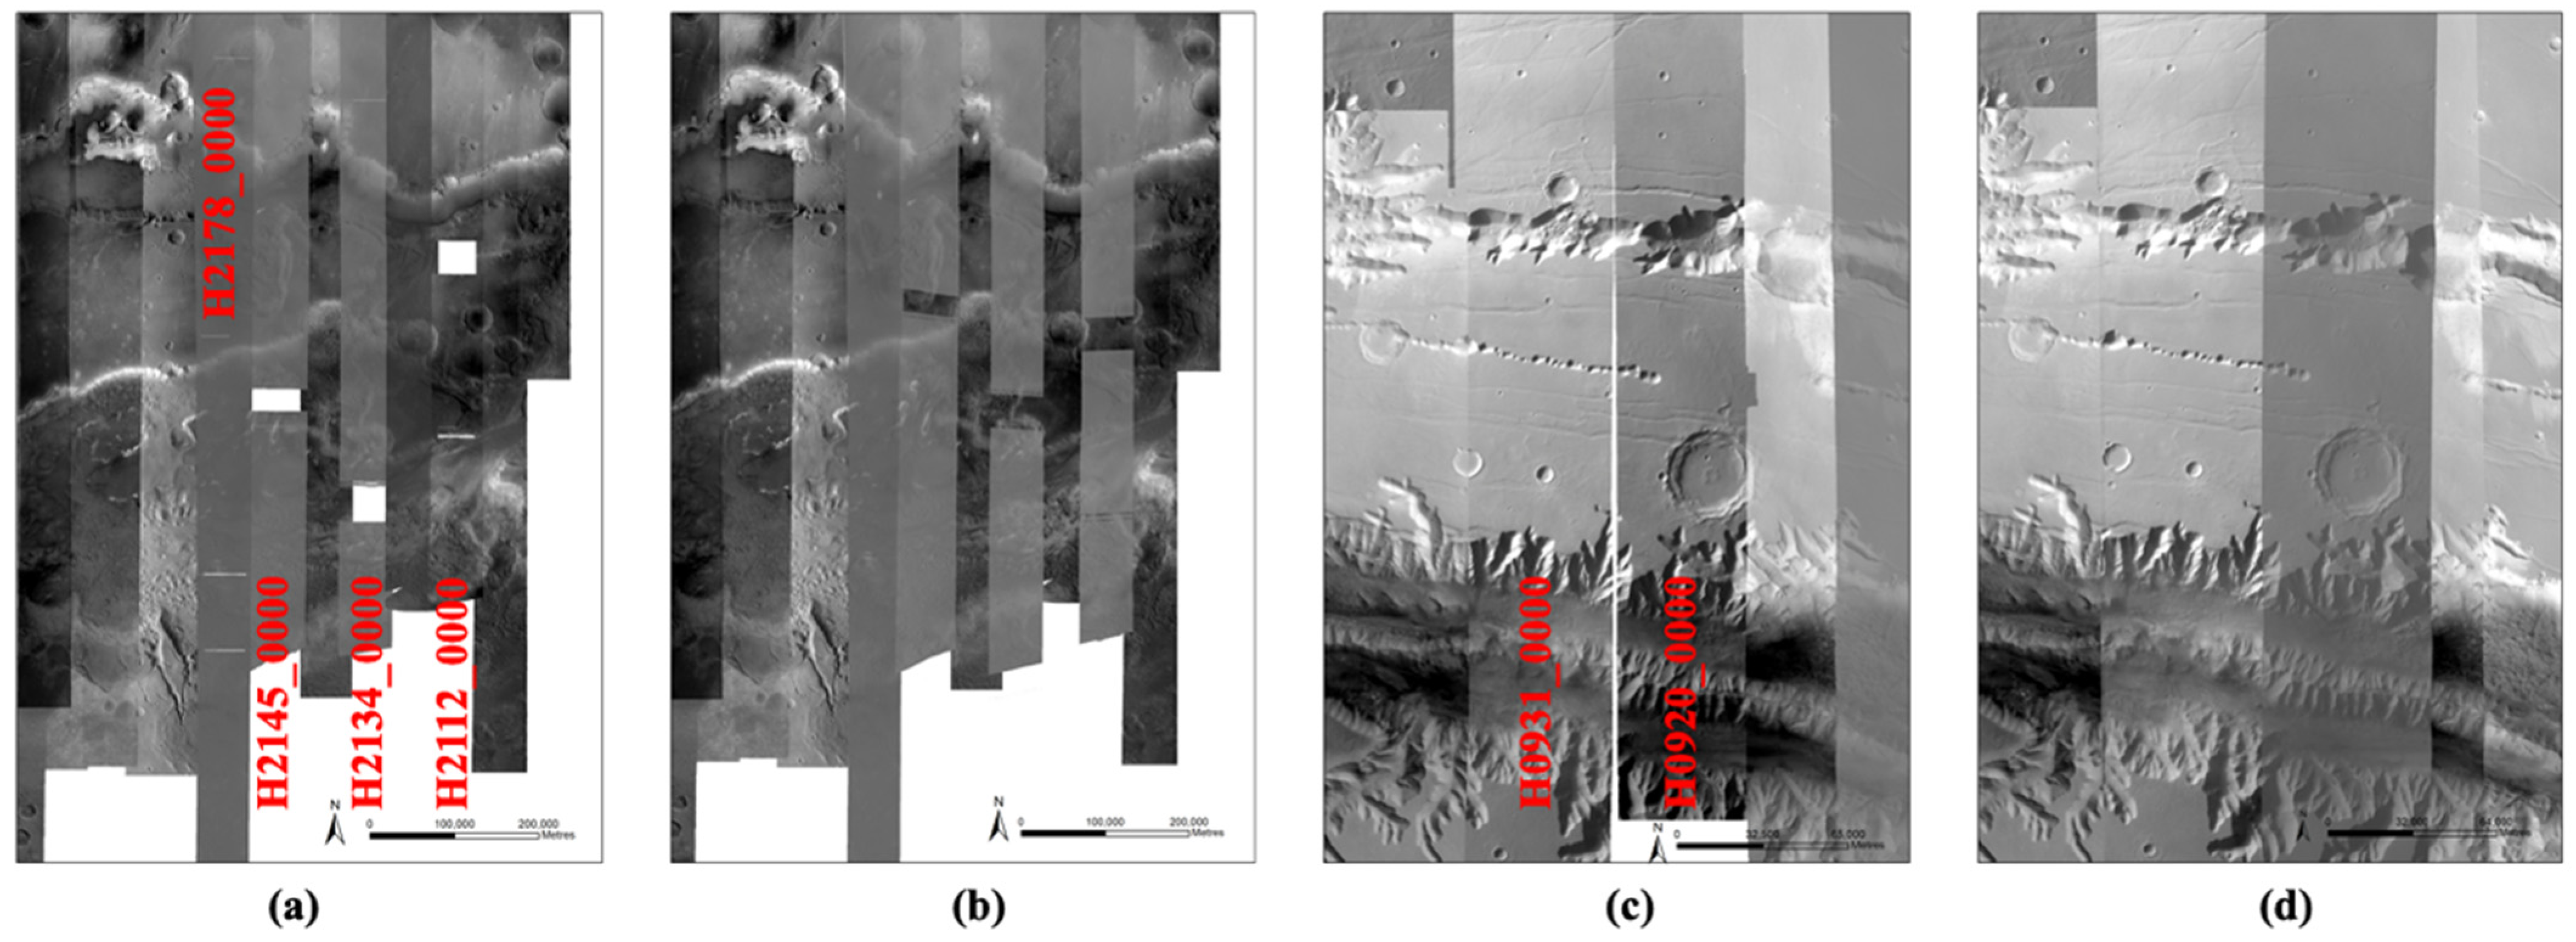
Initially, the DLR HRSC level 4 ORIs (ND4 products) and the UCL HRSC level 4 ORIs, which were orthorectified and co-registered using HRSC level 2 nadir panchromatic images (ND2 products), were used to create the ORI mosaic of Valles Marineris. However, we found some of the UCL level 4 ORIs, that were produced from the ND2 products, have missing data in different areas of the strip (the missing data comes from the original raw HRSC data records). Also, some of the DLR level 4 ORIs (ND4 products) are narrower than the level 2 stereo images (S12 and S22 products), leaving a seam gap between two adjacent ORIs (see Figure 8).
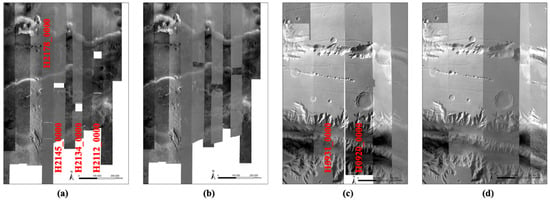
Figure 8.
Illustration of a combination of the DLR and new UCL HRSC level 4 ORIs (IDs are labelled in red), showing completeness before (a,c) and after (b,d) adding more additional overlapping UCL level 4 ORIs, produced from both the nadir and stereo level 2 images (ND2 and S12/S22 products), to fill in the missing data and seam gaps.
Therefore, additional HRSC level 2 stereo images (S12 and S22 products) are used to cover these gap regions, and further orthorectification and co-registrations are performed. Also, due to missing data, gaps appear at different locations in the different HRSC level 2 images (the level 2 nadir panchromatic and stereo images, i.e., ND2, S12, and S22 products) for a same strip. Multiple HRSC level 2 images are therefore sometimes required in order to create the final Valles Marineris ORI mosaic without any gaps. The additional HRSC level 2 images (ND2, S12, and S22) that were needed to produce overlapping new level 4 ORIs in order to fill in the gaps of the original 11 UCL level 4 ORIs are h2178_0000, h2145_0000, h2134_0000, and h2112_0000. The additional HRSC level 2 images (S12 and S22) that were needed to produce new “wider” level 4 ORIs in order to fill the thin seam gaps of the original DLR level 4 ORIs are h0931_0000 and h0920_0000. The issues are demonstrated in Figure 8 for the original HRSC level 4 ORIs from UCL and DLR using the nadir panchromatic images only (ND4 and ND2 images) showing missing data and gaps, in comparison to adding in the additional overlapped UCL HRSC level 4 ORIs (co-registered and orthorectified using ND2, S12, and S22 images).
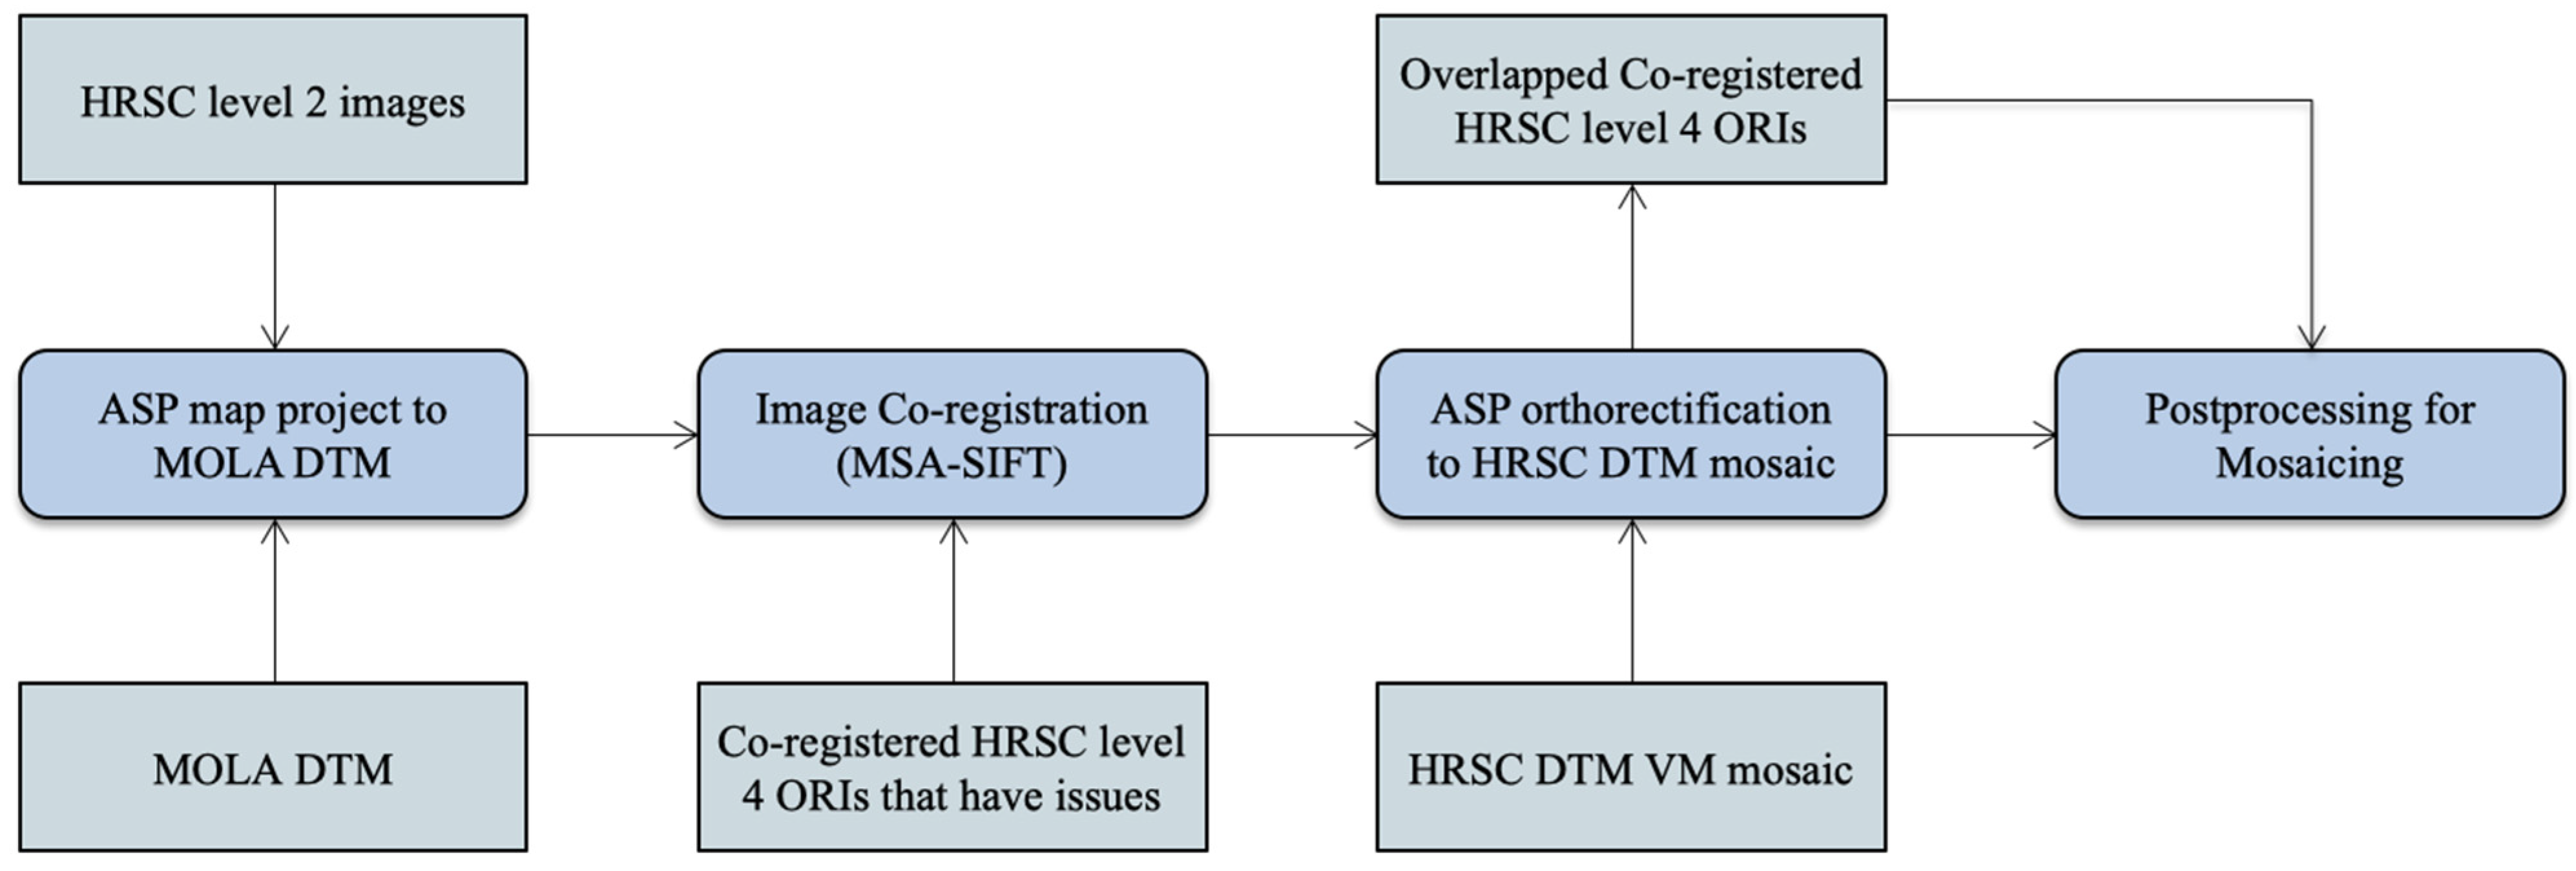
In this work, we use an automated image co-registration and orthorectification workflow to produce multiple overlapping HRSC level 4 ORIs from both level 2 nadir panchromatic and stereo images (ND2, S12, S22 products). The implementation uses our inhouse MSA-SIFT tie-point based image co-registration pipeline [39,44] and the ASP’s image orthorectification workflow (the “mapproject” function) [43]. The processing follows the steps of map projection with MOLA, image co-registration with already processed and co-registered HRSC level 4 ORIs, and orthorectification with the HRSC DTM Valles Marineris mosaic created at the previous stage. A flow diagram of the automated image co-registration and orthorectification processing chain is shown in Figure 9.
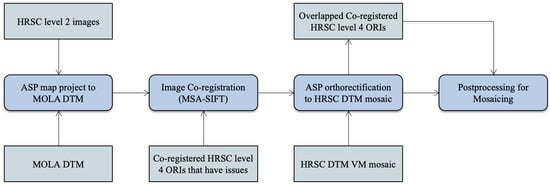
Figure 9.
Flow diagram of the automated image co-registration and orthorectification processing chain.
2.6. Brightness Correction and Mosaicing of ORIs
A particular difficulty in compiling image mosaics for the surface of Mars arises from the varying optical properties of the atmosphere. The quantity of dust carried by the atmosphere changes as a consequence of seasonal weather phenomena, affecting camera observations to a greater or smaller degree over different parts of the planet. This is seen in individual images as variations in clarity and contrast, resulting from how much light is scattered both onto the ground—from directions other than the source of illumination—as well as into and out of the camera’s line of sight. The image strips shown in Figure 8 illustrates the problem. It is difficult to make a physical correction for the effect, because the images are the only source of information on the instantaneous atmospheric dust content. A model-based measurement of dust content from an image requires some prior knowledge of how the surface should appear: once more, the image is the only source for the information, making the problem underdetermined.
We are able to approximate a solution by making use of the fact that large scale albedo variations on Mars are already known. The MGS’s TES was used to construct a global albedo map at about 7 km/pixel [39]. By introducing the constraint that an HRSC mosaic should conform to this albedo at coarse resolution, we are able to bring all the images into mutual brightness consistency. The main steps of the procedure are as follows [41]:
- (1)
- Lambert correction. The main effect of this step is to compensate the variation of illumination across an image caused by the curvature of the planet.
- (2)
- Generate intermediate resolution brightness reference map. Images are divided coarsely into cells (3 cells across track; a proportional number along-track according to the image). The image is rescaled in brightness value to match the TES map with a continuous interpolation between cells. A mosaic is created at moderate resolution (400 m/pixel) with same average brightness characteristics as the TES map. Edge artefacts are diminished using uniform Gaussian blur. The resulting mosaic has about 3 km/pixel information content, but with very much reduced artefacts compared to the TES source, where the information content is substantially lower than the nominal resolution.
- (3)
- Generate full-resolution mosaic. The source images are brightness-referenced to the intermediate mosaic similarly to step (2), but this time using a smaller cell size (9 × n). Overlapping images are feathered together over a 40-pixel range.
- (4)
- Image sequence. The overlapping sequence for the mosaic is optimised through visual inspection. The starting sequence places the shortest ground sampling distance at the top of the mosaic. Lower quality images are moved down in the sequence by estimating a longer effective ground sampling distance by comparison with neighbouring images.
- (5)
- Contrast adjustment. Images with higher atmospheric scattering appear in the mosaic as areas of low contrast. The contrast is increased either uniformly or with a multi-point interpolated along-track change.
- (6)
- Iteration. The mosaic is regenerated and steps (4) and (5) reconsidered until the result is as close to visually homogeneous as possible.
3. Results
3.1. HRSC DTM Mosaic for Valles Marineris
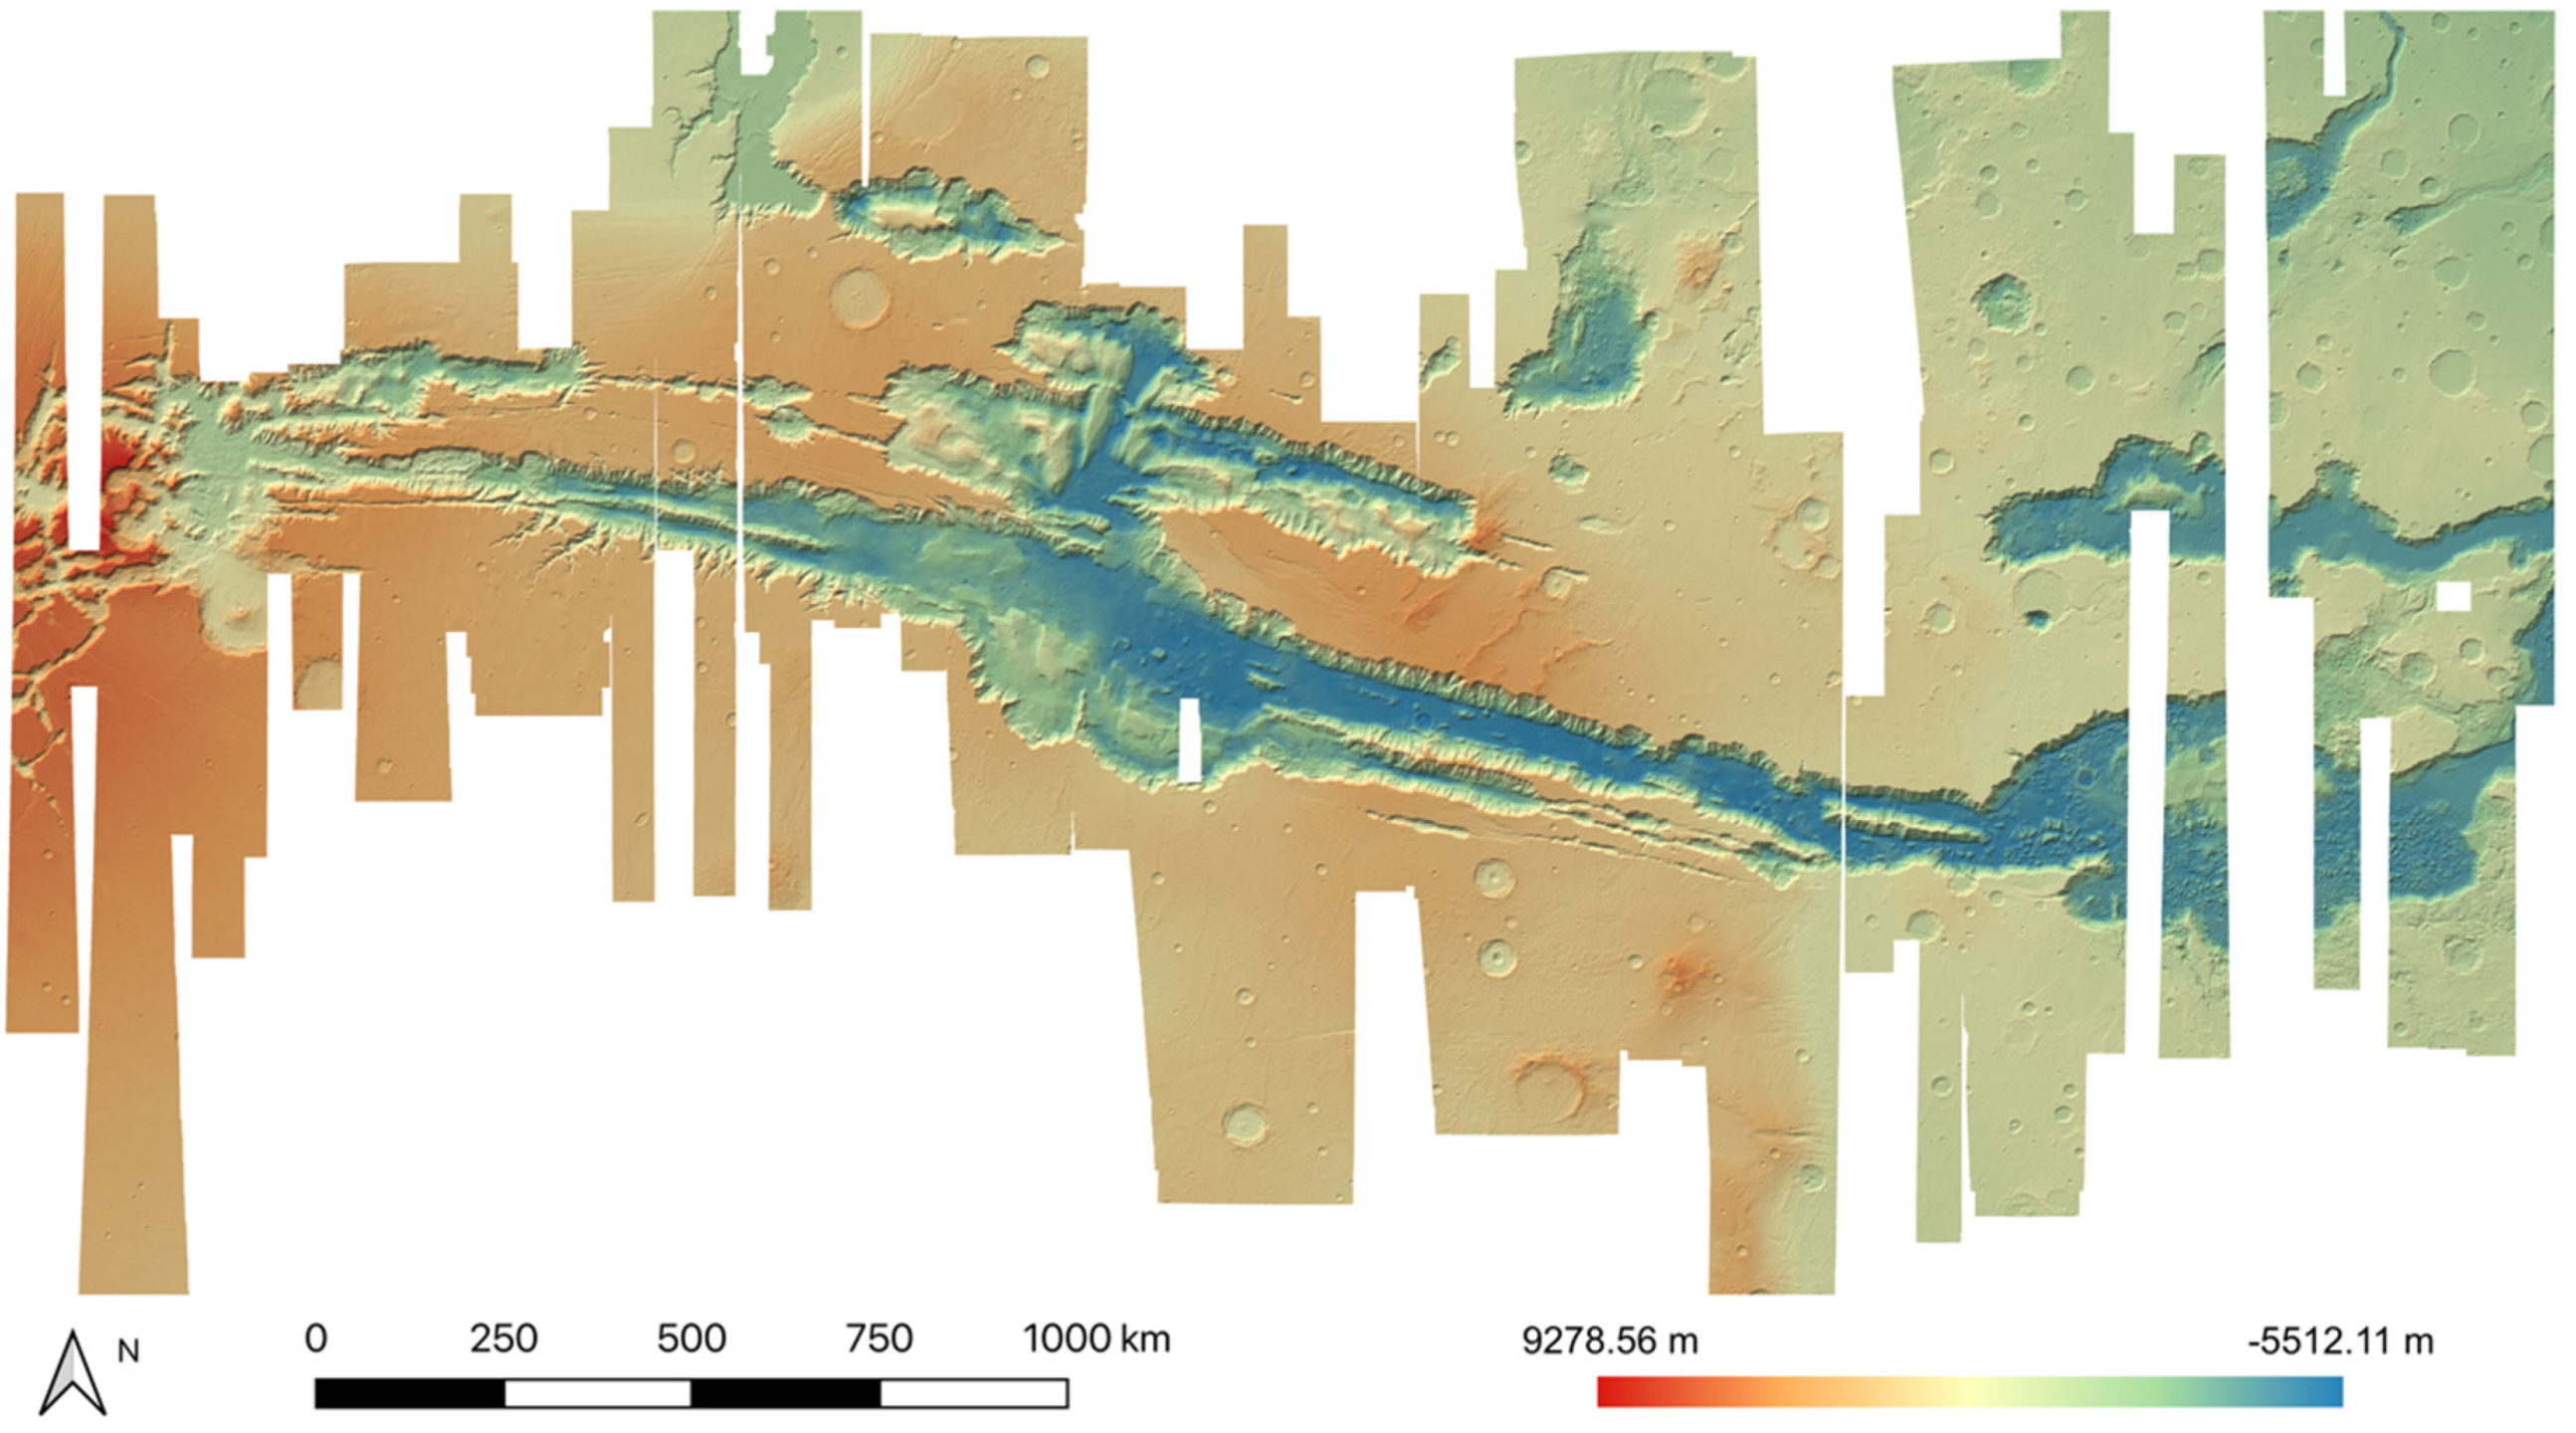
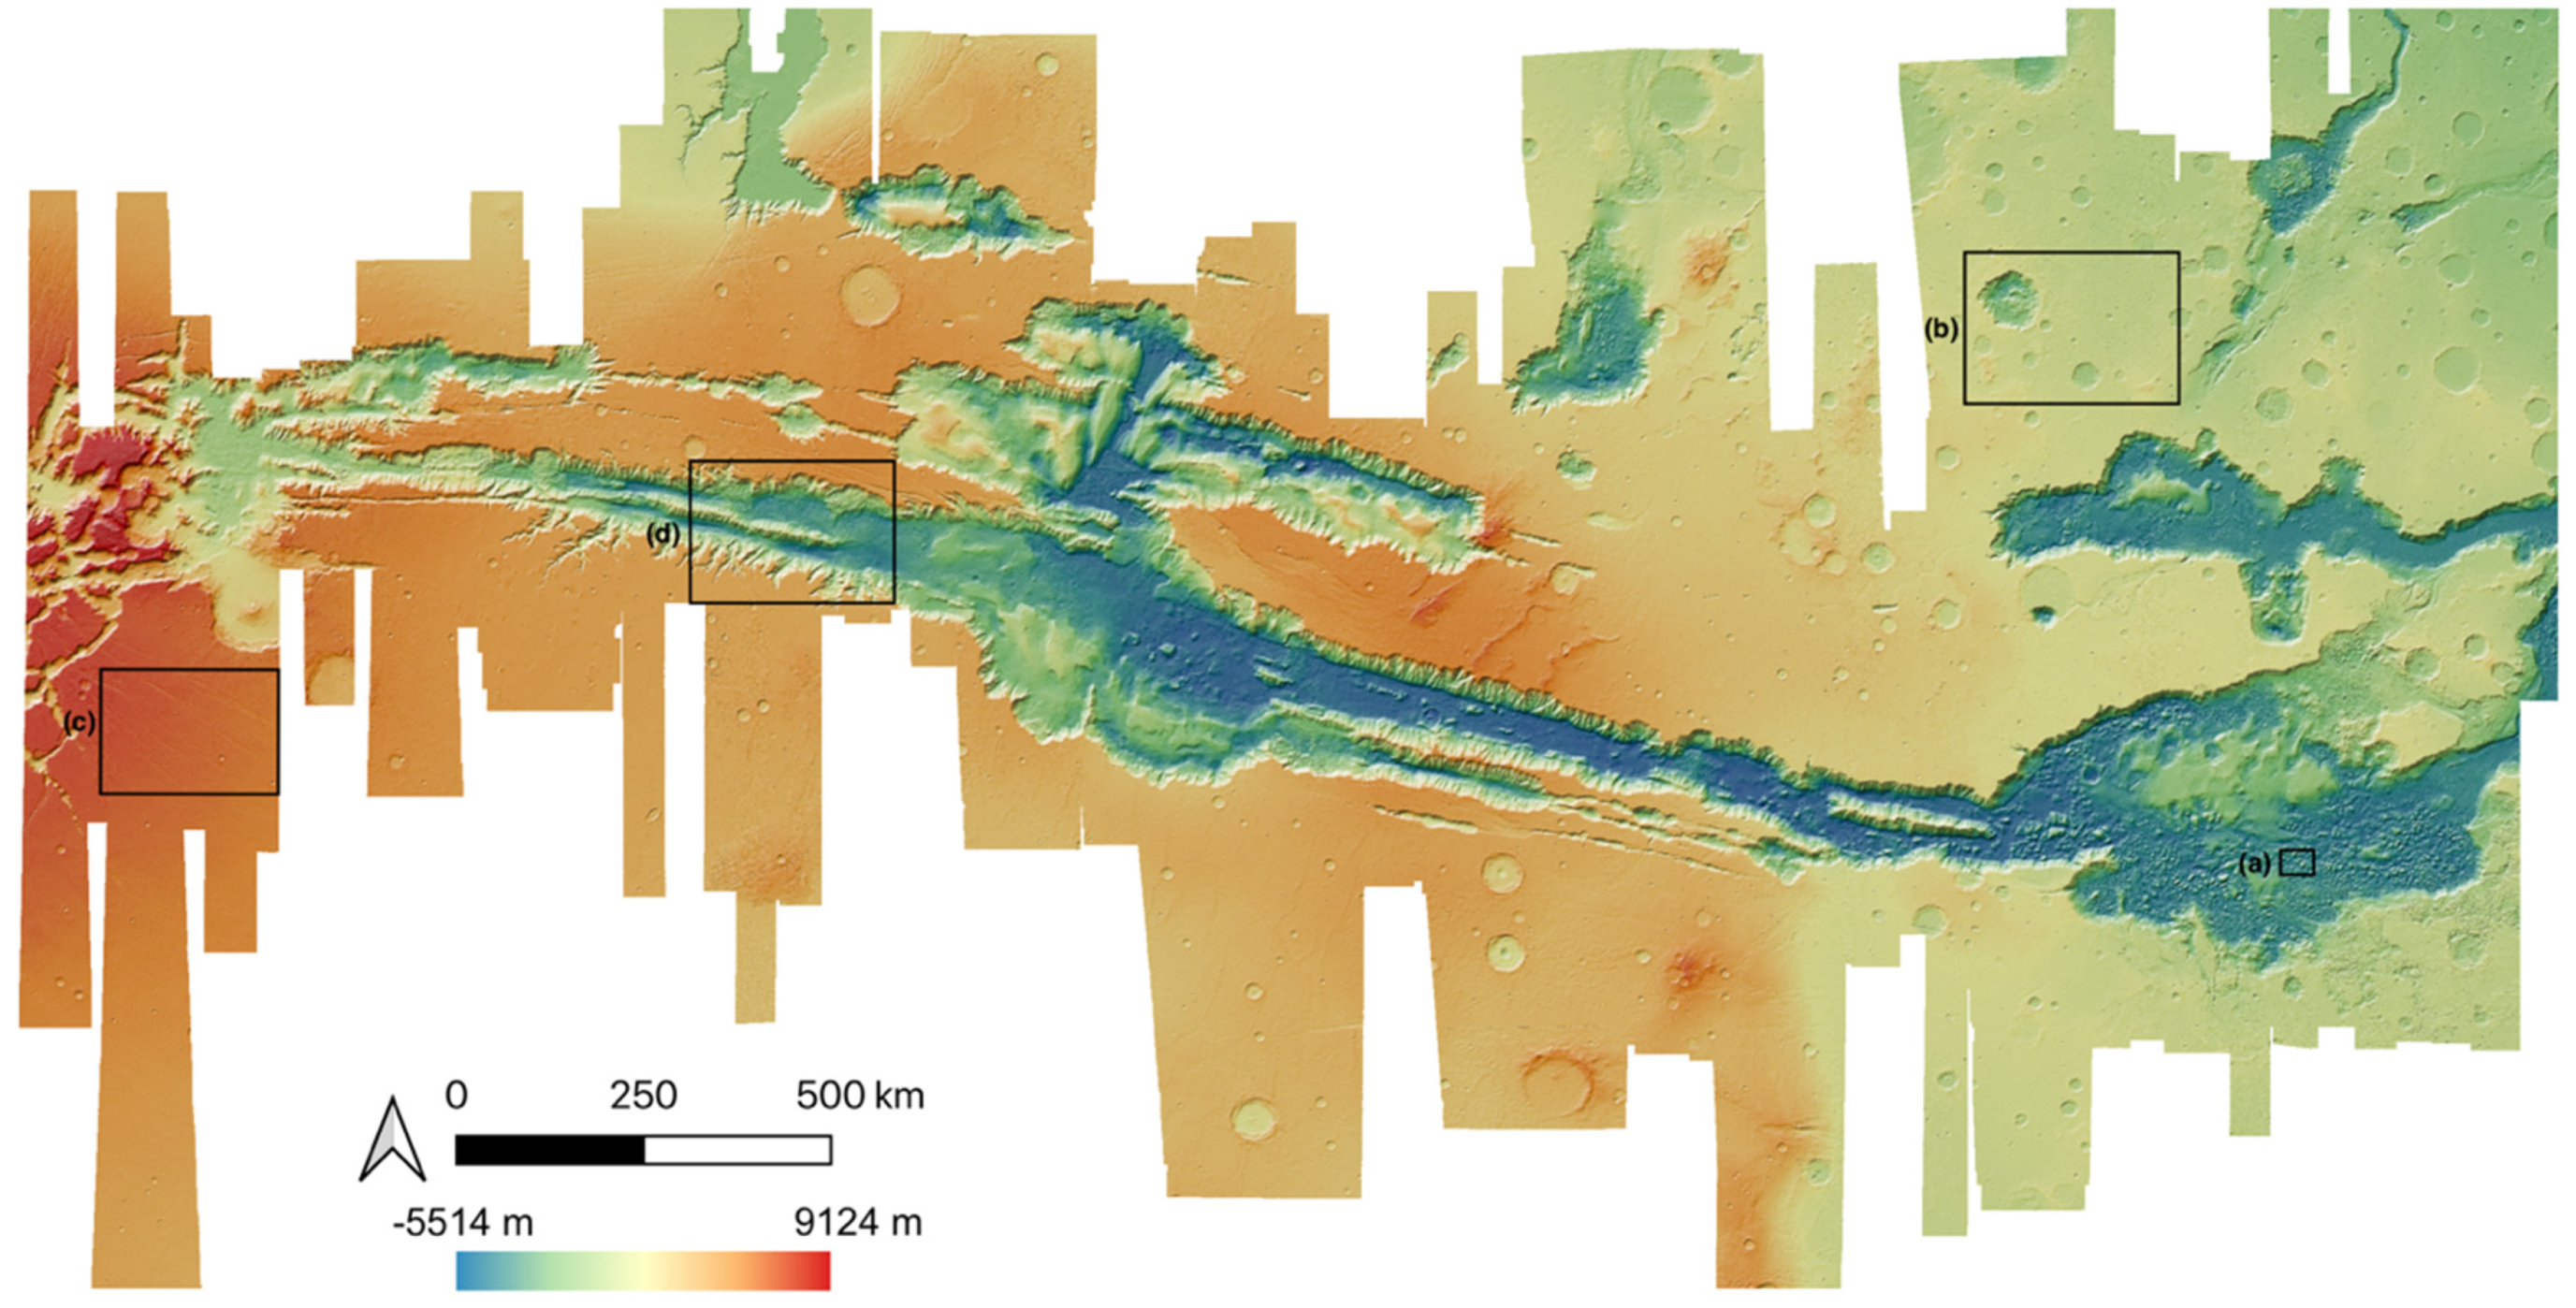
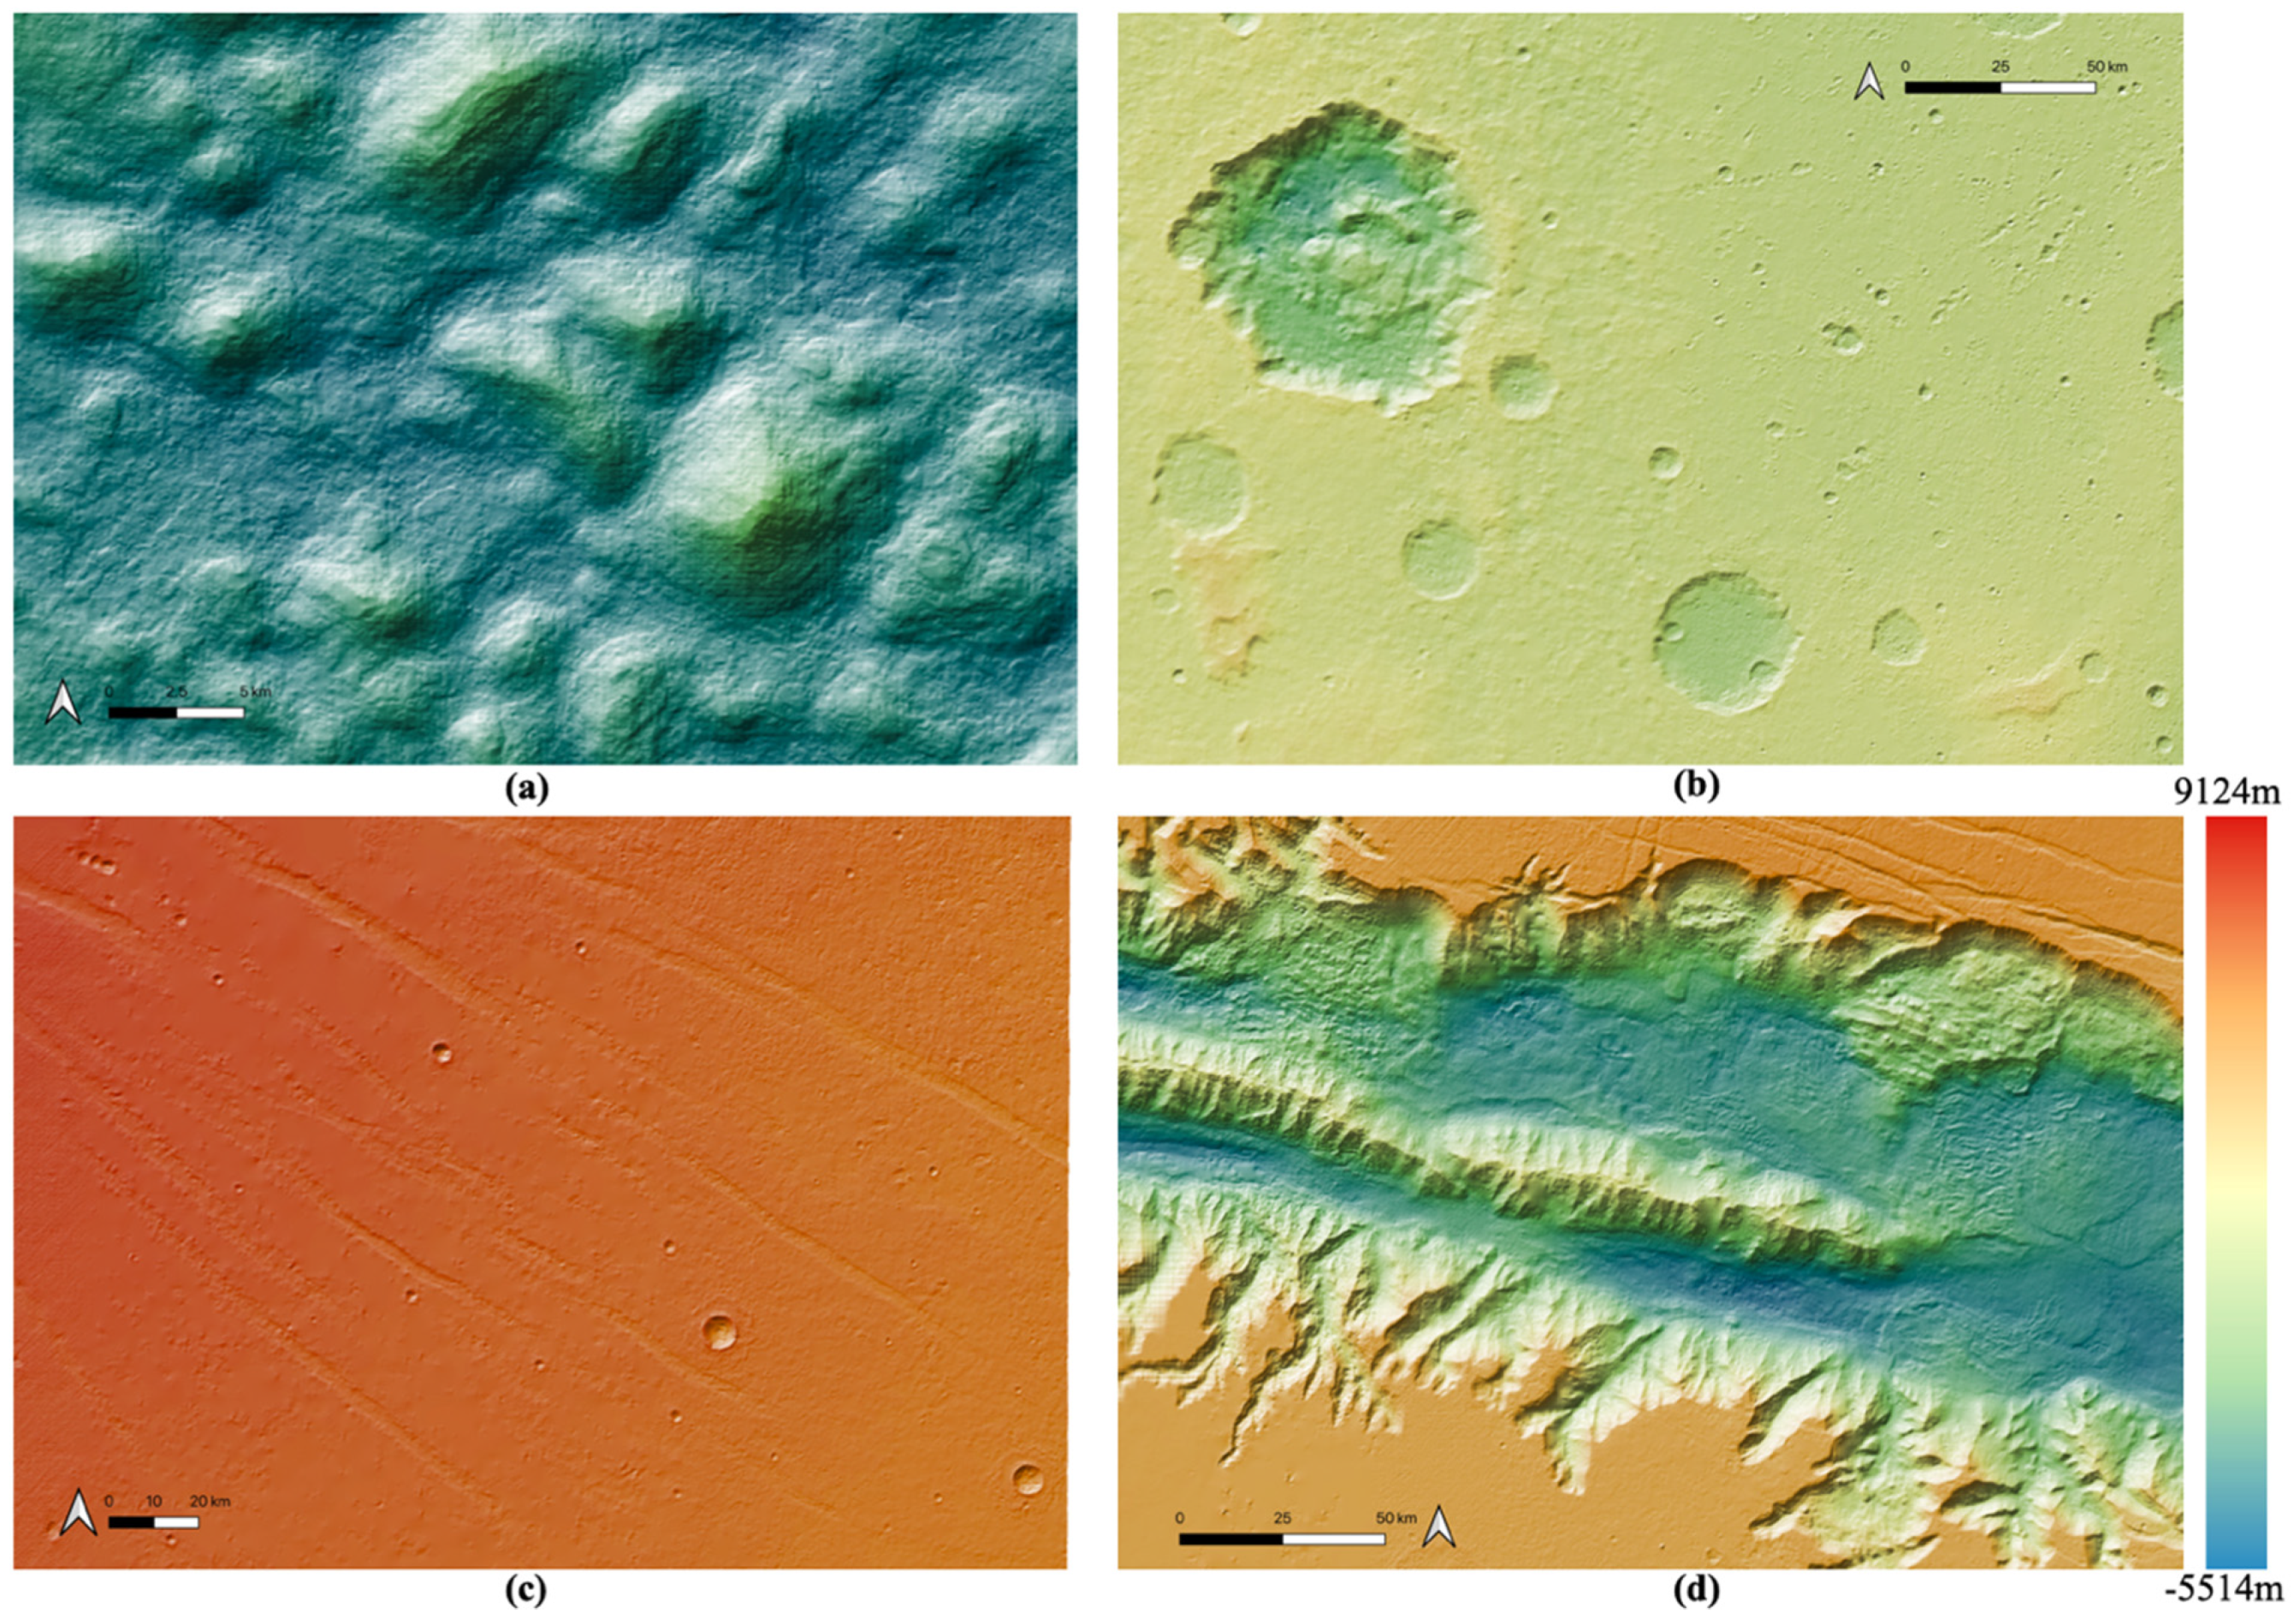
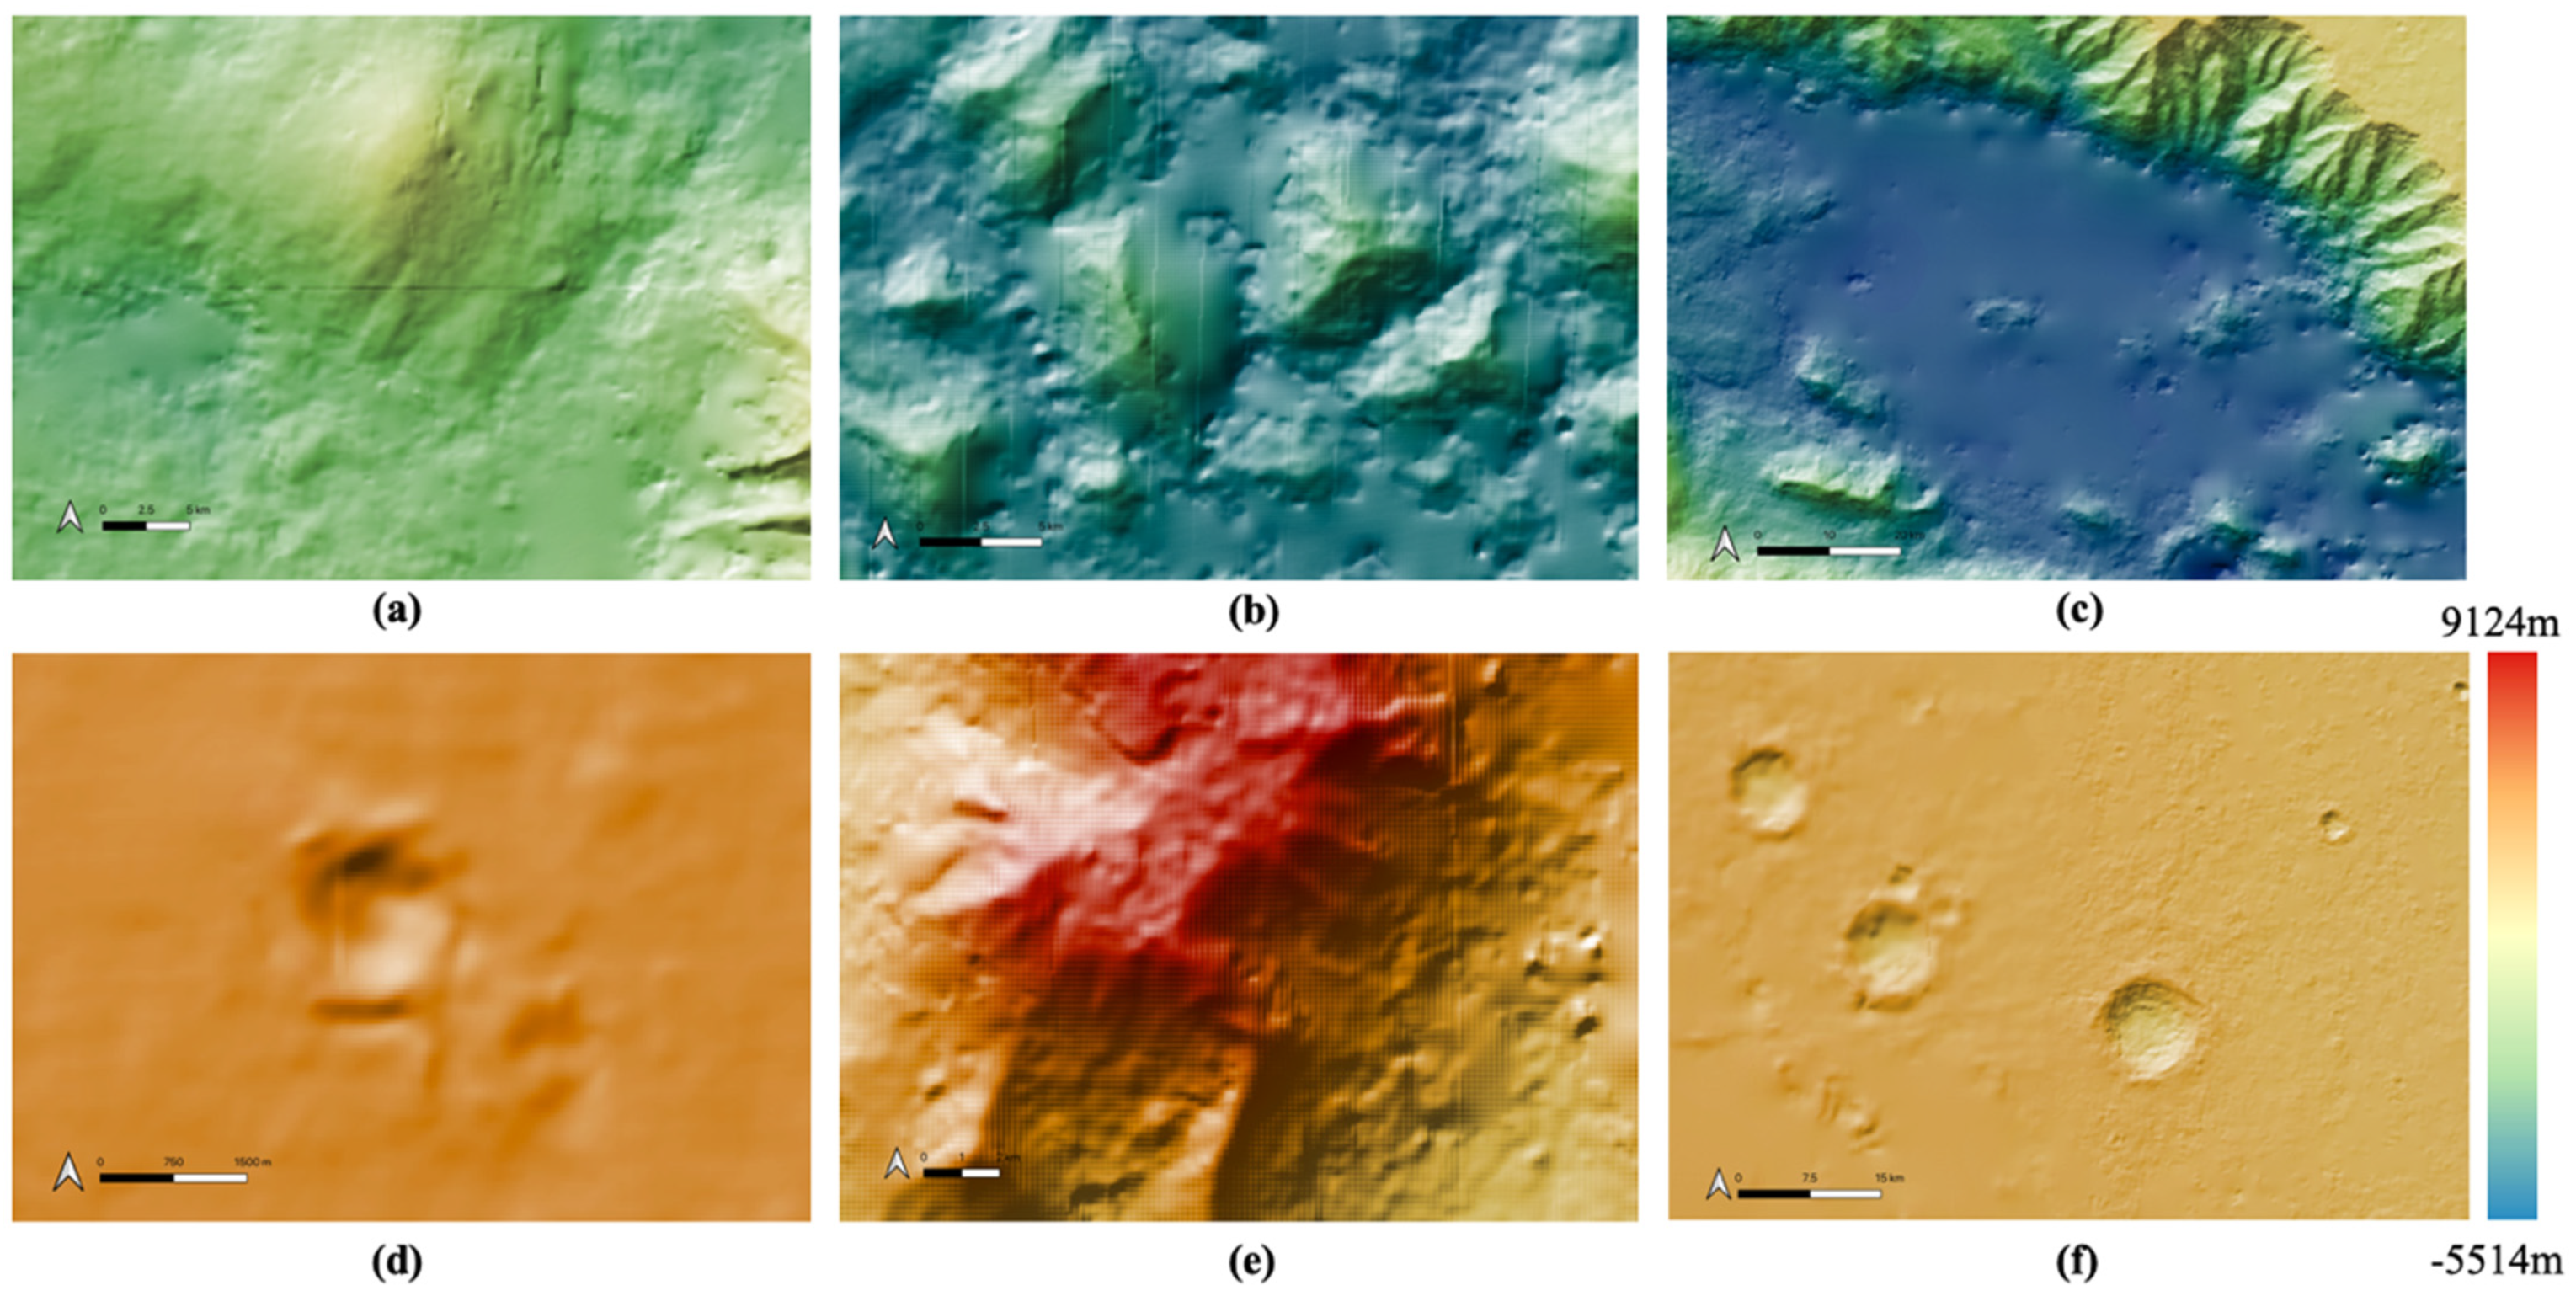
In this work, we created 11 high-quality HRSC level 4 DTMs, using a hybrid DTM processing chain that combine matching results from three different matchers, using the HRSC level 2 stereo images, to cover the gap regions from existing DLR HRSC level 4 DTMs for the Valles Marineris area. The resulting UCL level 4 DTMs are then simultaneously co-aligned with the DLR products and MOLA DTM, via a joint 3D and image co-registration process, to allow seamless mosaicing for the whole of Valles Marineris. The mosaic which just includes the DLR DTM products is shown in Figure 10. The final resulting HRSC DTM mosaic (50 m/pixel), using the 71 existing DLR DTMs and 11 newly created DTMs from UCL, is shown in Figure 11. We note that the new HRSC DTM mosaic is much more complete covering the whole of Valles Marineris area. Some cropped examples are provided in Figure 12 for zoom-in views over different terrain types, including hill/rock chaos, craters, flat surface, and valley/cliffs, within the Valles Marineris area.
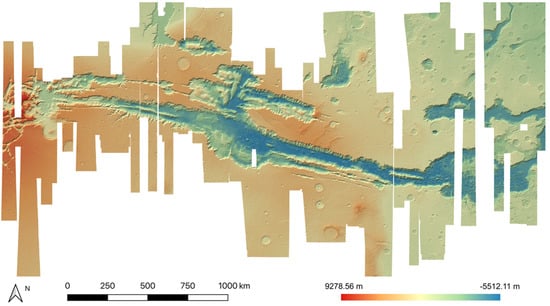
Figure 10.
HRSC DTM mosaic created only with the existing DLR HRSC level 4 DTMs, showing incomplete coverage of Valles Marineris.
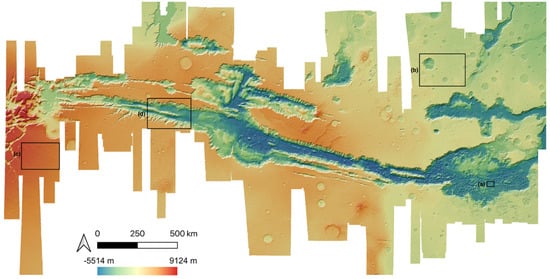
Figure 11.
The final resulting HRSC DTM mosaic at 50 m/pixel, covering the whole of Valles Marineris. The four areas indicated are shown in greater detail in Figure 12.
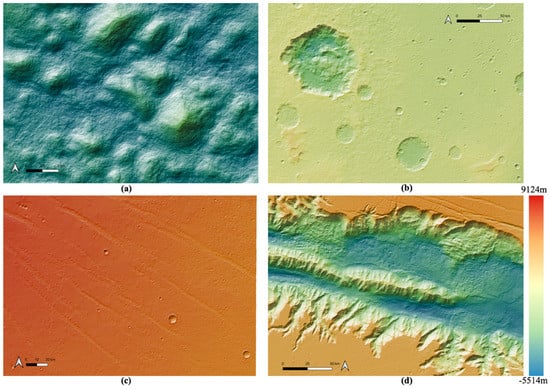
Figure 12.
Examples of zoom-in views using colourised by height and hill-shaded DTMs over different features within the Valles Marineris DTM mosaic, including (a) hilly/rock chaos area; (b) crater area; (c) flat surfaced area; (d) valley/cliff area.
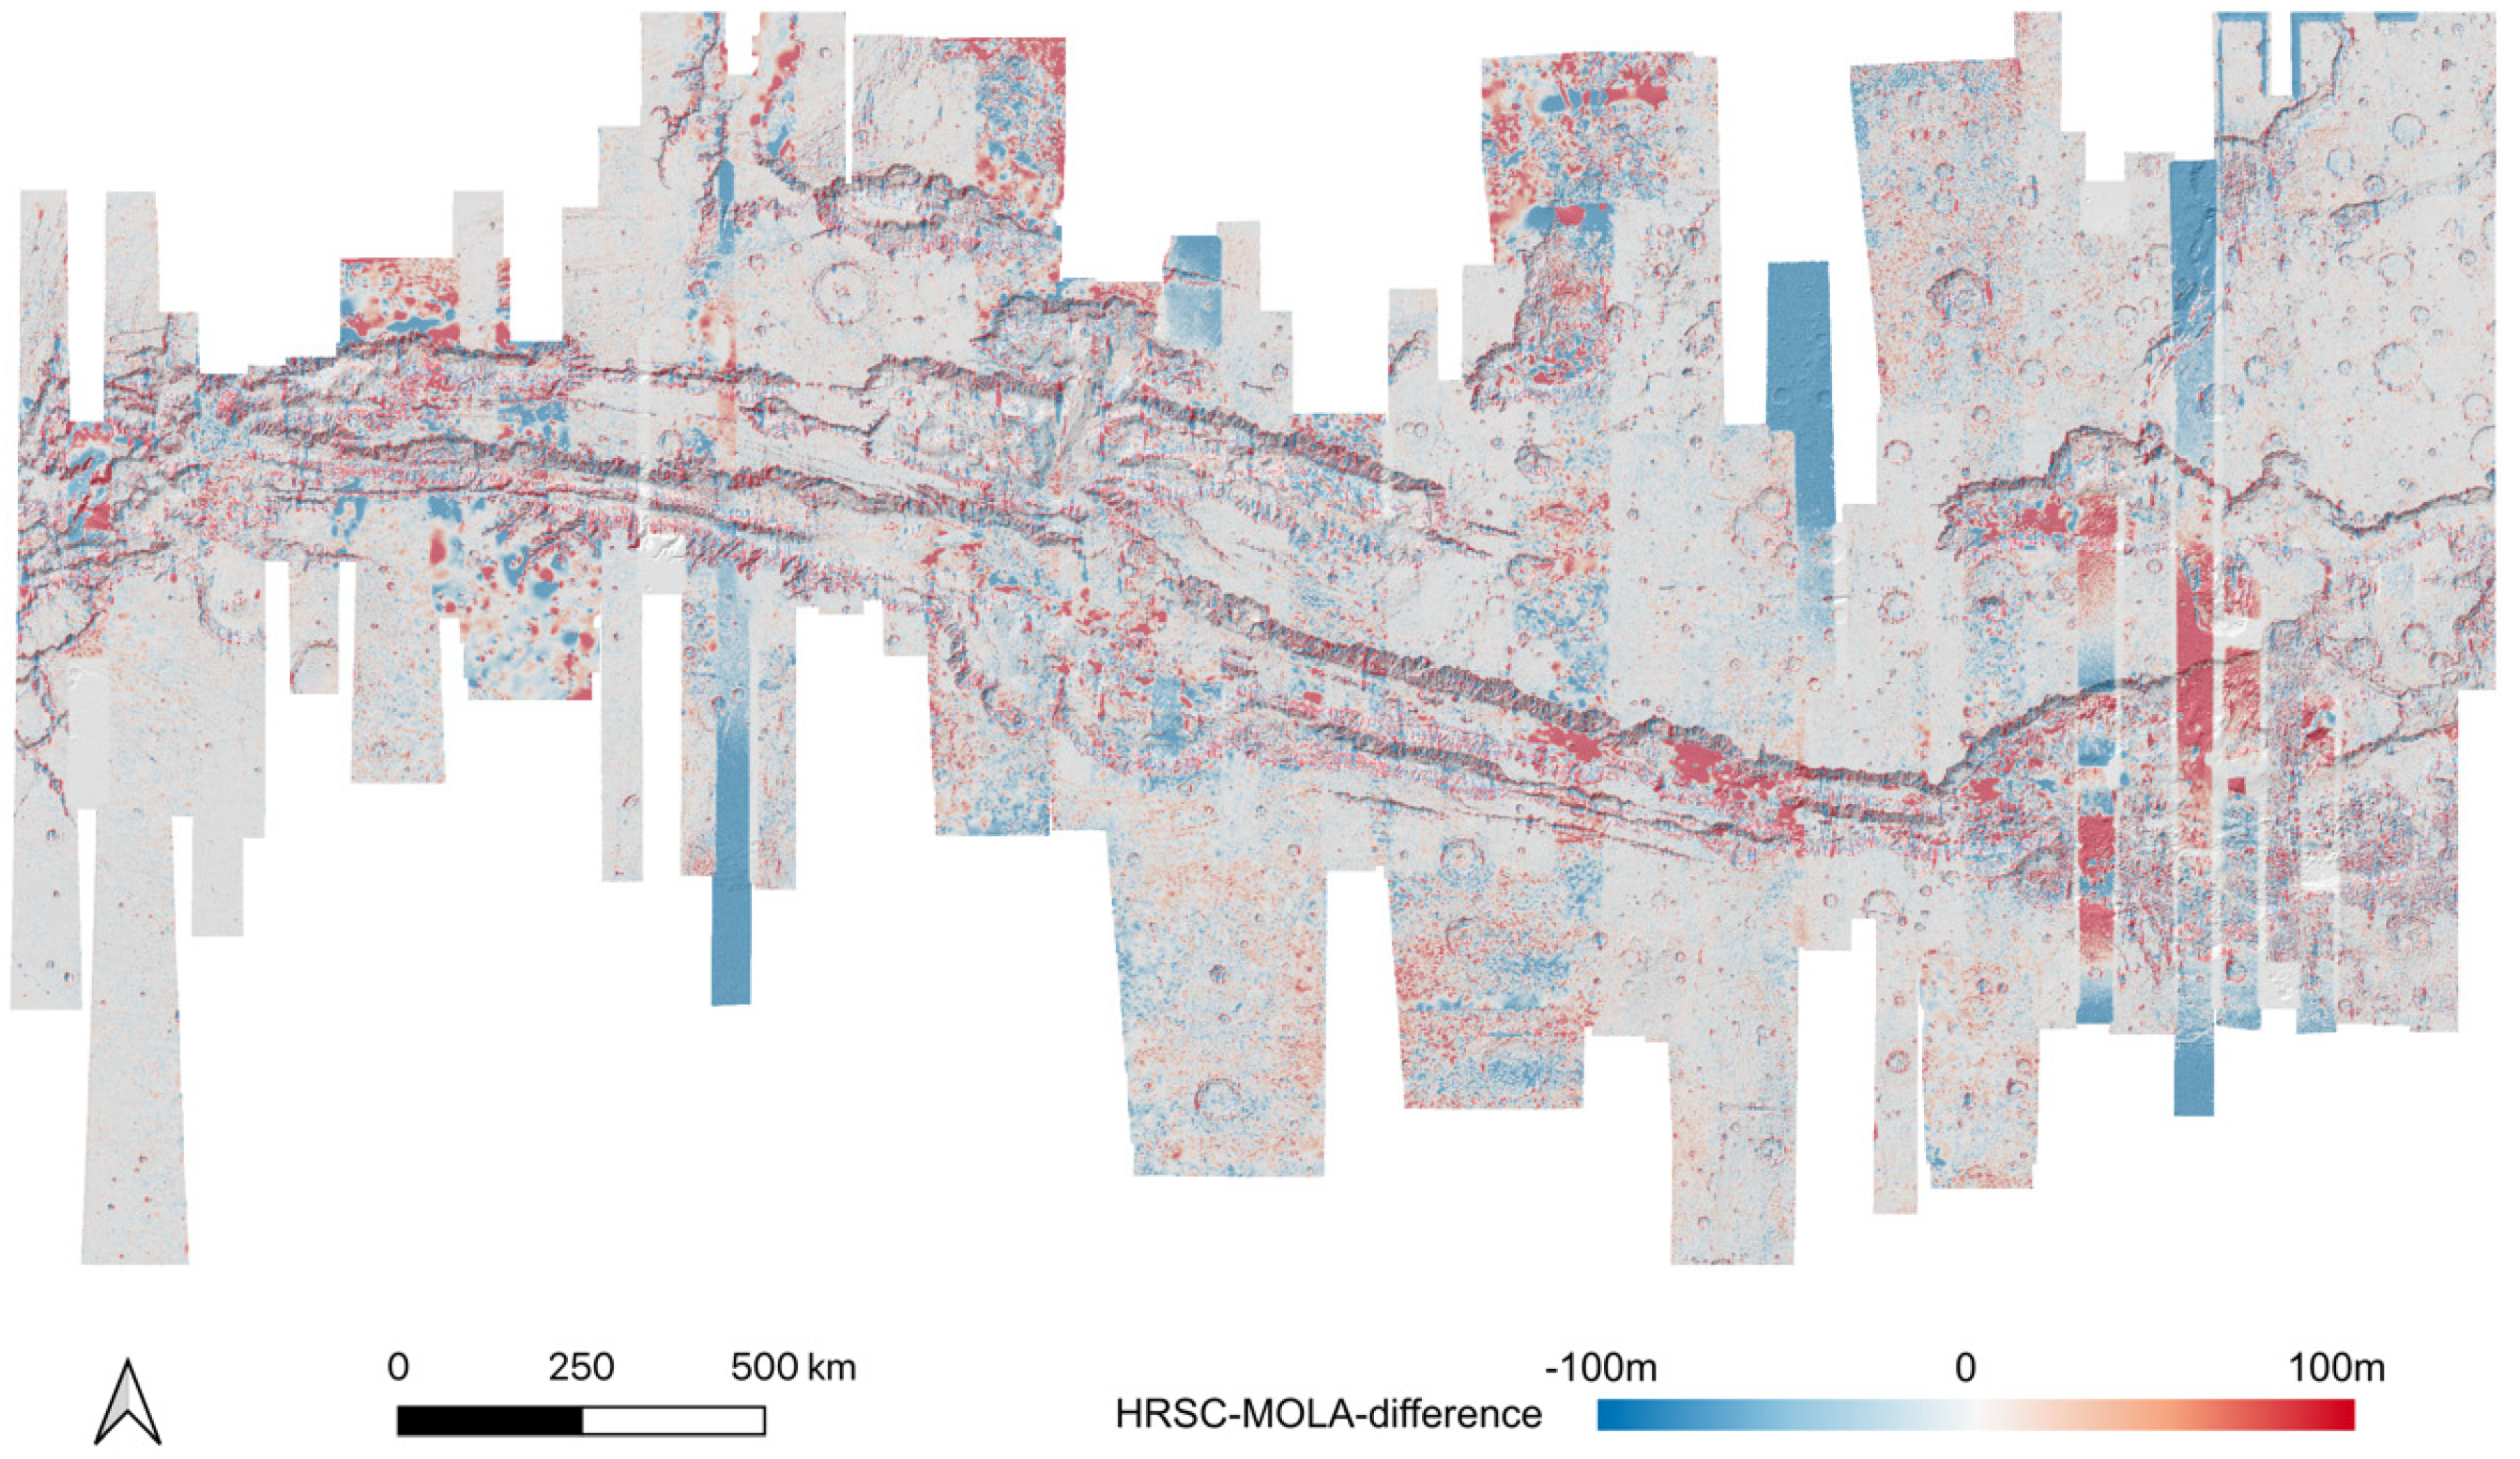
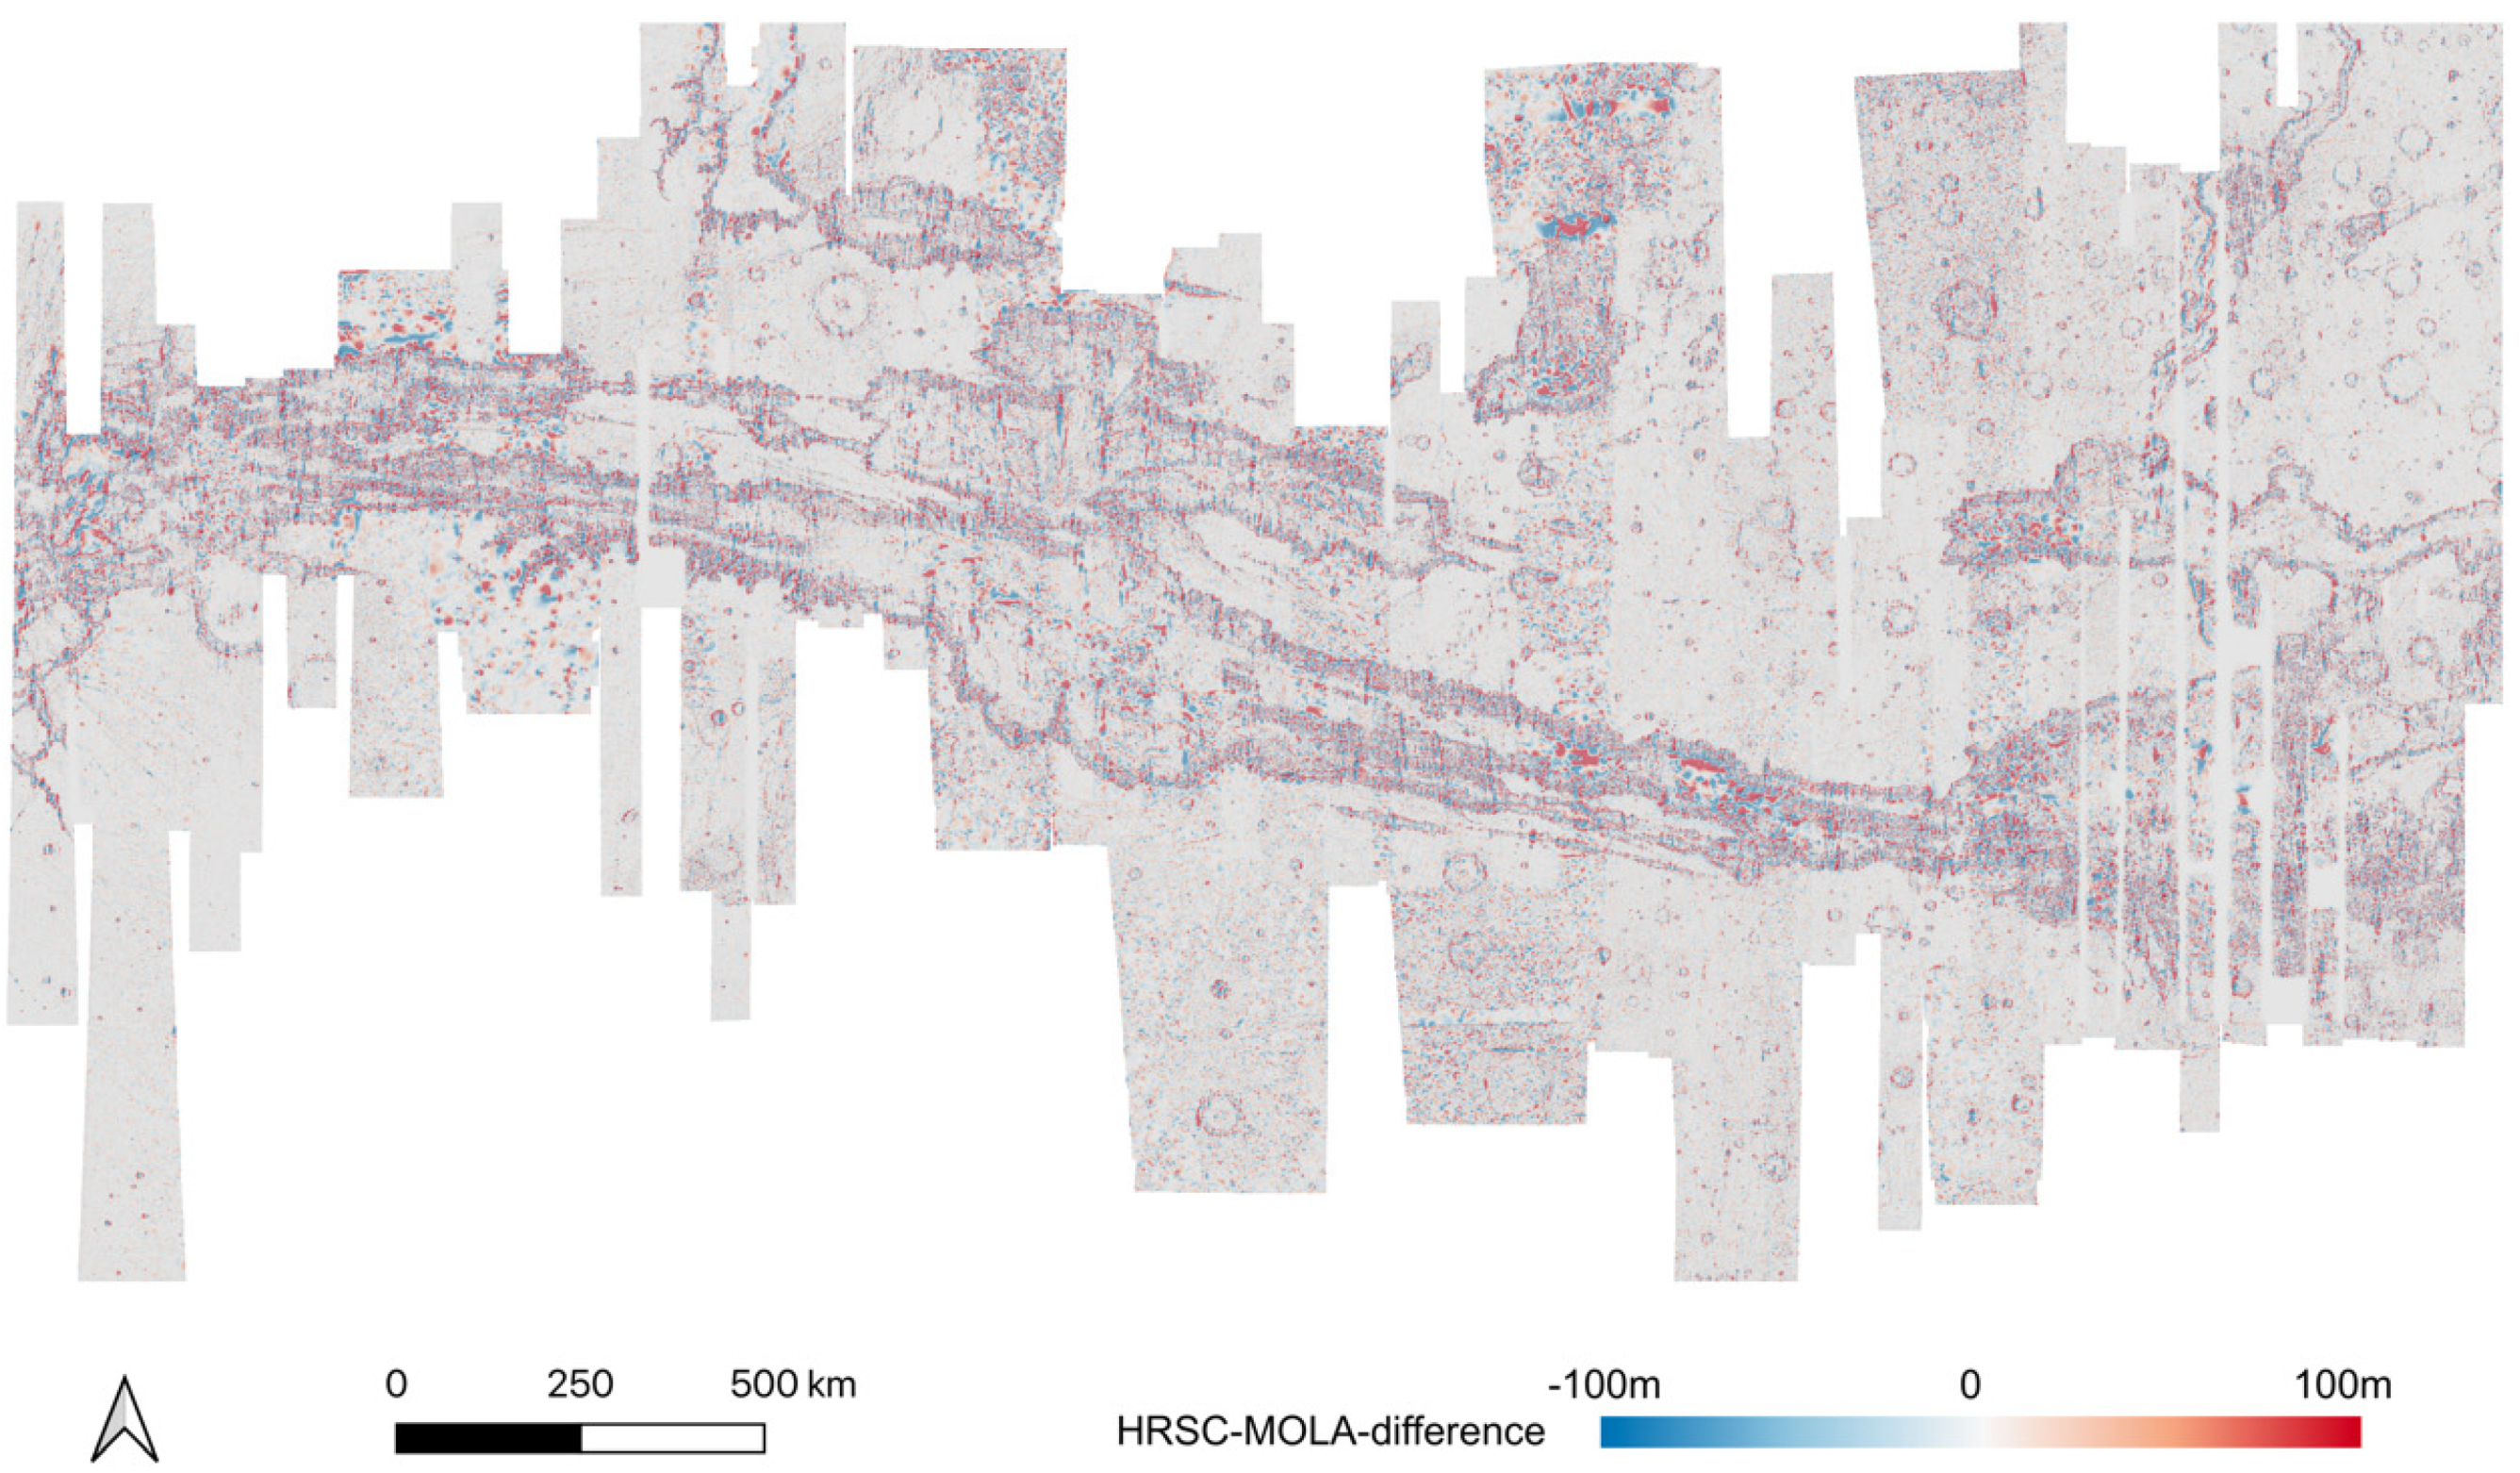
Also, the final resulting HRSC DTM mosaic has shown improved co-alignment accuracy against the MOLA DTM, which can be observed in Figure 13 and Figure 14, in comparison to the HRSC-to-MOLA difference maps (at the scale of 200 m/pixel) created before and after the proposed DTM co-alignment method (before mosaicing).
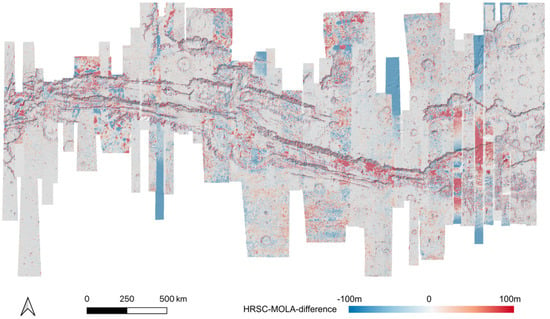
Figure 13.
HRSC-to-MOLA difference map before 3D co-alignment.
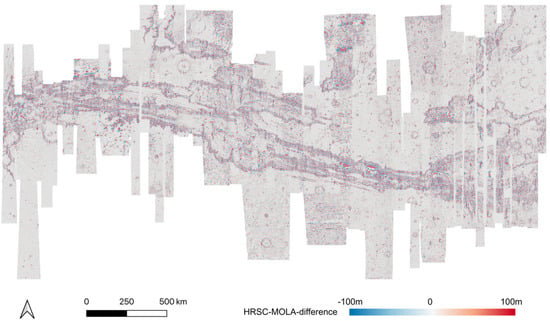
Figure 14.
HRSC-to-MOLA difference map after 3D co-alignment.
As shown in the difference maps comparing the single-strip HRSC level 4 DTMs, before (refer to Figure 13) and after (refer to Figure 14) our proposed joint 3D and image co-registration, against MOLA DTM, not only removes the systematic errors of the single-strip HRSC level 4 DTMs, e.g. jitter [38] and “tilted ends” (refer to Figure 13 for an example of these issues with jitter shown in the blue-to-red-to-blue differences and “tilted ends” where the end of a strip shows blue differences), have been corrected, but also local mis-alignments have been significantly reduced. Even though some local disagreement still exists in a few areas, most of the area, i.e., ~80.4% of all DTMs, has less than 30 m difference comparing to MOLA and about half, i.e., ~55.7% of all DTMs, has less than 15 m difference comparing to MOLA. On the other hand, without 3D co-alignment, only ~60.3% of the HRSC DTM pixels has less than 30 m difference to MOLA, and ~49.1% of the HRSC DTM pixels has less than 15 m difference to MOLA. This suggests the vertical accuracy, after the joint 3D and image co-registration, has had a significant positive improvement for large misalignments (>30 m), and some fair improvement for small misalignments (<30 m).
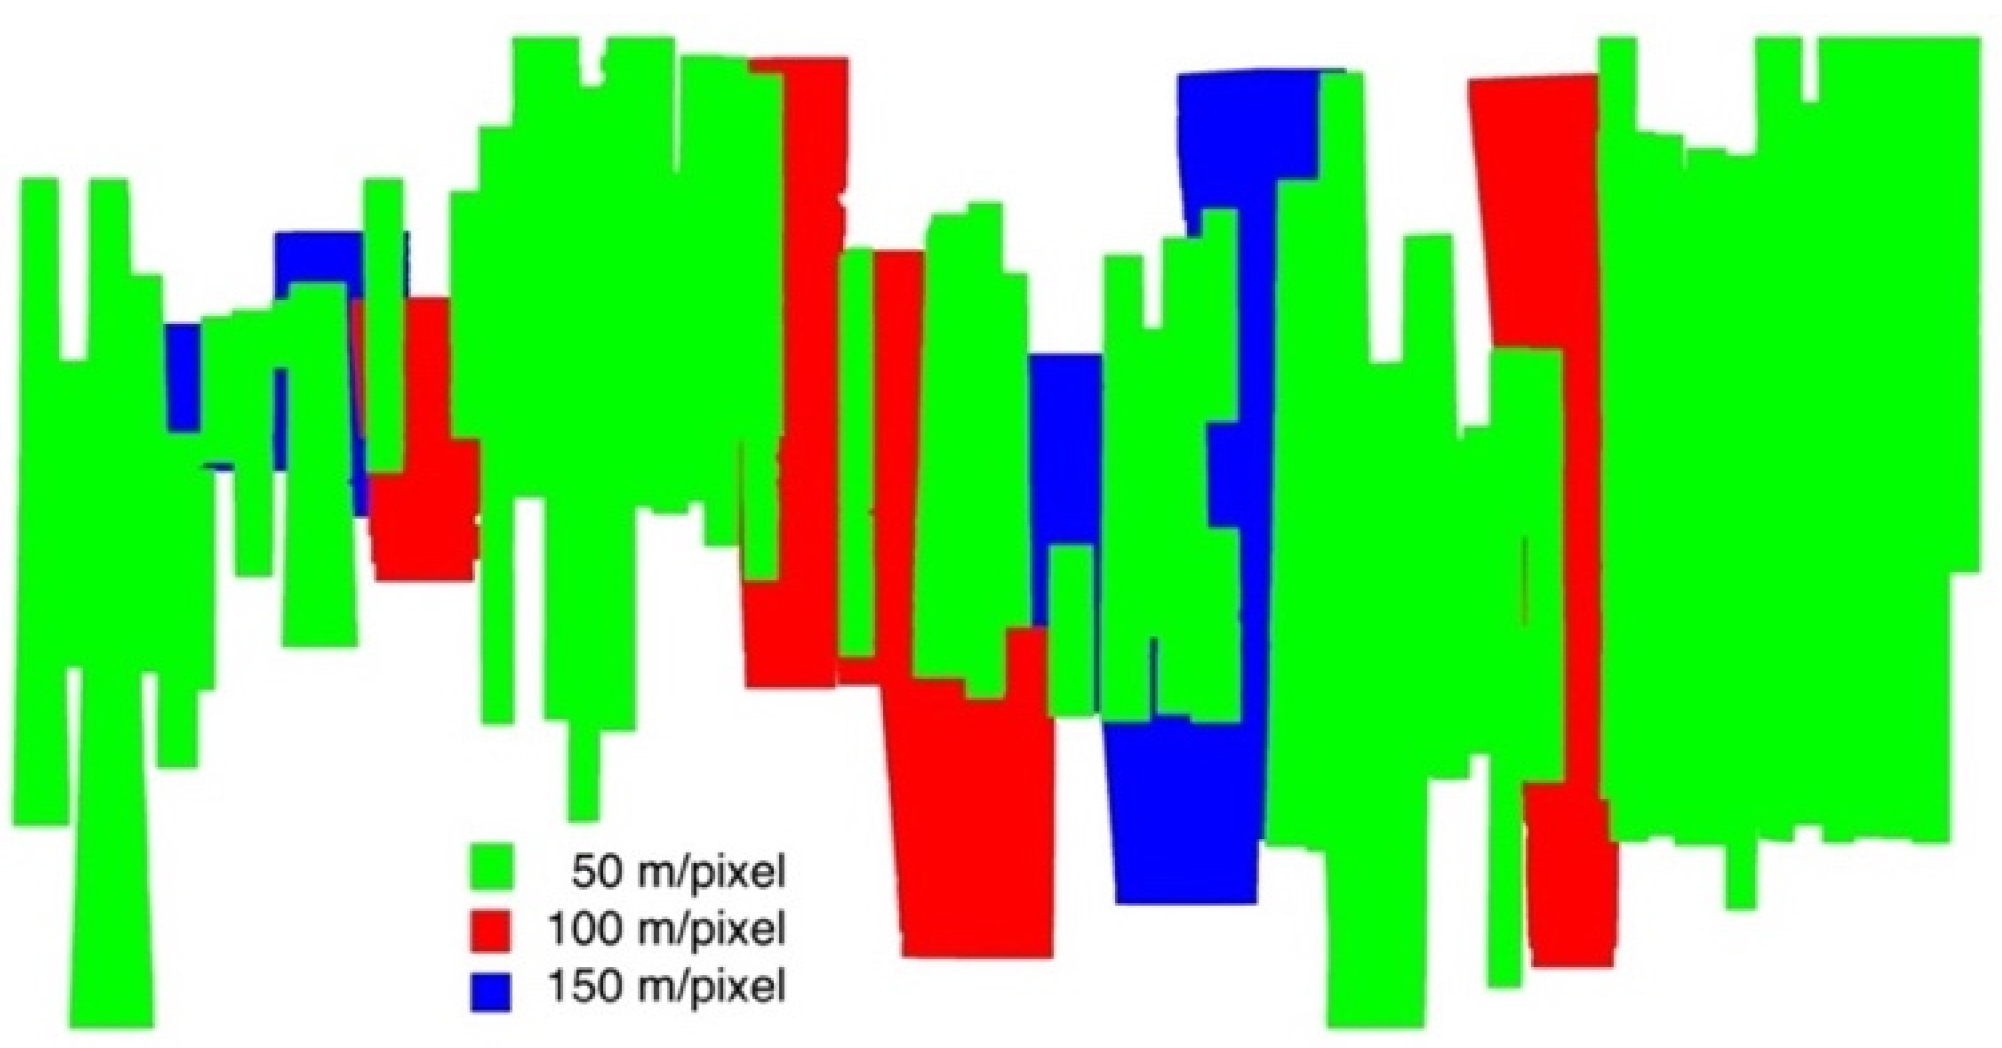
As for the mosaicing process, we used the higher resolution HRSC level 4 DTMs (57 from DLR and 11 from UCL at 50 m/pixel) in front and the lower resolution ones on the back (6 from DLR at 100 m/pixel, then 8 from DLR at 150 m/pixel). This means that although the Valles Marineris DTM mosaic is gridded at 50 m/pixel, some regions are mosaiced with upsampled 100 m/pixel or 150 m/pixel DTMs. Therefore, for those areas, they will show less detail than the areas that were mosaiced with native 50 m/pixel DTMs. Here we provide a colourised footprint figure, see Figure 15, to distinguish the native mapping resolutions of the Valles Marineris DTM mosaic. The lower DTM resolution is due to the lower resolution input stereo images, i.e., 12.5 m/pixel images produce 50 m/pixel DTMs, 25 m/pixel images produce 100 m/pixel DTMs, 50 m/pixel images produce 150 m/pixel DTMs, so Figure 15 also indicates the high-resolution and low-resolution distributions of the Valles Marineris ORI mosaic (see Section 3.2).
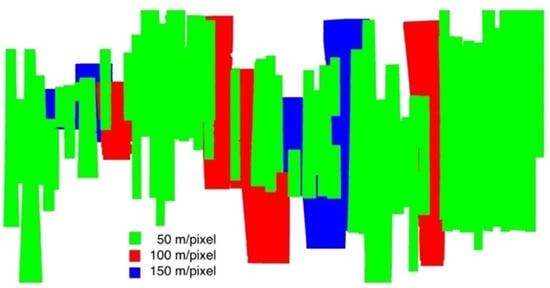
Figure 15.
Footprint map showing different native resolution (Green for 50 m/pixel, Red for 100 m/pixel, and Blue for 150 m/pixel) distributions for different regions within the 50 m/pixel Valles Marineris HRSC DTM mosaic.
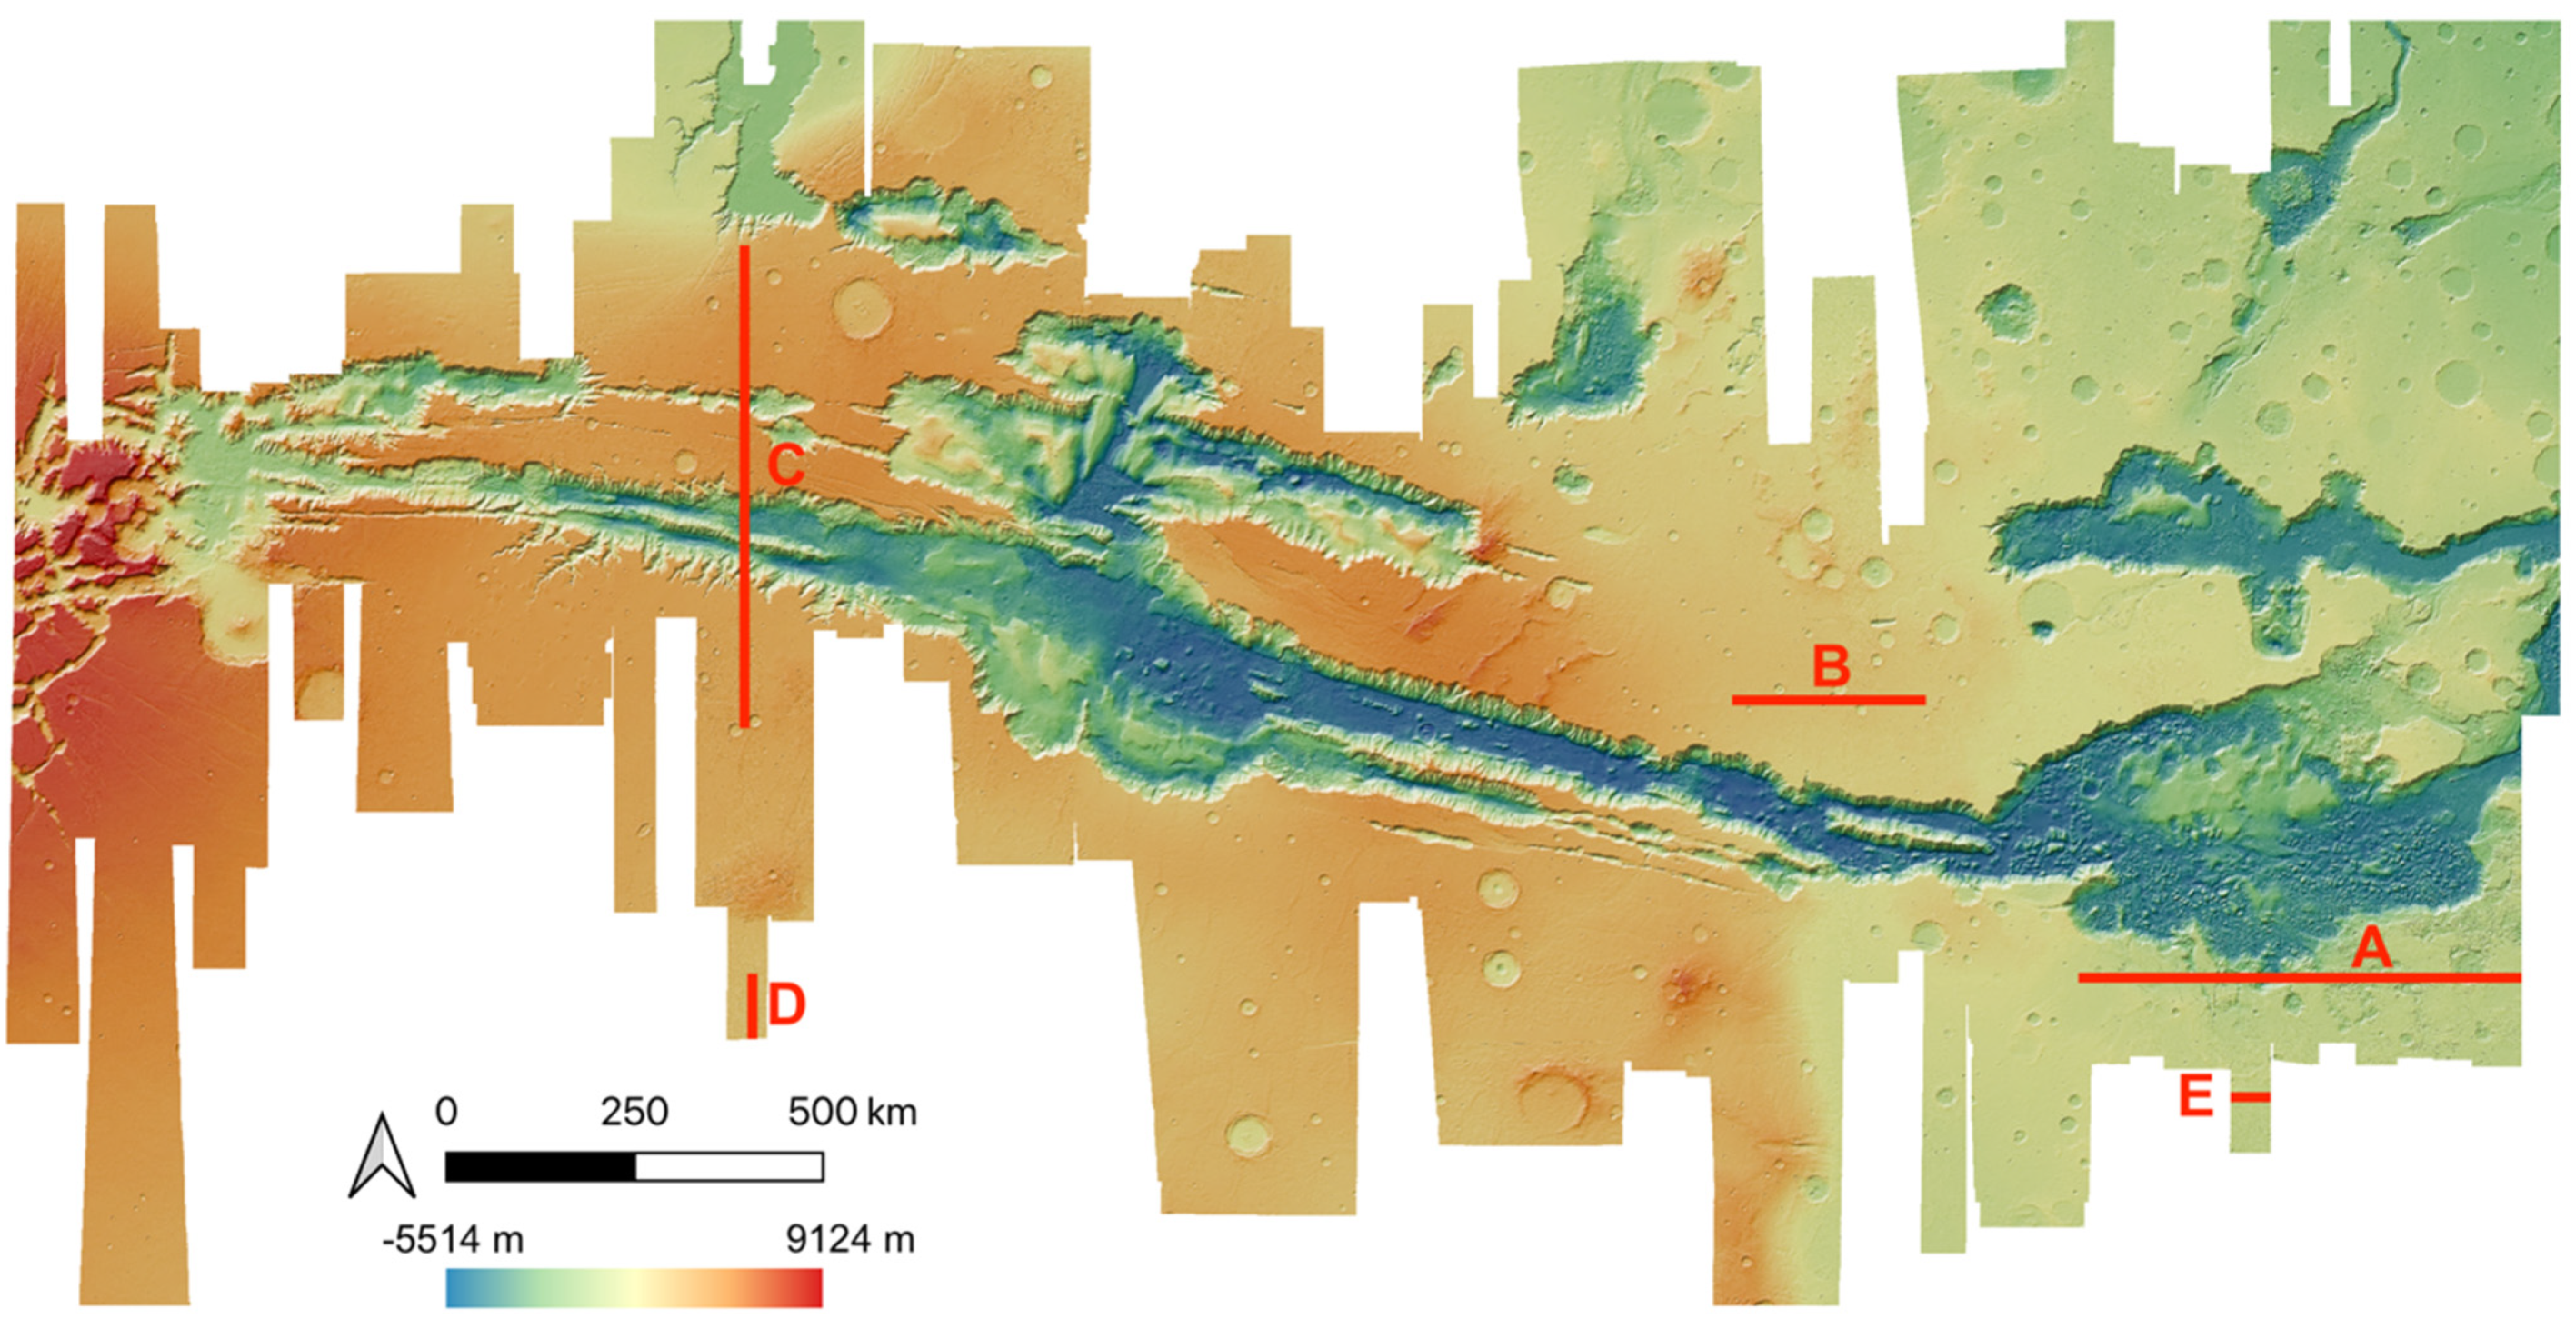
Examples of HRSC-to-MOLA profile locations are shown in Figure 16 and the results are shown in Figure 17 for Profile A, Figure 18 for Profile B, Figure 19 for Profile C, Figure 20 for Profile D, and Figure 21 for Profile E. Profile A covers a broad extent, crossing multiple DLR HRSC level 4 DTMs and UCL HRSC level 4 DTMs, and has shown smooth transitions between UCL and DLR products for the whole mosaic product. Profile B is a shorter line that contains only one UCL products in between two DLR products, a smooth transition from UCL to DLR products can be clearly observed at both sides. Also, Profile B shows no systematic cross-track offset at both ends of the UCL product. Profile C is a long vertical line crossing only one UCL product and shows no systematic along-track offset over a larger extent. On the other hand, Profile D is a shorter vertical line crossing the edge of the same UCL product shown in Profile C. Profile D shows the details of the HRSC DTM compared to MOLA DTM as well as good alignment between the two. Also, Profile D has shown that, after our 3D co-alignment process, there is no along-track warping issue near the DTM edge, which has been a common issue for stereo-derived DTMs. Finally, Profile E shows a short horizontal line, crossing both sides of the border of the UCL product. Profile E also shows the details of the good alignment of the HRSC DTM against the MOLA DTM. Also, Profile E shows that there are no across-track warping errors at either side of the DTM edges.
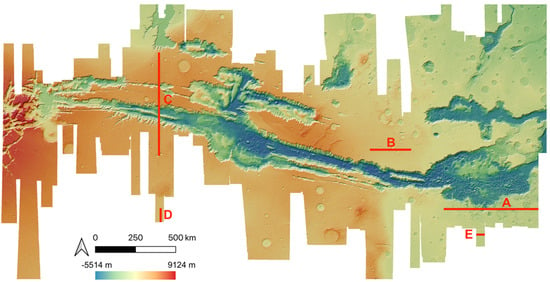
Figure 16.
HRSC DTM mosaic showing locations of the 5 profile lines (A, B, C, D, E).

Figure 17.
Height comparison between HRSC DTM (Red) and MOLA DTM (Blue) for Profile A. The DLR HRSC level 4 DTMs and UCL HRSC level 4 DTMs are labelled in Yellow and Green colour, respectively.

Figure 18.
Height comparison between HRSC DTM (Red) and MOLA DTM (Blue) for Profile B. The DLR HRSC level 4 DTMs and UCL HRSC level 4 DTMs are labelled as Yellow and Green colour, respectively.

Figure 19.
Height comparison between HRSC DTM (Red) and MOLA DTM (Blue) for Profile C. This profile line only contains the UCL HRSC level 4 DTM.

Figure 20.
Height comparison between HRSC DTM (Red) and MOLA DTM (Blue) for Profile D. This profile line only contains the UCL HRSC level 4 DTM.

Figure 21.
Height comparison between HRSC DTM (Red) and MOLA DTM (Blue) for Profile E. This profile line only contains the UCL HRSC level 4 DTM.
3.2. HRSC ORI Mosaic for Valles Marineris
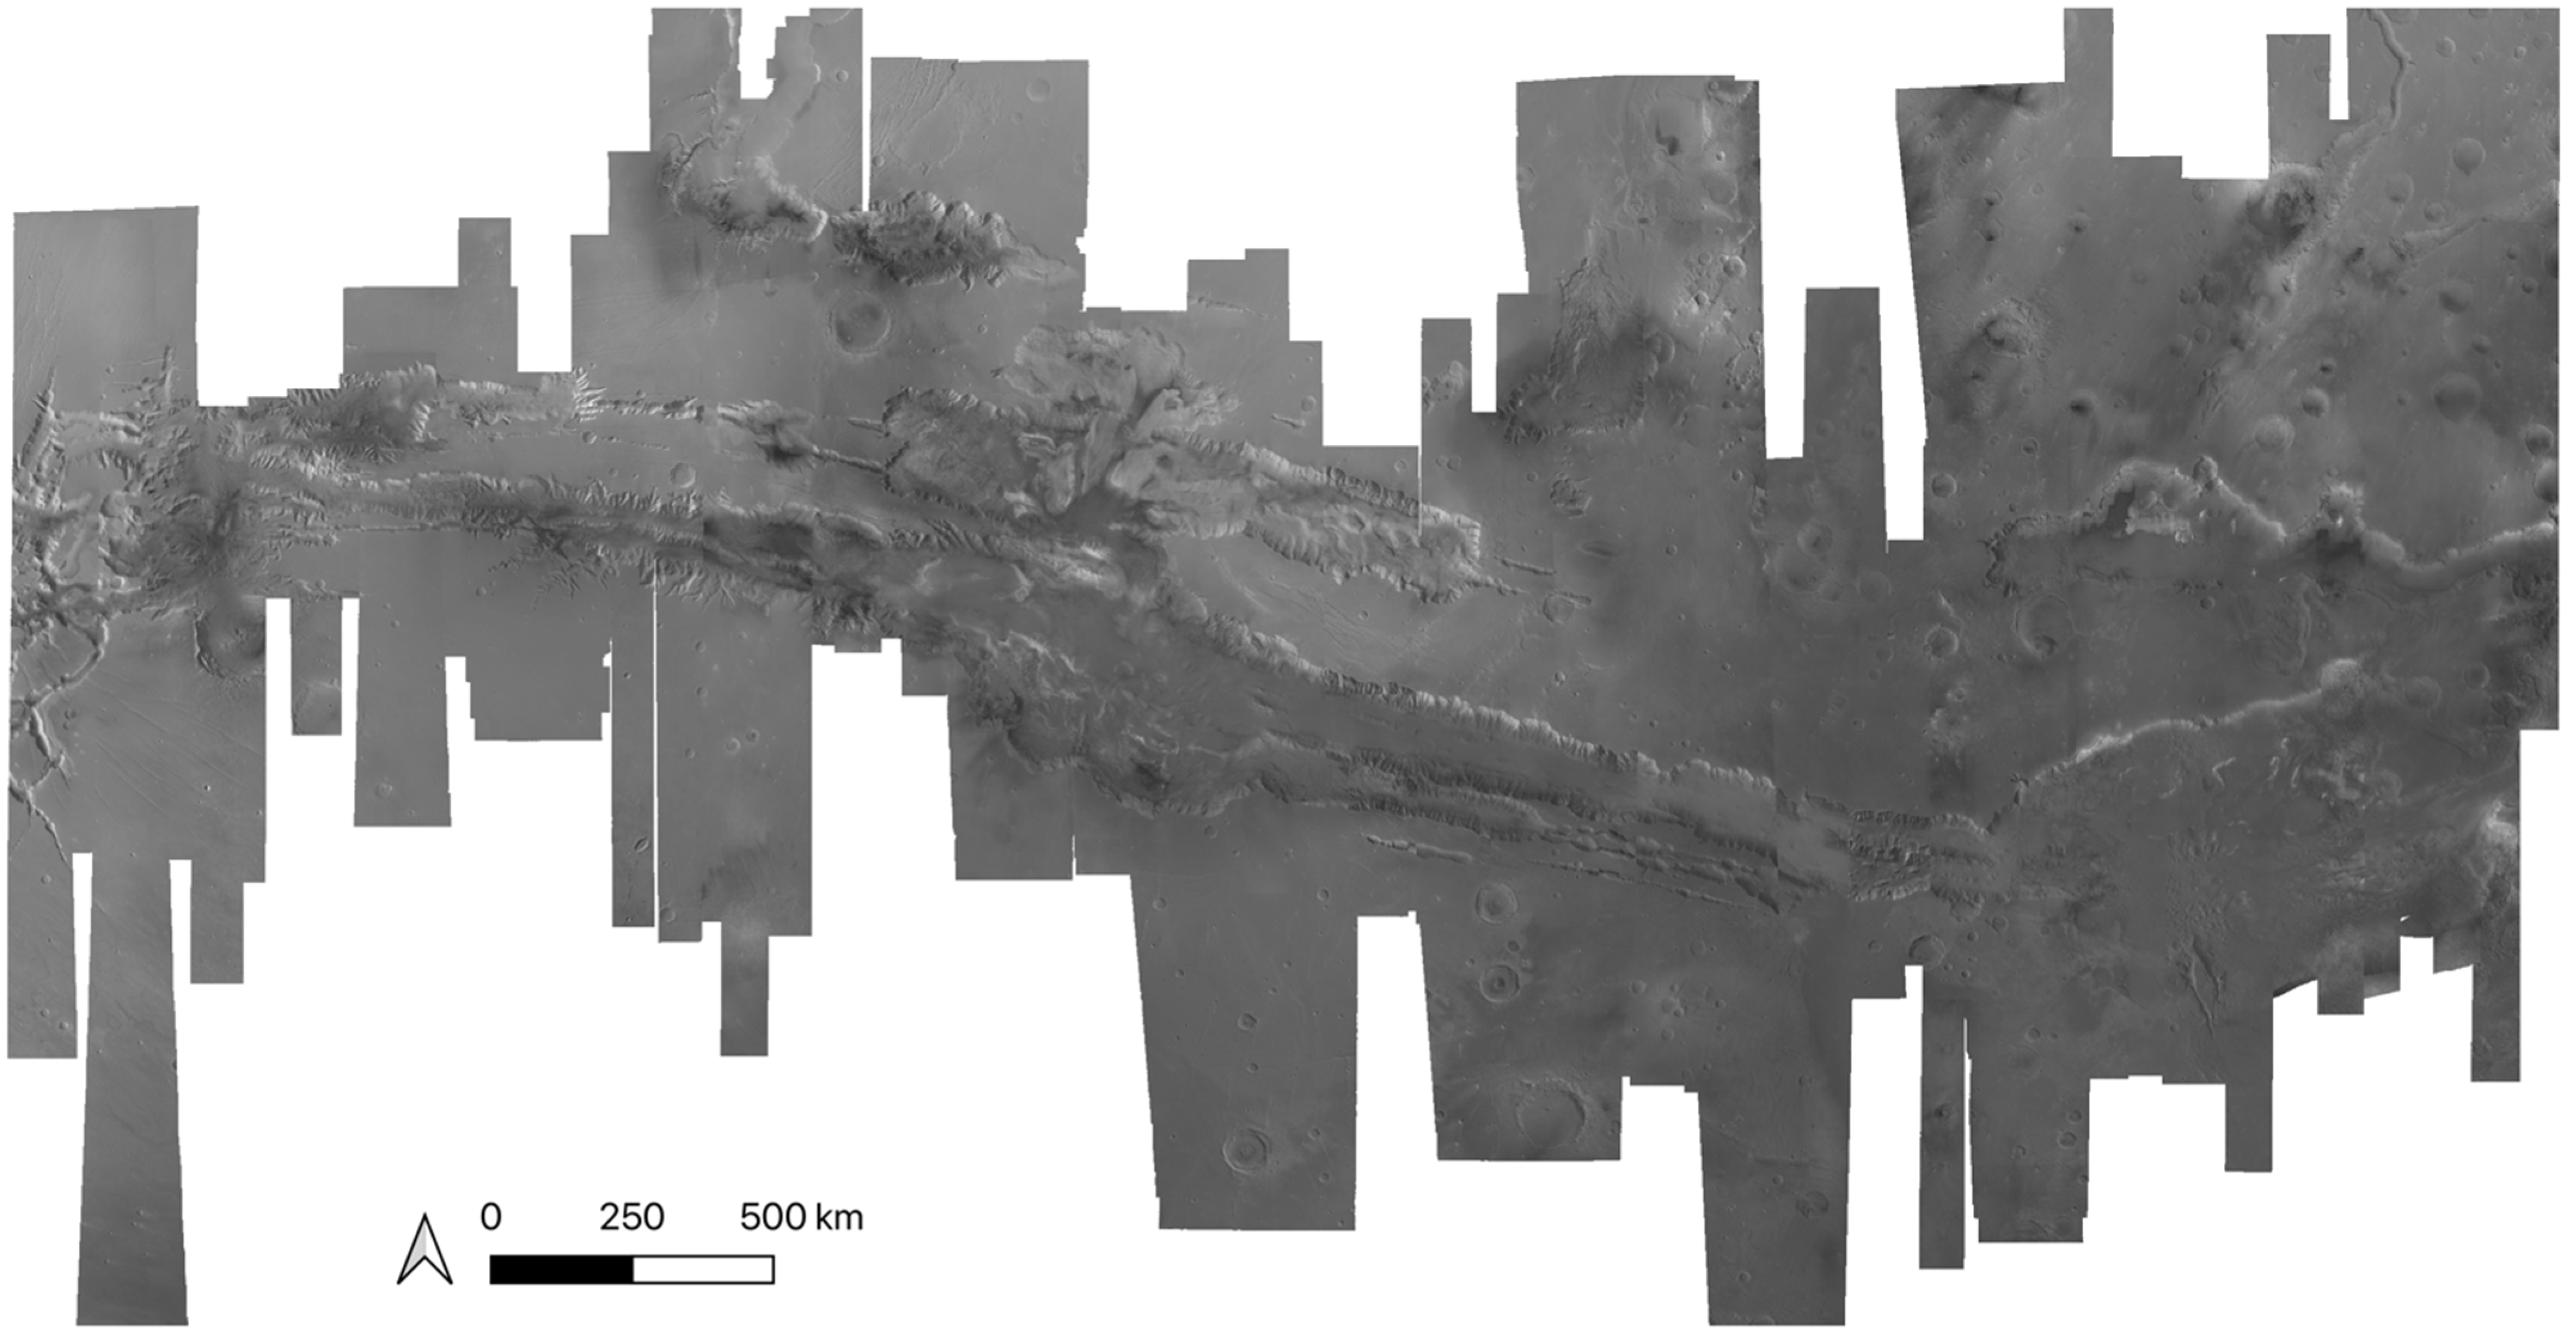
The mosaic from the orthoimages after Lambertian correction, brightness referencing, manual contrast adjustment and image sequencing is shown in Figure 22. In general, the transitions from one image to another are seamless, although in a few cases it is possible to see some change in image quality. It should be noted that HRSC observations, due to its elliptical orbit has equator crossing overpasses at different times of day, so that the solar illumination is not usually consistent between one strip and the next. There are also a couple of images which show morning fog on the floor of the valley for which there is still no alternative coverage: the transition from fog to no fog remains visible. The product was constructed at 12.5 m/pixel in 16-bit greyscale, and totals 120 GB.
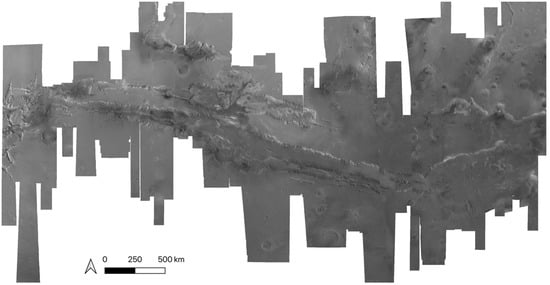
Figure 22.
HRSC 12.5 m/pixel image mosaic of Valles Marineris.
3.3. Access to the Products
The resultant HRSC DTM and ORI mosaic for the Valles Marineris area will be viewable through an interactive webGIS system (http://www.i-mars.eu/web-gis (accessed on 21 March 2021)) developed at the Free University Berlin [52]. The mosaic products are also being made publicly available through the ESA Guest Storage Facility (GSF) via their DOI [53] (see list of DOIs at https://www.cosmos.esa.int/web/psa/ucl-mssl_meta-gsf (accessed on 21 March 2021)). A link will also be established between the webGIS and the source-file and vice versa to ease visualisation and access/downloading.
4. Discussion
This paper presented our 3D mapping and mosaicing work of Valles Marineris using HRSC level 2 stereo images and pre-existing level 4 products. We highlighted a collection of methods, in order to produce the resultant HRSC DTM and ORI mosaic, which include a new hybrid HRSC DTM processing chain for single-strip DTM production, a joint 3D and image co-registration system to co-align all single-strip products with each other and simultaneously co-align with MOLA DTM, and finally an ORI co-registration and mosaicing method to create the ORI mosaic.
The proposed hybrid stereo matching method may not be practical for general stereo mapping tasks due to its high computational load. However, it is capable of achieving better quality for small-to-medium sized 3D reconstruction jobs comparing to the experimental single-matcher driven methods. The hybrid method can also be used to combine other unique matchers as far as they provide unique advantages over different circumstances of stereo matching. Similarly, if a stereo matching algorithm is highly dependent on the set parameters, then this hybrid method can also be applied to improve the stereo result by merging different disparity maps produced with different parameters of the same matcher. In future experiments, we plan to explore the advantages and disadvantages of more global matchers and, as well as deep-learning based methods, that have been proven successful in the field of stereo vision (https://vision.middlebury.edu/stereo (accessed on 21 March 2021)) and try different combinations for more robust and more accurate matching of planetary images. The disparity blending scheme proposed at the disparity merging step, can also be improved in future studies, as currently it only uses a small number (nearest 8 neighbours) of spatial information of the disparities. For example, if the disparity blending scheme considers a larger group of relevant neighbouring disparity values using the idea of co-kriging [54], the blended disparity might have better robustness towards matching artefacts and gaps.
Note that the HRSC stereo images do not normally have significant brightness/contrast/clarity/shadow differences between different off-nadir views as the HRSC instrument acquires continuous along-track acquisitions in a single orbit for stereo images (minimal time interval of up to ~30 seconds). However, for across-track repeat images such as CTX and HiRISE stereo, there can be substantial differences in image brightness/contrast/shadow, and the aforementioned clarity differences caused by different native resolution and noise level is a common challenge for HiRISE stereo. The proposed HRSC hybrid DTM processing chain can be further applied to produce robust results over CTX and HiRISE stereo images.
As for the proposed joint 3D and image co-registration method, one of the key advantages is its high spatial and vertical alignment accuracy to the reference data, as we have demonstrated in the difference map shown in Figure 14 and follow-up profile analysis. The joint 3D and image co-registration method makes use of the finer-scale image-to-image correspondences as initial and “landmark” correspondences in a coarser-scale 3D-to-3D matching scenario. However, the main limitation for this method is that it always requires a reference data. Where there is more than one sequential co-alignment steps needed, as described in Section 2.4 (d), there may be an accumulated HRSC-to-HRSC error in the centre, even though the HRSC-to-MOLA error is minimised. Also, the BA/SPA procedure updates the orientation data to correct image and DTM distortions. Therefore, it can be advantageous to perform such relative adjustment as a first step before any further improvements on 3D co-alignment, and even essential if there is a large distortion in any of the input HRSC level 2 stereo images. No such incidences were observed here.
In this work, we assume the existing DLR HRSC level 4 v50+ products (initially) and MOLA DTM are trustable reference data. Note that our proposed joint 3D and image co-registration method is not meant as a replacement of the BA/SPA procedure for initial (and batch) HRSC corrections. Instead, it is meant to act as an alternative method for new target HRSC corrections, where there are sufficient overlapping reference products, and also a complementary method to improve the HRSC-to-MOLA co-alignment after BA/SPA. All HRSC single-strip DTMs (both UCL and DLR) are finally corrected against MOLA DTM, assuming there are no significant artefacts or topographical changes at the MOLA scale.
Regarding the final HRSC DTM mosaic, overall quality has been visually checked and co-alignment accuracy has been quantified. However, the dataset is very large, and the stereo images are limited, so some local artefacts cannot be fully removed. There are known artefacts, including: tiling artefacts (seam lines), small interpolated-regions, smoothed area that were caused by using “foggy” HRSC stereo images (no other options were available as we have checked), occasional artefacts inside small craters, quilting artefacts at heavily shaded cliff areas, and the junction of lower resolution with higher resolution single-strip DTMs. These artefacts are illustrated in Figure 23. Methods have been developed for their removal, where feasible but were beyond the scope of this paper.
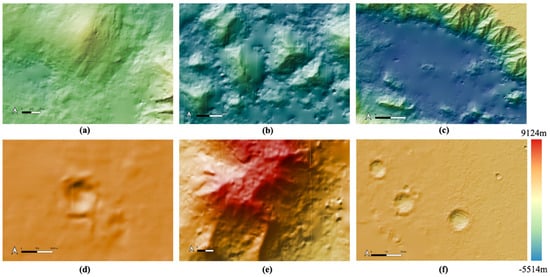
Figure 23.
Examples of “known artefacts” that appeared in the Valles Marineris HRSC DTM mosaic. (a) large scale tiling artefact (seam lines); (b) finer scale tiling artefact (seam lines) and small interpolated areas where matching has failed; (c) large “smoothed out” region inside the valley caused by using foggy input images that are not replaceable; (d) some minor artefact in very small craters; (e) quilting artefact at heavily shaded cliff areas; (f) the effect of joining higher resolution (50 m/pixel; from the left side) and lower resolution (150 m/pixel; from the right side) single-strip DTMs.
5. Conclusions
In this paper, we have introduced a complete processing system to produce HRSC level 4 DTMs over an extensive area, co-alignment with existing HRSC level 4 and MOLA DTMs, and the creation of a DTM and ORI mosaic that covers the large canyon system of Valles Marineris. We used a hybrid DTM processing chain that combines the matching result from three different matchers to produce high-quality HRSC single-strip DTMs. Then we introduced our joint 3D and image co-registration processing chain for high-accuracy HRSC-to-HRSC and HRSC-to-MOLA co-alignment and DTM mosaicing. Finally, automated image co-registration and orthorectification, and brightness correction methods are introduced for the production of Valles Marineris ORI mosaic.
As the result, we generated 11 new HRSC level 4 single-strip DTMs and ORIs that have filled the gap regions from existing DLR HRSC level 4 products. We then co-aligned the new HRSC DTM/ORIs with existing DLR HRSC DTM/ORIs, and for both of the UCL and DLR products, co-aligned with MOLA. The Valles Marineris DTM mosaic is therefore created using 82 co-aligned single-strip DTMs and the Valles Marineris ORI mosaic is subsequently created using 94 co-registered, brightness and contrast corrected single-strip ORIs. HRSC-to-MOLA difference map and profile analysis are demonstrated, examples are shown for evaluation of the mosaic product, and known artefacts are summarised and demonstrated.
The Valles Marineris mosaic product will be publicly available through the iMars webGIS and ESA GSF system. In the near future, we will look at applying the shape-from-shading method such as [55] to further improve quality and reduce artefact in the DTMs. In the future, we also plan to also build a HRSC colour ORI mosaic, and as well as the CTX DTM/ORI mosaic by co-aligning the CTX products we have processed for Valles Marineris, some of which have already been released through (https://www.cosmos.esa.int/web/psa/UCL-MSSL_iMars_CTX_v1.0 (accessed on 21 March 2021)).
Supplementary Materials
The following are available online at https://www.mdpi.com/article/10.3390/rs13071385/s1. All figures in full-resolution are available as supplementary material. A list of the HRSC IDs used in this work is also provided. The HRSC and CTX mosaic products are available online.
Author Contributions
Conceptualization, Y.T., J.-P.M., S.J.C.; methodology, Y.T., J.-P.M., G.M.; software, Y.T., G.M.; validation, Y.T., J.-P.M., S.J.C.; formal analysis, Y.T., J.-P.M.; investigation, J.-P.M., S.J.C., Y.T.; data curation, Y.T., A.R.D.P., S.J.C., J.-P.M.; writing—original draft preparation, Y.T., G.M., J.-P.M.; writing—review and editing, J.-P.M., Y.T., S.J.C.; visualization, Y.T. and A.R.D.P.; supervision, J.-P.M., Y.T., S.J.C.; project administration, J.-P.M., Y.T.; funding acquisition, J.-P.M., Y.T., S.J.C. All authors have read and agreed to the published version of the manuscript.
Funding
The research leading to these results is receiving funding from the UKSA Aurora programme (2018–2021) under grant no. ST/S001891/1. Partial funding has been received from the STFC “MSSL Consolidated Grant” ST/K000977/1. SJC is thankful to the CNES for supporting her HRSC-related work.
Data Availability Statement
The data products are all available via the DOI being added to the summary page for UCL products at https://www.cosmos.esa.int/web/psa/ucl-mssl_meta-gsf (accessed on 21 March 2021).
Acknowledgments
The research leading to these results is receiving funding from the UKSA Aurora programme (2018–2021) under grant no. ST/S001891/1. Partial funding has been received from the STFC “MSSL Consolidated Grant” ST/K000977/1. SJC is thankful to the CNES for supporting her HRSC-related work.
Conflicts of Interest
The authors declare no conflict of interest.
References
- Montgomery, D.R.; Som, S.M.; Jackson, M.P.; Schreiber, B.C.; Gillespie, A.R.; Adams, J.B. Continental-scale salt tectonics on Mars and the origin of Valles Marineris and associated outflow channels. Geol. Soc. Am. Bull. 2009, 121, 117–133. [Google Scholar] [CrossRef]
- Schultz, R.A.; Lin, J. Three-dimensional normal faulting models of the Valles Marineris, Mars, and geodynamic implications. J. Geophys. Res. Solid Earth 2001, 106, 16549–16566. [Google Scholar] [CrossRef]
- Andrews-Hanna, J.C. The formation of Valles Marineris: 1. Tectonic architecture and the relative roles of extension and subsidence. J. Geophys. Res. Planets 2012, 117. [Google Scholar] [CrossRef]
- Peulvast, J.P.; Mège, D.; Chiciak, J.; Costard, F.; Masson, P.L. Morphology, evolution and tectonics of Valles Marineris wallslopes (Mars). Geomorphology 2001, 37, 329–352. [Google Scholar] [CrossRef]
- Schultz, R.A. Multiple-process origin of Valles Marineris basins and troughs, Mars. Planet. Space Sci. 1998, 46, 827–834. [Google Scholar] [CrossRef]
- Rodriguez, J.A.P.; Kargel, J.S.; Baker, V.R.; Gulick, V.C.; Berman, D.C.; Fairén, A.G.; Glines, N. Martian outflow channels: How did their source aquifers form and why did they drain so rapidly? Sci. Rep. 2015, 5, 1–10. [Google Scholar]
- Warner, N.H.; Sowe, M.; Gupta, S.; Dumke, A.; Goddard, K. Fill and spill of giant lakes in the eastern Valles Marineris region of Mars. Geology 2013, 41, 675–678. [Google Scholar] [CrossRef]
- Coleman, N.M.; Baker, V.R. 9 Surface morphology and origin of outflow channels in the Valles Marineris region. In Megaflooding on Earth and Mars; Chapter 9; Cambridge University Press: Cambridge, UK, 2009; p. 172. [Google Scholar]
- Quantin, C.; Allemand, P.; Mangold, N.; Dromart, G.; Delacourt, C. Fluvial and lacustrine activity on layered deposits in Melas Chasma, Valles Marineris, Mars. J. Geophys. Res. Planets 2005, 110. [Google Scholar] [CrossRef]
- Weitz, C.M.; Milliken, R.E.; Grant, J.A.; McEwen, A.S.; Williams, R.M.E.; Bishop, J.L.; Thomson, B.J. Mars Reconnaissance Orbiter observations of light-toned layered deposits and associated fluvial landforms on the plateaus adjacent to Valles Marineris. Icarus 2010, 205, 73–102. [Google Scholar] [CrossRef]
- Mangold, N.; Ansan, V.; Masson, P.; Quantin, C.; Neukum, G. Geomorphic study of fluvial landforms on the northern Valles Marineris plateau, Mars. J. Geophys. Res. Planets 2008, 113. [Google Scholar] [CrossRef]
- McEwen, A.S.; Malin, M.C.; Carr, M.H.; Hartmann, W.K. Voluminous volcanism on early Mars revealed in Valles Marineris. Nature 1999, 397, 584–586. [Google Scholar] [CrossRef]
- Brož, P.; Hauber, E.; Wray, J.J.; Michael, G. Amazonian volcanism inside Valles Marineris on Mars. Earth Planet. Sci. Lett. 2017, 473, 122–130. [Google Scholar] [CrossRef]
- Brustel, C.; Flahaut, J.; Hauber, E.; Fueten, F.; Quantin, C.; Stesky, R.; Davies, G.R. Valles Marineris tectonic and volcanic history inferred from dikes in eastern Coprates Chasma. J. Geophys. Res. Planets 2017, 122, 1353–1371. [Google Scholar] [CrossRef]
- Chojnacki, M.; Moersch, J.E.; Burr, D.M. Climbing and falling dunes in Valles Marineris, Mars. Geophys. Res. Lett. 2010, 37. [Google Scholar] [CrossRef]
- Chojnacki, M.; Fenton, L.K.; Weintraub, A.R.; Edgar, L.A.; Jodhpurkar, M.J.; Edwards, C.S. Ancient Martian aeolian sand dune deposits recorded in the stratigraphy of Valles Marineris and implications for past climates. J. Geophys. Res. Planets 2020, 125, e2020JE006510. [Google Scholar] [CrossRef]
- Boazman, S.J.; Davis, J.M.; Grindrod, P.M.; Balme, M.R.; Vermeesch, P.; Baird, T. Measuring Ripple and Dune Migration in Coprates Chasma, Valles Marineris: A Source to Sink Aeolian System on Mars? J. Geophys. Res. Planets 2021, 126, e2020JE006608. [Google Scholar] [CrossRef]
- Mège, D.; Bourgeois, O. Equatorial glaciations on Mars revealed by gravitational collapse of Valles Marineris wallslopes. Earth Planet. Sci. Lett. 2011, 310, 182–191. [Google Scholar] [CrossRef]
- Gourronc, M.; Bourgeois, O.; Mège, D.; Pochat, S.; Bultel, B.; Massé, M.; Mercier, D. One million cubic kilometers of fossil ice in Valles Marineris: Relicts of a 3.5 Gy old glacial landsystem along the Martian equator. Geomorphology 2014, 204, 235–255. [Google Scholar] [CrossRef]
- Möhlmann, D.T.; Niemand, M.; Formisano, V.; Savijärvi, H.; Wolkenberg, P. Fog phenomena on Mars. Planet. Space Sci. 2009, 57, 1987–1992. [Google Scholar] [CrossRef]
- Inada, A.; Garcia-Comas, M.; Altieri, F.; Gwinner, K.; Poulet, F.; Bellucci, G.; Bibring, J.P. Dust haze in Valles Marineris observed by HRSC and OMEGA on board Mars Express. J. Geophys. Res. Planets 2008, 113. [Google Scholar] [CrossRef]
- Nedell, S.S.; Squyres, S.W.; Andersen, D.W. Origin and evolution of the layered deposits in the Valles Marineris, Mars. Icarus 1987, 70, 409–441. [Google Scholar] [CrossRef]
- Murchie, S.; Roach, L.; Seelos, F.; Milliken, R.; Mustard, J.; Arvidson, R.; Morris, R. Evidence for the origin of layered deposits in Candor Chasma, Mars, from mineral composition and hydrologic modeling. J. Geophys. Res. Planets 2009, 114. [Google Scholar] [CrossRef]
- Roach, L.H.; Mustard, J.F.; Swayze, G.; Milliken, R.E.; Bishop, J.L.; Murchie, S.L.; Lichtenberg, K. Hydrated mineral stratigraphy of Ius Chasma, Valles Marineris. Icarus 2010, 206, 253–268. [Google Scholar] [CrossRef]
- Lucchitta, B.K. Landslides in valles marineris, mars. J. Geophys. Res. Solid Earth 1979, 84, 8097–8113. [Google Scholar] [CrossRef]
- Lucas, A.; Mangeney, A. Mobility and topographic effects for large Valles Marineris landslides on Mars. Geophys. Res. Lett. 2007, 34. [Google Scholar] [CrossRef]
- Quantin, C.; Allemand, P.; Delacourt, C. Morphology and geometry of Valles Marineris landslides. Planet. Space Sci. 2004, 52, 1011–1022. [Google Scholar] [CrossRef]
- Brunetti, M.T.; Guzzetti, F.; Cardinali, M.; Fiorucci, F.; Santangelo, M.; Mancinelli, P.; Borselli, L. Analysis of a new geomorphological inventory of landslides in Valles Marineris, Mars. Earth Planet. Sci. Lett. 2014, 405, 156–168. [Google Scholar] [CrossRef]
- McEwen, A.S. Mobility of large rock avalanches: Evidence from Valles Marineris, Mars. Geology 1989, 17, 1111–1114. [Google Scholar] [CrossRef]
- Lucas, A.; Mangeney, A.; Ampuero, J.P. Frictional velocity-weakening in landslides on Earth and on other planetary bodies. Nat. Commun. 2014, 5, 1–9. [Google Scholar] [CrossRef]
- Johnson, B.C.; Campbell, C.S. Drop height and volume control the mobility of long-runout landslides on the Earth and Mars. Geophys. Res. Lett. 2017, 44, 12091–12097. [Google Scholar] [CrossRef]
- McEwen, A.S.; Dundas, C.M.; Mattson, S.S.; Toigo, A.D.; Ojha, L.; Wray, J.J.; Thomas, N. Recurring slope lineae in equatorial regions of Mars. Nat. Geosci. 2014, 7, 53–58. [Google Scholar] [CrossRef]
- McEwen, A.S.; Ojha, L.; Dundas, C.M.; Mattson, S.S.; Byrne, S.; Wray, J.J.; Gulick, V.C. Seasonal flows on warm Martian slopes. Science 2011, 333, 740–743. [Google Scholar] [CrossRef]
- Stillman, D.E.; Michaels, T.I.; Grimm, R.E. Characteristics of the numerous and widespread recurring slope lineae (RSL) in Valles Marineris, Mars. Icarus 2017, 285, 195–210. [Google Scholar] [CrossRef]
- Stillman, D.E.; Bue, B.D.; Wagstaff, K.L.; Primm, K.M.; Michaels, T.I.; Grimm, R.E. Evaluation of wet and dry recurring slope lineae (RSL) formation mechanisms based on quantitative mapping of RSL in Garni Crater, Valles Marineris, Mars. Icarus 2020, 335, 113420. [Google Scholar] [CrossRef]
- Chojnacki, M.; McEwen, A.; Dundas, C.; Ojha, L.; Urso, A.; Sutton, S. Geologic context of recurring slope lineae in Melas and Coprates Chasmata, Mars. J. Geophys. Res. Planets 2016, 121, 1204–1231. [Google Scholar] [CrossRef]
- Smith, D.E.; Zuber, M.T.; Frey, H.V.; Garvin, J.B.; Head, J.W.; Muhleman, D.O.; Pettengill, G.H.; Phillips, R.J.; Solomon, S.C.; Zwally, H.J.; et al. Mars Orbiter Laser Altimeter - Experiment summary after the first year of global mapping of Mars. J. Geophys. Res. 2001, 106, 23689–23722. [Google Scholar] [CrossRef]
- Neukum, G.; Jaumann, R. HRSC: The high resolution stereo camera of Mars Express. Sci. Payload 2004, 1240, 17–35. [Google Scholar]
- Tao, Y.; Muller, J.-P.; Sidiropoulos, P.; Xiong, S.-T.; Putri, A.R.D.; Walter, S.H.G.; Veitch-Michaelis, J.; Yershov, V. Massive Stereo-based DTM Production for Mars on Cloud Computers. Planet. Space Sci. 2018, 154, 30–58. [Google Scholar] [CrossRef]
- Christensen, P.R.; Bandfield, J.L.; Hamilton, V.E.; Ruff, S.W.; Kieffer, H.H.; Titus, T.N.; Malin, M.C.; Morris, R.V.; Lane, M.D.; Clark, R.L.; et al. Mars Global Surveyor Thermal Emission Spectrometer experiment: Investigation description and surface science results. J. Geophys. Res. Planets 2001, 106, 23823–23872. [Google Scholar] [CrossRef]
- Michael, G.G.; Walter, S.H.G.; Kneissl, T.; Zuschneid, W.; Gross, C.; McGuire, P.C.; Dumke, A.; Schreiner, B.; Van Gasselt, S.; Gwinner, K.; et al. Systematic processing of Mars Express HRSC panchromatic and colour image mosaics: Image equalisation using an external brightness reference. Planet. Space Sci. 2016, 121, 18–26. [Google Scholar] [CrossRef]
- Gwinner, K.; Scholten, F.; Spiegel, M.; Schmidt, R.; Giese, B.; Oberst, J.; Jaumann, R.; Neukum, G. Derivation and Validation of High-Resolution Digital Terrain Models from Mars Express HRSC data. Photogramm. Eng. Remote Sens. 2009, 75, 1127–1142. [Google Scholar] [CrossRef]
- Beyer, R.; Alexandrov, O.; McMichael, S. The Ames Stereo Pipeline: NASA’s Opensource Software for Deriving and Processing Terrain Data. Earth Space Sci. 2018, 5, 537–548. [Google Scholar] [CrossRef]
- Tao, Y.; Muller, J.-P.; Poole, W.D. Automated localisation of Mars rovers using co-registered HiRISE-CTX-HRSC orthorectified images and DTMs. Icarus 2016, 280, 139–157. [Google Scholar] [CrossRef]
- Shin, D.; Muller, J.-P. Progressively weighted affine adaptive correlation matching for quasi-dense 3D reconstruction. Pattern Recognit. 2012, 45, 3795–3809. [Google Scholar] [CrossRef]
- Gwinner, K.; Jaumann, R.; Hauber, E.; Hoffmann, H.; Heipke, C.; Oberst, J.; Neukum, G.; Ansan, V.; Bostelmann, J.; Dumke, A.; et al. The High Resolution Stereo Camera (HRSC) of Mars Express and its approach to science analysis and mapping for Mars and its satellites. Planet. Space Sci. 2016, 126, 93–138. [Google Scholar] [CrossRef]
- Putri, A.R.D.; Sidiropoulos, P.; Muller, J.P.; Walter, S.H.; Michael, G.G. A New South Polar Digital Terrain Model of Mars from the High-Resolution Stereo Camera (HRSC) onboard the ESA Mars Express. Planet. Space Sci. 2019, 174, 43–55. [Google Scholar] [CrossRef]
- Hirschmuller, H. Stereo processing by semiglobal matching and mutual information. IEEE Trans. Pattern Anal. Mach. Intell. 2008, 30, 328–341. [Google Scholar] [CrossRef]
- Facciolo, G.; Franchis, C.; Meinhardt, E. MGM: A significantly more global matching for stereovision. In Proceedings of the British Machine Vision Conference (BMVC), Swansea, UK, 7–10 September 2015; p. 90. [Google Scholar]
- Amberg, B.; Romdhani, S.; Vetter, T. Optimal Step Nonrigid ICP Algorithms for Surface Registration. In Proceedings of the IEEE Conference on Computer Vision and Pattern Recognition (CVPR), Minneapolis, MN, USA, 17–22 June 2007; pp. 1–8. [Google Scholar]
- Mörwald, T.; Balzer, J.; Vincze, M. Modeling connected regions in arbitrary planar point clouds by robust B-spline approximation. Robot. Auton. Syst. 2016, 76, 141–151. [Google Scholar] [CrossRef]
- Walter, S.H.G.; Muller, J.-P.; Sidiropoulos, P.; Tao, Y.; Gwinner, K.; Putri, A.R.D.; Kim, J.R.; Steikert, R.; Gasselt, S.V.; Michael, G.G.; et al. The Web-Based Interactive Mars Analysis and Research System for HRSC and the iMars Project. JGR/ESS Spec. Issue Planet. Mapp. Methods Tools Sci. Anal. Explor. 2018, 5, 308–3235. [Google Scholar] [CrossRef]
- Muller, J.-P.; Tao, Y.; Putri, A.R.D.; Watson, G.; Beyer, R.; Alexandrov, O.; McMichael, S.; Besse, S.; Grotheer, E. 3D Imaging tools and geospatial services from joint European-USA collaborations. In Proceedings of the EPSC-DPS Joint Meeting 2019, Geneva, Switzerland, 15–20 September 2019; Volume 13. EPSC–DPS2019–1355–2. [Google Scholar]
- Xiao, M.; Zhang, G.; Breitkopf, P.; Villon, P.; Zhang, W. Extended Co-Kriging interpolation method based on multi-fidelity data. Appl. Math. Comput. 2018, 323, 120–131. [Google Scholar] [CrossRef]
- Douté, S.; Jiang, C. Small-Scale Topographical Characterization of the Martian Surface with In-Orbit Imagery. IEEE Trans. Geosci. Remote Sens. 2019, 58, 447–460. [Google Scholar] [CrossRef]
Publisher’s Note: MDPI stays neutral with regard to jurisdictional claims in published maps and institutional affiliations. |
© 2021 by the authors. Licensee MDPI, Basel, Switzerland. This article is an open access article distributed under the terms and conditions of the Creative Commons Attribution (CC BY) license (https://creativecommons.org/licenses/by/4.0/).

