Article

A New Integrated Approach for Municipal Landfill Siting Based on Urban Physical Growth Prediction: A Case Study Mashhad Metropolis in Iran

by
Salman Qureshi
1,
Saman Nadizadeh Shorabeh
2,
Najmeh Neysani Samany
2,*,
Foad Minaei
2,
Mehdi Homaee
3,†,
Fatemeh Nickravesh
4,
Mohammad Karimi Firozjaei
2 and
Jamal Jokar Arsanjani
5
1
Department of Geography, Humboldt University of Berlin, Rudower Chaussee 16, 12489 Berlin, Germany
2
Department of GIS and Remote Sensing, Faculty of Geography, University of Tehran, Tehran 14178-53933, Iran
3
Agrohydrology Research Group, College of Agriculture, Tarbiat Modares University, Tehran 14115-336, Iran
4
Department of Human Geography, Faculty of Geography, University of Tehran, Tehran 14178-53933, Iran
5
Geoinformatics Research Group, Department of Planning and Development, Aalborg University Copenhagen, A.C Meyers Vænge 15, 2450 Copenhagen, Denmark
*
Author to whom correspondence should be addressed.
Current address: Department of Mining Engineering, Tarbiat Modares University, Tehran 14115-336, Iran.
Remote Sens. 2021, 13(5), 949; https://doi.org/10.3390/rs13050949
Submission received: 19 January 2021 / Revised: 22 February 2021 / Accepted: 28 February 2021 / Published: 3 March 2021

Abstract

:
Due to irregular and uncontrolled expansion of cities in developing countries, currently operational landfill sites cannot be used in the long-term, as people will be living in proximity to these sites and be exposed to unhygienic circumstances. Hence, this study aims at proposing an integrated approach for determining suitable locations for landfills while considering their physical expansion. The proposed approach utilizes the fuzzy analytical hierarchy process (FAHP) to weigh the sets of identified landfill location criteria. Furthermore, the weighted linear combination (WLC) approach was applied for the elicitation of the proper primary locations. Finally, the support vector machine (SVM) and cellular automation-based Markov chain method were used to predict urban growth. To demonstrate the applicability of the developed approach, it was applied to a case study, namely the city of Mashhad in Iran, where suitable sites for landfills were identified considering the urban growth in different geographical directions for this city by 2048. The proposed approach could be of use for policymakers, urban planners, and other decision-makers to minimize uncertainty arising from long-term resource allocation.

1. Introduction

The 20th century has witnessed the largest growth in the urban population, especially following the second world war. This near-exponential increase in the global population has led to major economic evolutions. Such economic developments, alongside the ever-increasing population growth and the accompanied intervention of a new culture of production and consumption, have left behind rising heaps of urban waste [1,2]. Waste production and management are directly related to urban development. In the course of urban growth, calls surged for access to readily available grounds for the disposal of waste as well as suitable regions for meeting the demands of a new culture, which ultimately engendered more wastes. The disposal of urban wastes calls for the occupancy of further grounds in an urban region [3]. On the other hand, the expansion of urban regions from current extremities has resulted in the curtailment of areas for the disposal of wastes and, therefore, lack of sufficient grounds in general [4].
The generation of municipal solid waste by industrial and urban entities causes several environmental issues [5,6], such as environmental degradation [7], pollution of surface water and groundwater [8,9], and unpleasant odors [10]. According to the US Environmental Protection Agency, four priorities in integrated management of solid wastes in order of preference are (a) lowering waste generation at the source, (b) recycling, (c) composting, and (d) landfilling [11]. Among these, the most customary and cost-effective dumping method is sanitary landfilling. The main reasons for such consideration can be the uncontrolled expansion of cities, the ever-growing waste generation, and the persisting problems in waste management [12,13].
The selection of a sanitarian waste location is a program that requires extensive ground assessment processes in order to identify a reachable, feasible, and optimum location for the landfill. This also needs to comply with the governmental rules and regulations [14] and simultaneously incur the lowest environmental damage and least public health threats, as well as being economically viable [15,16]. In recent decades, numerous studies have been done on choosing a suitable location to establish a landfill site. However, in these studies, the methods used and the spatial scale of the study area are different. The integration of geographic information system (GIS) and multi-criteria decision analysis (MCDA) proved highly advantageous to the decision-maker in implementing decision analysis functions, such as ranking options for the allocation of suitable areas for specific purposes [17,18,19]. In the following, we provide an overview of various studies on on-site selection issues in the field of waste, with these studies specifically focusing on the selection of the suitable site. Torabi-Kaveh et al. [20] combined the GIS analysis with a fuzzy analytical hierarchy process (FAHP) to determine suitable sites for landfill construction. Barakat et al. [2] combined the Boolean and analytic hierarchy process (AHP) methods with a set of economic and environmental criteria to landfill site selection in the city of Morocco. Ding and Shi [21] combined the AHP and entropy method for landfill site selection in Shenzhen, China. They used environmental, economic, and social criteria, such as distance to surface water, distance to airports, slopes, and others. Zabihi et al. [22] developed a landfill site selection methodology based on the AHP-OWA method using five criteria, namely elevation, maximum temperature, minimum temperature, slope angle, and rainfall.
The number of studies aimed at evaluating location optimization as well as using appropriate MCDA methods is not comprehensive. Even though there are studies available that address the issue of selecting suitable landfill sites, these differ substantially from a methodological point of view. Table 1 gives an overview of studies that utilized a GIS-based MCDA approach for evaluating the suitability of areas for landfill development.
Based on the literature review, it was found that most studies did not consider the urban expansion parameter. In general, the approach mentioned in the literature is as follows: First, different criteria are specified, then pairwise comparisons are made using a model and finally assigned to the weighted problem layers, and then with the algebraic sum of the weights of the maps, the location suitability map for landfill is determined. This final map is then classified into different classes according to suitability. Next, the decision-maker chooses the best option from among the very suitable classes. There is no study in the literature that considers the spatial and temporal dynamics of urban growth as a component of municipal solid waste management. The choice of landfill sites in the city’s physical expansion site causes many environmental and economic problems. Therefore, in this study, in addition to the cases mentioned in the previous articles, urban growth over a period of 30 years is considered as well as its prediction for the future.

2. Materials and Methods
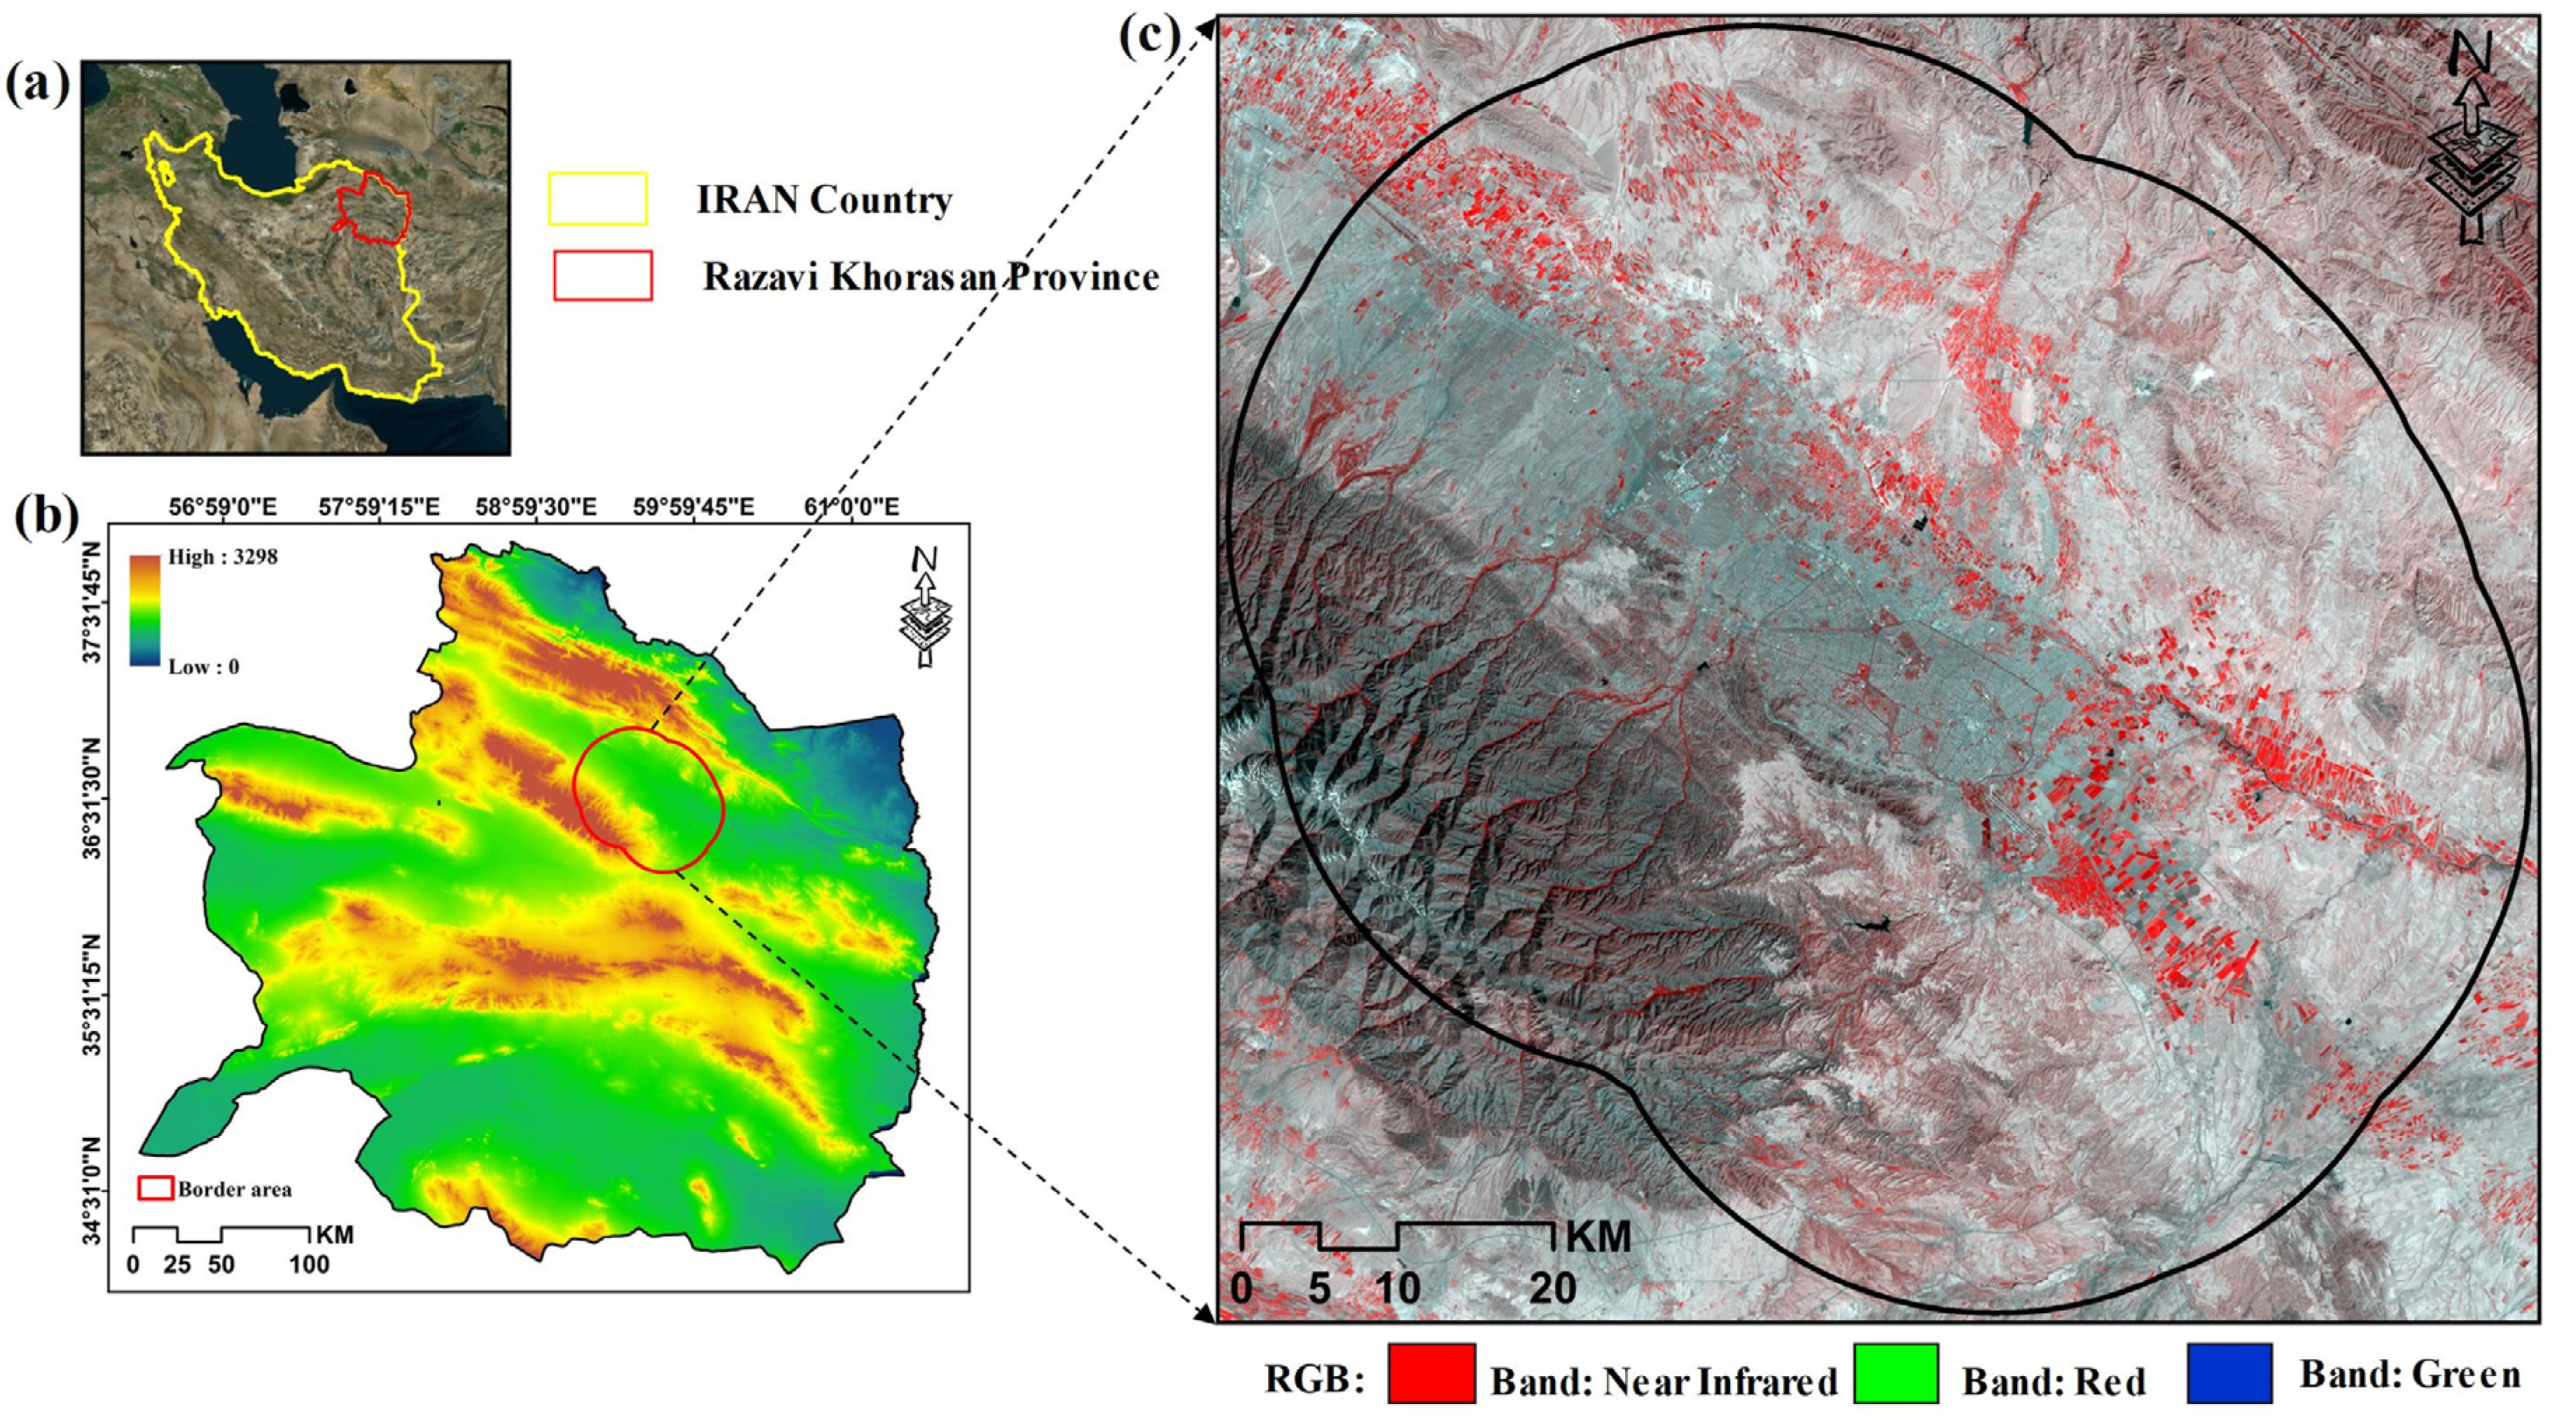
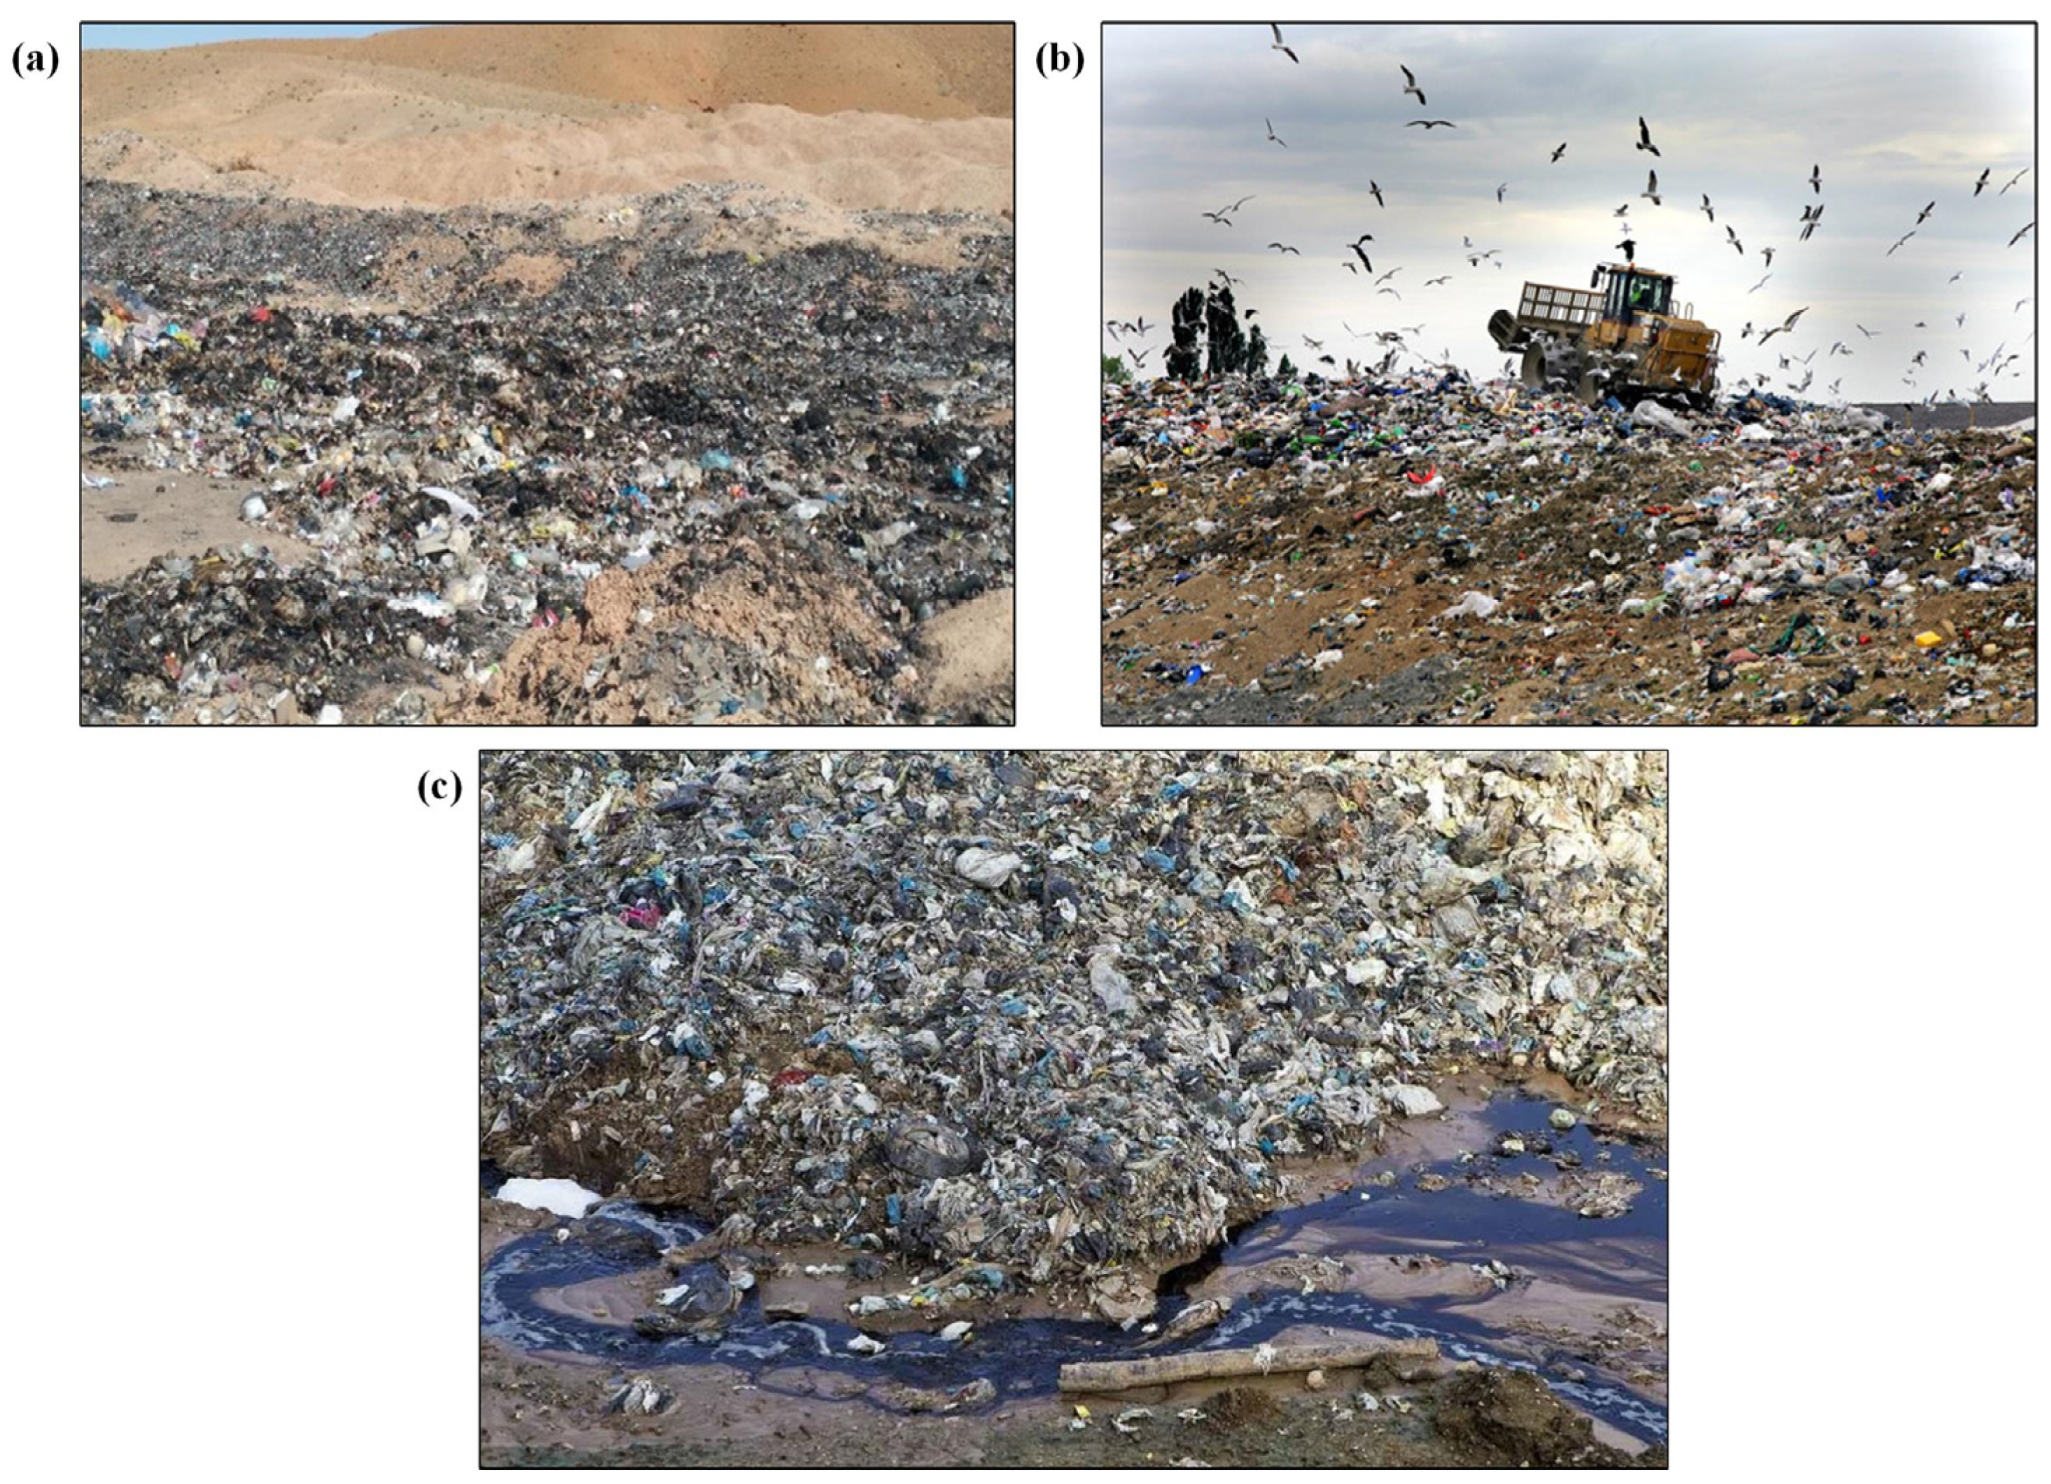
2.1. Study Area

The selected study area is Mashhad city, which is located in the northeast of Iran and in the center of the Khorasan Razavi Province, spreading between longitude 59°26′ and 59°44′E and latitude 36°37′ to 36°58′N (Figure 1). The solid waste of the Mashhad metropolis urban consists of foods (76.5%), papers and cardboards (4.9%), plastics (6.7%), glasses (1.7%), metals (2.2%) and others (8.0%). The city has a temperate climate and is inclined cold and dry, with hot and dry weather in the summer and cold and humid winters. The winds are mostly southeast to northwest. A 25 km buffer around the city boundary was drawn so as to delineate the approximate extent of the study area.
The prime inclusion criteria for the selection of this study area are twofold: (a) as the second largest city of Iran with a population of more than 3.5 million, the Mashhad metropolis receives an annual 20 million pilgrimage tourists with an average daily waste production of 1400 to 1700 tons, (b) the city is a highly dynamic urban settlement, which will expand even further due to its importance in terms of pilgrimage.
The traditional and non-sanitary landfilling in Mashhad has caused several environmental threats, such as a leachate lake where methane gas is produced and spread in the air. The bad smell of this gas and many other unpleasant gases have spread to the whole area and have caused diseases associated with skin [33,34], respiratory [35,36] and cancer [34,37] among nearby residents. An example of the solid waste situation in Mashhad city is shown in Figure 2.

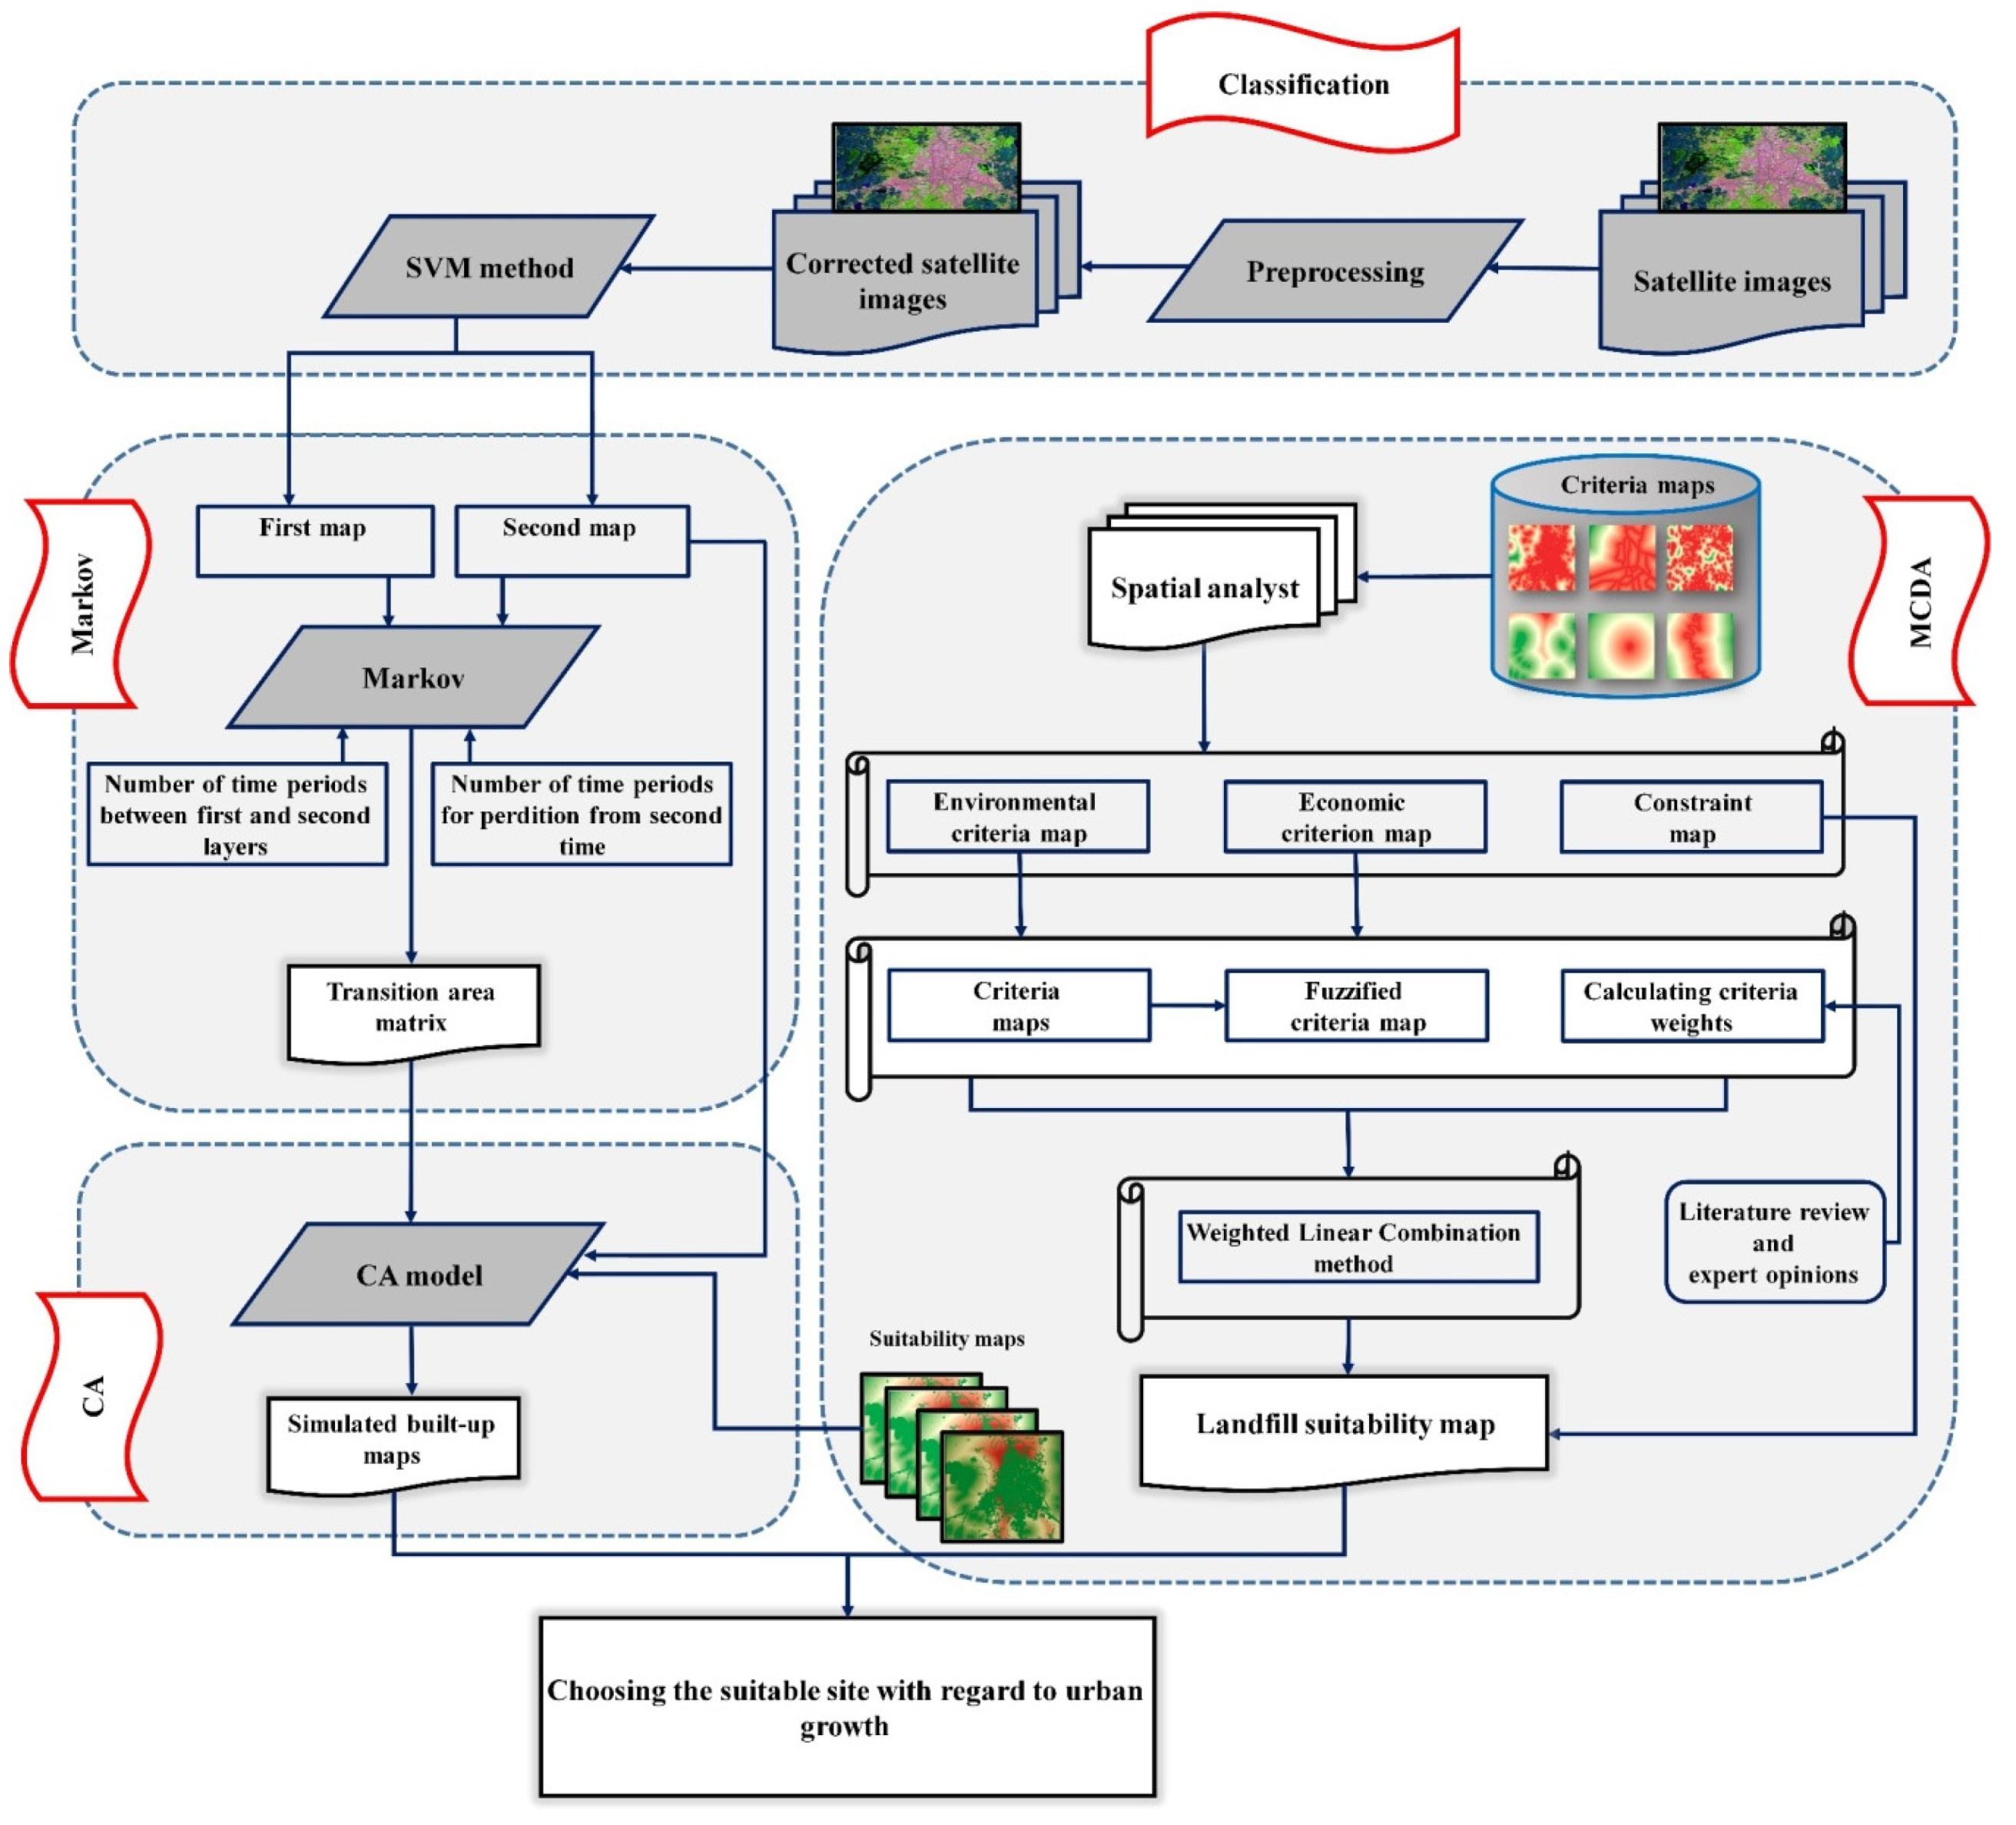
2.2. Methodology and Data

In the site selection process, criteria are set in the first step. In the next step, the criteria map and sub-criteria are prepared and entered into the GIS database. In this research, 12 criteria were used to select the appropriate landfill site. First, the restrictions, including a 500 m buffer from a landslide, 3000 m buffer from airports, 1000 m buffer from roads, 1000 m buffer from rivers, 500 m buffer from settlements and 300 m buffer from fault, were considered (the explanation of the reasons on which such restrictions are based are given in Section 2.3). The criteria used in this study were divided into two main criteria of economic and environmental [38]. The environmental criteria (leachate from the landfill engender negative impacts on the environment) and economic criteria (due to financial constraints) are important. These criteria were selected based on the systematic literature review [20,26,29,39,40,41,42,43,44]. Fuzzy logic was used to model uncertainty. The AHP model was used to weight the criteria. The weighted linear combination (WLC) model was used to integrate the criteria and identify suitable locations for waste landfills. In addition, the SVM method is used to classify the images, and the Markov chain is employed to predict urban growth. The flowchart of the study is shown in Figure 3.
Table 2 lists the data used in this study.

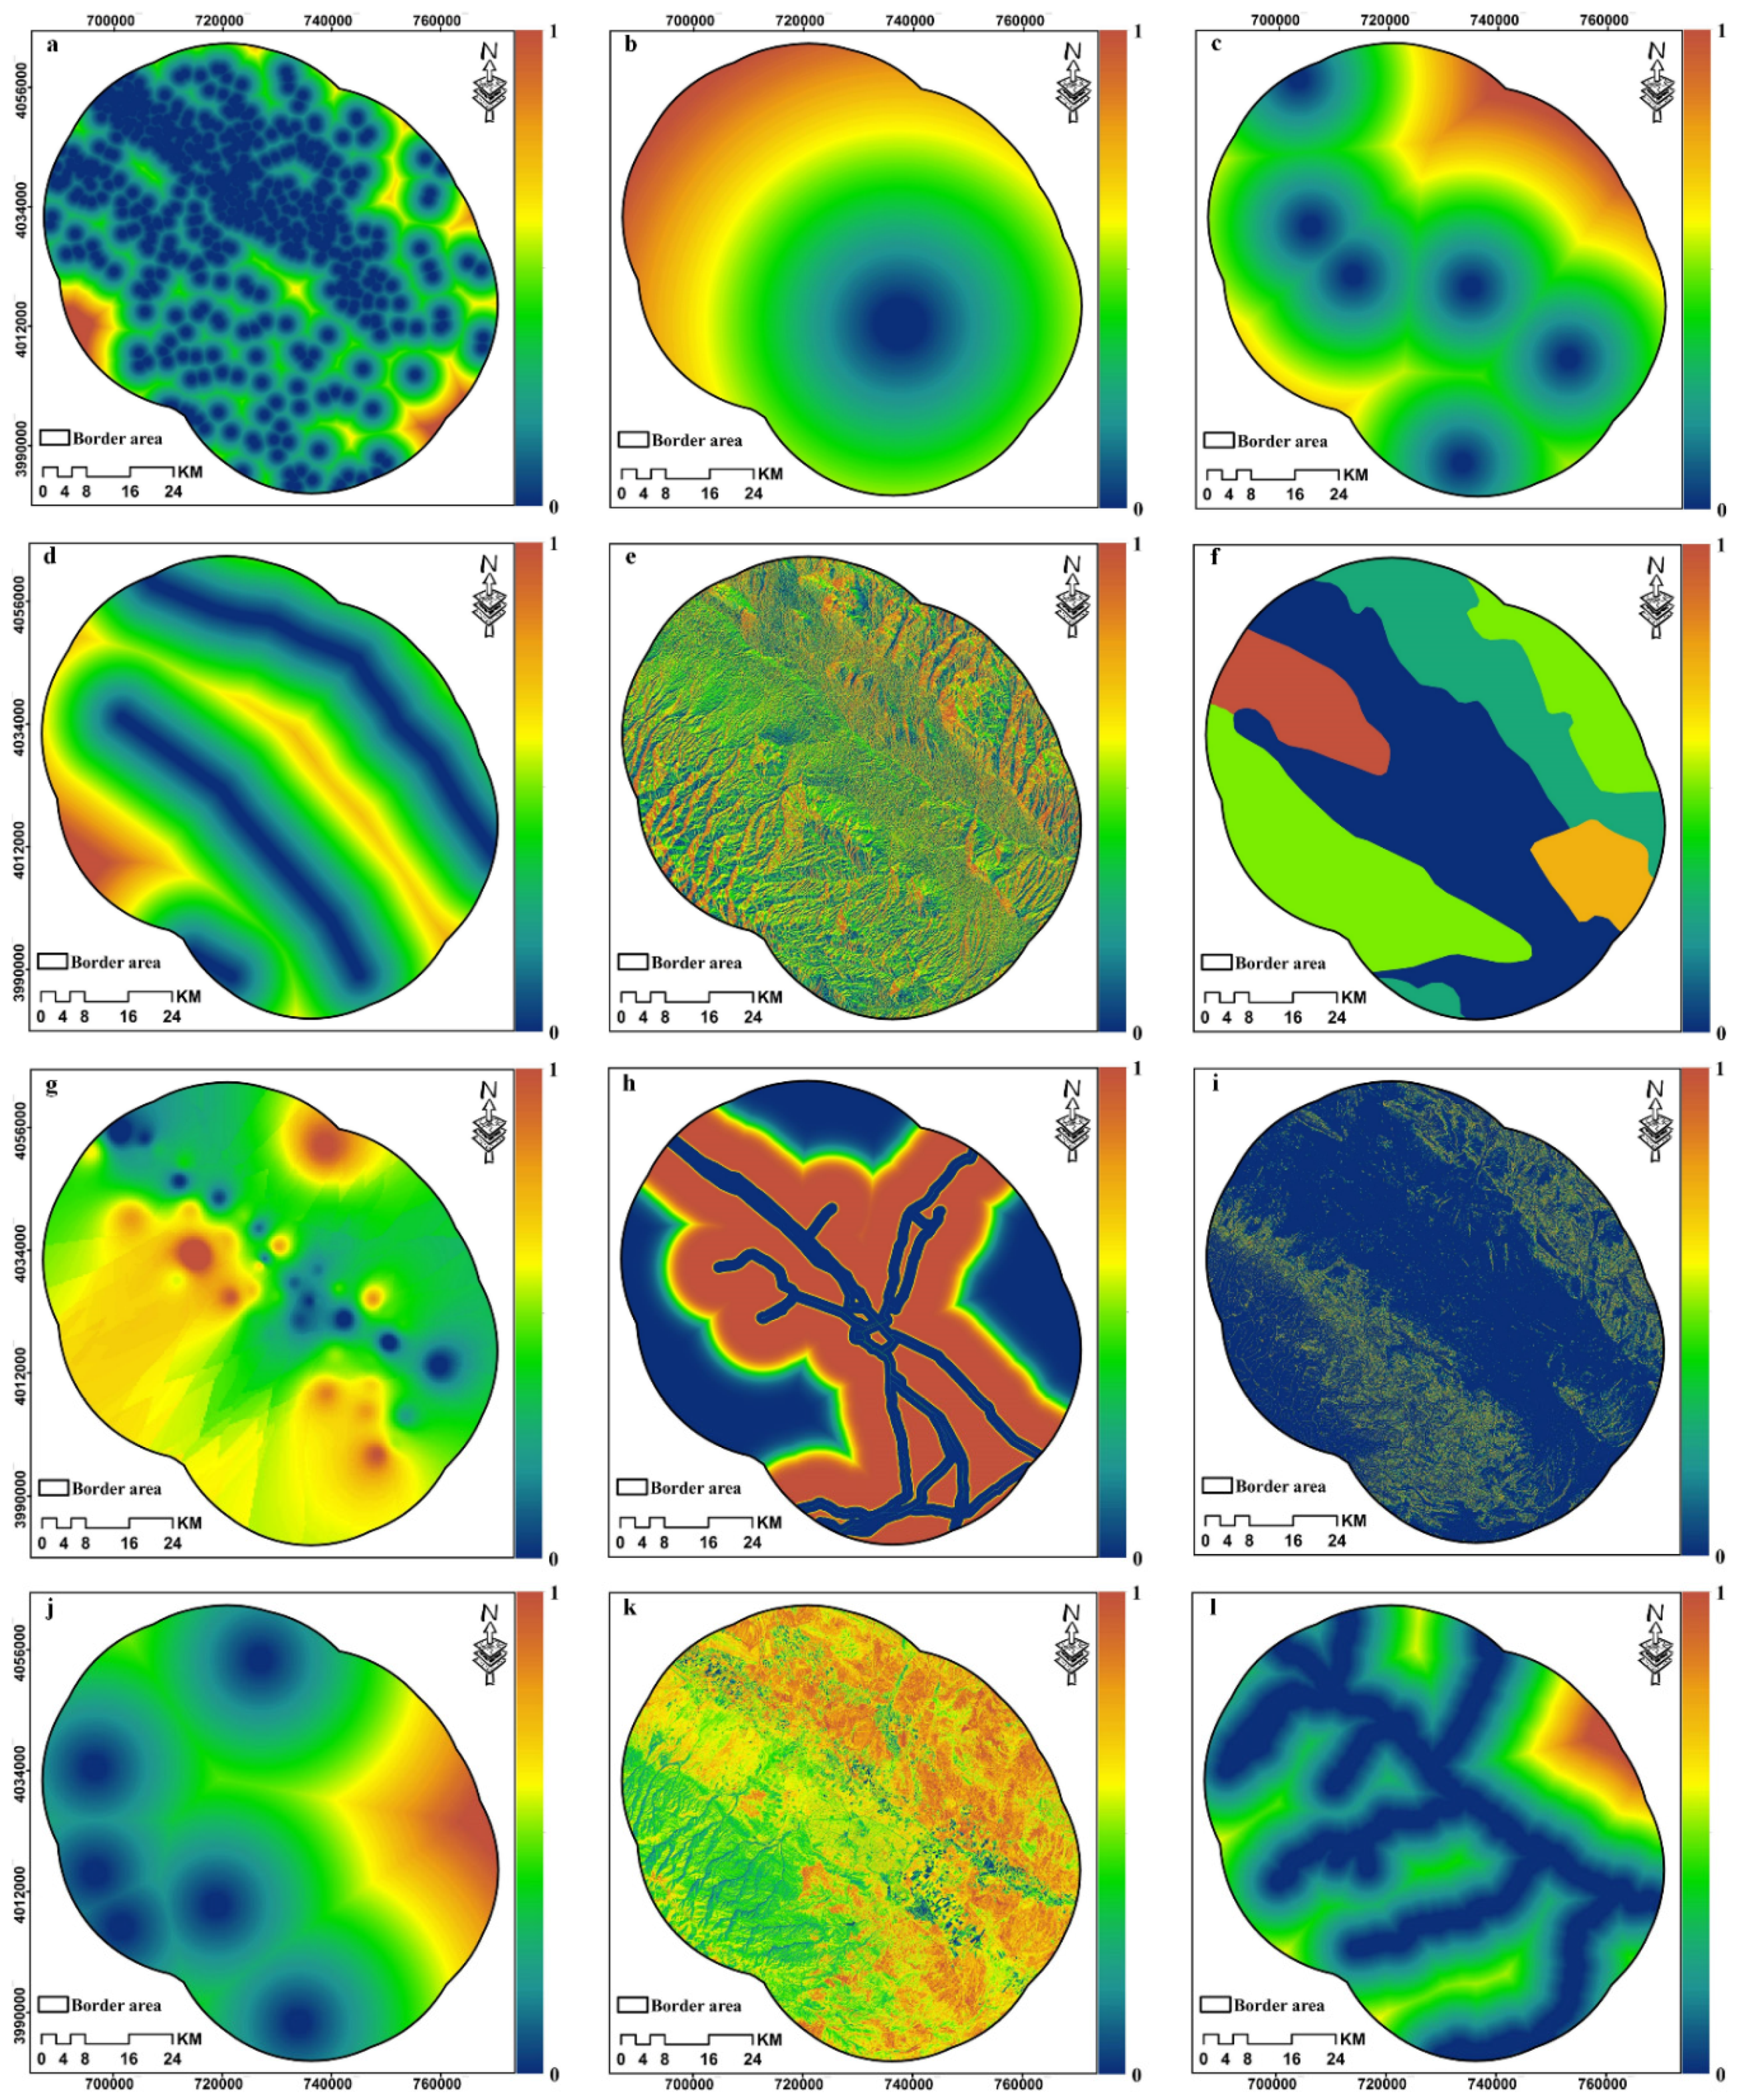
2.3. Identification of the Criteria

Choosing a suitable landfill depends on a complete understanding of the factors and how they are selected. The factors selected in this study were based on expert opinion. The selected locations should minimize not only economic, environmental, health and social costs but also be concordant with existing government regulations [45]. As a result, using the research background and expert opinion, 12 maps of input layers were created in which the main criteria are classified into two categories of environmental and economic criteria [2,46].

2.3.1. Environmental Criteria

Groundwater depth: a landfill should be built on land with underground water that is deep enough for its quality to remain unaffected by leachates from the landfill [47,48]. The inverse distance weighting (IDW) method was utilized to prepare groundwater depth maps. The basic assumption of the IDW interpolation method is that close values are more involved in interpolation values than distant observations [49]. In this study, the shallow groundwater areas are unsuitable, while deep groundwater areas are.
Distance from rivers: surface waters are important indicators for landfill location. A suitable distance from surface waters must be reserved in order to prevent pollution caused by the leachate [41]. Kontos et al. [50] recommend a minimum distance of 1000 m from the water stream. In this study, the distance considered less than 1000 m as constraint areas.
Soil type: soil grain, which is a combination of sand, clay, and silt, is a crucial factor in selecting the landfill location. The ratio of the three particles defines the permeability of the soil. That is, the higher the percentage of sand in the soil, the higher its permeability. On the contrary, an increase in the percentage of clay means a decrease in the permeability of the soil. Moreover, soil with higher clay ingredients participates more in cation transport and increases the probability of filtration phenomenon, which is due to the increased level of colloid particles [46,51]. The highest weight was given to desert soils and the lowest weight to the alluvial ones.
Distance from faults: landfills should be located far from faults and seismically active areas. An adequate distance prevents the fusion of leachate into underground waters. Being inattentive of the faults brings about the probability of leachate extension to a vast area and triggers environmental and anthropogenic catastrophes [52].
Landslides: landslides mostly occur in mountainous landscapes with high precipitation and alluvial lithology [53]. Considering the climatic and geographical conditions, constructions in high slopes, and other hillside destabilizing factors, landslides have become a major concern in the western part of the study area.
Distance from airports: one of the important reasons for choosing a landfill at a suitable distance from the airport is that landfills are the center of many bird gatherings, which can pose serious hazards when aircrafts land [54]. According to Kontos et al. [15], the suitable distance from airports is considered to be at least 3 km. In this study, a distance of 3 km is selected as the constraint area. Thus, the greater the distance is, the more suitable the site.
Distance from city and village: landfills require being outside cities and far from populated areas due to their negative impact on land value and future development of residential areas. On the other hand, a landfill should be as close as possible to cities and villages so as to cut the transportation costs and constrain the investigation domain. According to Allen et al. [55], the distance should be at least 5 km from urban centers and 500 m from the suburban regions. In this study, a distance of 500 m from urban and village locations is considered as the constraint area.
Wind direction: dwellings near landfills get highly affected by the stink of the landfills. Thus, it is better to build a landfill in a place where the wind direction is not pointed at dwellings [2]. In order to study the wind direction in the investigated region, the direction map was developed using DEM of the region as recommended by Şener et al. [41]. The efficiency of this model for mapping wind direction based on meteorological station data has been confirmed. The main wind direction in the study area is southeast and east (lowest value), and the least frequent winds are in west and northwest directions (highest value).
Normalized Difference Vegetation Index (NDVI): Due to the dangerous environmental effects, landfills should not be located in vegetated areas (forests, agricultural lands and rangelands) [56]. The NDVI index was used to extract vegetation.
NDVI is an index developed to describe vegetation using points of difference between near-infrared (strongly reflected by plants) and red light (absorbed by plants) [57]. The NDVI was derived images using Equation (1):
N D V I = ρ N I R ρ R e d ρ N I R + ρ R e d
where, ρ N I R and ρ R e d are the ground reflectance of near-infrared and red bands. The value of the NDVI is −1 to 1. Values less than 0 indicate water, and values above 0 indicate bare soil and vegetation. Higher values of the NDVI indicate greener vegetation [58,59].

2.3.2. Economic Criteria

Slope: From the economic point of view, the slope factor plays an important role since higher slopes require high costs [38]. The slope also plays a key role in maintaining soil water, the amount of runoff and potential erosion. Furthermore, it is not economically efficient to construct waste sites in high-slope areas [60]. The SRTM images with a resolution of 30 m were used to generate the slope map of the target area. In this study, the slope for creating a landfill site is between 8 and 12%.
Distance from roads: According to international regulations, landfills should be situated as far as possible from primary and secondary road networks [38,61]. On the other hand, landfills should be available in all seasons and all weather conditions, have roads with enough width, minimum traffic, and be ready in connection with expressways and possibly with a railroad [41]. In this research, a distance of less than 1000 m was considered as the constraint area.

2.4. Spatial Analysis and AHP-WLC

Having specified the set of criteria for assessing landfills, each criterion should be measured and represented as a GIS map layer in the database. Depending on the criteria used, specific spatial analysis tools are used to produce the criteria map. The Euclidean distance function is used to produce the criteria map related to the distance, such as distance from roads. In addition, to generate groundwater depth maps, spatial interpolation based on water resources management data is used [62]. Surface analysis functions based on topography to produce slope and aspect are used. The fuzzification of criteria maps was done with the fuzzy theory. The details of the fuzzy theory are in [45,63,64].
One of the most comprehensive MCDA methods is AHP [65], primarily recognized for its potential in reformulating complicated real-world problems into hierarchical frameworks, as well as its capacity for including both quantitative and qualitative criteria of the subject problem [66]. AHP works by assigning the highest weight to the most relevant layer, i.e., the layer with the highest impact on the objective. In other words, the measure of weights assigned to each informational unit is a function of the maximum impact it has inside the layer [67]. According to studies by Saaty and Vargas [68], a range is suggested for the comparison of criteria with quantities between 1 and 9. Each digit within this range represents the relative importance for the corresponding unit: 1 indicating similar (equal) importance, 3 moderate importance, 5 strong importance, 7 very strong importance and 9 absolute importance. In addition, numbers 2, 4, 6 and 8 represent the intermediate values.
The MCDA method was used to combine the map and weight of the criteria obtained. The WLC is located between the operator OR and the operator AND [69,70]. In the WLC model, two components of the value of functions v ( a i k ) and the weight of criteria ( w k ) are used and calculated using Equation (2):
V ( A i ) = k = 1 n w k v ( a i k )

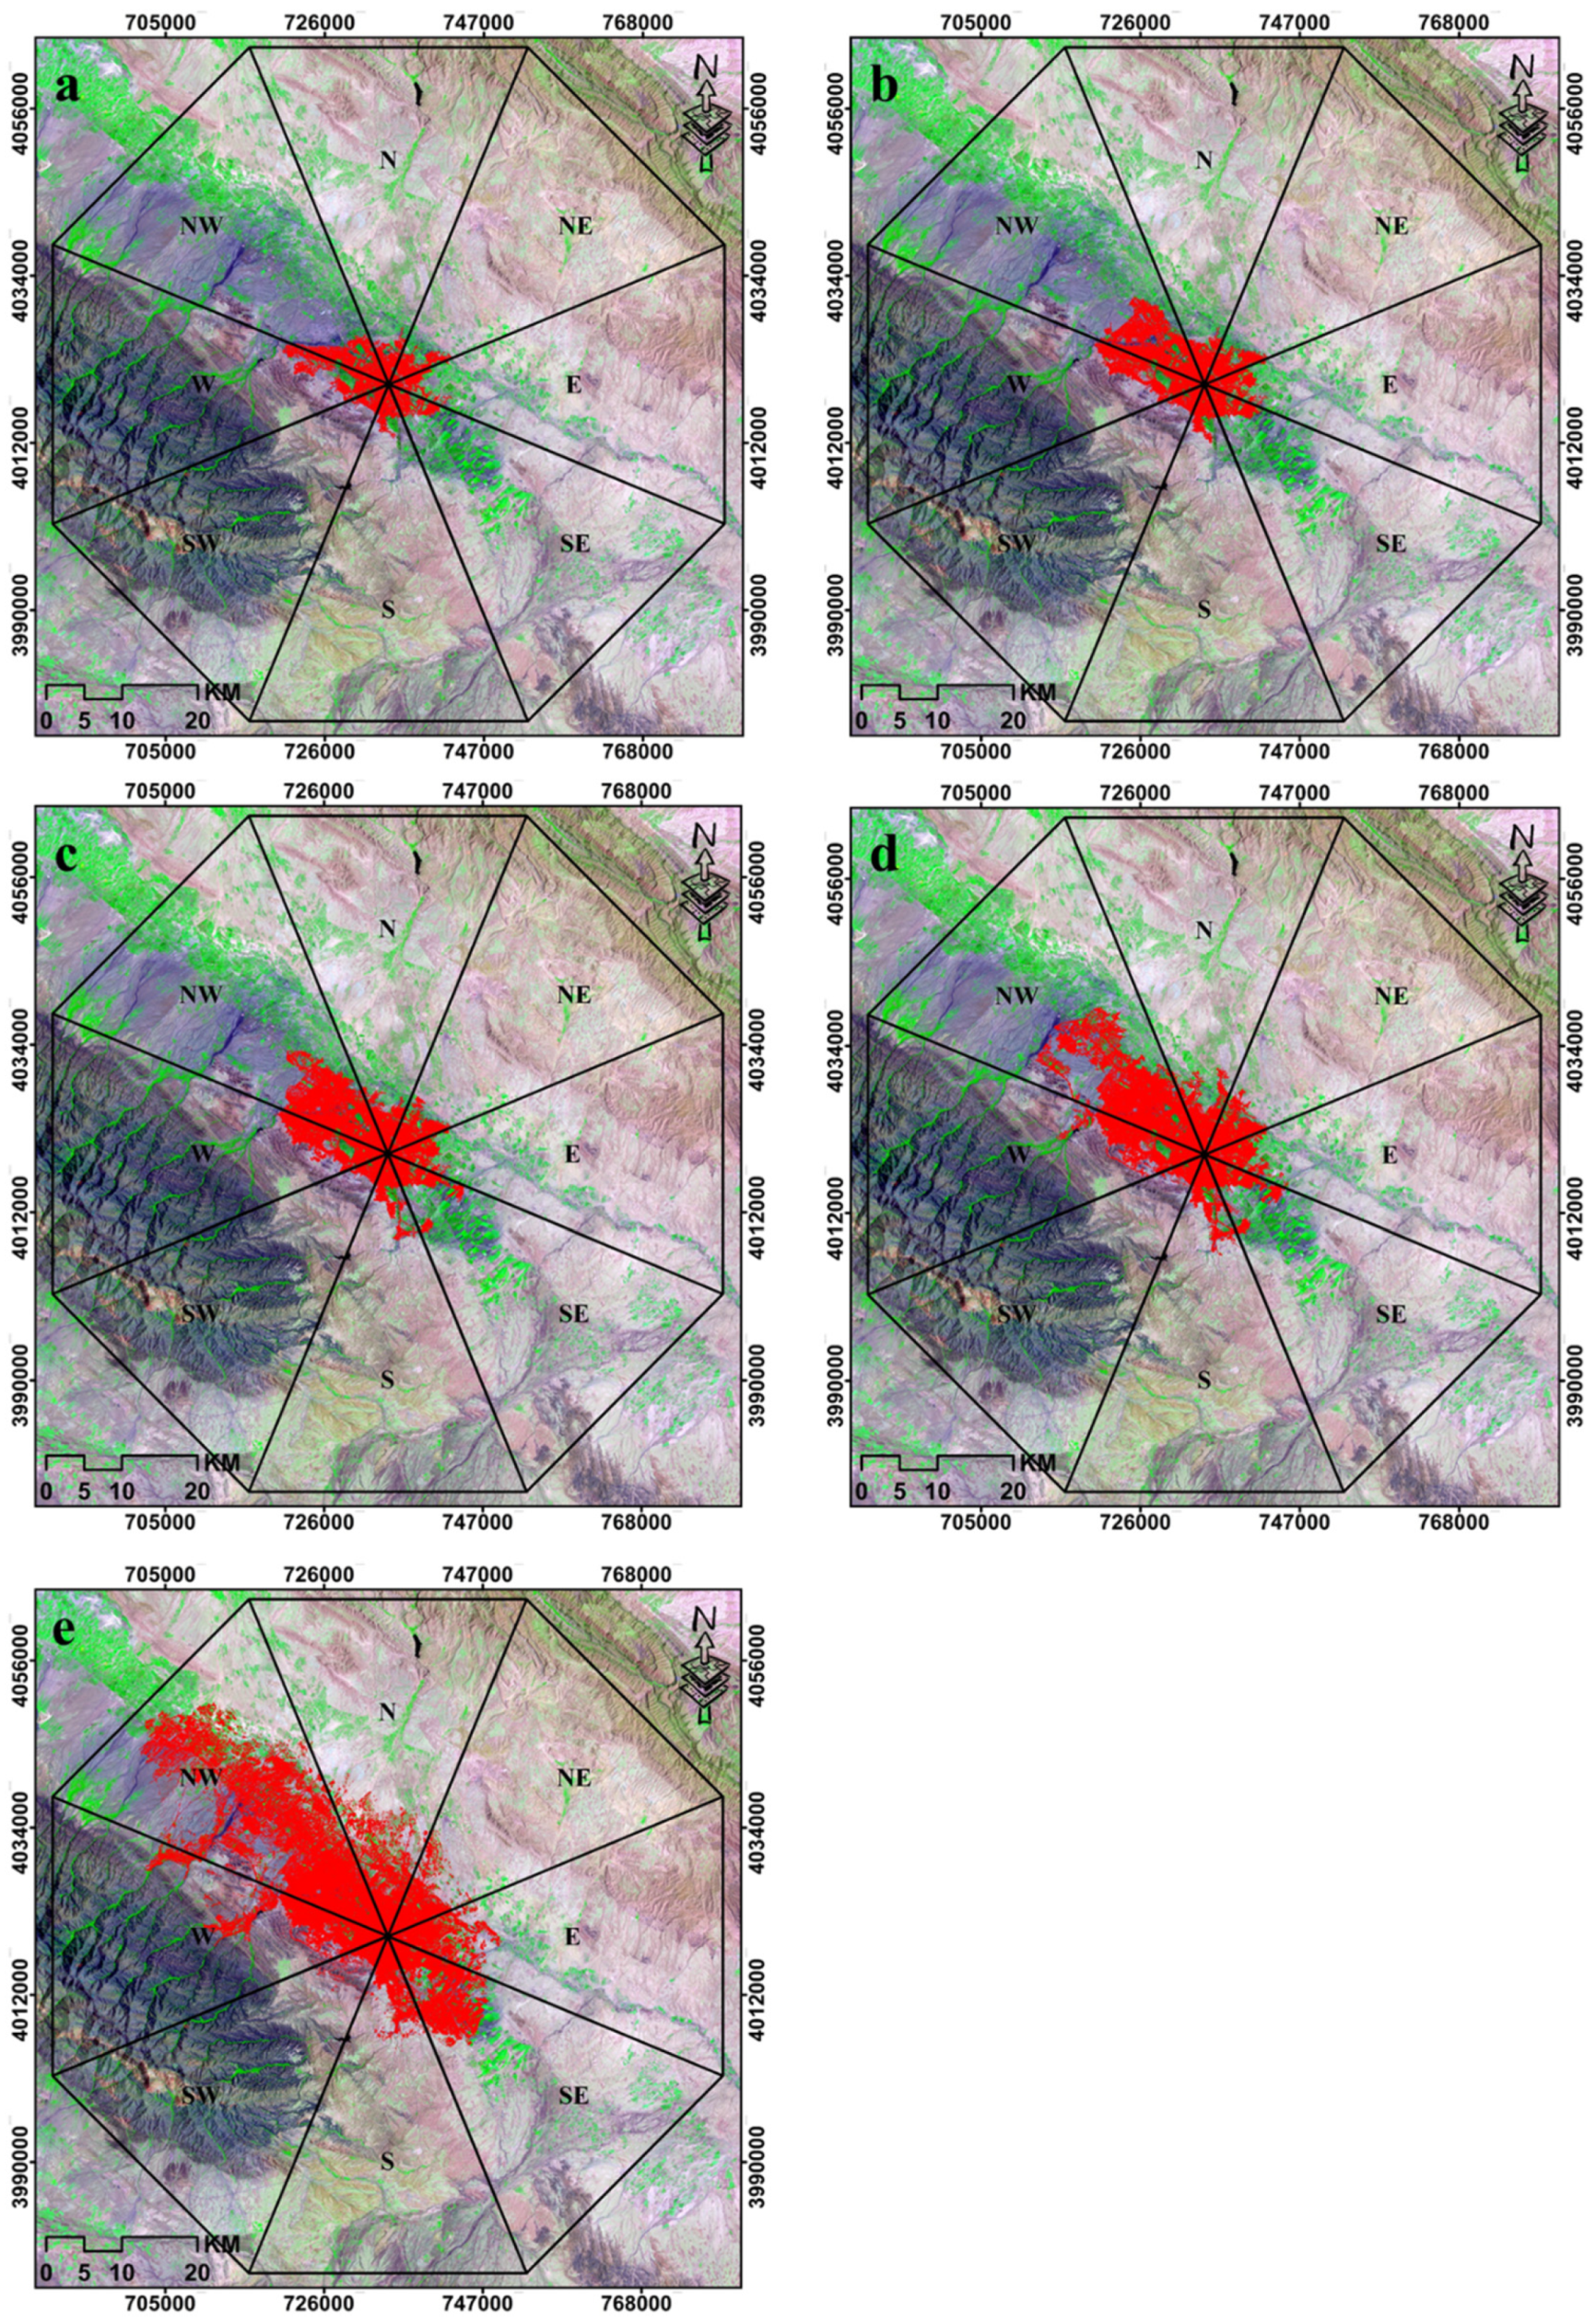
2.5. Simulation of Urban Growth

Given the importance of the physical growth of the city in determining the appropriate location for the landfill in this study, (1) the SVM model was used to determine the built-up extraction and physical growth of the city in different directions, and (2) the CA-Markov model was used to estimate urban growth. In general, the choice of the number of directions is related to the physical growth of an area. Further directions can be used for areas where the physical growth of the city is heterogeneous. For example, to accurately investigate urban growth changes in very dynamic and large cities, 8 or 16 directions can be used [71]. For smaller cities, fewer directions, such as 4, can be used. Studies, such as [72,73,74], have used 8 directions to examine the spatial location of urban development in different areas. Therefore, this study used 8 geographical directions.

2.6. The SVM Algorithm

In this research, the study area was categorized into two classes of built-up and non-built-up, using the SVM method. Built-up areas include residential, while non-built-up areas include bare lands and vegetation. The SVM method was used to extract urban growth. The SVM classification is one of the supervised nonparametric classification methods based on statistical learning theory [75]. It works on the assumption that there is no information about how the dataset is distributed. The SVM finds a hyperplane that separates the data set into a separate predefined class in a way that fits the training examples [76]. This algorithm was successfully used in many fields [21,77].
Following the classification procedure, the classification accuracy test was performed. Upon verification of the classification accuracy and significant confirmation of errors, the land use map was extracted. The overall accuracy parameter was used to evaluate the accuracy of the classification results. The overall accuracy is the average of the classification accuracy, which indicates the number of correctly classified pixels proportionate to the total number of pixels.

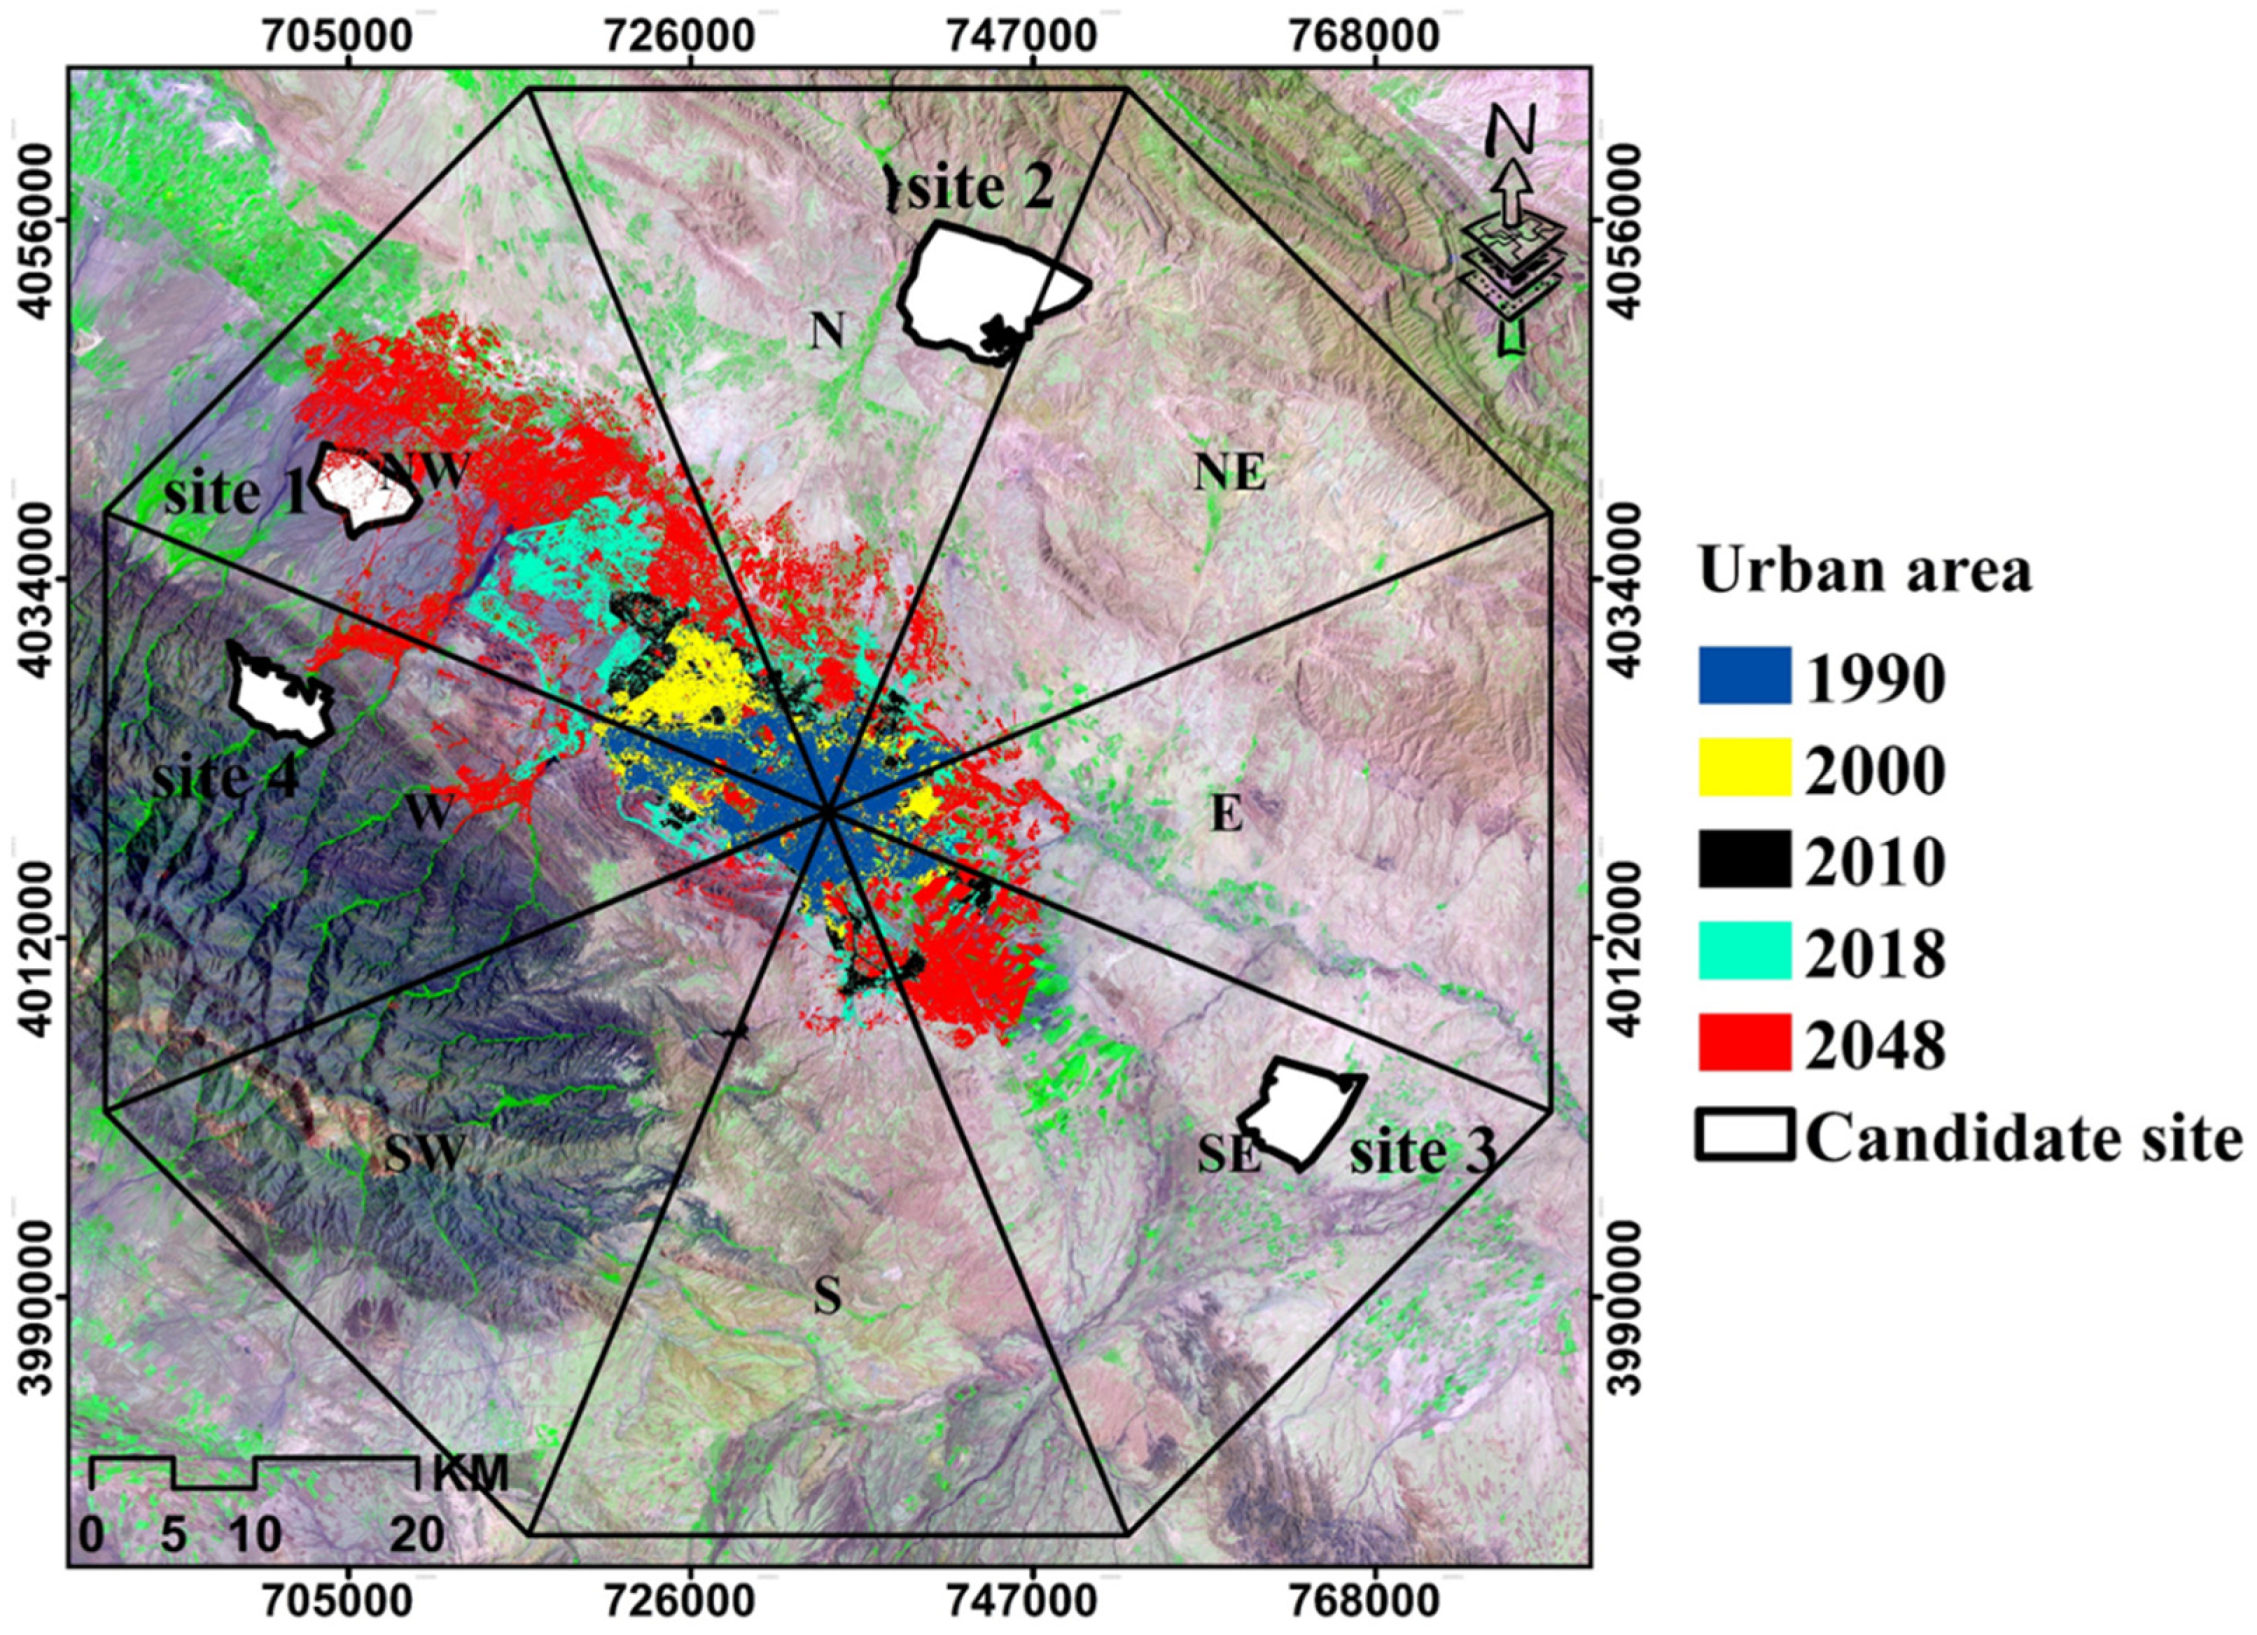
2.7. Urban Growth Estimation

The Markov model is the process-based theory of forming Markov stochastic process systems for prediction and is considered one of the prime methods of optimal control theory [78]. Entries of this model include predicted interval, two raster maps (first and the second year) and respective intervals (see for details Firozjaei et al. [57], Arsanjani et al. [79], Sang et al. [80]). In this study, images from the years between 1990 and 2018 were used to estimate urban growth.
The Markov model is a combination of automated cells and the Markov chain. In the Markov chain model, although the transfer probabilities per user are very accurate, there is no information on the location distribution of the land use [81]. Thus, the Markov stochastic model lacks any spatial dependency information. For this reason, the CA model is used to add a spatial attribute to the model [80,82].

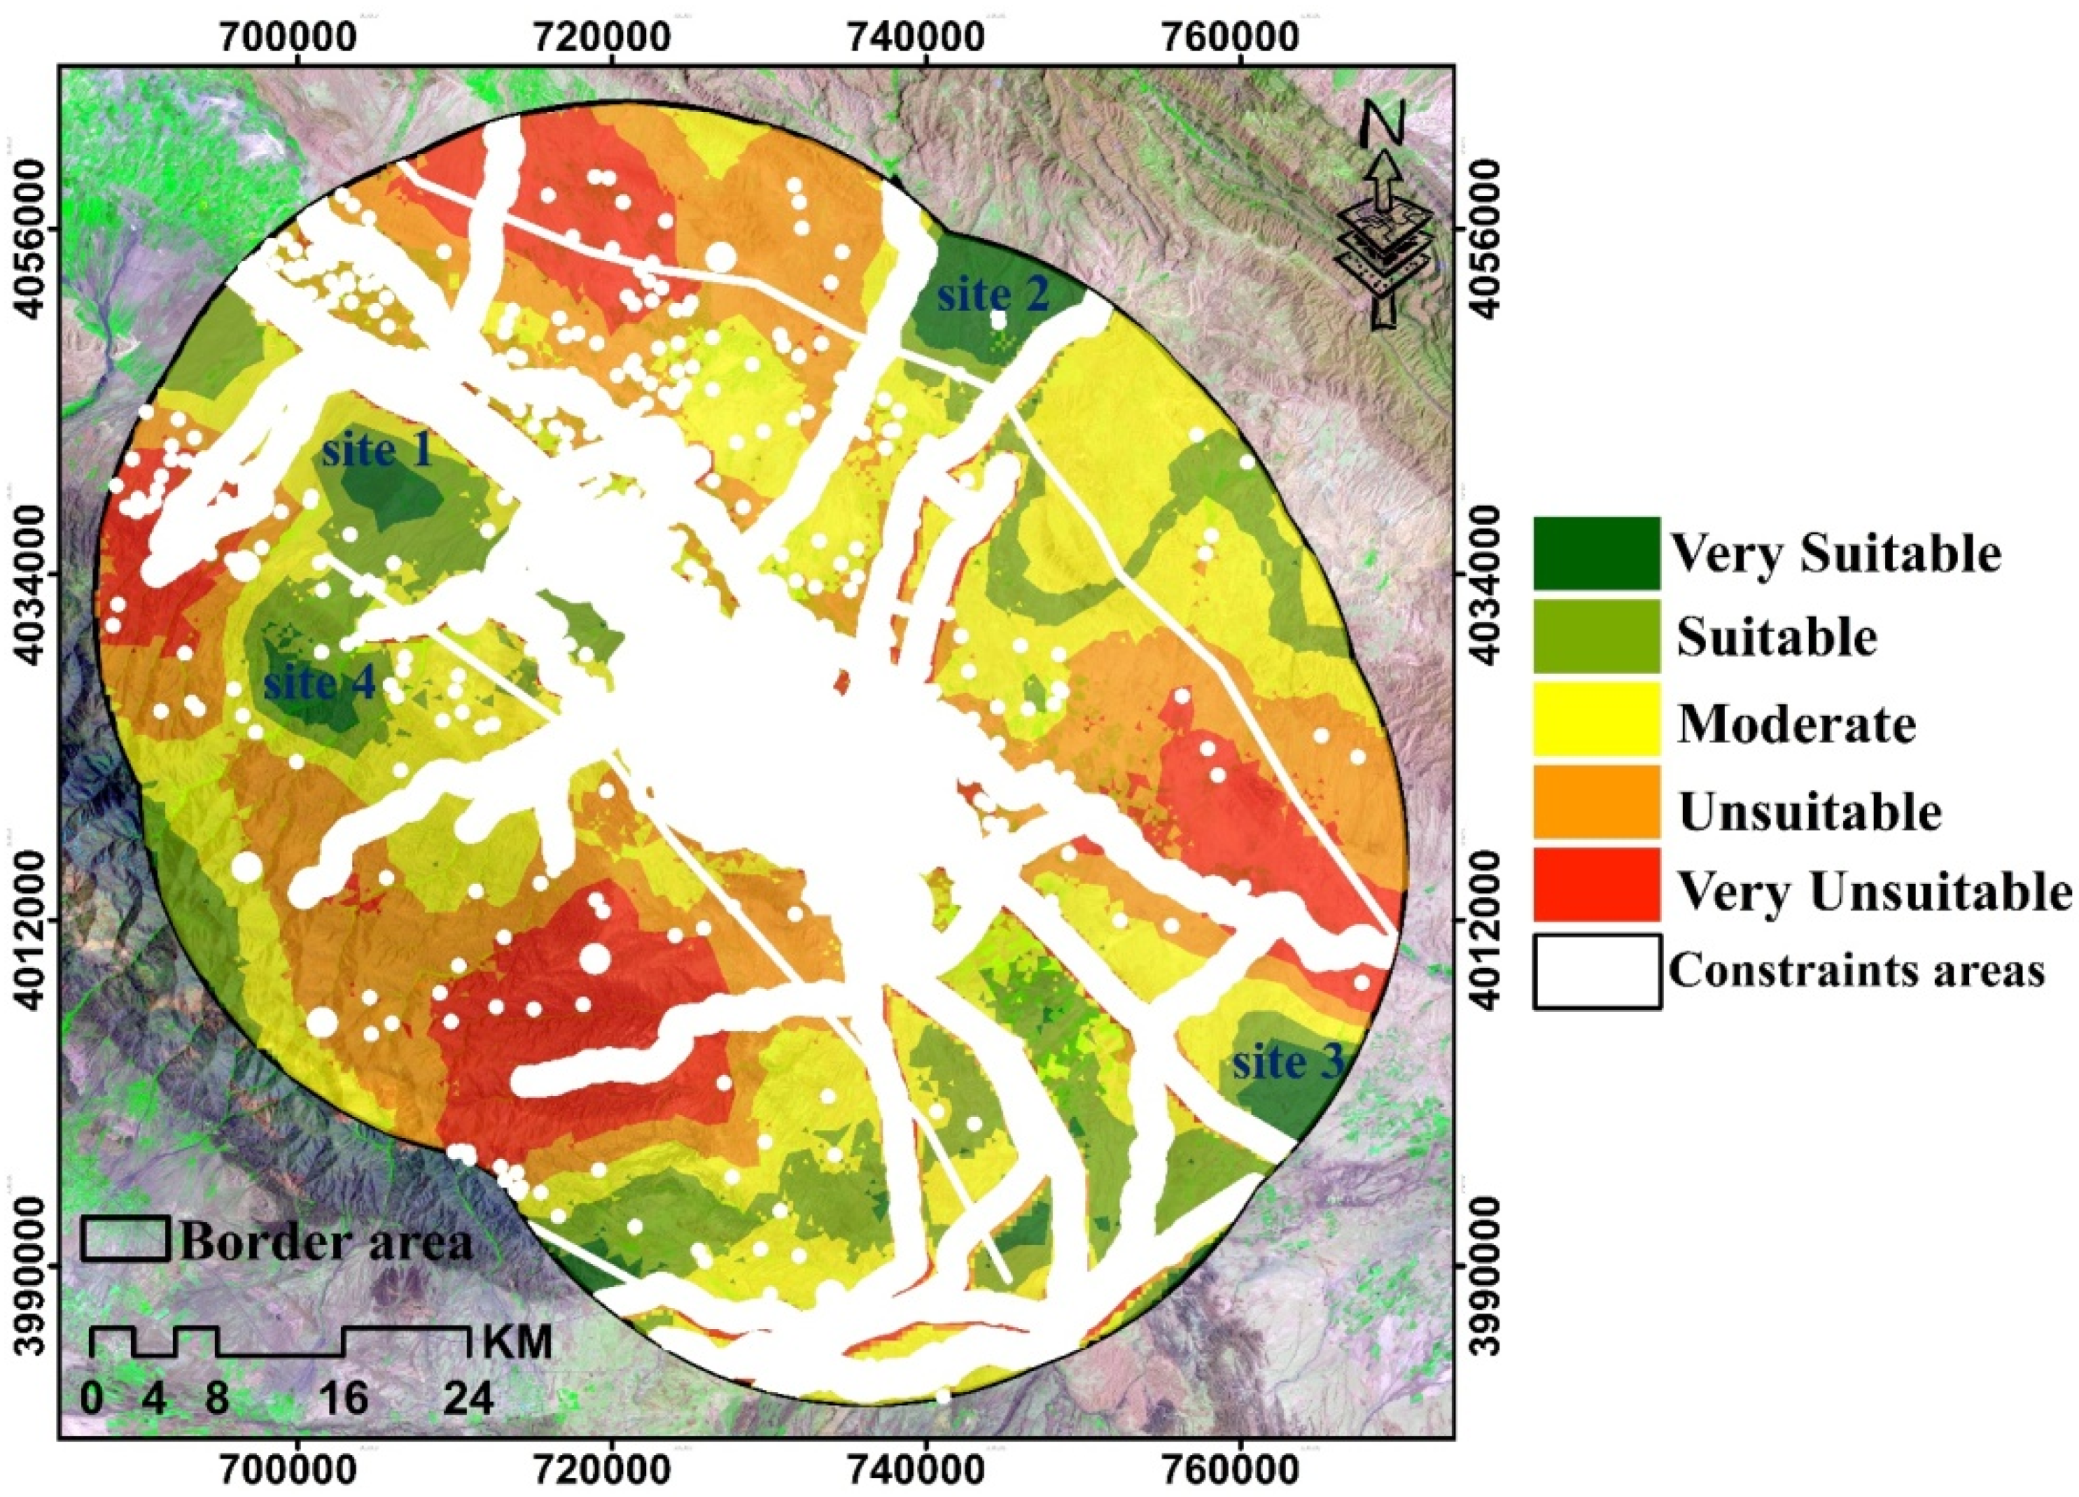
2.8. Classification of the Achieved Suitable Map
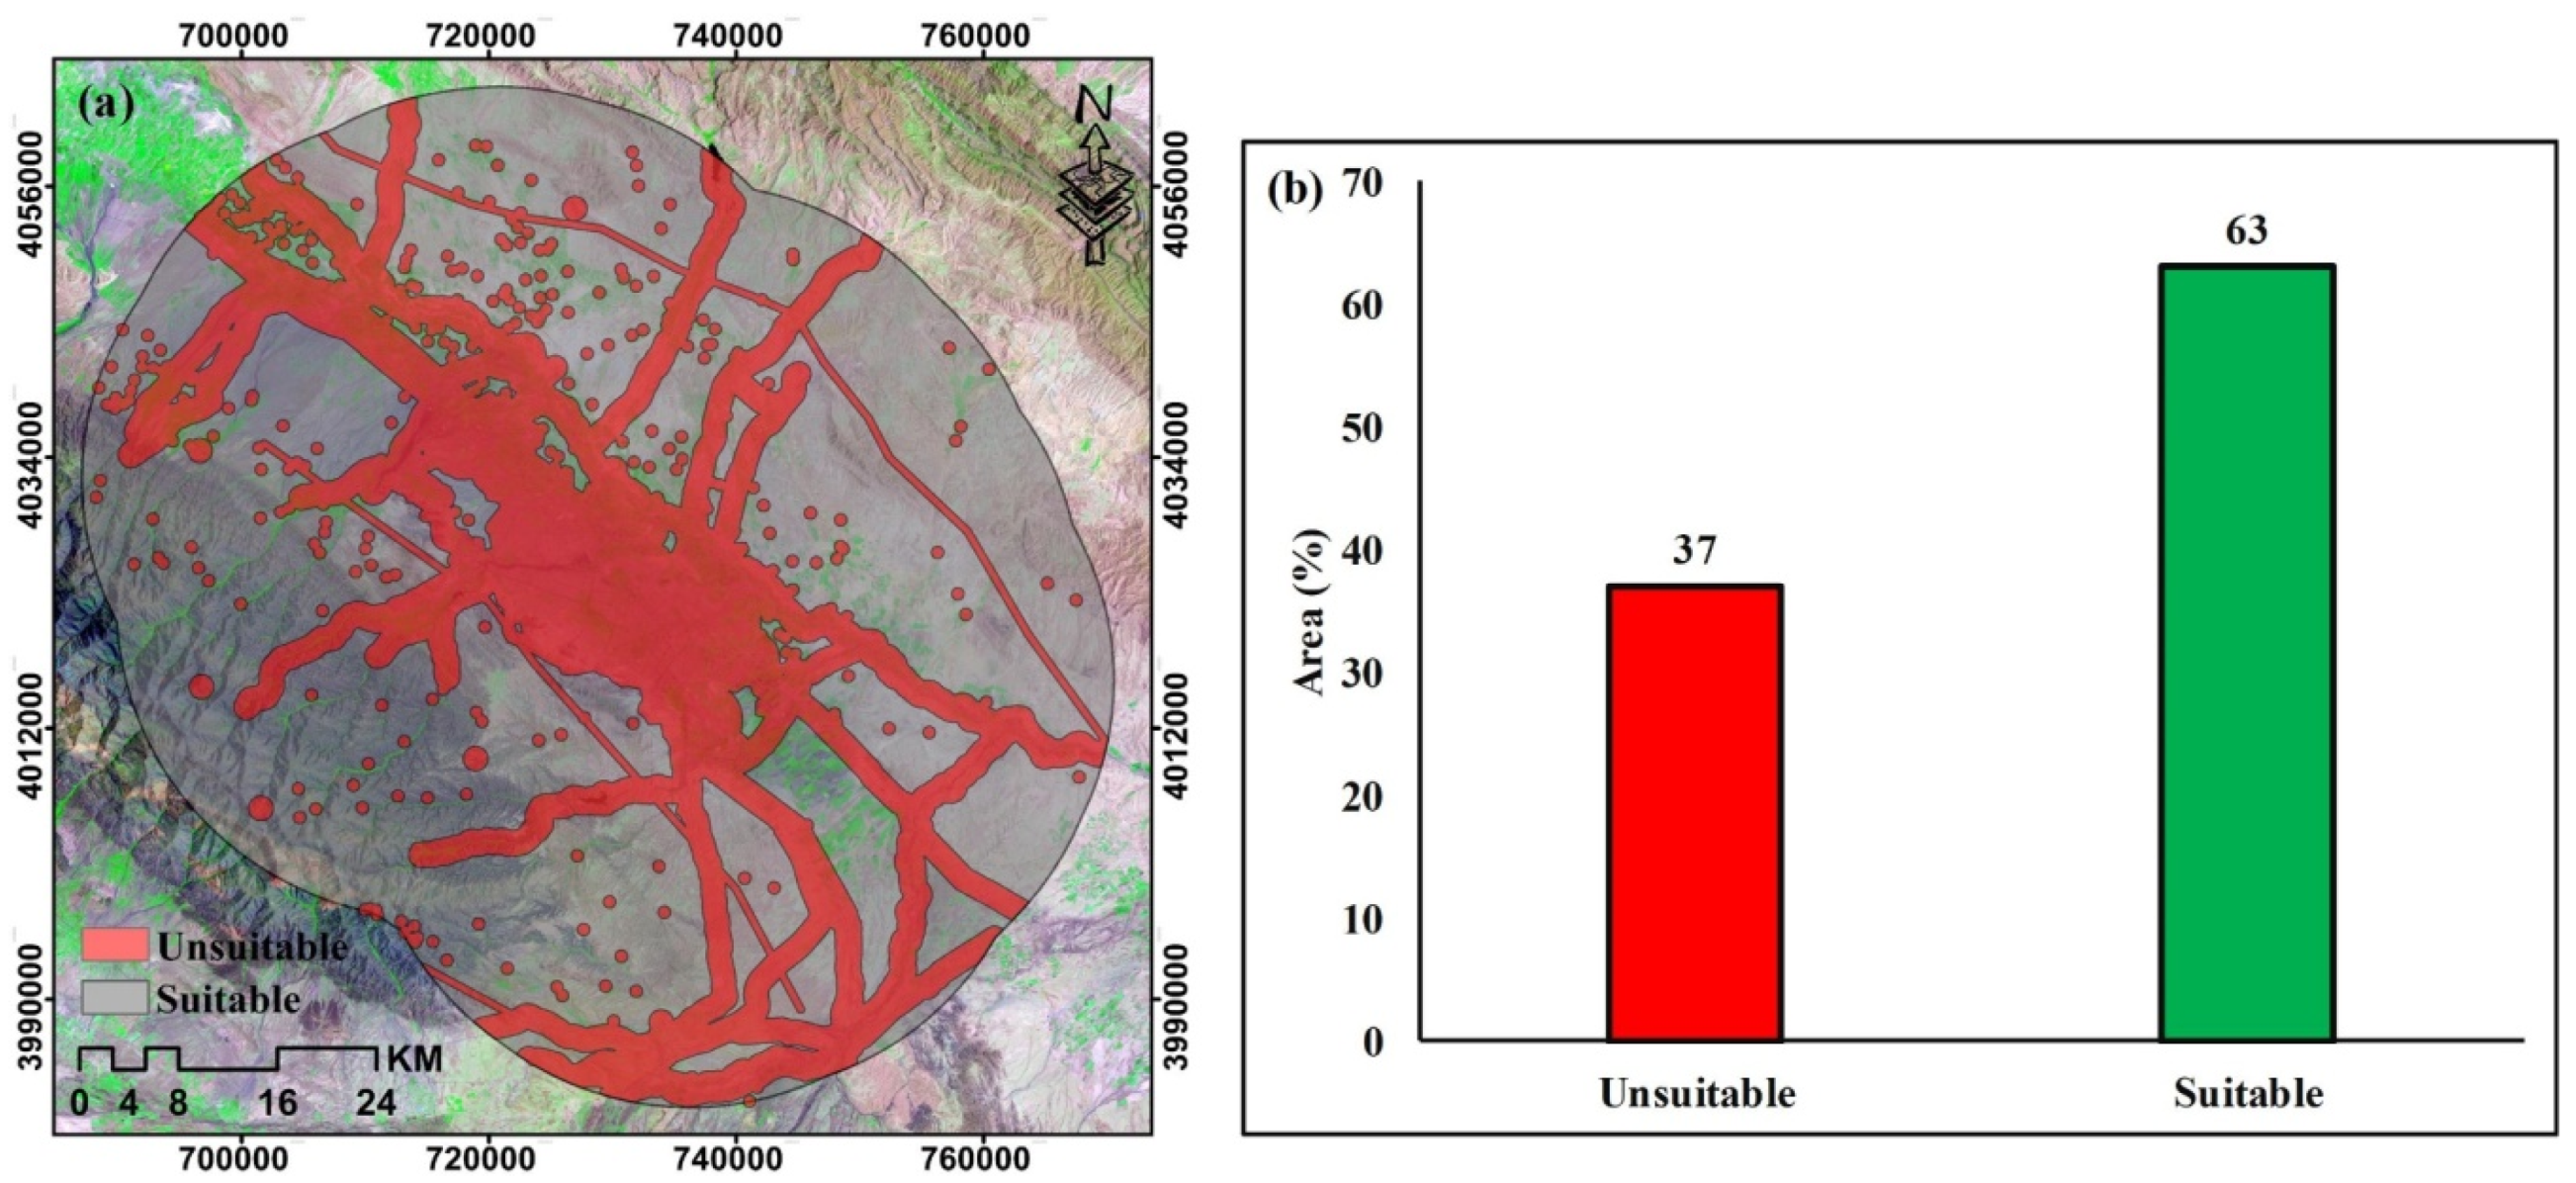
The maximum and minimum values were used to classify the final landfill map. Then, using the standard deviation and mean of the normalized map in accordance with Table 3, the final map was classified into five categories, namely very unsuitable, unsuitable, moderately suitable, suitable and very suitable.

3. Results

The current study benefited from the inputs of an interdisciplinary team of 30 experts from planning and environmental management and GIS engineering to weighting and prioritizing metrics according to pairwise comparisons. The weighting of the criteria was carried out using the Saaty method between 1 and 9 so that the relationship between weight and priorities was based on environmental regulations and technical rules for landfills. Then, a matrix weight was prepared, and the final weight of each criterion was calculated (Table 4). Due to the high use of groundwater in agriculture and rural settlements, the highest weight from the environmental criteria set was allocated to groundwater. In addition, from two economic criteria, the distance from roads was the highest weighted, as landfills should be in the vicinity of road networks, which leads to a reduction in transportation costs.
The results show that the consistency ratio for all criteria is less than 0.1. This demonstrates the acceptability and consistency of the opinions of 30 experts. The environmental and economic criteria were provided by using fuzzy functions in Table 4, and criteria maps were created. Economic criteria, such as slope and distance from roads as well as environmental criteria, including groundwater depth, distance from rivers, soil texture, distance from the fault, landslide, distance from airports, distance from villages, distance from the city, wind direction and NDVI. Figure 4 shows the normalized maps corresponding to each of the environmental and economic criteria.
One of the steps in identifying suitable areas for the location of waste landfills and removal of constraint areas in the final map is the combination of layers with a Boolean overlay method. Areas that are suitable for waste disposal are assigned a value of 1, and areas that are unsuitable are assigned a value of 0. Finally, the most important constraints were selected using a set of questionnaires sent to urban managers, literature reviewers, environmentalists, and economists. All restrictive layers in the GIS software were masked using the intersect tool, and residual areas were defined as suitable sites. In addition, from the entire study area, 63% are in the suitable class, and 37% are in the unsuitable class (Figure 5).
Using the weight assigned to each criterion, the WLC method was used to calculate the set of environmental and economic criteria. Figure 6 shows the final map for selecting the waste landfill. The suitability map was classified into four classes, namely very unsuitable, unsuitable, moderate, suitable and very suitable. In the study area, areas with a value of 0.8–1 were considered for the construction of landfill sites. The suitability map shows that 45% (141,576 ha) of the study area is unsuitable, 22% (68,912 ha) is suitable, and the other 33% (104,282 ha) has moderate potential for landfill sites.
The most suitable areas are found towards the northeast, southeast and northwest of the study area. Due to the high level of groundwater in the area, there are numerous marshes and rivers in the area that are suitable for drinking water in addition to being used for the cultivable of the residential community.
The appropriate slope of between 8 and 12% is required to construct a landfill. In this study, areas with a slope of less than 1% and above 5% were not considered for selecting the suitable landfill site. Sites with a slope below 8% would have fewer construction cost requirements as the volume of groundwater level in this area is high, the risk of groundwater contamination increases. On the other hand, according to field surveys, areas with a slope above 25% have a high level of underground water. In addition, suitable areas are at a good distance from roads because proper access to landfills reduces transportation and maintenance costs.
After considering the economic and environmental criteria, the characteristics of the locations selected are shown in Table 5. Based on Table 5, there are limitations to all selected sites, so measures should be taken to mitigate adverse effects. Slope variations are between 6 and 20%, which indicates a suitable slope compared to other sites selected site 2. Site 2 and 3 in suitable locations due to the value of the NDVI because an NDVI value between 0 and 0.1 represents bare soil. Because the adequate distance from rivers is considered 2000 m, sites 1, 3 and 4 are within a reasonable distance from the rivers. In the study area, all sites are within a suitable distance of landslides, faults, and rivers. The selected sites are also more than 25 km from the airport.
The overall accuracies were used to assess classification accuracy. The overall accuracies for 1990, 2000, 2010, and 2018 were, respectively, 89.5%, 92.6%, 92.2%, and 94.3%. The study area experienced rapid urban growth during the period 1990–2018. A thorough analysis of Landsat images exposes how the rate of built-up areas has increased from 10,241 ha to 15,244 ha from 1990 to 2000, respectively, corresponding to an increase of 48.85%. The urban growth continued reaching an area of 18,675 ha in 2010, corresponding to an increase of 3431 ha, equivalent to 22.5%. For 2018, a massive increase in urban areas occurred compared to previous years, with an increase of 8842 ha within 2010–2018, summing up to 27,517 ha. The main reasons for this increase in urban growth in 2018 are (i) the appropriate economic situation of this city, (ii) suitable conditions in terms of climate and natural resources, (iii) location of tourists and religious attractions and (iv) being in the path of the main communication roads that have turned it as a strategic area. The images from 1990 and 2018 were used to predict the urban area of 2048. The urban area is expected to reach 62,252 ha by 2048, which represents more than a 200% increase over the next 30 years. It should be noted that this expansion will occur under the business-as-usual scenario, i.e., in accordance with the change rate of the 2010–2018 period.
In order to select the most suitable site, the suitable candidate locations will be examined while considering the future urban expansion. For this purpose, the SVM classification model was combined with the binary technique for the extraction of built-up of 1990, 2000, 2010, 2018, and 2048 as presented in Figure 7. The city center is considered the starting point of the casted transects towards eight directions.
Using the spatial analysis of zonal statistics, the area of land constructed in different geographical directions for 1990, 2000, 2010, 2018 and 2048 was calculated. Then, the trend and rate of urban growth for different directions in the period from 1990–2018 years were extracted and shown in Table 6.
The extent of urban growth in various directions is shown in Table 6. Within 1990–2018, the greatest expansion occurred in the northwest direction. That is, the value reached from 2288 hectares in 1990 to 11,430 hectares in 2018. This is equal to a 399.56% urban expansion. That is followed by the second most area increment of 1866 hectares in the western part. The south-west direction experienced the least expansion of built-up lands during these years, which is most importantly due to the natural obstacles, including the topography of the region. This direction has experienced an expansion of 122 hectares. For the prediction period of 2018–2048, the greatest and smallest expansions are expected to occur in the northwest and south-west directions, respectively.
Figure 8 shows the candidate sites and the urban expansion trend for various directions, which is calculated using spatial analysis and applying overlap principles for spatial layers.
According to Figure 8, the greatest urban growth has occurred in the northwest and west directions. This is the reason sites 1 and 4 were removed from suitable locations since they would be located within the upcoming urban areas of the study area and hence avoiding great environmental and economic issues in the future. The south-west direction will face the smallest level of urban growth; however, a natural obstacle, i.e., the Binalud mountain range, will increase the construction costs, and the leach will contaminate surface water during rainfalls. Therefore, sites 2 and 3 are chosen as the ultimate suitable locations considering urban expansion and their high levels in all the criteria.

4. Discussion

Choosing a suitable waste site is one of the most important components in the waste management process. Allocating an inadequate location can lead to economic inefficiency, social and political conflicts, and environmental damage [4]. Waste management is closely related to the dynamics of urban development. Urban growth affects the land demand for landfills. In general, population growth leads to increased waste production. The disposal of this waste includes increased demand for land in most urban areas [1]. On the other hand, the expansion of urban areas to the outside is gradually reducing the availability of land for waste disposal. In this context, land scarcity is becoming a potential problem [83]. Previous studies to determine the location of landfills have not considered the impact of urban physical growth in the future. Therefore, the purpose of this study is to select suitable places for landfilling with emphasis on urban development for the future.
GIS is used as a powerful and integrated tool for storing, manipulating and analyzing landfill criteria [31,32,84], and given that many criteria can have an impact on choosing the suitable location, the use of MCDA methods acquisition can facilitate the selection of the appropriate location by considering key criteria in the decision-making process [47,85]. Numerous studies have shown that GIS-based MCDA models are a powerful and flexible tool in determining suitable landfills. According to the experts and AHP model, the criteria of groundwater depth and distance from roads were the most important among the environmental and economic criteria, respectively. AHP is a common method among decision-makers for MCDA, providing several advantages in the MCDA process [86]. The method is simple with a structured hierarchical format, which allows for a transparent selection process and provides the possibility to check the priority inconsistency. However, several disadvantages of the AHP method were reported in the previous studies [87,88,89,90]. However, the incompatibility rate of less than 0.01 indicates the acceptability and consistency of the opinions of 30 experts in this study [91]. Combining the criteria using the WLC method showed that there are only four suitable areas for landfilling in the study area. The CA model has been used to predict urban expansion. By integrating environmental models with socio-economic ones, the CA model provides a dynamic simulation and modeling framework [92]. In addition, the WLC method and CA model are conceptually more accurate, complete, and clearer than conventional mathematical systems [93]. Based on the current status and past information, the possible future for lands not built and untouched areas around the city can be predicted (Arsanjani et al., 2013). By estimating the pattern of urban growth and its distribution in space, using the CA model will lead to proper planning for sustainable development and the absence of surprises in the face of possible future events [94]. Previous studies have shown that the physical growth of built-up for a city in the past and future is different in different geographical directions [72,95]. The urban growth prediction for 2048 showed that the northeast and east directions will have the most expansion. Therefore, out of the four selected options, two options were left out because they will be on the path of urban expansion in the future because, in addition to environmental problems, potentially having to relocate these places will have high economic costs. In general, based on the findings of this study, the combination of GIS and remote sensing can be necessary to select the optimal and appropriate locations. The strategy proposed in this study is simple, comprehensive, integrated, flexible and scalable. Due to the increase in waste production and its environmental importance, determining suitable locations for waste disposal of metropolitan cities, such as Mashhad, is of great importance worldwide. On the other hand, with the increase in population of different cities of the world, the urban physical growth will accordingly increase. Due to the lack of limitations in terms of data type and model used and the independence of the proposed model to the geographical conditions, the proposed model can be suitable for determining the optimal landfill locations in all cities of the world.

5. Conclusions

Due to rapid urban development in the developing world, creating landfills has become more challenging as our allocation strategies are mainly based on the current landscape circumstances, while they will change in the future. Hence, it is recommended to build landfills away from future urban growth channels. The main contribution of this research was to adapt the current practices with oversight to the future landscape patterns using a dynamic case study of Mashhad over a 30-year timeframe to the future. This study presented a methodical approach inspired by expert knowledge for doing so by coupling satellite images and GIS data and methods. Consequently, candidate locations suitable for landfilling were determined, with about 5% of the study area being determined to be highly suitable. Our analysis of future urban development from 2018 until 2048 reveals a large expansion of Mashhad towards different directions in particular northwest and west. This is due to the fact that the ratio of uncultivated land to agricultural land is greater in these directions, and also, there are no natural obstacles in these directions. This resulted in removing two candidate sites from the list. This indicates how unreliable our landfill allocation for the study area could be if there was no consideration of the future. Our results are sensitive to a number of factors, including (i) accuracy of classification model for built-up extraction; (ii) performance of the CA-Markov model for urban growth prediction; (iii) experts’ uncertainty in the weighting process; and (iv) performance of the MCDA model; and (e) future regional plans.
Our findings, the presented methodology and utilized data can help stakeholders and decision-makers in the area to gain better insights into the allocation of land and resources. The practice of including expert knowledge was a useful experience to reflect their input while setting up a decision support system for landfill site selection. As future directions, consideration of public participatory approaches for receiving citizens’ opinion about such activities is proposed. Fuzzy and OWA models can be used to model uncertainty and risk to produce more accurate landfill maps. Furthermore, the use of neural network-based models to predict the physical growth of the built-up can be useful in improving the efficiency of the strategy proposed in this study to determine suitable landfill locations. Implementing the proposed strategy for different cities around the world can be effective in solving the problems and challenges associated with suitable landfills.

Author Contributions

S.N.S., M.K.F., F.M. and F.N. conceived and designed the research of the first draft and wrote the first draft; N.N.S., J.J.A. and M.H. redesigned the research, revised and edited the paper; S.Q. provided comments. All authors have read and agreed to the published version of the manuscript.

Funding

This research received no external funding.

Acknowledgments

This study was supported by the Agrohydrology Research Group of Tarbiat Modares University (Grant No. IG-39713).

Conflicts of Interest

The authors declare no conflict of interest.

References

  1. Leao, S.; Bishop, I.; Evans, D. Assessing the demand of solid waste disposal in urban region by urban dynamics modelling in a GIS environment. Resour. Conserv. Recycl. 2001, 33, 289–313. [Google Scholar] [CrossRef]
  2. Barakat, A.; Hilali, A.; El Baghdadi, M.; Touhami, F. Landfill site selection with GIS-based multi-criteria evaluation technique. A case study in Béni Mellal-Khouribga Region, Morocco. Environ. Earth Sci. 2017, 76, 413. [Google Scholar] [CrossRef]
  3. Yeung, I.M.; Chung, W. Factors that affect the willingness of residents to pay for solid waste management in Hong Kong. Environ. Sci. Pollut. Res. 2018, 25, 7504–7517. [Google Scholar] [CrossRef] [PubMed]
  4. Leao, S.; Bishop, I.; Evans, D. Spatial–temporal model for demand and allocation of waste landfills in growing urban regions. Comput. Environ. Urban Syst. 2004, 28, 353–385. [Google Scholar] [CrossRef]
  5. Mikkelsen, P.; Häfliger, M.; Ochs, M.; Jacobsen, P.; Tjell, J.; Boller, M. Pollution of soil and groundwater from infiltration of highly contaminated stormwater—A case study. Water Sci. Technol. 1997, 36, 325–330. [Google Scholar] [CrossRef]
  6. Hoang, G.M.; Fujiwara, T.; Phu, T.S.P.; Nguyen, L.D. Sustainable solid waste management system using multi-objective decision-making model: A method for maximizing social acceptance in Hoi An city, Vietnam. Environ. Sci. Pollut. Res. 2019, 26, 34137–34147. [Google Scholar] [CrossRef] [PubMed]
  7. Downey, L.; Van Willigen, M. Environmental stressors: The mental health impacts of living near industrial activity. J. Health Soc. Behav. 2005, 46, 289–305. [Google Scholar] [CrossRef] [PubMed] [Green Version]
  8. Kjeldsen, P.; Barlaz, M.A.; Rooker, A.P.; Baun, A.; Ledin, A.; Christensen, T.H. Present and long-term composition of MSW landfill leachate: A review. Crit. Rev. Environ. Sci. Technol. 2002, 32, 297–336. [Google Scholar] [CrossRef]
  9. Wang, Y.; Li, J.; An, D.; Xi, B.; Tang, J.; Wang, Y.; Yang, Y. Site selection for municipal solid waste landfill considering environmental health risks. Resour. Conserv. Recycl. 2018, 138, 40–46. [Google Scholar] [CrossRef]
  10. Palmiotto, M.; Fattore, E.; Paiano, V.; Celeste, G.; Colombo, A.; Davoli, E. Influence of a municipal solid waste landfill in the surrounding environment: Toxicological risk and odor nuisance effects. Environ. Int. 2014, 68, 16–24. [Google Scholar] [CrossRef] [PubMed]
  11. Kahhat, R.; Williams, E. Materials flow analysis of e-waste: Domestic flows and exports of used computers from the United States. Resour. Conserv. Recycl. 2012, 67, 67–74. [Google Scholar] [CrossRef]
  12. Eskandari, M.; Homaee, M.; Mahmodi, S. An integrated multi criteria approach for landfill siting in a conflicting environmental, economical and socio-cultural area. Waste Manag. 2012, 32, 1528–1538. [Google Scholar] [CrossRef]
  13. Karimi, H.; Amiri, S.; Huang, J.; Karimi, A. Integrating GIS and multi-criteria decision analysis for landfill site selection, case study: Javanrood County in Iran. Int. J. Environ. Sci. Technol. 2019, 16, 7305–7318. [Google Scholar] [CrossRef]
  14. Effat, H.A.; Hegazy, M.N. Mapping potential landfill sites for North Sinai cities using spatial multicriteria evaluation. Egypt. J. Remote Sens. Space Sci. 2012, 15, 125–133. [Google Scholar] [CrossRef] [Green Version]
  15. Kontos, T.D.; Komilis, D.P.; Halvadakis, C.P. Siting MSW landfills with a spatial multiple criteria analysis methodology. Waste Manag. 2005, 25, 818–832. [Google Scholar] [CrossRef]
  16. Adeyemi, G.A.; Markus, M.; Gbolahan, O.; Edeki, S. Landfill site selection in ado-odo ota lga using geographic information systemS. Int. J. Civ. Eng. Technol. 2018, 9, 1434–1445. [Google Scholar]
  17. Shorabeh, S.N.; Firozjaei, M.K.; Nematollahi, O.; Firozjaei, H.K.; Jelokhani-Niaraki, M. A risk-based multi-criteria spatial decision analysis for solar power plant site selection in different climates: A case study in Iran. Renew. Energy 2019, 143, 958–973. [Google Scholar] [CrossRef]
  18. Firozjaei, M.K.; Nematollahi, O.; Mijani, N.; Shorabeh, S.N.; Firozjaei, H.K.; Toomanian, A. An integrated GIS-based Ordered Weighted Averaging analysis for solar energy evaluation in Iran: Current conditions and future planning. Renew. Energy 2019, 136, 1130–1146. [Google Scholar] [CrossRef]
  19. Nadizadeh Shorabeh, S.; Neisany Samany, N.; Abdali, Y. Mapping the potential of solar power plants based on the concept of risk Case study: Razavi Khorasan Province. Sci. Res. Q. Geogr. Data 2019, 28, 129–147. (In Persian) [Google Scholar]
  20. Torabi-Kaveh, M.; Babazadeh, R.; Mohammadi, S.; Zaresefat, M. Landfill site selection using combination of GIS and fuzzy AHP, a case study: Iranshahr, Iran. Waste Manag. Res. 2016, 34, 438–448. [Google Scholar] [CrossRef]
  21. Ding, H.; Shi, W. Land-use/land-cover change and its influence on surface temperature: A case study in Beijing City. Int. J. Remote Sens. 2013, 34, 5503–5517. [Google Scholar] [CrossRef]
  22. Zabihi, H.; Alizadeh, M.; Kibet Langat, P.; Karami, M.; Shahabi, H.; Ahmad, A.; Nor Said, M.; Lee, S. GIS Multi-Criteria Analysis by Ordered Weighted Averaging (OWA): Toward an integrated citrus management strategy. Sustainability 2019, 11, 1009. [Google Scholar] [CrossRef] [Green Version]
  23. Tayyebi, A.; Shafizadeh-Moghadam, H.; Tayyebi, A.H. Analyzing long-term spatio-temporal patterns of land surface temperature in response to rapid urbanization in the mega-city of Tehran. Land Use Policy 2018, 71, 459–469. [Google Scholar] [CrossRef]
  24. Gorsevski, P.V.; Donevska, K.R.; Mitrovski, C.D.; Frizado, J.P. Integrating multi-criteria evaluation techniques with geographic information systems for landfill site selection: A case study using ordered weighted average. Waste Manag. 2012, 32, 287–296. [Google Scholar] [CrossRef] [PubMed]
  25. Mir, M.A.; Ghazvinei, P.T.; Sulaiman, N.; Basri, N.E.A.; Saheri, S.; Mahmood, N.; Jahan, A.; Begum, R.A.; Aghamohammadi, N. Application of TOPSIS and VIKOR improved versions in a multi criteria decision analysis to develop an optimized municipal solid waste management model. J. Environ. Manag. 2016, 166, 109–115. [Google Scholar]
  26. Rahmat, Z.G.; Niri, M.V.; Alavi, N.; Goudarzi, G.; Babaei, A.A.; Baboli, Z.; Hosseinzadeh, M. Landfill site selection using GIS and AHP: A case study: Behbahan, Iran. KSCE J. Civ. Eng. 2017, 21, 111–118. [Google Scholar] [CrossRef]
  27. Ahmad, S.Z.; Ahamad, M.S.S.; Yusoff, M.S.; Abujayyab, S.K. Enhanced Fuzzy-OWA model for municipal solid waste landfill site selection. In Proceedings of the AIP Conference Proceedings, Bydgoszcz, Poland, 9–11 May 2017; p. 040004. [Google Scholar]
  28. Santhosh, L.; Sivakumar Babu, G. Landfill site selection based on reliability concepts using the DRASTIC method and AHP integrated with GIS–a case study of Bengaluru city, India. Georisk Assess. Manag. Risk Eng. Syst. Geohazards 2018, 12, 234–252. [Google Scholar] [CrossRef]
  29. Aksoy, E.; San, B.T. Geographical information systems (GIS) and multi-criteria decision analysis (MCDA) integration for sustainable landfill site selection considering dynamic data source. Bull. Eng. Geol. Environ. 2019, 78, 779–791. [Google Scholar] [CrossRef]
  30. Feyzi, S.; Khanmohammadi, M.; Abedinzadeh, N.; Aalipour, M. Multi-criteria decision analysis FANP based on GIS for siting municipal solid waste incineration power plant in the north of Iran. Sustain. Cities Soc. 2019, 47, 101513. [Google Scholar] [CrossRef]
  31. Kamdar, I.; Ali, S.; Bennui, A.; Techato, K.; Jutidamrongphan, W. Municipal solid waste landfill siting using an integrated GIS-AHP approach: A case study from Songkhla, Thailand. Resour. Conserv. Recycl. 2019, 149, 220–235. [Google Scholar] [CrossRef]
  32. Rahimi, S.; Hafezalkotob, A.; Monavari, S.M.; Hafezalkotob, A.; Rahimi, R. Sustainable landfill site selection for municipal solid waste based on a hybrid decision-making approach: Fuzzy group BWM-MULTIMOORA-GIS. J. Clean. Prod. 2020, 248, 119186. [Google Scholar] [CrossRef]
  33. Njoku, P.O.; Edokpayi, J.N.; Odiyo, J.O. Health and environmental risks of residents living close to a landfill: A case study of Thohoyandou Landfill, Limpopo Province, South Africa. Int. J. Environ. Res. Public Health 2019, 16, 2125. [Google Scholar] [CrossRef] [PubMed] [Green Version]
  34. Bridges, O.; Bridges, J.W.; Potter, J.F. A generic comparison of the airborne risks to human health from landfill and incinerator disposal of municipal solid waste. Environmentalist 2000, 20, 325–334. [Google Scholar] [CrossRef]
  35. Sankoh, F.P.; Yan, X.; Tran, Q. Environmental and health impact of solid waste disposal in developing cities: A case study of granville brook dumpsite, Freetown, Sierra Leone. J. Environ. Prot. 2013, 4, 665–670. [Google Scholar] [CrossRef] [Green Version]
  36. Brender, J.D.; Maantay, J.A.; Chakraborty, J. Residential proximity to environmental hazards and adverse health outcomes. Am. J. Public Health 2011, 101, S37–S52. [Google Scholar] [CrossRef]
  37. Vrijheid, M. Health effects of residence near hazardous waste landfill sites: A review of epidemiologic literature. Environ. Health Perspect. 2000, 108, 101–112. [Google Scholar]
  38. Wang, G.; Qin, L.; Li, G.; Chen, L. Landfill site selection using spatial information technologies and AHP: A case study in Beijing, China. J. Environ. Manag. 2009, 90, 2414–2421. [Google Scholar] [CrossRef] [PubMed]
  39. Mahini, A.S.; Gholamalifard, M. Siting MSW landfills with a weighted linear combination methodology in a GIS environment. Int. J. Environ. Sci. Technol. 2006, 3, 435–445. [Google Scholar] [CrossRef] [Green Version]
  40. Akbari, V.; Rajabi, M.; Chavoshi, S.; Shams, R. Landfill site selection by combining GIS and fuzzy multi criteria decision analysis, case study: Bandar Abbas, Iran. World Appl. Sci. J. 2008, 3, 39–47. [Google Scholar]
  41. Şener, Ş.; Şener, E.; Nas, B.; Karagüzel, R. Combining AHP with GIS for landfill site selection: A case study in the Lake Beyşehir catchment area (Konya, Turkey). Waste Manag. 2010, 30, 2037–2046. [Google Scholar] [CrossRef]
  42. Arkoc, O. Municipal solid waste landfill site selection using geographical information systems: A case study from Çorlu, Turkey. Arab. J. Geosci. 2014, 7, 4975–4985. [Google Scholar] [CrossRef]
  43. Beskese, A.; Demir, H.H.; Ozcan, H.K.; Okten, H.E. Landfill site selection using fuzzy AHP and fuzzy TOPSIS: A case study for Istanbul. Environ. Earth Sci. 2015, 73, 3513–3521. [Google Scholar] [CrossRef]
  44. Al-Anbari, M.; Thameer, M.; Al-Ansari, N. Landfill Site Selection by Weighted Overlay Technique: Case Study of Al-Kufa, Iraq. Sustainability 2018, 10, 999. [Google Scholar] [CrossRef] [Green Version]
  45. Alam, S.; Kolekar, K.; Hazra, T.; Chakrabarty, S. Selection of Suitable Landfill Site for Municipal Solid Waste Disposal: A Fuzzy Logic Approach. In Waste Management and Resource Efficiency; Springer: Berlin/Heidelberg, Germany, 2019; pp. 109–129. [Google Scholar]
  46. Aydi, A.; Zairi, M.; Dhia, H.B. Minimization of environmental risk of landfill site using fuzzy logic, analytical hierarchy process, and weighted linear combination methodology in a geographic information system environment. Environ. Earth Sci. 2013, 68, 1375–1389. [Google Scholar] [CrossRef]
  47. Vasiljević, T.Z.; Srdjević, Z.; Bajčetić, R.; Miloradov, M.V. GIS and the analytic hierarchy process for regional landfill site selection in transitional countries: A case study from Serbia. Environ. Manag. 2012, 49, 445–458. [Google Scholar] [CrossRef]
  48. Khan, D.; Samadder, S.R. A simplified multi-criteria evaluation model for landfill site ranking and selection based on AHP and GIS. J. Environ. Eng. Landsc. Manag. 2015, 23, 267–278. [Google Scholar] [CrossRef]
  49. Gnanachandrasamy, G.; Ramkumar, T.; Venkatramanan, S.; Vasudevan, S.; Chung, S.; Bagyaraj, M. Accessing groundwater quality in lower part of Nagapattinam district, Southern India: Using hydrogeochemistry and GIS interpolation techniques. Appl. Water Sci. 2015, 5, 39–55. [Google Scholar] [CrossRef] [Green Version]
  50. Kontos, T.D.; Komilis, D.P.; Halvadakis, C.P. Siting MSW landfills on Lesvos island with a GIS-based methodology. Waste Manag. Res. 2003, 21, 262–277. [Google Scholar] [CrossRef]
  51. Sumathi, V.; Natesan, U.; Sarkar, C. GIS-based approach for optimized siting of municipal solid waste landfill. Waste Manag. 2008, 28, 2146–2160. [Google Scholar] [CrossRef]
  52. Al-Hanbali, A.; Alsaaideh, B.; Kondoh, A. Using GIS-based weighted linear combination analysis and remote sensing techniques to select optimum solid waste disposal sites within Mafraq City, Jordan. J. Geogr. Inf. Syst. 2011, 3, 267. [Google Scholar] [CrossRef] [Green Version]
  53. Feizizadeh, B.; Omrani, K.; Aghdam, F.B. Fuzzy analytical hierarchical process and spatially explicit uncertainty analysis approach for multiple forest fire risk mapping. In Proceedings of the GI-Forum, Salzburg, Austria, 7–10 July 2015; pp. 72–80. [Google Scholar]
  54. Şener, B.; Süzen, M.L.; Doyuran, V. Landfill site selection by using geographic information systems. Environ. Geol. 2006, 49, 376–388. [Google Scholar] [CrossRef]
  55. Allen, B.; Caetano, P.; Costa, C.; Cummins, V.; Donnelly, J.; Koukoulas, S.; O’donnell, V.; Robalo, C.; Vendas, D. A landfill site selection process incorporating GIS modelling. In Proceedings of the Ninth International Waste Management and Landfill, Sardinia, Italy, 1–6 October 2003. [Google Scholar]
  56. Alexakis, D.D.; Sarris, A. Integrated GIS and remote sensing analysis for landfill sitting in Western Crete, Greece. Environ. Earth Sci. 2014, 72, 467–482. [Google Scholar] [CrossRef]
  57. Firozjaei, M.K.; Kiavarz, M.; Alavipanah, S.K.; Lakes, T.; Qureshi, S. Monitoring and forecasting heat island intensity through multi-temporal image analysis and cellular automata-Markov chain modelling: A case of Babol city, Iran. Ecol. Indic. 2018, 91, 155–170. [Google Scholar] [CrossRef]
  58. Vlassova, L.; Perez-Cabello, F.; Nieto, H.; Martín, P.; Riaño, D.; De La Riva, J. Assessment of methods for land surface temperature retrieval from Landsat-5 TM images applicable to multiscale tree-grass ecosystem modeling. Remote Sens. 2014, 6, 4345–4368. [Google Scholar] [CrossRef] [Green Version]
  59. Nadizadeh Shorabeh, S.; Hamzeh, S.; Zanganeh Shahraki, S.; Firozjaei, M.K.; Jokar Arsanjani, J. Modelling the intensity of surface urban heat island and predicting the emerging patterns: Landsat multi-temporal images and Tehran as case study. Int. J. Remote Sens. 2020, 41, 7400–7426. [Google Scholar] [CrossRef]
  60. Lin, H.-Y.; Kao, J.-J. A vector-based spatial model for landfill siting. J. Hazard. Mater. 1998, 58, 3–14. [Google Scholar] [CrossRef]
  61. Nadizadeh, S.S.; Neysani, S.N.; Jelokhani, N.M. Determination of optimum areas for the landfill with emphasis on the urban expansion trend based on the combination of the Analytical Hierarchy Process and the Ordered Weighted Averaging model. J. Nat. Environ. 2018, 70, 949–969. (In Persian) [Google Scholar]
  62. Şener, Ş.; Sener, E.; Karagüzel, R. Solid waste disposal site selection with GIS and AHP methodology: A case study in Senirkent–Uluborlu (Isparta) Basin, Turkey. Environ. Monit. Assess. 2011, 173, 533–554. [Google Scholar] [CrossRef] [PubMed]
  63. Kahraman, C.; Cebi, S.; Onar, S.C.; Oztaysi, B. A novel trapezoidal intuitionistic fuzzy information axiom approach: An application to multicriteria landfill site selection. Eng. Appl. Artif. Intell. 2018, 67, 157–172. [Google Scholar] [CrossRef]
  64. Karasan, A.; Ilbahar, E.; Kahraman, C. A novel pythagorean fuzzy AHP and its application to landfill site selection problem. Soft Comput. 2019, 23, 10953–10968. [Google Scholar] [CrossRef]
  65. Saaty, T.L. The analytical hierarchy process, planning, priority. In Resource Allocation; RWS Publications: Pittsburgh, PA, USA, 1980. [Google Scholar]
  66. Saaty, T.L. Axiomatic foundation of the analytic hierarchy process. Manag. Sci. 1986, 32, 841–855. [Google Scholar] [CrossRef]
  67. Saaty, T.L. Decision making with the analytic hierarchy process. Int. J. Serv. Sci. 2008, 1, 83–98. [Google Scholar] [CrossRef] [Green Version]
  68. Saaty, T.L.; Vargas, L.G. Prediction, Projection, and Forecasting: Applications of the Analytic Hierarchy Process in Economics, Finance, Politics, Games, and Sports; Kluwer Academic Publishers: Dordrecht, The Netherlands, 1991. [Google Scholar]
  69. Malczewski, J. Ordered weighted averaging with fuzzy quantifiers: GIS-based multicriteria evaluation for land-use suitability analysis. Int. J. Appl. Earth Obs. Geoinf. 2006, 8, 270–277. [Google Scholar] [CrossRef]
  70. Boloorani, A.D.; Kazemi, Y.; Sadeghi, A.; Shorabeh, S.N.; Argany, M. Identification of dust sources using long term satellite and climatic data: A case study of Tigris and Euphrates basin. Atmos. Environ. 2020, 224, 117299. [Google Scholar] [CrossRef]
  71. Dadras, M.; Shafri, H.Z.; Ahmad, N.; Pradhan, B.; Safarpour, S. Spatio-temporal analysis of urban growth from remote sensing data in Bandar Abbas city, Iran. Egypt. J. Remote Sens. Space Sci. 2015, 18, 35–52. [Google Scholar] [CrossRef] [Green Version]
  72. Firozjaei, M.K.; Sedighi, A.; Argany, M.; Jelokhani-Niaraki, M.; Arsanjani, J.J. A geographical direction-based approach for capturing the local variation of urban expansion in the application of CA-Markov model. Cities 2019, 93, 120–135. [Google Scholar] [CrossRef]
  73. Karimi Firuzjaei, M.; Kiavarz Moghadam, M.; Mijani, N.; Alavi Panah, S. Quantifying the degree-of-freedom, degree-of-sprawl and degree-of-goodness of urban growth tehran and factors affecting it using remote sensing and statistical analyzes. J. Geomat. Sci. Technol. 2018, 7, 89–107. [Google Scholar]
  74. El-Magd, I.A.; Hasan, A.; El Sayed, A. A Century of Monitoring Urban Growth in Menofya Governorate, Egypt, Using Remote Sensing and Geographic Information Analysis. J. Geogr. Inf. Syst. 2015, 7, 402. [Google Scholar] [CrossRef] [Green Version]
  75. Mountrakis, G.; Im, J.; Ogole, C. Support vector machines in remote sensing: A review. ISPRS J. Photogramm. Remote Sens. 2011, 66, 247–259. [Google Scholar] [CrossRef]
  76. Kavzoglu, T.; Colkesen, I. A kernel functions analysis for support vector machines for land cover classification. Int. J. Appl. Earth Obs. Geoinf. 2009, 11, 352–359. [Google Scholar] [CrossRef]
  77. Rumpf, T.; Mahlein, A.-K.; Steiner, U.; Oerke, E.-C.; Dehne, H.-W.; Plümer, L. Early detection and classification of plant diseases with support vector machines based on hyperspectral reflectance. Comput. Electron. Agric. 2010, 74, 91–99. [Google Scholar] [CrossRef]
  78. Jiang, G.; Zhang, F.; Kong, X. Determining conversion direction of rural residential land consolidation in Beijing mountainous areas. Trans. Chin. Soc. Agric. Eng. 2009, 25, 214–221. [Google Scholar]
  79. Arsanjani, J.J.; Kainz, W.; Mousivand, A.J. Tracking dynamic land-use change using spatially explicit Markov Chain based on cellular automata: The case of Tehran. Int. J. Image Data Fusion 2011, 2, 329–345. [Google Scholar] [CrossRef]
  80. Sang, L.; Zhang, C.; Yang, J.; Zhu, D.; Yun, W. Simulation of land use spatial pattern of towns and villages based on CA–Markov model. Math. Comput. Model. 2011, 54, 938–943. [Google Scholar] [CrossRef]
  81. Walawender, J.P.; Szymanowski, M.; Hajto, M.J.; Bokwa, A. Land surface temperature patterns in the urban agglomeration of Krakow (Poland) derived from Landsat-7/ETM+ data. Pure Appl. Geophys. 2014, 171, 913–940. [Google Scholar] [CrossRef] [Green Version]
  82. Yang, X.; Zheng, X.-Q.; Lv, L.-N. A spatiotemporal model of land use change based on ant colony optimization, Markov chain and cellular automata. Ecol. Model. 2012, 233, 11–19. [Google Scholar] [CrossRef]
  83. Dace, E.; Bazbauers, G.; Berzina, A.; Davidsen, P.I. System dynamics model for analyzing effects of eco-design policy on packaging waste management system. Resour. Conserv. Recycl. 2014, 87, 175–190. [Google Scholar] [CrossRef]
  84. Hereher, M.E.; Al-Awadhi, T.; Mansour, S.A. Assessment of the optimized sanitary landfill sites in Muscat, Oman. Egypt. J. Remote Sens. Space Sci. 2020, 23, 355–362. [Google Scholar] [CrossRef]
  85. Eghtesadifard, M.; Afkhami, P.; Bazyar, A. An integrated approach to the selection of municipal solid waste landfills through GIS, K-Means and multi-criteria decision analysis. Environ. Res. 2020, 185, 109348. [Google Scholar] [CrossRef] [PubMed]
  86. Al-Aomar, R. A combined ahp-entropy method for deriving subjective and objective criteria weights. Int. J. Ind. Eng. Theory Appl. Pr. 2010, 17, 12–24. [Google Scholar]
  87. Belton, V.; Gear, T. On a short-coming of Saaty’s method of analytic hierarchies. Omega 1983, 11, 228–230. [Google Scholar] [CrossRef]
  88. Dyer, J.S. Remarks on the analytic hierarchy process. Manag. Sci. 1990, 36, 249–258. [Google Scholar] [CrossRef]
  89. Harker, P.T.; Vargas, L.G. The theory of ratio scale estimation: Saaty’s analytic hierarchy process. Manag. Sci. 1987, 33, 1383–1403. [Google Scholar] [CrossRef]
  90. Triantaphyllou, E.; Mann, S.H. Using the analytic hierarchy process for decision making in engineering applications: Some challenges. Int. J. Ind. Eng. Appl. Pract. 1995, 2, 35–44. [Google Scholar]
  91. Shorabeh, S.N.; Varnaseri, A.; Firozjaei, M.K.; Nickravesh, F.; Samany, N.N. Spatial modeling of areas suitable for public libraries construction by integration of GIS and multi-attribute decision making: Case study Tehran, Iran. Libr. Inf. Sci. Res. 2020, 42, 101017. [Google Scholar] [CrossRef]
  92. Hamad, R.; Balzter, H.; Kolo, K. Predicting land use/land cover changes using a CA-Markov model under two different scenarios. Sustainability 2018, 10, 3421. [Google Scholar] [CrossRef] [Green Version]
  93. Liu, X.; Liang, X.; Li, X.; Xu, X.; Ou, J.; Chen, Y.; Li, S.; Wang, S.; Pei, F. A future land use simulation model (FLUS) for simulating multiple land use scenarios by coupling human and natural effects. Landsc. Urban Plan. 2017, 168, 94–116. [Google Scholar] [CrossRef]
  94. Fu, X.; Wang, X.; Yang, Y.J. Deriving suitability factors for CA-Markov land use simulation model based on local historical data. J. Environ. Manag. 2018, 206, 10–19. [Google Scholar] [CrossRef]
  95. Karimi Firozjaei, M.; Sedighi, A.; Jelokhani-Niaraki, M. An urban growth simulation model based on integration of local weights and decision risk values. Trans. GIS 2020, 24, 1695–1721. [Google Scholar] [CrossRef]
Figure 1. Location of the case study, (a) Khorasan Razavi Province in the northeast of Iran (raster format, Google Earth Imagery), (b) elevation of the Khorasan Razavi Province (raster format, SRTM), and (c) Mashhad city (Raster format, Landsat 8).
Remotesensing 13 00949 g001
Figure 2. An example of a waste landfill situation in Mashhad metropolis, (a) waste abandoned in the natural, (b) bird’s accumulation in landfill sites, and (c) leachate from landfills.
Remotesensing 13 00949 g002
Figure 3. Flowchart of the study.
Remotesensing 13 00949 g003
Figure 4. Fuzzification criteria map, (a) distance from villages, (b) distance from airports, (c) distance from the city, (d) distance from fault, (e) wind direction, (f) soil texture, (g) groundwater depth, (h) distance from roads, (i) slope, (j) landslide, (k) NDVI, (l) distance from rivers.
Remotesensing 13 00949 g004
Figure 5. (a) Intersect constraints maps, (b) area of suitable and unsuitable areas.
Remotesensing 13 00949 g005
Figure 6. Landfill suitability map of Mashhad metropolis.
Remotesensing 13 00949 g006
Figure 7. Urban growth in geographic directions, (a) 1990, (b) 2000, (c) 2010, (d) 2018, (e) 2048.
Remotesensing 13 00949 g007
Figure 8. Location of candidate sites and urban growth for 1990–2048.
Remotesensing 13 00949 g008
Table 1. Overview of landfill site selection studies.
ReferencesStudy AreaMCDA MethodCriteria WeightingAdvantages and Disadvantages of the Method
Tayyebi et al. [23]Zanjan, IranDempster–ShaferExpert interviewsAdvantages: uncertainty supported, no bias in decision-making.
Disadvantages: time-consuming, hard to convince decision-making.
Gorsevski et al. [24]Polog Region, MacedoniaAHP-OWAPairwise comparison of criteriaAdvantages: flexible, intuitive and checks inconsistencies, considers risk in decision-making.
Disadvantages: uncertainty—not supported, measurement error can cause significant problems.
Torabi-Kaveh et al. [20]Iranshahr, IranFAHPBased on the authors’ expertiseAdvantages: similar to human reasoning, high precision, based on the linguistic model.
Disadvantages: the lower speed and also longer run time of system, lack of real-time response, restricted number of usage of input variables.
Mir et al. [25]Selangor, MalaysiaTOPSIS and VIKORDirect assignments of criteria weights based on the common sense of the authorAdvantages: ability to use real and experimental data, works with fundamental rankings and makes full use of allocated information.
Disadvantages: since it uses Euclidian distances, it does not differentiate between negative and positive values, lacks consideration of interactions among criteria.
Rahmat et al. [26]Behbahan, IranAHPPairwise comparison of criteriaAdvantages: it is adaptable, intuitive and verifiable for inconsistencies, computationally non-demanding, deals with both quantitative and qualitative criteria.
Disadvantages: irregularities in the ranking, additive aggregation is used, more pairwise comparisons are needed, uncertainty—not supported.
Barakat et al. [2]Béni Mellal-Khouribga Region, MoroccoAHPPairwise comparison of criteriaAdvantages: it is adaptable, intuitive and verifiable for inconsistencies, computationally non-demanding, deals with both quantitative and qualitative criteria.
Disadvantages: irregularities in the ranking, additive aggregation is used, more pairwise comparisons are needed, uncertainty—not supported.
Ahmad et al. [27]Seberang Perai, MalaysiaFuzzy-OWANo explanation about who assigns weightsAdvantages: in addition to considering the weight of the criteria, it also considers the ordered weights, considers risk in decision-making, prepares different scenarios for decision-making.
Disadvantages: time-consuming, determining the type of ordered weights is complicated.
Santhosh and Sivakumar Babu [28]Bengaluru, IndiaDRASTIC method and AHPDirect assignments of criteria weightsAdvantages: scalability, simplicity, absolute efficiency cannot be measured.
Disadvantages: requires accurate inputs, uncertainty not supported, time-consuming.
Aksoy and San [29]Antalya, TurkeyAHP-WLCPairwise comparison of criteriaAdvantages: scalability, simplicity.
Disadvantages: uncertainty not supported.
Feyzi et al. [30]Anzali, IranFANPPairwise comparison of criteriaAdvantages: uncertainty supported, independence among elements is not required, the prediction is accurate because priorities are improved by feedback.
Disadvantages: time-consuming, hard to convince decision-making.
Kamdar et al. [31]Songkhla, ThailandAHPExpert interviewsAdvantages: it is adaptable, intuitive and verifiable for inconsistencies, computationally non-demanding, deals with both quantitative and qualitative criteria.
Disadvantages: irregularities in the ranking, additive aggregation is used, more pairwise comparisons are needed, uncertainty—not supported.
Rahimi et al. [32]Mahallat, IranFuzzy-BWMBased on the authors’ expertiseAdvantages: only integers are used, making it much easier to use, uncertainty supported, requires fewer Pairwise comparisons.
Disadvantages: time-consuming, Large problems can be demanding.
Table 2. The characteristics of raster and vector data used in the research.
DatasetSatellite (Sensor)FormatDateResolution and ScaleSource
Satellite imagesLandsat TM5Raster199030https://earthexplorer.usgs.gov/ (accessed on 2 October 2020)
Satellite imagesLandsat ETM7Raster200030https://earthexplorer.usgs.gov/ (accessed on 2 October 2020)
Satellite imagesLandsat TM5Raster201030https://earthexplorer.usgs.gov/ (accessed on 2 October 2020)
Satellite imagesLandsat OLI8Raster201830https://earthexplorer.usgs.gov/ (accessed on 2 October 2020)
Groundwater depth-Excel, X, Y Coordinates2018-https://www.wrm.i (accessed on 2 October 2020)
Rivers-Vector20181:25,000http://www.frw.org.ir (accessed on 2 October 2020)
Soil type-Vector20181:50,000http://www.frw.org.ir (accessed on 2 October 2020)
Geological faults-Vector20181:25,000http://www.gsi.ir/en (accessed on 2 October 2020)
Wind directionSRTMRaster201830https://earthexplorer.usgs.gov/ (accessed on 2 October 2020)
NDVILandsat OLI8Raster201830https://earthexplorer.usgs.gov/ (accessed on 2 October 2020)
Landslide-Vector2018-http://www.frw.org.ir (accessed on 2 October 2020)
Airport-Vector2018-http://www.ncc.org.ir (accessed on 2 October 2020)
City and village-Vector2018-http://www.ncc.org.ir (accessed on 2 October 2020)
SlopeSRTMRaster201830https://earthexplorer.usgs.gov/ (accessed on 2 October 2020)
Roads-Vector20181:25,000https://www.mrud.ir (accessed on 2 October 2020)
Table 3. Classification of landfill map.
Suitable ClassClass Range
Very unsuitable T T m e a n 1.5 S T D
Unsuitable T m e a n 1.5 S T D < T T m e a n S T D
Moderate T m e a n S T D < T T m e a n + S T D
Suitable T m e a n + S T D > T T m e a n + 1.5 S T D
Very suitable T > T m e a n + 1.5 S T D
Note: T = the value of WLC per pixel; Tmean = the average value of WLC in the area; STD = standard deviation of WLC values in the area.
Table 4. Weight of criteria with fuzzy functions.
CriteriaWeightCRSub-CriteriaWeightCRFuzzy Function
Environmental0.750Groundwater depth0.170.006Linear—increasing
Distance from rivers0.12 Linear—increasing
Soil texture0.07 Linear—increasing
Distance from fault0.03 Linear—increasing
Landslide0.05 Linear—increasing
Distance from airport0.08 Linear—increasing
Distance from village0.14 Linear—increasing
Distance from city0.13 Linear—increasing
Wind direction0.1 Linear—increasing
NDVI0.11 Linear—decreasing
Economic0.25 Slope0.380.033Large and small
Distance from roads0.62 Large and small
Note: CR = consistency ratio.
Table 5. Feature of selected sites.
Site 4Site 3Site 2Site 1Criteria
90–11060–80>130>100Groundwater depth (m)
6500600020005000Distance from rivers (m)
AlluvialSaltyLatosolDesertSoil type
6000800015003000Distance from fault (m)
450042,00012,0008500Landslide (m)
35,00025,00036,00038,500Distance from airport (m)
4000900030,0006500Distance from city (m)
900500015002000Distance from village (m)
SouthNorthWestNorthwestWind direction
0.2–0.30.003–0.040.0006–0.0080.08–0.2NDVI
<20<9<12<6Slope (%)
4000150015004000Distance from roads (m)
Table 6. Area of urban growth in geographical directions (ha).
20482018201020001990
4226.041744.921294.021285.11825.84E
6325.022469.781643.671197.091037.61N
3507.752174.941764.541417.951216.44NE
28,54811,429.737176.965325.572288.25NW
3137.042081.251603.531051.74884.43S
7412.492017.816741296.541055.88SE
1355.13765.45676.26656.01643.86SW
7320.784279.773352.53124.352413.62W
Publisher’s Note: MDPI stays neutral with regard to jurisdictional claims in published maps and institutional affiliations.

