Abstract
Accurate solar radiation estimation is very important for solar energy systems and is a precondition of solar energy utilization. Due to the rapid development of new energy sources, the demand for surface solar radiation estimation and observation has grown. Due to the scarcity of surface radiation observations, high-precision remote sensing data are trying to fill this gap. In this paper, a global solar irradiance estimation method (in different months, seasons, and weather conditions), using data from the advanced geosynchronous radiation imager (AGRI) sensor onboard the FengYun-4A satellite with cloud index methodology (CSD-SI), was tested. It was found that the FengYun-4A satellite data could be used to calculate the clear sky index through the Heliosat-2 method. Combined with McClear, the global horizontal irradiance (GHI) and the direct normal irradiance (DNI) in northeast China could be accurately obtained. The estimated GHI accuracy under clear sky was slightly affected by the seasons and the normalized root mean square error (nRMSE) values (in four sites) were higher in summer and autumn (including all weather conditions). Compared to the estimated GHI, the estimated DNI was less accurate. It was found that the estimated DNI in October had the best performance. In the meantime, the nRMSE, the normalized mean absolute error (nMAE), and the normalized mean bias error (nMBE) of Zhangbei were 35.152%, 27.145%, and −8.283%, while for Chengde, they were 43.150%, 28.822%, and −13.017%, respectively. In addition, the estimated DNI at ground level was significantly higher than the actual observed value in autumn and winter. Considering that the error mainly came from the overestimation of McClear, a new DNI radiation algorithm during autumn and winter is proposed for northern China. After applying the new algorithm, the nRMSE decreased from 49.324% to 48.226% for Chengde and from 48.342% to 41.631% for Zhangbei. Similarly, the nMBE decreased from −32.351% to −18.823% for Zhangbei and from −26.211% to −9.107% for Chengde.
1. Introduction
The United Nations (UN) Sustainable Development Goals (SDGs) clearly indicate that access to affordable, reliable, sustainable, and modern energy should be ensured. There are encouraging signs that energy is becoming more sustainable and widely available. Among them, energy efficiency in power supply continues to improve, and renewable energy has made remarkable progress in electricity [1]. Solar energy is an important part of renewable energy and may become the most important source of energy for human development in the coming decades due to the lower cost of its associated equipment (such as solar panels).
In China, electricity is still an important pillar of the economy, with 75% of electricity still dependent on “dirty” coal as energy input [2]. According to China’s statistics in 2015, coal combustion accounted for a high proportion of NOx, carbon dioxide, and SO2 emissions [2,3]. Therefore, China announced an ambitious target of 20% non-fossil energy use by 2030. Solar energy is certainly a promising contributor and an important strategic technology to achieve these goals. The plan has sparked interest in bringing renewable energy systems into China’s power system. In 2019, although China’s newly installed photovoltaic grid-connected capacity declined again, as has been the case year-on-year, it still ranked first in the world in terms of new and accumulated photovoltaic grid-connected capacity [4]. However, there are still some obstacles to the development of photovoltaic industry, one of which is the lack of accurately prediction of the output power of photovoltaic grid-connected systems. The output power of a photovoltaic power station is larger, as are the output fluctuation and interval time. Therefore, there are great challenges to the management and coordination of the safe operation of large-scale photovoltaic grid connections. Additionally, accurate estimation of photovoltaic power can significantly reduce the risk of photovoltaic power station management and operation [5,6]. The first step in predicting photovoltaic power is to predict the solar irradiance received by the Earth’s surface. Among them, global horizontal irradiance (GHI) is applicable in PV (photovoltaic) systems and direct normal irradiance (DNI) is applicable in concentrated solar power plants (CSPs).
GHI and DNI information can generally be obtained by three different methods: ground observation, numerical simulation, and satellite remote sensing. Each method has its advantages and disadvantages. Ground observation can provide high-quality instrumentation and maintenance for baseline surface solar irradiance (SSI) data, but due to the small number of observation stations and uneven distribution, it has a limited guiding effect on the layout of photovoltaic power stations in large areas. Numerical models can generate continuous maps of radiation changes at regional and global scales, which are important for long-term climate monitoring, but the main drawback is the low accuracy of models in simulating cloud cover. Remote sensing data can capture the dynamic mobility of clouds, which provide a unique means to monitor and estimate SSI [7]. In recent years, a lot of satellite data have been used in solar photovoltaic research, such as GEO-13, Landsat series, and Meteosat Second Generation (MSG). However, for solar radiation estimation and photovoltaic research, each satellite and sensor have some limitations. The FengYun-4 satellite is the second generation of the geostationary orbit (GEO) quantitative remote sensing meteorological satellite, which adopts a three-axis stability control scheme. As a new generation of the geostationary orbit quantitative remote sensing meteorological satellite, FengYun-4 has achieved leapfrog development in function and performance. The number of radiation imaging channels of the FengYun-2G satellite has been increased from 5 to 14, covering the visible, short-wave, medium-wave, and long-wave infrared bands. FengYun satellites have proved their feasibility for radiation research in the Chinese region [8,9]. However, due to the limited number of observation stations, the annual change law of the estimated GHI and DNI has not been analyzed in detail, and there has been even less improvement of the estimated DNI.
The HelioClim project is an ambitious initiative of MINES Paris-Tech, launched in 1997, to increase knowledge about the SSI and to offer SSI values for instantaneous data of any longitude, latitude, or site on a global scale. HelioClim-4 is one of the latest computing schemes [10]. The HelioClim-4 database contains 15 min values of the global, direct, and diffuse components of the SSI with a daily update under creation in these Monitoring Atmosphere Composition and Climate (MACC) projects (http://www.soda-pro.com, accessed on 10 October 2020). However, this scheme has a high requirement for input parameters, and the data of the Chinese research area cannot be downloaded at present. Therefore, in this study, the Heliosat-2 model, which has been widely used by many researchers [8,11], was used to calculate atmospheric attenuation factors and the cloud index through the apparent albedo, the apparent albedo of the ground under clear sky conditions, and the apparent albedo of the brightest clouds.
In this paper, by using data from the advanced geosynchronous radiation imager (AGRI) sensor onboard the FY-4A (Fengyun-4A) satellite, combined with the cloud index methodology (CSD-SI) and the McClear data, the annual variation characteristics of the estimated GHI and DNI were analyzed in northern China, and the reasons for the variation were pointed out. Moreover, this paper developed a new algorithm to estimate the ground-level DNI in autumn and winter, and the applicability of the algorithm was verified.
2. Data and Methodology
2.1. Data
2.1.1. Ground Measurements
Ground data for verification were obtained from four meteorological observation stations in China, namely Zhangbei, Laoting, Hengshui, and Chengde. These sites are located in northern China, which is one of the most important photovoltaic power generation areas in China. These stations provided data of short-wave downward global radiation, direct radiation, and long-wave downward radiation in W/m2. Global horizontal irradiation (GHI) was measured using the FS-S6 solar radiation sensor, and direct normal irradiance (DNI) was recorded using the FS-D1 solar radiation sensor. The instruments are calibrated every two years, conforming to the first-class technical indicators of the ISO 9060:1990 and WMO standards. These stations provide high-precision ground-measured data of solar irradiance. The dataset used was from June 2018 to May 2019.
The temporal resolution of the ground data obtained from the four stations was 1 min, whereas the FengYun-4A satellite data had a temporal resolution ranging from 4 to 52 min. Therefore, the data corresponding to the observation point scanned by satellite remote sensing were selected from the observation data with a resolution of 1 min. At the same time, if the station had missing or rejected values for a constant six hours (or more than five default values for satellite images), the data within the day were discarded from the analysis. In addition, the satellite-derived surface albedo differs greatly from the actual values during rainy, snowy, and heavily polluted days. Hence, these days were also eliminated. Finally, the total amount of data verified in our study was, respectively, 15,656 for Zhangbei, 17,202 for Laoting, 19,581 for Hengshui, and 17,558 for Chengde. The data quantities for different weather conditions are also listed in Table 1.

Table 1.
The amount of data for different weather types at the four observation points.
The locations of the four stations in China are presented in Table 2, which were used for the validation of the estimated solar irradiance. Figure 1 shows the geographic information of the study area. These four observation stations are scattered in northern China. Among them, Chengde is in the northern area, Laoting is on the east coast, Zhangbei is in the western inland area, and Hengshui is in the south (Figure 1). These locations have different geological features, atmospheric conditions, and aerosol levels (due to the distribution of industry). Hence, the models’ performance was studied under varied atmospheric conditions.

Table 2.
Geographic information of the ground radiation stations.
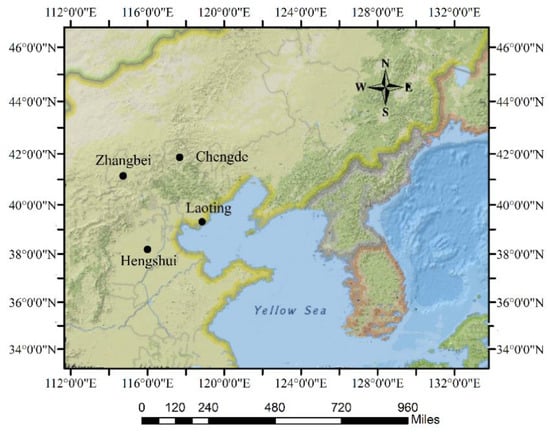
Figure 1.
The study region and the locations of the ground radiation stations.
2.1.2. FengYun-4 Geostationary Satellite
FengYun-4 is the exclusive second generation of the Chinese geostationary meteorological satellite to monitor the surface of the Earth and the atmosphere, which was successfully launched on 11 December 2016. The FengYun-4 stationary meteorological satellite is a large remote sensing platform with three-axis stable attitude control and carries a variety of payloads, including an advanced geosynchronous radiation imager (AGRI; 14 channels between 0.47 and 13.5 μm, with a spatial resolution of 0.5–4 km), an interferometric atmospheric vertical detector (GIIRS), a lightning imager (LMI), and a space environment monitoring instrument (SEP). The FengYun-4 scientific and experimental satellite provides 32 kinds of quantitative products, including cloud and atmospheric products, surface products, weather products, and radiation products, and plays a very important role in weather forecasting and climate estimation. In this work, the visible channel was used, where the spatial resolution was 1 × 1 km and the temporal resolution ranged from 4 to 52 min.
2.2. Methods
2.2.1. McClear Model
McClear is a new clear sky model that can exploit the MACC data source for estimating the downwelling shortwave direct and global irradiances received at ground level. Yang [12] compared several clear sky models and found that the McClear model is highly recommended for 1, 15, and 60 min resolution.
The McClear Clear Sky Irradiation service delivers time series of irradiation observed in a specific site in the world under clear skies, with a time step ranging from 1 min to 1 month. The global, direct, and diffuse horizontal irradiation, as well as the normal beam irradiance, can be download by entering the latitude, longitude, altitude, start and end time, time step, time reference, and output format on the SoDa web page. (http://www.soda-pro.com/web-services/radiation/cams-mcclear, accessed on 10 October 2020).
2.2.2. The Heliosat-2 Method
In recent years, the solar radiation attenuation model has been rapidly developed, among which the HelioClim-4 model is the latest. However, the method needs advanced products derived from geostationary satellites and recent Earth observation missions for the input of the Heliosat-4 method. Therefore, its applicability is restricted by region.
Herein, the Heliosat-2 method was adopted to calculate the attenuation model of solar radiation [13]. This model is often used to predict solar irradiance reaching the surface by calculating attenuation coefficients from satellite images [11,14,15]. The basic idea of this model is to convert the pixel image of a satellite observation into a pixel image of the cloud index, and then to multiply the cloud index with the solar exposure using the clear sky model, and finally to obtain the surface irradiance value of any position (pixel point).
is the result of comparing what the sensor sees to what should be seen on that pixel (if the sky is clear), which has to do with the “clarity” of the atmosphere. The calculation method of the atmospheric attenuation factor () is defined as follows [8]:
where is the clear sky index (dimensionless), and is the cloud index (unitless) at the instant time and pixel . Its value is obtained using Equation (2):
where is the apparent albedo (unitless) observed by a satellite sensor for time t (unitless), is the apparent albedo of the ground under clear sky conditions (unitless), and is the apparent albedo of the brightest clouds (unitless). The FY-4 satellite level 1 data provide a number that can be directly converted to apparent albedo in a calibration table. To obtain the albedo of the brightest cloud and the ground of each pixel, the histogram of all pixels of each month is constructed through statistical analysis. The 95th percentile of the monthly histogram is selected as the albedo of the brightest cloud, and the darkest pixel in the monthly time series is selected as the ground albedo.
The specific algorithm and implementation steps for predicting surface solar radiation by FY-4A are shown in Figure 2. The GHI can be estimated just by multiplying the clear sky index and global irradiation from McClear. The DNI estimation method shows it as flowing, which is based on the diffuse fraction model by Skartveit et al. [16].
where is the DNI under clear skies. When the clear sky index is smaller than 0.35, the DNI value is set to zero.
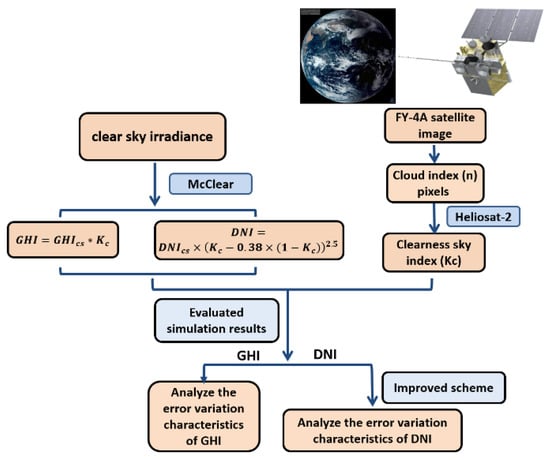
Figure 2.
Technical map for surface radiation estimation (global horizontal irradiance (GHI) and direct normal irradiance (DNI)) using the FY-4A satellite.
2.2.3. Statistical Index for Accuracy Evaluation
To better evaluate the applicability of the method for FY-4A in northern China, this paper selected the following common indicators to calculate the difference between the estimations and the observations.
The root mean square error (RMSE) is the mean of the square root of the error between the forecasted value and the measured value. This index is a quantitative weighting method. It is defined as:
where is the observed value and is the estimated value. The normalized root mean square error (nRMSE) is expressed as:
The mean absolute error (MAE) is another commonly used regression loss function. It is the sum of the absolute values of the difference between the target value and the estimated value and represents the average error range of the estimated value. It can be expressed as below:
The normalized mean absolute error (nMAE) is defined as:
The mean bias error (MBE) is similar to the MAE, except that this function does not use absolute values. It can determine whether the model has a positive deviation or a negative deviation.
The normalized mean bias error (nMBE) is defined as:
The Pearson correlation coefficient (R) is the quantity of linear correlations between the variables, which is defined as:
3. Results
3.1. The GHI Simulation Effect and Error Variation Characteristics
The weather conditions in this paper refer to clear sky (mean of CSI is 0.8 during the day), partly cloudy (mean of CSI is CSI during the day), and overcast (the mean of CSI is 0.35). The calculation method of CSI is:
where comes from the ground observations, and can be obtained from the McClear Clear Sky Irradiation service (introduced in Section 2.2.1)
The scatter diagrams of the measured and estimated values are presented in Figure 3 for Zhangbei, Laoting, Hengshui, and Chengde. The red and dark blue dots represent the high-density and low-density samples, respectively. They also represent the number of samples, the RMSE value, the correlation coefficient (R), and the 1:1 line (y = x).
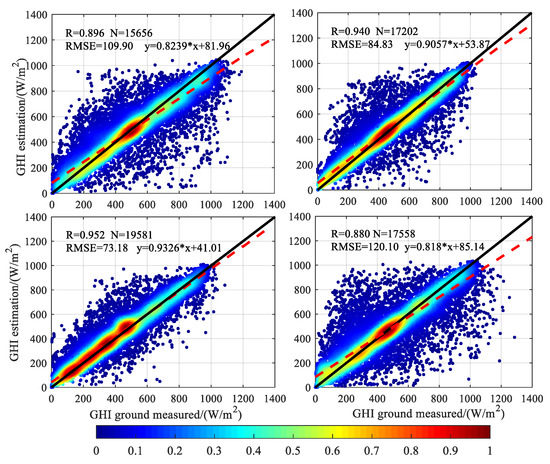
Figure 3.
Scatter diagrams of the measurements (horizontal axis) and estimates (vertical axis) of the GHI for Zhangbei, Laoting, Hengshui, and Chengde (the upper left, upper right, lower left, and lower right, respectively). The color represents the frequency of each pair. R, Pearson correlation coefficient; RMSE, root mean square error.
The mean GHI observation values of Chengde, Hengshui, Laoting, and Zhangbei were 462.265, 375.100, 456.427, and 500.478 W·m−2, respectively. The data in the manuscript are the values excluding rainy, snowy, and heavily polluted days, and the values range from 1 June 2018 to 31 May 2019. Due to the continuity of the data, the variation of estimated GHI under different seasons and different weather conditions could be reflected clearly.
Overall, all places tended to overestimate GHI when the amount of ground-observed data was low, while underestimating it when the amount of ground-observed data was relatively large. A bias deviation from the ideal linear fitting is clearly observable. The RMSE values at Zhangbei and Chengde were 109.9 and 120.1 W·m−2, respectively, which were significantly higher than those at Laoting and Hengshui, i.e., 84.83 and 73.18 W·m−2, respectively. For Laoting and Hengshui, all sky condition bias deviations were quite a lot lower than that in Zhangbei and Chengde, especially for the radiation ranges from 200 to 800 W·m−2.
Seasonal and cloud conditions had an important effect on the radiation estimation. According to [17], since the study area belongs to the plain area of eastern China without high mountains, there is little local variation in weather conditions and changes. As a result, though the GHI simulation effects of the four observation sites were different, the monthly variation trend was almost the same. Due to the complex and changeable weather system in summer, the value of nRMSE reached its maximum value in July at the four observation sites. Among them, the value of nRMSE in Chengde was the largest, while that in Hengshui was the smallest, i.e., 39.471% and 23.172%, respectively. Combined with Figure 4, it can be found that the estimated GHI results of Zhangbei and Chengde in January were the best, while those of Laoting and Hengshui in October were the best.
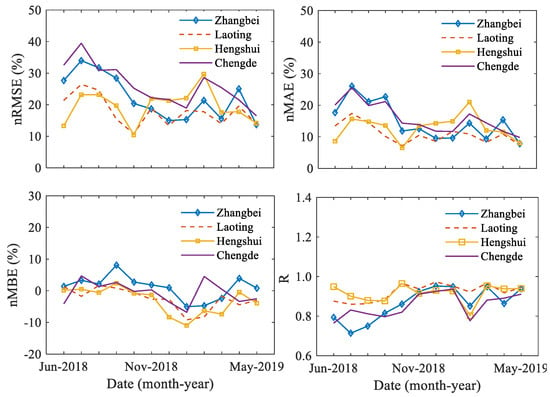
Figure 4.
Monthly trend chart of the estimated GHI. nRMSE, normalized RMSE; nMAE, normalized mean absolute error; nMBE, normalized mean bias error.
At the same time, it can be seen from Figure 4 that the estimated results of GHI fluctuated significantly in January and February. Through the different weather condition data, the estimated GHI had little difference under clear skies during the two months. Under clear sky conditions in January and February, the nRMSE of Chengde was 11.523% and 33.975% and the nMBE was −2.928% and 0.893%, respectively. However, under cloudy conditions in January and February, the nRMSE of Chengde increased from 23.865% to 41.153%, and the nMBE increased from −10.341% to 7.822%. The variation trend of Zhangbei’s estimated results was similar to that of Chengde. At the same time, the proportion of cloudy condition days in February was significantly higher than that in January. This indicates that the aerosol optical depth has little influence on the estimated GHI in different months, while the cloud optical depth has a greater influence on the estimated GHI. The improvement of the scheme should be further explored in future research. The following part of the paper combines different weather conditions and seasonal variation trends to analyze the seasonal variation trend and its reasons in detail.
RMSE is related to the average of each season. It is difficult to compare the accuracy of the model in different seasons by just using the RMSE, MAE, or MBE. Therefore, our study also used nRMSE, nMAE, nMBE, and R to analyze the performance of the model. Figure 5 shows the nRMSE, nMAE, nMBE, and R values of the forecasting models for the GHI during whole year (from summer 2018 to spring 2019) at the four observation sites.
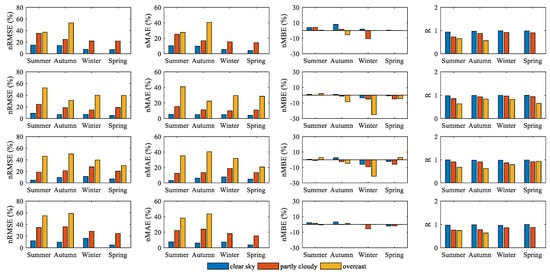
Figure 5.
The variation of estimated GHI under different seasons and different weather conditions (top row: Zhangbei; second row: Laoting; third row: Hengshui; bottom row: Chengde).
From the estimated GHI under different weather conditions in Figure 5, it can be found that clear skies are less affected by the seasons and show the best performance. The annual nRMSE values at the four sites ranged from 4.914% to 16.230%. In addition, the nMAE value of clear skies ranged from 3.670% to 10.373%, and the value of the correlation coefficient R was also stable between 0.953 and 0.993 during the four seasons. The estimated radiation on overcast days was significantly worse than that on clear sky and partly cloudy days. Meanwhile, the correlation between the observed and estimated values on cloudy days was also low.
In general, the estimated radiation under cloudy conditions (including partly cloudy and overcast conditions) was worse than under clear sky conditions. On the one hand, this is because different cloud types have different cloud microphysical properties, including cloud optical thickness, cloud equivalent temperature, ice water column content in the cloud, ice particle equivalent radius, etc. [18]. On the other hand, this is closely related to the spatial characteristics of satellite-derived irradiance and the representative limitations of ground measures [19]. Due to cloud movement and projection, there will be obvious differences between the observed and estimated values.
The seasonal variation for the estimated error also varied. Combined with Figure 4 and the third column of Figure 5, it can be found that the estimations for sunny and cloudy days underestimated the ground radiation in spring and summer (nMBE values were generally positive). However, in winter and spring, the estimated results of the GHI showed a significant negative deviation. The mean nMBE of the GHI was −5.122% for the four observation sites. Comparing the three weather conditions, the overestimation of surface radiation on cloudy days (including partly cloudy and overcast days) was more obvious.
3.2. The DNI Simulation Effect and Error Variation Characteristics
Among the four observation stations, only Zhangbei and Chengde observed direct radiation data, and the following analysis is based on the data collected by the two observatories sites. The mean DNI observation values of Chengde and Zhangbei were 468.106 and 460.884 W·m−2, respectively.
Comparing Figure 4 and Figure 6, it can be found that the estimated DNI also shows a yearly trend. It demonstrated that the estimated DNI in October 2018 showed the best performance all year round. The nRMSE, nMAE, and nMBE values of Zhangbei were 35.152%, 27.145%, and −8.283%, respectively; meanwhile, the nRMSE, nMAE, and nMBE of Chengde were 43.150%, 28.822%, and −13.017%, respectively. However, in autumn and winter, the estimated DNI value was significantly higher than the observed value, as shown in the nMBE values. This indicates that the estimated DNI values in January 2019 had the maximum negative deviation, among which the nMBE values of Zhangbei and Chengde were −43.899% and −41.714%, respectively.
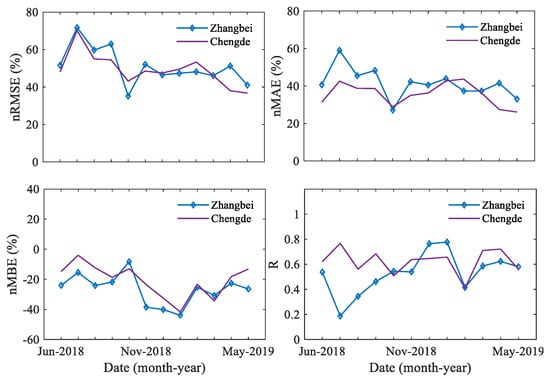
Figure 6.
Monthly trend chart of the estimated DNI.
Although, the estimated DNI was also affected by the climate conditions and underlying surface. Combining Figure 5 and Figure 7, it can be found that there was no close correlation between the estimated results of the GHI and the DNI. As can be seen from the above analysis, the estimated GHI in Zhangbei was better than that in Chengde. However, as shown in Figure 7, the estimated DNI in Chengde was generally better than that in Zhangbei. Since the estimation of radiation under clear sky conditions was relatively stable, these days could be used to evaluate results of the two places. Among them, the nRMSE value of the DNI varied from 33.054% to 42.294% under clear sky in Zhangbei. The nRMSE value of the DNI varied from 22.813% to 38.808% under clear skies in Chengde. In addition, the correlation coefficient variation range of the DNI simulation and observed data in Chengde varied from 0.673 to 0.888, which was significantly higher than that in Zhangbei.
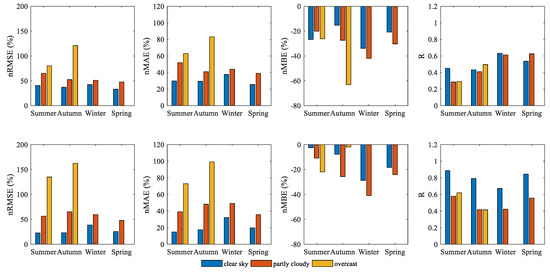
Figure 7.
The variation of estimated DNI under different seasons and different weather conditions (top row: Zhangbei; bottom grow: Chengde).
Overall, compared with the GHI, the estimated DNI showed obvious negative deviation, especially during autumn and winter. In winter, the nRMSE value was the highest, i.e., 42.294% in Zhangbei and 38.808% in Chengde. Meanwhile, the nMBE values in Zhangbei and Chengde were −33.856% and −28.702%, respectively. The reasons for the errors and the method for improving the estimated DNI effect are shown in the following analyses.
By comparing the observed and the estimated data, it can be found that the error of the DNI mainly came from two sources. First, the observed DNI value changed significantly before and after sunrise (sunset), while the estimated value only changed slightly. However, this part of the error is not easy to correct because it is affected by many factors. Second, from September 2018 to February 2019, the estimated DNI data at noon were significantly higher than the observed values. According to the analysis of the calculated variables, these errors were caused by the inaccurate setting of winter aerosol and other parameters in McClear. Therefore, in the following analyses, the relationship between the observed and estimated data were used to establish a set of correction models for autumn and winter (from September to February). This allowed us to build a foundation for estimating the DNI changes and for further photovoltaic estimation research.
In this study, the observed and estimated data from September 2018 to February 2019 were used to fit the most suitable algorithm with MATLAB software, and the algorithm passed the significance test of 0.05. Referring to the variation rule of the surface observation data, the final DNI estimation equation in autumn and winter is as follows:
where can be calculated through Equations (1)–(3).
A comparison between the original and improved estimated DNI values for five consecutive days is shown in Figure 8 and the results are shown in Table 3. The original estimated DNI had a high overall bias deviation, and the nMBE values were −26.211 and −32.351 for Chengde and Zhangbei. The average nRMSE was over 48%. High nMAE values were also shown across different sites, ranging from 37.547 to 39.984. It can be found in Figure 8 that the improved algorithm can reflect the changes of solar radiation more accurately, especially at noon. Moreover, the improved algorithm has smaller negative biases across all sites (negative and less than 19% in absolute magnitude). Compared to the original simulation, the RMSE decreased from 314.901 to 249.956 W·m−2 for Chengde and from 303.658 to 217.921 W·m−2 for Zhangbei. The nRMSE decreased from 49.324% to 48.226% for Chengde and from 48.342% to 41.631% for Zhangbei. Similarly, the deviation of nMBE and nMAE decreased.
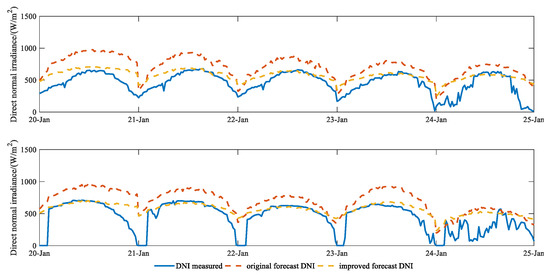
Figure 8.
The improved results of the DNI under all sky conditions for 108 continuous samples of the test set (top: Chengde; bottom: Zhangbei).

Table 3.
DNI correction effect analysis from September to May of the second year (W/m2 for the RMSE, MAE, MBE, and mean value).
Overall, the improved algorithm represents a significant improvement in the accuracy of DNI estimation for this region, with respect to the original method. Among the improvements, the effect of the DNI in Zhangbei showed better improvement, whose nRMSE decreased from 48.342% to 41.631%. In general, without the help of other observation means, the improved estimated DNI method in autumn and winter (from September 2018 to February 2019) was simple and efficient. However, this algorithm requires more observation points for verification. As a result, the best method of DNI radiation simulation in China can be obtained.
4. Discussion
In this study, statistical indicators such as nRMSE, nMAE, nMBE, and R, which are widely used in the field of estimation, were selected to evaluate the accuracy of the estimated results. However, the indicative role of these indicators depends on several major influencing factors, such as the percentage of clear days per month, the month for comparison, and the limitations of these indicators [20,21]. Although these indicators could be used to comprehensively evaluate the estimation error, they might also mislead the research due to the above defects. In addition, the difference in sample size would affect the results of the study on the annual variation of the estimation error of different weather types. For example, in winter and spring, the number of overcast days in Zhangbei and Chengde is one each (the total number of data is 63). However, the small amount of data makes the estimated results highly contingent, and it does not represent the estimated results of overcast conditions for the winter or spring. Therefore, this situation should be fully considered in the analysis.
Studies have shown that changes in DNI are very sensitive under partly cloudy and overcast conditions. In addition, the radiation algorithm may produce errors such as the inability to recognize weather types [22]. These problems also exist in climate model calculations, such as estimating solar radiation from satellite data. At the same time, it can be found that clouds and aerosols increase the uncertainty of radiation flux estimation. These characteristics are also shown in Figure 5 and Figure 7. Due to the uncertainty mentioned above, the University of Geneva benchmark [23] shows a relative RMSE deviation of 15–70% for GHI and 30–160% for DNI based on geographical conditions. The error range of the DNI in our study was within this range and the RMSE value was smaller, which indicated that FengYun-4 has a good estimation result on the DNI, and that the result is likely to be further improved.
5. Conclusions
Different weather conditions and seasonal variations can affect the estimation of solar radiation at the surface. Due to the limitations of observation data and the distribution of observation sites, the estimation of the GHI and DNI in China under different seasons and weather conditions has not been systematically studied. In this work, the global solar irradiance predicting method, which combines the cloud index methodology (CSD-SI) and McClear, was tested on the FY-4A satellite data. Validation was carried out against the ground measurements in Zhangbei, Laoting, Hengshui, and Chengde.
This study found that Heliosat-2 and the cloud index algorithm combined with McClear data applied to the FengYun-4 satellite could easily and effectively estimate the variation of ground radiation. However, with the change of weather conditions, months, and seasons, the estimated results of different observation points also changed.
Among them, the accuracy of the GHI estimation under clear sky conditions was slightly affected by the seasons (Figure 4). However, the GHI value under partly cloudy (or overcast) conditions could not be accurately estimated in summer and autumn. In winter, the estimation of GHI performed well, but the value was slightly lower than the observed values at all four stations.
In general, the estimated error of the DNI was significantly higher than that of the GHI, which was also proven by Beyer et al. [23]. In the annual variation of the estimated DNI, it was found that the estimated result was best in October. The nRMSE, nMAE, and nMBE of Zhangbei were 35.152%, 27.145%, and −8.283%, respectively. Meanwhile, the nRMSE, nMAE, and nMBE of Chengde were 43.150%, 28.822%, and −13.017%, respectively. In addition, it was found that there was no close correlation between the estimated results of the GHI and DNI. Compared to the GHI, the DNI estimation showed obvious negative deviation, especially during autumn and winter. These errors may have been caused by the inaccurate setting of the winter aerosol and other parameters in McClear. Therefore, our study used the observed and estimated DNI data (in autumn and winter) to develop a new DNI estimation algorithm for autumn and winter in northern China. The improved algorithm showed a significant improvement in the accuracy of DNI estimation for this region, with the RMSE decreasing from 314.901 to 249.956 W·m−2 for Chengde and from 303.658 to 217.921 W·m−2 for Zhangbei. Similarly, the nMBE decreased from −32.351% to −18.823% for Zhangbei and from −26.211% to −9.107% for Chengde.
According to the above analysis, the estimated GHI under clear skies was good throughout the year, which indicates that the estimation of the aerosol optical depth in the McClear model is accurate. However, in cloudy months, such as January, the cloud optical depth affects the estimated results of total surface radiation. This is closely related to the type of cloud that is not resolved in the Helisat-2 model. In the Helisat-2 model, the influence of different clouds on the surface radiation is reflected through the atmospheric attenuation factor. However, there are many semi-empirical parameters in this formula that are affected by local meteorological conditions. In this study, we only used empirical parameters. In future studies, the parameters should be calculated according to the actual situation of each region. In recent years, many other models have explored the theoretical aspects of clouds to alleviate the limitations of local meteorological factors on theoretical models. For example, Ma and Pinker [24] adopted the Updated Inference Scheme (V3.3.3) in their study and showed a better effect, which improved the treatment of water and ice clouds in their study. Kim et al. [25] employed the physical radiative transfer model itself to show the generality of solar irradiance over the Korean Peninsula. The classification of cloud type was performed using the cloud top pressure (CTP) and the shortwave TOA (top of the atmosphere) in the study. All the above studies better describe the influence of cloudy conditions on surface radiation. This is of great significance for further study on improving the estimation of surface radiation in China.
McClear is a widely employed model and is used by SoDa services for solar radiation estimations in Europe, Africa, and South America; our study also proved its applicability in China. However, it needed correction during the autumn and winter, especially for DNI estimation. At the same time, the data of FengYun-4 proved to be suitable for radiation simulation research. However, it was not effective for the prediction of the change of radiation under partly cloudy (or overcast) conditions in summer. Therefore, the algorithm of the cloud index and cloud type identification applicable to the FengYun-4 satellite data under complicated weather conditions should be explored in the future.
Author Contributions
Data curation, Y.G. and H.G.; funding acquisition, D.J. and L.Y., methodology, P.W. and H.G.; supervision, M.L. writing—original draft, D.J.; writing—review and editing, J.H., L.W., and L.Y. All authors have read and agreed to the published version of the manuscript.
Funding
This work was financially supported by the National Natural Science Foundation of China (41805085), the Science and Technology Project of Gansu Province (20JR5RA544), and the Doctoral Research Fund of Lanzhou City University (Grant LZCU-BS2019-13).
Data Availability Statement
The data presented in this study are available on request from the corresponding author. The data are not publicly available due to the rules of the Chinese Meteorological Administration on the Management of Meteorological Observation Data.
Acknowledgments
The authors would like to thank the National Meteorological Information Center for providing free access to the FY-4A satellite images. The authors would also like to thank the Editors and Reviewers of the Remote Sensing journal for their valuable comments.
Conflicts of Interest
The authors declare no conflict of interest.
References
- Buonocore, J.J.; Choma, E.; Villavicencio, A.H.; Spengler, J.D.; Koehler, D.A.; Evans, J.S.; Lelieveld, J.; Klop, P.; Sanchez-Pina, R. Correction: Metrics for the sustainable development goals: Renewable energy and transportation. Palgrave Commun. 2019, 5. [Google Scholar] [CrossRef]
- Bi, G.-b.; Shao, Y.; Song, W.; Yang, F.; Luo, Y. A performance evaluation of China’s coal-fired power generation with pollutant mitigation options. J. Clean. Prod. 2018, 171, 867–876. [Google Scholar] [CrossRef]
- Yang, Y.; Campana, P.E.; Yan, J. Potential of unsubsidized distributed solar PV to replace coal-fired power plants, and profits classification in Chinese cities. Renew. Sustain. Energy Rev. 2020, 131. [Google Scholar] [CrossRef]
- Jiang, H.; Jin, Y.; Ye, X.; Qiang, Y.; Li, J.; Han, P. Review of China’s PV industry in 2019 and prospect in 2020. Solar Energy 2020, 3, 14–23. [Google Scholar]
- Yang, L.; Gao, X.; Hua, J.; Wu, P.; Li, Z.; Jia, D. Very Short-Term Surface Solar Irradiance Forecasting Based On FengYun-4 Geostationary Satellite. Sensors 2020, 20, 2606. [Google Scholar] [CrossRef]
- Yang, D.Z.; Kleissl, J.; Gueymard, C.A.; Pedro, H.T.C.; Coimbra, C.F.M. History and trends in solar irradiance and PV power forecasting: A preliminary assessment and review using text mining. Solar Energy 2018, 168, 60–101. [Google Scholar] [CrossRef]
- Huang, G.H.; Li, Z.Q.; Li, X.; Liang, S.L.; Yang, K.; Wang, D.D.; Zhang, Y. Estimating surface solar irradiance from satellites: Past, present, and future perspectives. Remote Sens. Environ. 2019, 233. [Google Scholar] [CrossRef]
- Yang, L.W.; Gao, X.Q.; Li, Z.C.; Jia, D.Y.; Jiang, J.X. Nowcasting of Surface Solar Irradiance Using FengYun-4 Satellite Observations over China. Remote Sens. 2019, 11, 1984. [Google Scholar] [CrossRef]
- Chen, X.M.; Li, Y.; Wang, R.Z. Performance study of affine transformation and the advanced clear-sky model to improve intra-day solar forecasts. J. Renew. Sustain. Energy 2020, 12, 043703. [Google Scholar] [CrossRef]
- Qu, Z.; Gschwind, B.; Lefevre, M.; Wald, L. Improving HelioClim-3 estimates of surface solar irradiance using the McClear clear-sky model and recent advances in atmosphere composition. Atmos. Meas. Tech. 2014, 7, 3927–3933. [Google Scholar] [CrossRef]
- Diallo, M.; Albarelo, T.; Primerose, A.; Linguet, L. Improving the Heliosat-2 method for surface solar irradiation estimation under cloudy sky areas. Solar Energy 2018, 169, 565–576. [Google Scholar]
- Yang, D. Choice of clear-sky model in solar forecasting. J. Renew. Sustain. Energy 2020, 12. [Google Scholar] [CrossRef]
- Rigollier, C.; Lefevre, M.; Wald, L. The method Heliosat-2 for deriving shortwave solar radiation from satellite images. Solar Energy 2004, 77, 159–169. [Google Scholar] [CrossRef]
- Arbizu-Barrena, C.; Ruiz-Arias, J.A.; Rodriguez-Benitez, F.J.; Pozo-Vazquez, D.; Tovar-Pescador, J. Short-term solar radiation forecasting by advecting and diffusing MSG cloud index. Solar Energy 2017, 155, 1092–1103. [Google Scholar] [CrossRef]
- Alonso-Montesinos, J.; Batlles, F.J.; Bosch, J.L. Beam, diffuse and global solar irradiance estimation with satellite imagery. Energy Convers. Manag. 2015, 105, 1205–1212. [Google Scholar] [CrossRef]
- Skartveit, A.; Olesth, J.A.; Tuft, M.E. An hourly diffuse fraction model with correction for variability and surface albedo. Solar Energy 1998, 63, 173–183. [Google Scholar] [CrossRef]
- Wu, W.; Wang, S. Four season distribution of cloud and its correlation with precipitation in Northern China. J. Lanzhou Univ. (Nat. Sci.) 2010, 46, 32–40. [Google Scholar] [CrossRef]
- Letu, H.; Yang, K.; Nakajima, T.Y.; Ishimoto, H.; Nagao, T.M.; Riedi, J.; Baran, A.J.; Ma, R.; Wang, T.X.; Shang, H.Z.; et al. High-resolution retrieval of cloud microphysical properties and surface solar radiation using Himawari-8/AHI next-generation geostationary satellite. Remote Sens. Environ. 2020, 239, 111583. [Google Scholar] [CrossRef]
- Barker, H.W.; Li, Z. Interpreting shortwave albedo-transmittance plots: True or apparent anomalous absorption? Geophys. Res. Lett. 1997, 24, 2023–2026. [Google Scholar] [CrossRef]
- Masoom, A.; Kosmopoulos, P.; Bansal, A.; Kazadzis, S. Solar Energy Estimations in India Using Remote Sensing Technologies and Validation with Sun Photometers in Urban Areas. Remote Sens. 2020, 12, 254. [Google Scholar] [CrossRef]
- Valiance, L.; Charbonnier, B.; Paul, N.; Dubost, S.; Blanc, P. Towards a standardized procedure to assess solar forecast accuracy: A new ramp and time alignment metric. Solar Energy 2017, 150, 408–422. [Google Scholar] [CrossRef]
- Ellingson, R.G.; Fouquart, Y. The Intercomparison of Radiation Codes in Climate Models: An Overview. J. Geophys. Res. 1991, 96, 8925. [Google Scholar] [CrossRef]
- Beyer, H.G.; Martinez, J.P.; Suri, M.T.J.L.; Lorenz, E.; Müller, S.C.; Hoyer-Klick, C.; Ineichen, P. Report on Benchmarking of Radiation Products. Management and Exploitation of Solar Resource Knowledge. Manag. Exploit. Solar Resour. Knowl. 2009. Available online: http://www.mesor.org/docs/MESoR_Benchmarking_of_radiation_products.pdf (accessed on 6 November 2019).
- Kim, C.K.; Kim, H.G.; Kang, Y.H.; Yun, C.Y.; Lee, Y.G. Intercomparison of Satellite-Derived Solar Irradiance from the GEO-KOMSAT-2A and HIMAWARI-8/9 Satellites by the Evaluation with Ground Observations. Remote Sens. 2020, 12, 2149. [Google Scholar] [CrossRef]
- Ma, Y.; Pinker, R.T. Modeling shortwave radiative fluxes from satellites. J. Geophys. Res. Space Phys. 2012, 117. [Google Scholar] [CrossRef]
Publisher’s Note: MDPI stays neutral with regard to jurisdictional claims in published maps and institutional affiliations. |
© 2021 by the authors. Licensee MDPI, Basel, Switzerland. This article is an open access article distributed under the terms and conditions of the Creative Commons Attribution (CC BY) license (http://creativecommons.org/licenses/by/4.0/).