Abstract
Snow depth distribution in the Qinghai-Tibetan plateau is important for atmospheric circulation and surface water resources. In-situ observations at meteorological stations and remote observation by passive microwave remote sensing technique are two main approaches for monitoring snow depth at regional or global levels. However, the meteorological stations are often scarce and unevenly distributed in mountainous regions because of inaccessibility, so are the in-situ snow depth measurements. Passive microwave remote sensing data can alleviate the unevenness issue, but accuracy and spatial (e.g., 25 km) and temporal resolutions are low; spatial heterogeneity in snow depth is thus hard to capture. On the other hand, optical sensors such as moderate resolution imaging spectroradiometer (MODIS) onboard Terra and Aqua satellites can monitor snow at moderate spatial resolution (1 km) and high temporal resolution (daily) but only snow area extent, not snow depth. Fusing passive microwave snow depth data with optical snow area extent data provides an unprecedented opportunity for generating snow depth data at moderate spatial resolution and high temporal resolution. In this article, a linear multivariate snow depth reconstruction (LMSDR) model was developed by fusing multisource snow depth data, optical snow area extent data, and environmental factors (e.g., spatial distribution, terrain features, and snow cover characteristics), to reconstruct daily snow depth data at moderate resolution (1 km) for 16 consecutive hydrological years, taking Qinghai-Tibetan Plateau (QTP) as a case study. We found that snow cover day (SCD) and environmental factors such as longitude, latitude, slope, surface roughness, and surface fluctuation have a significant impact on the variations of snow depth over the QTP. Relatively high accuracy (root mean square error (RMSE) = 2.26 cm) was observed in the reconstructed snow depth when compared with in-situ data. Compared with the passive microwave remote sensing snow depth product, constructing a nonlinear snow depletion curve product with an empirical formula and fusion snow depth product, the LMSDR model (RMSE = 2.28 cm, R2 = 0.63) demonstrated a significant improvement in accuracy of snow depth reconstruction. The overall spatial accuracy of the reconstructed snow depth was 92%. Compared with in-situ observations, the LMSDR product performed well regarding different snow depth intervals, land use, elevation intervals, slope intervals, and SCD and performed best, especially when the snow depth was less than 3 cm. At the same time, a long-time snow depth series reconstructed based on the LMSDR model reflected interannual variations of snow depth well over the QTP.
1. Introduction
As an important constituent of the cryosphere and an indispensable variable used in hydrological science research, snow cover has a significant impact on global climate change and the hydrological cycle [1]. The relatively high levels of albedo and thermal insulation of snow cover directly affect the energy exchange between the atmosphere and the earth surface [1,2]. In the global hydrological cycle, snow accumulation and melting contribute greatly to water resource redistribution. It also provides the most important resources of freshwater in arid and semi-arid regions [3,4]. As the basic physical characteristics of snowpacks, snow depth is broadly applied in climatic and hydrological simulations [5,6,7]. Meanwhile, snow depth plays an important role in weather forecast [8], snowmelt runoff simulation [1], and drought and flood prediction [9,10]. Since the Qinghai-Tibetan Plateau (QTP) forms the target port of the space in Asia, its massive distribution of ice and snow considerably impact the ecosystem of the region and those of Asia and the Northern Hemisphere [11]. As a major open water storage in cold regions, snow cover buildup and decay are closely related to the hydrological cycle [12], the atmosphere-land interaction [13], the green-up date of vegetation in QTP [14], and even the frequency of summer monsoon in East Asian and heatwaves in northern China [15,16,17,18]. Knowledge of snow depth is essential to obtain accurate spatio-temporal variations of snow water equivalent for management of water resources and understanding plateau climate change.
Although real-time snow depth data obtained at conventional meteorological stations and automatic stations make it possible to investigate long-time series snow depth variations [19,20], in-situ measurements reflect merely snow depth variations in a limited geographical area. Besides, meteorological stations in QTP were located primarily in its eastern and low elevation areas; their applications in hydrology are thus limited [21]. However, remote sensing technologies provide long-time series measurements of snow on large scales [22,23,24]. In the visible and near-infrared (VNIR) spectral regions, satellite sensors such as the moderate resolution imaging spectroradiometer (MODIS), advanced very high-resolution radiometer (AVHRR), sentinel-2, etc. can obtain snow cover extent and snow cover fraction (SCF) with relatively high spatial resolution [25,26,27]. Snow cover extent products have been widely applied to hydrological models for streamflow forecast in many catchments in the world [28,29,30,31,32]. However, optical sensors only measure snow coverage but not snow depth; also, they are susceptible to cloud interference. Cloud and snow have similar spectral signatures in VNIR, leading to misclassification between snow cover and cloud [33,34]. Passive microwave sensors such as SMMR (scanning multichannel microwave radiometer), SSM/I (special sensor microwave/imager), SSMI/S (special sensor microwave imager/sounder), and AMSR2 (advanced microwave scanning radiometer 2) were based on the difference between the depth and shallow of snow cover and the microwave brightness temperature. The snow depth can be inferred by the brightness-temperature difference of GHz 18–37 [35,36,37] have the capacity to map snow depth on the global scale because microwaves can penetrate through cloud [38,39], but it is difficult to identify areas of shallow snow for their low spatial resolution and snow depth is often overestimated in arid and frigid areas [21].
Accuracy or temporal-spatial resolution is often limited for a single data set by a single technology. Reconstruction of accurate snow depth at high resolution by fusing multiple data sets developed through multiple remote sensing technologies becomes attractive. Assimilation of in-situ observations and snow depth data of remote sensing had proven to be effective in improving hydrological models and snow depth models [40,41]. Although the ensemble Kalman filter method (EnKF) is widely used for snow depth data assimilation, snow depth data obtained through EnKF has hardly been used effectively, given the few and uneven distribution of meteorological stations and large fluctuation in surface elevation [42,43]. Snow depth simulation based on the remotely sensed SCF data involves building a nonlinear snow depletion curve, which is hard to accomplish because of its high nonlinearity and spatial heterogeneity of QTP, the accuracy of the simulation is often compromised [44]. A downscaling algorithm of multiple data sources was developed based on passive microwave remote sensing data and optical remote sensing data [45]. New, improved snow depth downscaling methods have been developed and can generate good simulations of snow depth in Alaska, QTP, and northern China [24,46,47]. However, terrain features can affect surface spectral reflectance and scattering of microwave signals, leading to low accuracy in the microwave snow depth dataset; meanwhile, MODIS data are severely subject to cloud interference, leading to errors in the final snow depth product [21,47]. Snow depth downscaling modeling has been used in simulating snow depth variations in QTP with some success [48]. However, using a combination of multichannel brightness temperature data with surface information to estimate the spatial distribution of snow depth can either overestimate or underestimate snow cover extent to a certain degree.
On the other hand, environmental factors such as longitude, latitude, slope, surface roughness, and surface elevation fluctuation often affect snow accumulation at a specific location. The objective of this study is to develop a linear multivariate snow depth reconstruction (LMSDR) model, incorporating the fused snow depth from multiple remote sensed data sets, in-situ snow depth observations, and relevant environmental factors controlling snow accumulation at a specific location to reconstruct snow depth in QTP with high accuracy and high spatial resolution.
2. Study Area and Data Sources
2.1. Study Area
QTP is located in the west of China between 26°00′–39°47′ N and 73°19′–104°47′ E. It starts from the southern foot of the Himalayas in the south and ends at the northern side of Kunlun Mountains and Qilian Mountains in the north, with a span of about 1532 km. The distance from Pamir Plateau in the west to Hengduan Mountains in the east is about 2945 km. The QTP is high in the northwest and low in the southeast (Figure 1), with an average elevation of about 4000 m and an area of 2,620,100 km2. QTP is the highest and largest plateau in the world. The area features long and frigid winter and short and warm summer. There is a great diurnal temperature variation. The mean annual temperature ranges from −15 °C to 10 °C. Precipitation mainly occurs in May through September but is extremely spatially uneven [49,50]. Snow exists primarily from September to March the second year. Major rivers in QTP include the Yangtze River, the Yellow River, the Lantsang (Mekong) River, the Brahmaputra, the Ganges, and the Salween that all originate from the plateau. The QTP also has numerous lakes, snowpacks, and glaciers.
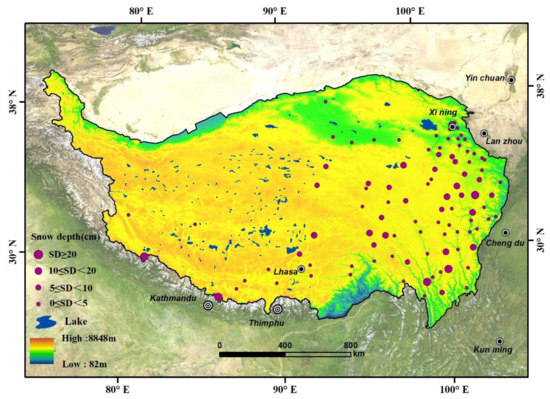
Figure 1.
Elevation and spatial distribution of meteorological stations over the Qinghai-Tibetan Plateau (QTP). In-situ snow depths were the annual mean values during the snow seasons from 2002 to 2018.
2.2. Long-Term Passive Microwave Snow Depth Dataset (PMSD)
The passive microwave snow depth dataset (PMSD) used for this study was developed by Che et al. [51,52,53] based on satellite passive microwave measurements and provided by the national Tibetan plateau data center (TPDC) (https://data.tpdc.ac.cn). The daily snow depth data has a 25 km spatial resolution. The raw data used in generating the PMSD data set were the daily passive microwave brightness temperature data from SMMR (1979–1987), SSM/I (1987–2007), and SSMI/S (2008–2018) archived by the US national snow and ice data center (NSIDC). The PMSD data set has been widely applied to climate change analysis, hydrological simulation, water resource management, vegetation variation, etc. [54,55,56]. In this study, we used the nearest-neighbor interpolation method for the raw data resampling [48,57]. Then through preprocessing such as projection transformation and cropping, the snow depth data with a 1 km spatial resolution were generated as inputs for snow depth reconstruction at high accuracy.
2.3. Cloud-Free MODIS-SCF
MODIS-SCF product with a 500 m spatial resolution derived from the MODIS daily cloud-free snow cover products over QTP (2002–2018) [58] was provided by the Sciences Data Bank (http://www.csdata.org/en/). Based on the normalized difference snow index (NDSI) derived from MODIS and shuttle radar topography mission (SRTM) data, a variety of cloud elimination algorithms were used to generate the cloud-reduced SCF (cloud cover < 10%). The dataset has been widely applied in studies of snow cover dynamics, climate change, hydrology/energy balance, and flood assessment in High Asia [59,60,61]. The snow depletion curve (SDC) was described by empirical formula between snow depth of in-situ observations and MODIS-SCF. The SDC over QTP (2002–2018) adopted in this study came from an exponential fitting model [47] (see Equation (1c)). At the same time, the snow cover day (SCD, the cumulative amount of the days with snow cover throughout the year is called snow cover days) of QTP was also obtained within the study period (2002–2018) based on the SCD extraction method [62].
2.4. In-Situ Snow Depth Observations
In-situ snow depth observations include those at conventional and automatic meteorological stations. In-situ data from conventional meteorological stations was provided by the national meteorological information center (http://data.cma.cn/site). Data included the date of observation, longitude, latitude, elevation, and snow depth (minimum value: 1 cm). In-situ data from the automatic meteorological stations were provided by TPDC (https://data.tpdc.ac.cn). Data included the date, snow depth, soil moisture, and land surface temperature [63]. The in-situ observations of 100 conventional meteorological stations in even hydrological years (2002.9.1~2003.3.31 to 2016.9.1~2017.3.31) were selected for snow depth model development. In-situ observations of the conventional meteorological stations in odd hydrological years (2003.9.1~2004.3.31 to 2017.9. 1~2018.3.31) and in-situ observations at 10 automatic meteorological stations in 2015.09.01–2016.03.31 were used for model validation.
2.5. Other Data Sources
To improve the accuracy of the snow depth reconstruction (SDR) model, other data sets used for model development include digital elevation model (DEM) data, land-use and land-cover change (LUCC), and soil particle size distribution data. National aeronautics and space administration (NASA) SRTM DEM at 90 m spatial resolution of version 4 (SRTM 90 m V4) [64] were processed to generate slope, aspect, surface roughness, and surface elevation fluctuation datasets. LUCC data provided by resource and environment science and data center (http://www.resdc.cn) include cultivated land, forest, grassland, waterbody, construction land, and unused land. These six types of LUCC have 25 subtypes. TPDC (https://data.tpdc.ac.cn) also provided soil particle size distribution data that was a multi-layer soil particle size distribution dataset developed based on 1:1,000,000 soil maps and 8595 soil profiles obtained during the second national soil survey of China [65,66]. The contents of sand and clay in the surface layer (0–30 cm) were used to evaluate the result of snow depth reconstruction.
3. Development of the LMSDR Model
Given the limitation of a single data source by a single remote sensing technology and the success of data fusion of multiple remote sensed data sets, we proposed developing a linear multivariate snow depth reconstruction (LMSDR) model to reconstruct snow depth in QTP at high accuracy and spatial resolution (1 km). The strategy for the model development was as follows: firstly, the algorithms of data fusion and downscaling were used to produce fused snow depth (FSD) data based on long-term passive microwave snow depth dataset (PMSD) and MODIS-SCF data. Secondly, the FSD was combined with in-situ observations to build a multifactor linear model to reconstruct snow depth data using relevant environmental factors such as longitude, latitude, slope, surface roughness, surface fluctuation, and SCD. Finally, the LMSDR model was used to simulate a long-time series of snow depth (2002–2018) in the QTP, and simulation accuracy was then evaluated.
3.1. Multisource Snow Depth Data Fusion
The algorithm of multisource data downscaling was adopted to downscale the PMSD product from a 25 km spatial resolution to 1 km. Three cases were considered: (1) when the value of a PMSD pixel (25 km × 25 km) was greater than 0, and at least one of its SCF sub-pixels (1 km × 1 km) had pixel values greater than 0 (SCFi > 0), the snow depth values of these sub-pixels were assigned based on the fusion-downscaling algorithm (see Equation (1a)); (2) when the value of a PMSD pixel was greater than 0, and all its SCF sub-pixels had a pixel value of 0 (SCFi = 0), the snow depth values of its sub-pixels were assigned to 0 (see Equation (1b); and (3) when the snow depth value of the PMSD pixel was 0, and at least one of the SCF sub-pixels had a value greater than 0 (SCFi > 0), the snow depth values of the sub-pixels were assigned according to the relationship between the perennial snow depth observations and SCF [47] (see Equation (1c)). These three cases were summarized in Equation (1)
where SCFi is the SCF value of the i-th SCF sub-pixel within a PMSD pixel; PMSD is the snow depth value of the PMSD pixel; FSDi is the fused (assigned) snow depth value for the i-th SCF sub-pixel; n is the total number of the sub-pixels within a co-registered PMSD pixel (here the value of n is 625 when 25 km is downscaled to 1 km).
3.2. Snow Depth Reconstruction (SDR) Model Development and Evaluation
We utilized 14,520 samples selected from eight even hydrological years of in-situ observations, snow cover characteristics, and environmental factors (e.g., spatial distribution, terrain features, etc.) to develop an SDR model. The tentative candidate models were as follows
where y is the in-situ observation at the meteorological stations; X1, X2, X3… Xi are snow characteristics and environmental factors; β1, β2, β3 … βi are the model coefficients corresponding to the factors; ui is the error. Equations (2)–(5) represent linear, logarithmic, power, and inverse models, respectively.
We utilized the 14,520 in-situ observations selected from eight even hydrological years for model construction. We evaluated the models using the sample leave-one-out cross-validation (LOOCV) method [67,68]. Firstly, one sample from the in-situ observations was chosen as the verification data, and the remaining samples were then used for model development. Secondly, the accuracy of the model was evaluated using the sample that was excluded in advance. This process was repeated for all data samples (14,520 in this case). Finally, the performance of all models (Equations (2)–(5)) was evaluated using the mean coefficient of determination (R2) and the root mean square error (RMSE). The best model was then selected.
Ground truth data used for model validation included 148,274 snow depth data from the 100 meteorological stations within the eight odd hydrological years and the 10 automatic meteorological stations for the period 2015–2016. The accuracy analysis for snow depth products of PMSD, SDC, FSD, and SDR was performed by evaluating model accuracy matrices such as RMSE, mean absolute error (MAE), positive mean error (PME), and negative mean error (NME) that are defined as below
where yi is the in-situ observation at meteorological stations; E (yi) is the i-th estimated snow depth value; is the mean observed value; n is the total number of surface observations; and p and r are samples with an observed value more and less than the estimated values, respectively. Figure 2 shows the procedure and methods used for the SD model development.
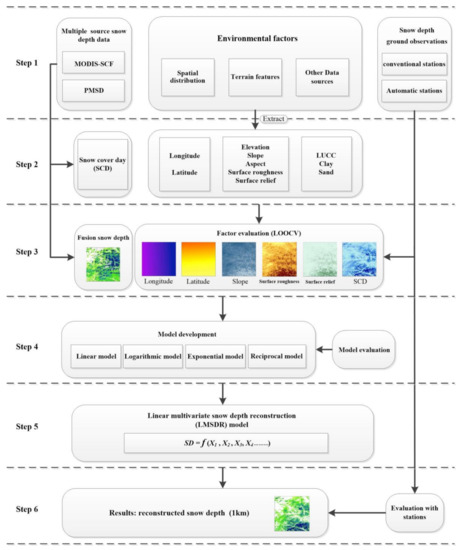
Figure 2.
Process and method of the reconstructed snow depth (RSD) model. MODIS: moderate resolution imaging spectroradiometer; SCF: snow cover fraction; LUCC: land-use and land-cover change; LOOCV: leave-one-out cross-validation; SD: snow depth.
4. Results
4.1. Selection of Environmental Factors
The selection of environmental factors that affect the multivariate SDR models is a very important step to optimize the model sensitivity. The LOOCV approach and linear regression method were used to evaluate factors that affect snow depth. Candidate factors for optimization include location, terrain features, LUCC, soil particle size proportion, and SCD. Table 1 shows the regression analysis results between in-situ snow depth observations and each candidate factor. We can see that a single factor generally has a poor correlation with the observations, with R between 0.07 and 0.69. It showed that the highest correlation (R = 0.69) occurred between SCD and in-situ observations, and the lowest correlation (R = 0.07) occurred between aspect and in-situ observations. We chose six environmental factors with a correlation coefficient larger than 0.3 to develop the final SDR model: latitude, longitude, slope, surface roughness, surface elevation fluctuation, and SCD.

Table 1.
Evaluations of factors affecting snow depth.
4.2. Model Optimization
The six optimized environmental factors were thus used in combination with FSD to build a final multivariate reconstruction model. As shown in Table 2, the LMSDR model (R2 = 0.63, RMSE = 2.28 cm) has higher accuracy and stability than the power model (R2 = 0.63, RMSE = 6.94 cm), the logarithmic model (R2 = 0.59, RMSE = 6.89 cm), and the inverse model (R2 = 0.58, RMSE= 6.84 cm).
Table 2.
Evaluations of multifactor RSD model.
Previous studies verified the presence of a highly linear relationship between microwave brightness temperature and snow depth over homogeneous snow-covered areas [69]. However, microwave brightness temperature data have a poor spatial resolution (e.g., 25 km); a single brightness temperature pixel can contain multiple types of land cover. Topographical complexity enhances the heterogeneity in the spatial distribution of snow depth. These factors greatly limit the spatial expression of microwave brightness temperature data [70,71]. The SDR data at higher spatial resolution (1 km) can alleviate this weakness effectively by introducing MODIS-SCF data of moderate high resolution (1 km) and environmental factor data at high resolution (90 m). Figure 3 shows the spatial distributions of snow depth in QTP generated by the SDR models. The LMSDR model generated better snow depth spatial distribution than the logarithmic model, the exponential model, and the inverse model. Meanwhile, we tried a similar data analysis by introducing all other factors without SCD to simulate snow depth and found that the R2 = 0.56 and RMSE = 2.44 cm (the LMSDR model, R2 = 0.63, RMSE = 2.28 cm.) and that the introduction of SCD improves the accuracy of the reconstructed snow depth.
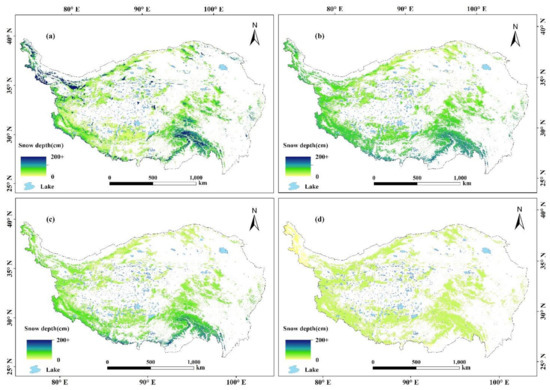
Figure 3.
The spatial distribution of snow depth on 2 February 2013 obtained from RSD models. (a) linear model (LMSDR); (b) logarithmic model; (c) power model; (d) inverse model.
In summary, the LMSDR model better reflected the snow depth simulation effect and its spatial distribution over the QTP. Based on the LMSDR model, the daily snow depth data of 16 hydrological years (2002–2018) were reconstructed.
5. Discussion
5.1. Overall Accuracy Comparison
The daily snow depth samples (148,274) of in-situ observations in the eight odd hydrological years of 100 meteorological stations, ten automatic meteorological stations from 2015 to 2016, and the products of LMSDR, PMSD, SDC, and FSD extracted from the matched 110 stations were used for accuracy analysis. Based on the modeling accuracy matrices of RMSE, MAE, PME, and NME (Equations (7)–(10)), the overall accuracy of the four snow depth products (PMSD, SDC, FSD, and LMSDR) were compared and analyzed using the in-situ observations as the reference (Figure 4a). The LMSDR model predicted snow depth with RMSE and MAE being 2.26 cm and 0.46 cm, respectively, followed by the SDC product (RMSE = 2.28 cm, MAE = 0.46 cm), then by the products of PMSD and FSD. The values of PME (4.17 cm, 3.91 cm, and 4.00 cm) were smaller than the absolute values of NME (−4.33 cm, −7.75 cm, and −11.63 cm) for the products of PMSD, SDC, and FSD, respectively. These accuracy matrix data indicated that the products of PMSD, SDC, and FSD underestimated the observed snow depth. In comparison, the absolute values of PME (3.19 cm) and NME (−3.90 cm) of snow depth data generated by the LMSDR model were close in magnitude, both smaller than those of the other three snow depth products (PMSD, SDC, and FSD), indicating that the LMSDR product outperformed the PMSD, SDC and FSD products in accuracy.
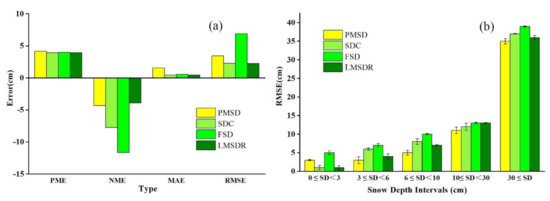
Figure 4.
(a) Overall accuracy evaluation of passive microwave snow depth dataset (PMSD), snow depletion curve (SDC), fused snow depth (FSD), and snow depth data of LMSDR; and (b) accuracy comparison in different intervals of snow depth.
Figure 4b shows the accuracy comparison of the four snow depth products against in-situ observation for different snow depths to investigate the performance of each product for snowpack of different depths. About 95% of the in-situ observation samples had a snow depth of less than 3 cm, and about 1% of the samples had a snow depth of more than 30 cm. Overall, the RMSE values of all snow depth products increase with increasing snow depths. Products of PMSD, SDC, FSD, and LMSDR performed relatively well in areas of shallow snow (depth less than 3 cm), with RMSE values of 3.19 cm, 1.57 cm, 5.55 cm, and 1.52 cm, respectively. The newly developed LMSDR product performed the best in accuracy for all snow depth products.
As shown in Figure 4, although the LMSDR product outperformed all other products for snowpack of different depths, it was noteworthy that poorer accuracy occurred when the value of snow depth was more than 30 cm. The reasons for this are twofold: (1) the scarcity of in-situ snow depth data in western QTP with deep snow was available for model development, and (2) the spatial heterogeneity of snow cover distribution in the topographically complex regions. The accuracy of reconstructed snow depth can be subject to many factors in the study area, e.g., patchiness prevalence, snowdrift frequency, wide distribution of frozen soil, the undulation of terrain, and the difference in the underlying surface of snow cover. The uneven distribution of in-situ observations in the deep snow areas can contribute greatly to the low accuracy in the deep snow areas [72], which can be alleviated with more meteorological stations being installed in western QTP. At the same time, it was found that the accuracy of the FSD product by the fusion algorithm performed not so well as the PMSD and SDC products. There may be two causes: (1) the fusion-downscaling algorithm assigned snow depth to each subpixel linearly using the SCF value as a weight and the PMSD value as invariable to get a good downscaling effect. However, the complex local terrain resulted in a discontinuous distribution of snow, hence the uncertainty of the fusion algorithm [47,73,74]; and (2) extreme heterogeneity of snow cover distribution with prominent patchiness and low spatial resolution (25 km) of the PMSD product resulted in relatively great errors in FSD in areas of high altitudes.
5.2. Snow Depth Accuracy Comparison of Different Snow Characteristics and Environmental Factors
Further performance analysis of the four data products was performed for snowpack over different LUCCs, elevation intervals, slope intervals, and SCDs. Table 3 shows that all products compared better with in-situ measurements over cultivated land than other LUCC types except PSD, with the LMSDR product performing the best (RMSE = 1.58 cm). For the construction land and bare land, the LMSDR product performed better than the other three products in matching the in-situ observations, with the RMSE being 1.86 cm and 1.90 cm, respectively. The LMSDR model performed worst over grassland (RMSE = 2.28 cm), but still better than the other three products. The SDC product outperformed the LMSDR product for snow over the forest, probably because of a lack of enough
Table 3.
RMSEs of different snow depth datasets in LUCCs, altitudes, slopes, and SCDs.
Elevation distribution strongly affected the amount and distribution of precipitation and snow accumulation at specific locations. As shown in Table 3, the PMSD, SDC, FSD, and LMSDR products performed relatively well in matching in-situ observations at the elevation zone of 1000–2000 m, with RMSE being 1.48 cm, 1.16 cm, 3.11 cm, and 1.13 cm, respectively. The LMSDR product performed the best in accuracy. All four products have relatively lower accuracy in the region of elevation above 4000 m. All products are positively correlated with elevation since the probability of precipitation as snowfall increases with increasing elevation [75,76]. The SDC product was found to perform the best in the region of elevation between 2000–2500 m (RMSE = 0.87 cm). The FSD product was found to perform the worst in regions of elevation between 3500–4000 m (RMSE = 13.24 cm). The differences in accuracy among the products were closely related to sample distribution at different elevation zones as well as the interaction between local climate and the complex terrain [77,78].
Slope was an important environmental factor of terrain features. The local incident angle and the polarization direction of microwave radiation depends on the slope. Slope has an impact on snow cover distribution to some extent by changing solar radiation and water vapor channel [48,74,79]. As shown in Table 3, the RMSE of the four snow depth products increased with increasing slope. The PMSD, SDC, FSD, and LMSDR products showed relatively higher accuracy in relatively flat areas with a slope less than 5°, with the RMSE values being 2.98 cm, 2.30 cm, 7.07 cm, and 1.80 cm, respectively.
As an important indicator of snow cover longevity, SCD had a prominent positive correlation with snow depth. Normally, areas with longer snow cover duration had a persistently lower temperature, and snow could be accumulated for a longer period [80]; it takes a longer time for a deeper snowpack to melt completely. However, as SCD increases, the accuracy of the PMSD, SDC, FSD, and LMSDR products exhibited a decreasing trend, as shown in Table 3. When SCD was less than 30 days, all snow depth products performed relatively well in accuracy, with the LMSDR product being the most accurate (RMSE = 1.18 cm). When SCD was more than 60 days, the PMSD, SDC, FSD, and LMSDR products performed poorly in accuracy, with RMSE being 3.88 cm, 2.71 cm, 8.38 cm, and 2.50 cm, respectively.
5.3. Spatial Accuracy Comparison of Different Snow Depth Products
The PMSD product fused with the moderate-resolution MODIS-SCF data can better capture snow depth heterogeneity than PMSD itself, reducing errors caused by the low resolution-related mixing problem [47]. The FSD data produced by the fusion-downscaling algorithm using the PMSD data and the cloud-reduced MODIS-SCF datasets effectively improved the accuracy of snow depth distribution in QTP while preserved snow depth information in the PMSD products.
Taking the spatial distribution of snow depth on 2 February 2013 as an example (Figure 5), parts of the typical snow-covered area were presented in detail to reflect the spatial distribution of the four snow depth data products in QTP. As shown in Figure 5a, the PMSD product reflected roughly the spatial distribution of snow depth, but it is hard to effectively discriminate the snow-covered from snow-free areas. Also, the maximum snow depth of the day observed by the PMSD product was 23 cm, while the in-situ observed maximum depth was 93 cm. The spatial resolution of 25 km limited the details of the snow depth spatial distribution. As shown in Figure 5b, the SDC product presented the spatial distribution of snow depth variation in more detail at a resolution of 1 km. However, as the number of pixels with a 100% SCF increased in the winter season, snow depth data generated by the empirical formulas failed to discriminate the area of deep snow from that of shallow snow. Compared with the mean values of the in-situ observations, the snow depth in the SDC product was obviously overestimated in the central QTP. In the perennially snow-covered areas such as the Himalayas and Nyainqentanglha Mountains, the SDC value was significantly underestimated compared to the in-situ observations, with the maximum value being only 26.9 cm. Figure 5c shows the spatial distribution of snow depth of the FSD product, from which area of deep snow can be discriminated effectively from the area of shallow snow. Nevertheless, because of the complex local terrain, the linear mixing approach based on SCF as a weight had some uncertainty, which resulted in serious heterogeneity and fragmentation of pixel distribution in the snow-covered area in the mid-eastern QTP. Figure 5d shows the snow depth distribution of the LMSDR product. Compared with the PMSD, SDC, and FSD products, the LMSDR product presented snow depth spatial distribution in detail by introducing impacts on snow depth by multiple environmental factors. The areas of deep snow shown in the LMSDR product were located primarily in the Karakoram Range, the west of the Kunlun Mountains, the Himalayas, the Kailas Range, and the Nyainqentanglha Mountains, with snow depth exceeding 100 cm. The areas of shallow snow were located primarily in the northern QTP, Ngari, the eastern mountains of the Western Sichuan Plateau, and the northern Hengduan Mountains. Only a little snow was seen in the eastern part of Qinghai Province, the southern part of western Sichuan Plateau, the southern part of Hengduan Mountains, the Qaidam Basin, and the lower Brahmaputra in southeastern Tibet. These observations derived from the LMSDR product were consistent with previous studies [81,82,83].
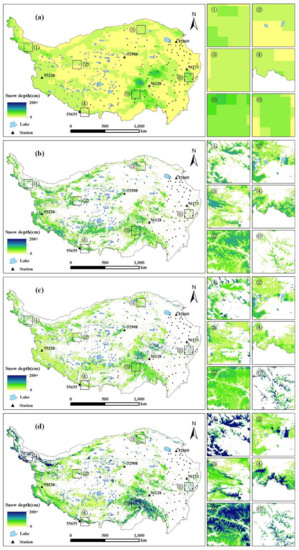
Figure 5.
The SD spatial distribution on 2 February 2013 of (a) PSD, (b) SDC, (c) FSD, and (d) LMSDR products in QTP, and the detailed display of ① Karakoram mountains, ② hinterland of Ngari, ③ Qilian Mountains, ④ Himalayas, ⑤ Brahmaputra Basin in southeast Tibet, and ⑥ Western Sichuan Plateau. (The spatial resolution in Figures a–d is 25 km, ①–⑥ is 1 km).
Taking the in-situ observations from the 100 meteorological stations as a reference to estimate the spatial accuracy of the four snow depth products quantitatively. When the snow depth from each product and the in-situ observations at the corresponding station within the same time period match, the error matrix was defined as true; otherwise, the error matrix was defined as false. By calculating the ratio of the counts of the samples that each product matches the in-situ observation to the total sample counts, the spatial accuracy for the product was derived in the study area. Results show that the PMSD, SDC, FSD, and LMSDR products had a spatial accuracy of 66.8%, 92.5%, 92.1%, and 92%, respectively. Overall, the SDC, FSD, and LMSDR products had high spatial accuracy, while PMSD has poor spatial accuracy. PMSD products had a better spatial accuracy of 70–90% in the northeast and southwest of QTP, but less than 50% in the southeast and hinterland of QTP (Figure 6a). The overall spatial accuracies in the SDC, FSD, and LMSDR distributions were similar. Most of the spatial accuracy in the northeast, southeast, and southwest of QTP was in the 70–95% range. The regions with lower spatial accuracy are mainly distributed in the central and eastern regions of QTP (Figure 6b–d).
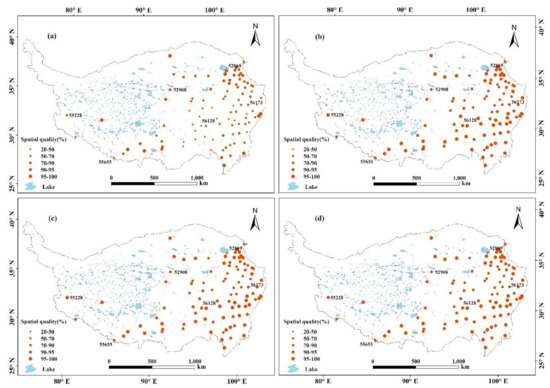
Figure 6.
Comparisons of spatial accuracy of PMSD (a), SDC (b), FSD (c), and LMSDR (d) products in QTP (1 September 2002–1 March 2018).
In order to show spatial accuracy at different geographic zones, the meteorological stations 52,869, 52,908, 55,228, 55,655, 56,128, and 56,173 (see Figure 6) were selected for comparison (see Table 4). Results show that the LMSDR, SDC, and FSD products performed relatively well in accuracy in the shallow snow areas; for example, spatial accuracy exceeded 93% at station 55,228 and station 56,128 (Table 4). In the areas with deep snow, spatial accuracy was lower for the LMSDR, SDC, and FSD products. For example, at station 55,655, the accuracy was less than 70% (Table 4). The PMSD product at station 52,908 and station 52,869, located in the northern QTP (Figure 6), performed the best with accuracy higher than 80%, followed by station 55,228 and station 56,173 with an accuracy of 65% and 61%, respectively. The PMSD product performed the worst at station 55,655 and station 56,128, with accuracy being 36% (Table 4).
Table 4.
Comparisons of the accuracy of PMSD, SDC, FSD, and LMSDR products at six meteorological stations in QTP.
Through the spatial accuracy analysis of the snow depth in QTP, a significant correlation between the spatial accuracy of snow depth and the values of snow depth were revealed. The products performed prominently better in spatial accuracy in areas of shallow snow than in areas of deep snow, which may be due to a relatively large difference between the in-situ observations at the meteorological stations and those by the remote sensing satellite. For the LMSDR model, the spatial distribution of the meteorological stations also affected the accuracy of the snow depth products since the in-situ observations have been dominantly located in eastern QTP, where snow was generally shallower. For instance, snow measurements at stations 55,655 and 56,128 in the valleys at the southern foot of the Himalayas and the Brahmaputra Basin were affected by the warm and humid air from the Indian Ocean and the Bay of Bengal [81,82], widespread occurrence of cloud and frequent rainfall caused a relatively low spatial accuracy in snow depth. At station 52,908 in the central QTP and station 55,228 in Ngari in the north of the Himalayas (Figure 5 and Figure 6), these products performed better in snow depth because of less rainfall and cloud interference. In summary, compared with the PMSD, SDC, and FSD products, the LMSDR product generated by the LMRSD model developed in this study performed better in the overall spatial accuracy when compared to in-situ observations.
5.4. Interannual Variation of the LMSDR Model
Based on the daily snow depth over the QTP in the 16 hydrological years from 2002 to 2018, the performance of the LMSDR product was further evaluated by analyzing its interannual and seasonal variation of the annual and seasonal mean snow depths. As shown in Figure 7a, the LMSDR product could well capture the variation trend of snow depth over the QTP when compared to the in-situ measurements. Figure 7b–d showed the annual variation between the mean reconstructed snow depth and the in-situ observations for autumn, winter, and spring, respectively. The LMSDR product underestimated the snow depth in winter and spring, especially in spring, with a difference near 0.2 cm. For some years, the deepest snow from the LMSDR product occurred in winter, while the deepest snow from the in-situ observation occurred in spring. In autumn, the LMSDR product was generally consistent with the in-situ observation. In some years, such as the autumn of 2012 and winter of 2014, the LMSDR product showed an overestimate. Generally, the LMSDR product worked best for snow depth reconstruction in autumn, followed by spring, and had relatively low accuracy in winter. In particular, in the years 2014 and 2015, the differences in the mean snow depth between the reconstructed and in-situ observed were more than 1.2 cm.
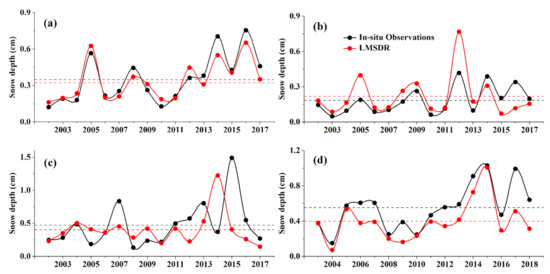
Figure 7.
Interannual variations of annual mean value and the seasonal mean value of snow depth in hydrological years from 2002 to 2018 over the QTP. (a) Annual; (b) Autumn; (c) Winter; (d) Spring.
The reconstruction of a long-time series of snow depth data using the LMSDR model developed in this study could effectively reduce some errors caused by excessive fluctuations in snowfall in some years over the QTP. The interannual variation of the annual mean value of the snow depth in the hydrological years was generally consistent with the in-situ observations. However, during the analysis of the interannual variations in different seasons, it was found that the accuracy in snow depth reconstruction in winter by the LMSDR product was relatively low. Moreover, the reconstruction in spring showed underestimation. As a key variable for snow depth reconstruction, the PMSD product used for reconstruction in winter and spring when snow was deep reflected the cumulative amount of all previous snowfall, while the in-situ observed snow depth provided by the meteorological stations represented a daily accumulation. The two values of snow depth were quite different, and the results of the reconstruction model showed obvious errors when snow was deep. With continuous snow accumulation in winter and spring, the possibility of bias and underestimation of the reconstructed values of snow depth was relatively high. On the other hand, seasonal winds significantly affected snow cover extent in higher elevation zones during winter and spring [84,85]. At the same time, the difference in the measurement timing between satellite sensors and in-situ observations, and the influence of various surface environmental factors increased the likelihood of such deviations.
6. Conclusions
Accurate measurement of the dynamic snow depth over mountainous areas such as QTP is important to understanding alpine climate dynamics, hydrological cycle, production and life, and ecological changes. In this study, multiple data sets of long-time series of snow depth such as the PMSD and snow cover data such as MODIS-SCF were used for an optimized multivariate reconstruction model development and validation. We took the in-situ observations of snow depth as “true value” for model development and validation. Such a model can effectively reduce accidental errors caused by excessive or low snowfall in some years. At the same time, the effective fusing of PMSD of low resolution (25 km) and MODIS-SCF of moderate resolution (1 km) improved the spatial accuracy and resolution (1 km) of snow depth distribution and avoided the spatial loss caused by simple data fusion or single data source identification in most studies. Based on this, the introduction of snow cover day and optimized influencing environmental factors such as longitude, latitude, slope, surface roughness, and surface elevation undulation made the LMSDR product outperform several other snow depth products when in-situ snow depth data were taken as the reference. As a result, the RMSE and MAE of the reconstructed snow depth by the model were only 2.26 cm and 0.46 cm, respectively; when compared to in-situ measurements, snow spatial accuracy exceeded 92%. The RMSE of the LMSDR product was 1.52 cm in areas of shallow snow where snow depth was less than 3 cm. The mean annual snow depth in hydrological years provided a sound representation of the trend of snow depth over QTP, with the best reconstruction for autumn in the years. Despite the success of the LMSDR model in reconstructing the long-term snow depth data in QTP, there were still some deficiencies that require improvement. For instance, due to the uneven spatial distribution of the meteorological stations in QTP, the snow depth reconstructed in areas of deep snow that occurs more frequently at elevation areas, low valleys, and forests had high uncertainty and were hard to evaluate because of lack of in-situ observations. Long-term in-situ observations in these areas are important for future model improvement and accuracy of reconstructed snow depth.
Author Contributions
Conceptualization, P.W. and T.Z.; methodology, T.Z. and P.W.; software, B.W. and P.W.; validation, G.Y., J.L. and N.W.; formal analysis, G.Y. and N.W.; investigation, J.L. and P.W.; resources, X.Z. and T.Z.; data curation, P.W. and N.W.; writing—original draft preparation, P.W. and T.Z.; writing—review and editing, T.Z. and X.Z.; visualization, X.Z.; supervision, X.Z.; project administration, T.Z. and G.Y.; funding acquisition, T.Z. All authors have read and agreed to the published version of the manuscript.
Funding
This research was funded by the National Natural Science Foundation of China (41801099) and the Second Tibetan Plateau Scientific Expedition and Research Programs (2019QZKK0301, 2019QZKK0307).
Institutional Review Board Statement
Not applicable.
Informed Consent Statement
Not applicable.
Data Availability Statement
The data used to support the findings of this study are available from the corresponding author upon request.
Acknowledgments
The author thanks anonymous reviewers for providing invaluable comments on the original manuscript.
Conflicts of Interest
The authors declare no conflict of interest.
Abbreviation
| Abbreviated Names | Interpretation |
| AMSR2 | advanced microwave scanning radiometer 2 |
| AVHRR | advanced very high resolution radiometer |
| DEM | digital elevation model |
| EnKF | ensemble Kalman filter method |
| FSD | fused snow depth |
| LMSDR | linear multivariate snow depth reconstruction |
| LOOCV | leave-one-out cross validation |
| LUCC | land-use and land-cover change |
| MAE | mean absolute error |
| MODIS | moderate resolution imaging spectroradiometer |
| NASA | national aeronautics and space administration |
| NDSI | normalized difference snow index |
| NME | negative mean error |
| NSIDC | US national snow and ice data left |
| PME | positive mean error |
| PMSD | passive microwave snow depth dataset |
| QTP | Qinghai-Tibetan Plateau |
| R2 | mean coefficient of determination |
| RMSE | root mean square error |
| SCD | snow cover day |
| SCF | snow cover fraction |
| SDC | snow depletion curve |
| SDR | snow depth reconstruction |
| SMMR | scanning multichannel microwave radiometer |
| SRTM | shuttle radar topography mission |
| SSM/I | special sensor microwave/imager |
| SSMI/S | special sensor microwave imager/sounder |
| TPDC | national Tibetan Plateau data left |
| VNIR | visible and near-infrared |
References
- Andreadis, K.M.; Lettenmaier, D.P. Assimilating remotely sensed snow observations into a macroscale hydrology model. Adv. Water Resour. 2006, 29, 872–886. [Google Scholar] [CrossRef]
- Immerzeel, W.W.; Van Beek, L.P.H.; Bierkens, M.F.P. Climate Change Will Affect the Asian Water Towers. Science 2010, 328, 1382–1385. [Google Scholar] [CrossRef] [PubMed]
- Barnett, T.P.; Adam, J.C.; Lettenmaier, D.P. Potential impacts of a warming climate on water availability in snow-dominated regions. Nat. Cell Biol. 2005, 438, 303–309. [Google Scholar] [CrossRef]
- Tao, C.; Xiaohua, H.; Liyun, D.; Hongyi, L.; Xiaodong, H.; Lin, X. Snow Cover Variation and Its Impacts over the Qinghai-Tibet Plateau. Chin. Acad. Sci. 2019, 34, 1247–1253. [Google Scholar]
- Nosaka, M.; Sasaki, H.; Murata, A.; Kawase, H.; Oh’Izumi, M. Bias Correction of Snow Depth by Using Regional Frequency Analysis in the Non-Hydrostatic Regional Climate Model around Japan. SOLA 2016, 12, 165–169. [Google Scholar] [CrossRef][Green Version]
- Dressler, K.A.; Leavesley, G.H.; Bales, R.C.; Fassnacht, S.R. Evaluation of gridded snow water equivalent and satellite snow cover products for mountain basins in a hydrologic model. Hydrol. Process. 2006, 20, 673–688. [Google Scholar] [CrossRef]
- Gong, G.; Cohen, J.; Entekhabi, D.; Ge, Y. Hemispheric-scale climate response to Northern Eurasia land surface characteristics and snow anomalies. Glob. Planet. Change 2007, 56, 359–370. [Google Scholar] [CrossRef]
- Cohen, J.; Entekhabi, D. Eurasian snow cover variability and northern hemisphere climate predictability. Geophys. Res. Lett. 1999, 26, 345–348. [Google Scholar] [CrossRef]
- Kuraś, P.K.; Weiler, M.; Alila, Y. The spatiotemporal variability of runoff generation and groundwater dynamics in a snow-dominated catchment. J. Hydrol. 2008, 352, 50–66. [Google Scholar] [CrossRef]
- Damm, A.; Köberl, J.; Prettenthaler, F. Does artificial snow production pay under future climate conditions? A case study for a vulnerable ski area in Austria. Tour. Manag. 2014, 43, 8–21. [Google Scholar] [CrossRef]
- Yao, T.D.; Qin, D.H.; Shen, Y.P.; Zhao, L.; Wang, N.-L.; Lu, A.-X. Cryospheric changes and their impacts on regional water cycle and ecological conditions in the Qinghai-Tibetan Plateau. Chin. J. Nat. 2013, 35, 179–186. [Google Scholar]
- Qian, Y.; Flanner, M.G.; Leung, L.R.; Wang, W. Sensitivity studies on the impacts of Tibetan Plateau snowpack pollution on the Asian hydrological cycle and monsoon climate. Atmos. Chem. Phys. Discuss. 2011, 11, 1929–1948. [Google Scholar] [CrossRef]
- Ma, Y.; Wang, Y.; Wu, R.; Zhu, Z.; Yang, K.; Li, M.; Ma, W.; Zhong, L.; Sun, F.; Chen, X.; et al. Recent advances on the study of atmosphere-land interaction observations on the Tibetan Plateau. Hydrol. Earth Syst. Sci. 2009, 13, 1103–1111. [Google Scholar] [CrossRef]
- Dong, J.; Zhang, G.; Zhang, Y.; Xiao, X. Reply to Wang et al.: Snow cover and air temperature affect the rate of changes in spring phenology in the Tibetan Plateau. Proc. Natl. Acad. Sci. USA 2013, 110, E2856–E2857. [Google Scholar] [CrossRef] [PubMed]
- Li, P. Distribution of Snow Cover Over the High Asia. J. Glaciol. Geocryol. 1995, 17, 291–298. [Google Scholar]
- Stow, D.A.; Hope, A.; McGuire, D.; Verbyla, D.; Gamon, J.; Huemmrich, F.; Houston, S.; Racine, C.; Sturm, M.; Tape, K.; et al. Remote sensing of vegetation and land-cover change in Arctic Tundra Ecosystems. Remote Sens. Environ. 2004, 89, 281–308. [Google Scholar] [CrossRef]
- Pu, Z.; Xu, L. MODIS/Terra observed snow cover over the Tibet Plateau: Distribution, variation and possible connection with the East Asian Summer Monsoon (EASM). Theor. Appl. Clim. 2008, 97, 265–278. [Google Scholar] [CrossRef]
- Wu, Z.; Jiang, Z.; Li, J.; Zhong, S.; Wang, L. Possible association of the western Tibetan Plateau snow cover with the decadal to interdecadal variations of northern China heatwave frequency. Clim. Dyn. 2012, 39, 2393–2402. [Google Scholar] [CrossRef]
- Xu, W.; Ma, L.; Ma, M.; Zhang, H.; Yuan, W. Spatial–Temporal Variability of Snow Cover and Depth in the Qinghai–Tibetan Plateau. J. Clim. 2017, 30, 1521–1533. [Google Scholar] [CrossRef]
- Shen, L.H.; Wu, T.; You, Q.L.; Jiang, G.J.; Xie, X.F.; Zhu, L.D.; Yin, J.W. Analysis of the characteristics of spatial and temporal variations of snow depth and their causes over the central and eastern Tibetan Plateau. J. Glaciol. Geocryol. 2019, 41, 1150–1161. [Google Scholar]
- Dai, L.; Che, T.; Xie, H.; Wu, X. Estimation of Snow Depth over the Qinghai-Tibetan Plateau Based on AMSR-E and MODIS Data. Remote Sens. 2018, 10, 1989. [Google Scholar] [CrossRef]
- Dietz, A.J.; Kuenzer, C.; Gessner, U.; Dech, S. Remote sensing of snow—A review of available methods. Int. J. Remote Sens. 2011, 33, 4094–4134. [Google Scholar] [CrossRef]
- De Lannoy, G.J.M.; Reichle, R.H.; Arsenault, K.R.; Houser, P.R.; Kumar, S.; Verhoest, N.E.C.; Pauwels, V.R.N. Multiscale assimilation of Advanced Microwave Scanning Radiometer-EOS snow water equivalent and Moderate Resolution Imaging Spectroradiometer snow cover fraction observations in northern Colorado. Water Resour. Res. 2012, 48, 182–205. [Google Scholar] [CrossRef]
- Huang, X.; Deng, J.; Wang, W.; Feng, Q.; Liang, T. Impact of climate and elevation on snow cover using integrated remote sensing snow products in Tibetan Plateau. Remote Sens. Environ. 2017, 190, 274–288. [Google Scholar] [CrossRef]
- Hall, D.K.; Riggs, G.A. Accuracy assessment of the MODIS snow products. Hydrol. Process. 2007, 21, 1534–1547. [Google Scholar] [CrossRef]
- Gascoin, S.; Grizonnet, M.; Bouchet, M.; Salgues, G.; Hagolle, O. Theia Snow collection: High-resolution operational snow cover maps from Sentinel-2 and Landsat-8 data. Earth Syst. Sci. Data 2019, 11, 493–514. [Google Scholar] [CrossRef]
- Parajka, J.; Bezak, N.; Burkhart, J.; Hauksson, B.; Holko, L.; Hundecha, Y.; Jenicek, M.; Krajčí, P.; Mangini, W.; Molnar, P.; et al. Modis Snowline Elevation Changes During Snowmelt Runoff Events in Europe. J. Hydrol. Hydromech. 2019, 67, 101–109. [Google Scholar] [CrossRef]
- Parajka, J.; Blöschl, G. Validation of MODIS snow cover images over Austria. Hydrol. Earth Syst. Sci. 2006, 10, 679–689. [Google Scholar] [CrossRef]
- Bavera, D.; Bavay, M.; Jonas, T.; Lehning, M.; De Michele, C. A comparison between two statistical and a physically-based model in snow water equivalent mapping. Adv. Water Resour. 2014, 63, 167–178. [Google Scholar] [CrossRef]
- Finger, D. The value of satellite retrieved snow cover images to assess water resources and the theoretical hydropower potential in ungauged mountain catchments. Jokull 2018, 68, 47–66. [Google Scholar]
- Zheng, W.; Du, J.; Zhou, X.; Song, M.; Bian, G.; Xie, S.; Feng, X. Vertical distribution of snow cover and its relation to temperature over the Manasi River Basin of Tianshan Mountains, Northwest China. J. Geogr. Sci. 2017, 27, 403–419. [Google Scholar] [CrossRef]
- Xie, S.; Du, J.; Zhou, X.; Zhang, X.; Feng, X.; Zheng, W.; Li, Z.; Xu, C.-Y. A progressive segmented optimization algorithm for calibrating time-variant parameters of the snowmelt runoff model (SRM). J. Hydrol. 2018, 566, 470–483. [Google Scholar] [CrossRef]
- Zhou, X.; Xie, H.; Hendrickx, J.M. Statistical evaluation of remotely sensed snow-cover products with constraints from streamflow and SNOTEL measurements. Remote Sens. Environ. 2005, 94, 214–231. [Google Scholar] [CrossRef]
- Hall, D.K.; Riggs, G.A.; Salomonson, V.V.; DiGirolamo, N.E.; Bayr, K.J. MODIS snow-cover products. Remote Sens. Environ. 2002, 83, 181–194. [Google Scholar] [CrossRef]
- Foster, J.L.; Hall, D.; Kelly, R.; Chiu, L. Seasonal snow extent and snow mass in South America using SMMR and SSM/I passive microwave data (1979–2006). Remote Sens. Environ. 2009, 113, 291–305. [Google Scholar] [CrossRef]
- Tedesco, M.; Reichle, R.; Low, A.; Markus, T.; Foster, J.L. Dynamic Approaches for Snow Depth Retrieval From Spaceborne Microwave Brightness Temperature. IEEE Trans. Geosci. Remote Sens. 2010, 48, 1955–1967. [Google Scholar] [CrossRef]
- Che, T.; Li, X.; Jin, R.; Huang, C. Assimilating passive microwave remote sensing data into a land surface model to improve the estimation of snow depth. Remote Sens. Environ. 2014, 143, 54–63. [Google Scholar] [CrossRef]
- Foster, J.L.; Hall, D.; Eylander, J.B.; Riggs, G.A.; Nghiem, S.V.; Tedesco, M.; Kim, E.; Montesano, P.M.; Kelly, R.E.J.; Casey, K.A.; et al. A blended global snow product using visible, passive microwave and scatterometer satellite data. Int. J. Remote Sens. 2011, 32, 1371–1395. [Google Scholar] [CrossRef]
- Liu, Y.; Peters-Lidard, C.D.; Kumar, S.; Foster, J.L.; Shaw, M.; Tian, Y.; Fall, G.M. Assimilating satellite-based snow depth and snow cover products for improving snow predictions in Alaska. Adv. Water Resour. 2013, 54, 208–227. [Google Scholar] [CrossRef]
- Clark, M.P.; Slater, A.G.; Barrett, A.P.; Hay, L.E.; McCabe, G.J.; Rajagopalan, B.; Leavesley, G.H. Assimilation of snow covered area information into hydrologic and land-surface models. Adv. Water Resour. 2006, 29, 1209–1221. [Google Scholar] [CrossRef]
- Toure, A.M.; Reichle, R.H.; Forman, B.A.; Getirana, A.; De Lannoy, G.J.M. Assimilation of MODIS Snow Cover Fraction Observations into the NASA Catchment Land Surface Model. Remote Sens. 2018, 10, 316. [Google Scholar] [CrossRef] [PubMed]
- Ek, M.B.; Mitchell, K.E.; Lin, Y.; Rogers, E.; Grunmann, P.; Koren, V.; Gayno, G.; Tarpley, J.D. Implementation of Noah land surface model advances in the National Centers for Environmental Prediction operational mesoscale Eta model. J. Geophys. Res. Space Phys. 2003, 108, 1–16. [Google Scholar] [CrossRef]
- Helmert, J.; Şensoy Şorman, A.; Montero, R.A.; De Michele, C.; De Rosnay, P.; Dumont, M.; Finger, D.; Lange, M.; Picard, G.; Potopová, V.; et al. Review of Snow Data Assimilation Methods for Hydrological, Land Surface, Meteorological and Climate Models: Results from a COST HarmoSnow Survey. Geoscience 2018, 8, 489. [Google Scholar] [CrossRef]
- Clark, M.; Hendrikx, J.; Slater, A.G.; Kavetski, D.; Anderson, B.; Cullen, N.J.; Kerr, T.; Hreinsson, E.Ö.; Woods, R.A. Representing spatial variability of snow water equivalent in hydrologic and land-surface models: A review. Water Resour. Res. 2011, 47. [Google Scholar] [CrossRef]
- Mhawej, M.; Faour, G.; Fayad, A.; Shaban, A. Towards an enhanced method to map snow cover areas and derive snow-water equivalent in Lebanon. J. Hydrol. 2014, 513, 274–282. [Google Scholar] [CrossRef]
- Gao, Y.; Xie, H.; Lu, N.; Yao, T.; Liang, T. Toward advanced daily cloud-free snow cover and snow water equivalent products from Terra–Aqua MODIS and Aqua AMSR-E measurements. J. Hydrol. 2010, 385, 23–35. [Google Scholar] [CrossRef]
- Tang, Z.G.; Li, H.Y.; Wang, J.; Liang, J.; Li, C.; Che, T.; Wang, X. Reconstruction of Snow Depth over the Tibetan Plateau Based on Mutisource Data. J. Geoinf. Sci. 2016, 18, 941–950. [Google Scholar]
- Wang, Y.; Huang, X.; Wang, J.; Zhou, M.; Liang, T. AMSR2 snow depth downscaling algorithm based on a multifactor approach over the Tibetan Plateau, China. Remote Sens. Environ. 2019, 231, 111268. [Google Scholar] [CrossRef]
- Bai, Z.; Dong, J.; Ma, Z. Climatic Characteristics of Qinghai-Xizang Plateau and Its Surrounding. Plateau Meteor. 2004, 6, 890–897. [Google Scholar]
- Yao, T.; Thompson, L.G.; Yang, W.; Yu, W.; Gao, Y.; Guo, X.; Yang, X.; Duan, K.; Zhao, H.; Xu, B.; et al. Different glacier status with atmospheric circulations in Tibetan Plateau and surroundings. Nat. Clim. Change 2012, 2, 663–667. [Google Scholar] [CrossRef]
- Che, T.; Li, X. Retrieval of Snow Depth in China by Passive Microwave Remote Sensing Data and Its Accuracy Assessment. Remote Sens. Technol. Appl. 2004, 26, 444–449. [Google Scholar]
- Che, T.; Li, X.; Jin, R.; Armstrong, R.; Zhang, T. Snow depth derived from passive microwave remote-sensing data in China. Ann. Glaciol. 2008, 49, 145–154. [Google Scholar] [CrossRef]
- Che, T. Long-term series of daily snow depth dataset in China (1979–2019). Natl. Tibet. Plateau Data Cent. 2015. [Google Scholar] [CrossRef]
- Gao, J.; Williams, M.W.; Fu, X.; Wang, G.; Gong, T. Spatiotemporal distribution of snow in eastern Tibet and the response to climate change. Remote Sens. Environ. 2012, 121, 1–9. [Google Scholar] [CrossRef]
- Xu, C.; Chen, Y.; Hamid, Y.; Tashpolat, T.; Chen, Y.; Ge, H.; Li, W. Long-term change of seasonal snow cover and its effects on river runoff in the Tarim River basin, northwestern China. Hydrol. Process. 2009, 23, 2045–2055. [Google Scholar] [CrossRef]
- Yu, Z.; Liu, S.; Wang, J.; Sun, P.; Liu, W.; Hartley, D.S. Effects of seasonal snow on the growing season of temperate vegetation in China. Glob. Change Biol. 2013, 19, 2182–2195. [Google Scholar] [CrossRef]
- Liang, T.; Zhang, X.; Xie, H.; Wu, C.; Feng, Q.; Huang, X.; Chen, Q. Toward improved daily snow cover mapping with advanced combination of MODIS and AMSR-E measurements. Remote Sens. Environ. 2008, 112, 3750–3761. [Google Scholar] [CrossRef]
- Qiu, Y.; Wang, X.; Han, L.; Chang, L.; Shi, L. Daily fractional snow cover dataset over High Asia. China Sci. Data 2017. [Google Scholar] [CrossRef]
- Li, C.; Sa, C.; Liu, G.; Wang, M.; Meng, H.; Bao, Y. Spatiotemporal Changes of Snow Cover and its Response to Climate Changes in the Mongolian Plateau from 2000 to 2017. Chin. J. Grassland. 2020, 2, 95–104. [Google Scholar] [CrossRef]
- La, B.Z.; Ci, Z. Snow Cover Variation and Meteorological Factor Research in Yarlung Zangbo Basin of Tibet from 2002 to 2015. Remote Sens. Technol. Appl. 2018, 33, 508–519. [Google Scholar]
- Zhou, M.; Wang, Y.; Liang, H.; Zeng, T.; Huang, W.; Wang, J.; Huang, X. Comparative analysis of the snow coverage products of Soumi-NPP and MODIS in the Qinghai-Tibet Plateau. J. Glaciol. Geocryol. 2019, 41, 36–44. [Google Scholar]
- Tang, Z.; Wang, J.; Wang, X.; Li, C.; Liang, J.; Peng, H. Extraction and Spatiotemporal Analysis of Snow Covered Days over Tibetan Plateau Based on MODIS Data. MT Res. 2017, 35, 412–419. [Google Scholar]
- Jiang, L.; Xu, W.; Zhang, J.; Wang, G.; Liu, X.; Zhao, S. A dataset for automatically measured snow depth on the Tibetan Plateau (2015—2016). China Sci. Data 2017. [Google Scholar] [CrossRef]
- Jarvis, A.; Reuter, H.I.; Nelson, A.; Guevara, E. Hole-Filled SRTM for the Globe Version 4. Available online: http://srtm.csi.cgiar.org/ (accessed on 18 December 2019).
- Shangguan, W.; Dai, Y. A China soil characteristics dataset. Natl. Tibet. Plateau Data Cent. 2010. [Google Scholar] [CrossRef]
- Shangguan, W.; Dai, Y.; Liu, B.; Ye, A.; Yuan, H. A soil particle-size distribution dataset for regional land and climate modelling in China. Geoderma 2012, 171, 85–91. [Google Scholar] [CrossRef]
- Cawley, G.C.; Talbot, N.L.C. Fast exact leave-one-out cross-validation of sparse least-squares support vector machines. Neural Netw. 2004, 17, 1467–1475. [Google Scholar] [CrossRef] [PubMed]
- Liang, T.; Yang, S.; Feng, Q.; Liu, B.; Zhang, R.; Huang, X.; Xie, H. Multi-factor modeling of above-ground biomass in alpine grassland: A case study in the Three-River Headwaters Region, China. Remote Sens. Environ. 2016, 186, 164–172. [Google Scholar] [CrossRef]
- Durand, M.; Liu, D. The need for prior information in characterizing snow water equivalent from microwave brightness temperatures. Remote Sens. Environ. 2012, 126, 248–257. [Google Scholar] [CrossRef]
- Dong, J.; Walker, J.P.; Houser, P.R. Factors affecting remotely sensed snow water equivalent uncertainty. Remote Sens. Environ. 2005. [Google Scholar] [CrossRef]
- Li, D.; Durand, M.; Margulis, S.A. Potential for hydrologic characterization of deep mountain snowpack via passive microwave remote sensing in the Kern River basin, Sierra Nevada, USA. Remote Sens. Environ. 2012, 125, 34–48. [Google Scholar] [CrossRef]
- Li, H.; Wang, J. Key Research Topics and Their Advances on Modeling Snow Hydrological Processes. J. Glaciol. Geocryol. 2013, 35, 430–437. [Google Scholar]
- Mätzler, C.; Standley, A. Technical note: Relief effects for passive microwave remote sensing. Int. J. Remote Sens. 2000, 21, 2403–2412. [Google Scholar] [CrossRef]
- Smith, T.; Bookhagen, B. Assessing uncertainty and sensor biases in passive microwave data across High Mountain Asia. Remote Sens. Environ. 2016, 181, 174–185. [Google Scholar] [CrossRef]
- Durand, Y.; Giraud, G.; Laternser, M.; Etchevers, P.; Mérindol, L.; Lesaffre, B. Reanalysis of 47 Years of Climate in the French Alps (1958–2005): Climatology and Trends for Snow Cover. J. Appl. Meteorol. Clim. 2009, 48, 2487–2512. [Google Scholar] [CrossRef]
- Lehning, M.; Grünewald, T.; Schirmer, M. Mountain snow distribution governed by an altitudinal gradient and terrain roughness. Geophys. Res. Lett. 2011, 38. [Google Scholar] [CrossRef]
- Grünewald, T.; Bühler, Y.; Lehning, M. Elevation dependency of mountain snow depth. Cryosphere 2014, 8, 2381–2394. [Google Scholar] [CrossRef]
- Sevruk, B. Regional Dependency of Precipitation-Altitude Relationship in The Swiss Alps. Clim. Change 1997, 36, 355–369. [Google Scholar] [CrossRef]
- Guo, Y.; Shi, J.; Du, J.; Fu, X. Evaluation of terrain effect on microwave radiometer measurement and its correction. Int. J. Remote Sens. 2011, 32, 8899–8913. [Google Scholar] [CrossRef]
- Tian, L.; Li, W.; Zhang, Y.; Tian, L.J.; Zhu, Q.; Peng, C.H.; Chen, H. The analysis of snow information from 1979 to 2007 in Qinghai-Tibetan Plateau. Acta Ecol. Sin. 2014, 34, 5974–5983. [Google Scholar]
- Xiaoge, X.; Zhou, T.; Yu, R. Increased Tibetan Plateau snow depth: An indicator of the connection between enhanced winter NAO and late-spring tropospheric cooling over East Asia. Adv. Atmos. Sci. 2010, 27, 788–794. [Google Scholar] [CrossRef]
- Ke, C.-Q.; Yu, T.; Yu, K.; Tang, G.-D.; King, L. Snowfall trends and variability in Qinghai, China. Theor. Appl. Clim. 2009, 98, 251–258. [Google Scholar] [CrossRef]
- Bai, S.; Wu, Q.; Shi, J.; Gu, H. Relationship between the spatial and temporal distribution of snow depth and the terrain over the Tibetan Plateau. Remote Sens. Land Resour. 2015, 27, 171–178. [Google Scholar] [CrossRef]
- Dadic, R.; Mott, R.; Lehning, M.; Burlando, P. Wind influence on snow depth distribution and accumulation over glaciers. J. Geophys. Res. Space Phys. 2010, 115, 115. [Google Scholar] [CrossRef]
- Shao, D.; Li, H.; Wang, J.; Pan, X.; Hao, X. Distinguishing the Role of Wind in Snow Distribution by Utilizing Remote Sensing and Modeling Data: Case Study in the Northeastern Tibetan Plateau. IEEE J. Sel. Top. Appl. Earth Obs. Remote Sens. 2017, 10, 4445–4456. [Google Scholar] [CrossRef]


Publisher’s Note: MDPI stays neutral with regard to jurisdictional claims in published maps and institutional affiliations. |
© 2021 by the authors. Licensee MDPI, Basel, Switzerland. This article is an open access article distributed under the terms and conditions of the Creative Commons Attribution (CC BY) license (http://creativecommons.org/licenses/by/4.0/).