Abstract
Availability of global satellite based Soil Moisture (SM) data has promoted the emergence of many applications in climate studies, agricultural water resource management and hydrology. In this context, validation of the global data set is of substance. Remote sensing measurements which are representative of an area covering 100 m to tens of km rarely match with in situ SM measurements at point scale due to scale difference. In this paper we present the new Indian Cosmic Ray Network (ICON) and compare it’s data with remotely sensed SM at different depths. ICON is the first network in India of the kind. It is operational since 2016 and consist of seven sites equipped with the COSMOS instrument. This instrument is based on the Cosmic Ray Neutron Probe (CRNP) technique which uses non-invasive neutron counts as a measure of soil moisture. It provides in situ measurements over an area with a radius of 150–250 m. This intermediate scale soil moisture is of interest for the validation of satellite SM. We compare the COSMOS derived soil moisture to surface soil moisture (SSM) and root zone soil moisture (RZSM) derived from SMOS, SMAP and GLDAS_Noah. The comparison with surface soil moisture products yield that the SMAP_L4_SSM showed best performance over all the sites with correlation (R) values ranging from 0.76 to 0.90. RZSM on the other hand from all products showed lesser performances. RZSM for GLDAS and SMAP_L4 products show that the results are better for the top layer R = 0.75 to 0.89 and 0.75 to 0.90 respectively than the deeper layers R = 0.26 to 0.92 and 0.6 to 0.8 respectively in all sites in India. The ICON network will be a useful tool for the calibration and validation activities for future SM missions like the NASA-ISRO Synthetic Aperture Radar (NISAR).
1. Introduction
Surface Soil Moisture (SSM) plays an important role in the water cycle and surface energy balance [1], it is as such identified as an Essential Climate Variable (ECV) [2]. The deeper layers Soil Moisture (SM) is a critical variable for the identification of the available water for agricultural activities and natural ecosystems, it is referred to in this context as the Root Zone Soil Moisture (RZSM). The knowledge of SSM and RZSM at both fine (ranging from cm to 100’s of m) and coarse scale (ranging from 100’s of m to tens of km) find their applications in various fields like water resource management [3], flood risk assessment [4], fire risk [5], landslide prediction [6], and vehicle maneuverability [7].
While Thermo-gravimetric technique (oven-drying) and lysometric installation are the two classical direct in situ methods to measure SM, there exist several means to measure soil moisture indirectly. These are either via in situ installations or remote sensing technology [8]. A comprehensive critical review of point-scale methods to measure in situ SM was provided by Su et al. [9]. Their study included: thermogravimetric and calcium carbide test, neutron scattering, gamma attenuation, dielectric techniques (Time Domain Reflectometry-TDR, Frequency Domain Relfectometry-FDR), capacitance probe, electrical impedance, Ground Penetrating Radar (GPR), electrical resistivity, heat pulse, MEMS (Microelectromechanical systems), tensiometer and optical reflectance techniques. They concluded that while none of the techniques fully covers all the requirements, the most reliable and commonly employed local SM measurement techniques are dielectric based. These sensors like the Theta Probe (Delta-T Instruments, UK) or the Stevens Hydra Probe link the electromagnetic propagation of the signal in the soil to the soil water content.
More recently there is the development of novel in situ techniques to estimate soil moisture locally but at a impact area of 10 to 250 m radius. These techniques include GNSS-R [10], L-Band UAV radiometers [11], and Cosmic Ray Neutron Probe (CRNP) [12]. Focal to this paper, are the CRNP which measures the reflected neutrons above ground which is then correlated to soil moisture. The instrument is called COSMOS (COsmic ray Soil Moisture Observation System) [12,13]. COSMOS is providing intermediate scale average soil moisture (250 m radius) [12] which vary spatial between 150–250 m radius [14] weakly dependent on SM and 0.3–0.7 m depth strongly dependent on SM. While CRNP has the advantage of being non-invasive it is still impacted by biomass, mineral content in the soil, organic matter, intercepted water and water in the litter. However, using temporal analysis these impacts can be subtracted from the signal in order to retrieve the SM [13]. Baatz et al. [15] developed an empirical formula to calculate the neutron counts for dynamically changing biomass to apply correction for COSMOS retrieved SM.
Many SM validation networks were developed across the globe for validation purpose (AMBHAS-Assimilation of Multi-satellite data at Berambadi watershed for Hydrology And land Surface experiment, NAFE-The National Airborne Field Experiment, SMAPEX-Soil Moisture Active Passive Experiment, SGP-The Southern Great Plains). Other international networks like the FLUXNET and the Integrated Carbon Obervation System (ICOS) include SM measurements and contribute to the validation efforts. The International Soil Moisture Network (ISMN) collects, consolidate and distributes the data from several of these networks [16]. The aforementioned, in situ soil moisture observation are used for crop water need at plot scale and for enhancing the understanding of local vadose zone hydrology, to determine spatial soil moisture at large scales. Their main application for large scale is the validation of spatially distributed SM estimates from remote sensing [17,18].
SM measurements with moderate to good temporal resolution (<3 days) and at coarse scale (>40 km resolution) can be measured using microwave remote sensing preferably in microwave frequencies. Several operational satellite missions provide global surface soil moisture products, such as: the Soil Moisture and Ocean Salinity (SMOS) [19], the Soil Moisture Active Passive (SMAP) [20], the METOP—A/B Advanced Scatterometer (ASCAT) [21], and the Advanced Microwave Scanning Radiometer 2 (AMSR2) [22]. Literature highlights that the L-Band based products perform better over India when compared with in situ point measurements [23,24,25]. It is useful to add that the prediction of SM provided by Land Surface Models (LSM) with or without assimilation of SM Earth Observation (EO) datasets. Attada et al. [26] highlighted the use of coupled LSM and atmospheric models for the assessment of Indian summer monsoon and determines several factors affecting the estimates of soil moisture like vegetation, soil properties and irrigation practiced in the agricultural site. In these conditions, in situ data becomes very critical to assess the reliability of the models.
Many studies show comparison and validation of satellite SM to the in situ observations for long time series and a variety of sites. SMEX02 [27] and SMEX03 [28] campaigns were used to validate AMSR—E, X and C—band soil moisture. SMOS validation is done over Continental US [29], Australia [30], Europe [31] and China [32], globally [33] to name a few. Colliander et al. [34] presented an overview of the SMAP validation sites across the globe. Suman et al. [25] have compared SMAP—L4 product to in situ observations using data from international soil moisture network (ISMN) and showed the usefulness of the data. Chakravorty et al. [24] showed SMOS—D has less error than SMOS—A over India using triple collocation approach with LSM results.
A common critical issue that arises in these validation exercises is the consideration of the scale mismatch between in situ measurements and EO datasets [17,25,29]. Most of the satellite soil moisture are validated using point-scale in situ measurements while the EO estimates are representative of an area from several squared m to several squared km [35]. In fact, using point-scale sensors it is difficult to measure long temporal data with regular tillage in agricultural plots and in such situations the sensors will be placed away from the agricultural field and the soil moisture measurements become approximate [36]. This raised the interest in the Cosmic Ray Neutron Probe (CRNP) observations as it extends the SM measurements to several 100 of meters. Evans et al., [1] used the COSMOS data for evaluating JULES (Joint UK Land Environment Simulator) model results in UK. Kedzior [37] using CRNP data to compare SMOS_L3 and the Global Land Data Assimilation System (GLDAS) data in triple collocation framework found that SMOS and CRNP has correlation of 0.59. Kim [38] evaluated AMSR2 data using COSMOS data. Montzka et al. [36] have compared AMSR2, ASCAT, SMAP, SMOS and GLDAS data with in situ SM using CRNP over 6 catchments which includes one catchment Singanallur in India and using triple collocation shows that the SMAP product has less error compared to others. Although global products are available, few in situ moisture networks are available for validation purposes in India [23,24,25,36,39].
In this paper we present the Indian COSMOS Network (ICON) implemented in the context of a collaboration between UKCEH (UK Centre for Ecology and Hydrology) and several Indian institutes namely the Indian Institute of Science-Bangalore (3 sites), the Indian Institute of Technology-Kanpur, the Indian Institute of Tropical Meteorology-Pune, the National Institute of Hydrology-Roorkee and the University of Agricultural Science-Dharwad.
The aim of this paper is to present the ICON network and provide a comparison between the ICON SM versus SSM and RZSM delivered from the SMOS, SMAP, and GLDAS from 2016 up to 2020. The paper thus investigates whether the COSMOS sensors are more representative of the surface SM or deeper layers. The performances are analysed with respect to soil properties and climate. The paper is structured as follows. First the ICON network and the Soil moisture data sets for SM and RZSM are introduced. Second, the SM retrieval from COSMOS and the evaluation metrics are detailed. Third the results and discussion are presented for each site and then a cross the sites with a focus on the impact of soil depth, climate and soil properties. The paper ends with the conclusions and recommendations.
2. Description of ICON
COSMOS is based on CRNP theoretical basis which is discussed in detail in [12]. In brief, the origin of primary cosmic rays used in CRNP can be either from galactic or solar sources. But the cosmic rays from galactic origin have higher energy and both produce neutrons from cascading particle interactions and collisions in the Earth’s atmosphere. Thus, a source of naturally occurring fast neutrons is generated by the cosmic rays. Fast neutrons are scattered (losing energy and becoming thermalized) as a result of collision of particles in the atmosphere and at the ground level. These fast neutrons are very efficiently scattered by the hydrogen atoms present. In the soil, a major part of hydrogen atoms present is in the form of soil water and hence the SM changes are inversely related to the intensity of fast neutrons, measured by the CRNP close to the ground surface [12].
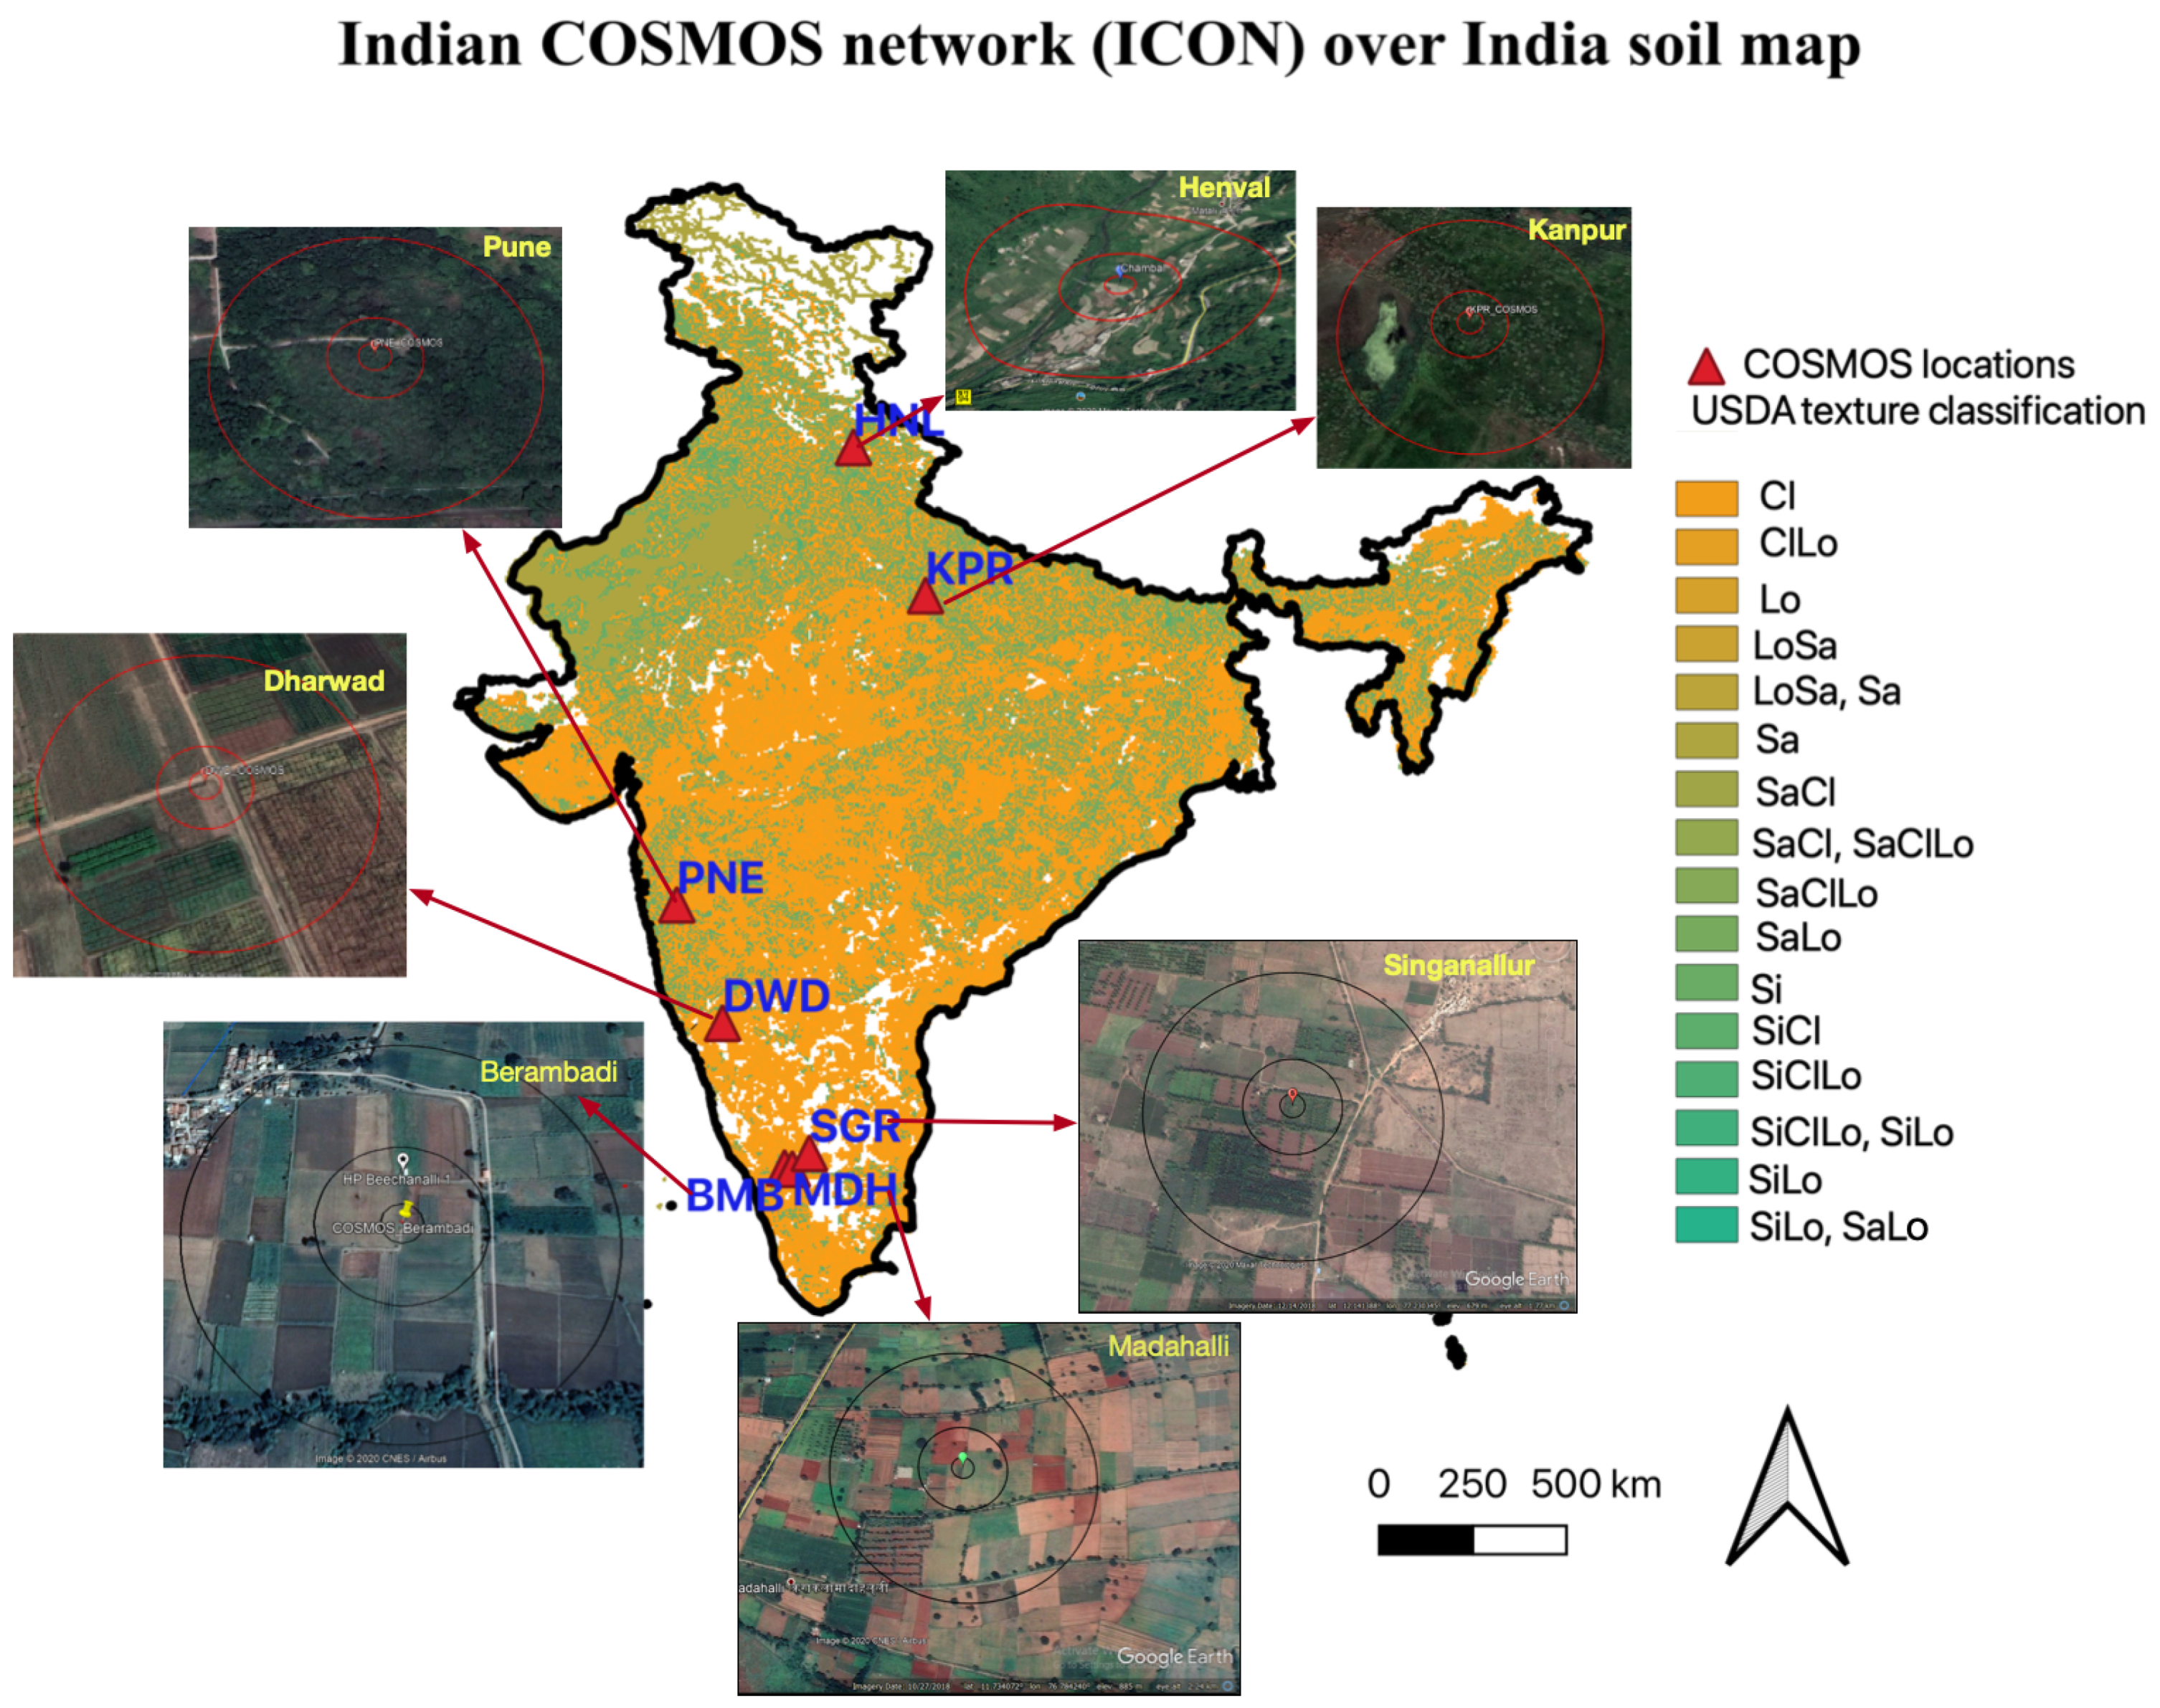
The ICON consists of 7 stations installed across India (see Figure 1). Each station is equipped with a COSMOS instrument that uses CRNP to sense SM over an area of approximately 20 hectares (0.2 km). SM data is produced at a 15 min temporal frequency and data is made available on daily time scale. The location of all the seven sites are indicated in Figure 1 with the associated Google Earth aerial photography. Sites cover latitudes 11 N to 30 N and excludes the extreme East and west of India. The location details and identifications of the stations are mentioned in Table 1. The climate and soil characteristics of the sites are presented in Table 2. The table shows the diversity of the regions covered by the network. The access to the details and resources are provided in the web portal https://cosmos-india.org/. Below, a detailed description of the COSMOS sites is presented.
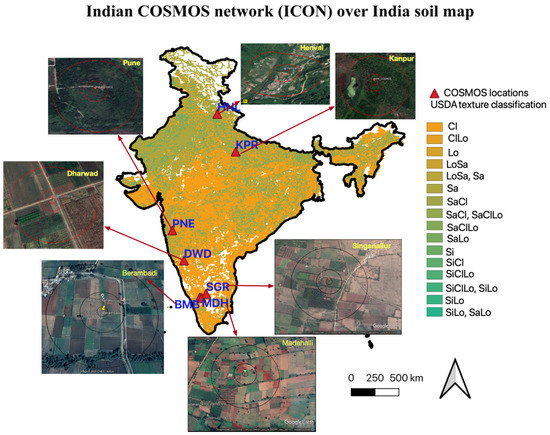
Figure 1.
Location of the Indian COSMOS Network (ICON) sites. Indian Map is overlayed with the soil texture map of India (NRSC) where Cl-Clay, Lo-Loam, Sa-Sand, Si-Silt. Photos show the precise location inside the google-earth maps with a 50 m and 200 m impact area.

Table 1.
Location of the COSMOS sensors across India.

Table 2.
Characteristics of ICON sites in terms of Climate, Soil properties, and land cover.
- Berambadi-BMB: The Berambadi watershed (89 km) is located in the Gundlupet taluk, Chamrajanagara district of Karnataka in South India and belongs to Kabini critical zone observatory. The Kabini Critical Zone Observatory is monitored under the project AMBHAS. The catchment has been instrumented as a Calibration and Validation (CAL/VAL) site for various satellite missions like SMOS and RISAT-1 under AMBHAS [40]. The climate in the catchment is sub-humid with annual precipitation of 800 mm and annual potential evapo-transpiration of 1539 mm based on MOD16 (MODIS global evapotranspiration data). The Köppen Climate Classification is “Aw”: Tropical Savanna climate. The soil type in the catchment comprises of red soil to black soil near valley. The major soil types in the region include sandy clay loam, sandy loam and sandy clay (see Figure 1). Average farm size in the catchment is about 1.2 hectares [40] and about 60% of land is under ground water irrigation and 40% is rain fed. The major crops in the catchment are turmeric, sunflower, maize, marigold and vegetables. The main crop in the catchment is grown during Kharif season (May to September). Rabi crop (October to December) and summer crop (January to April) is practiced in case if the farmer has access to irrigation [41]. Site is equipped with flux towers at 10 m height. Weather parameters like global radiation, wind speed, relative humidity and rainfall are monitored in the tower. SM (Stevens Hydra Probe and COSMOS), ground water fluctuation and crop dynamics (LAI and crop type) are monitored in the site.
- Madahalli-MDH: Madahalli microwatershed is located in Gundlupet taluk of Chamrajanagara district close to the BMB site. It is an agricultural area. The climate in the region is semi-arid and the annual precipitation is about 734 mm and annual PET is 1530 mm (MOD16). The major crop in the area include ragi, sunflower, red gram, maize and vegetables. Groundwater irrigation is practiced in the catchment. The Köppen Climate Classification is “Aw”. The weather variables are measured using flux tower. SM at point scale is monitored using Stevens Hydra Probe and at field scale is monitored using COSMOS sensor. Crop monitoring and ground water level monitoring is also carried out in the sites.
- Singanallur-SGR: Singanallur watershed is located in Kollegala Taluk of Chamarajanagara district in the southern part of Karnataka state. The annual rainfall in the area is found to be 780 mm. The potential evapotranspiration in the region is 1476 mm based on MOD16 data. It is an agricultural area. The major crops grown in the region are vegetables, sunflower, ragi and maize [42]. The Köppen Climate Classification is “Aw”: Tropical Savanna climate. Weather variables, crop monitoring and ground water level monitoring is carried out. SM is monitored using Stevens Hydra Probe and COSMOS.
- Dharwad-DWD: Dharwad is situated in northern part of Karnataka state which is in south Indian region with annual rainfall of about 761 mm and min temp 20 °C and max temperature being 35 °C. The potential evapotranspiration in the region 1639 mm (MOD16). The major soil type in the region is vertisol. The area is under University of Agricultural Science (UAS) Dharwad, and is mainly used for scientific studies in the agricultural sector. The major crops grown in the area are cotton, jowar, maize, wheat, rice etc. Surface water irrigation is practiced in the region (District Irrigation Plan). The Köppen Climate Classification is “Bsh”: Hot semi-arid climate. Weather variables are collected in the site.
- Pune-PNE: Pune is located in the central part of India in Maharashtra state. COSMOS is located inside the campus of Indian Institute of Tropical Meteorology (IITM) and is mostly covered by vegetation with sparse trees (see Figure 1). The major soil type in the area is sandy clay loam. The annual average rainfall is about 650 mm. The potential evapotranspiration in the region 1699 mm (MOD16). The Köppen Climate Classification is “Am”: Tropical monsoon climate. The site belongs to Indian Institute of Tropical Meteorology, Pune and is majorly used for scientific research. The COSMOS sensor is located in the middle of natural vegetation with shrubs and some small trees to around 4 to 6 m height. The field SM monitored using COSMOS.
- Kanpur-KPR: Kanpur is located in northern part of India in Uttar pradesh state with average annual rainfall of 650 mm. The soil type in the region is fluvisol (silty loam) [43]. The potential evapotranspiration in the region 1700 mm (MOD16). The Köppen Climate Classification is “Cwa”: Humid subtropical climate. COSMOS is located in an agricultural area maintained by Indian Institute of Technology, Kanpur which is majorly used for scientific purposes. The site is in an area with sparse trees adjacent to agricultural plots, and at 2 km to dense urban areas. Weather variables in the site are collected using flux station.
- Henval-HNL: Henval Valley is located near Chamba town in the Uttarakhand state in northern India with minimum temperature of 1.1 °C and max temperature of 32.9 °C. The site is situated on the banks of Henval river. The major soil types in the region are sandy loam, loam and sandy clay loam. Annual average rainfall is about 1120 mm. The potential evapotranspiration in the region 1791 mm (MOD16). Irrigation in the region is either done by tapping spring water or by using surface water.The Köppen Climate Classification is “Cwa”: Humid subtropical climate.
3. Spatial Soil Moisture Datasets
3.1. Satellite Data
Remote sensing data can be either passive or active based on whether the satellite instrument measures naturally emitted electromagnetic radiation from the Earth or its atmosphere, or whether the satellite instrument sends out a beam of radiation and detects its backscatter. In the present work passive remote sensing data has been used. The soil moisture analysis is done at both microwave and optical wavelengths of electro magnetic spectrum. Optical wavelengths are obstructed by cloud cover and hence only microwave wavelength is used in the current study. The naturally emitted radiation from Earth’s surface and overlying atmosphere is a complex function of the microwave radiative properties of the emitting body [44]. In passive microwave methods, the thermal emission of land surface is measured as brightness temperature (TB) at microwave wavelengths, using a radiometer and can be described as a simple function of the physical temperature of the emitting body and the emissivity of the body. The brightness temperature received at the sensor depends on many factors such as surface roughness, vegetation and relative permittivity (dielectric constant) related to soil texture [45]. Longer wavelengths can penetrate deeper and can also penetrate vegetation [46]. In the literature studies already show how SMOS and SMAP are showing promising data sets over India [23,24] and hence in the current study these two passive microwave remote sensing satellites are used and are explained in this section. Thus in our study we wanted to examine how SM from COSMOS is comparing with respect to satellite soil moisture and land surface model mentioned in the table (see Table 3).

Table 3.
Description of satellite products and LSM data used in the study for surface SM comparison.
3.1.1. Soil Moisture and Ocean Salinity Satellite (SMOS) Data
The Soil Moisture and Ocean Salinity (SMOS) mission, launched in November 2009 is a joint earth explorer mission of ESA (European Space Agency), Centre National d’Etudes Spatiales (CNES) and Centro para el Desarrollo Tecnologico Industrial. It is the first space borne mission dedicated to soil moisture mapping. SMOS retrieves soil moisture and vegetation optical depth () simultaneously using multi-angular full-polarization observation from an L-band 2D interferometric radiometer. The nominal spatial resolution of SMOS is 40 km with a revisit of 3 d at the equator (see Table 3). The SMOS SM retrieval algorithm assumes default values for certain units of target (default contribution) and estimates the state of the soil moisture dependent unit surfaces by minimizing the difference between the observed and modeled signal derived from the last best guess [47]. SMOS data over India is impacted by Radio Frequency Interference (RFI) at variable levels. In this study, SM was extracted from the SMOS_L2 UDP SM product version 650. A threshold of 0.5 for RFI— probability and 0.5 of goodness of fit Chi—prob was used to filter the data. The data can be downloaded from website https://smos-diss.eo.esa.int/oads/access/. Apart from SMOS_L2, SMOS_L4 RZSM product was also used in the study for comparison. SMOS_L4 which is obtained from SMOS surface soil moisture with complementary information from soil texture, MODIS LAI, and the European Center Medium Weather Forcast ECMWF center weather data [48]. The product consist of daily global root zone soil moisture over the EASEV2 25 km Cylindrical grid. It is representative of 0 to 1 m soil depth. The data can be downloaded from website https://www.catds.fr/Products/Products-access/.
3.1.2. Soil Moisture Active Passive (SMAP) Data
The Soil Moisture Active Passive (SMAP) mission is the first Earth observation satellite dedicated to SM developed by the United States National Aeronautics and Space Administration (NASA). It was launched in January 2015. SMAP mission provides high resolution soil moisture data and freeze/thaw state globally every 2–3 days with 3, 9, and 36 km resolution (see Table 3). SMAP supposed to operates in both active and passive modes, as the payload included a radar and a radiometer, both operating at L-band (at incidence angle = 40°) but the radar stopped acquisition after 3 month of the mission. SMAP radiometer is equipped with a spectral filtering which can mitigate for the impact of low to mild RFI sources. The spatial resolution of the radiometer is ≈39 km × 47 km. The main input to the SM retrieval algorithm are the time-ordered, geo—located, calibrated brightness temperatures at top of atmosphere. In addition to TB observations, the algorithm uses ancillary data sets for the SM retrieval. These include surface temperature, opacity of vegetation, vegetation scattering albedo, roughness, soil texture, data flags for identification of land cover. Both ascending orbit and descending orbit data are now available [49]. In this study, SMAP_L3_SM, version 6.0 from ascending and descending orbits are evaluated over experimental sites. In addition, the SMAP_L4_SSM and SMAP_L4_RZSM [50] which are based on data assimilation into a GEOS Catchment Land Surface and Microwave Radiative Transfer Model are used in the comparison. The SMAP data can be downloaded from website https://smap.jpl.nasa.gov/data/.
3.2. Land Surface Model
Global Land Data Assimilation System (GLDAS) is generating optimal fields of land surface states and fluxes, by combining satellite and ground based observational data products using advanced land surface modeling and data assimilation techniques [51]. The forcing into the models are from Princeton meteorological forcing input data and provides data from 2000 till present. In the current study, GLDAS_Noah version 2.1 products were downloaded from the NASA EARTHDATA webportal. The product is off-line (i.e., not coupled to the weather model) and it is a gridded 1D model (vertical fluxes only). GLDAS 2.1 includes three LSM: Noah-3.6, Community Land model(CLM-F2.5) and Variable Infiltration Capacity (VIC-4.1.2). The Noah-3.6 selected for this study, provides a full set of hydro-meteorological data including SM at 3 h time intervals over a regular grid at 0.25 spatial resolution (see Table 3). The model gives output in four soil layers, 0–10 cm, 10–40 cm, 40–100 cm and 100–200 cm. In this study, all layers were considered for the COSMOS data comparison separately and no further filtering is applied to the dataset. The data can be downloaded from website https://ldas.gsfc.nasa.gov/gldas/.
4. Methodology
4.1. Calibration of the COSMOS
The calibration of the soil moisture estimation from COSMOS is done using the calibration function proposed by [52].
where is volumetric water content (m/m), is ref count rate over dry soil, , , are fitting parameters, is dry bulk density of soil in (g/cm), is the density of liquid water (≈1 g/cm), and is the neutron count rate corrected for humidity at the time of measurement.
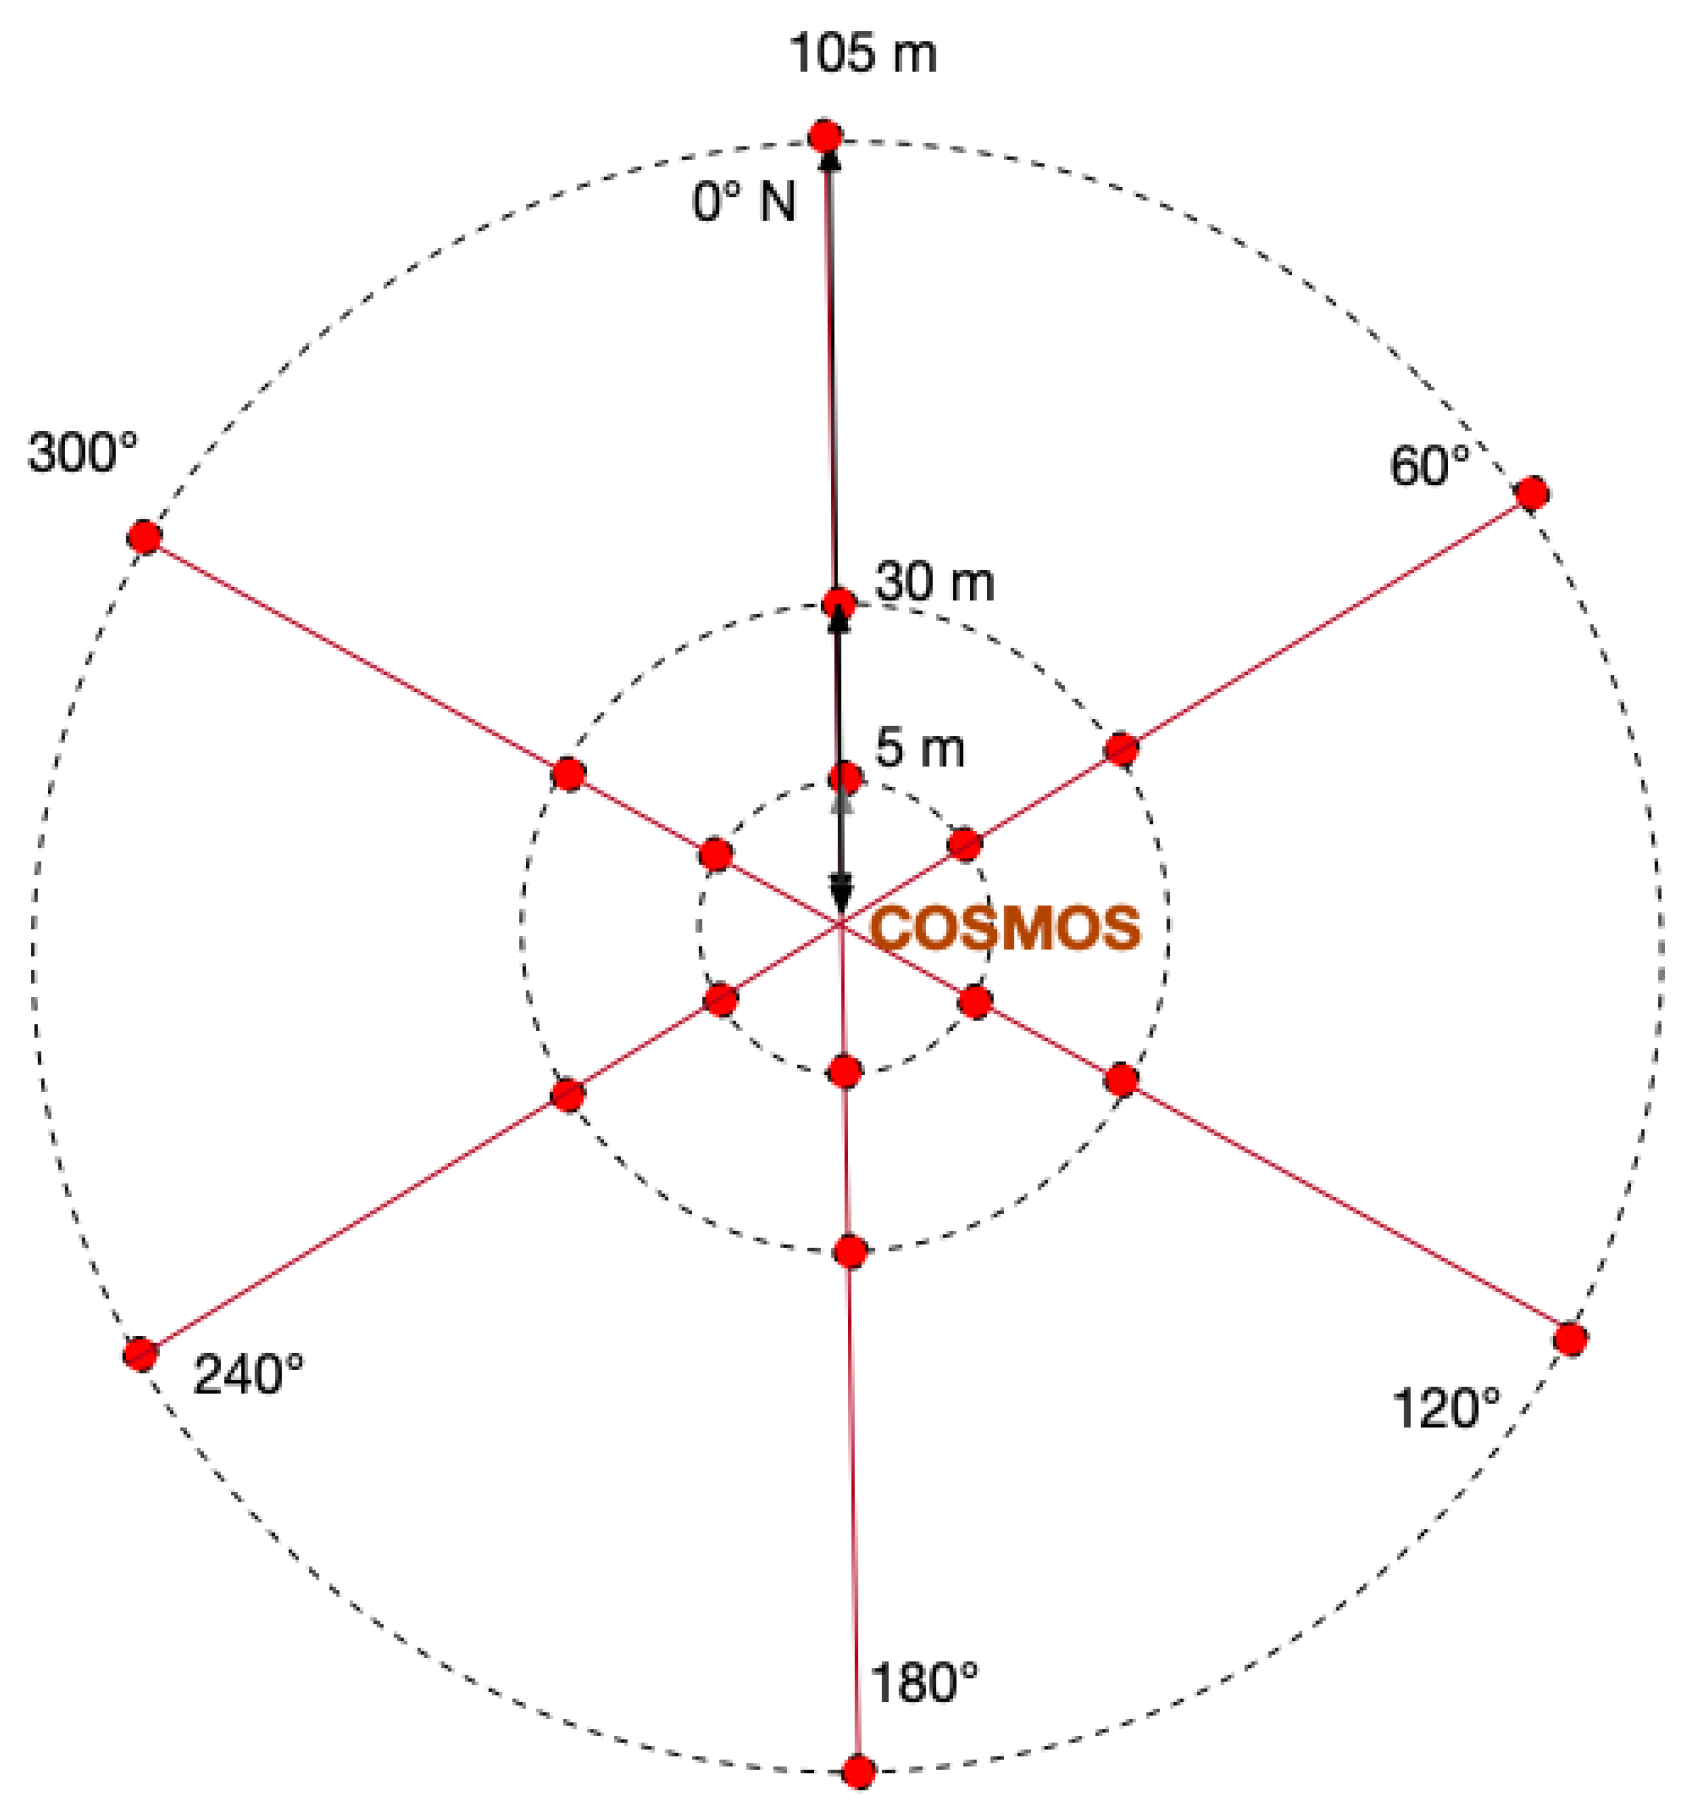
is calibrated for every site by taking in situ SM at the time of measurement of neutron intensity. At each site 3 circles were marked with radius of 5 m, 30 m and 105 m (see Figure 2) from the location of sensor. In each circle 6 sampling points were marked at equal distances to each other. At each point (total 18 points) 6 sampling depths considered at 5 cm distance. Thus making it total of 108 samples per site for calibration. These are calibrated against value over dry soil. The fast neutron counts were corrected for humidity. The processing of the data collected from site was done at Centre for Ecology and Hydrology (CEH) in UK following procedure given in [12]. All retrieved values that corresponded to non-physical values (SM > Saturation capacity of the soil) were filtered out. This mainly occur during very wet conditions. The processed data (Supplementary Material Figures 1.1 to Figure 1.7) is analysed in this study. The SM data acquired from the above mentioned sources were tested at seven different locations across India in this paper.
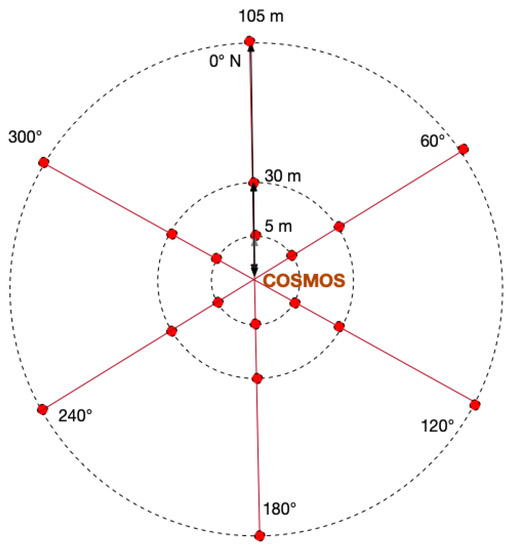
Figure 2.
Soil sample strategy for the calibration of the COSMOS sensors. Sampling locations are marked with red circles.
4.2. Evaluation Metrics
Validation of the data between observed and product is commonly carried out using metrics like RMSE (Root Mean Squared Error), Pearson’s correlation coefficient (R), bias and unbiased RMSE (ubRMSE) [20,25,53]. The same set of metrics were considered in this study.
- RMSE: Root Mean Squared Errorwhere, E[.] is expectation operator. is the SM from spatial products, and is ICON-COSMOS soil moisture.
- R: Pearson’s correlation coefficientwhere and are variances of time series of and respectively.
- Bias
- ubRMSE: Unbiased RMSE
5. Results
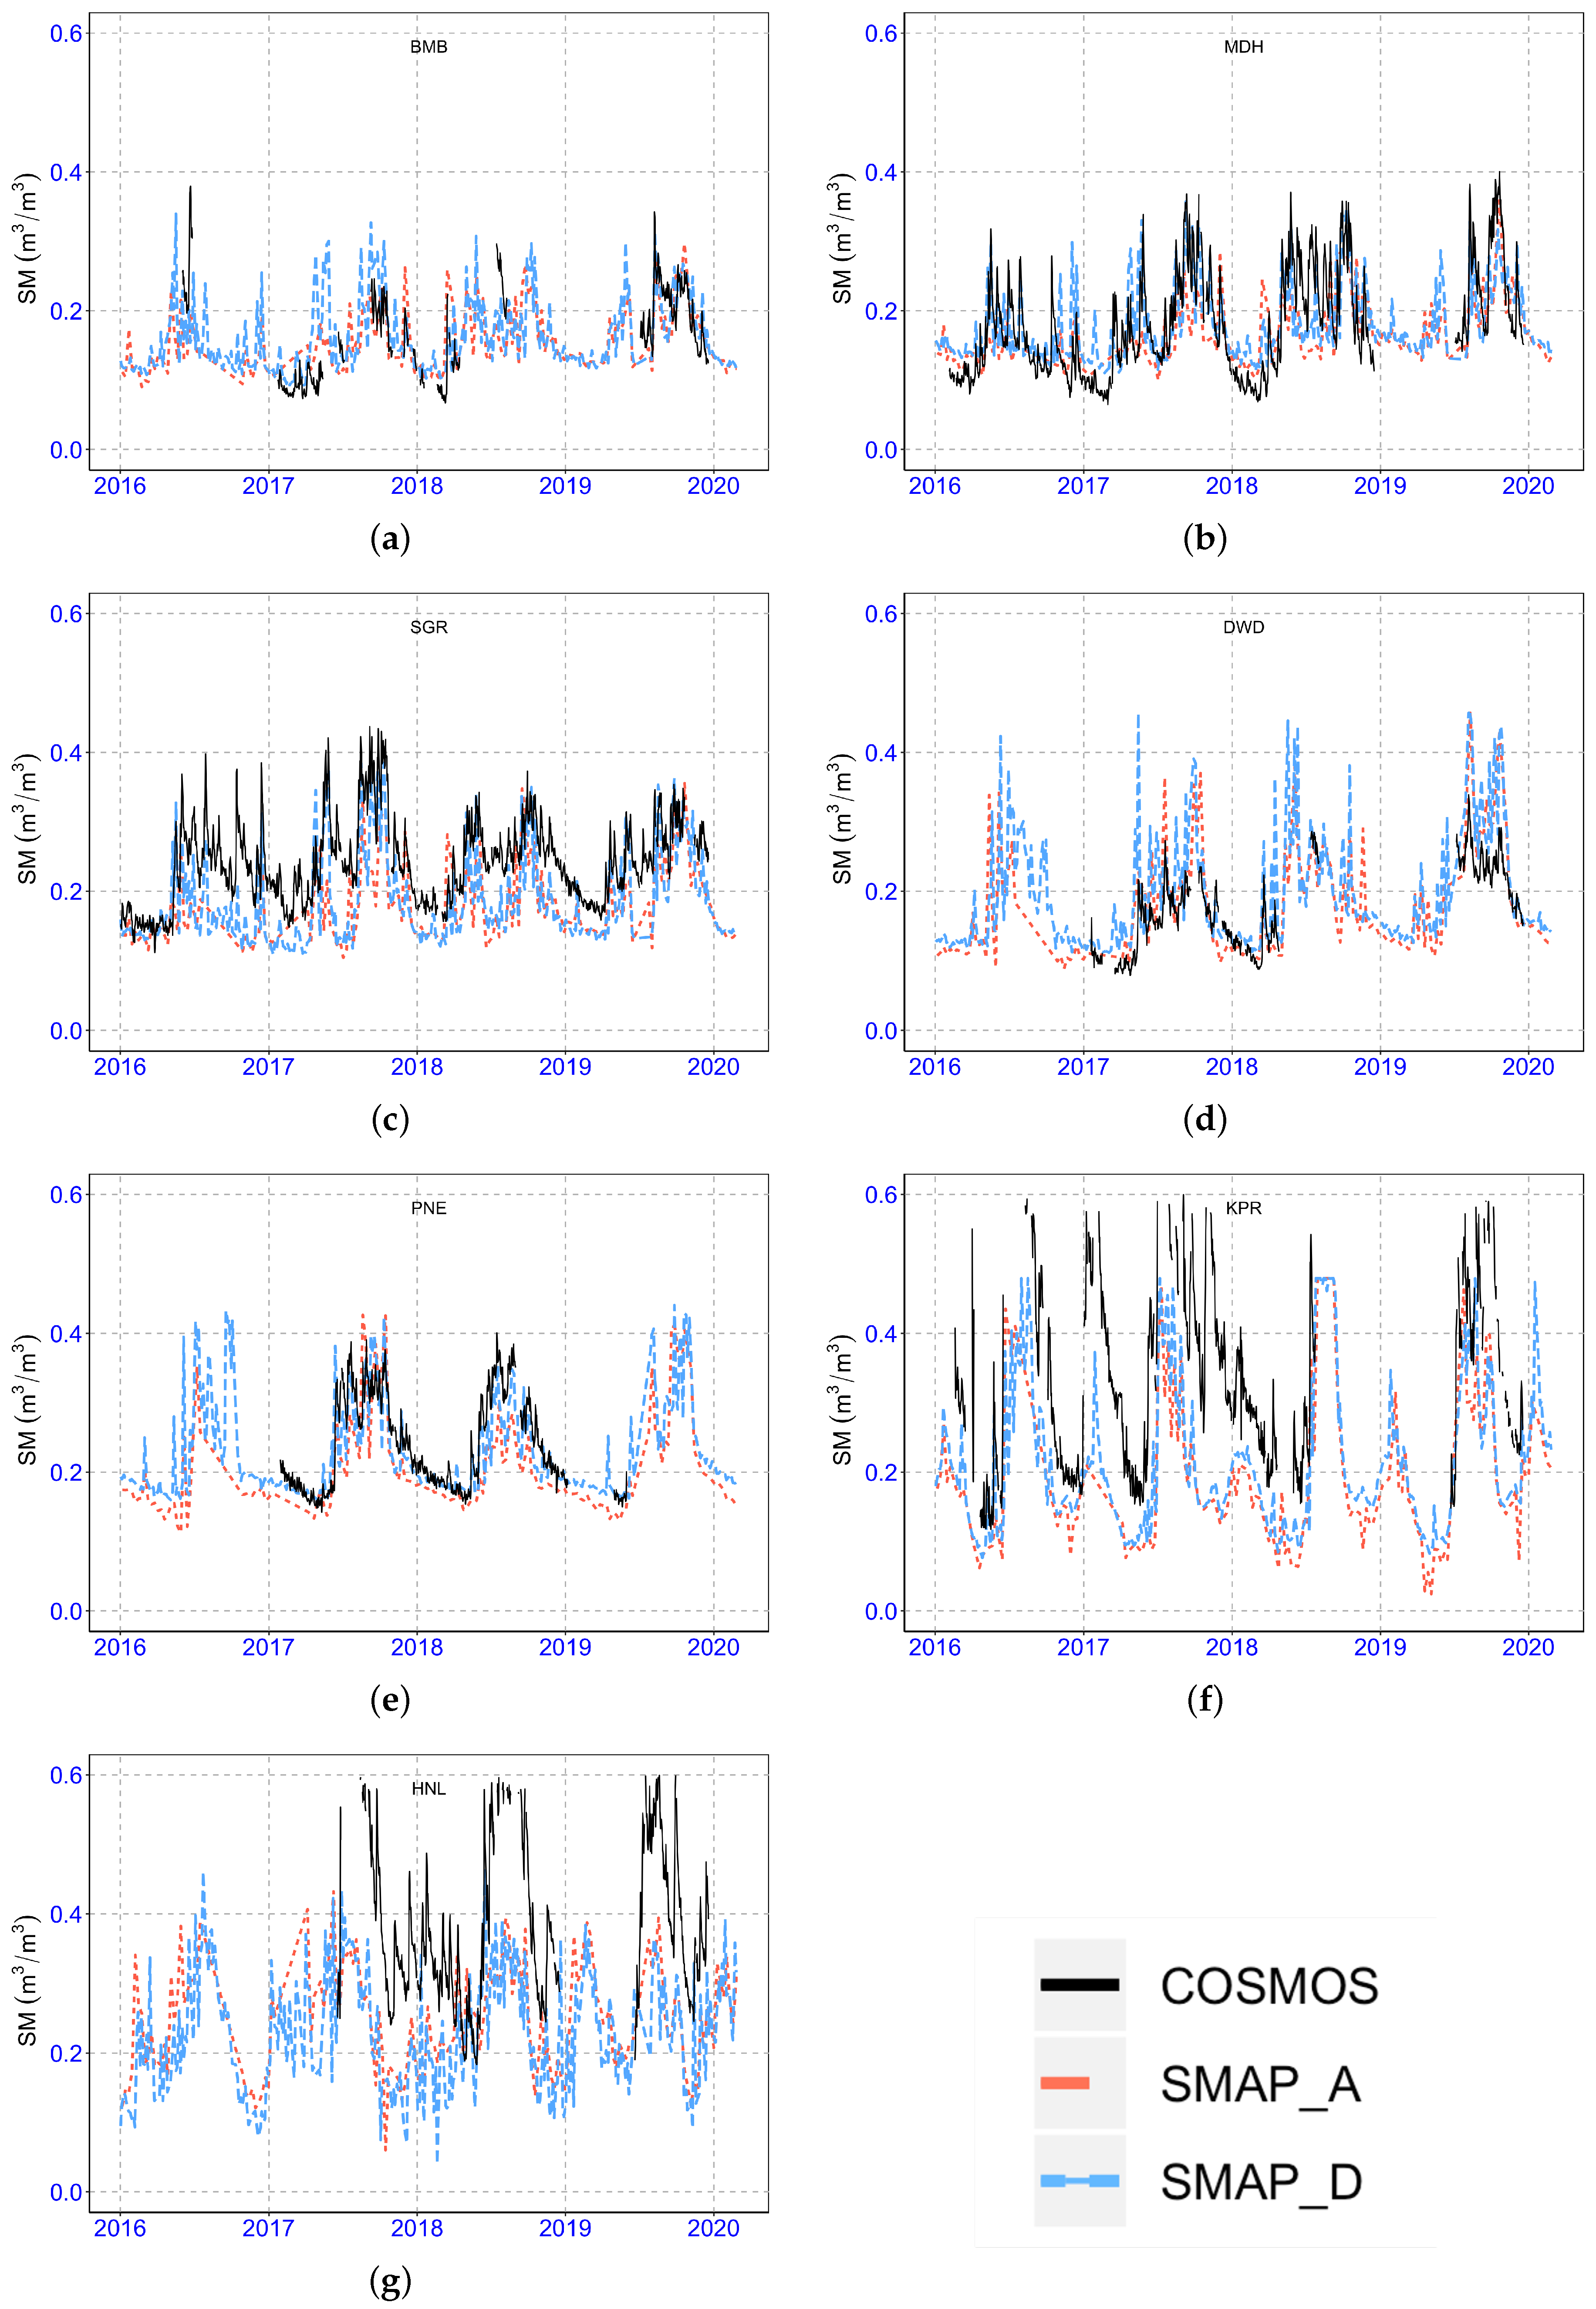
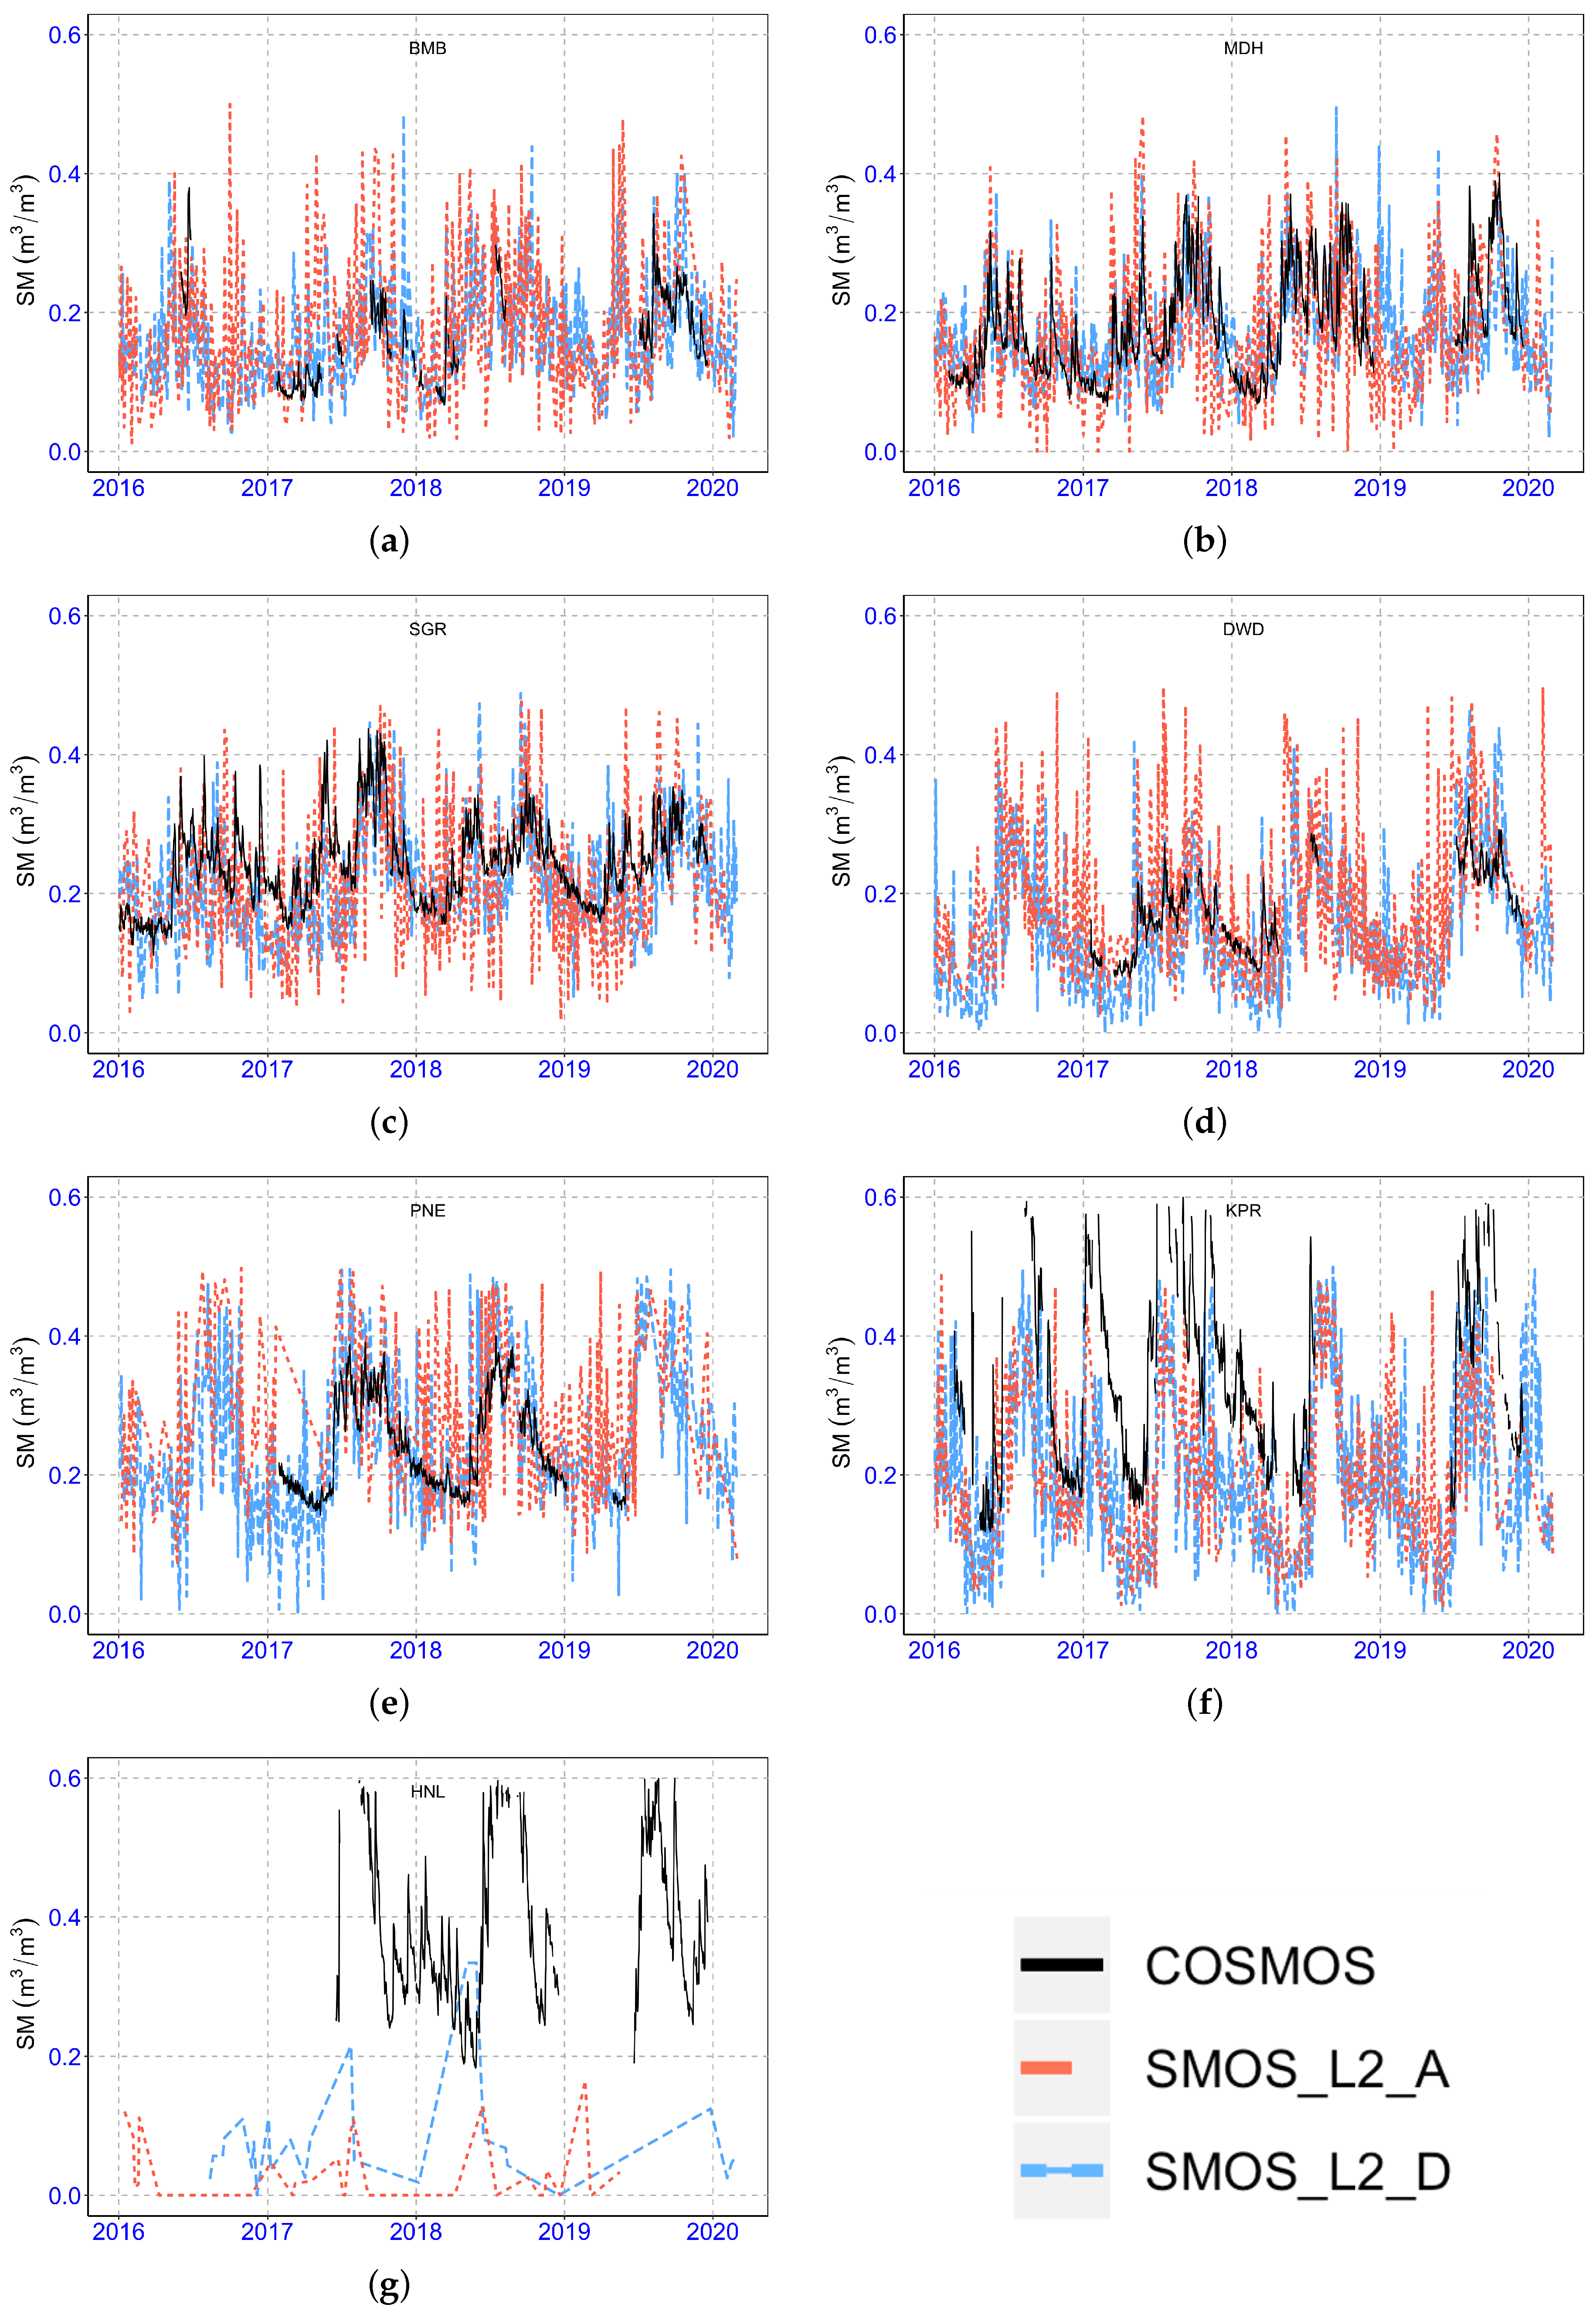
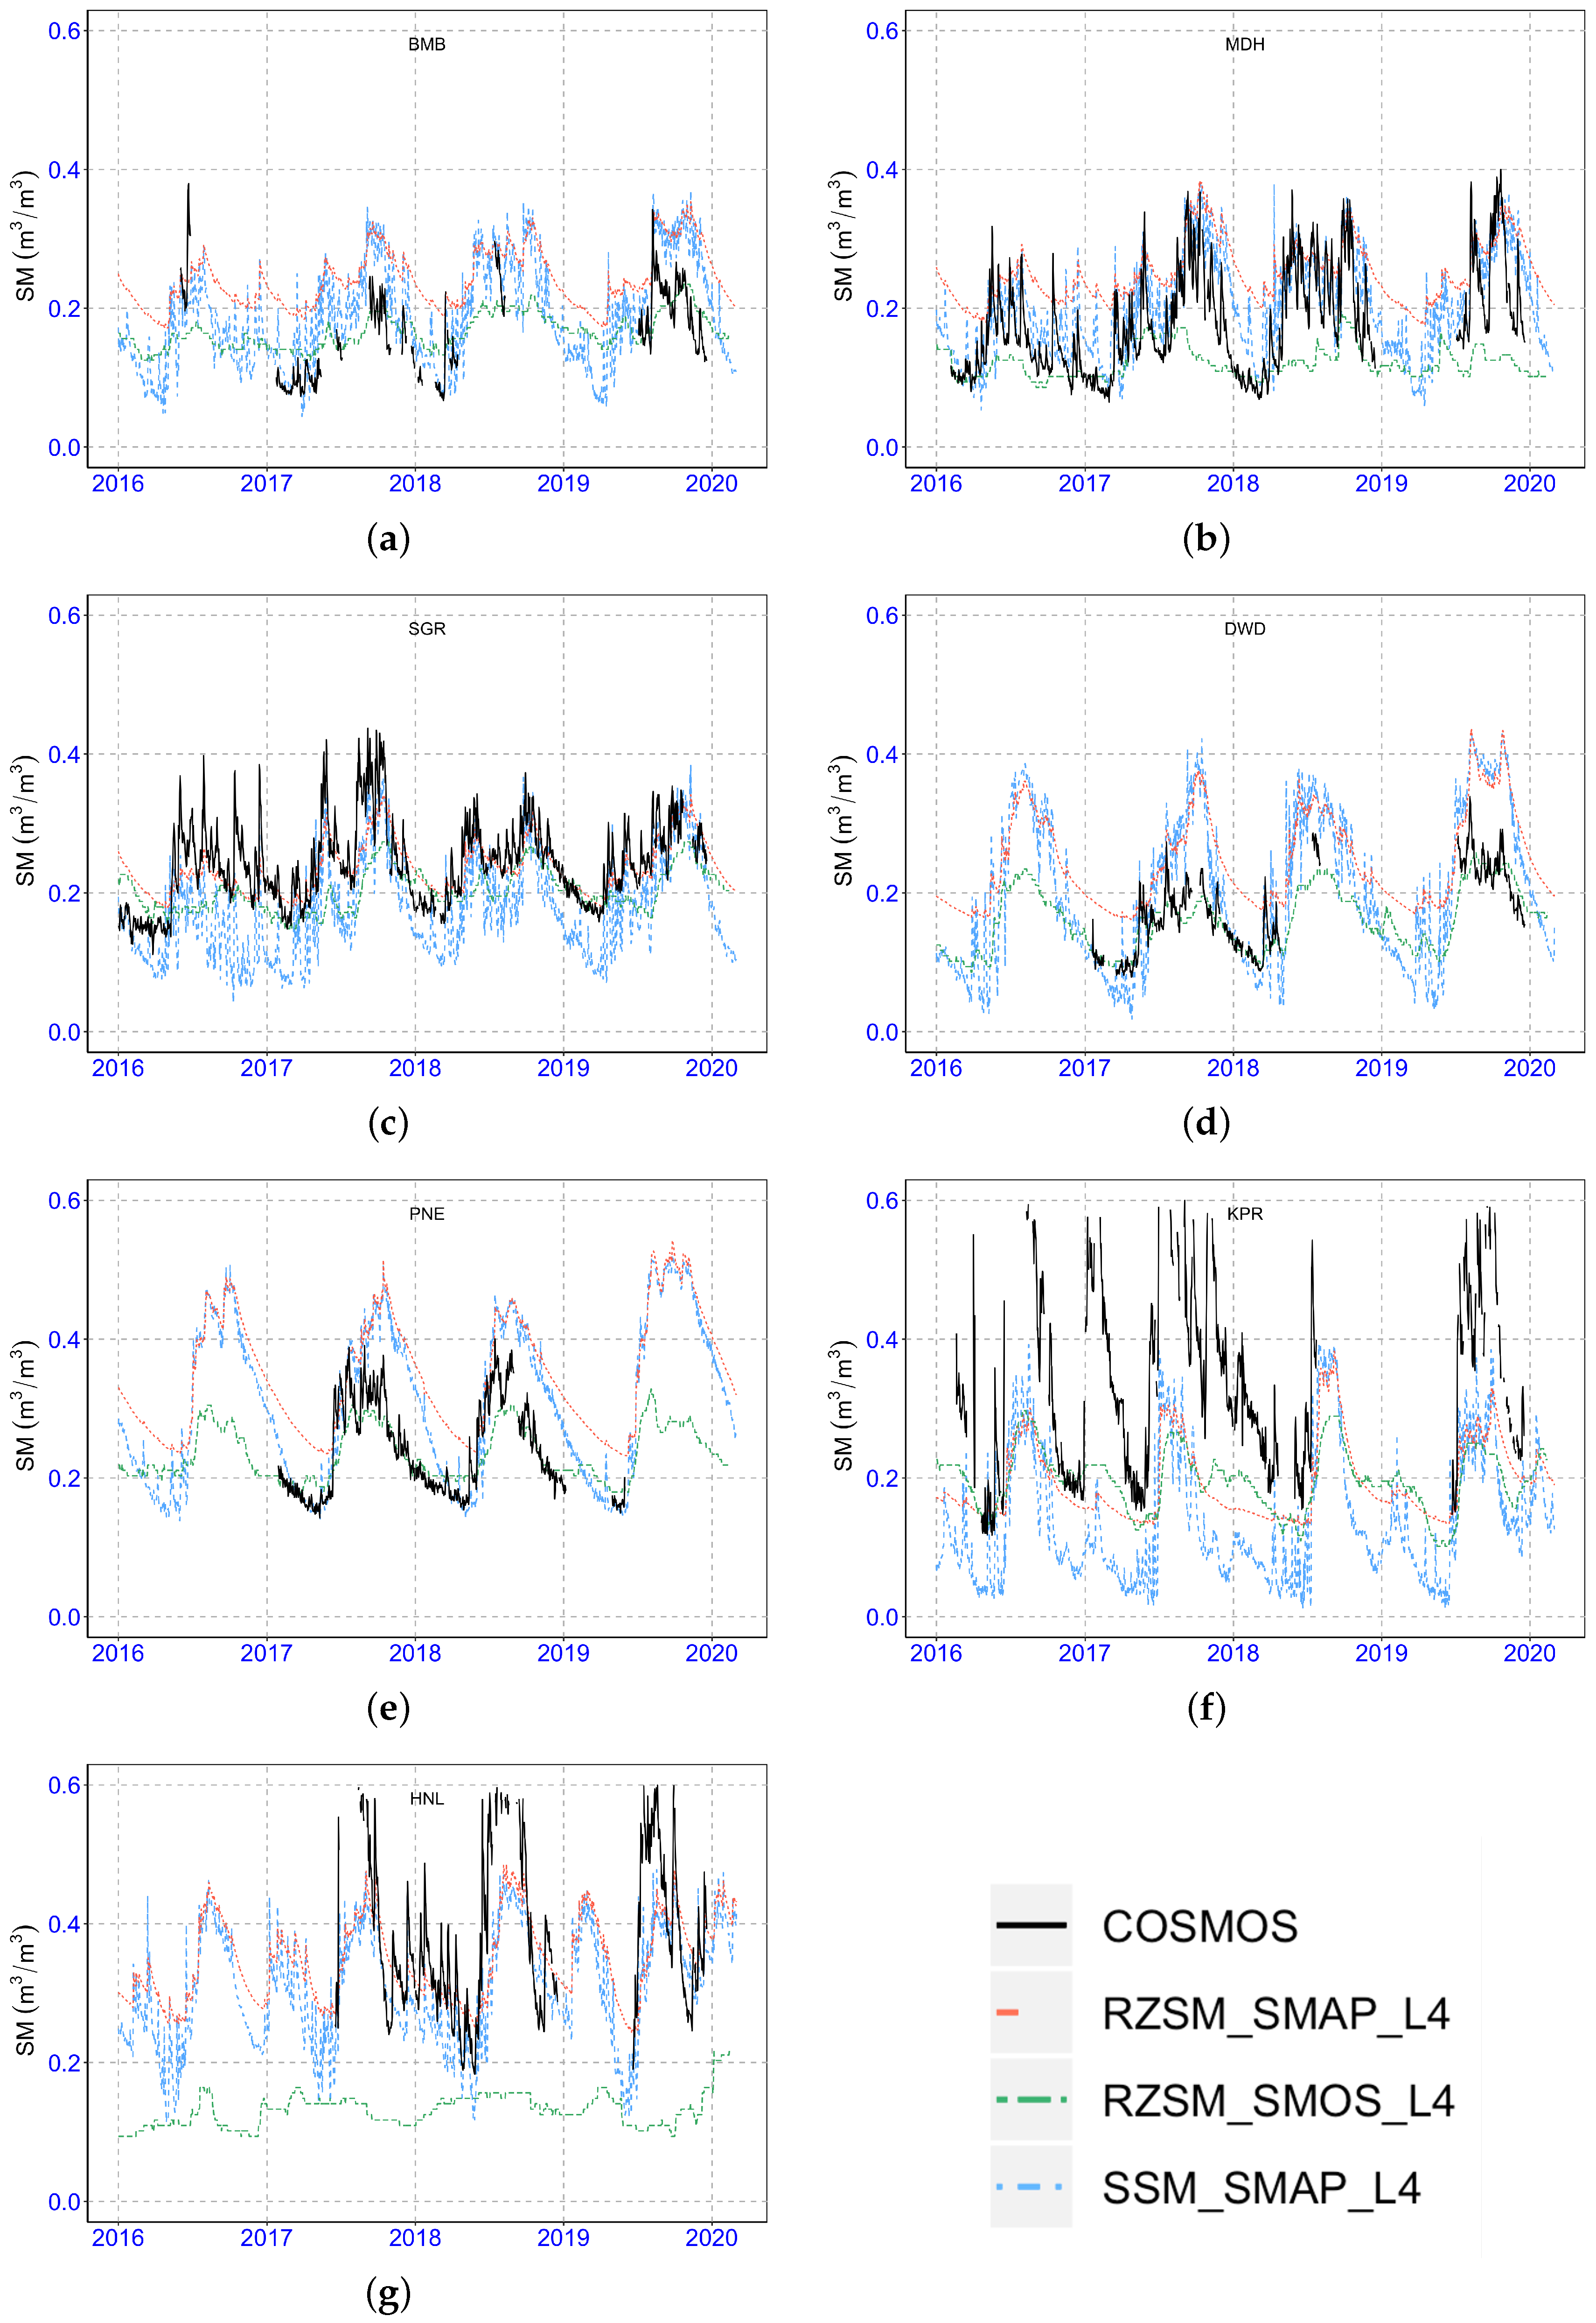
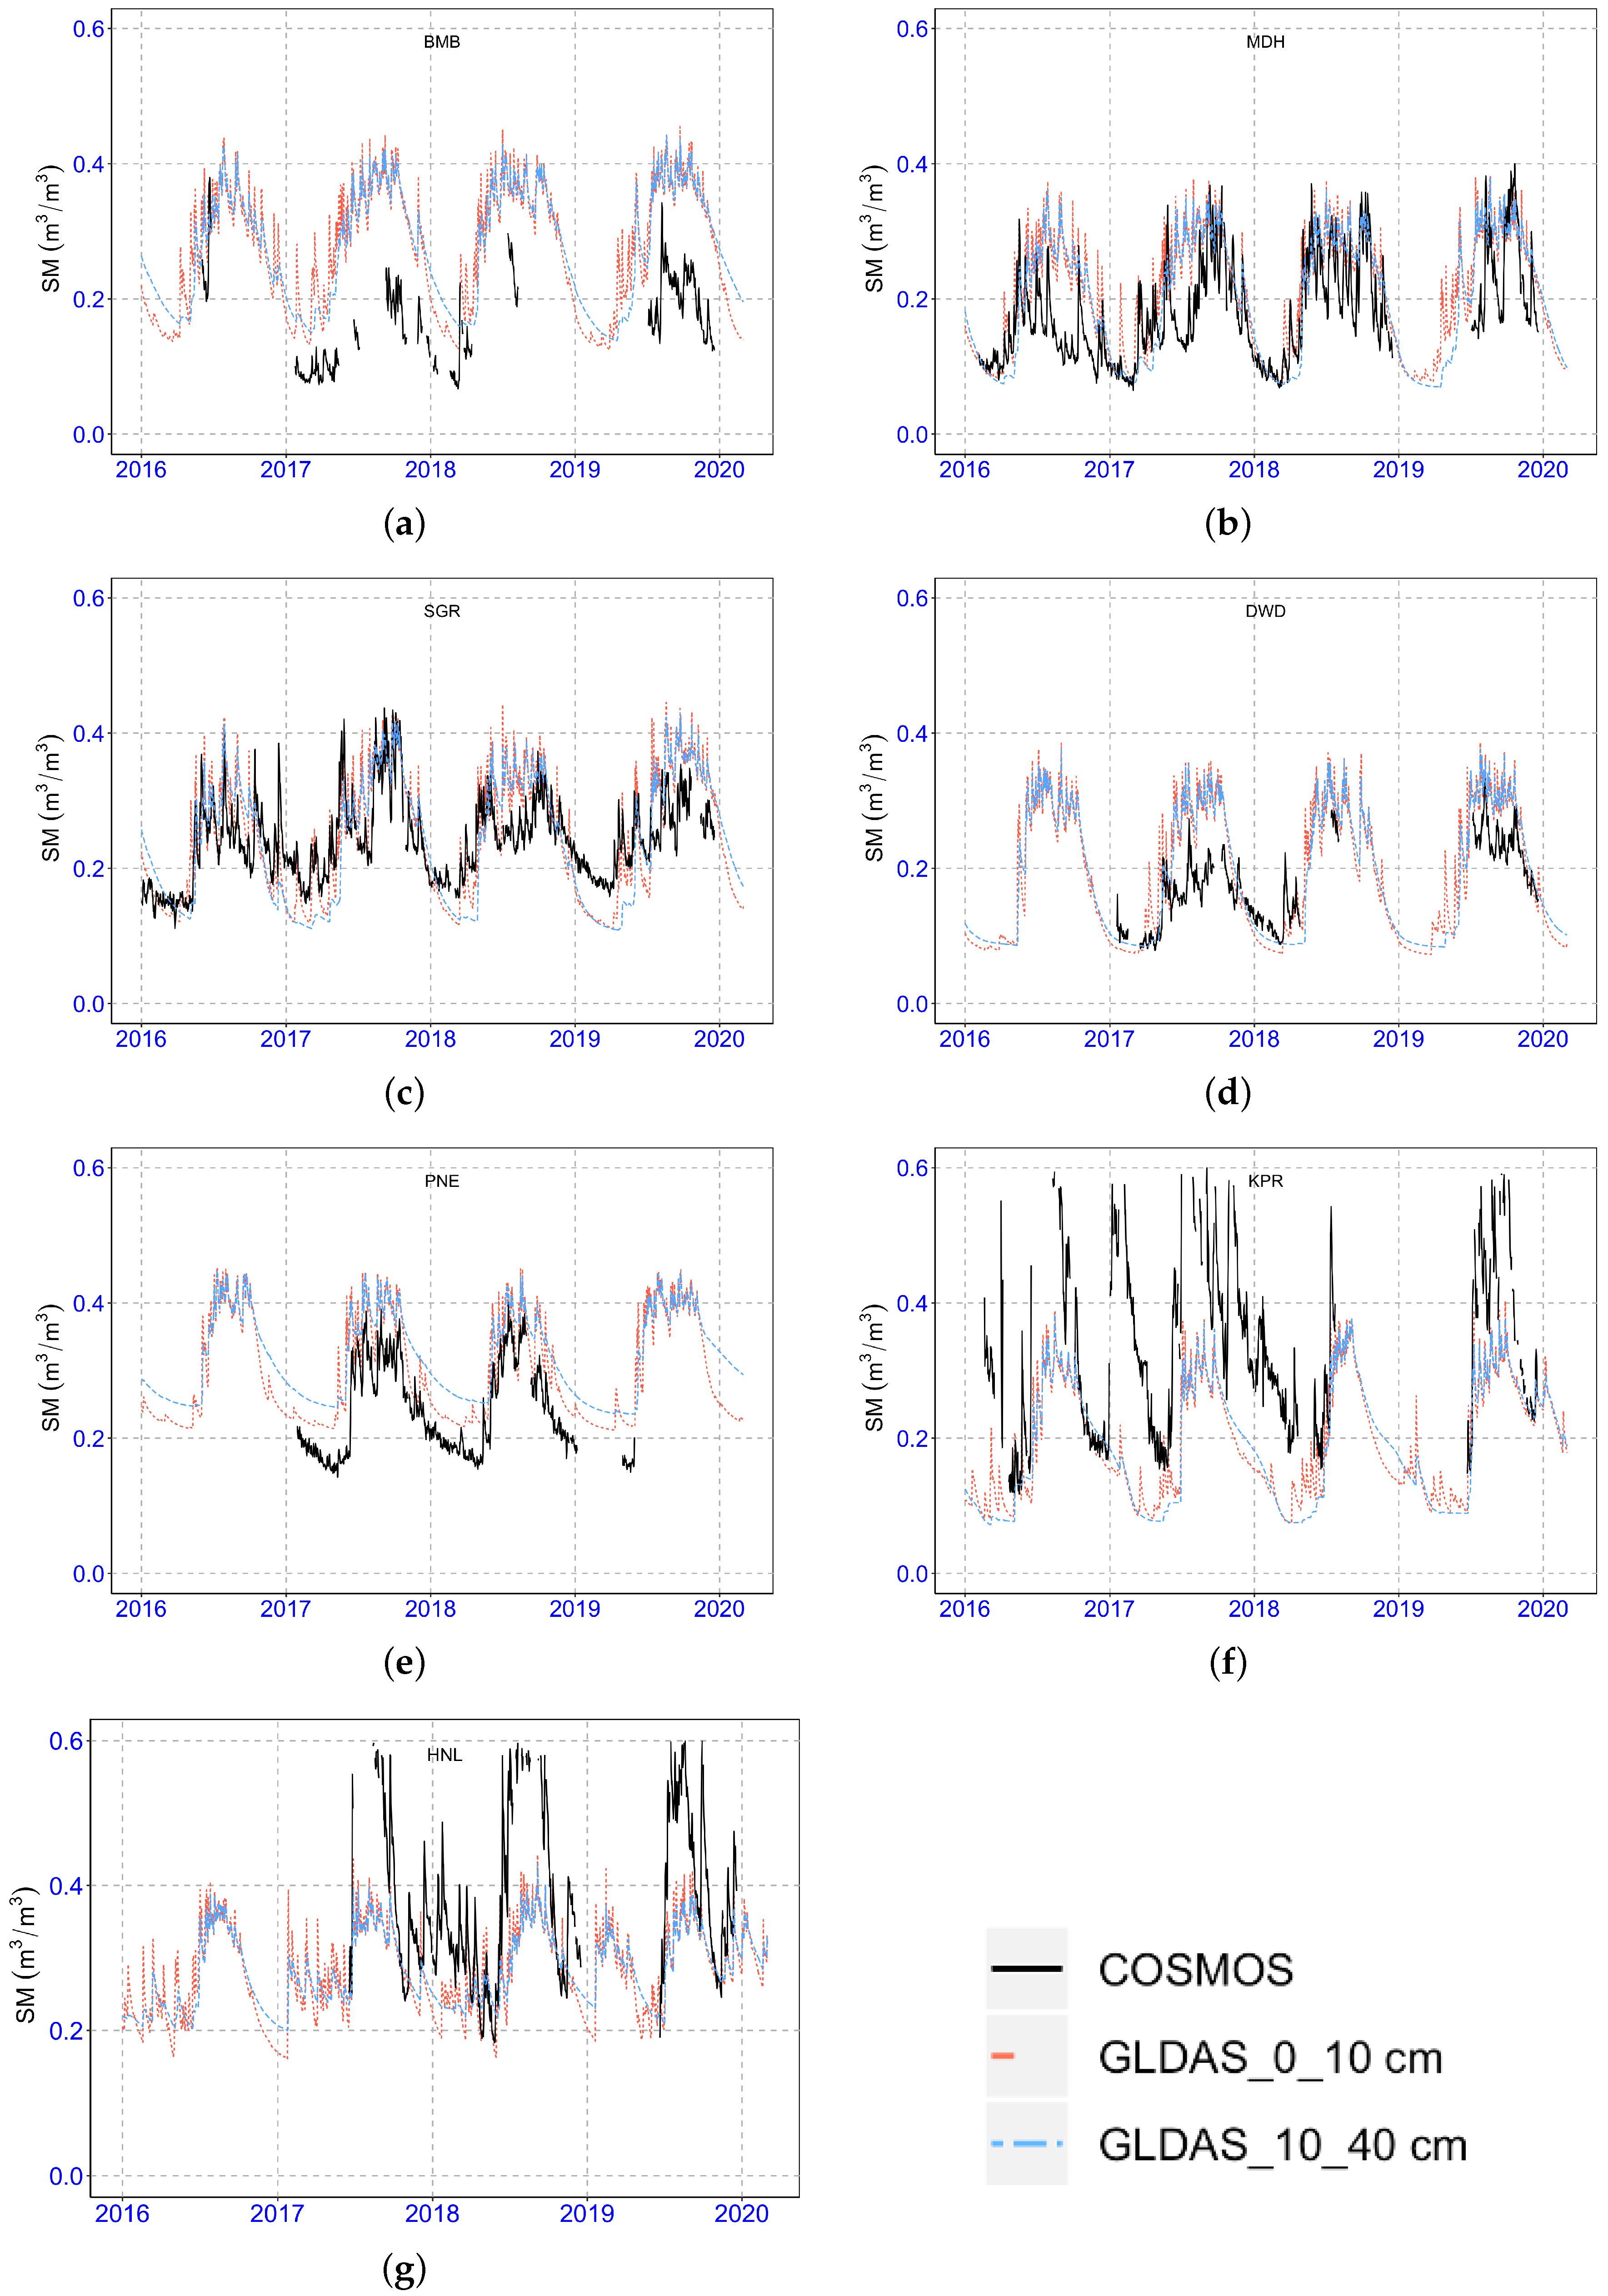
The comparison plots for all the sites are given in this section site wise. The R, RMSE, ubRMSE and bias are shown in Table 4, Table 5 and Table 6 for the all SSM products, for the SMAP_L4 and SMOS_L4, and GLDAS against ICON-COSMOS data respectively. Figure 3, Figure 4, Figure 5 and Figure 6 provide time series plots over each ICON site for the ICON-COSMOS data and SSM from SMAP and SMOS products, SMAP_L4 and SMOS_L4 products, and GLDAS data, respectively. Below is the site by site description of the results.

Table 4.
Comparison matrix between COSMOS and satellite products.

Table 5.
Comparison matrix between COSMOS SMAP_L4 and SMOS_L4 root zone soil moisture products.

Table 6.
Comparison matrix between COSMOS and GLDAS root zone soil moisture products.
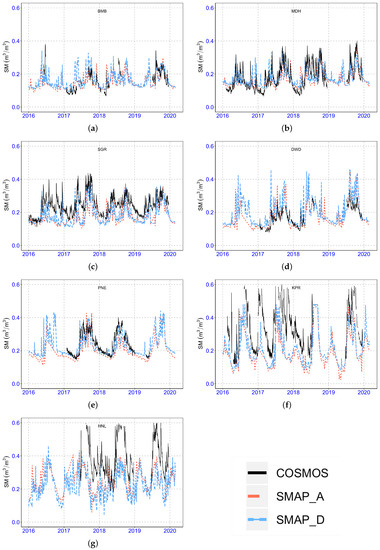
Figure 3.
Time series of surface soil moisture from SMAP_L3 data and ICON-COSMOS for Berambadi(BMB) (a), Madahalli(MDH) (b), Singanallur(SGR) (c), Dharwad(DWD) (d), Pune(PNE) (e), Kanpur(KPR) (f), and Henval(HNL) (g) sites.
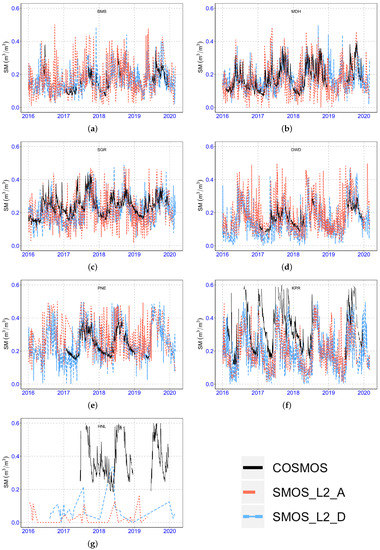
Figure 4.
Time series of surface soil moisture from SMOS_L2 data and ICON-COSMOS for Berambadi(BMB) (a), Madahalli(MDH) (b), Singanallur(SGR) (c), Dharwad(DWD) (d), Pune(PNE) (e), Kanpur(KPR) (f), and Henval(HNL) (g) sites.
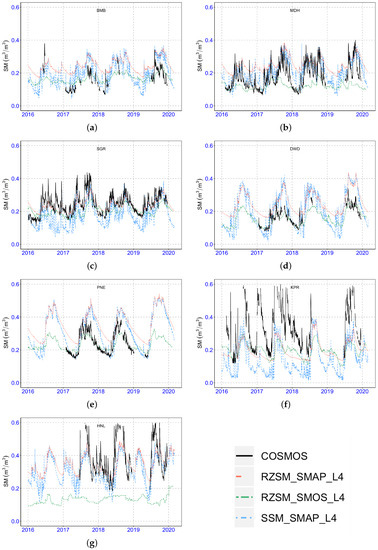
Figure 5.
Time series of root zone soil moisture from SMAP_L4 SSM, SMAP_L4 RZSM, SMOS_L4 RZSM and ICON-COSMOS for Berambadi(BMB) (a), Madahalli(MDH) (b), Singanallur(SGR) (c), Dharwad(DWD) (d), Pune(PNE) (e), Kanpur(KPR) (f), and Henval(HNL) (g) sites.
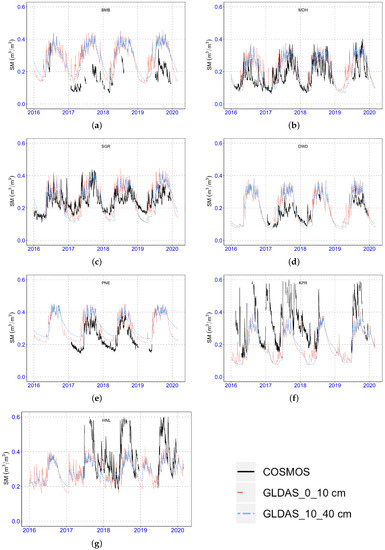
Figure 6.
Time series of soil moisture at (0–10cm) and (10–40cm) depth from GLDAS and ICON-COSMOS for Berambadi(BMB) (a), Madahalli(MDH) (b), Singanallur(SGR) (c), Dharwad(DWD) (d), Pune(PNE) (e), Kanpur(KPR) (f), and Henval(HNL) (g) sites.
- Berambadi-BMB: COSMOS SM time series (see Figure 6a) over BMB show high fluctuations during crop growth season, which can be explained by the impact of irrigation as the instrument is installed in a groundwater irrigated agricultural plot. The mean, maximum and minimum COSMOS SM over this site are 0.16 (m/m), 0.42 (m/m) and 0.07 (m/m), respectively. SM in Berambadi from different satellite and GLDAS products showed R values of 0.62, 0.66, 0.41, 0.52 and 0.76 for SMAP_L3_A, SMAP_L3_D, SMOS_L2_A, SMOS_L2_D and GLDAS respectively. The performance of GLDAS shows the best results, followed by SMAP and then SMOS products. Comparison of COSMOS with GLDAS RZSM data set (see Figure 6a) shows R values of 0.76, 0.77, 0.73 and 0.69 for (0–10 cm), (10–40 cm), (40–100 cm) and (100–200 cm) respectively. The performances for first and second layers are similar. For deeper layers the correlation decreases significantly. In the case of SSM and RZSM from SMAP the R values were of 0.8 and 0.72 respectively. The RZSM from SMOS_L4 shows R value of 0.67. The SSM has a significantly higher correlation (see Figure 5a).
- Madahalli-MDH: COSMOS sensor located in Madahalli site is also in an agricultural field (see Figure 1). The site is close to the Berambadi site. The mean, maximum and minimum SM from COSMOS sensor are 0.18 (m/m), 0.40 (m/m) and 0.065 (m/m) which very close to the Berambadi site. SM comparison with different SSM products SMAP_L3_A, SMAP_L3_D, SMOS_L2_A, SMOS_L2_D and GLDAS shows R value of 0.73, 0.76, 0.52 0.62 and 0.70 respectively. This shows the product SMAP_L3_D and GLDAS are performing equally well in this site for SM comparison (see Table 4). RZSM analysis shows that for GLDAS product at (0–10 cm), (10–40 cm), (40–100 cm) and (100–200 cm) shows R values of 0.7, 0.69, 0.61 and 0.6 respectively (see Figure 6. In Madahalli site the best performance is obtained like for BMB at (0–10 cm) and (10–40 cm) depths. For SMAP_L4 product R value was of 0.8 and 0.72 for SSM and RZSM respectively, showing significantly better performances for SSM (see Figure 5b). SMOS_L4 RZSM showed R value of 0.54 which is significantly less compared to SMAP_L4.
- Singanallur-SGR: Singanallur site is an irrigated agricultural plot (see Figure 1) with mean, maximum and minimum SM from COSMOS of 0.244 (m/m), 0.44 (m/m) and 0.11 (m/m), respectively. The higher mean value is consistent with the fact that this soil in the site has a higher percentage of clay than the Berambadi and Madahalli sites (see Figure 1). SSM from SMAP_L3_A, SMAP_L3_D, SMOS_L2_A, SMOS_L2_D and GLDAS show values of R 0.71, 0.81, 0.42, 0.52 and 0.78 respectively (see Table 4). From the values in the Table 5 and Table 6 it can be seen that the performance of SMAP_L4 SSM and GLDAS are giving best performance (see Figure 5 and Figure 6). The RZSM from GLDAS at (0–10 cm), (10–40 cm), (40–100 cm) and (100–200 cm) shows R values of 0.78, 0.71, 0.58 and 0.5 respectively, (see Figure 6c) showing close results for (0–10 cm) and (10–40 cm) depth. The COSMOS value is comparable to 0–40 cm from GLDAS product with good performance. The SMAP_L4 SSM and RZSM comparison shows values of R as 0.81 and 0.74, respectively (see Figure 5c), which is close to GLDAS performance.SMOS_L4 RZSM shows R value of 0.42 which is lower as compared to SMAP_L4 and GLDAS products.
- Dharwad-DWD: The COSMOS data time series shows a mean value of 0.17, maximum of 0.34 and minimum of 0.08 (m/m), respectively. SMAP_L3_A (R = 0.87) outperforms other products followed by GLDAS (R = 0.82) then SMAP_L3_D (R = 0.82) then SMOS_L2_D (R = 0.79) and SMOS_L2_A (R = 0.66) (see Table 4). All SSM products have good performances over this site. The RZSM comparison between GLDAS products and COSMOS (see Figure 6d) showed best comparison at all depths indicating minor differences in soil moisture across depths. The performance at all depths showed higher R values 0.82, 0.85, 0.85 and 0.84 respectively at depths (0–10 cm), (10–40 cm), (40–100 cm) and (100–200 cm) (see Table 6). Comparison of RZSM from SMAP_L4 and COSMOS (see Figure 5d) products showed better results at top layer with R value of 0.9 compared to deeper (R = 0.86) and from SMOS_L4 showed R value of 0.89 close to SMAP_L4.
- Pune-PNE: The site is located in a vegetated cover with sparse trees. The mean COSMOS SM value was 0.238 (m/m), maximum was 0.404 (m/m) and minimum 0.142 (m/m). The higher mean and minimum value can be attributed to the presence of sparse trees that preserve the soil moisture combined to the higher percentage clay in this site (see Figure 1). Over this site the SSM performance of GLDAS (R = 0.89) is best followed by SMAP_L3_D (R = 0.88) then by SMAP_L3_A (R = 0.83), SMOS_L2_D (R = 0.74), SMOS_L2_A (R = 0.50) (see Table 4). The RZSM data comparison between GLDAS and COSMOS (see Figure 6e) is showing very good performance at all depth with best performance at depth 10–40 cm with R value of 0.94. Comparison with SMAP_L4 and COSMOS (see Figure 5e) data showed better performance at top layer (R = 0.83) in comparison to the deeper layer (R = 0.75). Comparison of COSMOS with SMOS_L4 showed R value of 0.89.
- Kanpur-KPR: The comparison of SM from COSMOS sensor to spatial SM at the Kanpur site poses several challenges, the sensor is a non-representative area in a rice field with high dense urban areas (25% of the satellite footprint). The maximum value of soil moisture reported in this site reaches extremely high values above soil saturation (>0.50 (m/m)) because of standing water and was filtered out. The minimum is 0.117 (m/m) and the average 0.40 (m/m). The effect of irrigation is captured in the COSMOS measurements and not by any other products considered in the study indicated by peaks in COSMOS data when compared to products. All products show high bias that is explained by the reasons presented above, in fact the impact of urban areas is similar to bare rocks and induces negative bias in the retrieved SM. SMOS data shows some outliers (see Figure 3f). The performance of SMAP_L3_A (R = 0.89) shows the best performance followed by SMAP_L3_D (R = 0.82) then SMOS_L2_A (R = 0.71), SMOS_L2_D (R = 0.68) and then GLDAS (R = 0.63) (see Table 4). This shows that urban areas impacts the bias of the retrievals and to a much lesser extent the correlation as the urban environment is static bare rocks in passive microwave. This is true provided that zero to low levels of RFIs are from the urban environment. The RZSM comparison with GLDAS and COSMOS (see Figure 6f) showed best performance at depths 0–10 cm and 10–40 cm. The R values were 0.63 and 0.62 respectively. Comparison of SMAP_L4 and COSMOS (see Figure 5f) showed better R values for top layer as compared to deeper layer (0.79 and 0.74 respectively). Comparison of COSMOS with SMOS_L4 show R value of 0.66.
- Henval-HNL: The time series of COSMOS SM at the site has a mean value of 0.416 (m/m), maximum of 0.812 (m/m), and minimum of 0.183 (m/m). These high values are expected as the site is in a subtropical humid region in the Himalayas with 1120 mm/y of rainfall. Moreover the site is situated in a high altitude valley that experiences snow melting (see Figure 1). Rice cultivation is practiced in plots in the footprint of the COSMOS sensor and periodic irrigation for rice crops is seen. The local irrigation effect is very well captured in the COSMOS measurements and is not reflected to the same extent in the spatial products. This can be explained by the relatively small surface cover of the agricultural area when compared to the footprint of the satellite data. It is also worth mentioning that the site is located over mountainous region that impacts the SM retrieval in microwave. The performance of GLDAS (R = 0.75), SMAP_L3_A (R = 0.73) and SMAP_L3_D (R = 0.74) shows similar results with slight variations (see Table 4). SMOS data is not valid for this site (see Figure 3g) due to very high levels of RFIs and high topographic index. The RZSM comparison between GLDAS and COSMOS (see Figure 6g) showed better performance at depth of 10–40 cm. The R values at depths (0–10 cm), (10–40 cm), (40–100 cm) and (100–200 cm) show 0.75, 0.78, 0.62 and 0.26 respectively. Comparison with SMAP_L4 data and COSMOS data showed better result for top layer with R value of 0.76 in comparison to deeper layer which reported 0.66 R value (see Figure 5g).
6. Discussions
6.1. Surface and Root-Zone SM versus COSMOS Measurements
We have a network of cosmos sites (ICON), and we are using this to validate EO and model SM. From the site-by-site results of SMAP_L4 SSM and RZSM based on Table 5, it is clear that the performances depend on the associated soil depth of the SM. The correlation was higher for the SSM compared to RZSM for all sites with the following differences (RSSM-RRZSM): 0.08, 0.08, 0.07, 0.04, 0.08, 0.05, and 0.10 for BMB, MDH, SGR, DWD, PNE, KPR and HNL respectively. Also when considering the four different soil depths associated with GLDAS dataset (see Table 6) the correlation decreases systematically with soil depth for BMB (from R = 0.76 to R = 0.69), MDH (from R = 0.7 to R = 0.6), SGR (from R = 0.78 to 0.5), KPR (from R = 0.63 to 0.39), and HNL (from R = 0.76 to 0.26). The only two sites where the correlation didn’t show this pattern are DWD (from R = 0.82 to 0.5) and PNE (from 0.89 to 0.86). Our results show that when comparing COSMOS measurements to spatial soil moisture data at coarse scale that SSM is a better match than RZSM. Yet, interestingly, the SMAP_L4 SSM provided a better match than SMAP_L3 SSM and GLDAS first layer. And the SMAP products show better results in all sites compared to SMOS products. SMOS_L4 RZSM shows good performance in two sites DWD and PNE. Also the bias from SMOS_L4 is lower compared to SMAP_L4 product. The SMAP_L4 SSM is provided by assimilation of SMAP data into a LSM with a first layer at a deeper representative depth than SMAP_L3 SSM. So, while the correlation was higher for SSM, the best match with COSMOS was an intermediate information provided by modeling and corrected by the remote sensing data via assimilation. Moreover, as mentioned in [54], while the majority of the measured COSMOS signal originates from the near-surface of the soil, a finite influence of deeper soil layers is present. The effective sensing depth will depend on surface conditions and soil properties. Since soil properties profile shows a strong transition at around 20–25 cm depth in the agricultural fields at ICON, this can have an impact on the effective sensing depth. The notion of effective sensing depth concerns also the L-Band microwave observation from remote sensing. [55] found a 2.5 cm effective depth over frozen and thawed soils in the Tibetan Plateaus. While [56] associated a more commonly admitted 5 cm effective depth over South-west of France in temperate climate. Indeed, microwave radiative transfer theory in remote sensing shows that the effective depth is variable and can even reach more than 1 m in very special cases of dry desert sand (not encountered over ICON sites) [57]. One last component that can intervene in this comparison is the spatial aggregation through the impact area of COSMOS (200 m), and antenna footprint (40 km) for the remote sensing data. In the two cases, the aggregation (convolution) of the sensed signal over heterogeneous surfaces to determine soil moisture can redefine the final effective sensing depth.
6.2. Performances with Respect to Soil Properties and Climate Information
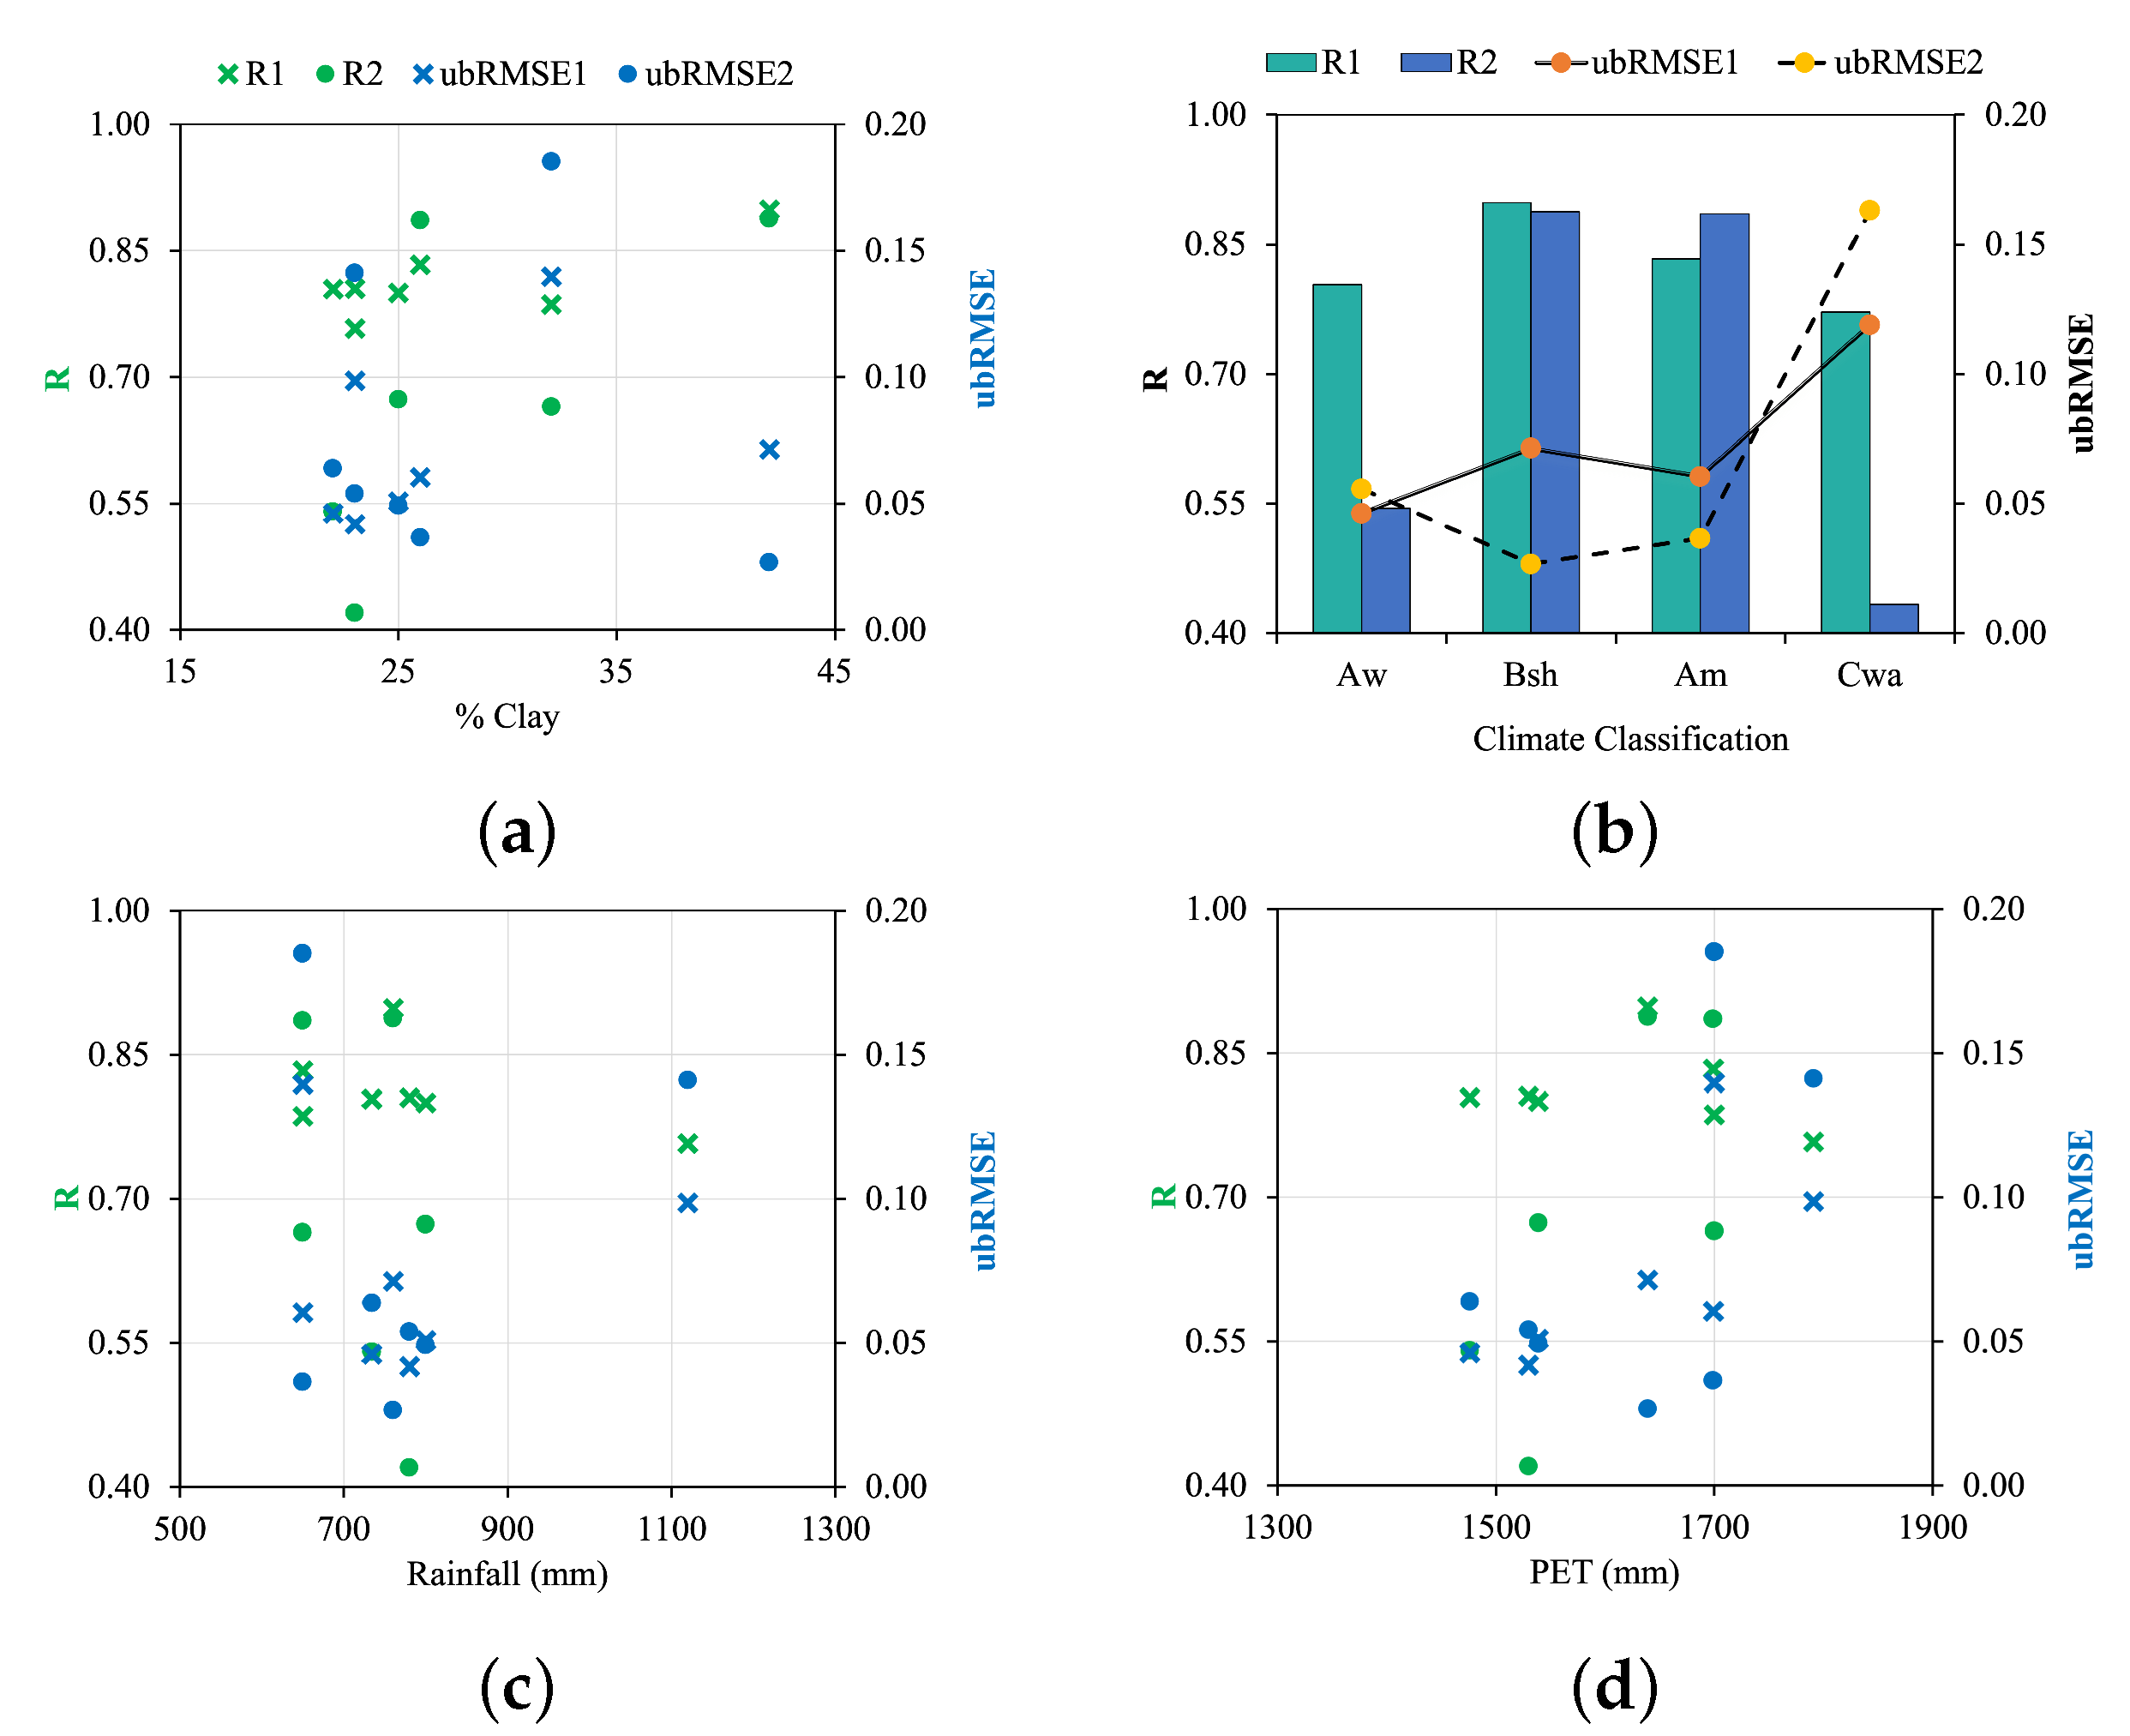
Here we attempt to assess the relation between the soil properties and climate condition (Climate class, Rainfall and PET). We consider the most performing dataset namely SMAP_L4 SSM for SMAP products and SMOS_L4 RZSM for SMOS products in this analysis. It is also important to bear in mind that the results are obtained based on the seven COSMOS stations and therefore can be under-sampled. Nonetheless, the following remarks can be stated. In Figure 7a, there is a tendency to have increased correlation with clay % and the best correlation are obtained for clay >40%. When compared between SMOS_L4 RZSM and SMAP_L4 SSM at lower % clay SMOS is showing lower R values in comparison to SMAP. The tendency is less visible in the ubRMSE. This suggests that the soil retention capacity which increases with % clay and which also increases the time of residence of the water in the depth (0–5 cm) of the soil enhances the match between the satellite SM and the COSMOS data. Figure 7b shows performance metrics as a function of the climatic classes. The comparison is highest for the Bsh: Hot to semi-arid climate, but represented by one site which makes it difficult to draw conclusions. Same can be said for Am: Tropical monsoon climate. Cwa:Humid subtropical climate and Aw: Tropical Savanna climate are represented by several sites. The results show that the drier Aw has better R and lower ubRMSE than the wetter Cwa. So the drier conditions present better performances. This slightly confirmed by Figure 7c where we see lower correlation for high rainfall. Unfortunately the sampling off the ICON network is not dense enough to draw major conclusions on this section, but the results suggest that a global analysis with other COSMOS networks is of interest. However, SMOS_L4 RZSM shows lower R values for Aw and Cwa climate and bias is also in the same range. Climate classes Am and Bsh are showing similar R values, rather a little higher and bias is also lower from SMOS_L4 RZSM data. This may be due to lower RFI interferences in Am and Bsh climate. Lower correlation values are seen for lower rainfall and PET values from SMOS_L4 RZSM.
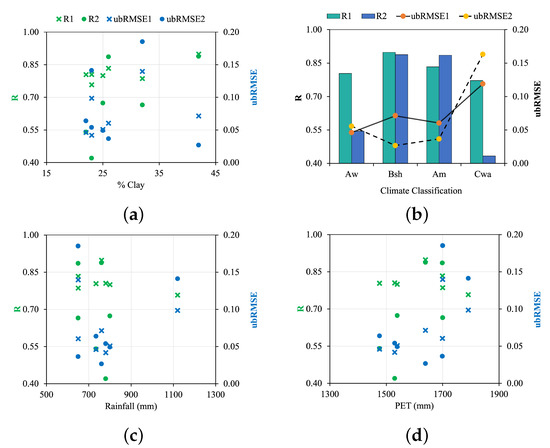
Figure 7.
Performance Analysis of SMAP_L4 SSM and SMOS_L4 RZSM over the ICON sites with respect to % of Clay (a), Köppen Climate classification (b), Average yearly Rainfall (c), and Average yearly PET (d). R1 and ubRMSE1 corresponds to SMAP_L4 SSM and R2 and ubRMSE2 corresponds to SMOS_L4 RZSM which are the best performing products among SMAP and SMOS.
6.3. Matching In Situ and Satellite Data Footprint
The case of the BMB and MDH provides a an opportunity for inter-comparison as the two sites are separated by ≈ 20 km which gives a 30% common surface footprint for the microwave sensors. The SMAP_L3 and SMOS_L2 SM still shows a significant difference in terms of correlation (SM(BMB)-SSM(MDH)) ≈ 0.11 while the bias remains low. This difference can be mainly explained by the difference of the complementary land cover. As BMB and MDH have 53% and 33% contribution associated to the “Bandipur National Park” forest land cover respectively. This comparison raises the question of the impact of the match between the land use at the COSMOS footprint and the land cover of the satellite data footprint across all the stations (see Table 2). When looking at the statistical results across all dataset it seems that the retrievals are not highly impacted with this mismatch in terms of correlation. The most notable difference is the bias over the two northern sites (KPR and HNL) which were analyzed in the previous section. The two sites have in common a “Cwa” climate class and are near the Himalayan mountain chain that may impact the microwave signal. [25] evaluated SMAP_L3 SM products with in situ point measurements and reported R values of 0.72, 0.71 and 0.67 over Uttarpradesh (UP) and Madyapradesh (MP) and Gujrat, respectively. Our results over KPR which is in UP shows higher R values for both SMAP_L3_A and SMAP_L3_D of 0.893 and 0.818, respectively. Also the metrics over PNE site in Maharashtra located the central part of India close to MP shows higher R value of 0.827 and 0.877 for SMAP_L3_A and SMAP_L3_D respectively. These results can be attributed partially to the better sampling footprint of the COSMOS sensor. SMAP_L3 showed better performance than SMOS_L2 but at a smaller extent than [25,36] that used SMOS_L3 products. Worth mentioning that the spatial mismatch of the footprint can be traded for temporal resolution as in the case of SMAP, SMOS also shows higher values of R when average soil moisture is used as compared to point scale [53]. Considering the size of the COSMOS footprint it is clear that disaggregated SM products like in [23] and future products from the Indian Space Research Organisation (ISRO) and NASA, Synthetic Aperature Radar (SAR) - NISAR - will be a better fit. In fact disaggregated product combining microwave and SAR are at good accuracy for 500 m resolution and the NISAR mission is expected to provide SSM maps at 200 m spatial resolution and 12 days revisit from L-Band and S-band SAR.
7. Conclusions
ICON, a COSMOS based monitoring network was installed across seven locations in India covering four climate classes and a variety of soil properties. This paper presents the seven sites and the first results from the seven sites of the network. Satellite SSM and RZSM from SMAP and SMOS and GLDAS SM product were evaluated against the COSMOS in situ soil moisture from 2016 to end of 2019. Hereby a summary of the main results in this paper are presented.
While the COSMOS sensor provides an intermediate resolution, one sensor cannot provide a proper sampling of the passive microwave footprint. Still, our results show that surprisingly the comparison between the spatial datasets and the COSMOS sensors provides high correlation and low bias in the majority of the cases. The urban cover had a low impact on correlation and induce a high negative bias, provided that low level of RFI are present.
The SM analysis shows best performance for SSM SMAP_L4 with R values 0.76 to 0.9 and GLDAS (0–10 cm) with R values 0.75 to 0.89. Our results also show that the COSMOS sensors are systematically more highly correlated to SSM than RZSM. The RZSM in GLDAS at depth 10-40 cm with R values 0.66 to 0.86 showed better performance than SMAP_L4 at deeper layers 0.62 to 0.94. Performances seemed to increase with %clay in the soil texture with best performances for %clay more than 40%. However, the performance of COSMOS is affected by structure of the soil, water content and depth hence more research in this area is necessary. In conclusion, ICON proves to be a very important asset for the CAL/VAL of SM products. Clearly, the optimal usage of the ICON Network for validation would be to use <500 m spatial resolution SSM. The good performances of the coarse resolution soil moisture products proves their usefulness for agricultural drought monitoring applications. A way forward is to disaggregate the microwave product with complementary information from optical or SAR before validation. But also if maintained the ICON network will be very useful for the validation of the SSM maps at 200 m resolution every 12 days that the NASA-ISRO SAR mission NISAR will provide.
Supplementary Materials
The following are available online at https://www.mdpi.com/2072-4292/13/3/537/s1.
Author Contributions
Conceptualization, S.M., S.K.T. and A.A.B.; Data curation, D.B.U., S.Y., T.S. and M.F.; Formal analysis, D.B.U. and A.A.B.; Funding acquisition, J.E. and R.M.; Investigation, S.M., S.K.T., A.A.B. and T.S.; Methodology, S.K.T. and A.A.B.; Project administration, S.M. and S.K.T.; Resources, D.B.U., S.Y., T.S., M.F., S.N.T., M.M., M.G., N.G., M.K.N., S.K.J., S.S.A. and B.S.Y.; Supervision, J.E., S.M., S.K.T. and A.A.B.; Validation, D.B.U., S.K.T. and A.A.B.; Visualization, D.B.U., S.K.T., A.A.B. and R.M.; Writing—original draft, D.B.U.; Writing—review & editing, D.B.U., A.A.B., R.M., S.N.T., M.M., M.G., N.G., M.K.N., S.K.J., S.S.A. and B.S.Y. All authors have read and agreed to the published version of the manuscript.
Funding
ICON was setup by the UKCEH SUNRISE programme, which is funded by the Natural Environment Research Council (NERC) as part of a National Capability Long-Term Science-Official Development Assistance (LTS-ODA) Award.
Institutional Review Board Statement
Not applicable.
Informed Consent Statement
Not applicable.
Data Availability Statement
The access to the details and resources with respect to ICON data sets are provided in the web portal https://cosmos-india.org/. SMOS https://smos-diss.eo.esa.int/oads/access/ SMOS https://www.catds.fr/Products/Products-access/ SMAP and SMAP https://smap.jpl.nasa.gov/data/ GLDAS https://ldas.gsfc.nasa.gov/gldas/.
Acknowledgments
We acknowledge the investment of Centre for Ecology & Hydrology (CEH) UK, for the construction of the COSMOS—India Network. We acknowledge the IMPRINT project. We would like to thank Abhishek from PHAME Enterprises, Avinash and Soundar Rajan IISc team. R.Krishnan and S.S. Sabade for the field work in the installation and operation of the ICON network.
Conflicts of Interest
All co-authors certify that they have No Conflicts of interest related to the current paper.
Abbreviations
The following abbreviations are used in this manuscript:
| SM | Soil Moisture |
| SSM | Surface Soil Moisture |
| RZSM | Root Zone Soil Moisture |
| ICON | Indian COSMOS Network |
| AMBHAS | Assimilation of Multi-satellite data at Berambadi watershed for Hydrology |
| And land Surface experiment | |
| NAFE | The National Airborne Field Experiment |
| SMAPEX | Soil Moisture Active Passive Experiment |
| SGP | The Southern Great Plains |
| ICOS | Integrated Carbon Obervation Network |
| ISMN | International Soil Moisture Network |
| MDPI | Multidisciplinary Digital Publishing Institute |
| CRNP | Cosmic Ray Neutron Probe |
| COSMOS | COsmic ray Soil Moisture Observation System |
| SMOS | Soil Moisture Observation System |
| SMAP | Soil Moisture Active Passive |
| GLDAS | Global Land Data Assimilation System |
| ASCAT | Advanced Scatterometer |
| AMSR | Advanced Microwave Scanning Radiometer |
| LSM | Land Surface Modelling |
| KSNDMC | Karnataka State Natural and Disaster Mangement Centre |
| TB | Brightness Temperature |
| NASA | National Aeronautics and Space Administration |
| ISRO | Indian Space Research Organisation |
| NISAR | NASA-ISRO Synthetic Aperture Radar mission |
| RFI | Radio Frequency Interference |
References
- Evans, J.G.; Ward, H.C.; Blake, J.R.; Hewitt, E.J.; Morrison, R.; Fry, M.; Ball, L.A.; Doughty, L.C.; Libre, J.W.; Hitt, O.E.; et al. Soil water content in southern England derived from a cosmic-ray soil moisture observing system—COSMOS-UK. Hydrol. Process. 2016, 30, 4987–4999. [Google Scholar] [CrossRef]
- Bojinski, S.; Verstraete, M.; Peterson, T.C.; Richter, C.; Simmons, A.; Zemp, M. The concept of essential climate variables in support of climate research, applications, and policy. Bull. Am. Meteorol. Soc. 2014, 95, 1431–1443. [Google Scholar] [CrossRef]
- Fereres, E.; Soriano, M.A. Deficit irrigation for reducing agricultural water use. J. Exp. Bot. 2007, 58, 147–159. [Google Scholar] [CrossRef] [PubMed]
- Komma, J.; Blöschl, G.; Reszler, C. Soil moisture updating by Ensemble Kalman Filtering in real-time flood forecasting. J. Hydrol. 2008, 357, 228–242. [Google Scholar] [CrossRef]
- Fan, L.; Wigneron, J.P.; Xiao, Q.; Al-Yaari, A.; Wen, J.; Martin-StPaul, N.; Dupuy, J.L.; Pimont, F.; Al Bitar, A.; Fernandez-Moran, R.; et al. Evaluation of microwave remote sensing for monitoring live fuel moisture content in the Mediterranean region. Remote Sens. Environ. 2018, 205, 210–223. [Google Scholar] [CrossRef]
- Pelletier, J.D. Scale-invariance of soil moisture variability and its implications for the frequency-size distribution of landslides. arXiv 1997, arXiv:physics/9705035. [Google Scholar] [CrossRef]
- Hendrickx, J.M.; Harrison, J.B.J.; Borchers, B.; Kelley, J.R.; Howington, S.; Ballard, J. High-resolution soil moisture mapping in Afghanistan. In Detection and Sensing of Mines, Explosive Objects, and Obscured Targets XVI; International Society for Optics and Photonics: Orlando, FL, USA, 2011; Volume 8017, p. 801710. [Google Scholar]
- Karthikeyan, L.; Chawla, I.; Mishra, A.K. A review of remote sensing applications in agriculture for food security: Crop growth and yield, irrigation, and crop losses. J. Hydrol. 2020, 586, 124905. [Google Scholar] [CrossRef]
- SU, S.L.; Singh, D.; Baghini, M.S. A critical review of soil moisture measurement. Measurement 2014, 54, 92–105. [Google Scholar] [CrossRef]
- Rodriguez-Alvarez, N.; Bosch-Lluis, X.; Camps, A.; Vall-Llossera, M.; Valencia, E.; Marchan-Hernandez, J.F.; Ramos-Perez, I. Soil moisture retrieval using GNSS-R techniques: Experimental results over a bare soil field. IEEE Trans. Geosci. Remote Sens. 2009, 47, 3616–3624. [Google Scholar] [CrossRef]
- Acevo-Herrera, R.; Aguasca, A.; Bosch-Lluis, X.; Camps, A. On the use of compact L-band Dicke radiometer (ARIEL) and UAV for soil moisture and salinity map retrieval: 2008/2009 field experiments. In Proceedings of the 2009 IEEE International Geoscience and Remote Sensing Symposium, Cape Town, South Africa, 12–17 July 2009; Volume 4, pp. IV-729–IV-732. [Google Scholar]
- Zreda, M.; Shuttleworth, W.J.; Zeng, X.; Zweck, C.; Desilets, D.; Franz, T.; Rosolem, R. COSMOS: The cosmic-ray soil moisture observing system. Hydrol. Earth Syst. Sci. 2012, 16, 4079–4099. [Google Scholar] [CrossRef]
- Bogena, H.R.; Huisman, J.A.; Güntner, A.; Hübner, C.; Kusche, J.; Jonard, F.; Vey, S.; Vereecken, H. Emerging methods for noninvasive sensing of soil moisture dynamics from field to catchment scale: A review. Wiley Interdiscip. Rev. Water 2015, 2, 635–647. [Google Scholar] [CrossRef]
- Kohli, M.; Schron, M.; Zreda, M.; Schmidt, U.; Dietrich, P.; Zacharias, S. Footprint characteristics revised for field-scale soil moisture monitoring with cosmic-ray neutrons. J. Am. Water Resour. Assoc. 2015, 5, 5772–5790. [Google Scholar] [CrossRef]
- Baatz, R.; Bogena, H.; Franssen, H.J.H.; Huisman, J.A.; Montzka, C.; Vereecken, H. An empirical vegetation correction for soil water content quantification using cosmic ray probes. Water Resour. Res. 2015, 51, 2030–2046. [Google Scholar] [CrossRef]
- Dorigo, W.; Wagner, W.; Hohensinn, R.; Hahn, S.; Paulik, C.; Xaver, A.; Gruber, A.; Drusch, M.; Mecklenburg, S.; van Oevelen, P.; et al. The International Soil Moisture Network: A data hosting facility for global in situ soil moisture measurements. Hydrol. Earth Syst. Sci. 2011, 15, 1675–1698. [Google Scholar] [CrossRef]
- Brocca, L.; Morbidelli, R.; Melone, F.; Moramarco, T. Soil moisture spatial variability in experimental areas of central Italy. J. Hydrol. 2007, 333, 356–373. [Google Scholar] [CrossRef]
- Albergel, C.; de Rosnay, P.; Gruhier, C.; Muñoz-Sabater, J.; Hasenauer, S.; Isaksen, L.; Kerr, Y.; Wagner, W. Evaluation of remotely sensed and modelled soil moisture products using global ground-based in situ observations. Remote Sens. Environ. 2012, 118, 215–226. [Google Scholar] [CrossRef]
- Kerr, Y.H.; Waldteufel, P.; Wigneron, J.P.; Delwart, S.; Cabot, F.; Boutin, J.; Escorihuela, M.J.; Font, J.; Reul, N.; Gruhier, C.; et al. The SMOS mission: New tool for monitoring key elements ofthe global water cycle. Proc. IEEE 2010, 98, 666–687. [Google Scholar] [CrossRef]
- Entekhabi, B.D.; Njoku, E.G.; Neill, P.E.O.; Kellogg, K.H.; Crow, W.T.; Edelstein, W.N.; Entin, J.K.; Goodman, S.D.; Jackson, T.J.; Johnson, J.; et al. The Soil Moisture Active and Passive (SMAP) mission. Proc. IEEE 2010, 98, 704–716. [Google Scholar] [CrossRef]
- Bartalis, Z.; Wagner, W.; Naeimi, V.; Hasenauer, S.; Scipal, K.; Bonekamp, H.; Figa, J.; Anderson, C. Initial soil moisture retrievals from the METOP-A Advanced Scatterometer (ASCAT). Geophys. Res. Lett. 2007, 34, 5–9. [Google Scholar] [CrossRef]
- Parinussa, R.M.; Holmes, T.R.; Wanders, N.; Dorigo, W.A.; De Jeu, R.A. A preliminary study toward consistent soil moisture from AMSR2. J. Hydrometeorol. 2015, 16, 932–947. [Google Scholar] [CrossRef]
- Tomer, S.; Al Bitar, A.; Sekhar, M.; Zribi, M.; Bandyopadhyay, S.; Kerr, Y. MAPSM: A spatio-temporal algorithm for merging soil moisture from active and passive microwave remote sensing. Remote Sens. 2016, 8, 990. [Google Scholar] [CrossRef]
- Chakravorty, A.; Chahar, B.R.; Sharma, O.P.; Dhanya, C.T. A regional scale performance evaluation of SMOS and ESA-CCI soil moisture products over India with simulated soil moisture from MERRA-Land. Remote Sens. Environ. 2016, 186, 514–527. [Google Scholar] [CrossRef]
- Suman, S.; Srivastava, P.K.; Petropoulos, G.P.; Pandey, D.K.; O’Neill, P.E. Appraisal of SMAP operational soil moisture product from a global perspective. Remote Sens. 2020, 12, 1977. [Google Scholar] [CrossRef]
- Attada, R.; Kumar, P.; Dasari, H.P. Assessment of Land Surface Models in a High-Resolution Atmospheric Model during Indian Summer Monsoon. Pure Appl. Geophys. 2018, 175, 3671–3696. [Google Scholar] [CrossRef]
- Bindlish, R.; Jackson, T.J.; Gasiewski, A.J.; Klein, M.; Njoku, E.G. Soil moisture mapping and AMSR-E validation using the PSR in SMEX02. Remote Sens. Environ. 2006, 103, 127–139. [Google Scholar] [CrossRef]
- Bosch, D.D.; Lakshmi, V.; Jackson, T.J.; Choi, M.; Jacobs, J.M. Large scale measurements of soil moisture for validation of remotely sensed data: Georgia soil moisture experiment of 2003. J. Hydrol. 2006, 323, 120–137. [Google Scholar] [CrossRef]
- Al Bitar, A.; Leroux, D.; Kerr, Y.H.; Merlin, O.; Richaume, P.; Sahoo, A.; Wood, E.F. Evaluation of SMOS soil moisture products over continental US using the SCAN/SNOTEL network. IEEE Trans. Geosci. Remote Sens. 2012, 50, 1572–1586. [Google Scholar] [CrossRef]
- Merlin, O.; Rüdiger, C.; Al Bitar, A.; Richaume, P.; Walker, J.P.; Kerr, Y.H. Disaggregation of SMOS soil moisture in Southeastern Australia. IEEE Trans. Geosci. Remote Sens. 2012, 50, 1556–1571. [Google Scholar] [CrossRef]
- Montzka, C.; Bogena, H.R.; Weihermüller, L.; Jonard, F.; Bouzinac, C.; Kainulainen, J.; Balling, J.E.; Loew, A.; Dall’Amico, J.T.; Rouhe, E.; et al. Brightness temperature and soil moisture validation at different scales during the SMOS validation campaign in the Rur and Erft catchments, Germany. IEEE Trans. Geosci. Remote Sens. 2013, 51, 1728–1743. [Google Scholar] [CrossRef]
- Dente, L.; Su, Z.; Wen, J. Validation of SMOS soil moisture products over the Maqu and Twente Regions. Sensors 2012, 12, 9965–9986. [Google Scholar] [CrossRef]
- Al-Yaari, A.; Wigneron, J.P.; Ducharne, A.; Kerr, Y.; Wagner, W.; De Lannoy, G.; Reichle, R.; Al Bitar, A.; Dorigo, W.; Richaume, P.; et al. Global-scale comparison of passive (SMOS) and active (ASCAT) satellite based microwave soil moisture retrievals with soil moisture simulations (MERRA-Land). Remote Sens. Environ. 2014, 152, 614–626. [Google Scholar] [CrossRef]
- Colliander, A.; Jackson, T.J.; Bindlish, R.; Chan, S.; Das, N.; Kim, S.B.; Cosh, M.H.; Dunbar, R.S.; Dang, L.; Pashaian, L.; et al. Validation of SMAP surface soil moisture products with core validation sites. Remote Sens. Environ. 2017, 191, 215–231. [Google Scholar] [CrossRef]
- Gruber, A.; Dorigo, W.; Zwieback, S.; Xaver, A.; Wagner, W. Characterizing Coarse-Scale Representativeness of in situ Soil Moisture Measurements from the International Soil Moisture Network. Vadose Zone J. 2013, 12, vzj2012.0170. [Google Scholar] [CrossRef]
- Montzka, C.; Bogena, H.R.; Zreda, M.; Monerris, A.; Morrison, R.; Muddu, S.; Vereecken, H. Validation of spaceborne and modelled surface soil moisture products with Cosmic-Ray Neutron Probes. Remote Sens. 2017, 9, 103. [Google Scholar] [CrossRef]
- Kȩdzior, M.; Zawadzki, J. Comparative study of soil moisture estimations from SMOS satellite mission, GLDAS database, and cosmic-ray neutrons measurements at COSMOS station in Eastern Poland. Geoderma 2016, 283, 21–31. [Google Scholar] [CrossRef]
- Kim, S.; Liu, Y.Y.; Johnson, F.M.; Parinussa, R.M.; Sharma, A. A global comparison of alternate AMSR2 soil moisture products: Why do they differ? Remote Sens. Environ. 2015, 161, 43–62. [Google Scholar] [CrossRef]
- Tomer, S.; Al Bitar, A.; Sekhar, M.; Zribi, M.; Bandyopadhyay, S.; Sreelash, K.; Sharma, A.K.; Corgne, S.; Kerr, Y. Retrieval and multi-scale validation of soil moisture from multi-temporal SAR data in a semi-arid tropical region. Remote Sens. 2015, 7, 8128–8153. [Google Scholar] [CrossRef]
- Sharma, A.K.; Hubert-Moy, L.; Buvaneshwari, S.; Sekhar, M.; Ruiz, L.; Bandyopadhyay, S.; Corgne, S. Irrigation history estimation using multitemporal landsat satellite images: Application to an intensive groundwater irrigated agricultural watershed in India. Remote Sens. 2018, 10, 893. [Google Scholar] [CrossRef]
- Robert, M.; Thomas, A.; Sekhar, M.; Badiger, S.; Ruiz, L.; Willaume, M.; Leenhardt, D.; Bergez, J.E. Farm typology in the Berambadi Watershed (India): Farming systems are determined by farm size and access to groundwater. Water 2017, 9, 51. [Google Scholar] [CrossRef]
- Vasundhara, R.; Dharumarajan, S.; Hegde, R.; Srinivas, S.; Niranjana, K.V.; Srinivasan, N.; Singh, S.K. Characterization and Evaluation of Soils of Singanallur Watershed Using Remote Sensing and GIS. Int. J. Bio-resour. Stress Manag. 2017, 8, 51–56. [Google Scholar] [CrossRef]
- Adla, S.; Rai, N.K.; Karumanchi, S.H.; Tripathi, S.; Disse, M.; Pande, S. Laboratory calibration and performance evaluation of low-cost capacitive and very low-cost resistive soil moisture sensors. Sensors 2020, 20, 363. [Google Scholar] [CrossRef]
- Hallikainen, M.; Winebrenner, D.P. The physical basis for sea ice remote sensing. In Geophysical Monograph Series; Carsey, F.D., Ed.; American Geophysical Union: Washington, DC, USA, 1992; Volume 68, pp. 29–46. [Google Scholar] [CrossRef]
- Moran, M.S.; Peters-Lidard, C.D.; Watts, J.M.; McElroy, S. Estimating soil moisture at the watershed scale with satellite-based radar and land surface models. Can. J. Remote Sens. 2004, 30, 805–826. [Google Scholar] [CrossRef]
- Njoku, E.G.; Entekhabi, D. Passive microwave remote sensing of soil moisture. J. Hydrol. 1996, 184, 101–129. [Google Scholar] [CrossRef]
- Kerr, Y.H.; Waldteufel, P.; Richaume, P.; Wigneron, J.P.; Ferrazzoli, P.; Mahmoodi, A.; Al Bitar, A.; Cabot, F.; Gruhier, C.; Juglea, S.E.; et al. The SMOS Soil Moisture Retrieval Algorithm. IEEE Trans. Geosci. Remote Sens. 2012, 50, 1384–1403. [Google Scholar] [CrossRef]
- Ahmad, A.B.; Ali, M. Algorithm Theoretical Basis Document (ATBD) for the SMOS Level 4 Root Zone Soil Moisture; Version v30_01, Zenodo 2020. Available online: https://zenodo.org/record/4298572#.YAqUhYsRXIU (accessed on 4 December 2020).
- O’Neill, P.; Chan, S.; Bindlish, R.; Jackson, T.; Colliander, A.; Dunbar, S.; Chen, F.; Piepmeier, J.; Yueh, S.; Entekhabi, D.; et al. Assessment of version 4 of the SMAP passive soil moisture standard product. Int. Geosci. Remote Sens. Symp. (IGARSS) 2017, 2017, 3941–3944. [Google Scholar] [CrossRef]
- Reichle, R.H.; Koster, R.D.; Dong, J.; Berg, A.A. Global soil moisture from satellite observations, land surface models, and ground data: Implications for data assimilation. J. Hydrometeorol. 2004, 5, 430–442. [Google Scholar] [CrossRef]
- Rodell, M.; Houser, P.R.; Jambor, U.; Gottschalck, J.; Mitchell, K.; Meng, C.J.; Arsenault, K.; Cosgrove, B.; Radakovich, J.; Bosilovich, M.; et al. The Global Land Data Assimilation System. Bull. Am. Meteorol. Soc. 2004, 85, 381–394. [Google Scholar] [CrossRef]
- Desilets, D.; Zreda, M.; Ferré, T.P. Nature’s neutron probe: Land surface hydrology at an elusive scale with cosmic rays. Water Resour. Res. 2010, 46, 1–7. [Google Scholar] [CrossRef]
- Liu, Y.; Yang, Y.; Yue, X. Evaluation of satellite-based soil moisture products over four different continental in-situmeasurements. Remote Sens. 2018, 10, 1161. [Google Scholar] [CrossRef]
- Zreda, M.; Desilets, D.; Ferré, T.P.A.; Scott, R.L. Measuring soil moisture content non-invasively at intermediate spatial scale using cosmic-ray neutrons. Geophys. Res. Lett. 2008, 35. [Google Scholar] [CrossRef]
- Zheng, D.; Li, X.; Wang, X.; Wang, Z.; Wen, J.; van der Velde, R.; Schwank, M.; Su, Z. Sampling depth of L-band radiometer measurements of soil moisture and freeze-thaw dynamics on the Tibetan Plateau. Remote Sens. Environ. 2019, 226, 16–25. [Google Scholar] [CrossRef]
- Escorihuela, M.J.; Chanzy, A.; Wigneron, J.P.; Kerr, Y. Effective soil moisture sampling depth of L-band radiometry: A case study. Remote Sens. Environ. 2010, 114, 995–1001. [Google Scholar] [CrossRef]
- Ulaby, F.T.; Moore, R.K.; Fung, A.K. Microwave Remote Sensing: Active and Passive, Volume 1—Microwave Remote Sensing Fundamentals and Radiometry; Addison Wesley: Norwood, MA, USA, 1981. [Google Scholar]
Publisher’s Note: MDPI stays neutral with regard to jurisdictional claims in published maps and institutional affiliations. |
© 2021 by the authors. Licensee MDPI, Basel, Switzerland. This article is an open access article distributed under the terms and conditions of the Creative Commons Attribution (CC BY) license (http://creativecommons.org/licenses/by/4.0/).

