Modelling and Comparing Shading Effects of 3D Tree Structures with Virtual Leaves
Abstract
1. Introduction
2. Materials and Methods
2.1. Site Description and Trees
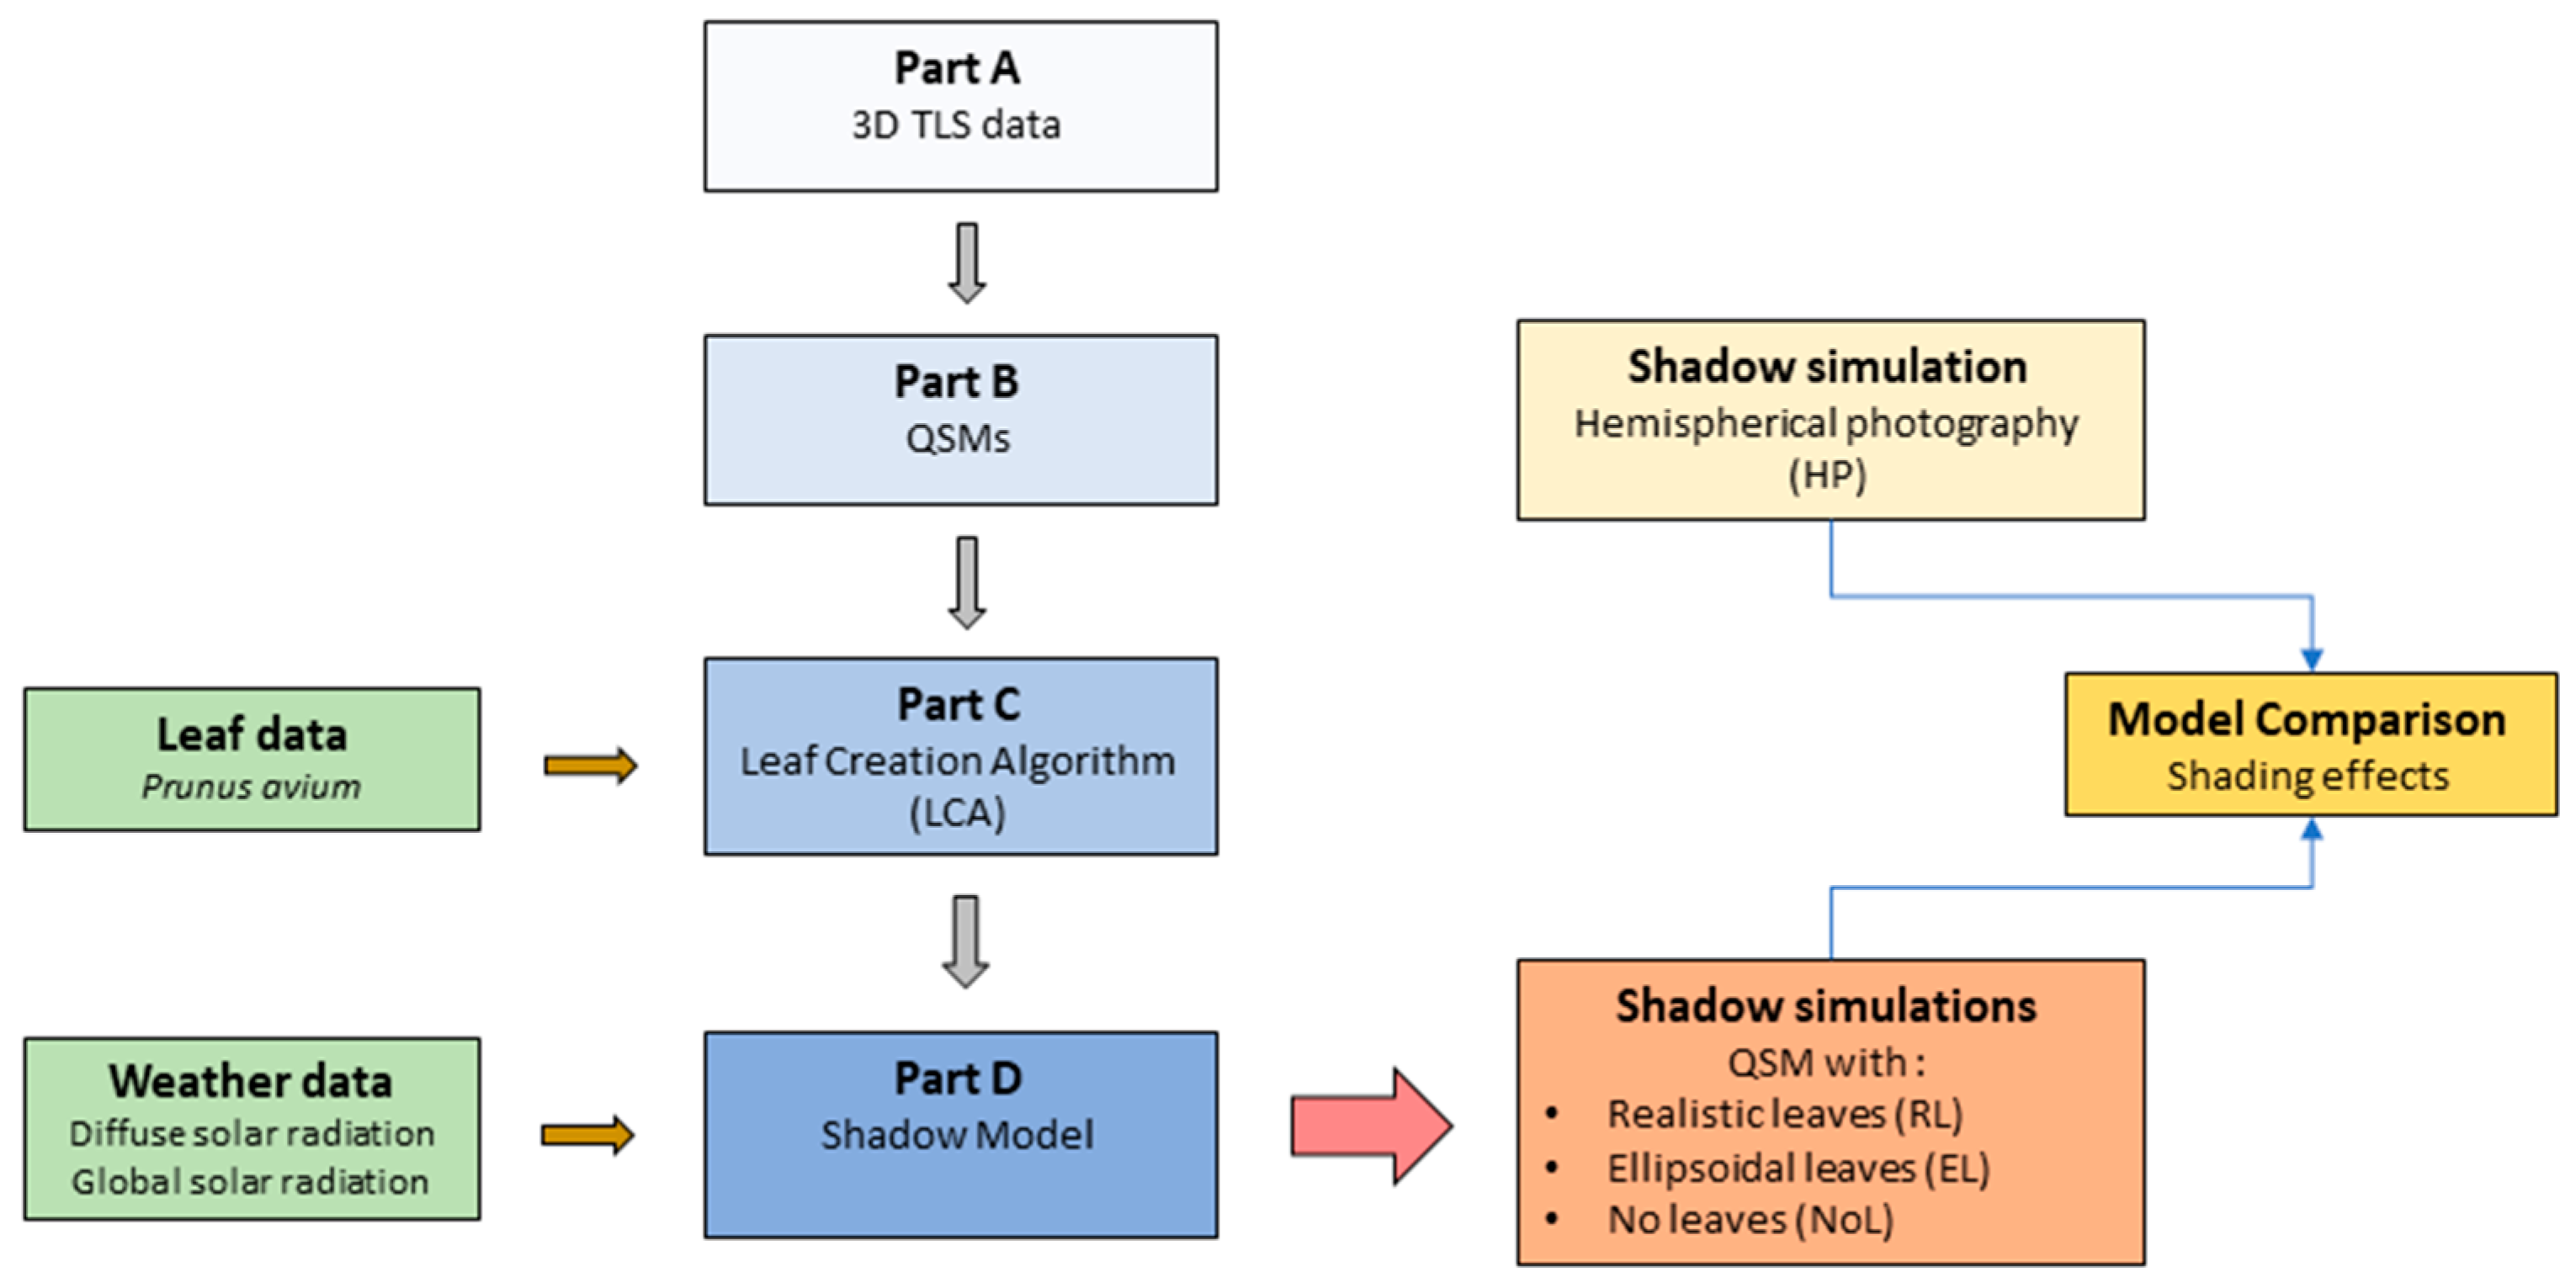
2.2. Overview of the Modelling Steps
- Part A: Collection of 3D TLS data, processing and tree segmentation;
- Part B: Creation of quantitative structure models (QSMs), representative of tree structures;
- Part C: Introduction of the leaf creation algorithm (LCA) and its application;
- Part D: Application of the shadow model using solar radiation data.
- Part A: Collection of 3D TLS Data, Processing and Tree Segmentation
- Part B: Creation of Quantitative Structure Models (QSMs)
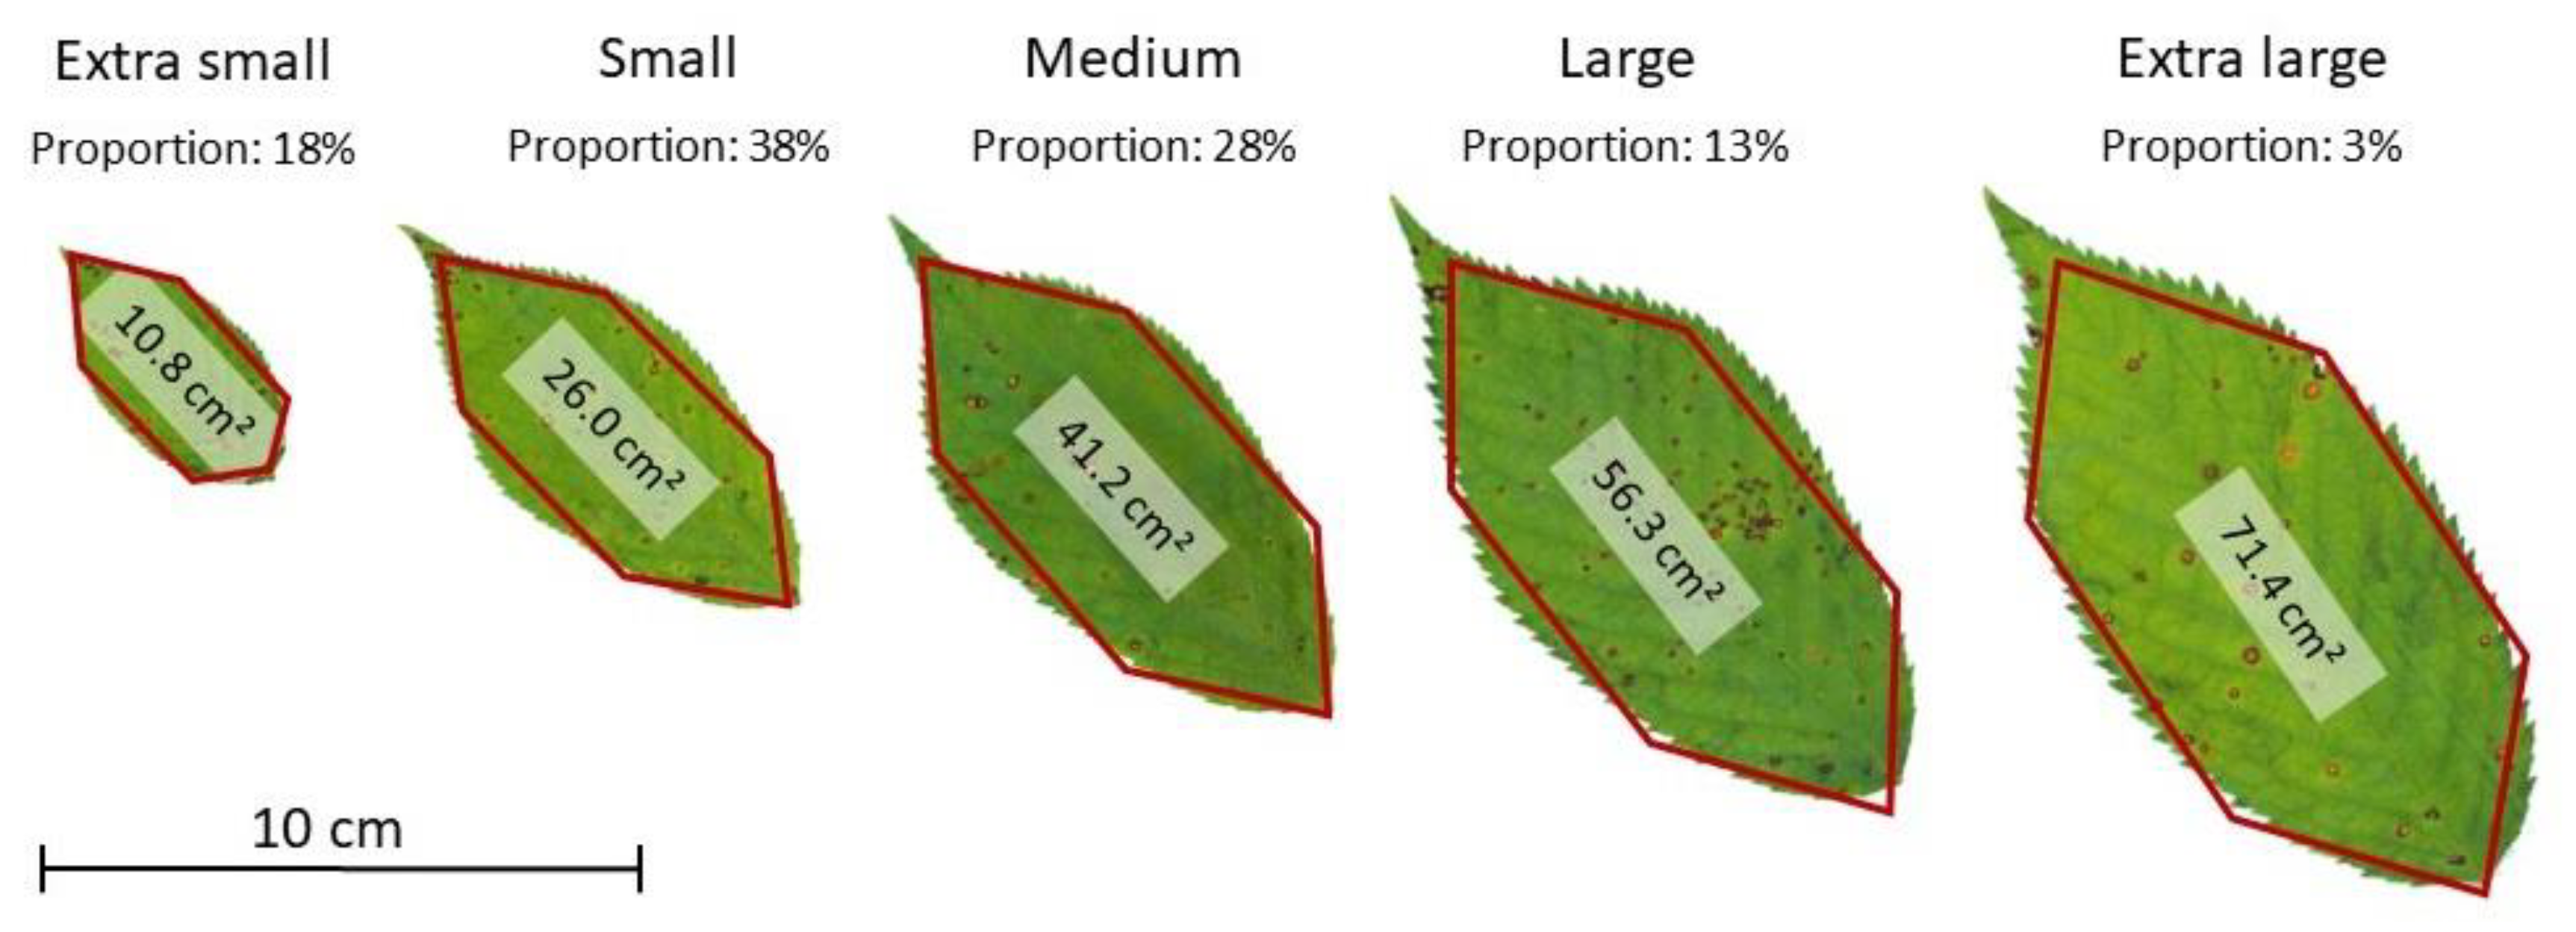
- Part C: Leaf Measurements and Leaf Creation Algorithm (LCA)
| Algorithm 1 Leaf Creation Algorithm (LCA) | |
| 1: | Load a tree-cylinder model (QSM) |
| 2: | Define parameter leaf spacing (i.e., 2 cm) |
| 3: | for each first order branch do |
| 4: | define branch section to be foliated (e.g., the first 8.47% of the length of a first order branch have no leaves). |
| 5: | for each branch cylinder to be foliated do |
| 6: | Establish positions for leaves along the directional axis between cylinder start and end, according to the parameter leaf spacing, and evenly distribute them, alternating between left and right side. |
| 7: | Expand the preliminary leaf position with 2 cm (adding a virtual petiole), perpendicular to cylinder direction and horizontal to the ground, respecting the right or left orientation (+90° or −90° from cylinder direction) |
| 8: | for each leaf position do |
| 9: | Randomly select a leaf-size class and match the lower leaf-geometry point with the established leaf position. |
| 10: | Propagate the other five leaf-geometry points by keeping leaf oriented perpendicular to cylinder direction and horizontal to the ground. |
| 11: | end for (step 8) |
| 12: | end for (step 5) |
| 13: | end for (step 3) |
| 14: | return leaf edge coordinates dataframe and leaf attributes table |
- Part D: Updated Shadow Model
2.3. Shadow Simulations
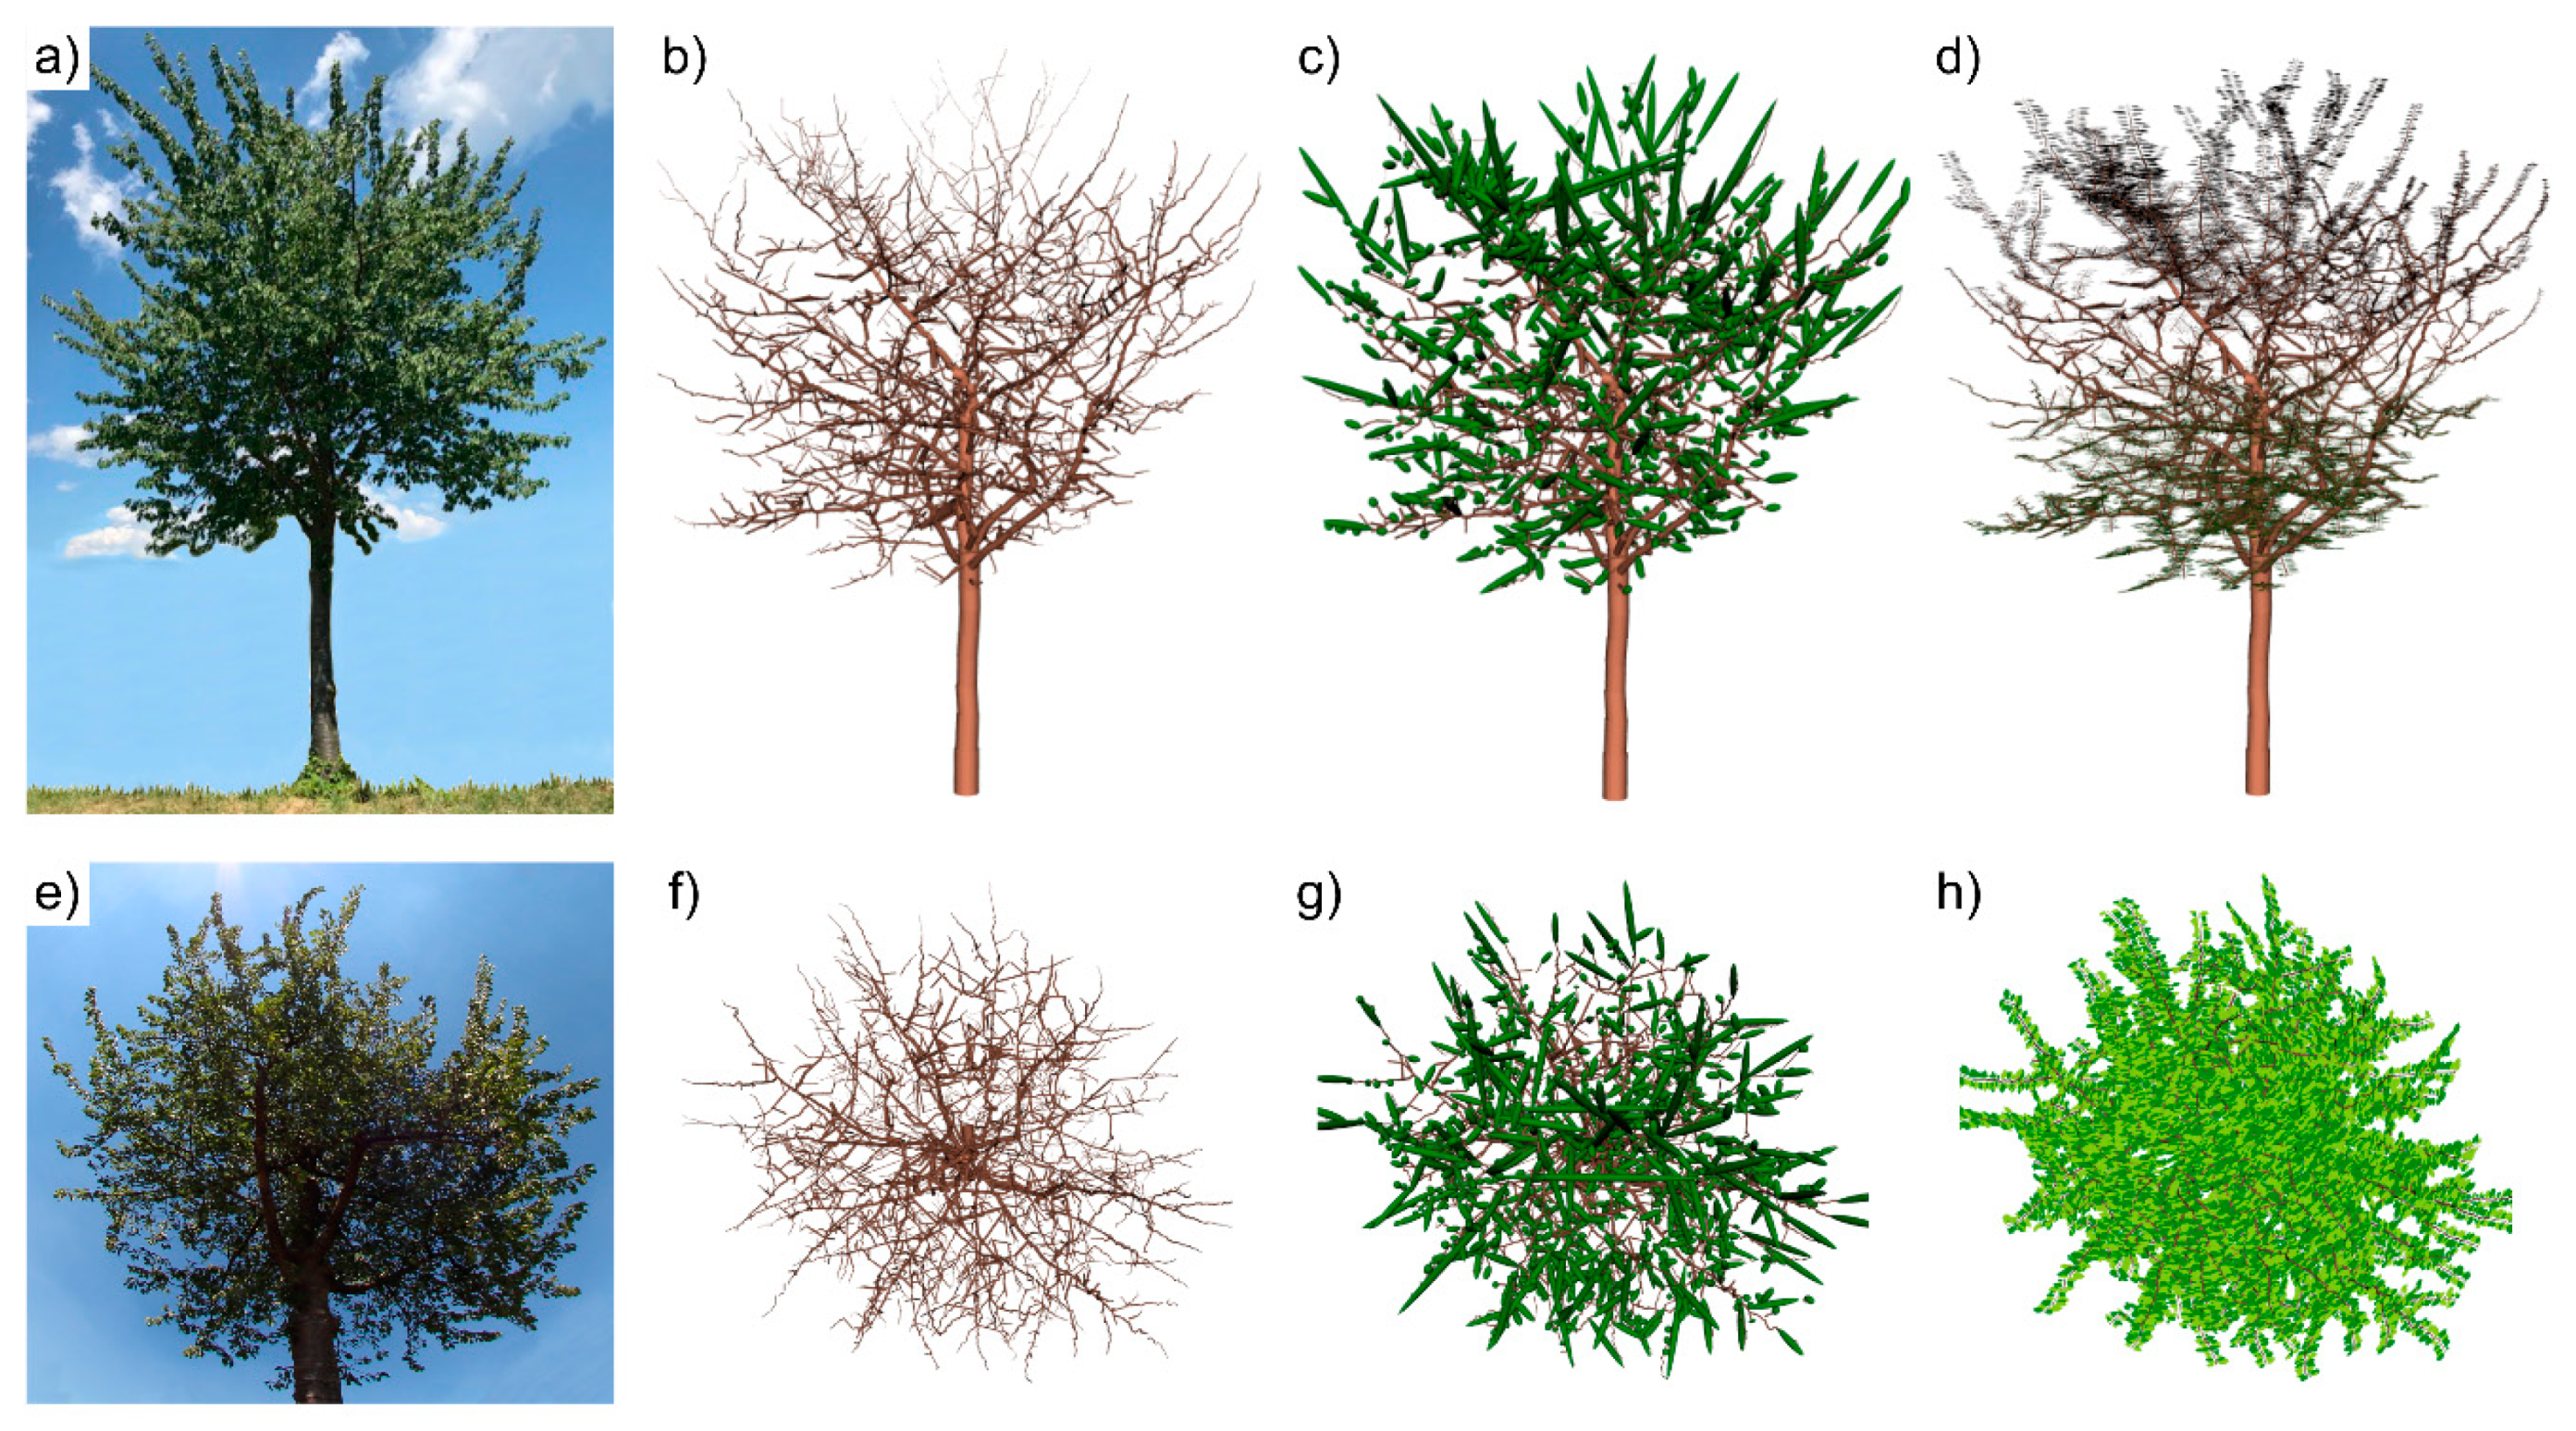
- QSMs with leaves created with the LCA (realistic leaves, RL);
- QSMs with ellipsoids as leaf-replacements (ellipsoidal leaves; EL);
- QSMs without leaves (no leaves; NoL): we were also interested in the effect of leaves on the shading in relation to a tree outside the vegetation period, under leaf-off conditions.
2.4. Comparisons and Analysis of Shading Effects
3. Results
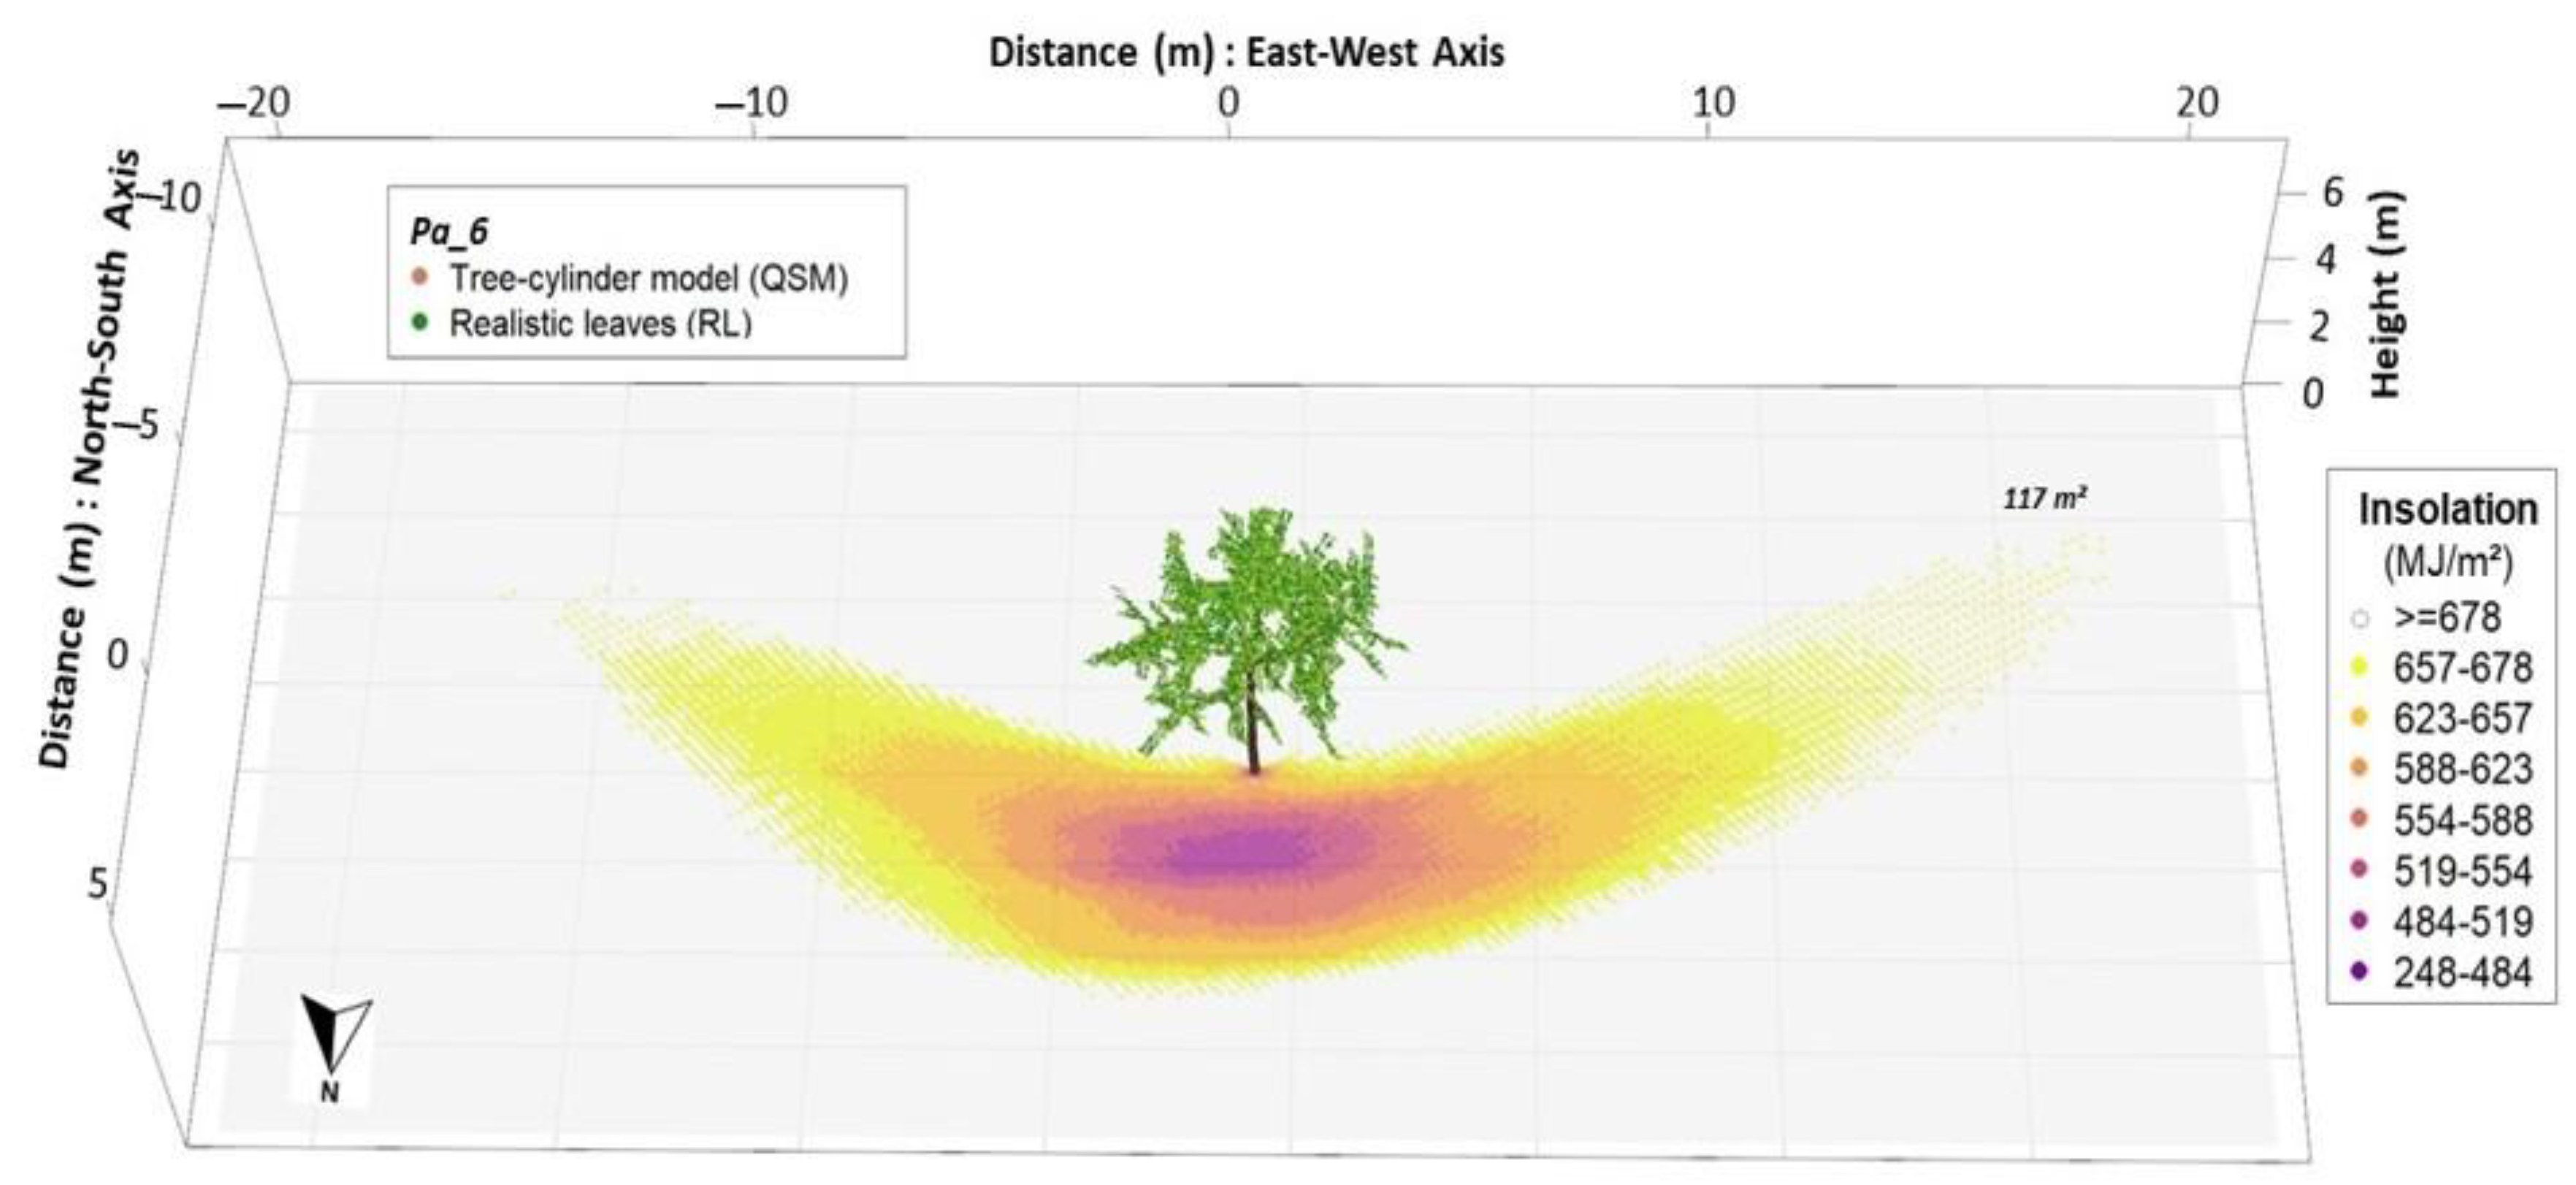
3.1. Modelling Insolation and Shading Effect with RL
3.2. Model Comparison
4. Discussion
4.1. Leaf Creation Algorithm in Comparison to Others
4.2. Shadow Simulations—Performance and Comparison
5. Conclusions
6. Outlook
Supplementary Materials
Author Contributions
Funding
Data Availability Statement
Acknowledgments
Conflicts of Interest
References
- Jones, C.G.; Lawton, J.H.; Shachak, M. Positive and negative effects of organisms as physical ecosystem engineers. Ecology 1997, 78, 1946–1957. [Google Scholar] [CrossRef]
- Valladares, F.; Laanisto, L.; Niinemets, Ü.; Zavala, M.A. Shedding light on shade: Ecological perspectives of understorey plant life. Plant Ecol. Divers. 2016, 9, 237–251. [Google Scholar] [CrossRef]
- Sheppard, J.P.; Bohn Reckziegel, R.; Borrass, L.; Chirwa, P.W.; Cuaranhua, C.J.; Hassler, S.K.; Hoffmeister, S.; Kestel, F.; Maier, R.; Mälicke, M.; et al. Agroforestry: An Appropriate and Sustainable Response to a Changing Climate in Southern Africa? Sustainability 2020, 12, 6796. [Google Scholar] [CrossRef]
- Nair, P.K.R. Classification of agroforestry systems. Agroforest. Syst. 1985, 3, 97–128. [Google Scholar] [CrossRef]
- Leakey, R. Definition of agroforestry revisited. Agrofor. Today 1996, 8, 5. [Google Scholar]
- Editors of Agroforestry Systems. What is Agroforestry? Agroforest. Syst. 1982, 1, 7–12. [Google Scholar] [CrossRef]
- Eichhorn, M.; Paris, P.; Herzog, F.; Incoll, L.; Liagre, F.; Mantzanas, K.; Mayus, M.; Moreno, G.; Papanastasis, V.; Pilbeam, D.; et al. Silvoarable Systems in Europe–Past, Present and Future Prospects. Agroforest. Syst. 2006, 67, 29–50. [Google Scholar] [CrossRef]
- Blaser, W.J.; Oppong, J.; Yeboah, E.; Six, J. Shade trees have limited benefits for soil fertility in cocoa agroforests. Agric. Ecosyst. Environ. 2017, 243, 83–91. [Google Scholar] [CrossRef]
- Schulz, V.S.; Munz, S.; Stolzenburg, K.; Hartung, J.; Weisenburger, S.; Graeff-Hönninger, S. Impact of different shading levels on growth, yield and quality of potato (Solanum tuberosum L.). Agronomy 2019, 9, 330. [Google Scholar] [CrossRef]
- Landsberg, J.J.; Sands, P.J.; Landsberg, J.; Sands, P. Physiological Ecology of Forest Production: Principles, Processes and Models; Elsevier/Academic Press: Amsterdam, The Netherlands, 2011. [Google Scholar]
- Monteith, J.; Unsworth, M. Principles of Environmental Physics: Plants, Animals, and the Atmosphere; Academic Press: Cambridge, MA, USA, 2013; ISBN 0123869935. [Google Scholar]
- Cutini, A.; Matteucci, G.; Mugnozza, G.S. Estimation of leaf area index with the Li-Cor LAI 2000 in deciduous forests. For. Ecol. Manag. 1998, 105, 55–65. [Google Scholar] [CrossRef]
- Hill, R. A lens for whole sky photographs. Q. J. R. Meteorol. Soc. 1924, 50, 227–235. [Google Scholar] [CrossRef]
- Evans, G.C.; Coombe, D.E. Hemisperical and Woodland Canopy Photography and the Light Climate. J. Ecol. 1959, 47, 103–113. [Google Scholar] [CrossRef]
- Chazdon, R.L.; Field, C.B. Photographic estimation of photosynthetically active radiation: Evaluation of a computerized technique. Oecologia 1987, 73, 525–532. [Google Scholar] [CrossRef]
- Rich, P.M.; Clark, D.B.; Clark, D.A.; Oberbauer, S.F. Long-term study of solar radiation regimes in a tropical wet forest using quantum sensors and hemispherical photography. Agric. For. Meteorol. 1993, 65, 107–127. [Google Scholar] [CrossRef]
- Roxburgh, J.R.; Kelly, D. Uses and limitations of hemispherical photography for estimating forest light environments. N. Z. J. Ecol. 1995, 19, 213–217. [Google Scholar]
- Comeau, P.G.; Gendron, F.; Letchford, T. A comparison of several methods for estimating light under a paper birch mixedwood stand. Can. J. For. Res. 1998, 28, 1843–1850. [Google Scholar] [CrossRef]
- Bellow, J.; Nair, P.K.R. Comparing common methods for assessing understory light availability in shaded-perennial agroforestry systems. Agric. For. Meteorol. 2003, 114, 197–211. [Google Scholar] [CrossRef]
- Dupraz, C.; Liagre, F. Agroforesterie: Des Arbres et des Cultures, 2nd ed.; Éditions France Agricole: Paris, France, 2011. [Google Scholar]
- Talbot, G.; Dupraz, C. Simple models for light competition within agroforestry discontinuous tree stands: Are leaf clumpiness and light interception by woody parts relevant factors? Agroforest. Syst. 2012, 84, 101–116. [Google Scholar] [CrossRef]
- Stadt, K.J.; Lieffers, V.J. MIXLIGHT: A flexible light transmission model for mixed-species forest stands. Agric. For. Meteorol. 2000, 102, 235–252. [Google Scholar] [CrossRef]
- Zhao, W.; Qualls, R.J.; Berliner, P.R. Modeling of the short wave radiation distribution in an agroforestry system. Agric. For. Meteorol. 2003, 118, 185–206. [Google Scholar] [CrossRef]
- Sinoquet, H.; Sonohat, G.; Phattaralerphong, J.; Godin, C. Foliage randomness and light interception in 3-D digitized trees: An analysis from multiscale discretization of the canopy. Plant Cell Environ. 2005, 28, 1158–1170. [Google Scholar] [CrossRef]
- Sinoquet, H.; Stephan, J.; Sonohat, G.; Lauri, P.É.; Monney, P. Simple equations to estimate light interception by isolated trees from canopy structure features: Assessment with three-dimensional digitized apple trees. New Phytol. 2007, 175, 94–106. [Google Scholar] [CrossRef] [PubMed]
- Schmidt, M.; Nendel, C.; Funk, R.; Mitchell, M.G.E.; Lischeid, G. Modeling Yields Response to Shading in the Field-to-Forest Transition Zones in Heterogeneous Landscapes. Agriculture 2019, 9, 6. [Google Scholar] [CrossRef]
- Van der Zande, D.; Stuckens, J.; Verstraeten, W.W.; Muys, B.; Coppin, P. Assessment of Light Environment Variability in Broadleaved Forest Canopies Using Terrestrial Laser Scanning. Remote Sens. 2010, 2, 1564–1574. [Google Scholar] [CrossRef]
- Béland, M.; Widlowski, J.-L.; Fournier, R.A.; Côté, J.-F.; Verstraete, M.M. Estimating leaf area distribution in savanna trees from terrestrial LiDAR measurements. Agric. For. Meteorol. 2011, 151, 1252–1266. [Google Scholar] [CrossRef]
- Dauzat, J.; Madelaine-Antin, C.; Heurtebize, J.; Lavalley, C.; Vincent, G. How Much Commercial Timber in Your Plot, How Much Carbon Sequestrated in the Trees, How Much Light Available for Undercrops? Terrestrial LIDAR is the Right Technology For Addressing These Questions. In 3rd European Agroforestry Conference-Book of Abstracts; Gosme, M., Ed.; CIRAD: Montpellier, France, 2016; pp. 121–124. ISBN 978-2-87614-717-1. [Google Scholar]
- Cifuentes, R.; van der Zande, D.; Salas, C.; Tits, L.; Farifteh, J.; Coppin, P. Modeling 3D Canopy Structure and Transmitted PAR Using Terrestrial LiDAR. Can. J. Remote Sens. 2017, 43, 124–139. [Google Scholar] [CrossRef]
- Grau, E.; Durrieu, S.; Fournier, R.; Gastellu-Etchegorry, J.-P.; Yin, T. Estimation of 3D vegetation density with Terrestrial Laser Scanning data using voxels. A sensitivity analysis of influencing parameters. Remote Sens. Environ. 2017, 191, 373–388. [Google Scholar] [CrossRef]
- Rosskopf, E.; Morhart, C.; Nahm, M. Modelling Shadow Using 3D Tree Models in High Spatial and Temporal Resolution. Remote Sens. 2017, 9, 719. [Google Scholar] [CrossRef]
- Seidel, D.; Fleck, S.; Leuschner, C. Analyzing forest canopies with ground-based laser scanning: A comparison with hemispherical photography. Agric. For. Meteorol. 2012, 154–155, 1–8. [Google Scholar] [CrossRef]
- Hackenberg, J.; Morhart, C.; Sheppard, J.P.; Spiecker, H.; Disney, M. Highly Accurate Tree Models Derived from Terrestrial Laser Scan Data: A Method Description. Forests 2014, 5, 1069–1105. [Google Scholar] [CrossRef]
- Hackenberg, J.; Spiecker, H.; Calders, K.; Disney, M.; Raumonen, P. SimpleTree—An Efficient Open Source Tool to Build Tree Models from TLS Clouds. Forests 2015, 6, 4245–4294. [Google Scholar] [CrossRef]
- Fan, G.; Nan, L.; Chen, F.; Dong, Y.; Wang, Z.; Li, H.; Chen, D. A New Quantitative Approach to Tree Attributes Estimation Based on LiDAR Point Clouds. Remote Sens. 2020, 12, 1779. [Google Scholar] [CrossRef]
- Raumonen, P.; Kaasalainen, M.; Åkerblom, M.; Kaasalainen, S.; Kaartinen, H.; Vastaranta, M.; Holopainen, M.; Disney, M.; Lewis, P. Fast automatic precision tree models from terrestrial laser scanner data. Remote Sens. 2013, 5, 491–520. [Google Scholar] [CrossRef]
- Trochta, J.; Krůček, M.; Vrška, T.; Král, K. 3D Forest: An application for descriptions of three-dimensional forest structures using terrestrial LiDAR. PLoS ONE 2017, 12, e0176871. [Google Scholar] [CrossRef] [PubMed]
- Fan, G.; Nan, L.; Dong, Y.; Su, X.; Chen, F. AdQSM: A New Method for Estimating Above-Ground Biomass from TLS Point Clouds. Remote Sens. 2020, 12, 3089. [Google Scholar] [CrossRef]
- Raumonen, P.; Casella, E.; Calders, K.; Murphy, S.; Åkerblom, M.; Kaasalainen, M. Massive-scale tree modelling from TLS data. ISPRS Annals of the Photogrammetry. Remote Sens. Spat. Inf. Sci. 2015, 2, 189. [Google Scholar]
- Calders, K.; Newnham, G.; Burt, A.; Murphy, S.; Raumonen, P.; Herold, M.; Culvenor, D.; Avitabile, V.; Disney, M.; Armston, J. Nondestructive estimates of above-ground biomass using terrestrial laser scanning. Methods Ecol. Evol. 2015, 6, 198–208. [Google Scholar] [CrossRef]
- Åkerblom, M.; Raumonen, P.; Casella, E.; Disney, M.I.; Danson, F.M.; Gaulton, R.; Schofield, L.A.; Kaasalainen, M. Non-intersecting leaf insertion algorithm for tree structure models. Interface Focus 2018, 8, 20170045. [Google Scholar] [CrossRef]
- Kaasalainen, S.; Krooks, A.; Liski, J.; Raumonen, P.; Kaartinen, H.; Kaasalainen, M.; Puttonen, E.; Anttila, K.; Mäkipää, R. Change Detection of Tree Biomass with Terrestrial Laser Scanning and Quantitative Structure Modelling. Remote Sens. 2014, 6, 3906–3922. [Google Scholar] [CrossRef]
- Sheppard, J.P.; Morhart, C.; Hackenberg, J.; Spiecker, H. Terrestrial laser scanning as a tool for assessing tree growth. iForest 2017, 10, 172–179. [Google Scholar] [CrossRef]
- Luoma, V.; Saarinen, N.; Kankare, V.; Tanhuanpää, T.; Kaartinen, H.; Kukko, A.; Holopainen, M.; Hyyppä, J.; Vastaranta, M. Examining Changes in Stem Taper and Volume Growth with Two-Date 3D Point Clouds. Forests 2019, 10, 382. [Google Scholar] [CrossRef]
- Global Solar Atlas. GSA 2.3. World Bank Group, World. 2020. Available online: https://globalsolaratlas.info/map?c=11.523088,8.4375,3 (accessed on 3 November 2020).
- Morhart, C.; Sheppard, J.P.; Schuler, J.K.; Spiecker, H. Above-ground woody biomass allocation and within tree carbon and nutrient distribution of wild cherry (Prunus avium L.)—A case study. For. Ecosyst. 2016, 3, 1–15. [Google Scholar] [CrossRef]
- Pascu, I.-S.; Dobre, A.-C.; Badea, O.; Tanase, M.A. Retrieval of Forest Structural Parameters From Terrestrial Laser Scanning: A Romanian Case Study. Forests 2020, 11, 392. [Google Scholar] [CrossRef]
- CloudCompare. CloudCompare. v2.10.2 (Zephyrus) [Windows 64-bit]. 2019. Available online: http://www.cloudcompare.org/ (accessed on 4 February 2020).
- Disney, M.I.; Boni Vicari, M.; Burt, A.; Calders, K.; Lewis, S.L.; Raumonen, P.; Wilkes, P. Weighing trees with lasers: Advances, challenges and opportunities. Interface Focus 2018, 8. [Google Scholar] [CrossRef]
- Raumonen, P. TreeQSM. MATLAB-Software v2.30. 2017. Available online: https://github.com/InverseTampere/TreeQSM (accessed on 1 November 2018).
- Bohn Reckziegel, R.; Larysch, E.; Morhart, C.; Kahle, H.-P.; Seifert, T. Modelling shadow cast by trees using 3D models with artificial leaves. In Proceedings of the Book of Abstracts of the 9th International Conference on Functional-Structural Plant Models, Online, 5–9 October 2020; Kahlen, K., Chen, T.-W., Fricke, A., Stützel, H., Eds.; pp. 133–134. [Google Scholar]
- Deutscher Wetterdienst (DWD). CDC (Climate Data Center): Hourly Station Observations of Solar Irradiation. 2019. Available online: https://opendata.dwd.de/climate_environment/CDC/observations_germany/climate/10_minutes/solar/ (accessed on 24 February 2020).
- R Core Team. R: A Language and Environment for Statistical Computing. Microsoft R Open 3.5.3. Vienna, Austria, 2019. Available online: https://www.R-project.org/ (accessed on 4 February 2020).
- Bivand, R.S.; Pebesma, E.J.; Gómez-Rubio, V. Applied Spatial Data Analysis with R, 2nd ed.; Springer: Berlin/Heidelberg, Germany, 2013. [Google Scholar]
- Pebesma, E.; Bivand, R.S. S classes and methods for spatial data: Sp Package. R News 2005, 5, 9–13. [Google Scholar]
- Corripio, J.G. Insol: Solar Radiation. R Package Version 1.2.1. 2019. Available online: https://CRAN.R-project.org/package=insol (accessed on 4 February 2020).
- Adler, D.; Murdoch, D. Rgl: 3D Visualization Using OpenGL. R Package Version 0.100.19. 2019. Available online: https://CRAN.R-project.org/package=rgl (accessed on 4 February 2020).
- Canham, C.D.; Denslow, J.S.; Platt, W.J.; Runkle, J.R.; Spies, T.A.; White, P.S. Light regimes beneath closed canopies and tree-fall gaps in temperate and tropical forests. Can. J. For. Res. 1990, 20, 620–631. [Google Scholar] [CrossRef]
- Lee, S.-I. Developing a bivariate spatial association measure: An integration of Pearson′s r and Moran′s I. J. Geogr. Syst. 2001, 3, 369–385. [Google Scholar] [CrossRef]
- Lee, S.-I. A Generalized Significance Testing Method for Global Measures of Spatial Association: An Extension of the Mantel Test. Environ. Plan. Econ. Space 2004, 36, 1687–1703. [Google Scholar] [CrossRef]
- Tiefelsdorf, M.; Griffith, D.A.; Boots, B. A variance-stabilizing coding scheme for spatial link matrices. Environ. Plan. A 1999, 31, 165–180. [Google Scholar] [CrossRef]
- Kim, D.; Seo, S.; Min, S.; Simoni, Z.; Kim, S.; Kim, M. A Closer Look at the Bivariate Association between Ambient Air Pollution and Allergic Diseases: The Role of Spatial Analysis. Int. J. Environ. Res. Public. Health 2018, 15, 1625. [Google Scholar] [CrossRef]
- Côté, J.-F.; Fournier, R.A.; Egli, R. An architectural model of trees to estimate forest structural attributes using terrestrial LiDAR. Environ. Model. Softw. 2011, 26, 761–777. [Google Scholar] [CrossRef]
- Zheng, G.; Moskal, L.M. Leaf Orientation Retrieval from Terrestrial Laser Scanning (TLS) Data. IEEE Trans. Geosci. Remote Sens. 2012, 50, 3970–3979. [Google Scholar] [CrossRef]
- Ma, L.; Zheng, G.; Eitel, J.U.H.; Moskal, L.M.; He, W.; Huang, H. Improved Salient Feature-Based Approach for Automatically Separating Photosynthetic and Nonphotosynthetic Components Within Terrestrial Lidar Point Cloud Data of Forest Canopies. IEEE Trans. Geosci. Remote Sens. 2016, 54, 679–696. [Google Scholar] [CrossRef]
- Falster, D.S.; Westoby, M. Leaf size and angle vary widely across species: What consequences for light interception? New Phytol. 2003, 158, 509–525. [Google Scholar] [CrossRef]
- Urban, J.; Tatarinov, F.; Nadezhdina, N.; Čermák, J.; Ceulemans, R. Crown structure and leaf area of the understorey species Prunus serotina. Trees 2009, 23, 391–399. [Google Scholar] [CrossRef]
- Miljković, D.; Stefanović, M.; Orlović, S.; Stanković Neđić, M.; Kesić, L.; Stojnić, S. Wild cherry (Prunus avium (L.) L.) leaf shape and size variations in natural populations at different elevations. Alp. Bot. 2019, 129, 163–174. [Google Scholar] [CrossRef]
- Chianucci, F.; Pisek, J.; Raabe, K.; Marchino, L.; Ferrara, C.; Corona, P. A dataset of leaf inclination angles for temperate and boreal broadleaf woody species. Ann. For. Sci. 2018, 75, 50. [Google Scholar] [CrossRef]
- Vicari, M.B.; Pisek, J.; Disney, M. New estimates of leaf angle distribution from terrestrial LiDAR: Comparison with measured and modelled estimates from nine broadleaf tree species. Agric. For. Meteorol. 2019, 264, 322–333. [Google Scholar] [CrossRef]
- Mc Millen, G.G.; Mc Clendon, J.H. Leaf Angle: An Adaptive Feature of Sun and Shade Leaves. Bot. Gaz. 1979, 140, 437–442. [Google Scholar]
- Liu, C.; Li, Y.; Xu, L.; Chen, Z.; He, N. Variation in leaf morphological, stomatal, and anatomical traits and their relationships in temperate and subtropical forests. Sci. Rep. 2019, 9, 5803. [Google Scholar] [CrossRef]
- Bohn Reckziegel, R.; Sheppard, J.P.; Morhart, C.; Du Toit, B.; Kahle, H.-P. Modelling shade cast by rows of trees using 3D models based on terrestrial laser scanning data. In Proceedings of the Book of Abstracts of the 9th International Conference on Functional-Structural Plant Models, Online, 5–9 October 2020; Kahlen, K., Chen, T.-W., Fricke, A., Stützel, H., Eds.; pp. 169–170. [Google Scholar]

| Terminology | Definition |
|---|---|
| Solar Radiation Energy | The radiant energy from the sun that drives photosynthesis, the energy source of tree growth, absorbed by leaves [10]. It is the short-wave electromagnetic radiation [11]. |
| Insolation | Amount of solar radiation received on a given surface in a given time period [10], or simply the power per unit area received from the sun. Synonyms: solar irradiation/irradiance, solar exposure. |
| Reduced Insolation | Amount of solar radiation received on a given surface in a given time period after discounting the shading effect of obstacles (e.g., trees and leaves). This is assessed by comparing the insolation of one-unit area in comparison to another, under full radiation conditions. |
| Light | Sometimes is referred as a synonym for solar radiation energy. Other times, referred as to visible light, which is the radiation within the portion of the electromagnetic spectrum that can be perceived by the human eye. Moreover, a synonym for Photosynthetically Active Radiation (PAR). |
| Shadow | Absence of light; the dark area created by blocking the visible light from a light source (i.e., the sun) |
| Shading effect | Area subjected to reduced insolation. In this paper, often described by the “shaded area” (the surface not under full radiation conditions) and “insolation reduction” (the energy reduction in a given time period). |
| Property | Pa_1 | Pa_2 | Pa_3 | Pa_4 | Pa_5 | Pa_6 |
|---|---|---|---|---|---|---|
| DBH (cm) | 20.2 | 24.8 | 23.9 | 20.2 | 26.3 | 18.8 |
| Tree height (m) | 6.13 | 8.46 | 8.09 | 8.71 | 9.03 | 7.43 |
| Total tree volume (l) | 277.7 | 489.0 | 356.7 | 528.3 | 603.1 | 216.9 |
| Cylinder count | 4141 | 5935 | 3601 | 5758 | 5465 | 1993 |
| Cumulative branch length (m) | 430.6 | 521.5 | 373.6 | 579.3 | 624.4 | 249.1 |
| Total branch volume (l) | 169.3 | 301.7 | 190.1 | 339 | 363.8 | 110.8 |
| Max. branch order | 7 | 8 | 8 | 7 | 8 | 7 |
| Branch count | 924 | 1057 | 784 | 1407 | 1199 | 507 |
| Tree | Total Leaf Area (m²) | Leaf Count | Proportion of Leaves per Size Classes | ||||
|---|---|---|---|---|---|---|---|
| Extra Small | Small | Medium | Large | Extra Large | |||
| Pa_1 | 75.4 | 23,059 | 18.3% | 38.0% | 27.7% | 12.9% | 3.1% |
| Pa_2 | 113.1 | 34,694 | 18.3% | 38.4% | 27.5% | 12.6% | 3.1% |
| Pa_3 | 66.3 | 20,299 | 18.3% | 38.4% | 27.4% | 12.7% | 3.2% |
| Pa_4 | 102.4 | 31,417 | 18.6% | 37.8% | 27.9% | 12.7% | 3.0% |
| Pa_5 | 114.9 | 35,194 | 18.4% | 38.1% | 27.5% | 13.1% | 2.9% |
| Pa_6 | 40.8 | 12,539 | 18.3% | 38.3% | 28.1% | 12.6% | 2.7% |
| Leaf Mode | Shaded Area (m²) | Insolation Reduction (MJ m²) | Insolation Reduction (%) | ||||||
|---|---|---|---|---|---|---|---|---|---|
| Mean | STD | Δ | Mean | STD | Δ | Mean | STD | Δ | |
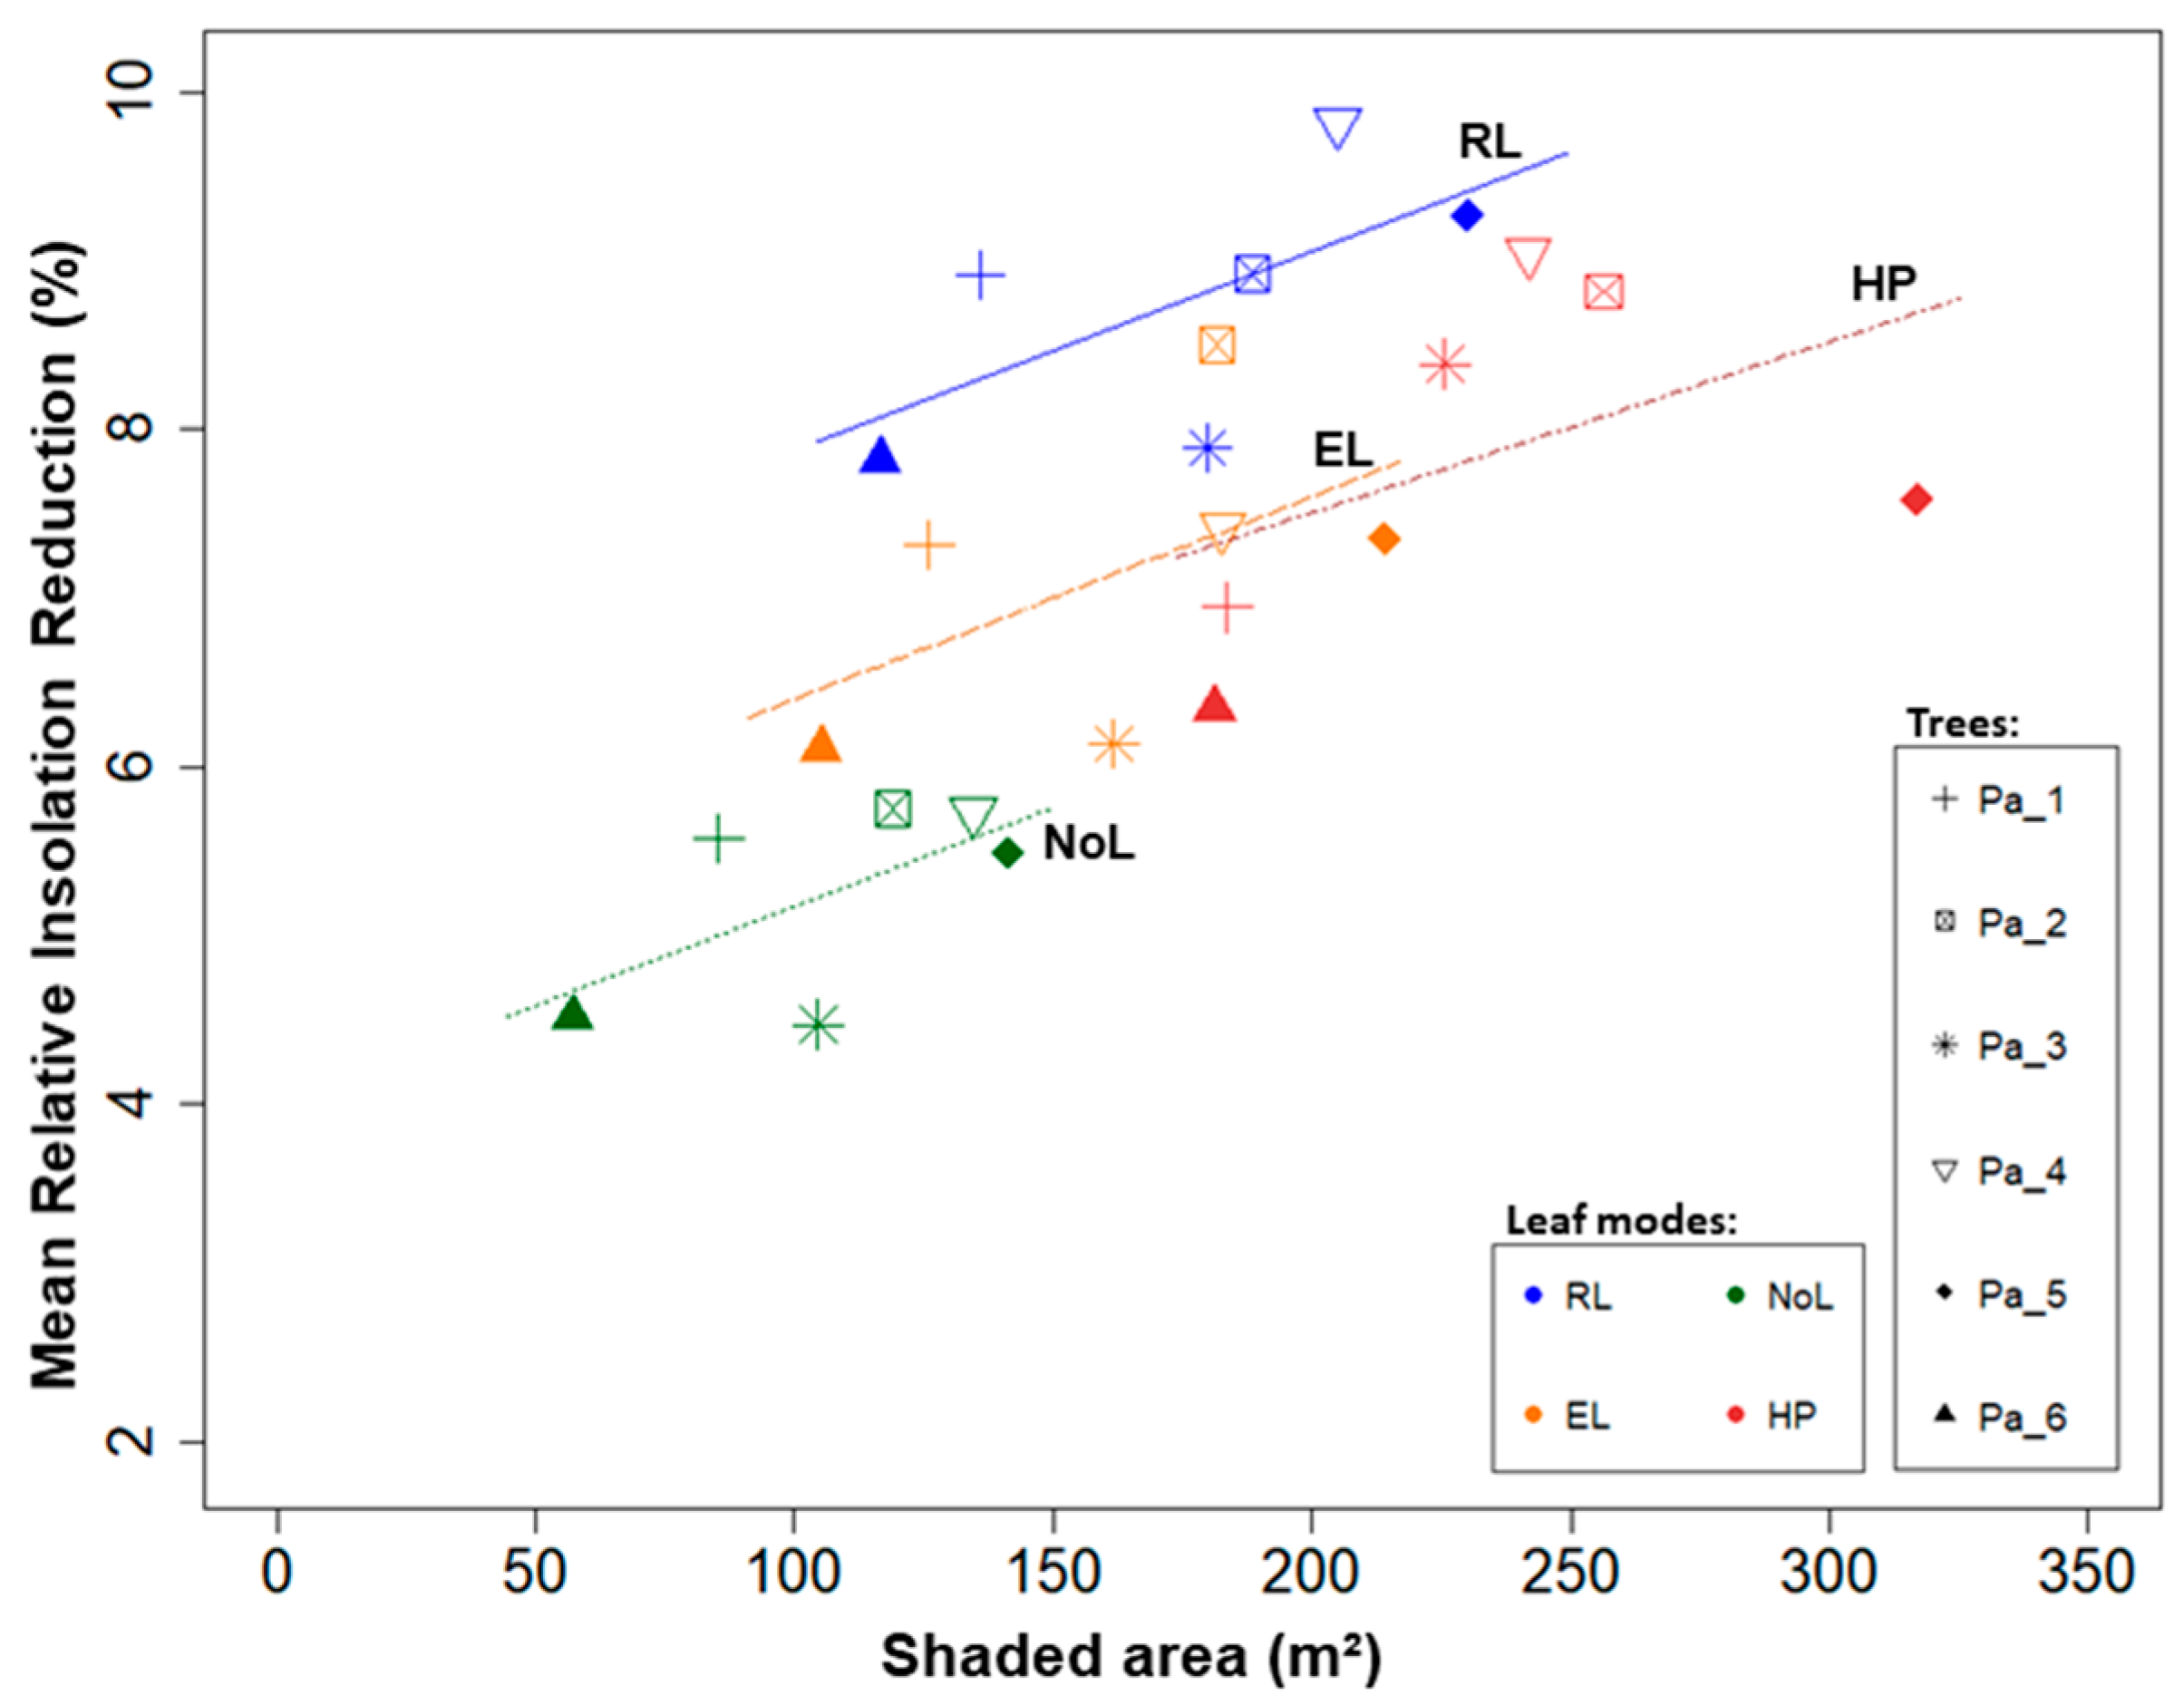
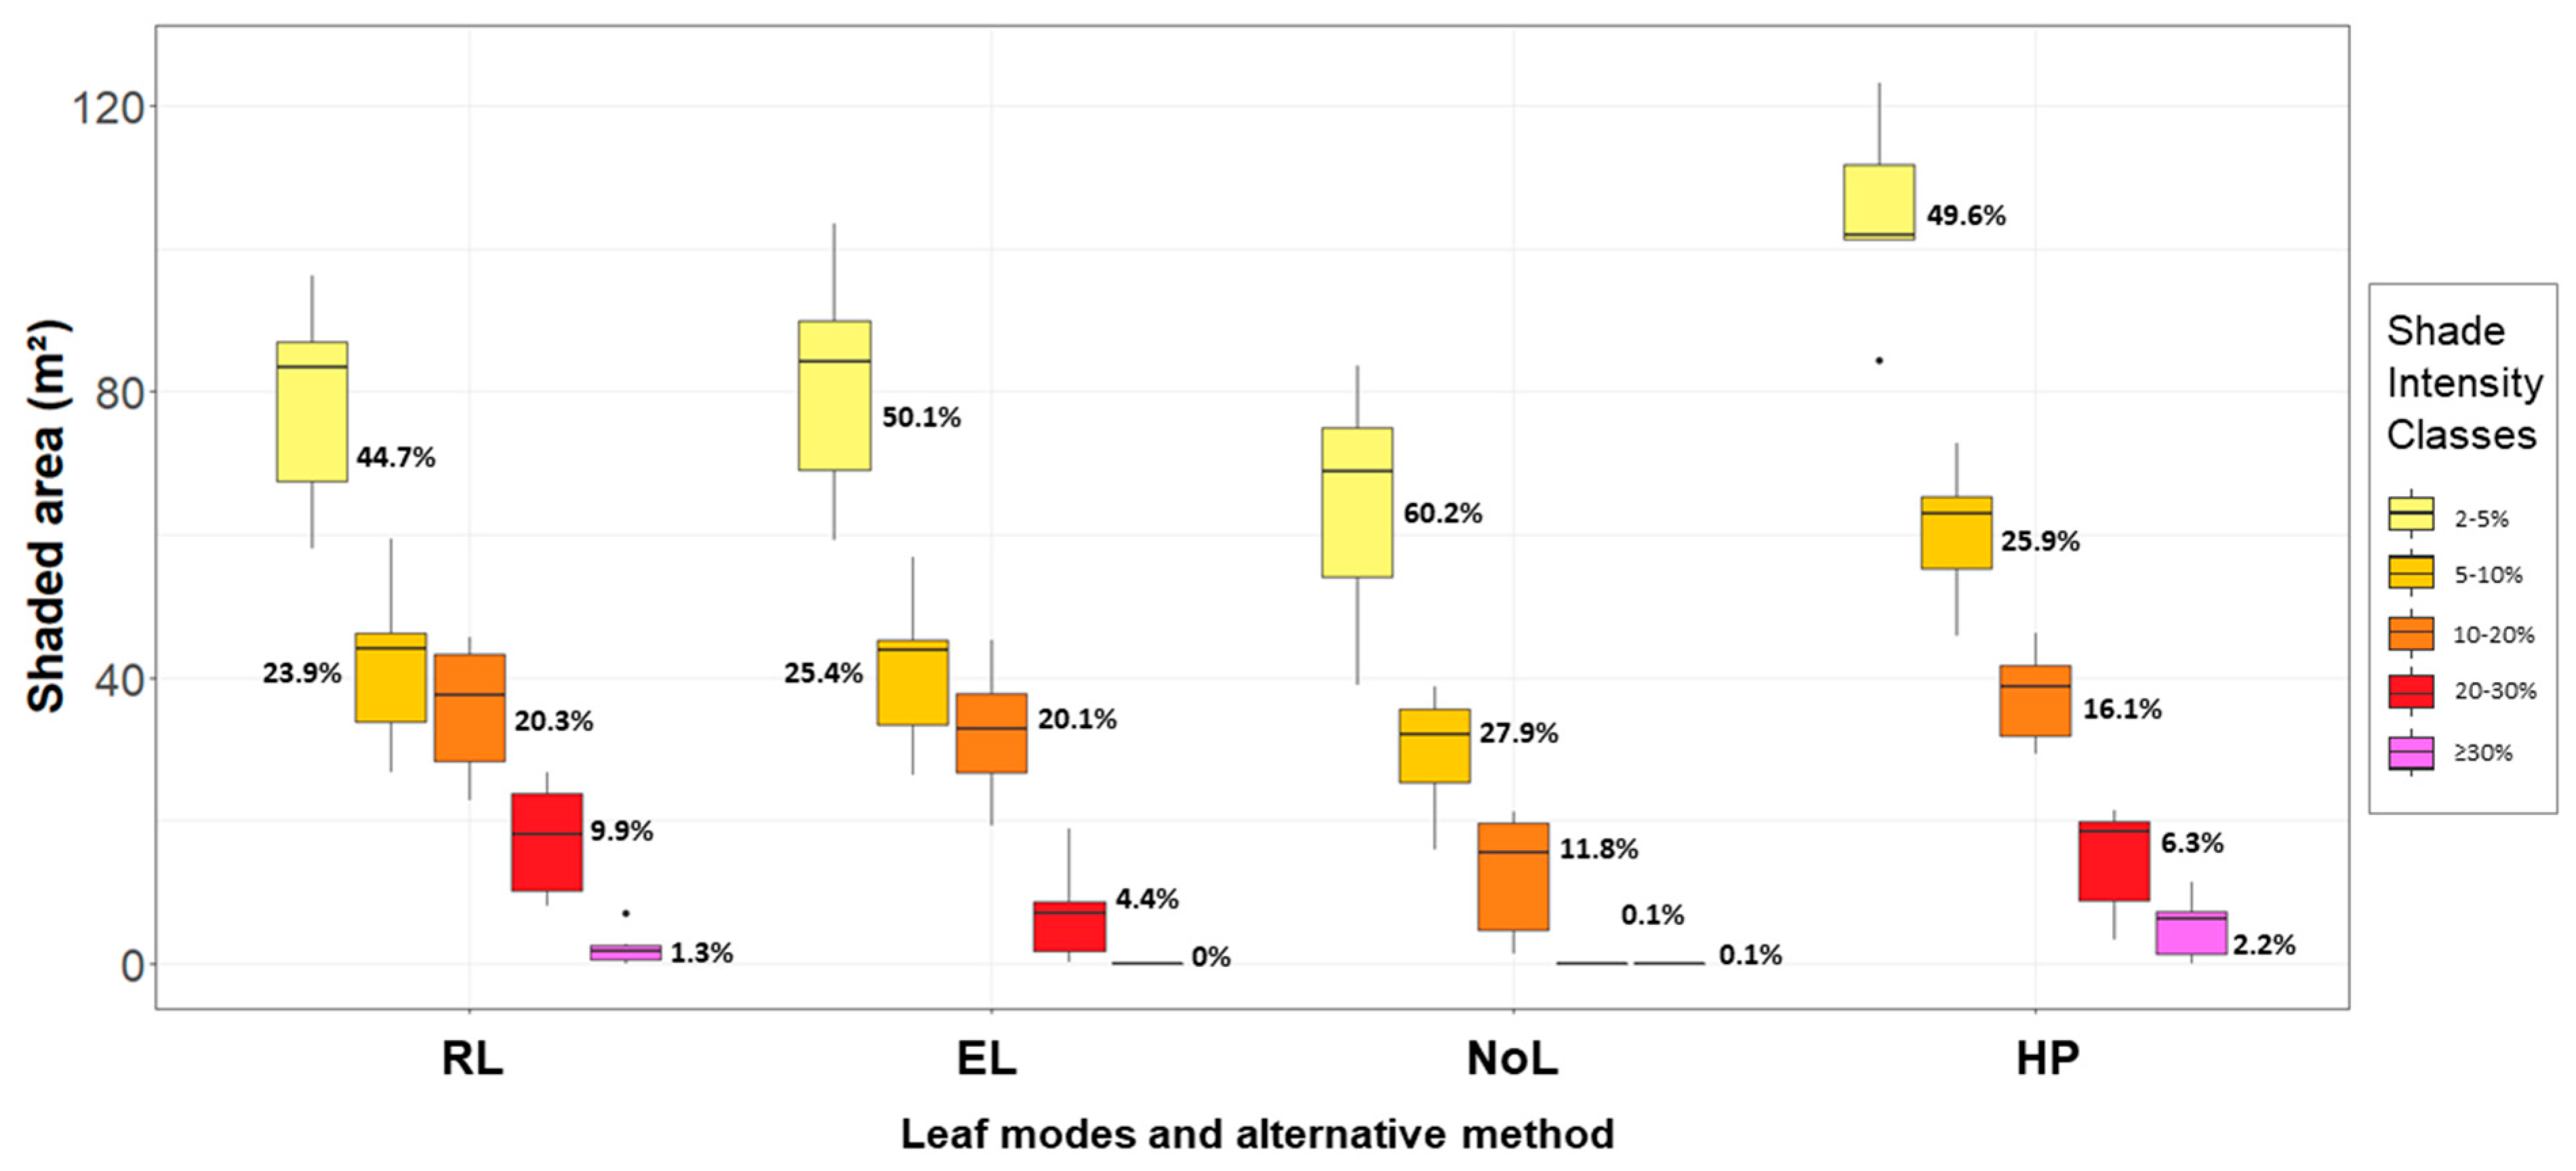
| RL | 175.91 | ±42.56 | - | 60.67 | ±5.42 | - | 8.77 | ±0.78 | - |
| EL | 161.88 | ±40.09 | −8.0% | 49.38 | ±6.27 | −18.6% | 7.14 | ±0.91 | −18.6% |
| NoL | 107.05 | ±31.80 | −39.1% | 36.35 | ±4.16 | −40.1% | 5.25 | ±0.60 | −40.1% |
| HP | 234.25 | ±50.67 | +33.2% | - | - | - | 7.85 | ±1.08 | −10.4% |
| Tree | RL vs. | SSSx | SSSy | r Weights | r Pearson | L |
|---|---|---|---|---|---|---|
| Pa_1 | EL | 0.651 | 0.665 | 0.968 | 0.989 | 0.653 |
| NoL | 0.651 | 0.641 | 0.749 | 0.955 | 0.623 | |
| HP | 0.651 | 0.588 | 0.636 | 0.804 | 0.490 | |
| Pa_2 | EL | 0.677 | 0.700 | 0.970 | 0.991 | 0.684 |
| NoL | 0.677 | 0.674 | 0.755 | 0.957 | 0.652 | |
| HP | 0.677 | 0.530 | 0.414 | 0.656 | 0.361 | |
| Pa_3 | EL | 0.650 | 0.662 | 0.868 | 0.958 | 0.632 |
| NoL | 0.650 | 0.566 | 0.713 | 0.892 | 0.546 | |
| HP | 0.650 | 0.538 | 0.213 | 0.558 | 0.255 | |
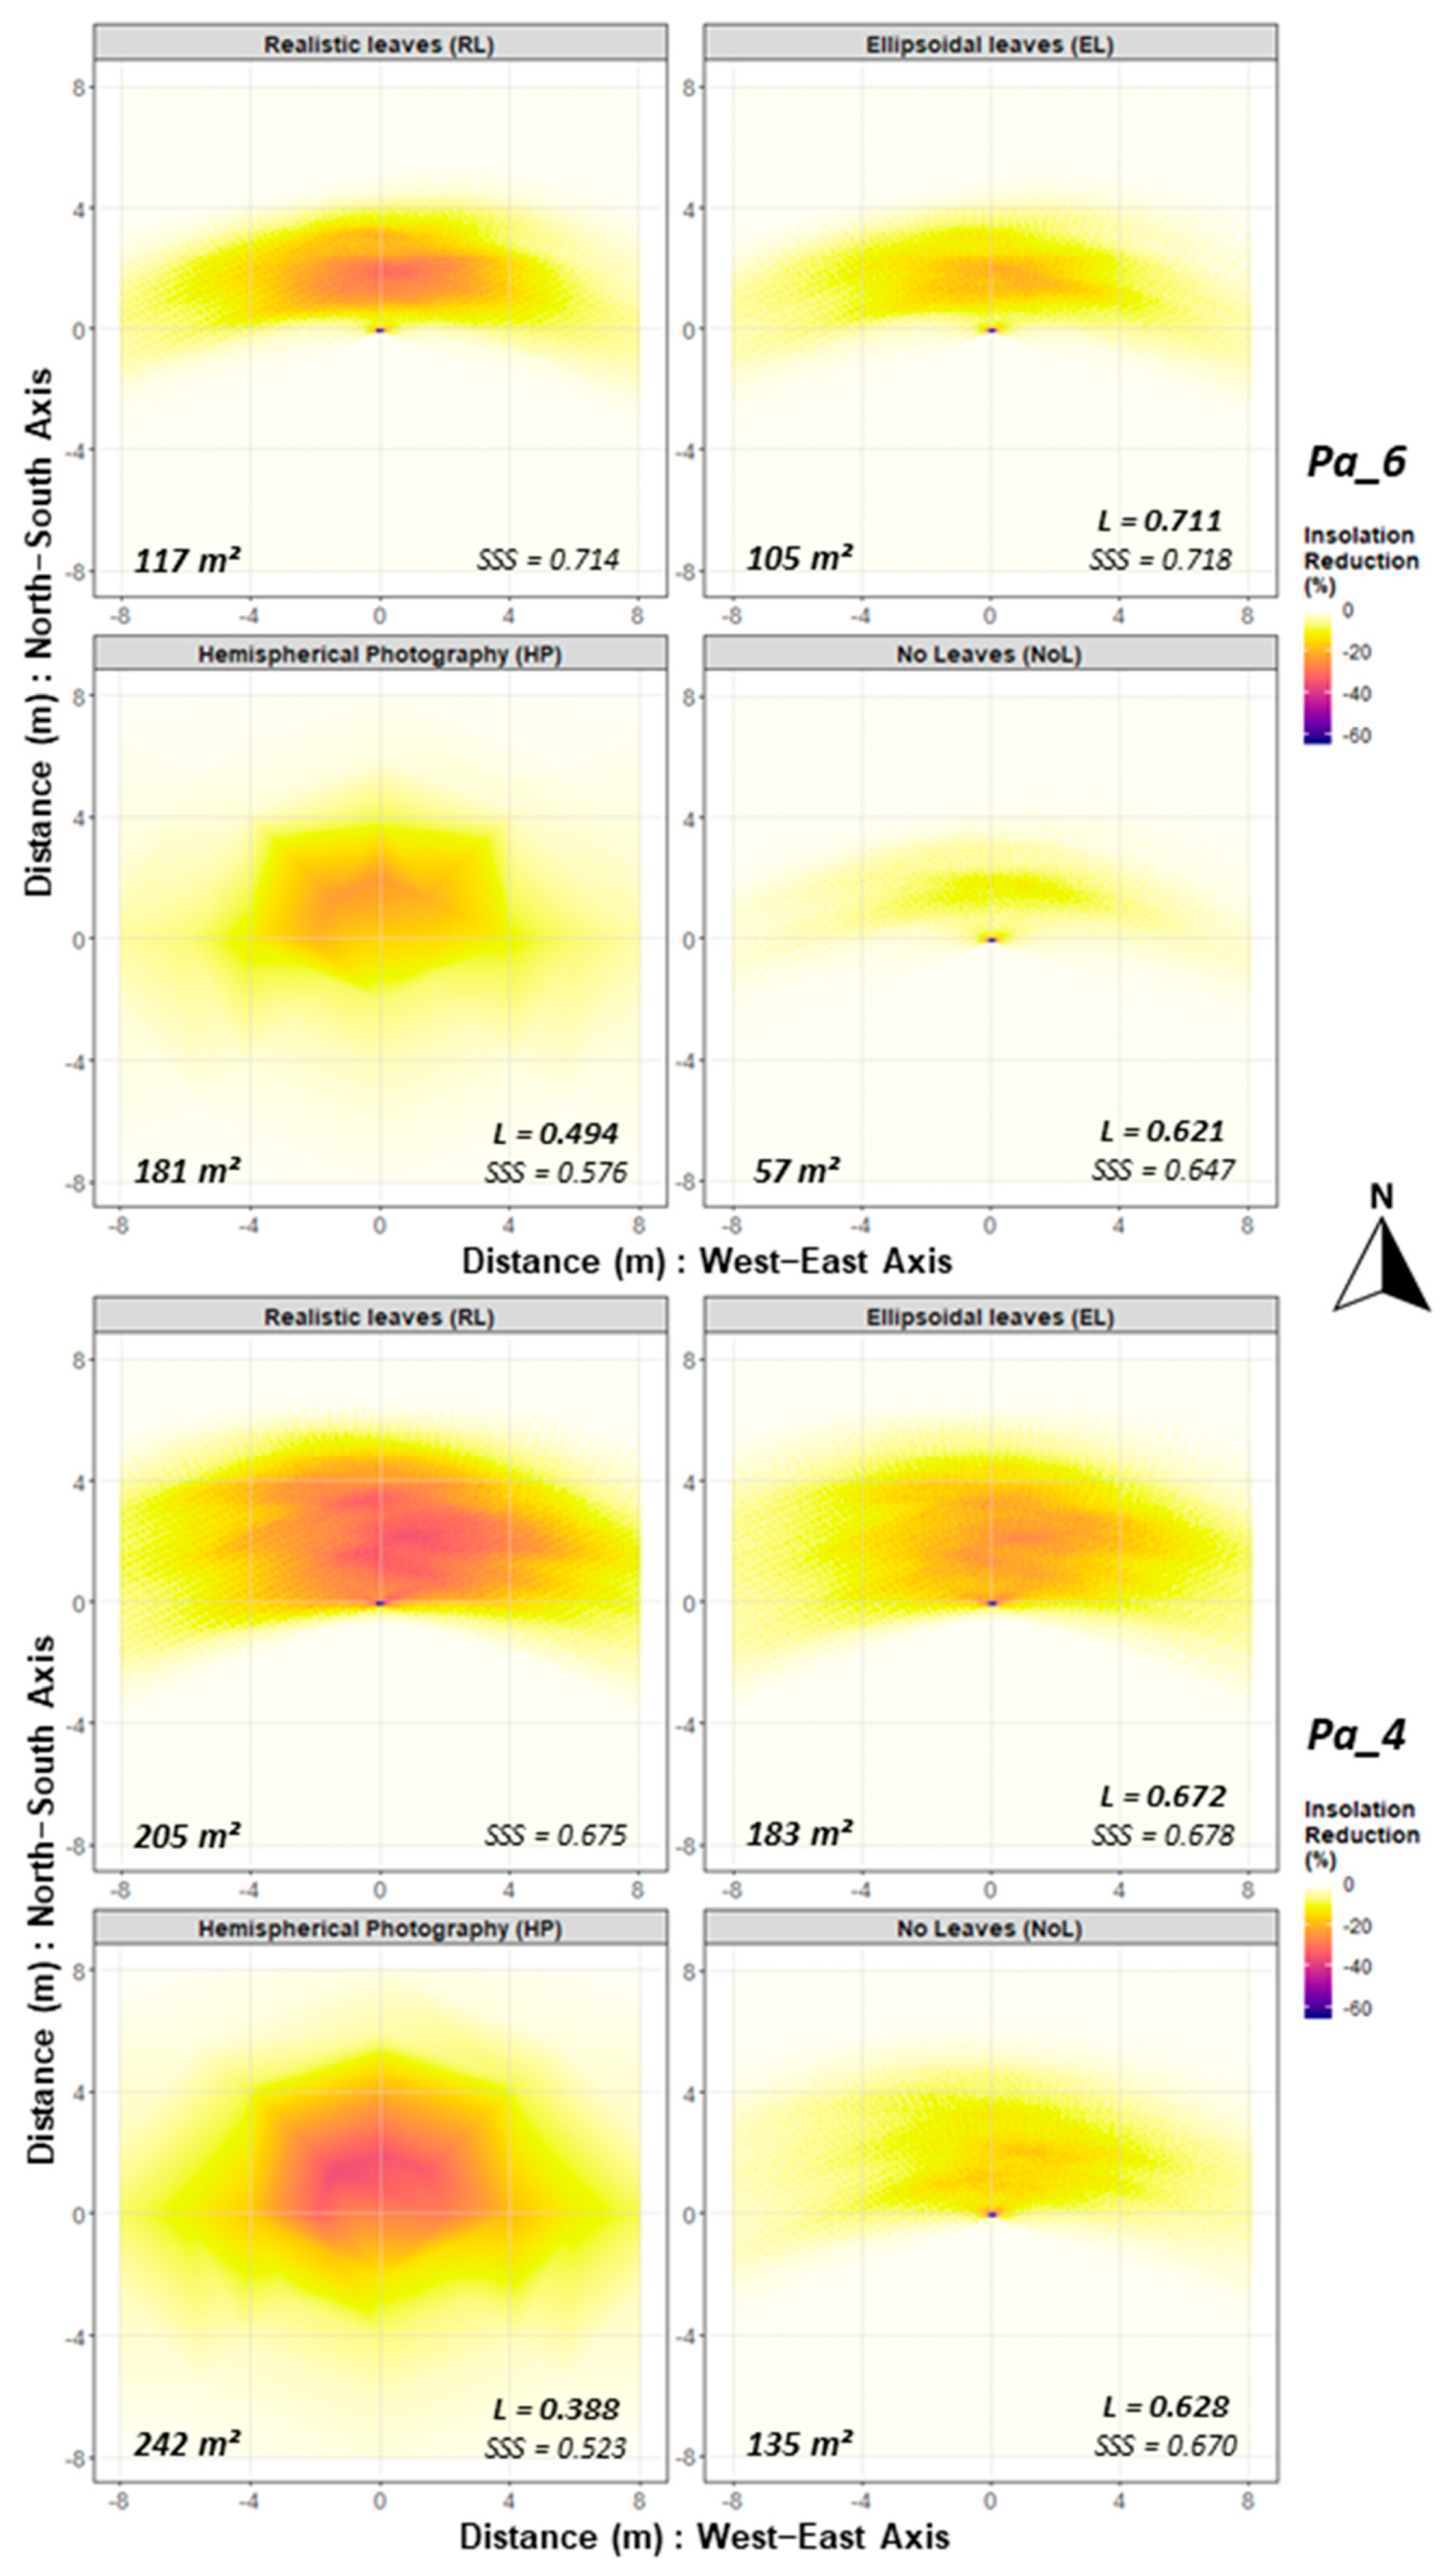
| Pa_4 | EL | 0.675 | 0.678 | 0.929 | 0.989 | 0.672 |
| NoL | 0.675 | 0.668 | 0.668 | 0.954 | 0.647 | |
| HP | 0.675 | 0.523 | 0.419 | 0.707 | 0.388 | |
| Pa_5 | EL | 0.665 | 0.689 | 0.936 | 0.987 | 0.671 |
| NoL | 0.665 | 0.670 | 0.624 | 0.936 | 0.629 | |
| HP | 0.665 | 0.528 | 0.369 | 0.711 | 0.386 | |
| Pa_6 | EL | 0.714 | 0.718 | 0.945 | 0.988 | 0.711 |
| NoL | 0.714 | 0.647 | 0.556 | 0.896 | 0.621 | |
| HP | 0.714 | 0.576 | 0.667 | 0.774 | 0.494 |
Publisher’s Note: MDPI stays neutral with regard to jurisdictional claims in published maps and institutional affiliations. |
© 2021 by the authors. Licensee MDPI, Basel, Switzerland. This article is an open access article distributed under the terms and conditions of the Creative Commons Attribution (CC BY) license (http://creativecommons.org/licenses/by/4.0/).
Share and Cite
Bohn Reckziegel, R.; Larysch, E.; Sheppard, J.P.; Kahle, H.-P.; Morhart, C. Modelling and Comparing Shading Effects of 3D Tree Structures with Virtual Leaves. Remote Sens. 2021, 13, 532. https://doi.org/10.3390/rs13030532
Bohn Reckziegel R, Larysch E, Sheppard JP, Kahle H-P, Morhart C. Modelling and Comparing Shading Effects of 3D Tree Structures with Virtual Leaves. Remote Sensing. 2021; 13(3):532. https://doi.org/10.3390/rs13030532
Chicago/Turabian StyleBohn Reckziegel, Rafael, Elena Larysch, Jonathan P. Sheppard, Hans-Peter Kahle, and Christopher Morhart. 2021. "Modelling and Comparing Shading Effects of 3D Tree Structures with Virtual Leaves" Remote Sensing 13, no. 3: 532. https://doi.org/10.3390/rs13030532
APA StyleBohn Reckziegel, R., Larysch, E., Sheppard, J. P., Kahle, H.-P., & Morhart, C. (2021). Modelling and Comparing Shading Effects of 3D Tree Structures with Virtual Leaves. Remote Sensing, 13(3), 532. https://doi.org/10.3390/rs13030532


