Article

Investigation of Polar Mesospheric Summer Echoes Using Linear Discriminant Analysis

1
Department of Physics and Technology, UiT The Arctic University of Norway, Forskningsparken, Sykehusvegen 21, 9019 Tromsø, Norway
2
Department of Automation and Process Engineering, UiT The Arctic University of Norway, Teknologibygget, Klokkargårdsbakken 35, 9019 Tromsø, Norway
*
Author to whom correspondence should be addressed.
Remote Sens. 2021, 13(3), 522; https://doi.org/10.3390/rs13030522
Submission received: 17 December 2020 / Revised: 22 January 2021 / Accepted: 29 January 2021 / Published: 2 February 2021
(This article belongs to the Section Remote Sensing Image Processing)

Abstract

:
Polar Mesospheric Summer Echoes (PMSE) are distinct radar echoes from the Earth’s upper atmosphere between 80 to 90 km altitude that form in layers typically extending only a few km in altitude and often with a wavy structure. The structure is linked to the formation process, which at present is not yet fully understood. Image analysis of PMSE data can help carry out systematic studies to characterize PMSE during different ionospheric and atmospheric conditions. In this paper, we analyze PMSE observations recorded using the European Incoherent SCATter (EISCAT) Very High Frequency (VHF) radar. The collected data comprises of 18 observations from different days. In our analysis, the image data is divided into regions of a fixed size and grouped into three categories: PMSE, ionosphere, and noise. We use statistical features from the image regions and employ Linear Discriminant Analysis (LDA) for classification. Our results suggest that PMSE regions can be distinguished from ionosphere and noise with around 98 percent accuracy.

Graphical Abstract

1. Introduction

Radar observations at mid and high latitudes detect during the Arctic summer months echoes that originate from 80 to 90 km altitude, i.e., in the mesosphere [1]. These Polar Mesospheric Summer Echoes (PMSE) are radio waves scattered at spatial structures in the distribution of the free electrons which form in the presence of ice particles and neutral air turbulence [2,3]. The charging of ice particles influences the electron distribution and the radar echoes can in this way detect ice particles with small dimensions that are not or only partly observed with optical methods [3]. The larger among the ice particles are visible to the human eye in Noctilucent Clouds (NLC). NLC originate from larger particles than PMSE. Both PMSE and NLC form when the mesosphere is the coldest. We refer the reader to a detailed review of the early observations of PMSE [2] and to an overview of the understanding of this phenomenon [3].
Both PMSE and NLC occur at altitudes that are difficult to study due to poor accessibility. In situ measurements in the mesosphere can be made from rockets, but only during short time intervals. Radar measurements from the ground remain a good option for observational studied and can be made independently from weather conditions. Therefore, PMSE provide an interesting tool for local long-term studies of ice particles and their interactions in the mesosphere. For example, the 53.5 MHz Middle Atmosphere Alomar Radar System (MAARSY) on Andøya provides information on the occurrence rate of PMSE on a yearly and diurnal scale and their altitude [4].
The European Incoherent SCATter (EISCAT) radars are high-power, large-aperture radars and they also detect PMSE. They are, however primarily designed to study incoherent scatter, a process that depends on electron density and hence ionization in the upper atmosphere [5]. The ionization is influenced by sunlight, energetic particle precipitation, and other phenomena of the Arctic ionosphere that also influence the PMSE process. While it is interesting to study both phenomena at the same time, this complicates the analysis since the PMSE signal, and the incoherent scatter signal need to be separated. Figure 1 illustrates a typical EISCAT observation. The image displays PMSE in horizontal wavy layers between 80 and 90 km and incoherent scatter from the ionospheric electrons above. Figure 1 also shows that, for part of the observation a strong ionospheric signal extends down almost to 70 km. This illustrates that altitude is not a sufficient criterion to distinguish both components. While both signals can be distinguished by means of their different frequency distributions [3,5], those can only be studied involving additional data. We here attempt to make a separation based on data sets like the one shown in Figure 1. The separation of image regions is also of interest for future studies to compare the occurrence of PMSE and NLC [6]. We follow this recent work [6] to analyze NLC images and start by considering Linear Discriminant Analysis (LDA).
Our study investigates the separability of PMSE from noise background and ionospheric background regions in EISCAT observations. This study is further motivated because a new radar, EISCAT_3D [7] is at present under construction. It will allow us to observe PMSE in the same volume from three different sites and hence provide more information on the motion of the structures that form the PMSE [8]. Analysis tools need to be developed in order to compare the observations from the different sites. The EISCAT_3D can also be used for monitoring observations with the perspective to provide a large data set for statistical analysis.
We introduce the statistical methods applied in Section 2, describe the analysis process in Section 3, and present and discuss the results in Section 4. We draw a short conclusion (Section 5) and give additional information in the Appendix A.

2. Methods

2.1. Linear Discriminant Analysis (LDA)

LDA, also known as Fischer′s discriminant analysis [9] considers two classes of distributions, μ1 and μ2 and covariances Σ1 and Σ2, where the separation criterion J ( 𝓌 ) between the two is defined by the ratio of variance between classes and within classes as:
J ( 𝓌 ) = 𝓌 T S B 𝓌 𝓌 T S W 𝓌
In this expression, 𝓌 is a vector that is normal to the discriminant hyperplane, T denotes the transpose and S B and S W describe between and within-class scatter respectively. They are:
S B = ( μ 1 μ 2 ) ( μ 1 μ 2 ) T ,
S W = ( Σ 1 + Σ 2 )
The results obtained from the two-class case can be extended to three and more classes. For more details, please see [10].
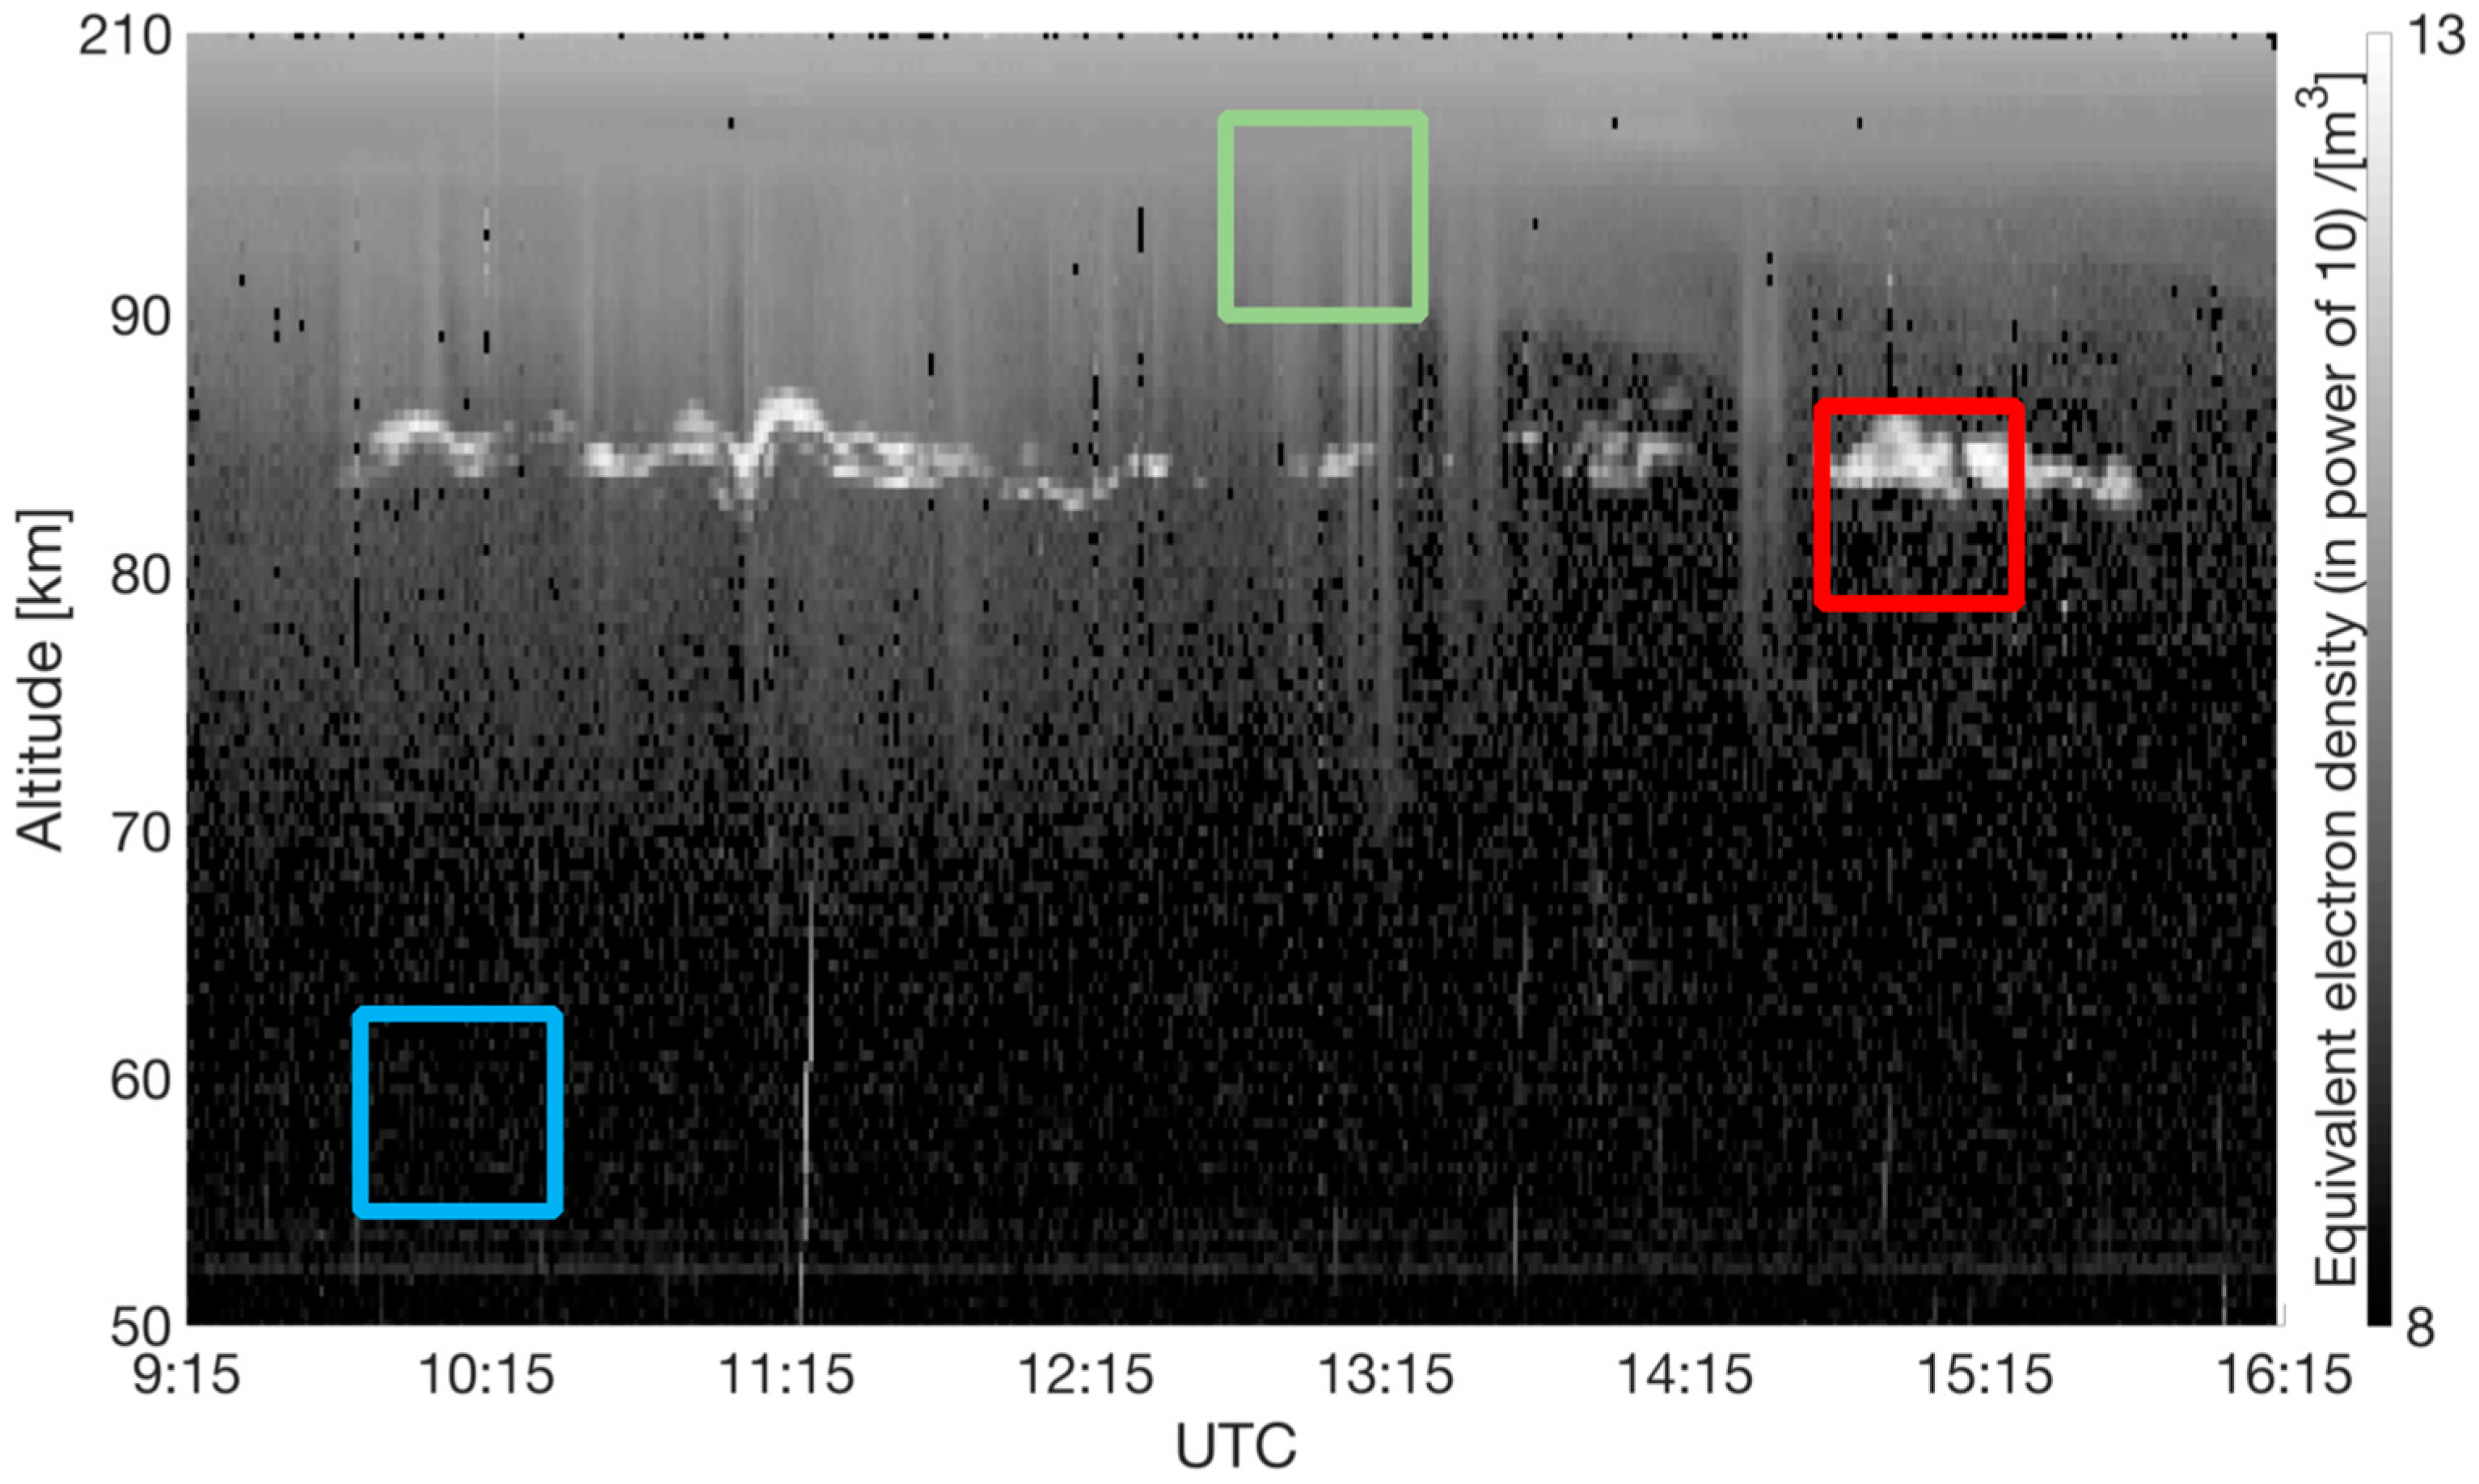
In order to analyze the separability of the three distinct classes corresponding to the PMSE, background noise, and ionospheric background, we selected smaller image regions or window sizes from the complete images as shown in Figure 2. We apply the LDA algorithm on these image windows; the features used for LDA are a combination of low-order statistics: mean and standard deviation and higher-order statistics: skewness and kurtosis.

2.2. Skewness and Kurtosis

Skewness is a measure of asymmetry or the extent to which a given distribution differs from a normal distribution [10]. For a random variable X , the skewness S [ X ] is calculated by its standardized third central moment as [11],
S [ X ] = E [ ( X μ σ ) 3 ]
where μ is the mean, σ is the standard deviation, and E is the average or expected value. The values of S [ X ] can be positive, negative, zero, or undefined.
Kurtosis is a measure of outliers in a distribution. For a random variable X , the kurtosis K [ X ] is defined by its fourth standardized moment as [12],
K [ X ] = E [ ( X μ σ ) 4 ]

2.3. Input Data

In this study, we use 18 images taken during four different years with the EISCAT Very High Frequency (VHF, 224 MHz) radar located near Tromsø (69.58°N, 19.2272°E). The data which is given in ASCII format, denotes the electron density (NEL) in regions of incoherent scatter [13] and a signal proportional to the backscattered power in the PMSE [13]. The incoherent scatter can be described as the scattering of the electromagnetic waves at free electrons. As described in a theoretical work [14], it is possible to deduce the total amount of electrons in the targeted area based on the total energy received.

3. Procedure

The dataset consists of 18 images with PMSE observations in different time intervals. The details of the 18 selected observations for the study are listed in Table A1 in the appendix. For each group, eight image regions or windows are collected. This means that there are 8 × 3 = 24 windows for every image. Figure 2 shows the three different classes of an image: PMSE, background noise, and ionospheric background. We use default window size of 100 by 100 pixels (see Section 4).
As shown in Figure 3, the histograms′ grayscale distributions look different for the three classes. The one for the PMSE (Figure 3a) has the largest standard deviation. The one for the ionospheric background class (Figure 3b) has the lowest standard deviation and the highest mean. For the background noise, the mean value is the lowest of all, and the standard deviation is low as well. These differences in the three classes imply that they can be separated using mean and standard deviation. One can also notice that Figure 3a looks like a combination of the distributions seen in Figure 3b,c, and some high intensity grayscale values. PMSE occur at an altitude where background noise and ionospheric background are partially present, this means that the grayscale histogram distribution of PMSE (shown in Figure 3a) can vary depending on the window size and the proportional presence of background noise and ionospheric background. In Figure 3, the grayscale values are in the range [0–255], 0 being black and 255 being white.

4. Results

The accuracy of classification is defined as the ratio of number of correctly predicted image regions to that of all the image regions used for testing. Table 1 shows the accuracies obtained by using a window size of 100 by 100 pixels and four different combinations of parameters: mean standard deviation, skewness, and kurtosis.
From the complete dataset, 70 percent is used for training, i.e., 302 out of 432 samples, and 30 percent is used for testing i.e., 130 samples. The training and testing samples are randomly selected.
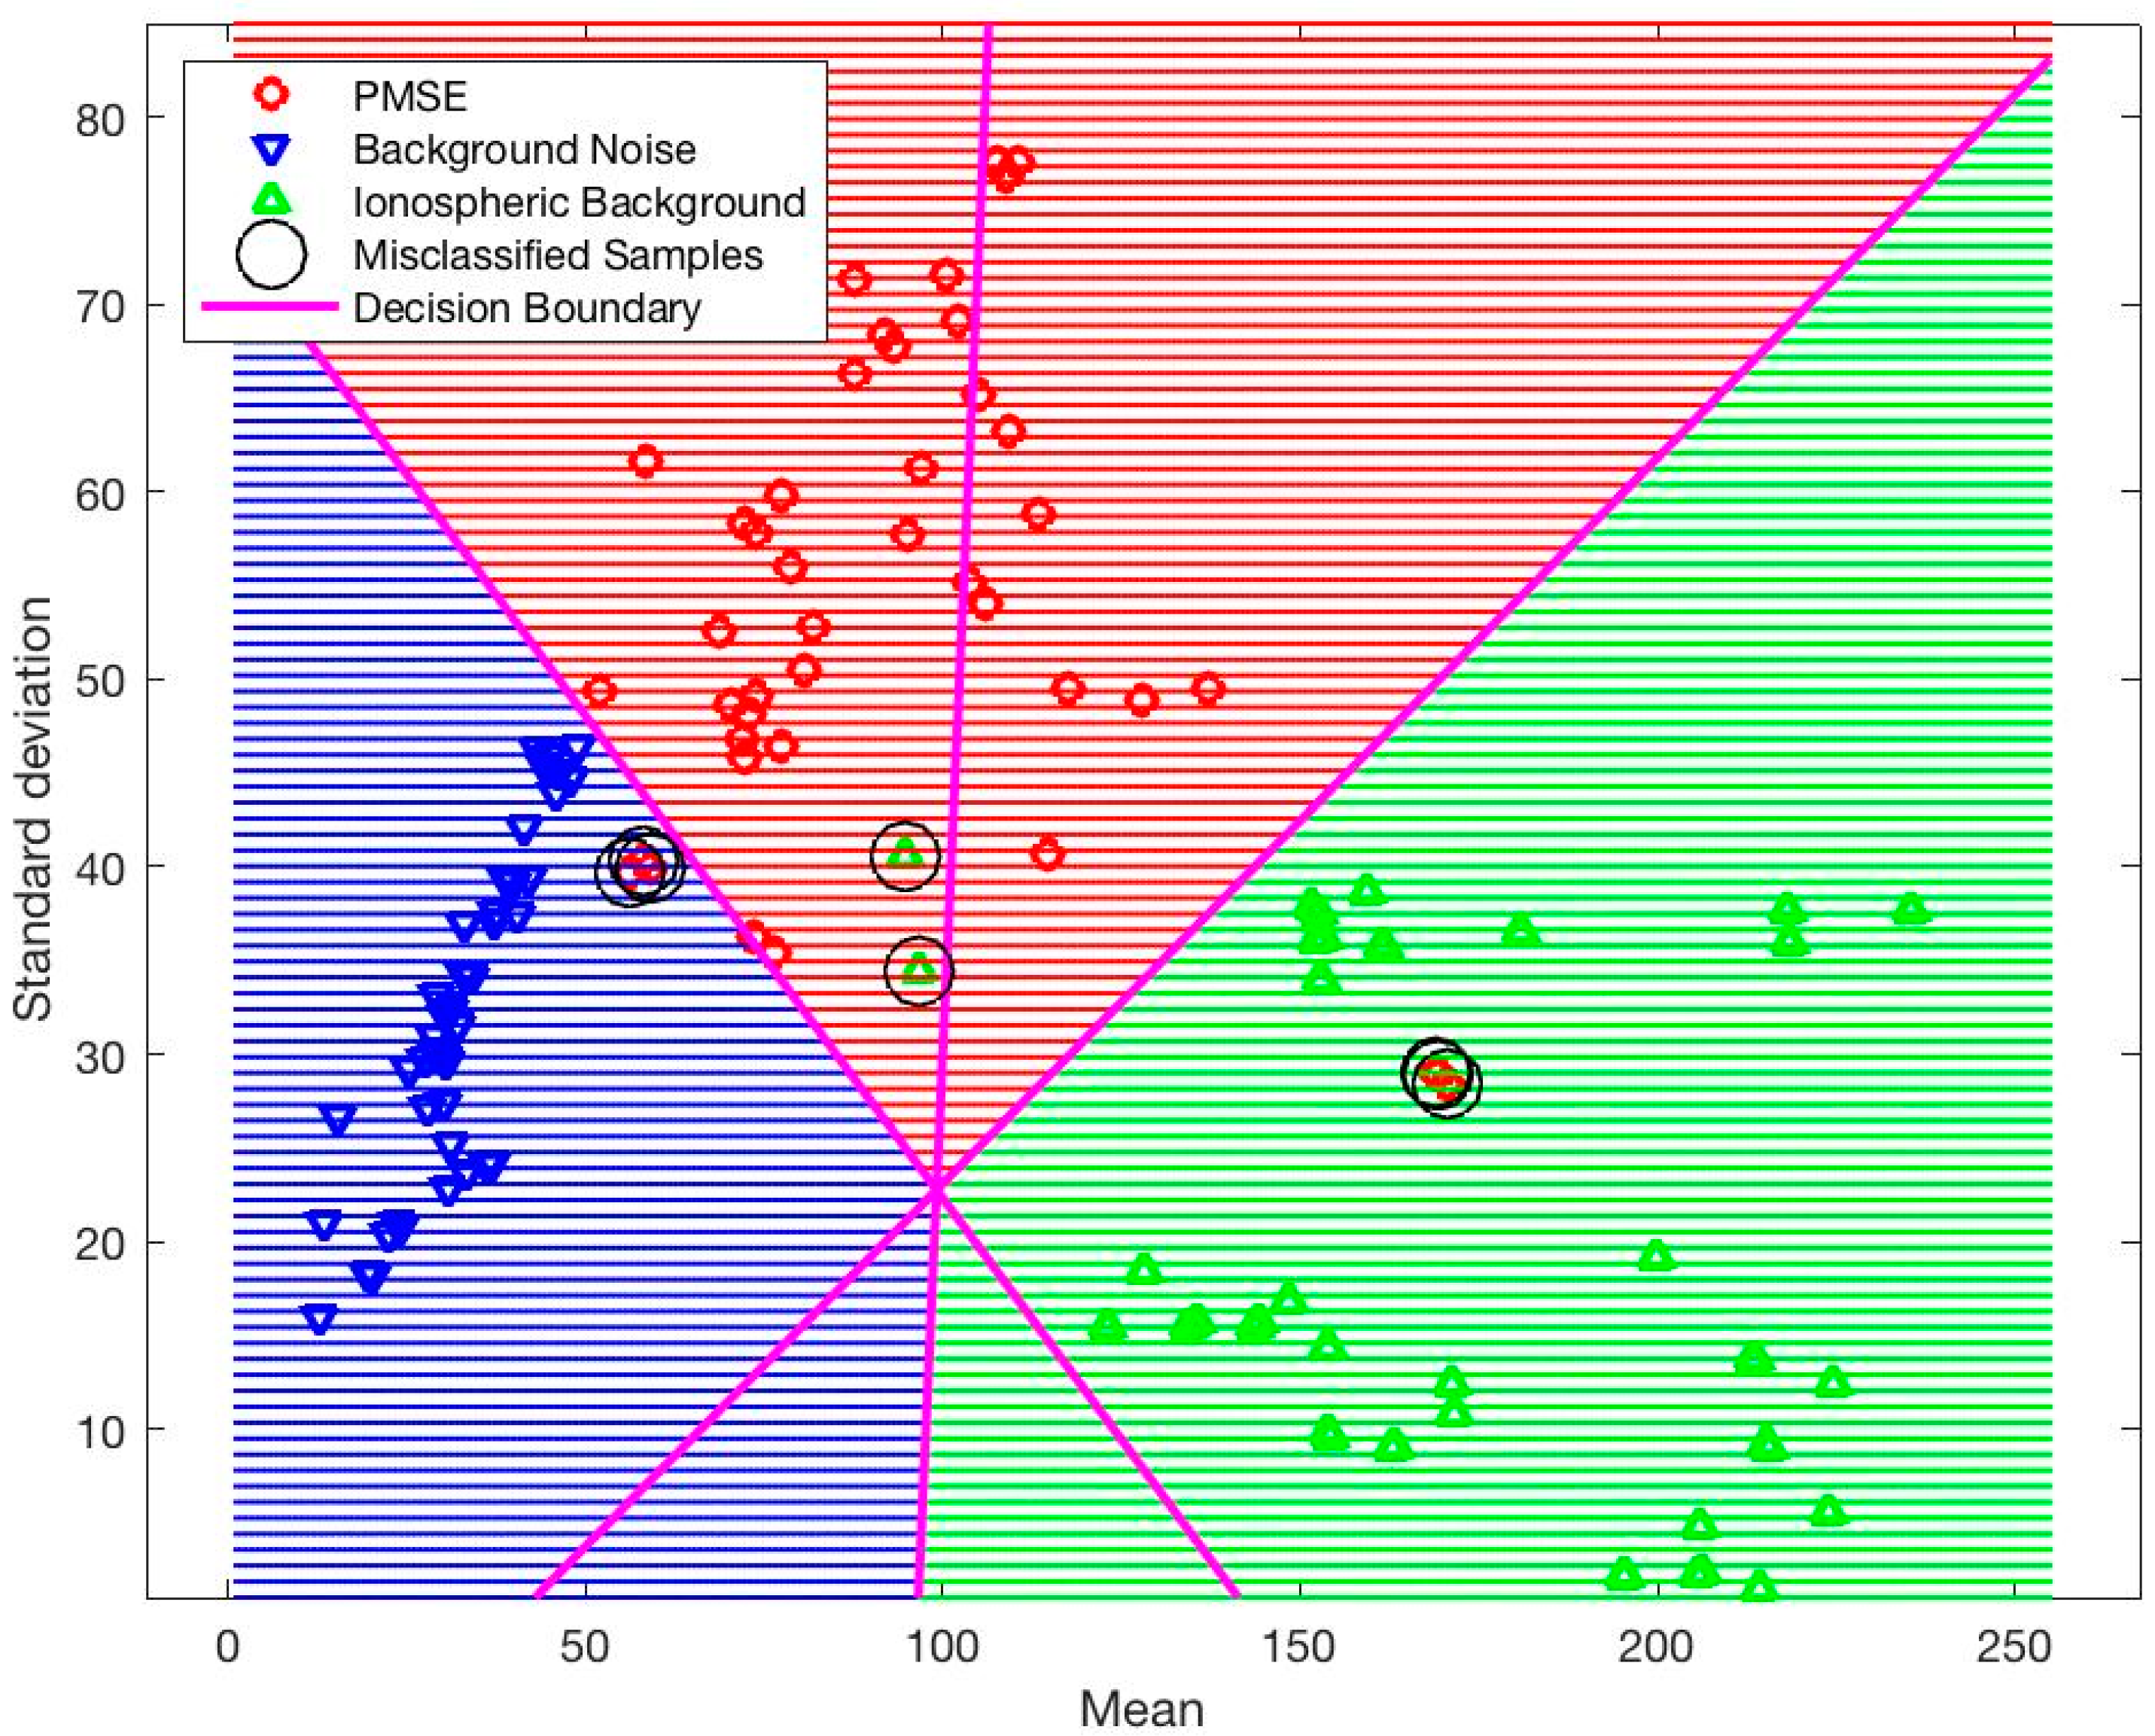
In Figure 4, we visualize the separation of the whole data into the three classes i.e., PMSE, background noise, and ionospheric background by using a window size of 100 by 100 pixels and mean and standard deviation as two dimensions for LDA. Furthermore, the results in the figure show that there are only 6 misclassifications out of 130 samples used for testing.
We also use LDA for different window sizes ranging from 60 to 200 pixels, the resulting variation of the accuracy is shown in Figure 5 (see also Table A2 in the Appendix A). We reach best accuracies within 90 percent for window sizes ranging from 100 to 180 pixels with the best value of 98.18 percent for window size of 160 by160 pixels and including all four parameters. We chose the window size of 100 by100 pixels as a compromise between size and accuracy.
The results for accuracies pertaining to training and test data are shown in Table A3, we can observe that they show comparable accuracies. The classification accuracies shown in Figure 5 are obtained by taking an average over 10 iterations of randomly selecting the training and testing data from the dataset. We also test 10, 100 and 1000 iterations, the results are shown in Table A4, Table A5 and Table A6, indicate that there are no significant differences in the accuracy values obtained from the different iterations.

5. Discussion

The best accuracies are obtained with two different sets of parameters as shown in Table 1. The first one is mean and standard deviation, and the second one is using all the four parameters: mean, standard deviation, skewness, and kurtosis.
In Figure 5, we can see that almost all the different sets of parameters are following a similar trend, i.e., the accuracy is improving with a larger window size up to 180 pixels, after which the accuracy starts to decrease. In this study, the time scale and the altitude scale of the images are not consistent, they are varying from one image to another without influencing the accuracy of the classification. In other words, a larger or smaller amount of background data does not change much the accuracy of classification, especially for two and more parameters.
We can notice in Figure 4, that a few PMSE got misclassified into either the ionospheric background class or the background noise class. This can be possibly attributed to the fact that the PMSE occurs at the boundary altitude between the ionospheric signal region and the background noise region. Therefore, if the PMSE is not strong, or if its intensity is close to the background noise intensity, it can get misclassified. Figure 6 and Figure 7 show examples of PMSE events when misclassifications happened. In Figure 6, a few examples of samples belonging to the PMSE class were misclassified as belonging to the background noise class. Figure 7 shows a case where PMSE samples got misclassified as ionospheric background.
The ionospheric background class can also be misclassified as PMSE, but the background noise is never misclassified. One possible explanation for this is that the ionospheric background can vary from one image to another. Figure 8 presents two images (7 July 2010 and 10 August 2015) with very different ionospheric backgrounds. It is homogeneous in the 2010 image while in the 2015 image it displays vertical stripes, a curtain-like structure. This pattern extends lower down in altitude and overlaps with the PMSE altitude, possibly explaining the misclassification.
This study shows that LDA can be applied to distinguish PMSE regions in images from those with ionospheric incoherent scatter and with background noise. In comparison to more advanced methods that are applied for example to the analyses of NLC [6] and of radar observations at other, (HF) high frequency [15], it is more simple and computationally inexpensive. It is therefore suitable to preselect PMSE regions for further analysis.

6. Conclusions

This paper describes an analysis approach for PMSE observations made with an incoherent scatter radar. Our study shows that LDA can be used to distinguish image regions containing PMSE from those with noise or ionospheric background. We noted that samples belonging to the background noise class were not misclassified, however, samples belonging to the other categories were sometimes misclassified. This can be attributed to factors like the changes of the ionospheric background over the years. Our proposed method can be used to pre-select data for further analysis of the shape of the PMSE for which we will consider methods in the future; it can be used for simultaneous studies of PMSE and NLC; and it is suitable for analyzing large data sets like those from the EISCAT_3D [7] that is at present under construction.

Author Contributions

Conceptualization, D.J., P.S. and I.M.; programming, D.J.; investigation, D.J.; data curation, D.J.; writing—original draft preparation, D.J.; writing—review and comments, P.S. and I.M.; supervision, P.S. and I.M.; project administration, I.M.; funding acquisition, I.M. All authors have read and agreed to the published version of the manuscript.

Funding

This work is supported by a project funded by the Research Council of Norway, NFR 275503. The EISCAT International Association is supported by research organizations in Norway (NFR), Sweden (VR), Finland (SA), Japan (NIPR and STEL), China (CRIPR), and the United Kingdom (NERC).

Acknowledgments

The authors thank Anders Tjulin and Ingemar Häggström (both at the International EISCAT Scientific Association) for support on access and using EISCAT data and thank the anonymous referees for constructive comments that helped to improve the manuscript. DJ thanks Srishti Gautam (UiT) for support with using MATLAB.

Conflicts of Interest

The authors declare no conflict of interest. The funders had no role in the design of the study; in the collection, analyses, or interpretation of data; in the writing of the manuscript, or in the decision to publish the results.

Appendix A

The 18 images and therefore the 18 PMSE observations used for the study, their date, start and end time are listed in Table A1.
Table A1. This table lists the dates given in (day. month. year) that are used for the LDA and universal time (UTC) of observation given in (hour: minutes: seconds).
Dates
(dd.mm.yyyy)
Start Time in UTC 1
(hh:mm:ss)
End Time in UTC
(hh:mm:ss)
28.06.200807:58:3308:36:18
30.06.200807:59:3812:07:30
02.07.200810:24:3011:59:02
10.06.200909:03:4211:56:09
11.06.200909:03:4211:59:12
14.07.200908:19:3311:33:15
16.07.200908:47:3010:06:26
17.07.200907:49:4411:59:30
26.07.200908:00:2911:59:22
30.07.200912:15:2915:59:08
07.07.201000:00:3021:59:27
08.07.201009:00:4212:59:03
09.08.201500:00:2601:59:26
10.08.201509:14:4016:12:28
12.08.201520:04:4023:59:28
13.08.201500:00:2801:59:26
19.08.201500:00:2801:59:26
20.08.201500:00:2801:59:26
1 Start time in UTC does not mean the start of a PMSE event. In fact, the observation time does not necessarily mean that a PMSE is happening during the whole time frame, nor that the PMSE is centered around the middle of the time frame. Nevertheless, there is a PMSE event in every image.
The detail of the testing accuracies used to plot Figure 5 is listed in the following Table A2.
Table A2. This table shows the testing accuracies in percent of different LDA that are conducted over the same dataset.
Window SizeM 1M, Std 2M, Std, Sk 3M, Std, Sk, K 4
6084.39 ± 1.9692.58 ± 1.0093.41 ± 2.0593.71 ± 1.82
8089.24 ± 1.8897.50 ± 1.4395.91 ± 1.2095.23 ± 1.19
10093.26 ± 1.8797.05 ± 0.9196.21 ± 0.8797.05 ± 1.40
12094.24 ± 2.8296.14 ± 1.2696.52 ± 1.2597.50 ± 1.07
14094.92 ± 1.6895.83 ± 1.0996.97 ± 1.2997.80 ± 1.10
16095.76 ± 1.2094.85 ± 1.4696.36 ± 1.5598.18 ± 0.81
18096.14 ± 1.6194.62 ± 1.4597.05 ± 1.6996.67 ± 1.39
20095.15 ± 1.1492.65 ± 1.0796.82 ± 1.6395.76 ± 1.56
1 M: Mean. 2 Std: Standard deviation. 3 Sk: Skewness. 4 K: Kurtosis.
The detail of the training accuracies used to plot Figure 5 is listed in the following Table A3.
Table A3. This table shows the training accuracies in percent of different LDA that are conducted over the same dataset.
Window SizeM 1M, Std 2M, Std, Sk 3M, Std, Sk, K 4
6084.53 ± 0.8893.00 ± 0.6893.63 ± 0.7194.23 ± 0.79
8088.50 ± 0.7996.47 ± 0.5395.93 ± 0.5295.57 ± 0.59
10092.57 ± 0.8296.93 ± 0.4997.00 ± 0.7597.20 ± 0.63
12094.67 ± 0.6396.63 ± 0.3396.60 ± 0.5697.87 ± 0.45
14094.80 ± 1.2196.33 ± 0.5996,67 ± 0.7298.13 ± 0.42
16095.57 ± 0.5596.00 ± 0.4496.87 ± 0.8398.07 ± 0.52
18095.73 ± 0.5495.50 ± 0.9597.10 ± 0.7297.53 ± 0.59
20095.40 ± 0.8693.33 ± 0.8096.57 ± 0.5597.33 ± 0.52
1 M: Mean. 2 Std: Standard deviation. 3 Sk: Skewness. 4 K: Kurtosis.
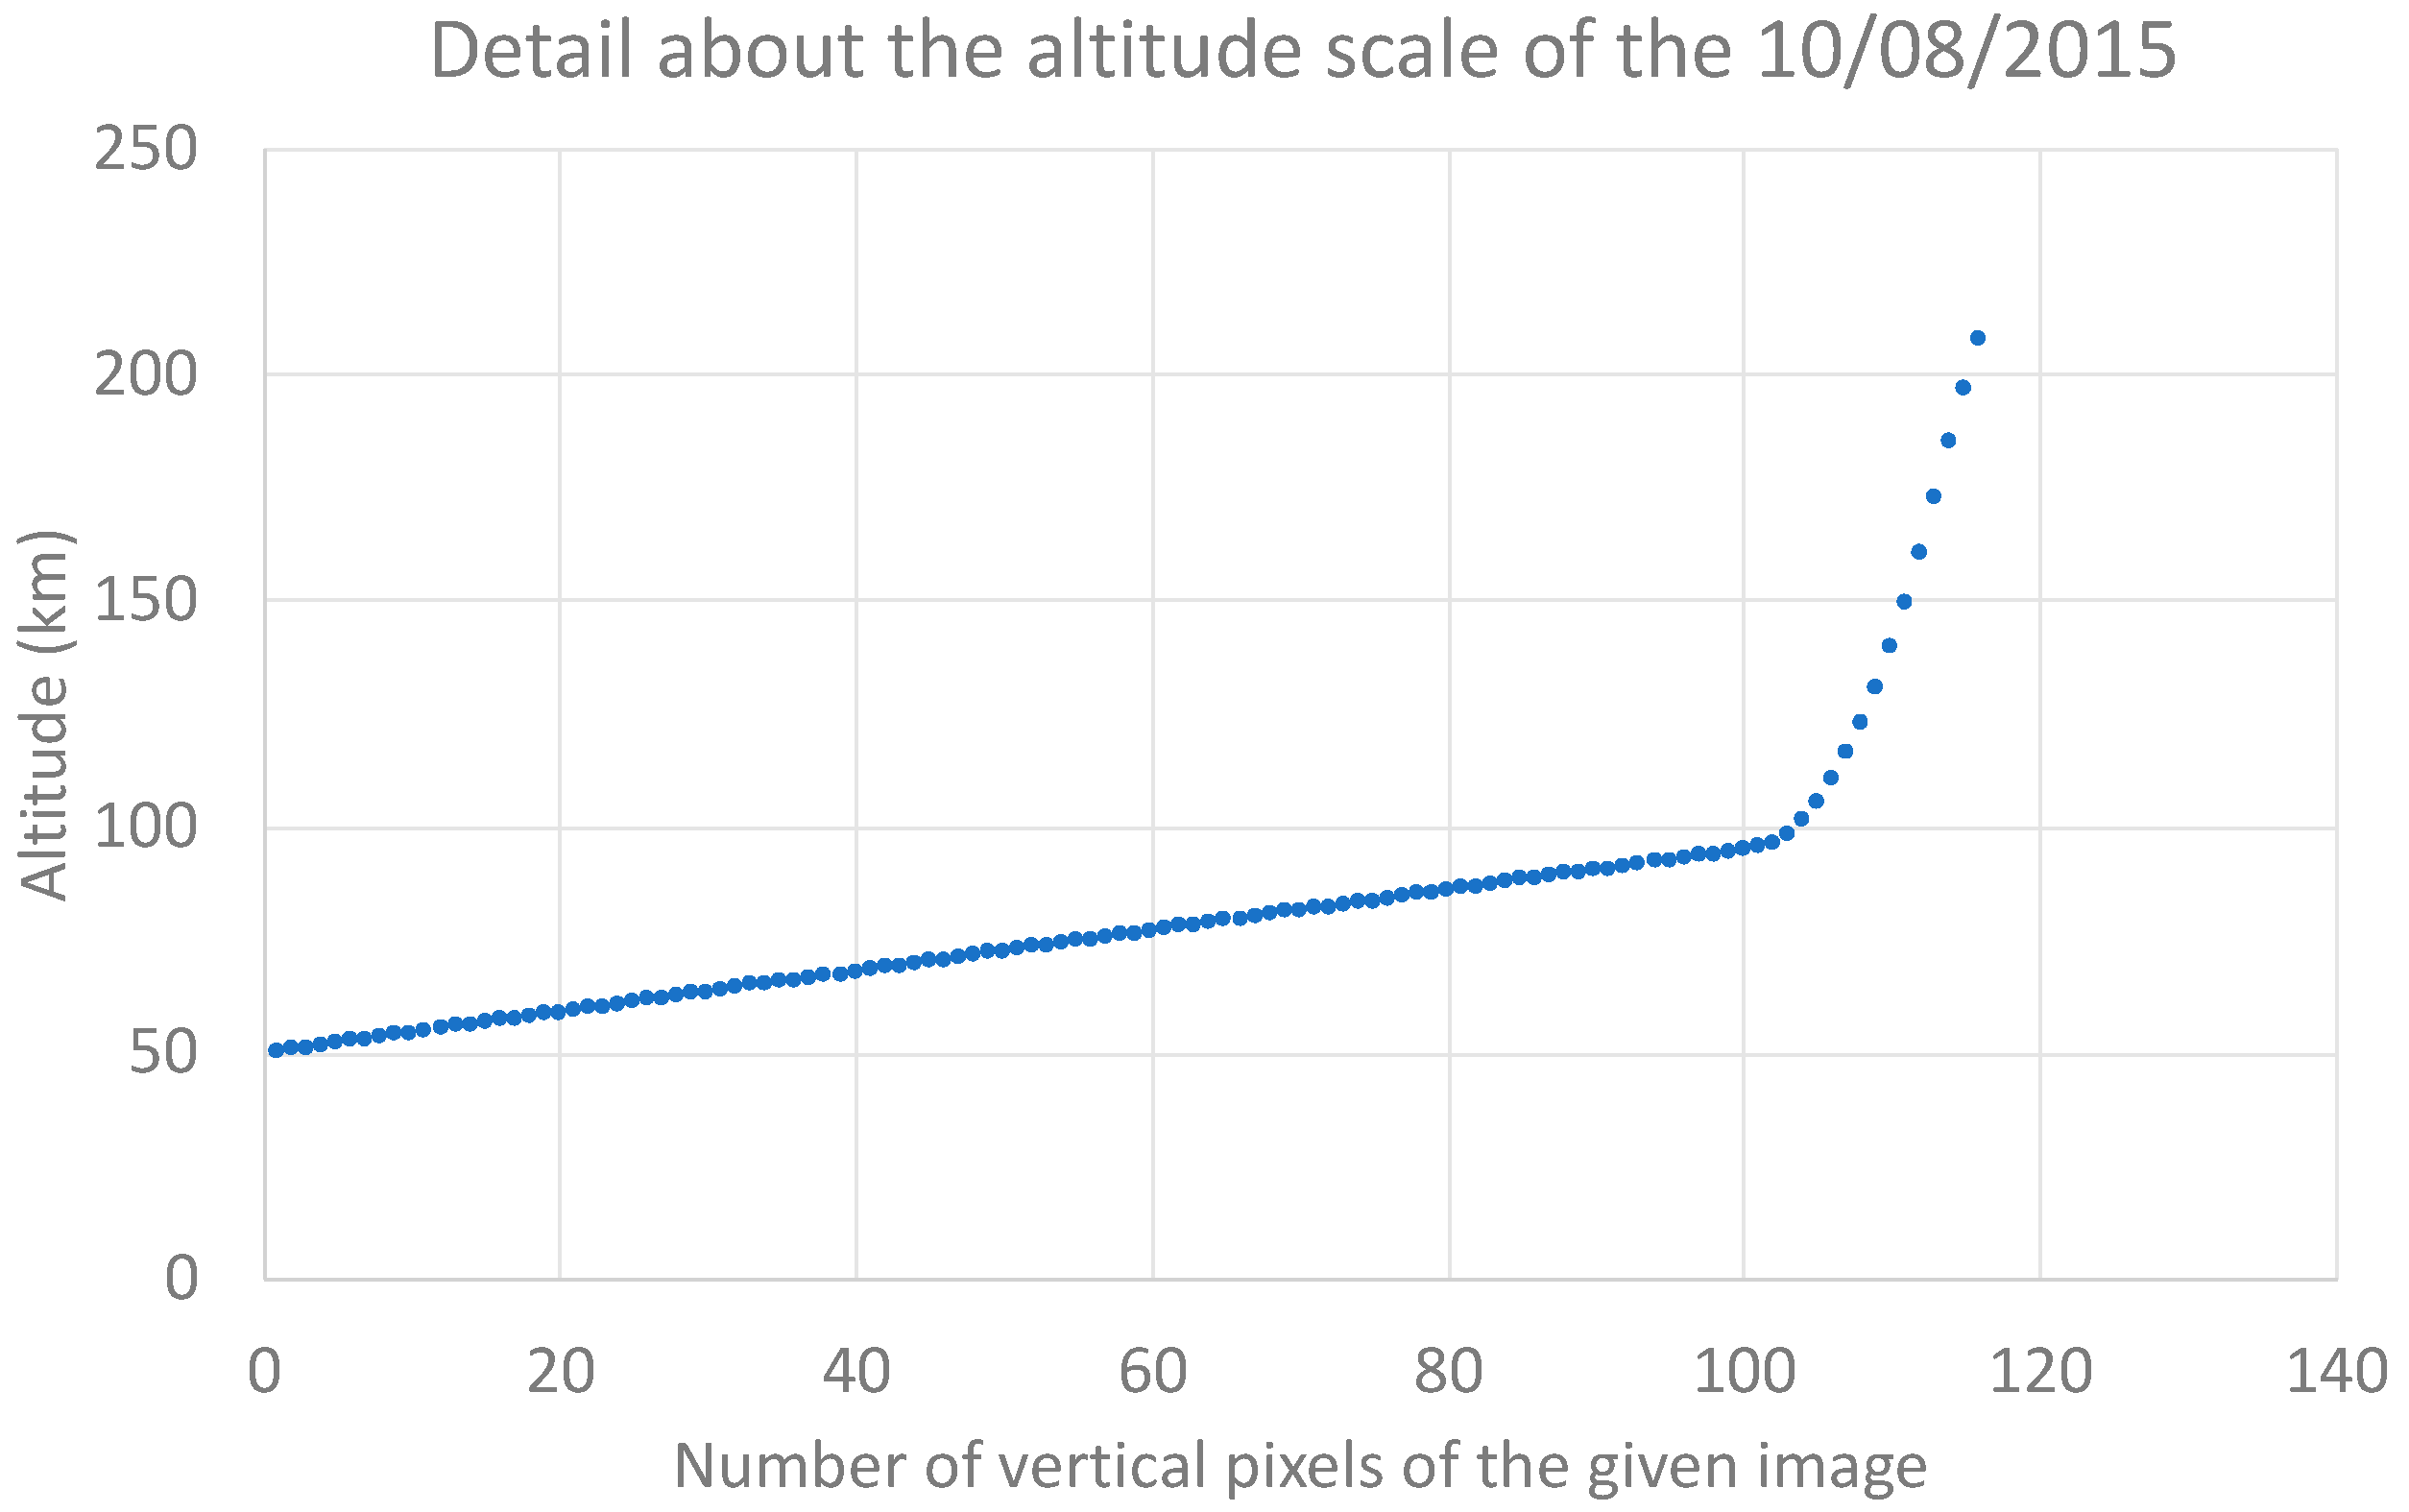
It is important to note that the steps in altitude are not equal between lower and higher altitudes. Figure A1 shows that the altitude scale is constant from altitudes 50 km to 100 km. From a 100 km altitude, the scale starts to be exponential. This graph describes the data taken 10 of August 2015, but all data sets used in this study show a similar feature.
Table A4 shows the averaged accuracies after 10 runs of the LDA, Table A5 shows the accuracies averaged after 100 runs and finally Table A6 shows the accuracies averaged over 1000 runs.
Table A4. This table shows the testing accuracies in percent, averaged over 10 runs of LDA.
Window SizeM 1M, Std 2M, Std, Sk 3M, Std, Sk, K 4
6085.5392.5893.6494.70
8089.3996.6795.9195.08
10092.8896.2997.0597.20
12094.5596.6796.5297.50
14095.0095.8396.4497.50
16095.5395.9196.5997.58
18095.9195.1597.1296.59
20094.7092.5097.4296.89
1 M: Mean. 2 Std: Standard deviation. 3 Sk: Skewness. 4 K: Kurtosis.
Table A5. This table shows the testing accuracies in percent, averaged over 100 runs of LDA.
Window SizeM 1M, Std 2M, Std, Sk 3M, Std, Sk, K 4
6084.7192.6292.8993.98
8088.1796.7295.8695.37
10091.8896.8396.5496.90
12094.2596.7296.4397.53
14095.0596.1496.3997.55
16095.4595.5096.8097.73
18095.8894.9096.8296.91
20095.2392.8896.3796.63
1 M: Mean. 2 Std: Standard deviation. 3 Sk: Skewness. 4 K: Kurtosis.
Table A6. This table shows the testing accuracies in percent, averaged over 1000 runs of LDA.
Window SizeM 1M, Std 2M, Std, Sk 3M, Std, Sk, K 4
6084.5692.7393.1193.73
8088.4496.6695.7995.45
10092.4596.7596.5497.02
12094.4296.5196.6197.55
14095.1396.0396.5797.67
16095.5395.6396.6697.68
18095.7095.1196.9896.78
20095.0293.0296.6596.55
1 M: Mean. 2 Std: Standard deviation. 3 Sk: Skewness. 4 K: Kurtosis.
Figure A1. Plots representing the difference in altitude between each step or incrementation in vertical pixels in the image.
Remotesensing 13 00522 g0a1

References

  1. Ecklund, W.L.; Balsley, B.B. Long-term observations of the Arctic mesosphere with the MST radar at Poker Flat, Alaska. J. Geophys. Res. Space Phys. 1981, 86, 7775–7780. [Google Scholar] [CrossRef]
  2. Cho, J.Y.N.; Röttger, J. An updated review of polar mesosphere summer echoes: Observation, theory, and their relationship to noctilucent clouds and subvisible aerosols. J. Geophys. Res. Atmos. 1997, 102, 2001–2020. [Google Scholar] [CrossRef] [Green Version]
  3. Rapp, M.; Lübken, F.J. Polar mesosphere summer echoes (PMSE): Review of observations and current understanding. Atmos. Chem. Phys. 2004, 4, 2601–2633. [Google Scholar] [CrossRef] [Green Version]
  4. Latteck, R.; Strelnikova, I. Extended observations of polar mesosphere winter echoes over Andøya (69° N) using MAARSY. J. Geophys. Res. Atmos. 2015, 120, 8216–8226. [Google Scholar] [CrossRef]
  5. Röttger, J.; La Hoz, C. Characteristics of polar mesosphere summer echoes (PMSE) observed with the EISCAT 224 MHz radar and possible explanations of their origin. J. Atmos. Terr. Phys. 1990, 52, 893–906. [Google Scholar] [CrossRef]
  6. Sharma, P.; Dalin, P.; Mann, I. Towards a Framework for Noctilucent Cloud Analysis. Remote Sens. 2019, 11, 2743. [Google Scholar] [CrossRef] [Green Version]
  7. McCrea, I.; Aikio, A.; Alfonsi, L.; Belova, E.; Buchert, S.; Clilverd, M.; Engler, N.; Gustavsson, B.; Heinselman, C.; Kero, J.; et al. The science case for the EISCAT_3D radar. Prog. Earth Planet. Sci. 2015, 2, 21. [Google Scholar] [CrossRef] [Green Version]
  8. Mann, I.; Häggström, I.; Tjulin, A.; Rostami, S.; Anyairo, C.C.; Dalin, P. First wind shear observation in PMSE with the tristatic EISCAT VHF radar. J. Geophys. Res. Space Phys. 2016, 121, 11271–11281. [Google Scholar] [CrossRef]
  9. Fisher, R.A. The use of multiple measurements in taxonomic problems. Ann. Eugen. 1936, 7, 179–188. [Google Scholar] [CrossRef]
  10. Koutroumbas, K.; Theodoridis, S. Pattern Recognition, 4th ed.; Wiley: Hoboken, NJ, USA, 2008. [Google Scholar]
  11. Bera, A.K.; Premaratne, G. Modeling Asymmetry and Excess Kurtosis in Stock Return Data; Elsevier: Amsterdam, The Netherlands, 2000. [Google Scholar]
  12. Westfall, P.H. Kurtosis as Peakedness, 1905–2014. R.I.P. Am. Stat. 2014, 68, 191–195. [Google Scholar] [CrossRef] [PubMed] [Green Version]
  13. Lehtinen, M.S.; Huuskonen, A. General incoherent scatter analysis and GUISDAP. J. Atmos. Terr. Phys. 1996, 58, 435–452. [Google Scholar] [CrossRef]
  14. Gordon, W.E. Incoherent Scattering of Radio Waves by Free Electrons with Applications to Space Exploration by Radar. Proc. IRE 1958, 46, 1824–1829. [Google Scholar] [CrossRef]
  15. Wing, S.; Greenwald, R.A.; Meng, C.-I.; Sigillito, V.G.; Hutton, L.V. Neural networks for automated classification of ionospheric irregularities in HF radar backscattered signals. Radio Sci. 2003, 38, 1063. [Google Scholar] [CrossRef]
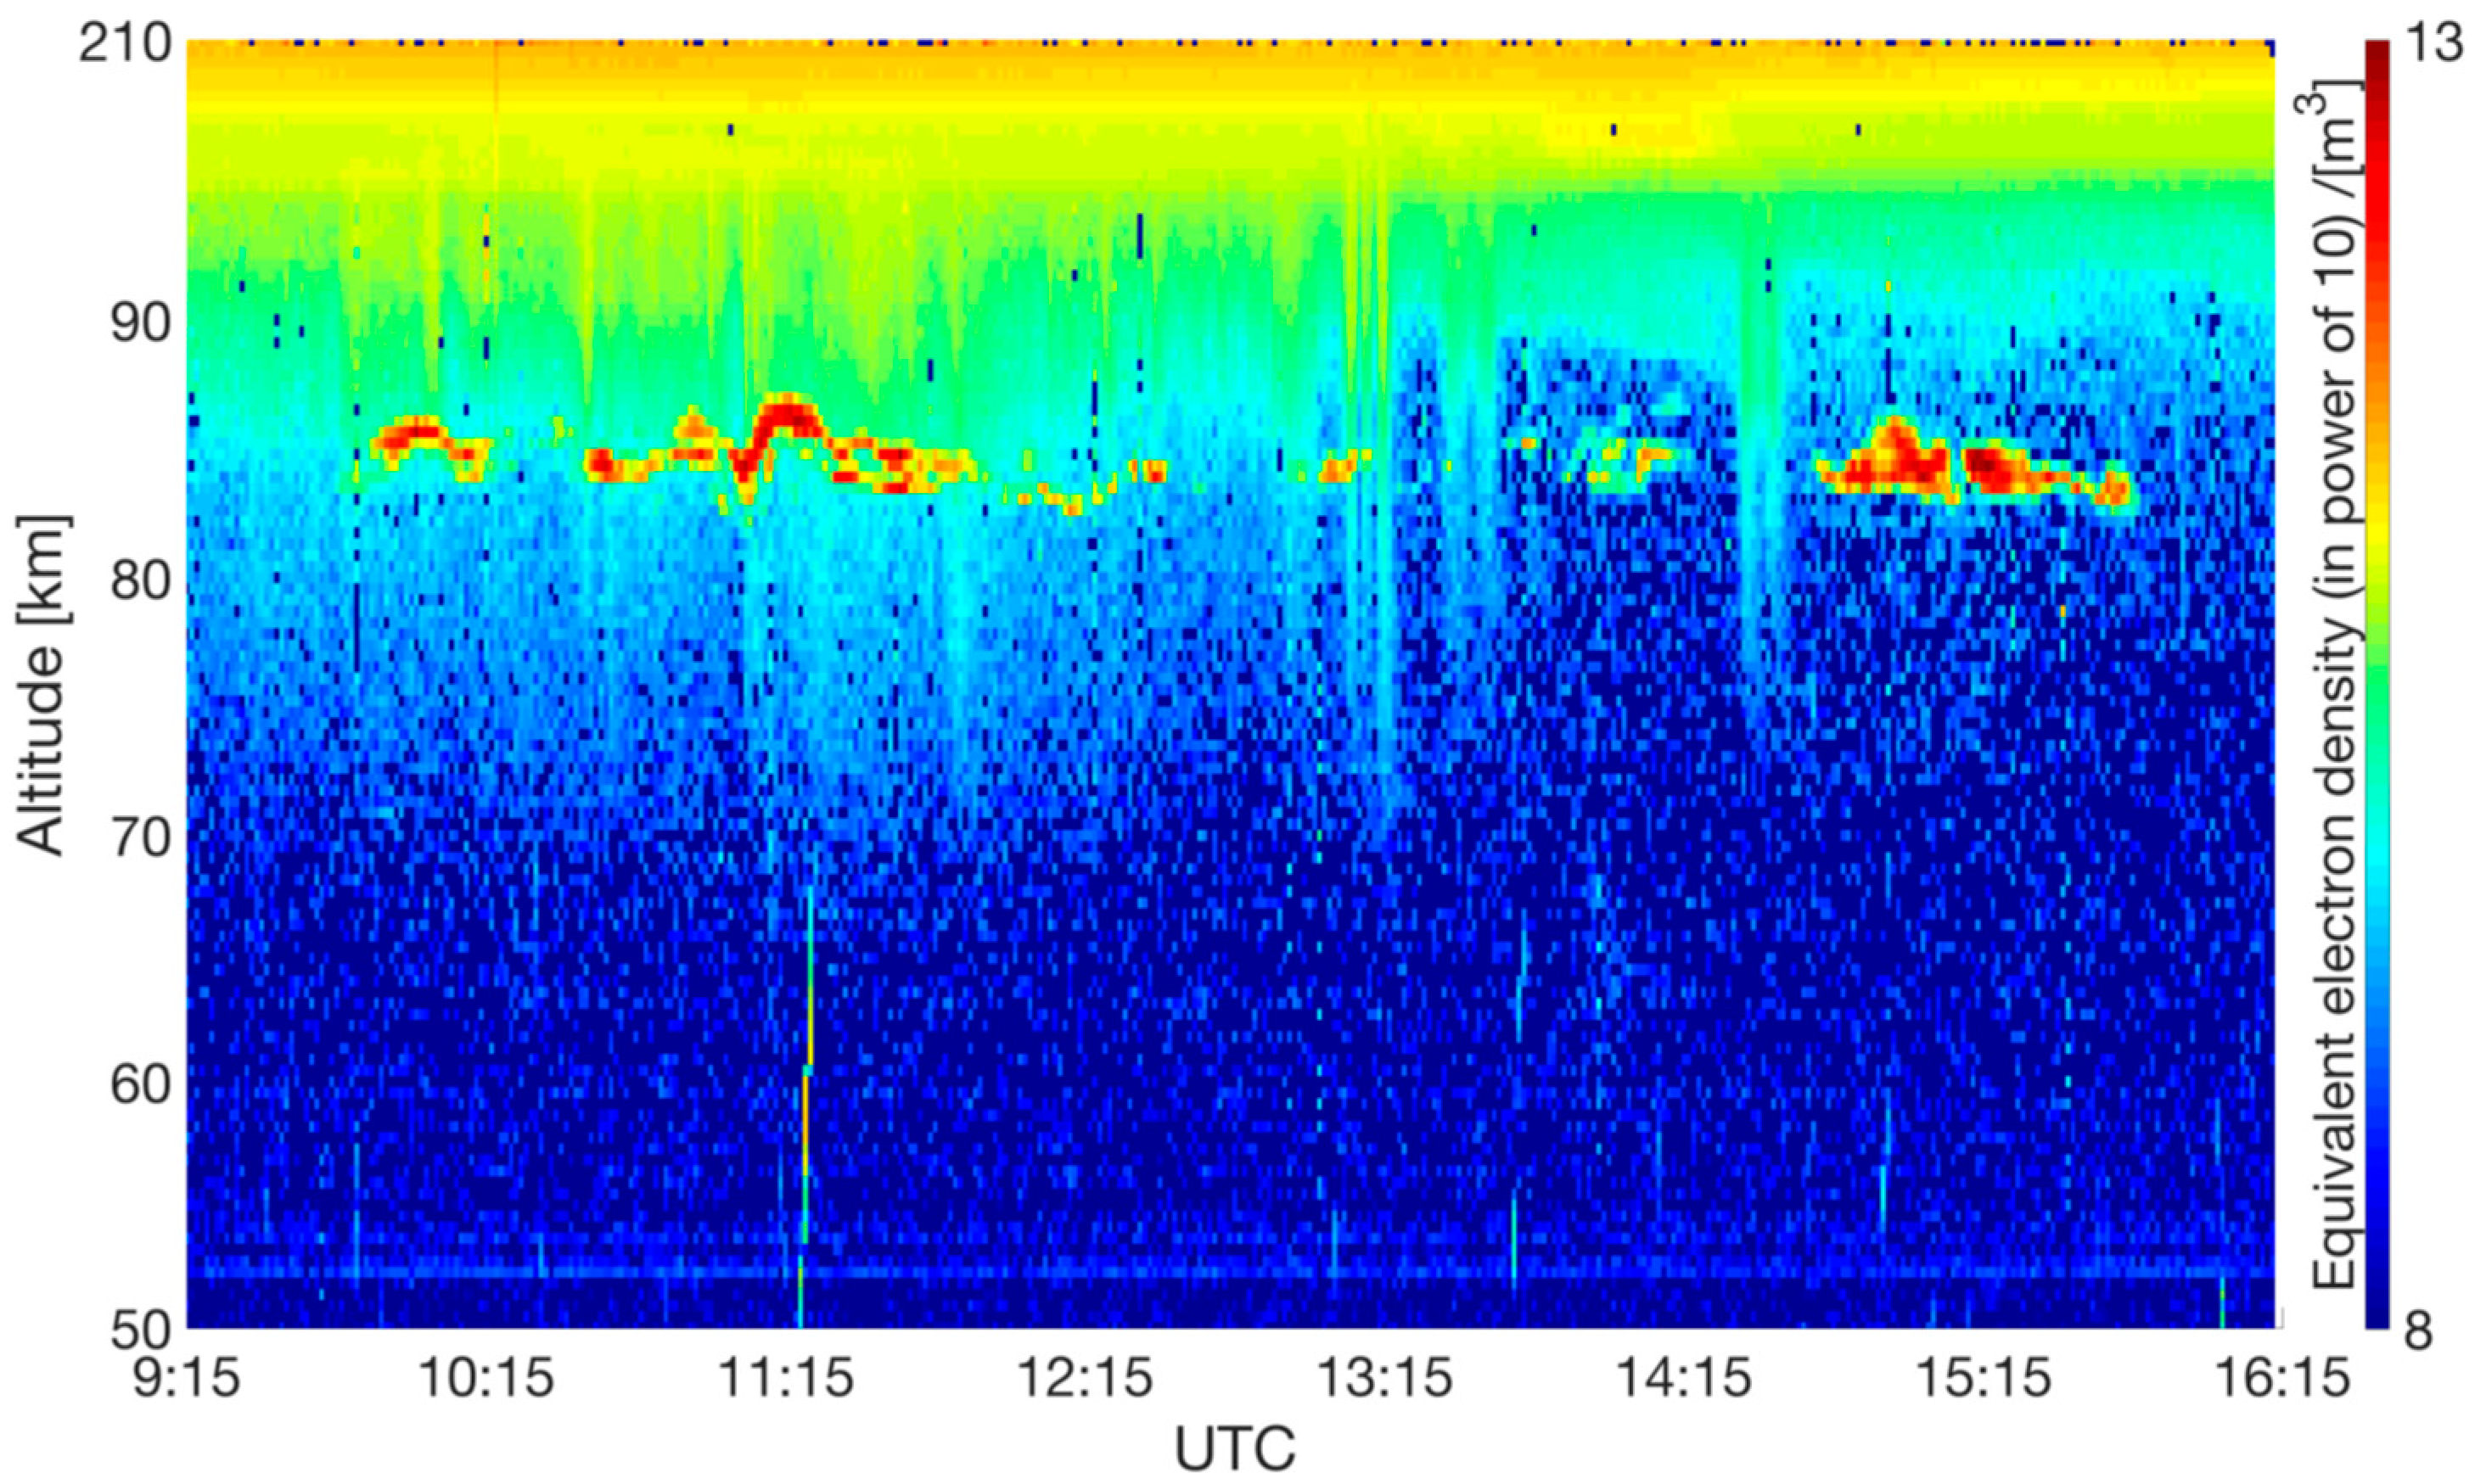
Figure 1. An example of a raw image with typical PMSE event analyzed with LDA in the latter part of this paper. The data used to plot this image is from the 10th of August 2015 over an altitude from 50 to 210 km altitude.
Remotesensing 13 00522 g001
Figure 2. Figure showing the way windows are collected. The whole image is plotted in black and white. Targeted day (dd.mm.yyyy): 10.08.2015. Smaller image regions or window sizes are collected from the complete image, and correspond to the 3 different classes, respectively: Red window for the PMSE group; Blue window for the background noise group; Green window for the ionospheric background group.
Remotesensing 13 00522 g002
Figure 3. Selected histograms showing the differences in the grayscale distribution for the 3 different classes being: (a) PMSE; (b) ionospheric background; (c) background noise. Targeted day (dd.mm.yyyy): 10.08.2015. The grayscale values are in the range [0,255]. The vertical scale shows the number of pixels.
Remotesensing 13 00522 g003
Figure 4. Plot representing the LDA using 30 percent of the whole dataset, used for predicting. Two dimensions are used here: mean and standard deviation. The different colored dots and correspondingly colored shaded areas represent the different classes. Blue symbols represent the background noise class, green symbols represent the ionospheric background class, and red symbols represent the PMSE class. The pink lines represent the linear separation between the 3 groups. Here, the accuracy of the separation is 93.94.
Remotesensing 13 00522 g004
Figure 5. The plot represents the LDA′s different accuracies for all the different window sizes used and for all the different sets of dimensions used.
Remotesensing 13 00522 g005
Figure 6. Case of a PMSE from the 20 of August 2015 during which a misclassification of a PMSE window as background noise happened. The white squares represent PMSE windows classified in the right group, while the orange windows represent examples of misclassifications containing a weaker PMSE signal.
Remotesensing 13 00522 g006
Figure 7. Case of a PMSE from the 30 of June 2008 during which a misclassification of a PMSE window as ionospheric background happened. The white squares represent PMSE windows classified in the right group during the LDA, while the orange windows represent examples of misclassifications where the PMSE signal looks almost as intense as the ionospheric background.
Remotesensing 13 00522 g007
Figure 8. Plots representing different ionospheric background conditions. Plot (a) is from the 7 July 2010. The ionospheric background looks homogeneous. Plot (b) is from the 10 of August 2015. The ionospheric background is not homogeneous anymore. It is possible to regularly distinguish curtain-like patterns along the time axis.
Remotesensing 13 00522 g008
Table 1. This table shows the accuracies in percent of different LDA for a window size of 100 × 100 pixels and 4 different sets of parameters. Values written in bold font are the highest.
Window SizeMM, Std 1M, Std, Sk 2M, Std, Sk, K 3
10093.26 ± 1.8797.05 ± 0.9196.21 ± 0.8797.05 ± 1.40
1 Std: Standard deviation. 2 Sk: Skewness. 3 K: Kurtosis.
Publisher’s Note: MDPI stays neutral with regard to jurisdictional claims in published maps and institutional affiliations.