Article

Fire Occurrences and Greenhouse Gas Emissions from Deforestation in the Brazilian Amazon

by
Claudia Arantes Silva
1,*,
Giancarlo Santilli
2,
Edson Eyji Sano
3 and
Giovanni Laneve
4
1
Departamento de Geologia Geral, Instituto de Geociências, Universidade de Brasília (UnB), Brasília 70297-400, Brazil
2
Faculdade do Gama, Universidade de Brasília (UnB), Brasília 72444-240, Brazil
3
Embrapa Cerrados, Planaltina 73301-970, Brazil
4
Scuola di Ingegneria Aerospaziale, Sapienza University of Rome, 00138 Roma, Italy
*
Author to whom correspondence should be addressed.
Remote Sens. 2021, 13(3), 376; https://doi.org/10.3390/rs13030376
Submission received: 4 December 2020 / Revised: 15 January 2021 / Accepted: 15 January 2021 / Published: 22 January 2021
(This article belongs to the Special Issue Satellite Remote Sensing Applications for Fire Management)

Abstract

:
This work presents the dynamics of fire occurrences, greenhouse gas (GHG) emissions, forest clearing, and degradation in the Brazilian Amazon during the period 2006–2019, which includes the approval of the new Brazilian Forest Code in 2012. The study was carried out in the Brazilian Amazon, Pará State, and the municipality of Novo Progresso (Pará State). The analysis was based on deforestation and fire hotspot datasets issued by the Brazilian Institute for Space Research (INPE), which is produced based on optical and thermal sensors onboard different satellites. Deforestation data was also used to assess GHG emissions from the slash-and-burn practices. The work showed a good correlation between the occurrence of fires in the newly deforested area in the municipality of Novo Progresso and the slash-and-burn practices. The same trend was observed in the Pará State, suggesting a common practice along the deforestation arch. The study indicated positive coefficients of determination of 0.72 and 0.66 between deforestation and fire occurrences for the municipality of Novo Progresso and Pará State, respectively. The increased number of fire occurrences in the primary forest suggests possible ecosystem degradation. Deforestation reported for 2019 surpassed 10,000 km2, which is 48% higher than the previous ten years, with an average of 6760 km2. The steady increase of deforestation in the Brazilian Amazon after 2012 has been a worldwide concern because of the forest loss itself as well as the massive GHG emitted in the Brazilian Amazon. We estimated 295 million tons of net CO2, which is equivalent to 16.4% of the combined emissions of CO2 and CH4 emitted by Brazil in 2019. The correlation of deforestation and fire occurrences reported from satellite images confirmed the slash-and-burn practice and the secondary effect of deforestation, i.e., degradation of primary forest surrounding the deforested areas. Hotspots’ location was deemed to be an important tool to verify forest degradation. The incidence of hotspots in forest area is from 5% to 20% of newly slashed-and-burned areas, which confirms the strong impact of deforestation on ecosystem degradation due to fire occurrences over the Brazilian Amazon.

Graphical Abstract

1. Introduction

Global efforts have been made to preserve Earth’s ecosystems and to mitigate climate changes, including reductions of deforestation and forest degradation [1,2]. The Brazilian Amazon is one of the most endangered ecosystems. A deep understanding of this ecosystem, including its carbon cycle, is essential to know the adaptability of the environment to climate changes [3]. The Brazilian Amazon, with about 5.2 million km2, covers the states of Acre (AC), Amapá (AP), Amazonas (AM), Maranhão (MA), Mato Grosso (MT), Pará (PA), Rondônia (RO), Roraima (RR), and Tocantins (TO), and occupies about 60% of the Brazilian territory (Figure 1A). Human occupation in this region has claimed large areas of the original forest for settlement, beef production, crop plantation, and hydropower generation [4,5,6,7,8,9,10,11,12], especially in a region known as the deforestation arch. This arch-shaped region is located in the southernmost part of the Brazilian Amazon and shows the highest occurrence of forest clearings [13] and occupation [14,15]. It covers about 1.71 million km2, i.e., 33% of the Brazilian Amazon. This region stretches from the southeast of Pará State to the east of Acre State, concentrating 77% of total deforestation of the Brazilian Amazon, mostly for soybean plantation and cattle ranching [5,15,16]. Figure 1B shows the annual deforestation over the Pará State and the Brazilian Amazon, as estimated by the National Institute for Space Research (INPE), from 1988 to 2019. This institution defines deforestation as the clear-cut conversion of the primary forest by human activities, detected by the Earth Observation satellite optical sensors [13].
Since 2006, the highest levels of deforestation in the Brazilian Amazon are found in the Pará State, reaching about 5000 km2 in 2019. It can also be seen in Figure 1B that the deforestation trend in the Pará is similar to that of the entire Brazilian Amazon. In this state, forest disturbances are located mainly in the south, southwest, and east borders, covering approximately 550,000 km2. The largest annual deforestation in the Brazilian Amazon occurred in 1995, surpassing 29,000 km2. A second peak occurred in the period 2002–2004, with an average of 24,939 km2. From 2004 to 2012, there was a sharp decrease in annual deforestation rates, as indicated by the blue line in Figure 1B (correlation higher than 80%). Voluntary “Reducing Emission from deforestation and forest Degradation in Developing countries” (REDD+) projects for the region started in 2008 [17]. By this time, Brazil was close to reaching the goal of reducing deforestation by 80% until 2020 (green, dashed line in Figure 1B) compared to the 1996–2005 period. This goal was set in 2009 during the United Nations Framework Convention on Climate Change (UNFCCC) held in Copenhagen, Denmark [18]. The trend, however, inverted, as indicated by the steady growth of the red line in Figure 1B. The inflexion is linked to the Federal Law n. 12.727/2012 [19] that, to some extent, relaxed forest conservation. As of 2019, deforestation in Pará State alone was higher than the target value set in 2009 for the whole Brazilian Amazon.
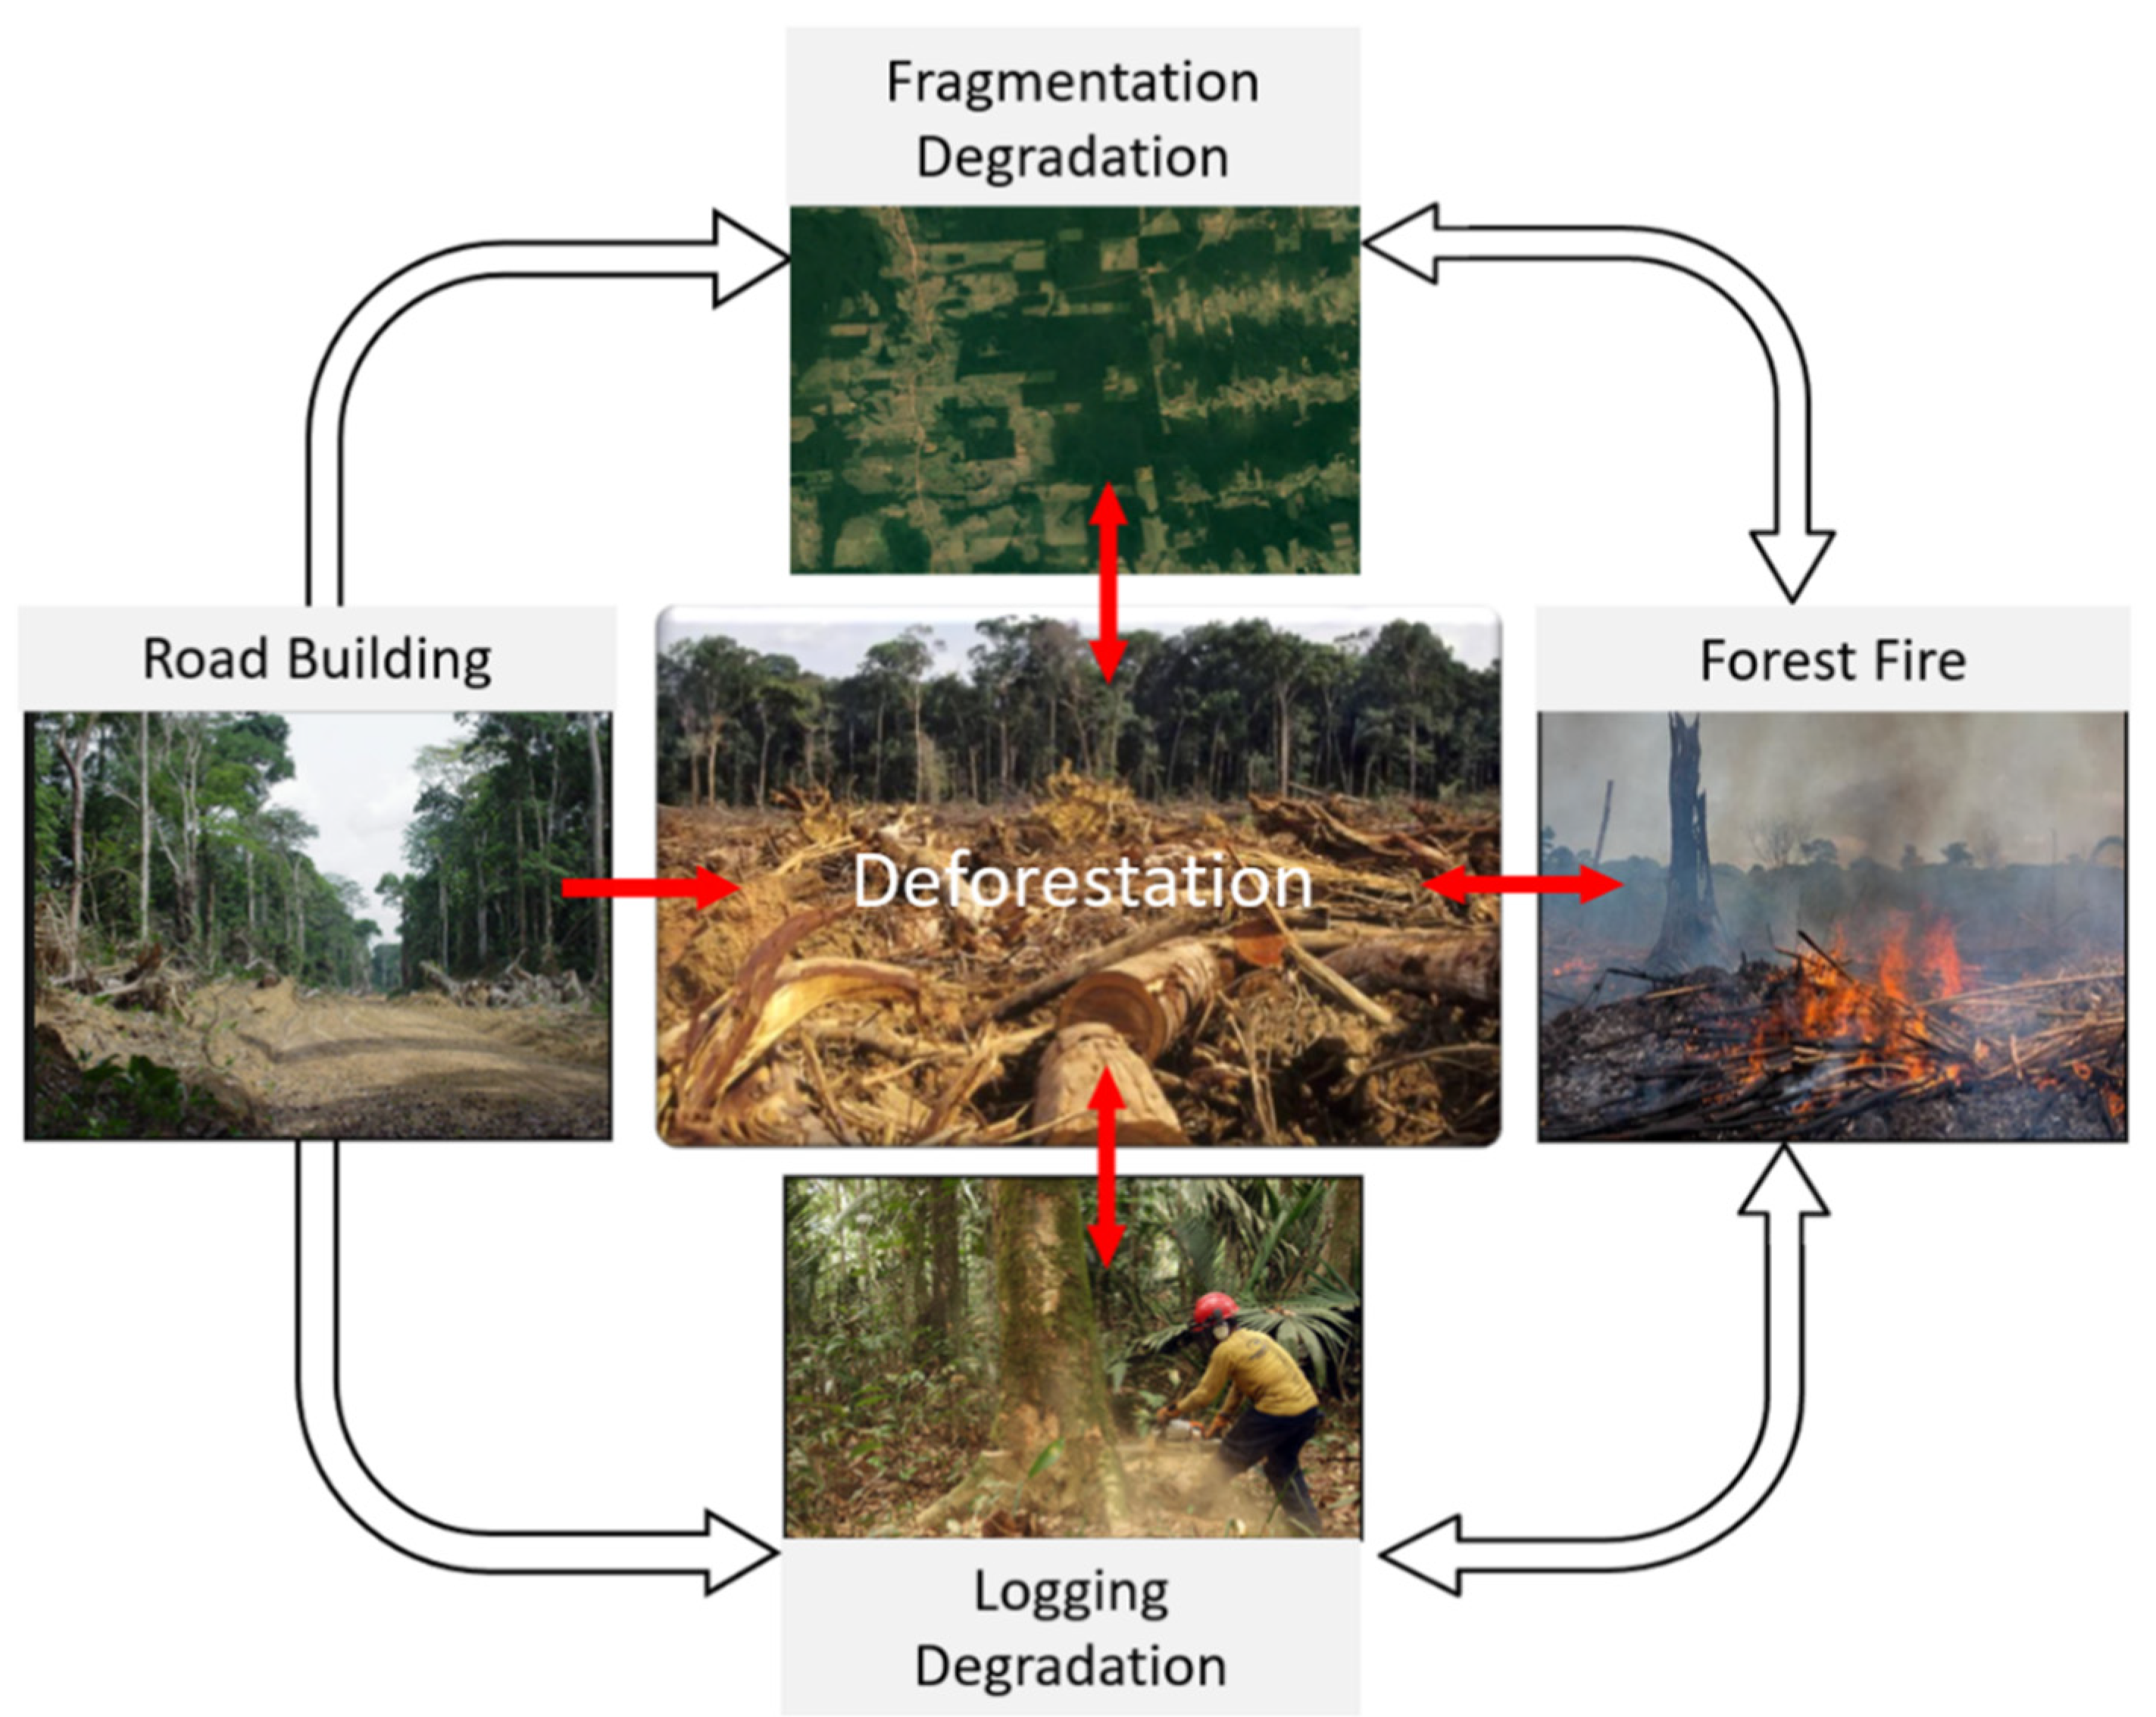
Figure 2 shows the relationship between land use and land cover changes, and forest fire in the Brazilian Amazon, as proposed in References [5,6]. Road construction facilitates forest access, accelerating deforestation and selective logging, and lowering the resilience of surrounding forests to fire [20,21,22,23]. Deforestation raises the number of forest edges, increasing the susceptibility of forests to fires [24,25,26,27]. Selective logging degrades forest, reduces canopy and soil moisture, and increases canopy temperature and tree mortality, intensifying fire outbreaks [22,28,29]. The cycle grows in a spiral configuration: forest fires and smoke emissions reduce rainfall, particularly in the dry season [24,30,31,32,33,34,35], previously burned areas are more prone to recurrence, changes in the global and local climate, along with land use intensification, contribute to increasing the level of forest degradation [28,35,36,37,38,39,40,41], most significant changes in forest canopy density take place in regions close to the forest edges [16,22,35,42], and land management fires can penetrate the standing degraded forests, as demonstrated by others studies [21,43,44].
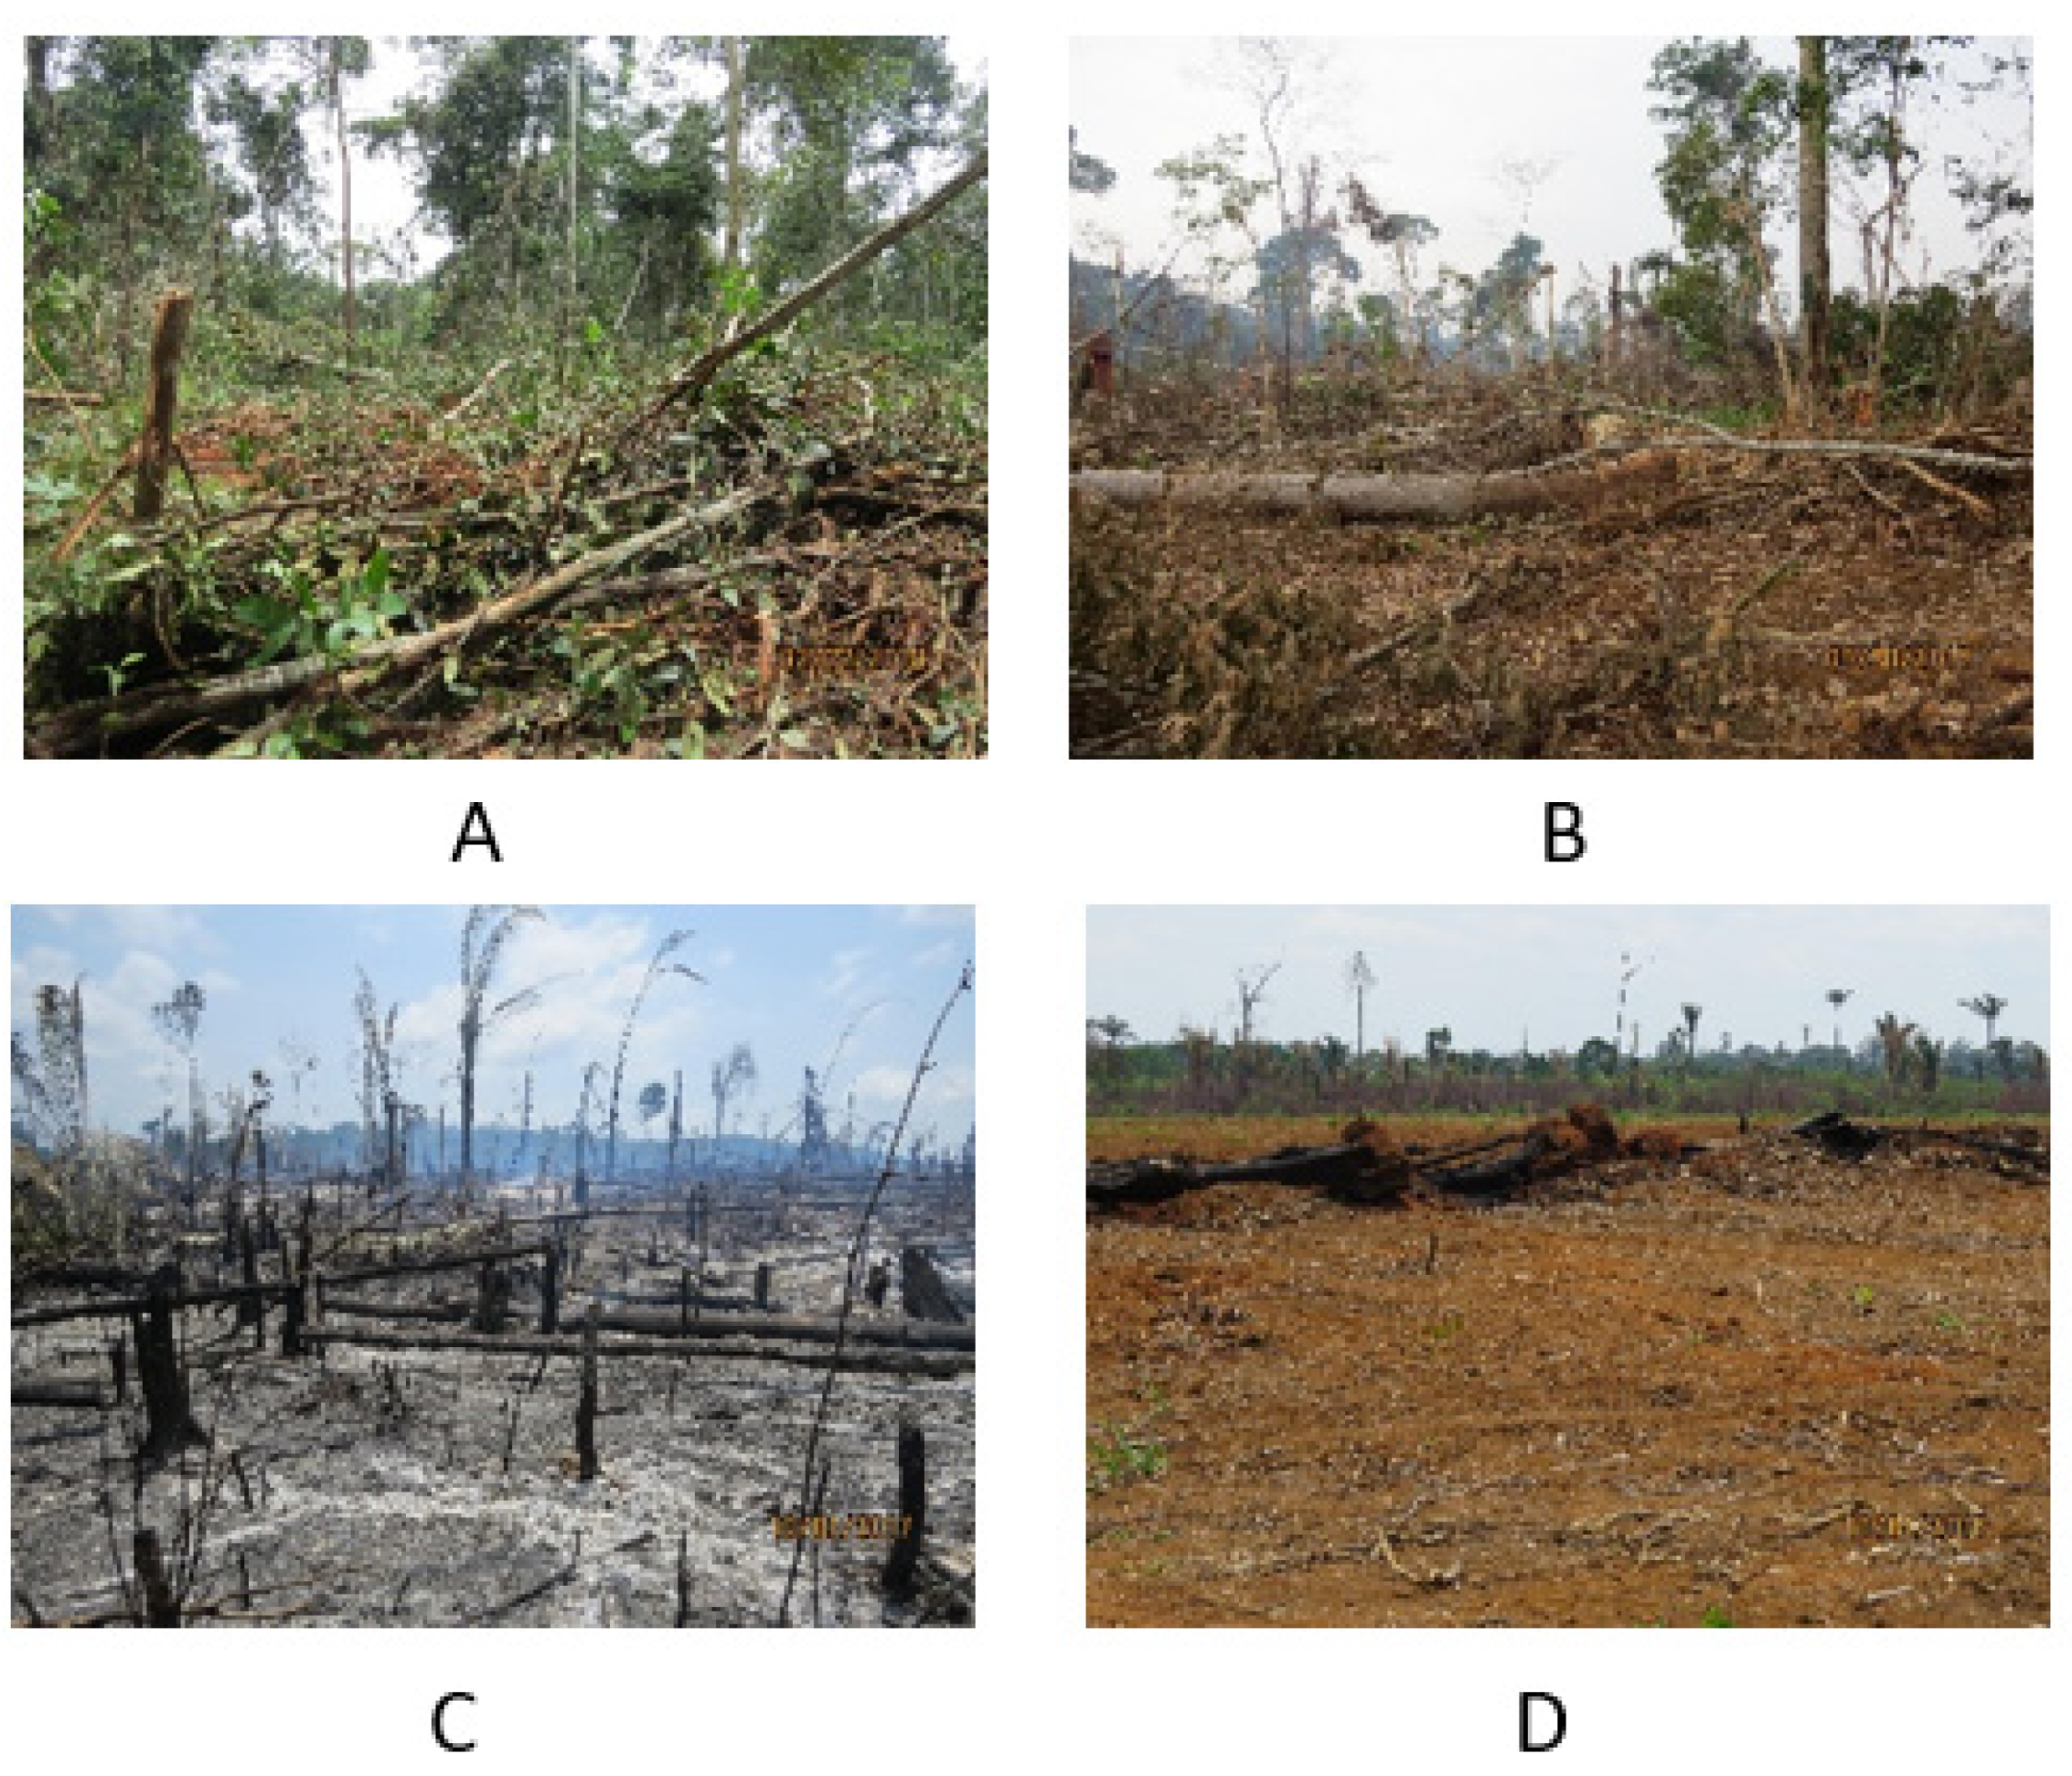
Several in-situ measurements of the slash-and-burn forest clearing practices have been conducted to infer greenhouse gas (GHG) emission [45,46,47,48,49]. Figure 3 shows the main steps of the slash-and-burn practices observed in the Brazilian Amazon. By the end of the rainy season, the forest is clear-cut (Figure 3A) and left in the terrain to dry until the peak of the dry season (Figure 3B), after which the fire is set. The burning period typically extends from July to October. The initial fire consumes the duff-layer, small branches, and leaves, while most of the massive trunks remain in the terrain (Figure 3C). Finally, the remaining scorched logs are stockpiled and burned along the coming years until the terrain becomes dominantly bare soil (Figure 3D). Fire may penetrate the standing forest if moisture favors flame propagation through the understory vegetation [42,43,44]. Forest degradation increases after successive fires, observed by the combustion of growing small trees in dry seasons. The less resilient forest also favors significant fire recurrences over the years. Fire is used mainly for land management, mostly for clearing the terrain after the slash-and-burn deforestation for subsequent maintenance of deforested areas [50,51].
GHG emissions from deforestation in the Brazilian Amazon are also of great concern, considering that it generally accounts for more than 200 t ha−1 of CO2 after the clear-cut occupation [44,49,52]. These authors also observed that other gases such as CO, CH4, and non-methane hydrocarbons and particulates are also emitted in large quantities.
This paper addresses the relationship between forest loss, fire occurrence, forest degradation, and primary GHG emissions over the Brazilian Amazon and downscaling to the Pará State and Novo Progresso municipality. Several authors studied carbon emissions from fires in the Brazilian Amazon, emphasizing specific topics such as drought-related fires rather than forest-clearing-related fires [35] or in specific regions such as the states of Rondônia and Mato Grosso [53]. Aragão and Shimabukuro [37] reported an increase of fire occurrences in areas experiencing reduced deforestation. The literature review showed that there is no previous study relating the amount of fire occurrences in standing forest (degradation) due to deforestation following the slash-and-burn practices over the region. We relied on annual reports published by INPE, for the period 2006–2019. The data were used to correlate fire events in a specific area (Novo Progresso municipality) and in a regional area (Pará State), both located in the deforestation arch. Fire outbreaks inside the primary forest were also investigated to assess ecosystem degradation. The work also presents the amount of GHG originated by the first forest clearing process along the Brazilian rainforest in 2019. The period of 2007–2019 was selected for this study, as it has sharp decay on deforestation rates followed by the steady growth of human occupation after 2012, as depicted in Figure 1.

2. Materials and Methods

2.1. Novo Progresso Region

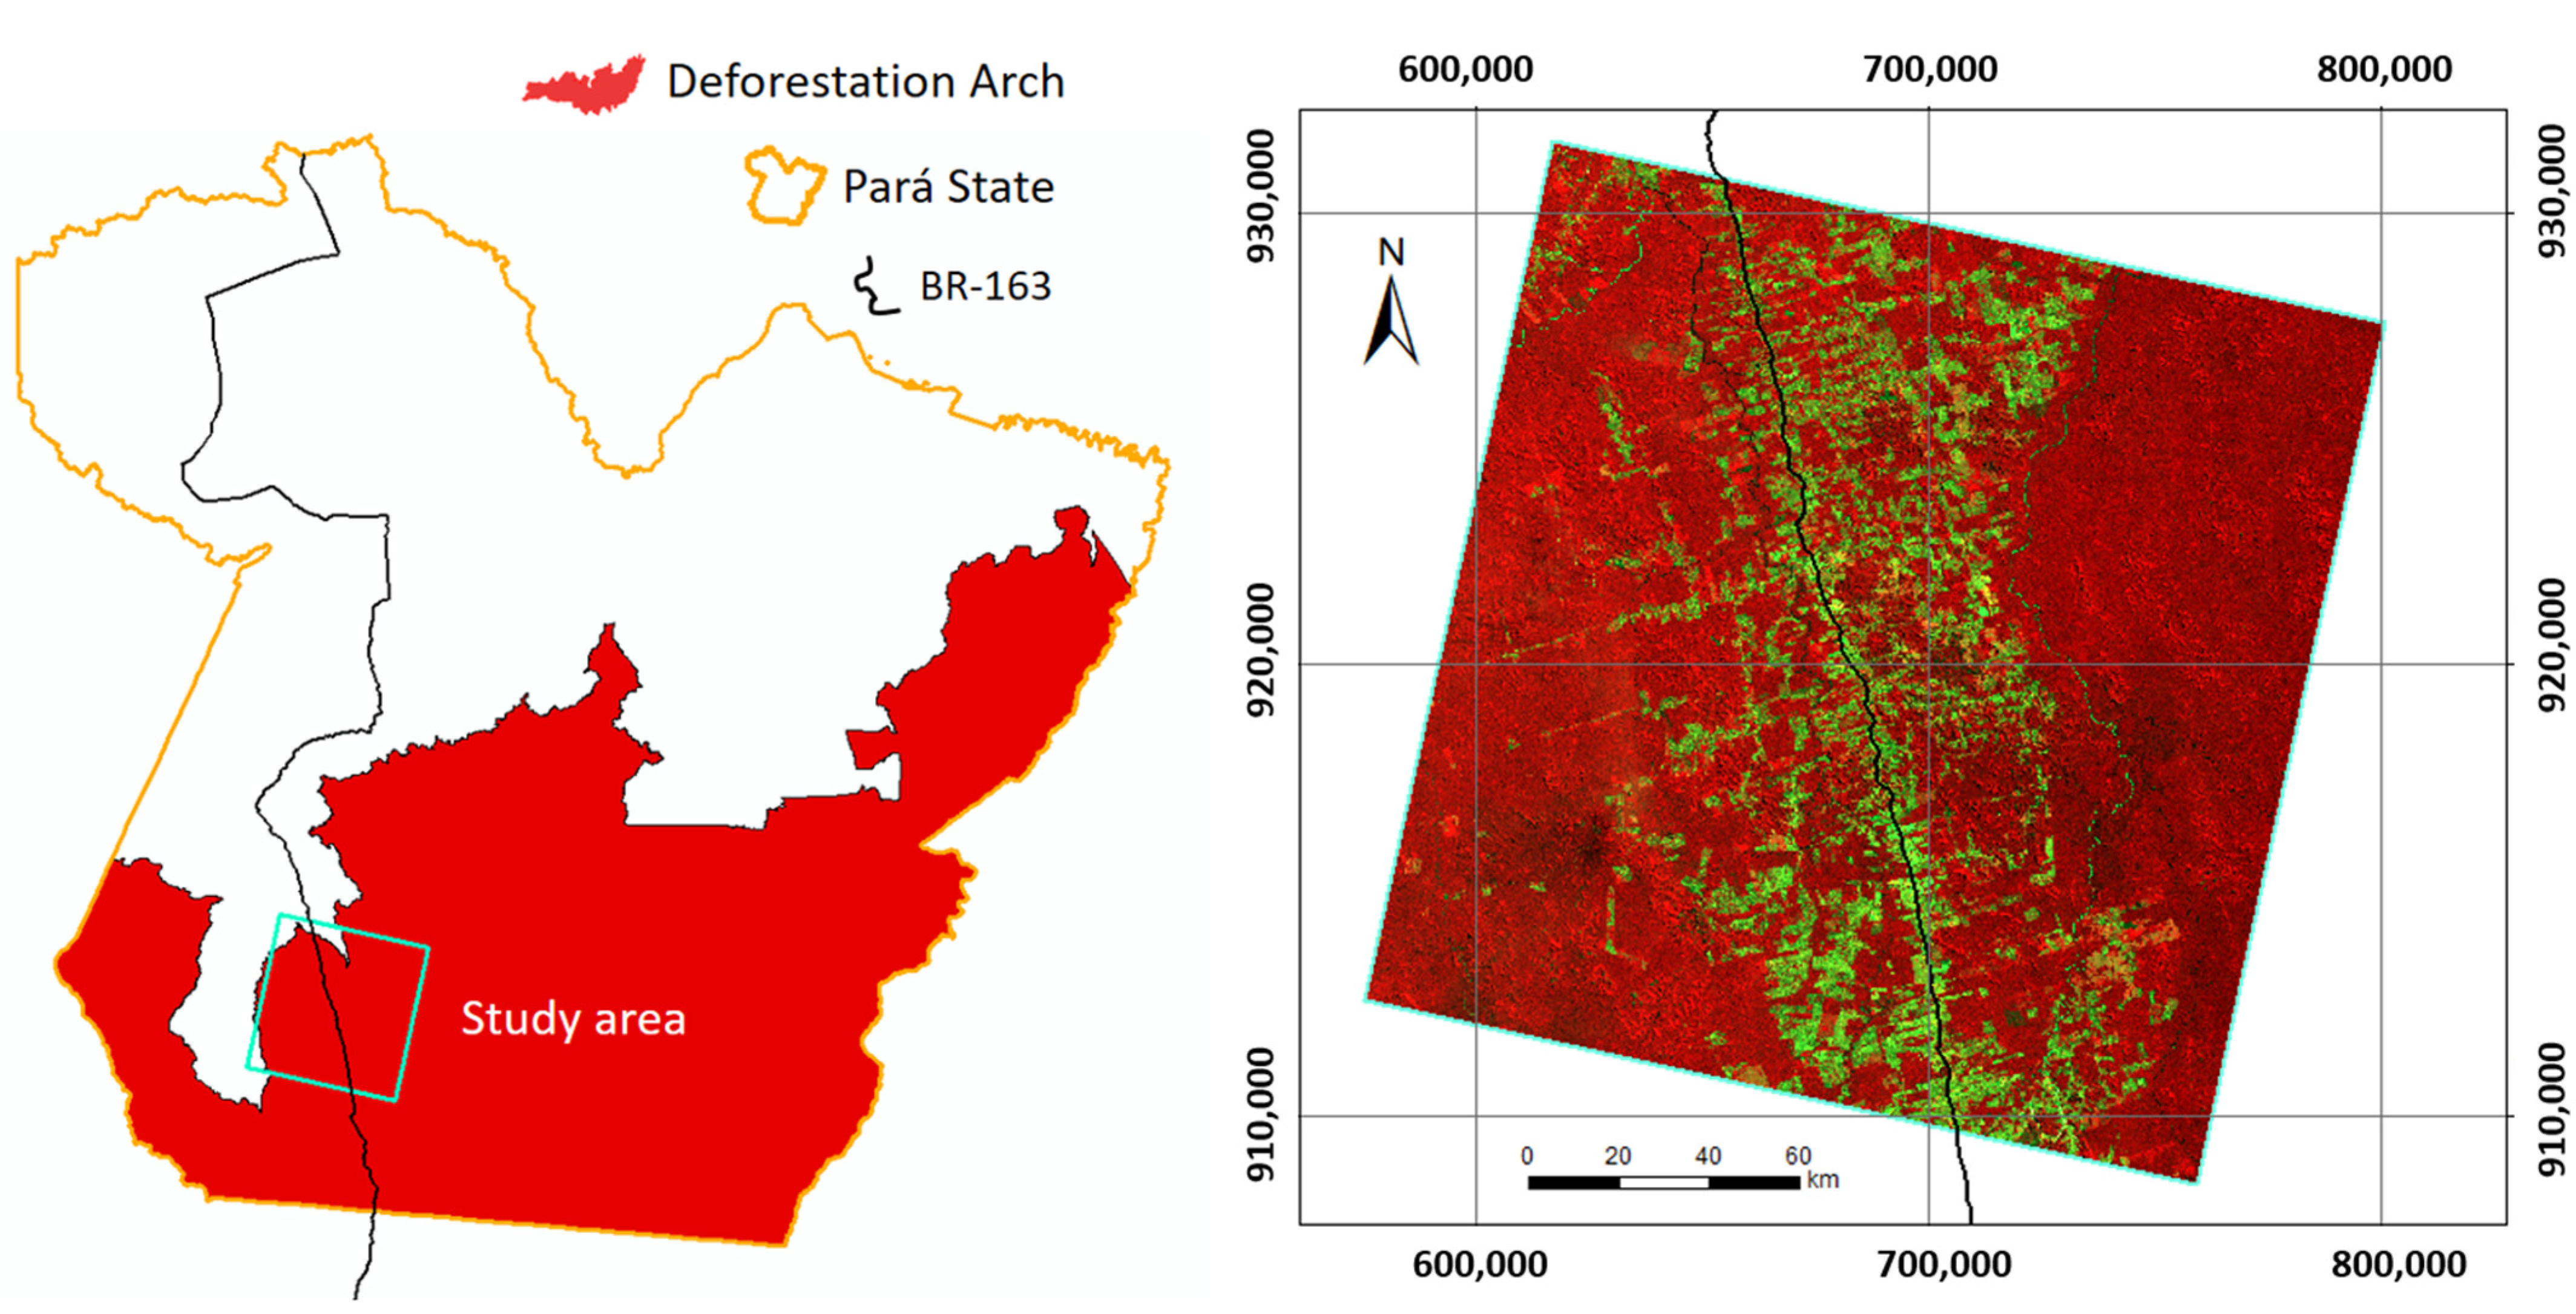
Pará State encompasses an area of 1,246,000 km2, equivalent to the total area occupied by Germany, France, the United Kingdom, and Italy, altogether. The Novo Progresso region, located in the southwest of the Pará State (Figure 4), covers 36,800 km2 and is one of the areas in this state facing long-time, largest clear-cutting deforestation. Most of the deforestation in the Novo Progresso region is found along the BR-163 highway, crossing the region in the North–South direction. Land cover change mapping and monitoring of this municipality has been a big concern in the literature [54,55,56]. Within this context, we analyzed our data by considering them in three different scales: municipality, state, and region levels, in order to check the consistency among these scales.

2.2. Datasets

The datasets of deforestation and fire hotspots were produced by the INPE’s Amazon Deforestation Satellite Monitoring Program (PRODES) and the Forest Fire Program (Programa Queimadas), respectively. PRODES provides the annual rates of clear-cut deforested areas larger than 6.25 hectares over the Brazilian Amazon [58]. The system makes use of moderate spatial resolution (10–100 m) optical data, mostly from the dry season, obtained by Landsat 8 (30 m spatial resolution and 16-day revisit time), China–Brazil Earth Resources Satellite (CBERS-4) (20 m spatial resolution and 26-day revisit time), and Sentinel-2 (10 m spatial resolution and 5-day revisit time) satellites. The near real-time fire detection data, provided by the Forest Fire Program [59], are based on thermal sensors onboard several sun-synchronous and geostationary satellites, namely:
  • MODerate Resolution Imaging Spectroradiometer (MODIS) sensor onboard Aqua and Terra platforms.
  • Advanced Very High-Resolution Radiometer (AVHRR) sensor onboard National Oceanic and Atmospheric Administration (NOAA) satellite.
  • AVHRR-3 and Infrared Atmospheric Sounder Interferometer (IASI) sensors onboard Meteorological Operational (MetOp) satellite.
  • Visible Infrared Imaging Radiometer Suite (VIIRS) sensor onboard Suomi National Polar-orbiting Partnership (NPP) satellite.
  • Advanced Baseline Imager (ABI) sensor, onboard GOES-R satellite.
  • Spinning Enhanced Visible and Infrared Imager (SEVIRI) sensor onboard Meteosat Second Generation (MSG) satellite.
Daily fire hotspot monitoring is performed by the MODIS sensor (Collection 6) [59,60,61]. The detection of fire hotspots by INPE through satellite images is carried out using well-known techniques [62,63,64], basically by subtracting brightness temperatures measured in the middle infrared (MIR) band (around 4 µm) with that of the measured thermal infrared (TIR) band (around 11 µm). Thermal anomalies are identified when the difference in the brightness temperature measured in these two spectral bands is higher than a given threshold, i.e., when the temperature from MIR is much higher than that of TIR. Hantson et al. [65] investigated the strengths and weaknesses of hotspots detected by MODIS to characterize fire occurrence in many different ecosystems. For the Brazilian Amazon, they reported less than 2.1% of commissioning error, and 80% confidence interval between hotspot detection (MODIS) and burned area (Landsat). The coefficient of determination between the annual number of hotspots and burned areas for the Amazon was R2 = 0.95.

2.3. Methodology

2.3.1. Deforestation and Fire Hotspots

In the southwest region of Pará State, the typical rainy season is from November to May and the typical dry season is from June to October [66]. INPE´s deforestation mapping starts on 1 August of the previous year until 31 July of the current year. In this paper, this period is referred to as PY (PRODES Year). In PRODES, the processing time is quite long to account for the required level of confidence (>90%) and the size of the region (deforestation arch). Deforestation reports are generally published about four months after the end of the mapping period.
Fire occurrences within the forest and deforested areas were covered for the same reference period (2007–2019) to evaluate their strength of relationship with deforestation. To avoid misinterpretations, the reference year for the hotspots follows that of deforestation. Most planned fires, however, take place in the mid/end of the dry season (August–September) for higher combustion efficiency. The first fires consume about 50% of the recently slashed biomass. The scorched biomass is then stockpiled and burnt in the following years to complete the land clearing process. The newly deforested areas reported for a given PY show intense fire activities in the first months of PY+1 (August–September), but fire hotspots are likely to appear at that pre-burnt area for the next PRODES years (PY+2, PY+3, PY+4, and so on), though at lesser intensity when compared to the first burn. Throughout the work, fire scars, hotspots, and fire outbreaks are mentioned indiscriminately and are considered as indicative of the spatial and temporal burned areas.
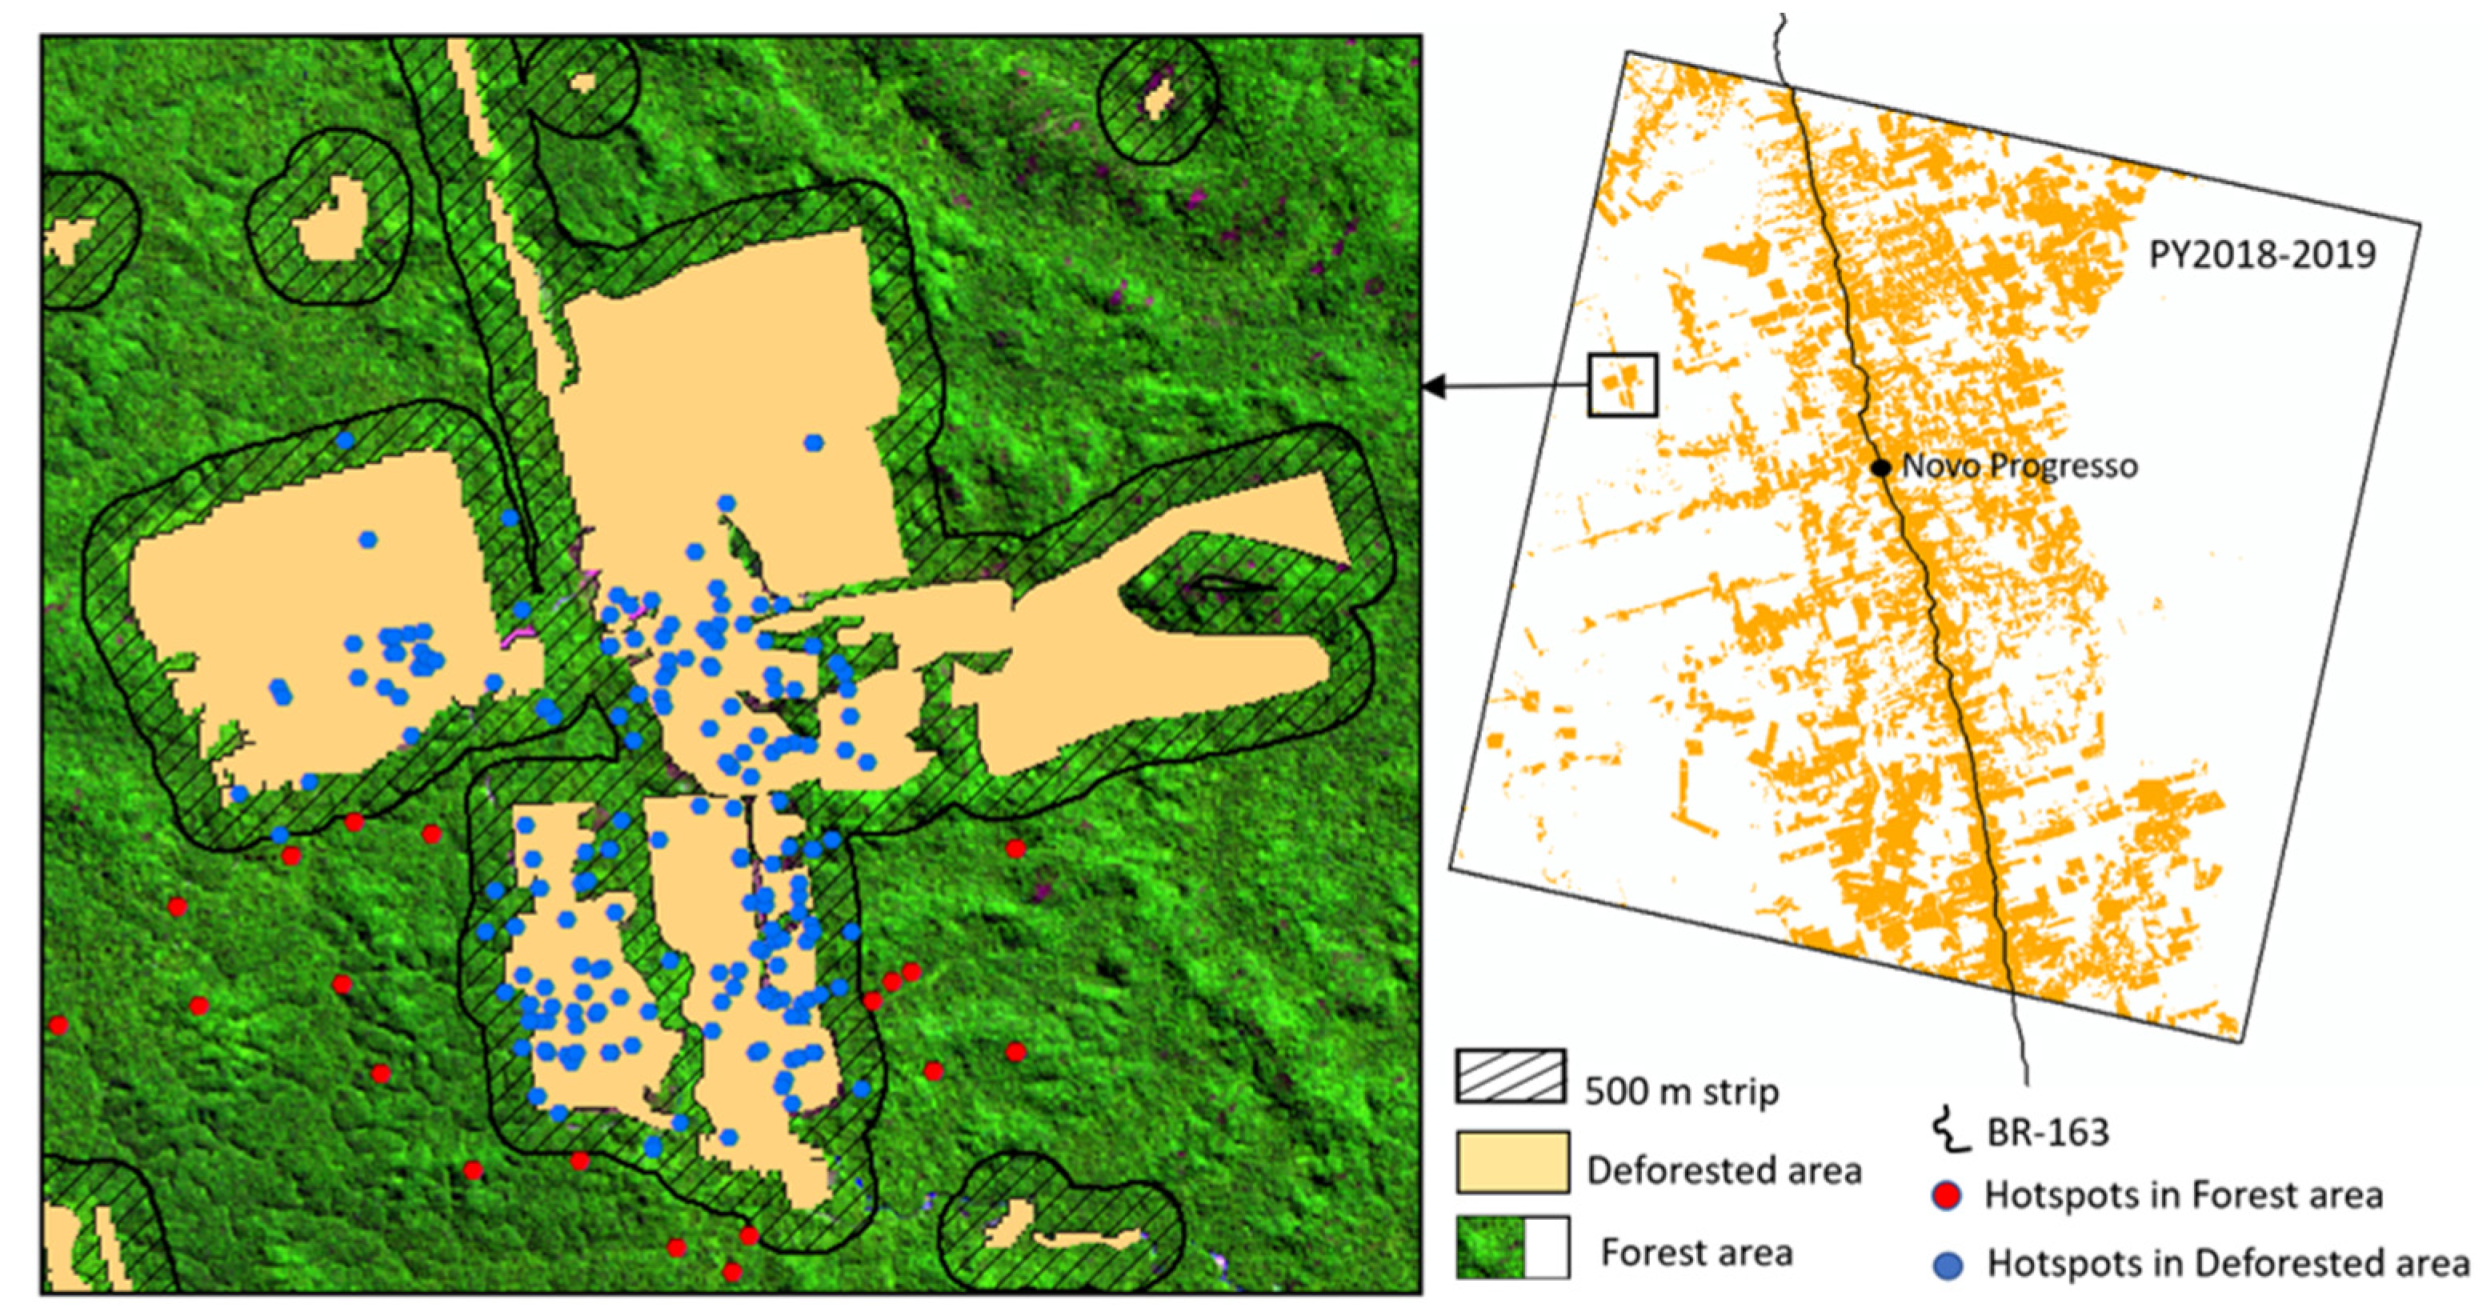
Figure 5 illustrates, for a given year, the accumulative location of detected fire hotspots inside the forest shown as red dots, and in the deforested areas, indicated by blue dots. Hotspots’ location accuracy is ±500 m. Due to positioning uncertainty, the fire hotspots reported at a distance higher than 500 meters (buffer zone) from the edge of deforested areas were considered to take place at the standing forest. The boundaries of deforested areas were updated annually. Therefore, the buffer zone of 500 m was updated accordingly. Figure 5 shows the consolidated data of forest and non-forest areas as reported by INPE, corresponding to the actual status of the region by 31 July 2019 (PY2018–2019). The hotspots in Figure 5 give the location of their incidences at any time during the period of 1 August 2018 to 31 July 2019. Most of the fire hotspots would appear in the dry season of 2018, from July to October, for which clear-cut had occurred at the first quarter of 2018 (PY2017–2018).
It is important to highlight that the healthy undisturbed forest does not sustain large fires in the Brazilian Amazon, due to the high levels of humidity, even in the dry season. Fire occurrences in the humid tropical forest are observed in dead trees and along the duff-layer. The understory vegetation may propagate flame in the surroundings of large cleared areas (degraded edges of forests) in combination with an intense dry season. Flame propagation through the understory vegetation is too weak to be captured by satellite sensors. Therefore, the fire hotspots inside the intact forest may be due to the flaming of large naturally dead trees or along an open forest trail where small slashed trees have the ability to sustain the fire. Selective logging also degrades the area around the large falling trees, thus making the vicinity prone to propagate flame. Fire occurrences inside the standing forest are restricted to degraded forest caused by any of the previously discussed events or their combined effects.
This study deals with deforestation and the use of fire for land clearing. Fire hotspots may also occur in nearby degraded areas, such as dead trees, near extracted logs and trails. Total GHG emission for the Amazon was limited to the burning of the newly deforested area corrected by the average regrowth of secondary forest throughout.

2.3.2. Greenhouse Gas Emissions

Amazon GHG emissions from slash-and-burn practices can be estimated based on in-situ measurements of forest clearing fire experiments [50,52]. Figure 6 explains the GHG estimation model. Emissions are calculated based on the amount of burned dry biomass, combustion efficiency, and the emission factors for each gas. The dry weight of biomass (ton) is estimated from the local fresh biomass (ton ha−1), its humidity (%), and the amount of deforested area (ha). For the Novo Progresso region, we used the data obtained [52] from two different sites in the Alta Floresta municipality, which is less than 500 km from the Novo Progresso region. For the Pará State, the fresh biomass was calculated by averaging the estimates from Alta Floresta, Mato Grosso State, and Manaus, Amazonas State [46,50,52]. For the Brazilian Amazon, the average fresh biomass included the values from the Pará State and from the municipalities of Cruzeiro do Sul and Rio Branco, both in Acre State. More detailed information about the methodology of the GHG emissions and estimates can be found in Carvalho Jr. et al. [50] and Soares Neto et al. [52].
Soares Neto et al. [52] reported combustion efficiencies of about 50% and fresh biomass humidity of 42%, prior to clear-cut. Table 1 summarizes the relevant data for emission estimates from slash-and-burn activities in the Brazilian Amazon rainforest.

3. Results and Discussion

3.1. Fire Hotspots in the Novo Progresso Region

Table 2 reports the statistics about the fire hotspot occurrences inside the deforested and forest areas in the Novo Progresso region. We found a total of 11,769 fire hotspots in PY2006–2007, with 9702 located in deforested areas (corresponding to 5230.90 km2) and 2067 in forest areas (corresponding to an area of 31,574.50 km2). In PY2018–2019, the total fire outbreaks detected from 1 August 2018 to 31 July 2019 was 39,384, from which 37,236 over 8481.80 km2 of deforested area, and 2148 over 28,323.70 km2 of intact forest.
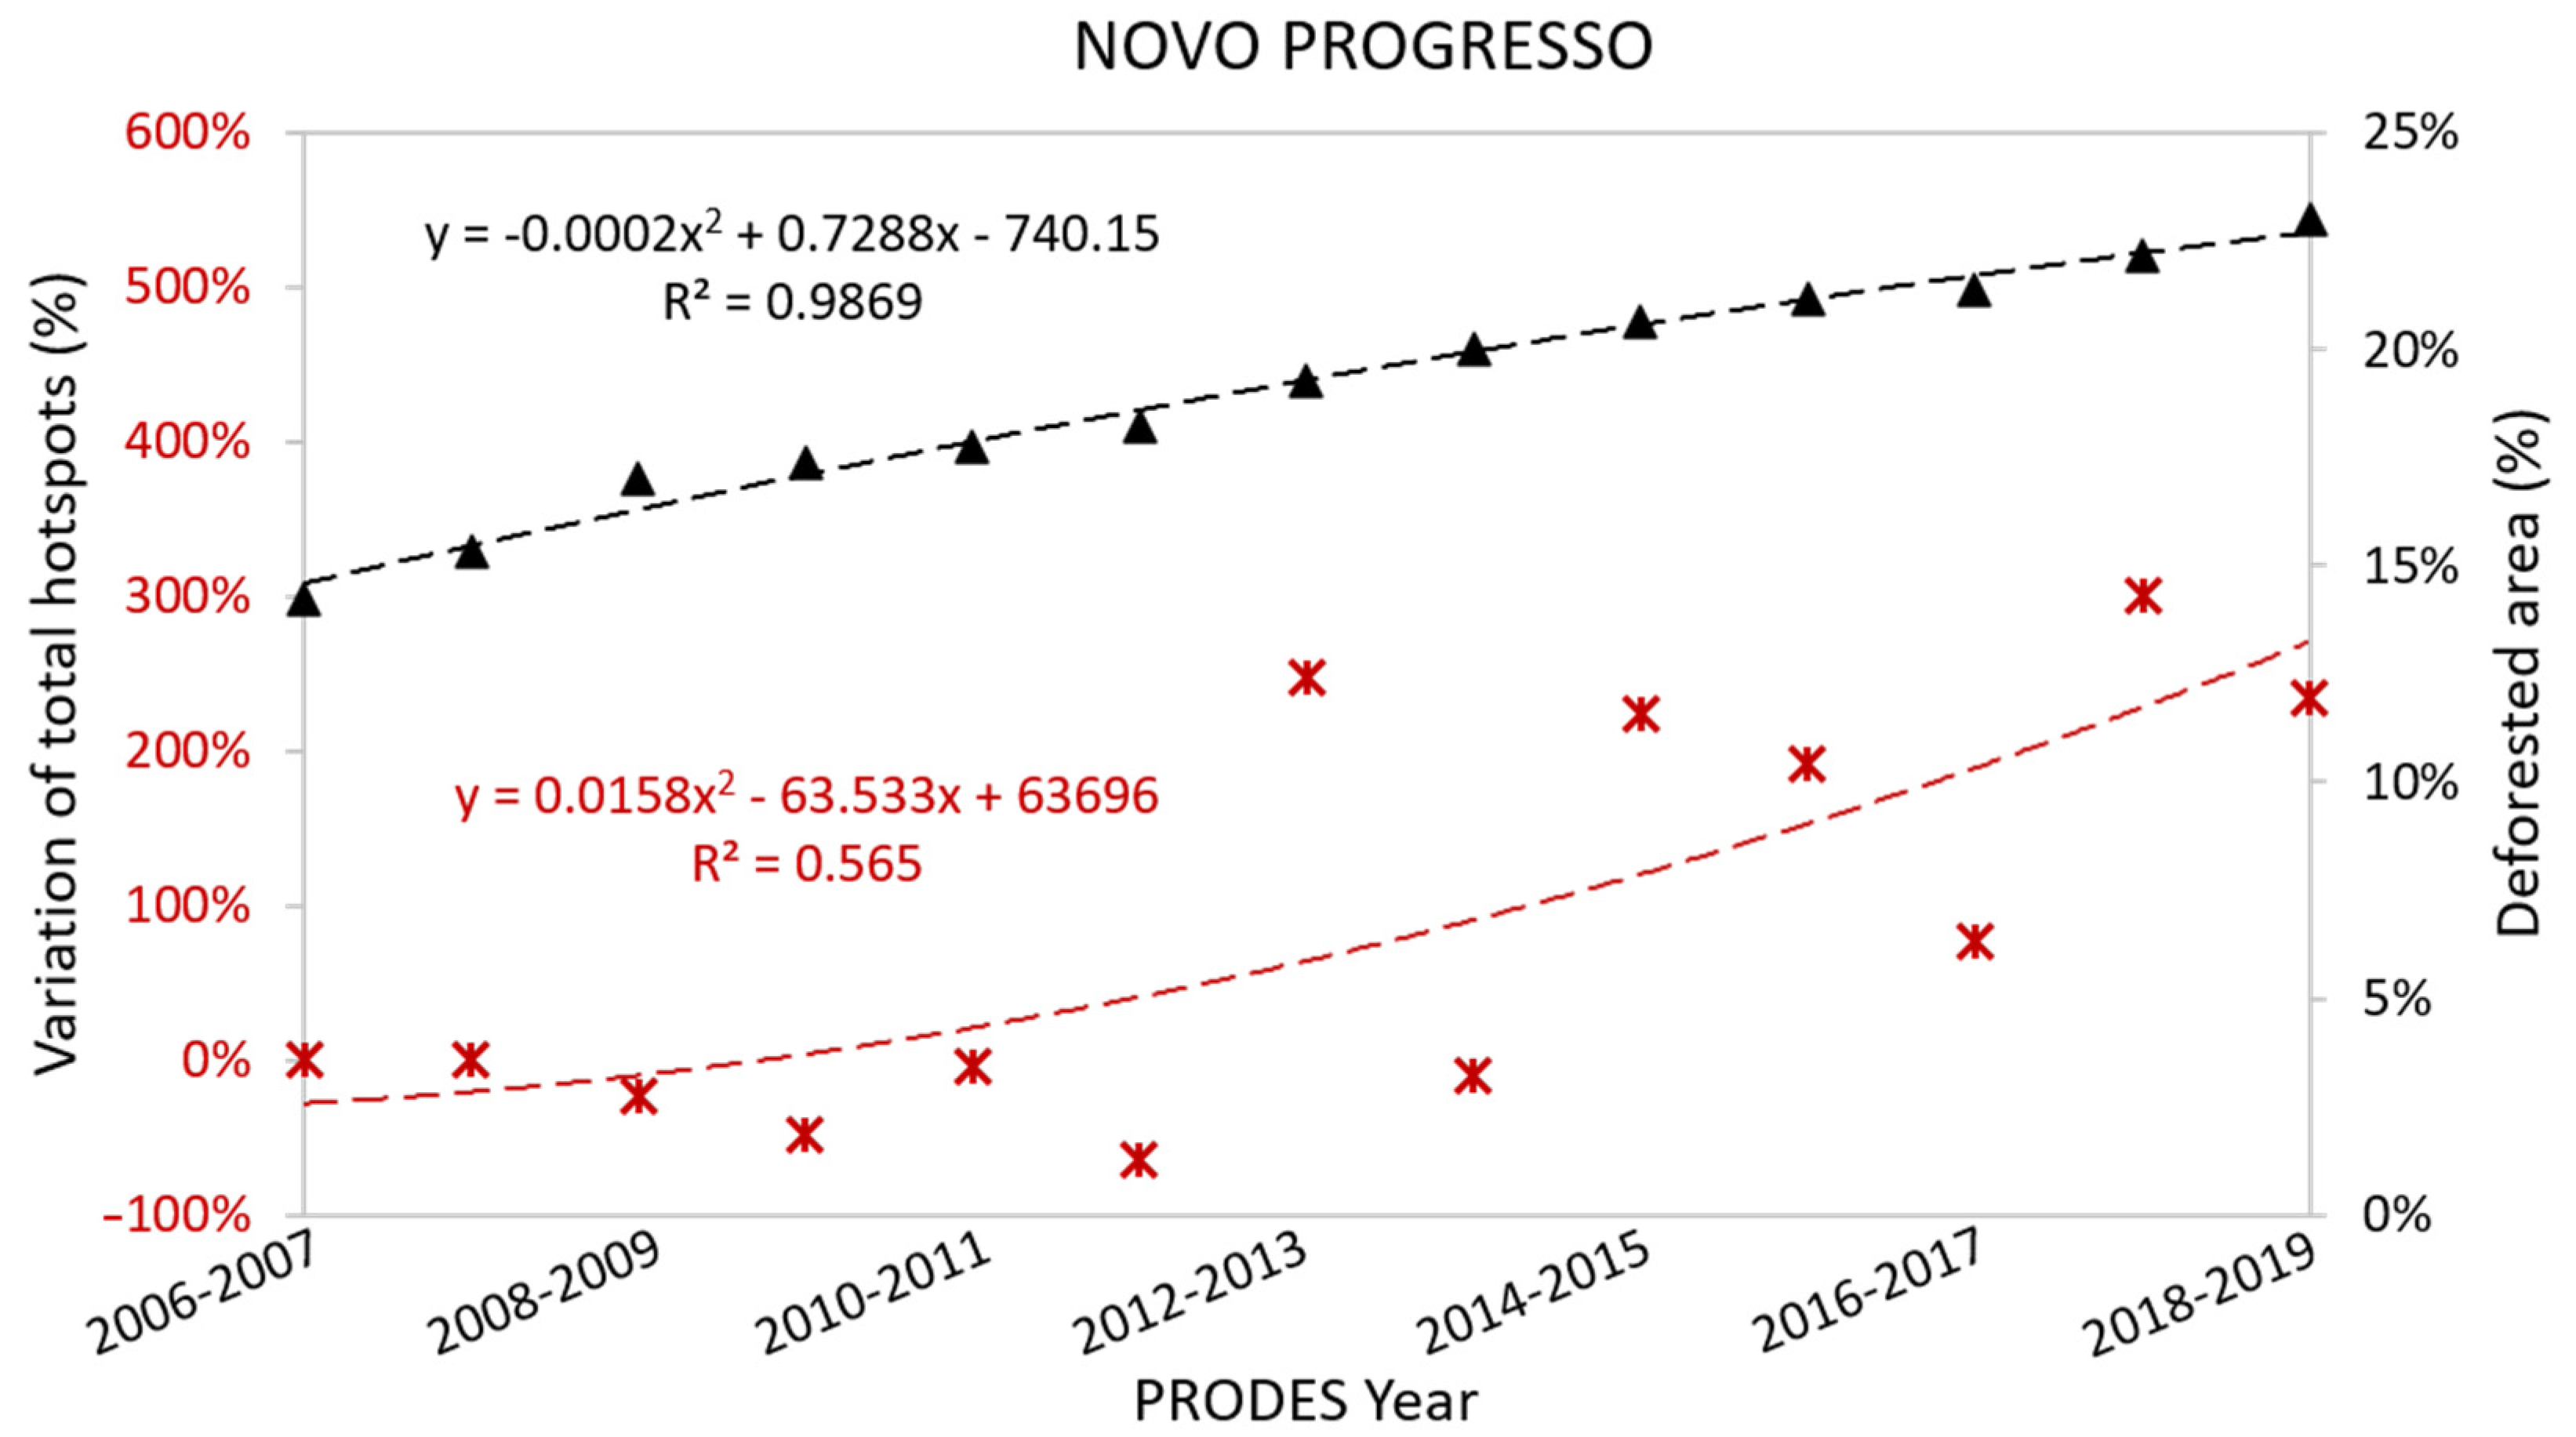
Figure 7 shows the variation of total fire outbreaks relative to PY2006–2007 and accumulated deforestation in the Novo Progresso region. From PY2006–2007 to PY2018–2019, deforested areas increased by 8.8%, with a positive correlation of 0.72 with total detected fire hotspots for the same area. The variation of hotspots was stable from PY2006–2007 to PY2011–2012 and increased from PY2012–2013 to PY2018–2019. Deforested areas increased from 4.0% of the period PY2006–2007 to PY2011–2012 to 4.8% of the period PY2012–2013 to PY2018–2019. The average of fire outbreaks was 9047 against 33,014 from PY2012–2013 to PY2018–2019, a three-fold increase.
In this study, deforestation, fire hotspot, and GHG emission data for the period 2007–2019 were analyzed at the levels of municipality, state, and region. In the Novo Progresso municipality, both deforestation and fire hotspots increased over time, though fire hotspots’ increase was not so consistent as deforestation over the period considered. Several studies indicate that, in tropical forests, deforestation and land management practices by using fire are strongly linked [4,5,6,7,8,9,10,11,12]. In the research conducted in Reference [67] in the Novo Progresso region, more than 70% of fire events detected from MODIS time series for the period 2000–2014 occurred over deforested areas. The sharp increase of fire hotspots found in the period from PY2012–2013 to PY2018–2019 may be related to the current Brazilian Forest Code [19]. This law states that farmers located in the Brazilian Amazon need to maintain 80% of their land with native vegetation if located in forestlands or 30% if located in non-forestlands. However, the law amnestied 58% of the required restoration areas deforested illegally before 2008 [68]. Therefore, the increase in total fire hotspots from 2013 may be associated with the relaxation from the prevailing law.
Figure 8 exemplifies the dynamics of deforestation occurred in the Novo Progresso region. The deforestation dynamics over the period under investigation are shown in yellow. We can see that the deforested area shown in the bottom and right corner in the PY2012–2013 (area A, Figure 8) was subjected to intense fire activity. The clear-cut process and fire occurred in the same PRODES year of 2012–2013. A significant number of fire outbreaks were detected in PY2012–2013, PY2013–2014, and PY2014–2015. Conversely, fewer hotspots were detected in PY2016–2017 and PY2018–2019, indicating that the area was almost free of original forest residues after PY2016–2017.
The fire hotspots over recently deforested areas (clear-cut) are man-induced, as a rapid and cheap means to clear the area (slash-and-burn) that can be observed by comparing Figure 3B,C. Eventually, the fire set to clean a given deforested area may propagate fire on a nearby pasture, or on some crop area or even through the understory of a standing forest, by accident. Fire occurrences inside consolidated occupied areas may suggest land management, as shown in the large-deforested area in PY2012–2013 (area B, Figure 8). For this area, the high density of hotspots was detected in PY2015–2016 and decayed in the following two years. The high concentration of fire outbreaks in deforested areas is caused by either the combustion of old pre-carbonized trunks that were not burned in the previous years or due to the burning of pasture, caused by an advance of the fire front from the deforested area or even land management.
Fire intensity increased sharply thereafter, as it can be seen in PY2017–2018 (area C, Figure 8). Burning activities were also observed in PY2018–2019, though with less intensity. The slash-and-burn approach for clearing the forest is even more evident by observing PY2018–2019 in Figure 8. The strong overlapping of deforestation and fire occurrences, shown by the large concentration of hotspots, indicates that the clear-cut took place after 31 July 2018, and the slashed biomass was most likely burnt during the dry season of the same year (2018). The method seemed different from the previous years since forest clearing usually takes place in the rainy season, i.e., in the first quarter of PY, and the fire activity starts in the third quarter of the same year but is reported as PY+1. Such forest clearing processes, also reported by different researchers [5,6,8,11,12,27], confirm the cycle depicted in Figure 2. It begins with the extraction of high commercial value trees (selective logging), followed by the removal of smaller trees and by the clear-cutting of remaining trees and shrubs, producing deforestation in the middle of the forest. Regarding the large-scorched trunks, the clearing process may extend for about five to six years until the remaining logs that were stockpiled had been combusted to completion.
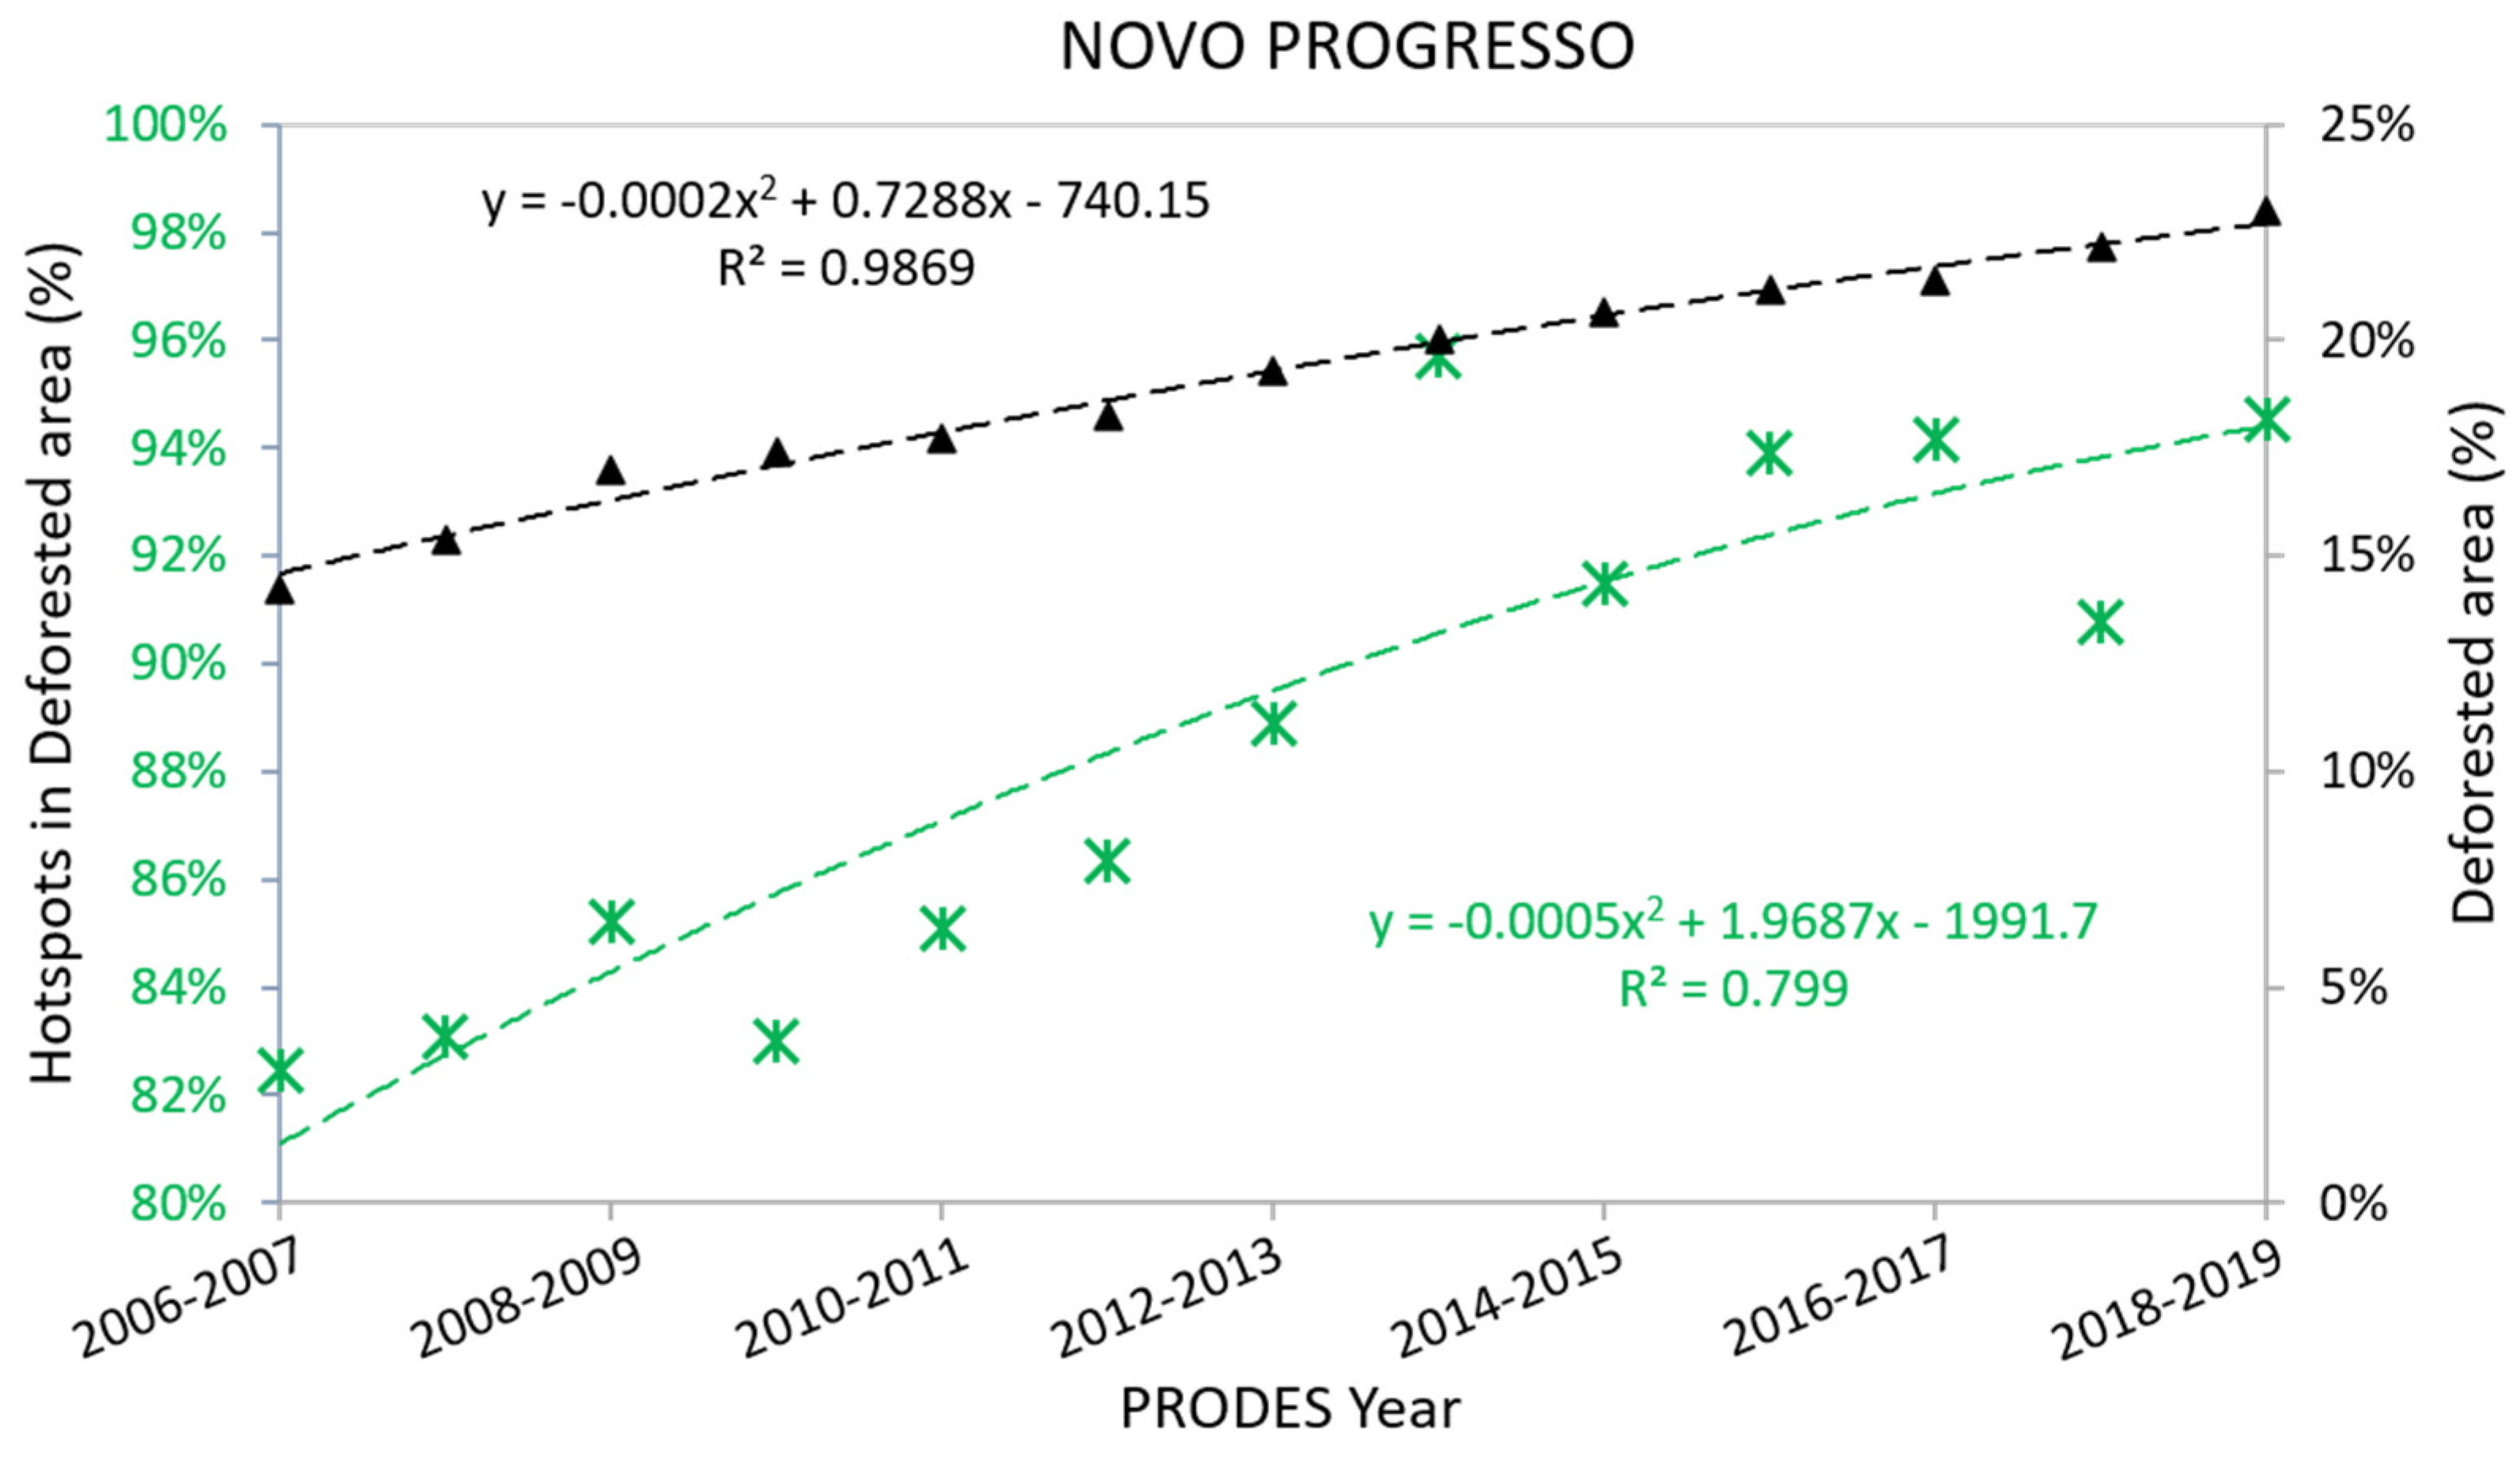
The occurrence of fire inside deforested areas can be observed in Figure 9. In PY2006–2007, the deforested area corresponded to 14.2% of the total Novo Progresso region. For the considered period, there was a steady increase in deforestation. By PY2018–2019, the deforested area accounted for 23.0%, an increase of 8.8% in land cleaning, which corresponds to an area of 3250 km2. In PY2006–2007, there were 11,769 occurrences of total fire hotspots in the Novo Progresso region, of which 82.4% were in deforested areas. In PY2018–2019, the hotspots in deforested area reached 94.5%, an increase of 12.1%. Fire outbreaks in deforested areas indicate the systematic use of fire as a means for new land clearing and land management practices.
The highest annual rate of deforestation occurred in PY2008–2009 (609.6 km2) and the lowest in PY2016–2017 (83.5 km2) (Table 2). After PY2008–2009, a deforestation peak occurred in PY2012–2013 (392.4 km2), followed by the periods of PY2017–2018 and PY2018–2019 when deforestation rates rose again. Fire hotspots, though, increased at higher rates than deforestation, the curve fitting of fire outbreaks indicates a somehow steady increase of fire occurrences for the studied period. The average number of hotspots was 7597 from PY2006–2007 to PY2011–2012 and 30,440 from PY2012–2013 to PY2018–2019, four times higher than the previous period.
Figure 10 shows the number of fire hotspots detected inside the forest for PY2018–2019 as a function of distance from the edge of the deforested area. As can be seen, a significant incidence of fire outbreaks occurred in the first 800 m from the margins and extended up to 1200 m. The same behavior was also observed for the previous years. Other researchers had already recognized a more significant frequency of fires within forest areas and near the deforested areas [4,5,6,16,43,44,50]. The behavior of hotspot occurrences agrees with the data reported in References [40,44]. The increase of fires around the edges of deforested areas enhances the forest degradation along the edges. The decrease in forest resilience to fire makes it more susceptible to sustain biomass combustion due to the reduction in near-the-edge forest humidity. Periods of severe drought combined with an intense slash-and-burn activity favor the outbreaks of fires in standing degraded forests [69].
The research carried out by Matricardi et al. [70], during the period 1992 to 2014, revealed that forest degradation in the Brazilian Amazon had surpassed deforestation. They attributed 40% of the whole Amazon forest was degraded by intensive logging and understory fires, and the remaining 60% through edges and isolated forest fragmentation.
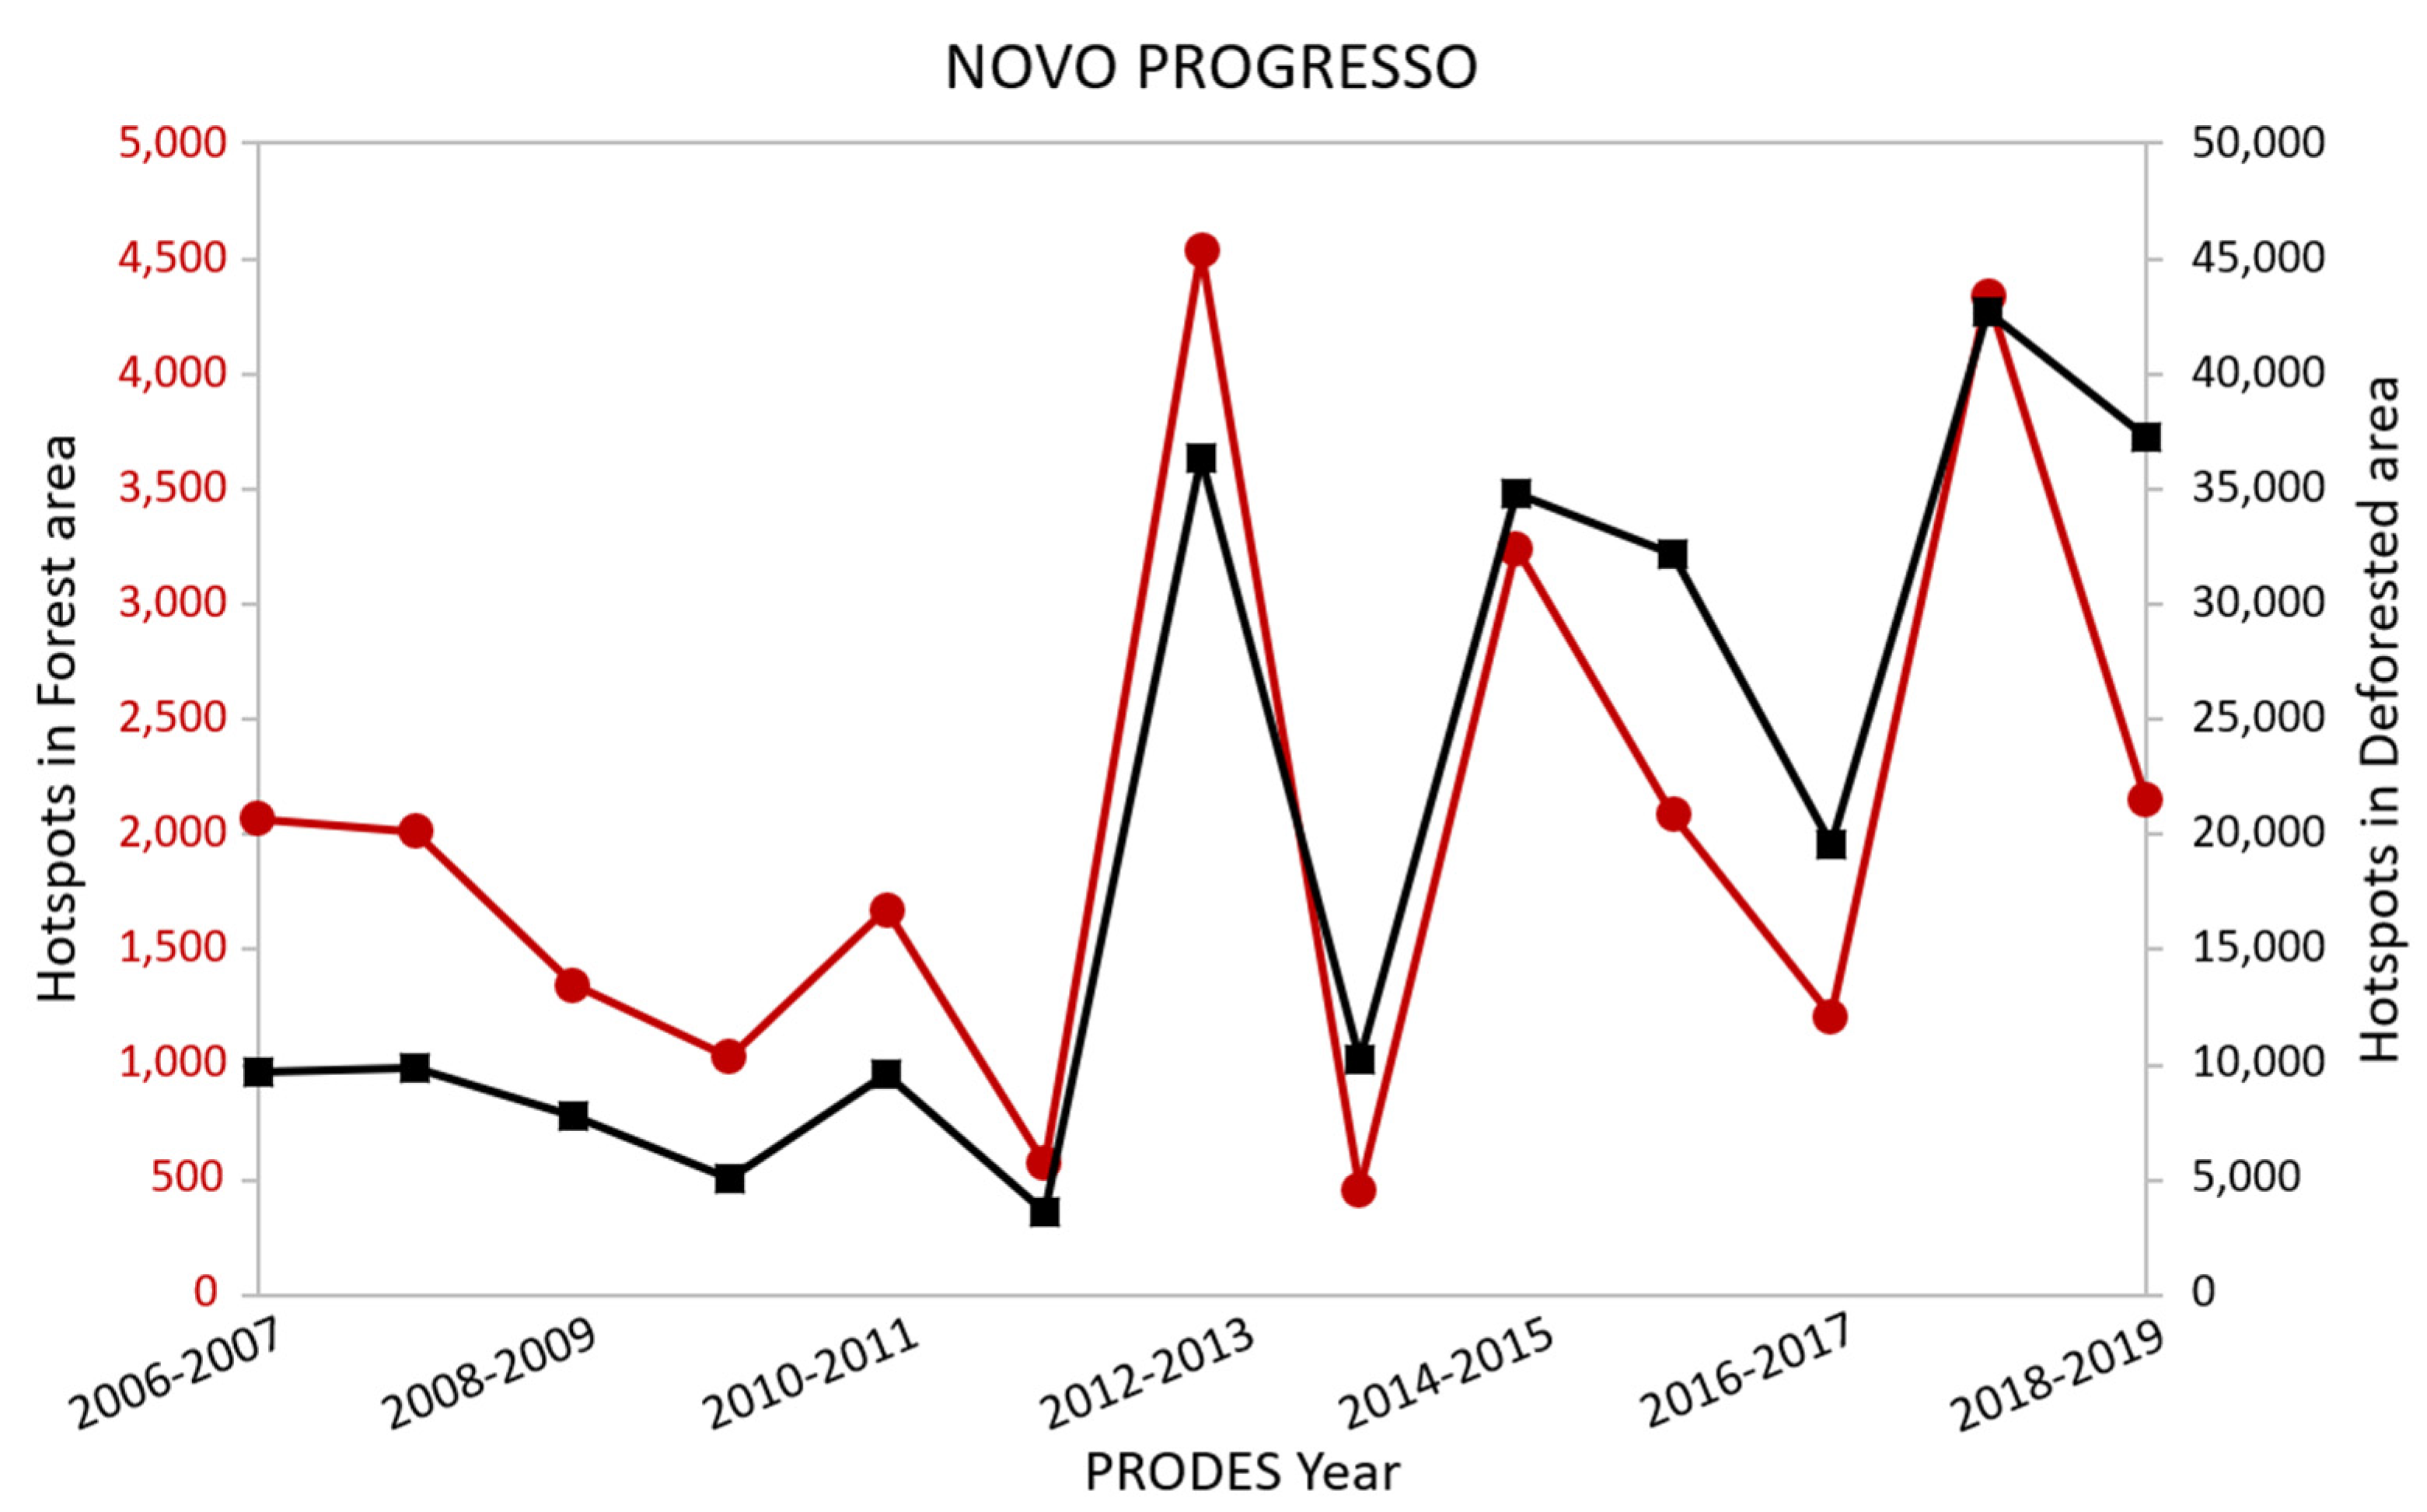
The influence of slash-and-burn practices near to forest degraded areas is evident, as shown by the plots in Figure 11. There is a direct correlation between forest clearing and forest degradation due to the use of fire on newly slashed areas. In that sense, forest clearing is a direct cause of primary forest degradation, as shown in Figure 8. A close look at the plots from PY2017–2018 and PY2018–2019 reveals the intense occurrences of fire in forest areas, which was not observed in previous years, thus indicating the damage of a healthy ecosystem. For the time span of this study, the number of fire occurrences in healthy forest is from 5% to 20% of deforested areas. Then, the degraded area could be estimated, to some extent, based on the size of the pixel that characterizes a hotspot.

3.2. Fire Hotspots and Deforestation in the Pará State

In recent years, Pará State has faced high deforestation rates in the Brazilian Amazon. Table 3 shows the total occurrence of annual fire hotspots, the accumulated deforested areas, and the annual deforested area in this state. A total of 146,863 fire hotspots were detected in PY2006–2007 and 351,001 fire hotspots in PY2018–2019. In PY2006–2007, there was an accumulated deforested area equivalent to 9.35%. From PY2006–2007 to PY2018–2019, the deforested area reached 12.30%, a 2.95% increase in deforestation for the specified period and area of 42,350 km2. Fire occurrences, however, increased at a rate higher than deforestation, which also indicates forest degradation [4,5,6,29,69,70].
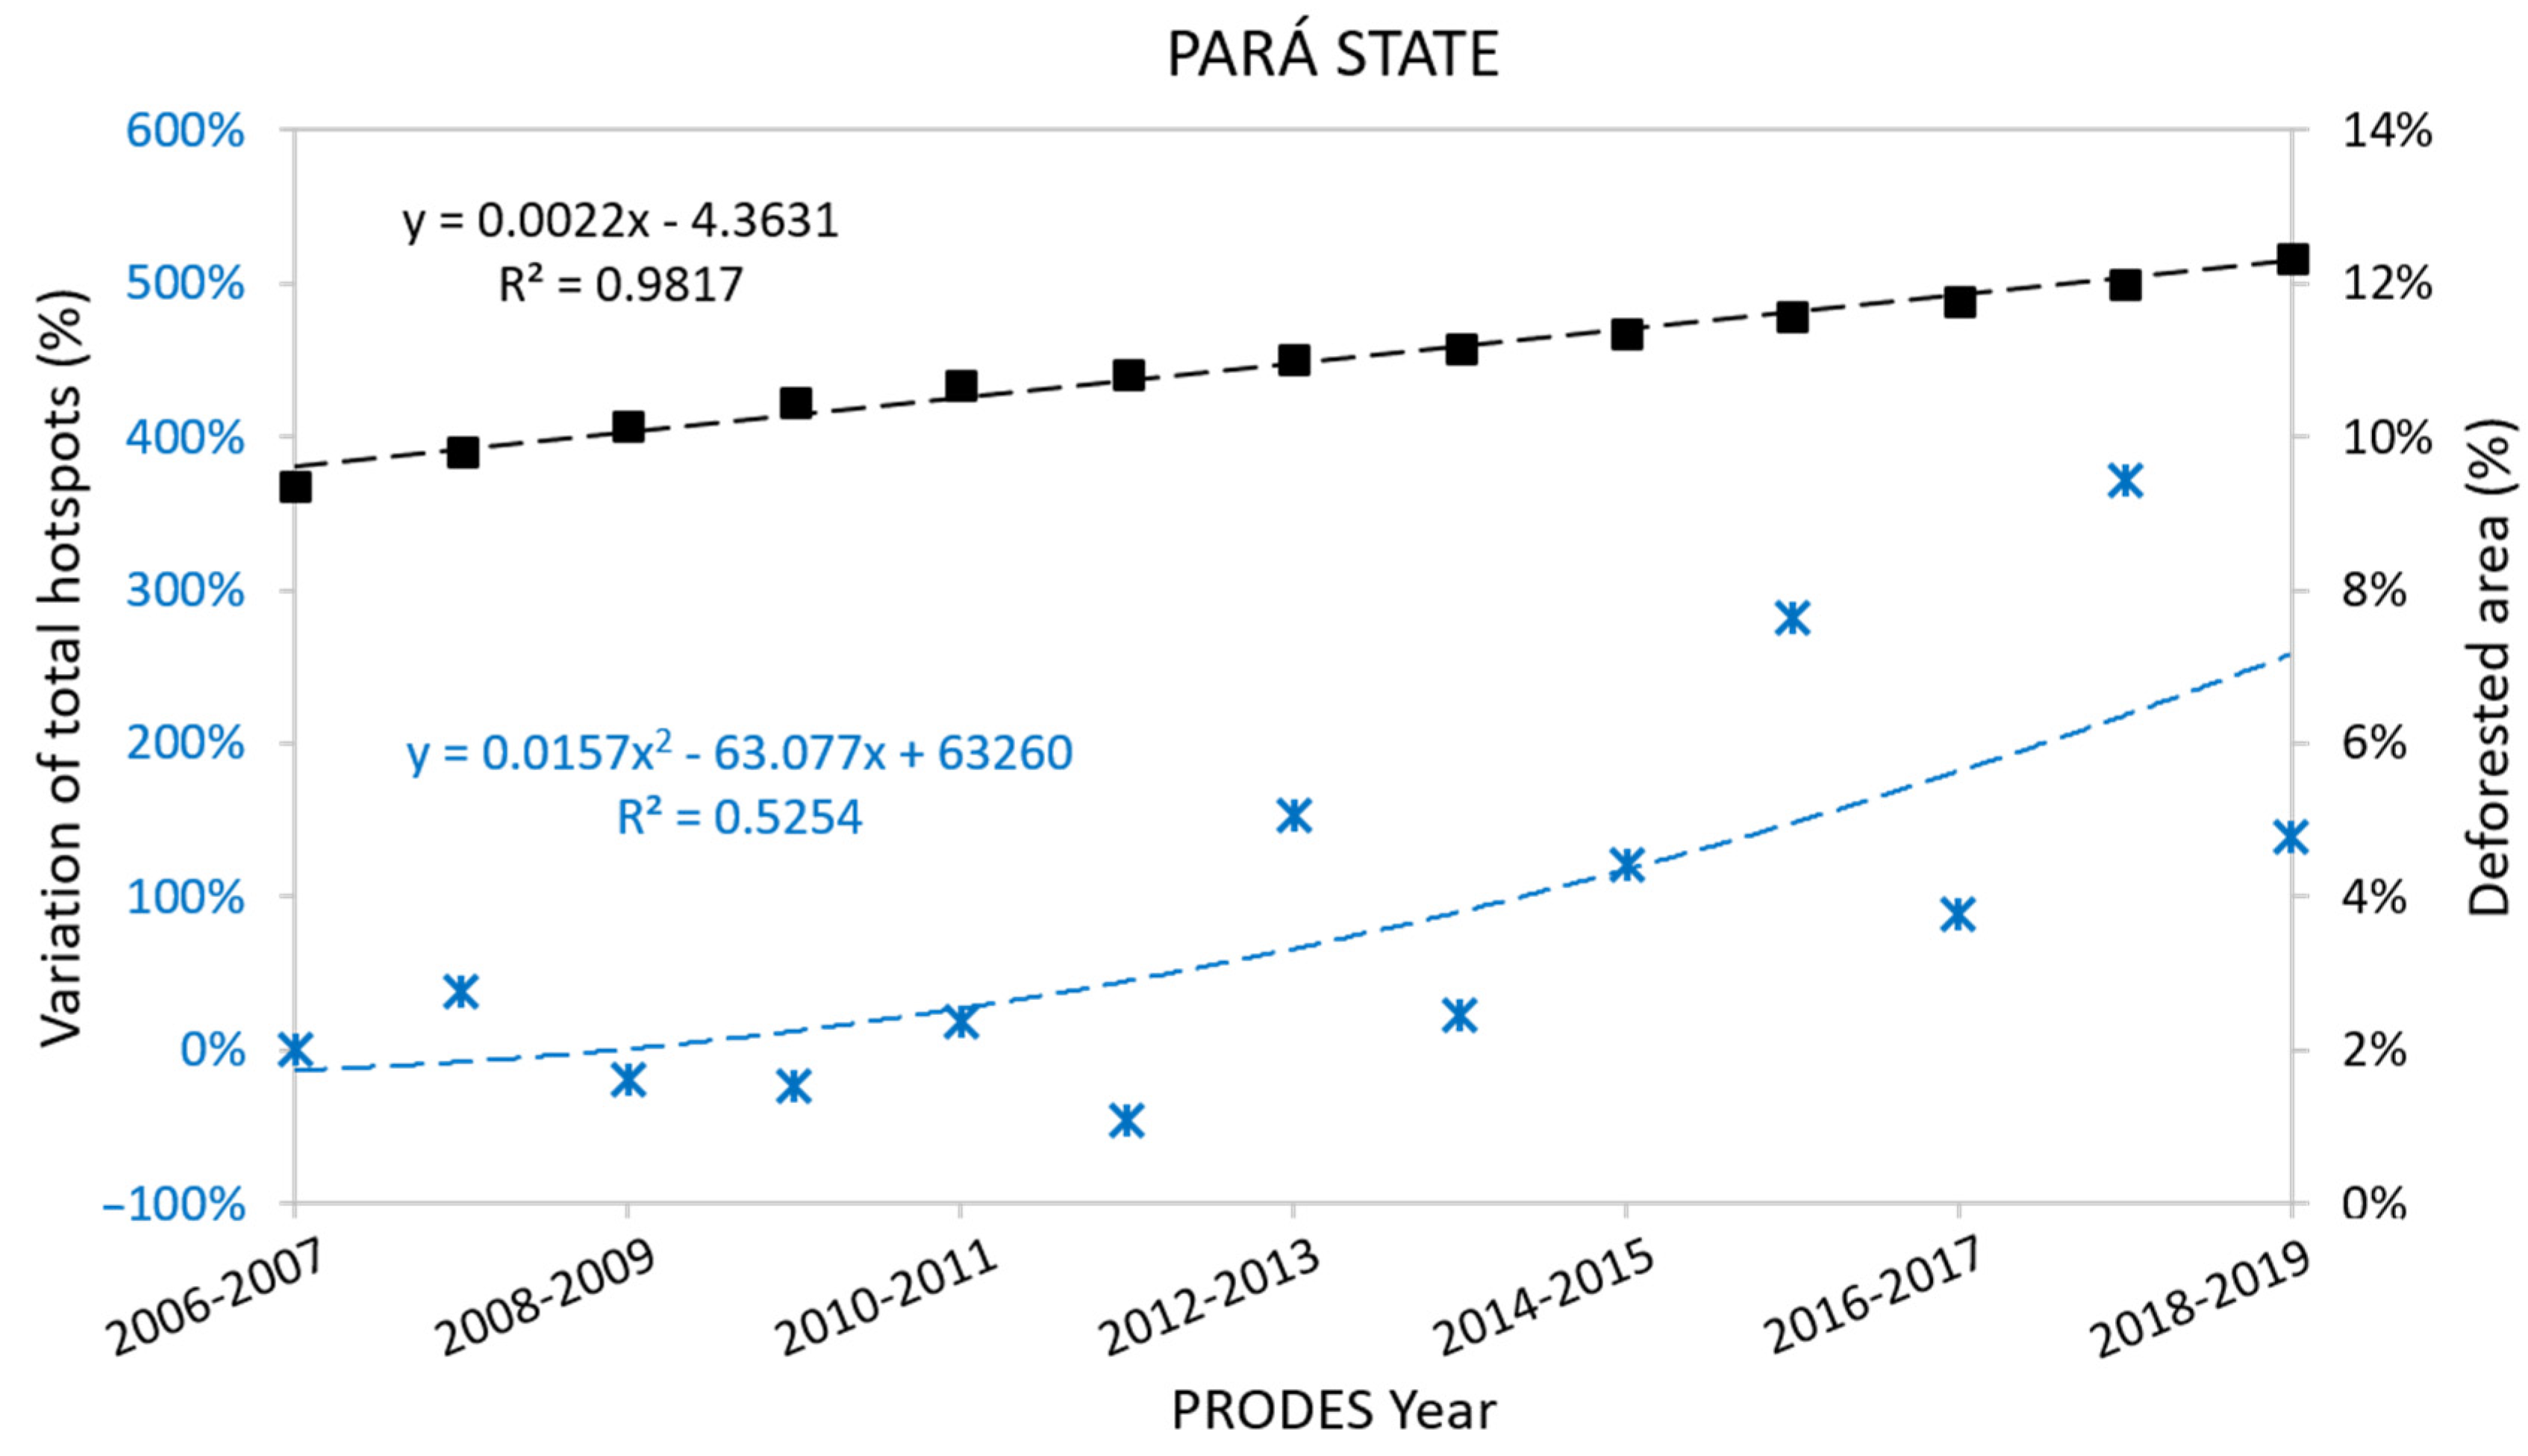
Figure 12 shows the variation of total fire hotspots from PY2007 to PY2019 along with the accumulated deforestation area in the Pará State. There was a positive correlation of 0.66 between total hotspots and deforested areas. It can be observed that the variation of total hotspots was stable from PY2006–2007 to PY2011–2012 and increased from PY2012–2013 to PY2018–2019. Similar trends were observed for the smaller area (Figure 9). There is an expectation that the local and regional deforestation practices also apply for the entire deforestation arch.

3.3. Gas and Particulate Emissions

Total gas and particulate emissions as a function of the burned area were calculated and summarized in Table 4. These data represent the emissions exclusively with the combustion of biomass from slash-and-burn activities. The efficiency of the first fire was about 50%. It did not include small fires that may take place in the degraded standing forest, pasture, or crop remaining over the bare soil. Also, the emissions are solely from the first fire of the newly slashed area. Over the years, after the initial large fire, stockpiled scorched biomass, i.e., the remaining 50%, is subjected to successive burns, ultimately approaching 100% combustion efficiency for that newly deforested area. Total CO2 emissions accounted for the methane that is converted into an equivalent amount of CO2, considering its relative radiative forcing, plus the emissions of the CO2 itself, as shown in Figure 6.
A small region such as Novo Progresso emitted about 8.81 Mton of CO2 over 331 km2 of land approximately for the year PY2018–2019. For comparison, the carbon emission of Abruzzo region (Italy), with 1.30 million inhabitants, was 11.1 Mton for the year 2006 [71]. These data are even more alarming when we consider the emissions after deforestation practices in the Pará State, and the Brazilian Amazon, accounting for 132.1 and 328.7 Mton of CO2 released to the atmosphere respectively, in the PY2018–2019. Other emissions are also of great concern in local and regional scales, notably, particulates of diameter less than 2.5 mm. Local, regional, and total emissions were about 0.027, 0.41, and 0.89 Mton, respectively. The same applies to CO emissions, accounting for 0.55, 8.3, and 20.41 Mton in Novo Progresso, Pará State, and Brazilian Amazon, respectively.
After the year 2000, high deforestation rates were observed in the period of 2002 to 2004, with an average of 24,939 km2. In this time span, the lowest deforestation occurred in 2012, equivalent to 4561 km2 following the voluntary REDD+ project’s starting year [17]. Applying the same emission factors and other relevant data from Table 1, the total CO2 emissions for the period 2002–2004 and in 2012 were 752.3 Mton and 137.6 Mton on average, respectively. The CO2 emissions from 2019 are, therefore, 2.38 times higher than the minimum (2012) and 2.29 times smaller than the maximum (2002–2004). Emissions were estimated based on the deforested area. The results were not corrected for a possible offset from forest regrowth. According to Smith et al. [72], the yearly increase in secondary forest extent in the Brazilian Amazon was about 8.61% ± 10.96%, offsetting GHG emissions from newly slash-and-burned areas by 10.29% ± 6.8%. Taking this scenario into consideration, the net emissions from fires, for the year 2019, was 295 Mton of CO2 for the Brazilian Amazon, which is 16.4% of the whole emissions from Brazil [73], that consumes about 50% of the recently slashed biomass.
In Brazil, the total CO2 emissions related to deforestation practices of newly slashed areas in the Brazilian Amazon are higher than those from transport, electricity and heat, manufacturing, industry, buildings, aviation, and shipping sectors of the Brazilian economy. The emissions from deforestation of the Amazon rainforest in Brazil is next to the agricultural sector.
A rough estimate of burned biomass on wide areas can be carried out using geostationary satellite sensor data starting from the computation of the fire radiative power, which is the power radiated by the fire. By integrating this quantity over time, it is possible to estimate the radiative fire energy and the burned biomass, and then the emissions in the atmosphere if the coefficients providing the burning efficiency of vegetation affected by the fire are available [74]. This will be the subject of a forthcoming paper.

4. Conclusions

This work showed a strong correlation between the occurrence of fire in the newly deforested area in the municipality of Novo Progresso following the local slash-and-burn practices. The same trends were also observed for the Pará State, suggesting a common practice along with the deforestation arch. The study indicated positive correlations of 0.72 and 0.66 between deforestation and fire occurrences in local and regional scales, respectively. The use of fire as a rapid means for forest clearing was evident for the PY2018–2019, which showed a strong overlapping of slash-and-burn activities in a brief period. Many fire occurrences inside the forest in the near recent deforested areas result in ecosystem degradation, turning it more prone to future fire events. The area of old-growth forest, negatively influenced by nearby slash-and-burn practices, is a fraction of the deforested area, thus enlarging forest degradation. The occurrences of hotspots in the healthy forest are from 5% to 20% of newly deforested areas. This is a strong indication of the primary cause of forest degradation due to slash-and-burn practices. The steady increase in deforestation after the PY2011–2012 is a worldwide concern because of the loss of intact forest and the massive greenhouse gases emissions, from the slash-and-burn practices, accounting for about 295 million tons of CO2 for the PY2018–2019 alone.

Author Contributions

Conceptualization, methodology, formal analysis, data curation, writing—original draft preparation, funding acquisition, C.A.S.; writing—review and editing, C.A.S., G.S., E.E.S. and G.L. All authors have read and agreed to the published version of the manuscript.

Funding

C.A. Silva was supported by Conselho Nacional de Desenvolvimento Científico e Tecnológico (CNPq) and the Coordenação de Aperfeiçoamento de Pessoal de Nível Superior (CAPES)—Finance Code 001. E.E. Sano was supported by the Conselho Nacional de Desenvolvimento Científico e Tecnológico (CNPq) (303502/2019-3).

Data Availability Statement

The data presented in this study are available upon request for the corresponding author.

Conflicts of Interest

We declare no conflict of interest.

References

  1. Aragão, L.E.O.C.; Poulter, B.; Barlow, J.B.; Anderson, L.O.; Malhi, Y.; Saatchi, S.; Phillips, O.L.; Gloor, E. Environmental change and the carbon balance of Amazonian forests. Biol. Rev. 2014, 89, 913–931. [Google Scholar] [CrossRef] [PubMed]
  2. FAO. UM-REDD Programme. Available online: http://www.un-redd.org/how-we-work (accessed on 31 August 2020).
  3. Bustamante, M.M.; Roitman, I.; Aide, T.M.; Alencar, A.; Anderson, L.O.; Aragão, L.; Asner, G.P.; Barlow, J.; Berenguer, E.; Chambers, J.; et al. Toward an integrated monitoring framework to assess the effects of tropical forest degradation and recovery on carbon stocks and biodiversity. Glob. Chang. Biol. 2016, 22, 92–109. [Google Scholar] [CrossRef] [PubMed]
  4. Nepstad, D.C.; Veríssimo, A.; Alencar, A.; Nobre, C.; Lima, E.; Lefebvre, P.; Schlesinger, P.; Potter, C.; Moutinho, P.; Mendoza, E.; et al. Large-scale impoverishment of Amazonian forests by logging and fire. Nature 1999, 398, 505–508. [Google Scholar] [CrossRef]
  5. Nepstad, D.; Carvalho, G.; Barros, A.C.; Alencar, A.; Capobianco, J.P.; Bishop, J.; Moutinho, P.; Lefebvre, P.; Silva, U.L., Jr.; Prins, E. Road paving, fire regime feedbacks, and the future of Amazon forests. For. Ecol. Manag. 2001, 154, 395–407. [Google Scholar] [CrossRef]
  6. Cochrane, M.A. Fire science for rainforests. Nature 2003, 421, 913–919. [Google Scholar] [CrossRef] [PubMed]
  7. Bowman, M.S.; Soares-Filho, B.S.; Merry, F.D.; Nepstad, D.C.; Rodrigues, H.; Almeida, O.T. Persistence of cattle ranching in the Brazilian Amazon: A spatial analysis of the rationale for beef production. Land Use Policy 2012, 29, 558–568. [Google Scholar] [CrossRef]
  8. Domingues, M.S.; Bermann, C. O arco de desflorestamento na Amazônia: Da pecuária à soja. Ambient. Soc. 2012, 15, 1–22. [Google Scholar] [CrossRef]
  9. Kastens, J.H.; Brown, J.C.; Coutinho, A.C.; Bishop, C.R.; Esquerdo, J.C.D.M. Soy moratorium impacts on soybean and deforestation dynamics in Mato Grosso, Brazil. PLoS ONE 2017, 12, e0176168. [Google Scholar] [CrossRef]
  10. Yanai, A.M.; Nogueira, E.M.; Graça, P.M.L.A.; Fearnside, P.M. Deforestation and carbon stock loss in Brazil’s Amazonian settlements. Environ. Manag. 2017, 59, 393–409. [Google Scholar] [CrossRef] [Green Version]
  11. Farias, M.H.C.S.; Beltrão, N.E.S.; Cordeiro, Y.E.M.; Santos, C.A. Impact of rural settlements on the deforestation of the Amazon. Mercator 2018, 17, e17009. [Google Scholar] [CrossRef]
  12. Yanai, A.M.; Graça, P.M.L.A.; Escada, M.I.S.; Ziccardi, L.G.; Fearnside, P.M. Deforestation dynamics in Brazil´s Amazonian settlements: Effects of land-tenure concentration. J. Environ. Manag. 2020, 268, 110555. [Google Scholar] [CrossRef] [PubMed]
  13. INPE. Terrabrasilis. Available online: http://terrabrasilis.dpi.inpe.br/en/home-page/ (accessed on 30 August 2020).
  14. Azevedo-Ramos, C.; Moutinho, P. No man’s land in the Brazilian Amazon: Could undesignated public forests slow Amazon deforestation? Land Use Policy 2018, 73, 125–127. [Google Scholar] [CrossRef]
  15. Souza, C.M., Jr.; Shimbo, J.Z.; Rosa, M.R.; Parente, L.L.; Alencar, A.A.; Rudorff, B.F.T.; Hasenack, H.; Matsumoto, M.; Ferreira, L.G.; Souza-Filho, P.W.M.; et al. Reconstructing three decades of land use and land cover changes in Brazilian biomes with Landsat archive and Earth Engine. Remote Sens. 2020, 12, 2735. [Google Scholar] [CrossRef]
  16. Soares-Filho, B.S.; Nepstad, D.C.; Curran, L.M.; Cerqueira, G.C.; Garcia, R.A.; Ramos, C.A.; Voll, E.; McDonald, A.; Lefebvre, P.; Schlesinger, P. Modelling conservation in the Amazon basin. Nature 2006, 440, 520–523. [Google Scholar] [CrossRef]
  17. West, T.A.; Börner, J.; Sills, E.O.; Kontoleon, A. Overstated carbon emission reductions from voluntary REDD+ projects in the Brazilian Amazon. Proc. Natl. Acad. Sci. USA 2020, 117, 24188–24194. [Google Scholar] [CrossRef]
  18. United Nations Climate Change. Copenhagen Climate Change Conference. Available online: https://unfccc.int/process-and-meetings/conferences/past-conferences/copenhagen-climate-change-conference-december-2009/copenhagen-climate-change-conference-december-2009 (accessed on 19 November 2020).
  19. Law No. 12.727, 17 October 2012. Available online: http://www.planalto.gov.br/ccivil_03/_ato2011-2014/2012/lei/l12727.htm (accessed on 19 November 2020).
  20. Sorrensen, C.L. Linking small holder land use and fire activity: Examining biomass burning in the Brazilian Lower Amazon. For. Ecol. Manag. 2000, 128, 11–25. [Google Scholar] [CrossRef]
  21. Asner, G.P.; Knapp, D.E.; Broadbent, E.N.; Oliveira, P.J.C.; Keller, M.; Silva, J.N. Selective logging in the Brazilian Amazon. Sci. 2005, 310, 480–482. [Google Scholar] [CrossRef]
  22. Broadbent, E.N.; Asner, G.P.; Keller, M.; Knapp, D.E.; Oliveira, P.J.C.; Silva, J.N. Forest fragmentation and edge effects from deforestation and selective logging in the Brazilian Amazon. Biol. Conserv. 2008, 141, 1745–1757. [Google Scholar] [CrossRef]
  23. Barber, C.P.; Cochrane, M.A.; Souza, C.M., Jr.; Laurance, W.F. Roads, deforestation, and the mitigating effect of protected areas in the Amazon. Biol. Conserv. 2014, 177, 203–209. [Google Scholar] [CrossRef]
  24. Alencar, A.; Nepstad, D.; Diaz, M.C.V. Forest understory fire in the Brazilian Amazon in ENSO and non-ENSO years: Area burned and committed carbon emissions. Earth Interact. 2006, 10, 1–17. [Google Scholar] [CrossRef]
  25. Matricardi, E.A.T.; Skole, D.; Pedlowski, M.A.; Chomentowski, W.; Fernandes, L.C. Assessment of tropical forest degradation by selective logging and fire using Landsat imagery. Remote Sens. Environ. 2010, 114, 1117–1129. [Google Scholar] [CrossRef]
  26. Barni, P.E.; Pereira, V.B.; Manzi, A.O.; Barbosa, E.I. Deforestation and forest fires in Roraima and their relationship with phytoclimatic regions in the northern Brazilian Amazon. Environ. Manag. 2015, 55, 1124–1138. [Google Scholar] [CrossRef] [PubMed]
  27. Pinheiro, T.F.; Escada, M.I.S.; Valeriano, D.M.; Hostert, P.; Gollnow, F.; Müller, H. Forest degradation associated with logging frontier expansion in the Amazon: The BR-163 region in southwestern Pará, Brazil. Earth Interact. 2016, 20, 1–26. [Google Scholar] [CrossRef]
  28. Arima, E.Y.; Walker, R.T.; Perz, S.G.; Caldas, M. Loggers and forest fragmentation: Behavioral models of road building in the Amazon basin. Ann. Am. Assoc. Geogr. 2005, 95, 525–541. [Google Scholar] [CrossRef]
  29. Souza, G.M.; Escada, M.I.S.; Capanema, V.P. Cicatrizes de queimadas e padrões de mudanças de uso e cobertura da terra no sudoeste do estado do Pará, Brasil. In Proceedings of the XVIII Simpósio Brasileiro de Sensoriamento Remoto (SBSR), Santos, Brazil, 28–31 May 2017; pp. 5760–5767. [Google Scholar]
  30. Butt, N.; Oliveira, P.A.; Costa, M.H. Evidence that deforestation affects the onset of the rainy season in Rondônia, Brazil. J. Geophys. Res. 2011, 116, 2–9. [Google Scholar] [CrossRef]
  31. Knox, R.; Bisht, G.; Wang, J.; Bras, R.L. Precipitation variability over the forest-to-nonforest transition in Southwestern Amazonia. J. Clim. 2011, 24, 2368–2377. [Google Scholar] [CrossRef] [Green Version]
  32. Davidson, E.A.; Araújo, A.C.; Artaxo, P.; Balch, J.K.; Brown, I.F.; Bustamante, M.M.C.; Coe, M.T.; DeFRIES, R.S.; Keller, M.; Longo, M.; et al. The Amazon basin in transition. Nature 2012, 481, 321–328. [Google Scholar] [CrossRef]
  33. Jiménez-Muñoz, J.C.; Mattar, C.; Barichivich, J.; Santamaría-Artigas, A.; Takahashi, K.; Malhi, Y.; Sobrino, A.J.; Van Der Schrier, G. Record-breaking warming and extreme drought in the Amazon rainforest during the course of El Niño 2015–2016. Sci. Rep. 2016, 6, 33130. [Google Scholar] [CrossRef] [Green Version]
  34. Zemp, D.C.; Schleussner, C.F.; Barbosa, H.; Rammig, A. Deforestation effects on Amazon forest resilience. Geophys. Res. Lett. 2017, 44, 6182–6190. [Google Scholar] [CrossRef] [Green Version]
  35. Aragão, L.E.; Anderson, L.O.; Fonseca, M.G.; Rosan, T.M.; Vedovato, L.B.; Wagner, F.H.; Silva, C.V.J.; Junior, C.H.S.; Arai, E.; Aguiar, A.P.; et al. 21st Century drought-related fires counteract the decline of Amazon deforestation carbon emissions. Nat. Commun. 2018, 9, 536. [Google Scholar] [CrossRef]
  36. Fearnside, P.M.; Graça, P.M.L.D.A.; Keizer, E.W.H.; Maldonado, F.D.; Barbosa, R.I.; Nogueira, E.M. Modelagem de desmatamento e emissões de gases de efeito estufa na região sob influência da rodovia Manaus-Porto Velho (BR-319). Rev. Bras. Meteorol. 2009, 24, 208–233. [Google Scholar] [CrossRef] [Green Version]
  37. Aragão, L.E.O.C.; Shimabukuro, Y.E. The incidence of fire in Amazonian forests with implications for REDD. Science 2010, 328, 1275–1278. [Google Scholar] [CrossRef] [PubMed]
  38. Hosonuma, N.; Herold, M.; Sy, V.; de Fries, R.S.; Brockhaus, M.; Verchot, L.; Angelsen, A.; Romijn, E. An assessment of deforestation and forest degradation drivers in developing countries. Environ. Res. Lett. 2012, 7, 044009. [Google Scholar] [CrossRef]
  39. Spracklen, D.V.; Garcia-Carreras, L. The impact of Amazonian deforestation on Amazon basin rainfall. Geophys. Res. Lett. 2015, 42, 9546–9552. [Google Scholar] [CrossRef] [Green Version]
  40. Jusys, T. Fundamental causes and spatial heterogeneity of deforestation in Legal Amazon. Appl. Geogr. 2016, 75, 188–199. [Google Scholar] [CrossRef]
  41. Ruiz-Vásquez, M.; Arias, P.A.; Martínez, J.A.; Espinoza, J.C. Effects of Amazon basin deforestation on regional atmospheric circulation and water vapor transport towards tropical South America. Clim. Dyn. 2020, 54, 4169–4189. [Google Scholar] [CrossRef]
  42. Krieger-Filho, G.C.; Bufacchi, P.; Santos, J.C.; Veras, C.A.G.; Alvarado, E.C.; Mell, W.; Carvalho, J.A., Jr. Probability of surface fire spread in Brazilian rainforest fuels from outdoor experimental measurements. Eur. J. Forest Res. 2017, 136, 217–232. [Google Scholar] [CrossRef] [Green Version]
  43. Carvalho, J.A., Jr.; Veras, C.A.G.; Alvarado, E.C.; Sandberg, D.V.; Leite, S.J.; Gielow, R.; Rabelo, E.R.C.; Santos, J.C. Understory fire propagation and tree mortality on adjacent areas to an Amazonian deforestation fire. Int. J. Wildland Fire 2010, 19, 795–799. [Google Scholar] [CrossRef]
  44. Silva Júnior, C.H.L.; Aragão, L.E.O.; Fonseca, M.G.; Almeida, C.T.; Vedovato, L.B.; Anderson, L.O. Deforestation-induced fragmentation increases forest fire occurrence in central Brazilian Amazonia. Forests 2018, 9, 305. [Google Scholar] [CrossRef] [Green Version]
  45. Carvalho, J.A., Jr.; Higuchi, N.; Araújo, T.M.; Santos, J.C. Combustion completeness in a rainforest clearing experiment in Manaus, Brazil. J. Geophys. Res. 1998, 103, 13195–13199. [Google Scholar] [CrossRef] [Green Version]
  46. Carvalho, J.A., Jr.; Costa, F.S.; Veras, C.A.G.; Sandberg, D.V.; Alvarado, E.C.; Gielow, R.; Serra, A.M.; Santos, J.C. Biomass fire consumption and carbon release rates of rainforest-clearing experiments conducted in northern Mato Grosso, Brazil. J. Geophys. Res. 2001, 106, 17877–17887. [Google Scholar] [CrossRef] [Green Version]
  47. Carvalho, E.R.; Veras, C.A.G.; Carvalho, J.A., Jr. Experimental investigation of smouldering in biomass. Biomass Bioenerg. 2002, 22, 283–294. [Google Scholar] [CrossRef]
  48. Rabelo, E.R.C.; Veras, C.A.G.; Carvalho, J.A., Jr.; Alvarado, E.C.; Sandberg, D.V.; Santos, J.C. Log smoldering after an Amazonian deforestation fire. Atmos. Environ. 2004, 38, 203–211. [Google Scholar] [CrossRef]
  49. Christian, T.J.; Yokelson, R.J.; Carvalho, J.A., Jr.; Griffith, D.W.T.; Alvarado, E.C.; Santos, J.C.; Soares Neto, T.G.; Veras, C.A.G.; Hao, W.M. The tropical forest and fire emissions experiment: Trace gases emitted by smoldering logs and dung from deforestation and pasture fires in Brazil. J. Geophys. Res. Atmos. 2007, 112, 2156–2202. [Google Scholar] [CrossRef] [Green Version]
  50. Amaral, C.S.S., Jr.; Amaral, S.S.; Costa, M.A.M.; Soares Neto, T.G.; Veras, C.A.G.; Costa, F.S.; van Leeuwen, T.T.; Krieger Filho, G.C.; Tourigny, E.; Forti, M.C.; et al. CO2 and CO emission rates from three forest fire controlled experiments in Western Amazonia. Atmos. Environ. 2016, 135, 73–83. [Google Scholar] [CrossRef]
  51. Van Marle, M.J.E.; Field, R.D.; van der Werf, G.R.; Wagt, I.A.E.; Houghton, R.A.; Rizzo, L.V.; Artaxo, P.; Tsigaridis, K. Fire and deforestation dynamics in Amazonia (1973–2014). Glob. Biogeochem. Cycles 2017, 31, 24–38. [Google Scholar] [CrossRef] [Green Version]
  52. Soares Neto, T.G.; Carvalho, J.A., Jr.; Veras, C.A.G.; Alvarado, E.C.; Gielow, R.; Lincoln, E.N.; Cristian, T.J.; Yokelson, R.J.; Santos, J.C. Biomass consumption, CO2, CO and main hydrocarbon gas emissions in an Amazonian forest clearing fire. Atmos. Environ. 2009, 43, 438–446. [Google Scholar] [CrossRef]
  53. Lima, A.; Silva, T.S.F.; de Feitas, R.M.; Adami, M.; Formaggio, A.R.; Shimabukuro, Y.E. Land use and land cover changes determine the spatial relationship between fire and deforestation in the Brazilian Amazon. Appl. Geogr. 2012, 34, 239–246. [Google Scholar] [CrossRef]
  54. Crowson, M.; Ron, H.; Björn, W. Mapping land cover change in northern Brazil with limited training data. Int. J. Appl. Earth Obs. Geoinf. 2019, 78, 202–214. [Google Scholar] [CrossRef]
  55. Jakimow, B.; Griffiths, P.; van der Linden, S.; Hostert, P. Mapping pasture management in the Brazilian Amazon from dense Landsat time series. Remote Sens. Environ. 2018, 205, 453–468. [Google Scholar] [CrossRef]
  56. Müller, H.; Griffiths, P.; Hostert, P. Long-term deforestation dynamics in the Brazilian Amazon—Uncovering historic frontier development along the Cuiabá–Santarém highway. Int. J. Appl. Earth Obs. Geoinf. 2016, 44, 61–69. [Google Scholar] [CrossRef]
  57. ESA. EO Browser. Available online: https://apps.sentinel-hub.com/eo-browser/ (accessed on 20 November 2020).
  58. Assis, L.F.F.G.; Ferreira, K.R.; Vinhas, L.; Maurano, L.; Almeida, C.; Carvalho, A.; Rodrigues, J.; Maciel, A.; Camargo, C. TerraBrasilis: A spatial data analytics infrastructure for large-scale thematic mapping. ISPRS Int. J. GeoInf. 2019, 8, 513. [Google Scholar] [CrossRef] [Green Version]
  59. INPE. Monitoramento de Queimadas e Incêndios por Satélite em Tempo Quase-Real. Available online: http://queimadas.dgi.inpe.br/queimadas/portal (accessed on 31 August 2020).
  60. Giglio, L.; Descloitres, J.; Justice, C.O.; Kaufman, Y.J. An enhanced contextual fire detection algorithm for MODIS. Remote Sens. Environ. 2003, 87, 273–282. [Google Scholar] [CrossRef]
  61. Giglio, L.; Schroeder, W.; Justice, C.O. The collection 6 MODIS active fire detection algorithm and fire products. Remote Sens. Environ. 2016, 178, 31–41. [Google Scholar] [CrossRef] [PubMed] [Green Version]
  62. Di Biase, V.; Laneve, G. Geostationary sensor based forest fire detection and monitoring: An improved version of the SFIDE algorithm. Remote Sens. 2018, 10, 741. [Google Scholar] [CrossRef] [Green Version]
  63. Kaufman, Y.J.; Justice, C.O.; Flynn, L.P.; Kendall, J.D.; Prins, E.M.; Giglio, L.; Ward, D.E.; Menzel, W.P.; Setzer, A.W. Potential global fire monitoring from EOS-MODIS. J. Geophys. Res. Atmos. 1998, 103, 32215–32238. [Google Scholar] [CrossRef]
  64. Justice, C.O.; Giglio, L.; Korontzi, S.; Owens, J.; Morisette, J.T.; Roy, D.; Descloitres, J.; Alleaume, S.; Petitcolin, F.; Kaufman, Y. The MODIS fire products. Remote Sens. Environ. 2002, 83, 244–262. [Google Scholar] [CrossRef]
  65. Hantson, S.; Padilla, M.; Corti, D.; Chuvieco, E. Strengths and weaknesses of MODIS hotspots to characterize global fire occurrence. Remote Sens. Environ. 2013, 131, 152–159. [Google Scholar] [CrossRef]
  66. Silva, C.A.; Santilli, G.; Sano, E.E.; Rodrigues, S.W.P. Análise qualitativa do desmatamento na Floresta Amazônica a partir de sensores SAR, óptico e termal. Anu. Inst. Geociênc. 2019, 42, 18–29. [Google Scholar] [CrossRef]
  67. Santana, N.C.; Carvalho Júnior, O.A.; Gomes, R.A.T.; Guimarães, R.F. Burned-area detection in Amazonian environments using standardized time series per pixel in MODIS data. Remote Sens. 2018, 10, 1904. [Google Scholar] [CrossRef] [Green Version]
  68. Soares-Filho, B.; Rajão, R.; Macedo, M.; Carneiro, A.; Costa, W.; Coe, M.; Rodrigues, H.; Alencar, A. Cracking Brazil’s forest code. Science 2014, 344, 363–364. [Google Scholar] [CrossRef] [PubMed]
  69. Silva, S.S.; Fearnside, P.M.; Graça, P.M.L.A.; Brown, I.F.; Alencar, A.; Melo, A.W.F. Dynamics of forest fires in the southwestern Amazon. For. Ecol. Manag. 2018, 424, 312–322. [Google Scholar] [CrossRef]
  70. Matricardi, E.A.T.; Skole, D.L.; Costa, O.B.; Pedlowski, M.A.; Samek, J.H.; Miguel, E.P. Long-term forest degradation surpasses deforestation in the Brazilian Amazon. Science 2020, 369, 1378–1382. [Google Scholar] [CrossRef] [PubMed]
  71. Pulselli, R.M.; Romano, P.; Marchi, M.; Bastianoni, S. Carbon emission intensity and areal empower density: Combining two systemic indicators to inform the design and planning of sustainable energy landscapes. Chapter 19. In Sustainable Energy Landscapes: Designing, Planning, and Development; Stremke, S., van den Dobbelsteen, A., Eds.; CRC Press: Boca Raton, FL, USA, 2013; pp. 385–406. [Google Scholar]
  72. Smith, C.C.; Espírito-Santo, F.D.B.; Healey, J.R.; Young, P.J.; Lennox, G.D.; Ferreira, J.; Barlow, J. Secondary forests offset less than 10% of deforestation-mediated carbon emissions in the Brazilian Amazon. Glob. Chang. Biol. 2020, 26, 7006–7020. [Google Scholar] [CrossRef] [PubMed]
  73. SEEG—Sistema de Estimativa de Emissão de Gases do Efeito Estufa. Available online: http://seeg.eco.br (accessed on 4 January 2021).
  74. Laneve, G.; Cadau, E.G.; Santilli, G. Estimation of the burned biomass based on the quasi-continuous MSG/SEVIRI Earth observation system. In Proceedings of the IEEE International Geoscience and Remote Sensing Symposium (IGARSS 2009), Cape Town, South Africa, 12–19 July 2009. [Google Scholar]
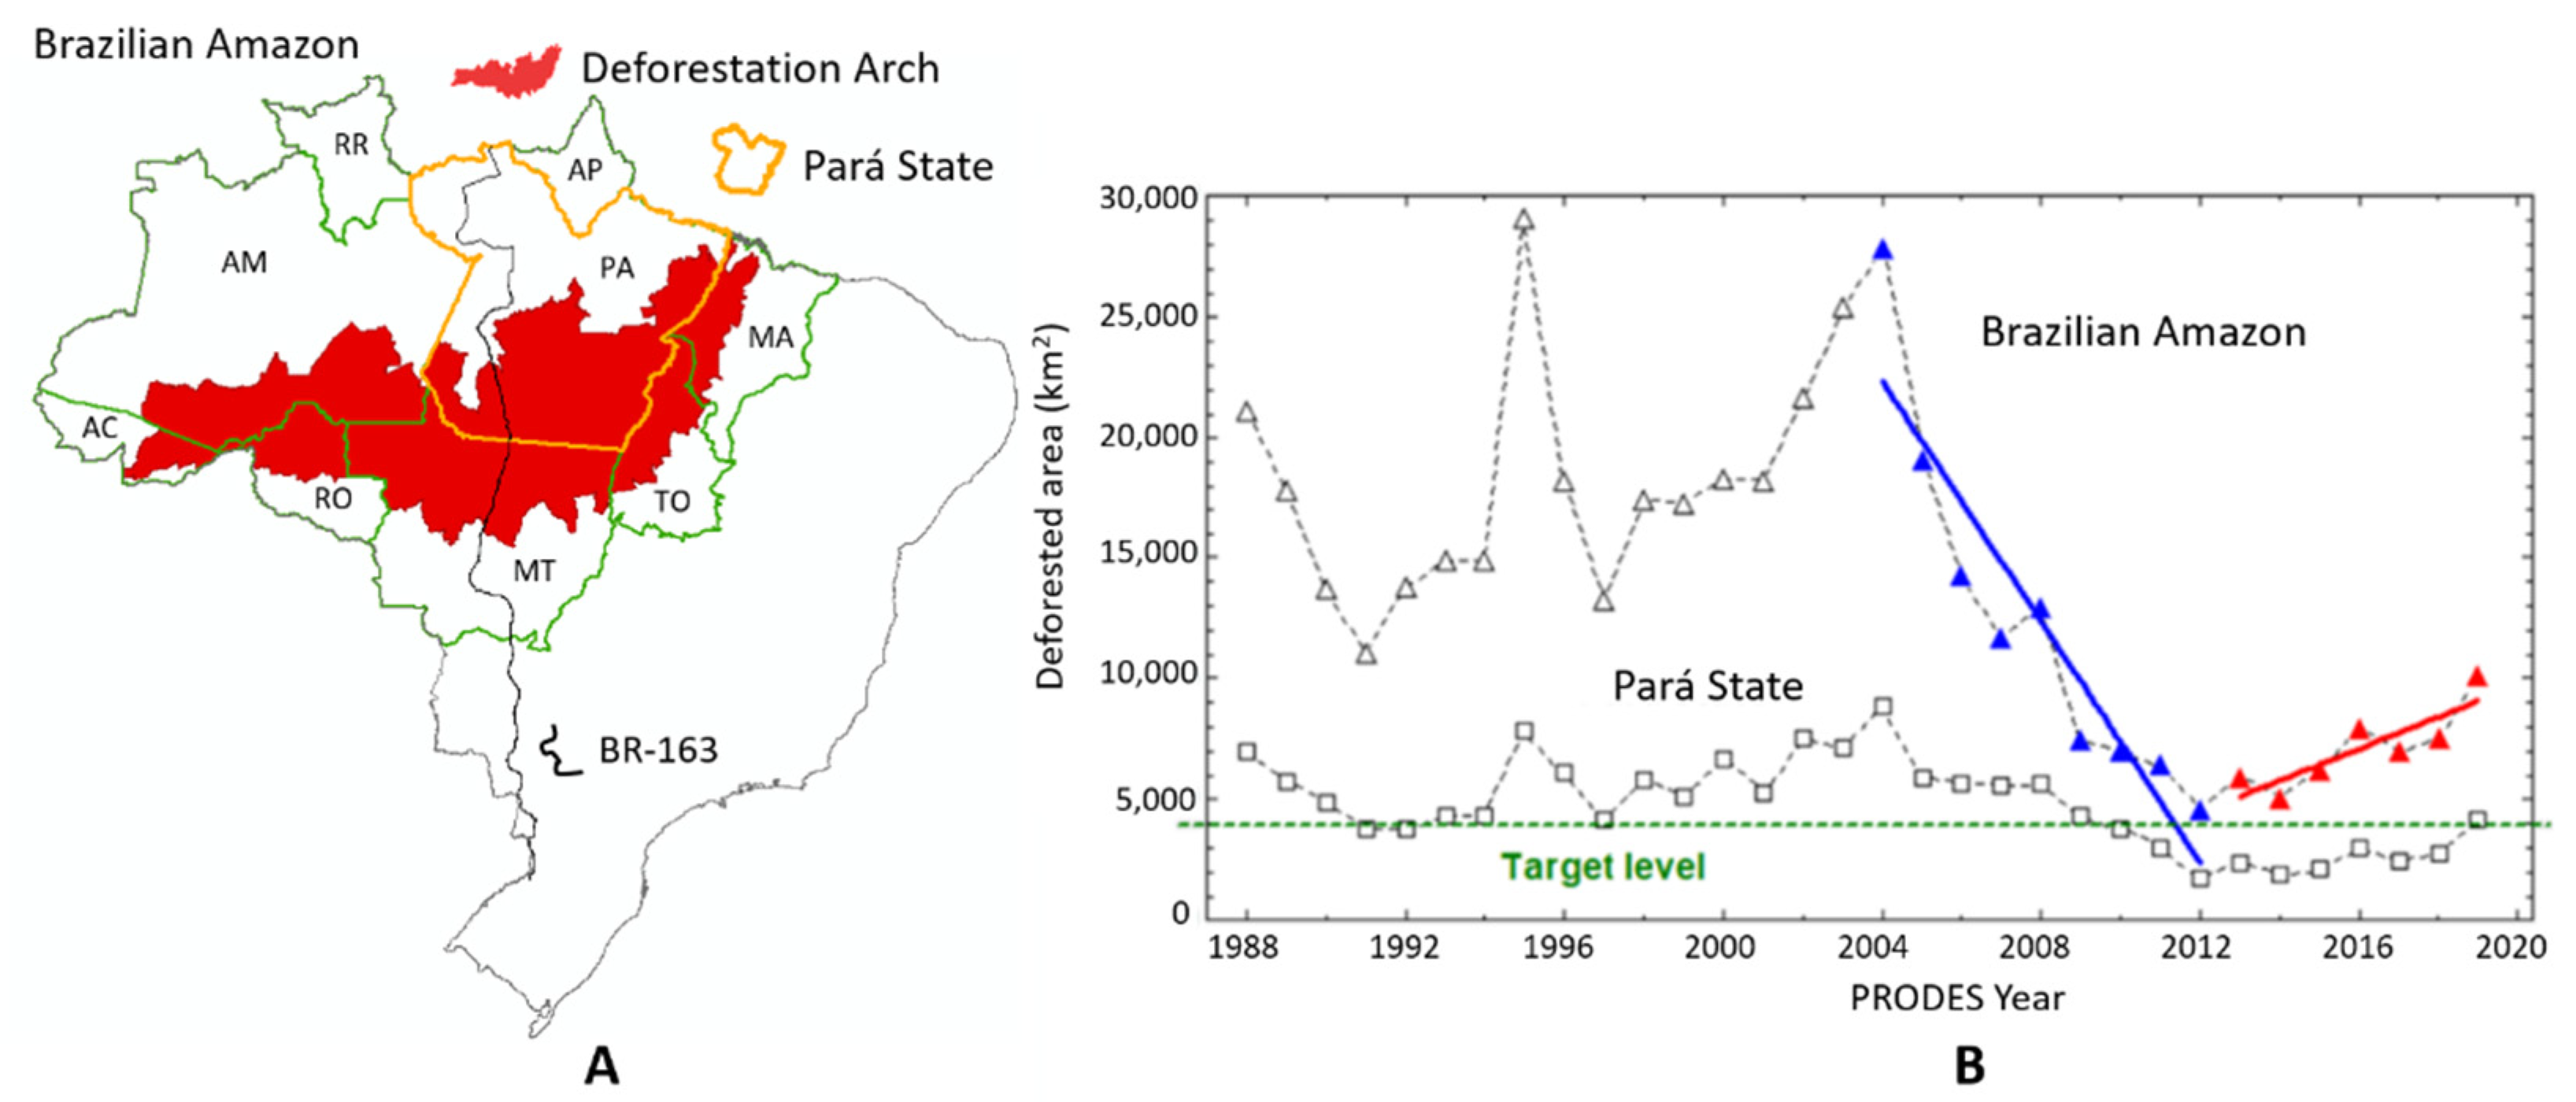
Figure 1. (A) Location of the deforestation arch in the Brazilian Amazon. (B) Annual deforestation area in the Brazilian Amazon (triangle) and in the Pará State (square), according to the Monitoring Deforestation of the Brazilian Amazon Forest by Satellite (PRODES) project, coordinated by the National Institute for Space Research (INPE). State identification: AC = Acre; AM = Amazonas; AP = Amapá; MA = Maranhão; MT = Mato Grosso; PA = Pará; RO = Rondônia; RR = Roraima; TO = Tocantins.
Remotesensing 13 00376 g001
Figure 2. Relationship between land use and land cover changes and fire occurrences. Sources: References [5,6].
Remotesensing 13 00376 g002
Figure 3. Main stages of the clear-cut processes of forest clearing in the Brazilian Amazon. (A) Clear-cut during the wet season or end of the wet season, (B) trunks and branches left in the terrain for drying, (C) burning activity during the dry season, and (D) bare soil prepared for pasture or crop plantation (Photos: E. Sano).
Remotesensing 13 00376 g003
Figure 4. Location of the Novo Progresso region, southwest of the Pará State. Red-Green-Blue (RGB) false-color composite of bands 5, 4, and 3 of Landsat 8 satellite images [57].
Remotesensing 13 00376 g004
Figure 5. Examples of deforested areas (yellow and striped polygons), forest (green and white areas), fire hotspots in the forest areas (red dots), fire hotspots in the deforested areas (blue dots), and deforestation dynamics example (dotted square) in the Novo Progresso region.
Remotesensing 13 00376 g005
Figure 6. Procedure of the estimation of the greenhouse gas (GHG) emission. HU = humidity; DB = dry biomass, TE = total emission.
Remotesensing 13 00376 g006
Figure 7. Variation of the total fire hotspots (red) relative to the year PY2006–2007 and accumulated deforestation area (black) in the Novo Progresso region.
Remotesensing 13 00376 g007
Figure 8. Deforestation dynamics from PY2011–2012 to PY2018–2019 in a portion of the Novo Progresso region. The figure, from upper-left to low-right, shows the yearly evolution of hotspots related to deforestation in deforested (blue dots) and forested (red dots) areas.
Remotesensing 13 00376 g008
Figure 9. Temporal analysis of fire hotspots occurrence in the deforested areas (green) and the relative increase of deforestation (black) in the Novo Progresso region.
Remotesensing 13 00376 g009
Figure 10. Number of fire hotspots in the forest area, for the PY2018–2019, identified according to their distance from the borders of the deforested areas in the Novo Progresso region.
Remotesensing 13 00376 g010
Figure 11. Fire hotspots inside the forest and in deforested area over time for the Novo Progresso region.
Remotesensing 13 00376 g011
Figure 12. Variation of the total fire hotspots (blue) relative to the year PY2006–2007 and accumulated deforestation area (black) in the Pará State.
Remotesensing 13 00376 g012
Table 1. Basic data for gas emissions estimate. Source: References [50,52].
ParameterReference ValueReference Area
Fresh biomass (ton ha−1)512Novo Progresso
Fresh biomass (ton ha−1)570Pará State
Fresh biomass (ton ha−1)580Brazilian Amazon
Emission factor CH4 (kg ton−1 (db)) *9.2Brazilian Amazon
Emission factor CO (kg ton−1 (db))111.3Brazilian Amazon
Emission factor CO2 (kg ton−1 (db))1599Brazilian Amazon
Emission factor NMHC (kg ton−1 (db))5.57Brazilian Amazon
Emission factor PM2.5 (kg ton−1 (db))4.84Brazilian Amazon
Fresh biomass humidity (%)42Brazilian Amazon
Combustion efficiency (%)50Brazilian Amazon
* db refers to mass of dry biomass burned. NMHC = non-methane hydrocarbon; PM = particulate matter.
Table 2. Total annual fire hotspots distribution in the Novo Progresso region. Deforested and forest areas and fire hotspots are reported from PY2006–2007 until PY2018–2019 in the Novo Progresso region. PY = PRODES year.
PYForest Area (km2)Accumulated Deforested Area (km2)Annual Deforested Area (km2)Fire Hotspots in ForestFire Hotspots in Deforested Area
2006–200731,574.55230.9 20679702
2007–200831,153.65651.9421.020129870
2008–200930,543.96261.5609.613457753
2009–201030,406.76398.7137.210355060
2010–201130,281.56524.0125.316759573
2011–201230,096.56708.9184.95723621
2012–201329,704.17101.3392.4453636,350
2013–201429,437.97367.6266.345710,186
2014–201529,200.67604.8237.3324334,817
2015–201629,021.97783.5178.7208532,196
2016–201728,938.47867.183.6121219,572
2017–201828,655.28150.3283.2433842,723
2018–201928,323.78481.8331.5214837,236
Table 3. Distribution of the total annual fire hotspots, accumulated deforested area (%), and annual deforested area (km2) in the Pará State, analyzed from July 2007 to December 2019.
PYTotal Annual
Fire Hotspots
Accumulated
Deforested Area (%)
Annual Deforested
Area (km2)
2006–2007146,8639.355526
2007–2008202,9229.805607
2008–2009119,23410.144281
2009–2010113,17410.443770
2010–2011174,39410.693008
2011–201280,40110.831741
2012–2013372,39111.012346
2013–2014181,45811.171887
2014–2015324,02411.342153
2015–2016560,59111.582992
2016–2017276,28311.772433
2017–2018692,49811.992744
2018–2019351,00112.303862
Source: Fire hotspots from the Forest Fire Program and deforestation from the Monitoring Deforestation of the Brazilian Amazon Forest by Satellite (PRODES) project produced by the National Institute for Space Research (INPE).
Table 4. Gas emission estimates as for PY2019 slash-and-burn activities in the Brazilian Amazon.
Parameter (Units)Novo Progresso RegionPará StateBrazilian Amazon
Deforested area (ha)33.15 × 103446.30 × 1031.09 × 106
Fresh biomass (Mton ha−1)5.12 × 10−45.70 × 10−45.80 × 10⁻⁴
Total Biomass (Mton)16.97254.2632.4
CH4 emitted (Mton)0.0470.671.7
CO2 emitted (Mton)7.86109.2293.3
Total CO2 (Mton)8.81132.1328.7
CO emitted (Mton)0.558.320.41
NMHC emitted (Mton)0.0270.411.02
PM2.5 emitted (Mton)0.0240.360.89
NMHC = non-methane hydrocarbon; PM = particulate matter.
Publisher’s Note: MDPI stays neutral with regard to jurisdictional claims in published maps and institutional affiliations.