Abstract
Global-scale forest/non-forest (FNF) maps are of crucial importance for applications like biomass estimation and deforestation monitoring. Global FNF maps based on optical remote sensing data have been produced by the wall-to-wall satellite image analyses or sampling strategies. The German Aerospace Center (DLR) and the Japan Aerospace Exploration Agency (JAXA) also made available their global FNF maps based on synthetic aperture radar (SAR) data. This paper attempted to answer the following scientific question: how comparable are the FNF products derived from optical and SAR data? As test sites we selected the Amazon (tropical rainforest) and Cerrado (tropical savanna) biomes, the two largest Brazilian biomes. Forest estimations from 2015 derived from TanDEM-X (X band; HH polarization) and ALOS-2 (L band; HV polarization) SAR data, as well as forest cover information derived from Landsat 8 optical data were compared with each other at the municipality and image sampling levels. The optical-based forest estimations considered in this study were derived from the MapBiomas project, a Brazilian multi-institutional project to map land use and land cover (LULC) classes of an entire country based on historical time series of Landsat data. In addition to the existing forest maps, a set of 1619 Landsat 8 RGB color composites was used to generate new independent comparison data composed of circular areas with 5-km diameter, which were visually interpreted after image segmentation. The Spearman rank correlation estimated the correlation among the data sets and the paired Mann–Whitney–Wilcoxon tested the hypothesis that the data sets are statistically equal. Results showed that forest maps derived from SAR and optical satellites are statistically different regardless of biome or scale of study (municipality or image sampling), except for the Cerrado´s forest estimations derived from TanDEM-X and ALOS-2. Nevertheless, the percentage of pixels classified as forest or non-forest by both SAR sensors were 90% and 80% for the Amazon and Cerrado biome, respectively, indicating an overall good agreement.
1. Introduction
Currently, forests cover approximately 4060 million ha in the world [1]. Since 1990, the world has lost about 178 million ha of forests [1], regardless of increasing monitoring, assessment, reporting, planning, stakeholder involvement, and designation of more forestlands as units of biodiversity conservation [2]. The largest losses occurred in the tropical regions of South America and Africa. The increasing demand for food, products, and energy, either from forests themselves (e.g., timbers for exportation) or from the lands replacing the forests (e.g., water reservoirs for hydroelectric power generation and clear-cut terrains for livestock and cropland) is the primary cause of forest loss [3,4]. Government settlement programs, expansion of urban centers, and mining activities are also other major contributors for the forest reduction [5,6]. The construction of new roads also contributes to deforestation, as it increases forest access along the forest edges [7].
Forest loss reduces resources such as timber and water supply for local inhabitants; increases greenhouse gas emission, surface runoff, and soil erosion; while it decreases the prevention of flood events and affects biodiversity richness and forest structure as a consequence, for example, of forest fragmentation and introduction of invasive species [8,9]. Deforestation also alters local and regional climate, since forest trees maintain high levels of evapotranspiration, which is an important source of atmospheric moisture that is recycled back as precipitation [10]. For example, the ongoing clear-cutting deforestation in the Brazilian Amazon is expected to amplify the duration of dry season in this region [11].
Given the importance of forested ecosystem services, the advances in satellite remote sensing technologies and the rapid increase of data availability, forest loss monitoring systems have been produced using consistent and timely satellite remote sensing data at spatial resolutions typically ranging between 10 to 50 m. Two prominent examples are the global forest cover loss maps produced by the University of Maryland, under the Global Land Analysis & Discovery (GLAD) program, based on 30-m resolution, optical Landsat satellite data sets [12] and the JICA-JAXA forest early warning system in the tropics (JJ-FAST), which uses 50-m resolution, L band ALOS-2 ScanSAR data [13].
Brazil, with almost 500 million ha of tropical broadleaf rainforest, semi-deciduous forest, and dry forest (12% of total global forest area) [2], is the leading country in terms of development of tropical forest monitoring systems. Since 1988, the National Institute for Space Research (INPE) has been monitoring deforestation occurring at a scale larger than 6.25 ha in the Brazilian Legal Amazon using Landsat, China-Brazil Earth Resources Satellite (CBERS), and Resourcesat satellite data under the Brazilian Amazon Deforestation Monitoring System by Satellite (PRODES) project [14]. More recently, PRODES project extended the mapping area over the Brazilian tropical savannah (Cerrado), which is much more challenging to monitor deforestation because of the marked climatic seasonality (6-month dry season and another 6-month wet season) and because Cerrado vegetation corresponds to a mosaic of grasslands, shrublands, and forestlands in varying proportions [15].
The German Aerospace Center (DLR) and the Japan Aerospace Exploration Agency (JAXA) proposed independent global forest/non-forest (FNF) maps based on SAR data sets (X and L bands, respectively) [3,16]. SAR systems are attractive for mapping and monitoring forest cover and forest changes since they can obtain images regardless of cloud coverage and solar illumination conditions and they are more sensitive to vegetation structure than optical images, especially at low frequencies [17]. The JAXA´s global FNF map from ALOS data is basically produced considering thresholds of backscattering coefficients to decide if a pixel is classified as forest or as non-forest. On the other hand, the DLR´s FNF map from TanDEM-X data exploits the information coming from the interferometric bistatic coherence as input feature to a clustering algorithm that is acquisition geometry/geographical-dependent. These approaches lead to different accuracies in different regions of the world, depending, for example, on the species composition and vegetation density of each region of the world. When SAR data are taken during dry season, the deciduous and dry forest areas will be underestimated due to the smaller/missing canopy [18]. Besides, forest definition usually varies according to the country or institution, especially in terms of area threshold, minimum tree cover, and tree height [19]. For example, according to the Clean Development Mechanism of the Kyoto Protocol [20], forests are lands with more than 0.05–1.0 ha with canopy cover >10–30% and trees taller than 2–5 m at maturity. One of the most widely used forest definitions is the one proposed by [21]: lands with more than 0.5 ha with canopy cover > 10% and trees taller than 5 m at maturity.
The utilization of these maps has often been hampered because of the uncertainties and inconsistencies mainly related to the presence of different types of ecotones in the forest boundaries, limited availability of optical data during the rainy season, and the use of images from different seasons, demanding for evaluation of accuracy benchmark, as pointed out by [22]. For example, the estimation of CO2 emissions from deforestation, carbon stock, and biomass may be underestimated or overestimated depending on the accuracy of the utilized FNF map. Deforestation monitoring crucially relies on accurate and up-to-date FNF maps to reduce misinterpretations related to changes detected over non-forest land covers. The confusion between forests and other forms of vegetation is one of the main obstacles for reliable operational deforestation detection [23]. Further conversions related to land management practices on already deforested lands (for example, pasture cleaning, cropland replacing pastureland, or sugarcane replacing cropland) are prone to cause false detections. To our best knowledge, studies evaluating the accuracy of FNF maps from DLR and JAXA either globally or at country-based level, by means of field data or high spatial resolution satellite images for performing the validation, have not been addressed yet.
Assessing accuracy of thematic maps involves sampling design (e.g., random, systematic, or stratified), estimation of number of samples, obtaining ground reference data, and univariate and multivariate statistical analysis [24]. Because of the difficulty of obtaining reliable ground reference data sets for consistent validation purposes over wide areas, which is the case of Amazon and Cerrado biomes, we decided to not conduct accuracy analyses of SAR and optical derived FNF maps. Instead, we wanted to analyze if they are statistically equal and correlated, helping to build consistent FNF maps. Within this context, this study aims to address the compatibility between FNF maps derived from SAR and optical images over the Amazon (tropical broadleaf rainfall forest) and Cerrado (tropical broadleaf semi-deciduous and deciduous savannah) biomes.
2. Materials and Methods
2.1. Study Areas
The selected study areas correspond to the Amazon and Cerrado biomes, the two largest biomes in Brazil, located in the northern and central parts of the country, respectively (Figure 1). The Amazon biome occupies an area of approximately 4.18 million km2. About 88% of this biome was originally constituted by dense ombrophylous forest (48%), open ombrophylous forest (25%), and ecotones (15%; transition between forest and savannah, mostly along the boundary between Amazon and Cerrado biomes) [25]. Large occurrences of savannah formations (6%) mainly in the states of Amapá, Roraima, Rondônia, and Pará (~233 thousand km2), with several endemic species of fauna and flora, are also found in the Amazon biome [26]. The remaining native vegetation is mostly composed of mangroves in the coastal part of states of Amapá, Pará, and Maranhão, and campinarana (shrubs and trees dominated vegetation well-adapted to extremely poor soil fertility) [25].
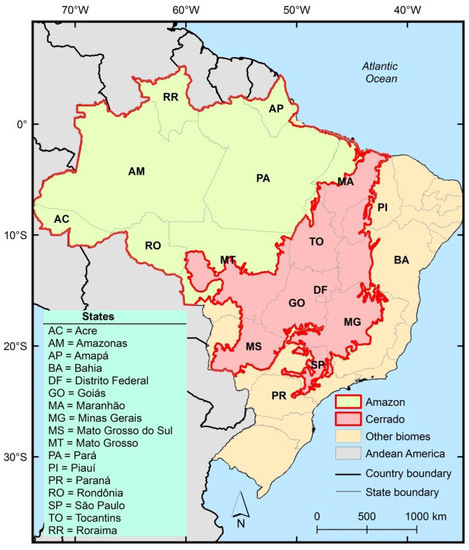
Figure 1.
Location of the study areas (Amazon and Cerrado biomes) in the northern and central parts of Brazil. Amazon biome corresponds to the tropical rainfall forest and Cerrado biome corresponds to the tropical savannah. “Other biomes” in the legend correspond to the Caatinga (semi-arid), Atlantic Forest (coastal forest), Pampa (grasslands), and Pantanal (wetlands) (boundaries not shown in the figure). Source: [27].
In the period between 2008 and 2019, there was an estimated total of 80,400 km2 of clear-cut deforestation in the Amazon biome, with an average annual rate of 6700 km2 per year [14]. Pará, Rondônia, and Mato Grosso accounted for approximately 80% of total deforested area in this biome. Clear-cutting deforestation in the Amazon biome occurs throughout the year; however, it is more intensive in the end of wet season (March/April) and during the dry season when weather conditions favor access to the forest and logging, though optical-based deforestation monitoring systems typically show the highest levels of deforestation in the peak of the dry season (August/September) because of its less cloud-cover conditions. The branches and trunks are left over in the terrain until the peak of the dry season and then burned. In most of the cases, these areas are converted into pasturelands, croplands, or even abandoned after couple of years, becoming secondary vegetation (regeneration), which are of interest as a source of carbon sink or potential lands for agricultural and livestock expansion. According to the Brazilian Forest Code, 80% of rural properties in this biome need to be preserved by native vegetation [28].
The Cerrado biome occupies approximately 2.04 million km2, and its vegetation is composed by a highly seasonal mosaic of different proportions of grasslands, shrublands, savannah woodlands, deciduous and semi-deciduous forests, and evergreen riparian forests, depending on the region. It is one of 25 world hotspots for biodiversity conservation [29]. The typical Cerrado vegetation ranges from closed or open canopy, deciduous and semi-deciduous forest canopy at a height up to 15 m to natural grasslands with sparse shrubs [30]. This biome hosts more than 12,000 plant species [31] and one third of Brazilian biodiversity, with a high level of endemism [32]. Despite its importance in terms of conservation of biodiversity, only 3% of the biome is permanently protected [33]. The need for conservation on private rural lands, as determined by the Forest Code, is much weaker than in the Amazon biome: 35% if the farm is located in the Brazilian Legal Amazon (a political division that includes all Amazon biome and the remaining areas in the Mato Grosso State and part of Maranhão State); or 20% otherwise.
Approximately 45% of the native vegetation of the Cerrado was already converted into some type of land use by 2017, especially cultivated pastures by Brachiaria species, and rain-fed, annual grain production (mostly soybean, corn, and cotton) [34]. The rate of land use conversion is up to two times higher than the one observed in the Amazon in the past 5 years [14], and most of the native vegetation conversion tends to occur in plateaus that are suitable for intensive, mechanized farming [15]. The conversion is occurring rapidly, especially in the northern part of the biome, where we find a new agricultural frontier known as MATOPIBA (region encompassed by Maranhão, Tocantins, Piauí, and Bahia) [35]. These four states together represent 55% of the loss of native vegetation that recently happened from 2005 to 2017 [34].
2.2. Data Sets
One of the key data sets of this study was the global FNF map of 2015 produced by DLR based on the TerraSAR-X add-on for Digital Elevation Measurement (TanDEM-X) interferometric StripMap SAR data and clipped to the Amazon and Cerrado biomes (Figure 2A) [16,36]. The TanDEM-X mission is the first operational spaceborne bistatic SAR system comprising a constellation of two twin satellites TerraSAR-X and TanDEM-X, launched in 2007 and 2010, respectively, allowing for a flexible data acquisition geometry [37]. The two satellites operate at X band (9.65 GHz frequency, 3.1 cm wavelength) in single (VV, HH, VH or HV), dual (VV+HH) or full (HH+HV+HV+VV) polarizations and different acquisition modes (Spotlight, Stripmap, or ScanSAR). The data utilized for the generation of the FNF map were acquired in bistatic Stripmap single polarization (HH). The primary objective of the TanDEM-X mission was to generate a world-wide, consistent, timely, and unprecedented high-precision digital elevation model (DEM), successfully delivered in 2016 [38]. The DLR´s FNF map was made available at 50-m independent ground resolution and was produced based on more than 500 thousand quick-look images acquired from 2011 until 2015. Quick-looks are obtained by applying a spatial averaging to the corresponding data at full resolution (about 3 m for azimuth and range) and have a ground pixel spacing of about 50 m × 50 m. The utilized algorithm is based on a supervised fuzzy clustering algorithm, where the coherence-derived volume correlation factor, which quantifies the amount of interferometric decorrelation caused by volume scattering phenomena, which typically occur in the presence of vegetation, is used as a primary input feature to the classifier [39]. Because of the variability of the interferometric coherence at X band among different forest types due to changes in forest structure, density, and tree height, three reference data sets were obtained from tropical, temperate, and boreal forests to generate the global FNF map. In this data set, forest was defined based on training areas over tropical (South America), temperate (Europe), and boreal (North Asia) forests.
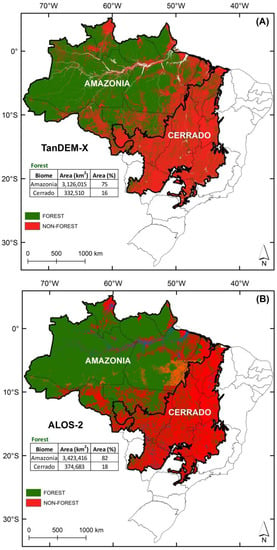
Figure 2.
DLR and JAXA global forest/non-forest maps produced based on the TanDEM-X interferometric synthetic aperture radar data (A) and on the ALOS-2/PALSAR-2 synthetic aperture radar data (B), respectively. The maps were clipped to the Amazon and Cerrado biomes. Sources: [36,43].
Water bodies were filtered out in a second stage of processing based on a freely available map of perennial water bodies at the 150 m × 150 m spatial resolution, produced by the Land Cover project of the Climate Change Initiative of the European Space Agency (ESA) [40]. Therefore, water bodies appear as “no data” in the TanDEM-X FNF map. Mountainous areas where forest growth is highly unlikely were also filtered out by deriving a global tree line from the TanDEM-X DEM and ancillary data, that is, a virtual altitude threshold that defines the edge of regions where trees cannot grow, to avoid possible misclassifications due to geometric distortions such as foreshortening, layover, and shadowing [41]. The altitude threshold varies as a function of temperature, moisture conditions, tree species, and, ultimately, as a function of latitude. Urban areas were identified by applying the Global Urban Footprint derived from the full-resolution TanDEM-X backscatter information freely available at the resolution of 2.8 arcsec (75 m–85 m) [42].
Another key data set was the global FNF map of 2015 produced by JAXA based on ortho-rectified (geometric distortion correction) and slope-corrected ALOS-2/PALSAR-2 data obtained over the period of June to September and clipped to the areas of interest (Amazon and Cerrado biomes) (Figure 2B) [43]. The satellite operates at L band (1.25 GHz frequency, 23 cm wavelength) with single (HH), dual (HH+HV) or full (HH+HV+HV+VV) polarization and different acquisition modes (ScanSAR, StripMap, or Spotlight). The JAXA´s FNF map is available at 25-m pixel spacing. In this product, forest is defined as natural forest patches with areas larger than 0.5 ha, trees higher than 5 m and tree canopy cover of more than 10%, following the definition proposed by Food and Agriculture Organization (FAO) [3]. As the HH polarization presents higher levels of confusion between forest and non-forest classes, the global FNF map was produced using only the images obtained in the HV polarization, followed by an object-oriented image classification and by an application of a 5 × 5 median filter. A set of 15 γ° (gamma naught, the backscattering coefficient per area normal to incidence angle) thresholds of forest/non-forest, varying from −20.1 dB to −11.9 dB and obtained from different continents, was used to produce the global FNF map [3]. Water bodies were defined by a series of γ° and geometric density function thresholds and appear as class # 3 (1 = forest; 2 = non-forest; 3 = water body) in the JAXA´s FNF map. Previous studies have demonstrated the strength of the ALOS data for forest cover assessment [44,45].
Additionally, we utilized external reference FNF maps from the Amazon and Cerrado biomes, derived from optical remote sensing data. In this study, we considered the LULC map of Brazil produced by the MapBiomas Project [46,47]. MapBiomas is a Brazilian multi-institutional initiative involving federal universities, non-governmental organizations, and private companies to map LULC classes of the entire country at the annual basis using time series of Landsat images available in the cloud computing, Google Earth Engine platform. All cloud-free pixels of Landsat scenes from a specific year are processed by the Random Forest classifier to determine, pixel by pixel, the most statistically probable LULC class. Currently, it is the most detailed and updated LULC data available in Brazil on an annual basis and at national level. The average overall accuracy of the LULC time-series, based on stratified random samples of 75,000 Landsat pixels, was 89%, ranging from 73% to 95%, depending on the biome [47]. Specifically, we utilized the map produced for the year 2015 (MapBiomas v. 4.1), clipped to the boundaries of the two investigated biomes. In this project, forest was defined based on the three-level, hierarchical Brazilian vegetation classification system proposed by the Brazilian Institute for Geography and Statistics (IBGE) [24].
Another data set considered in this study was a systematic sampling composed of a circular area of 5 km diameter taken every 0.5 degrees. We used Landsat 8 OLI images acquired in 2015 over the Amazon and the Cerrado biomes (378 images, one image per path/row, paths ranging from 001 to 006 and from 217 to 233 and rows from 57 to 77) that were visually interpreted. Because of the high cloud cover conditions and poor radiometric quality, 176 images, mostly from the Amazon biome, were not included in this data set. Most of the images were acquired between August and September (peak of the dry season in both biomes).
2.3. Methodological Approach
The forest cover data derived by the TanDEM-X, ALOS-2, and Landsat 8 satellites (MapBiomas products) were statistically compared at the levels of biome and municipality. More specifically, the forest cover data from TanDEM-X, ALOS-2, and MapBiomas project were split into two biomes (Amazon and Cerrado) and then into 532 and 1326 municipalities located in these two biomes, respectively. Since both SAR-derived FNF maps present different pixel spacing (ALOS-2 = 25 m; TanDEM-X = 50 m), we also included, in our analysis, the FNF map derived from ALOS-2 resampled to the pixel spacing of 50 m. In this last case, the resampling procedure was performed using the nearest neighbor method. Figure 3 shows the flowchart of the methodological approach, highlighting the steps involved in the Landsat 8 image processing, geographical information system (GIS) data processing, and the non-parametric statistical tests considered in the data analysis.
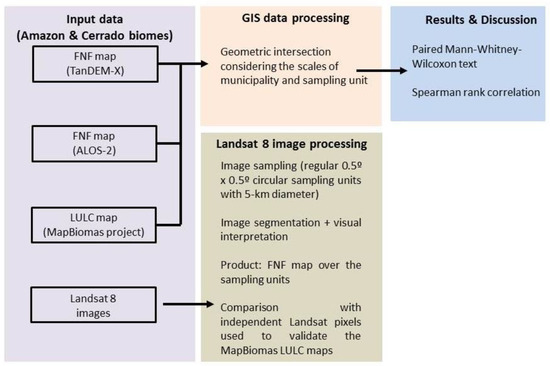
Figure 3.
Flowchart showing the major steps of the methodological approach. FNF = forest/non-forest; LULC = land use and land cover; GIS = geographical information system.
The SAR-derived FNF maps were also compared with the forest cover estimations produced by the authors by visual interpretation of ortho-rectified Landsat 8 OLI scenes from 2015, available in the Earth Explorer user interface from the U.S. Geological Survey. The cloud-free images were sampled to a circular area of 5 km diameter at every 0.5-degree confluences of latitude and latitude. This image sampling design has been used by FAO in the context of Forest Resources Assessment (FRA) and was considered by [48] to estimate land cover changes in the Brazilian Cerrado and Caatinga biomes, as well as by [49] to validate PROBA-V images used to map LULC classes of the Mato Grosso State, Brazil. Within this strategy, sets of 1359 and 695 RGB color composites were obtained, covering the entire Amazon and Cerrado biomes, respectively. A total of 430 image samples from the Amazon biome and five samples from the Cerrado biome were excluded because of the lack of images without cloud coverage or poor radiometric quality of the images (Figure 4).
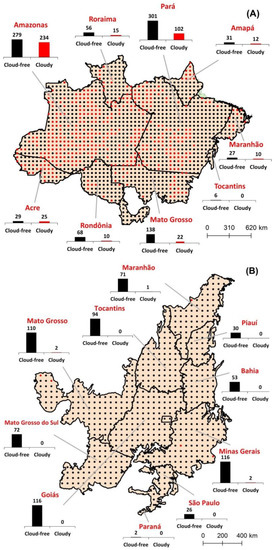
Figure 4.
Landsat 8 OLI image sampling points per state predicted by the sampling design (confluence of 0.5 × 0.5 degree regular grid) and corresponding number of cloud-free Landsat 8 OLI images in the Amazon (A) and Cerrado (B) biomes. Red circles are the sampling sites without cloud-free images. Total number of cloud-free image sampling points: 929 for the Amazon biome and 690 for the Cerrado biome.
Landsat 8 OLI bands 4 (red, 0.636–0.673 μm), 5 (near infrared, 0.851–0.879 μm), and 6 (shortwave infrared, 1.566–1.651 μm) were selected for image segmentation by the region growing algorithm available in the SPRING 5.5 geographical information system (GIS) software [50]. After several empirical tests, the similarity was set as 25 while the minimum area was defined as 67 pixels, corresponding to approximately 6 ha in the 30 m spatial resolution of Landsat 8 OLI images. These two thresholds are the only input parameters required by this software for segmentation. The segments were converted into shapefile format and visually interpreted by overlaying them on the corresponding RGB color composites of Landsat 8 images. An interpretation key was prepared to discriminate between forest formations and other non-forest and land use classes (typically, shrublands, grasslands, croplands, cultivated pasturelands, urban areas, and water bodies) (Table 1). Reforestation areas, mostly by Eucalyptus, found mainly in the Cerrado biome, were considered as forest, even though they are planted (non-natural forests). Here, it is important to keep in mind that reforestation can be classified as non-forest or forest in SAR images, depending on the age. Surrounding harvested areas will be classified as non-forest as well in pixel-per-pixel algorithms. Examples of the Landsat 8 OLI color composites and corresponding results of image segmentation and interpretation are shown in Figure 5. The results of the Landsat visual interpretation were compared with the database composed of 1314 independent Landsat pixels that were used by [46] to validate the MapBiomas LULC maps. These pixels were the ones that overlapped with our samples.

Table 1.
Interpretation key for the Landsat 8 OLI, RGB color composites of bands 4, 5, and 6 for forest and other representative and most extensive land use and land cover (LULC) classes found in the Amazon and Cerrado biomes (shrublands, grasslands, croplands, and cultivated pasturelands).
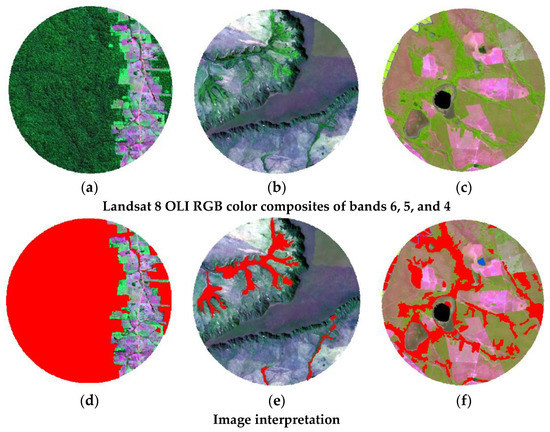
Figure 5.
Examples of Landsat 8 OLI RGB color composites (a–c) and corresponding image interpretation (d–f) from the municipalities of Nova Mamoré/Rondônia (Amazon biome) and from the municipalities of Mateiros/Tocantins and São Miguel do Araguaia/Goiás (Cerrado biome), respectively. Red areas correspond to the forest class.
The Shapiro–Wilk test was applied to verify the data normality. Once the normality was rejected, we used the paired Mann–Whitney–Wilcoxon test (hereafter referred as Wilcoxon test) to test the hypothesis that the data sets are statistically equal and the Spearman rank correlation (ρ) to calculate the correlation among the data sets. The statistical analyses were performed using R version 4.0.2 [51] and its ggplot2 data visualization package [52].
3. Results and Discussion
3.1. Amazon Biome
According to the [46], forests in the Amazon biome in 2015 were covering an area of 3.42 million km2 (81% of the biome). The TanDEM-X estimation showed that there are 3,126,015 km2 (75% of the biome) of forests while ALOS-2 showed a total area of 3,423,416 km2 (82%) (Figure 2). The difference of 297,401 km2 (7%) between TanDEM-X and ALOS-2 estimations provides the first indication that the two considered SAR-based FNF maps over the Amazon biome may present some important differences. In fact, ALOS-2 also estimated more forest cover than did the TanDEM-X at the municipality level (Figure 6). TanDEM-X and ALOS-2 showed median values of 40.3% and 43.1%, and average values of 46.6% and 47.0%, respectively. The results of Wilcoxon test showed that both maps are different (p < 0.01), though the correlation (ρ) between them was high (ρ = 0.92). The interquartile range was larger for the ALOS-2 forest map, indicating a higher dispersion of forest estimations. The range of percentage of forest cover in the municipalities located in the Amazon biome was large, with municipalities with almost no forest cover and others with almost full coverage of forest. This is an indicator that at least half of the municipalities of the Amazon biome have less forest coverage than that determined by the Brazilian Forest code for this biome [28].
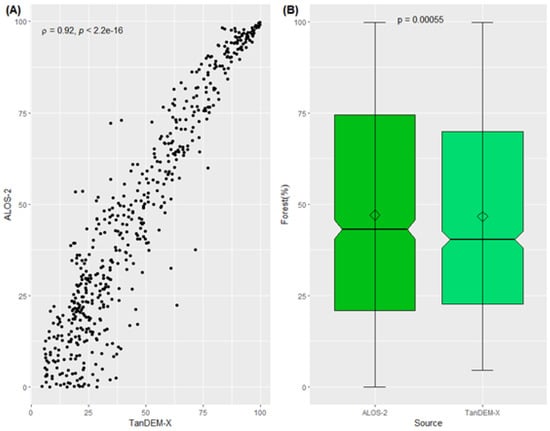
Figure 6.
Relationship between the percentage of forest estimations obtained by the TanDEM-X and ALOS-2 data sets (A) and the results of the Wilcoxon test (B) over the Amazon biome at the municipality level.
Figure 7 shows the relations of the forest estimations obtained by TanDEM-X, ALOS-2, and Landsat 8 OLI image interpretation at the sampling level (929 image samples) in the Amazon biome. The overall accuracy of the Landsat 8 image interpretation was 93.4%; omission errors of 5.2% and 10.9% for forest and non-forest discriminations, respectively; and commission errors of 3.4% and 15.9% (Supplementary Material, Table S1). The correlation between TanDEM-X and ALOS-2 with Landsat were ρ = 0.91 and ρ = 0.90, respectively, and ρ = 0.89 between TanDEM-X and ALOS-2. The ALOS-2 forest map and Landsat estimation median values were 87.9% and the TanDEM-X forest map was 78.9%. Despite these high correlation values and similar medians, they are statistically different (p-value << 0.01) when the sampled location is analyzed.
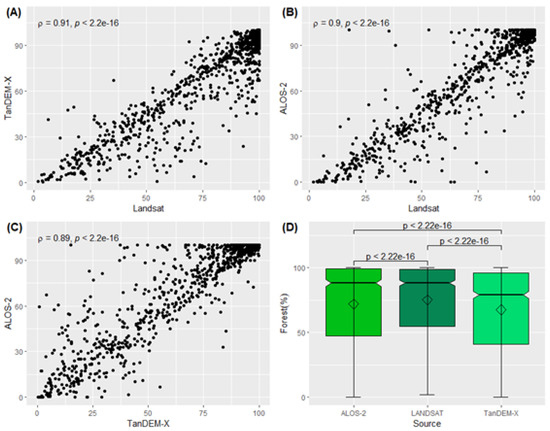
Figure 7.
Relationship between the percentages of forest estimations obtained by the TanDEM-X, ALOS-2, and Landsat 8 OLI image interpretation (A–C) and the results of the Wilcoxon test (D) over the Amazon biome at the local level (image samples).
The dominant forest classes present in the Amazon biome are the primary rainfall forest often subdivided in dense, mixed, and open perennial forests as well as the mangroves found in the coastal region of Amapá, Maranhão, and Pará [53]. These forest formations present relatively little spectral and radiometric confusion in both optical and SAR satellite images with respect to the following other representative LULC classes present in this biome: savannah-like formations mostly found in large spots in the states of Amapá and Roraima [54]; extensive pasturelands for cattle beef production mostly found in the states of Mato Grosso, Pará, and Rondônia [55]; highly mechanized grain production in the Amazon/Cerrado ecotone region in the Mato Grosso State [56]; and the mosaic of grass, shrub, and trees found in the lowlands along the Tocantins/Araguaia River basin in the border of the states of Tocantins and Pará [57].
Therefore, it seems that it is relatively easy to produce SAR-derived FNF maps within heavily wooded regions regardless of the presence of varying land use and land cover changes and illegal logging activities. Thus, it is somehow surprising that TanDEM-X and ALOS-2 provided statistically different forest estimations over the Amazon biome. Nevertheless, this difference can be related to the nature of SAR information used to derive both FNF maps (ALOS-2: intensity at the HV polarization; TanDEM-X: volume correlation coefficient). The different image acquisition modes of ALOS-2 and TanDEM-X, for example, in terms of wavelength, are another important factor. The penetration capability of emitted microwave signals at L band into the forest canopy is stronger than that from the X band [17]. Consequently, there is an occurrence of multiple backscattering processes within the forest canopy for the L band, while in the X band, the dominant scattering processes occur at the top of canopy. Finally, the time lag in the satellite overpasses is another important issue. While TanDEM-X data set was obtained during the time period from 2011 to 2015, ALOS-2 data set was obtained during the dry season of 2015.
The category known as secondary vegetation, which corresponds to those areas that were clear-cut and are in the process of regeneration [58], is perhaps the most difficult category to be discriminated from forest in the Amazon biome. Not all LULC maps from the Amazon biome discriminate secondary vegetation. Neither the MapBiomas initiative nor IBGE, the government institution responsible for producing official LULC maps of Brazil, include secondary vegetation in the list of LULC classes. Thus, depending on the level or age of regeneration, it is classified as poorly managed cultivated pasture or as forest, a decision that is made by the interpreters responsible for the visual interpretation or for training the supervised classification algorithms or machine learning procedures. Different interpretations given to this class are also likely to be relevant for the differences found in the forest estimations from SAR and Landsat images in the Amazon biome.
In order to analyze the influence of differences in the pixel size (50 m for TanDEM-X; 25 m for ALOS-2), we resampled the ALOS-2 scenes to the TanDEM-X pixel size. The mean difference in the percent of forest cover between the ALOS-2 25-m pixel size and the ALOS-2 50-m pixel size for the 929 samples was 0.04%, that is, a negligible influence of pixel size change in the forest cover estimation by the ALOS-2 satellite. Figure 8 shows a portion of FNF maps produced by the TanDEM-X and ALOS-2 from the municipality of Porto Velho, Rondônia State. In this figure, we can note that the TanDEM-X FNF map is much more fragmented than the ALOS-2 FNF map, although the pixel spacing of TanDEM-X is four times larger than that from the ALOS-2, resulting in a TanDEM-X forest cover estimation of 50% and ALOS-2 forest cover estimation of 43%. This can be explained in terms of characteristics of input products. The original products of TanDEM-X (12 m × 12 m resolution) were processed by multi-looking filter to obtain 50-m quick-looks [59], while the ALOS-2 input data (36 m × 20 m) [3] were converted into 25-m pixel spacing and processed by median filter after the image classification. This figure also shows that the river channel is better defined in ALOS-2 FNF map due to the different approaches in delineating water bodies, as reported in the Section 2.2.
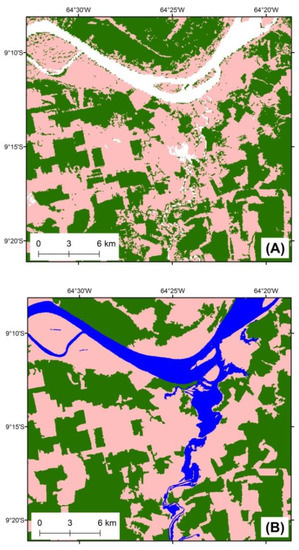
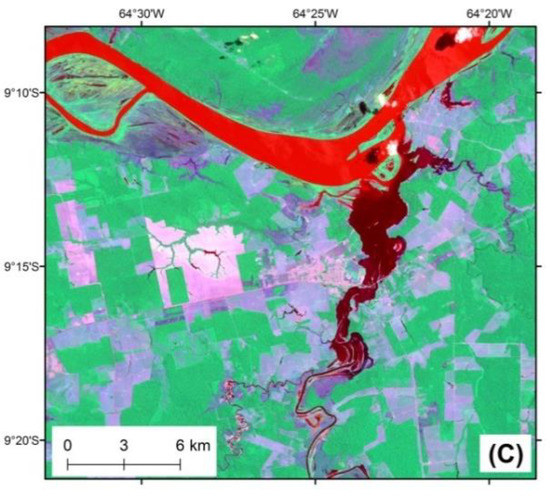
Figure 8.
Portions of FNF maps produced by the TanDEM-X (A) and ALOS-2 (B) data sets over the municipality of Porto Velho, Rondônia State. TanDEM-X forest estimation = 50%; ALOS-2 forest estimation = 43%. Green color corresponds to the forest; pink color corresponds to the non-forest; white color in (A) and blue color in (B) correspond to the river channel. In (C), the RGB color composite of Landsat 8, bands 4, 5, and 6 (overpass: 9 September, 2015) of the same region.
By taking advantage of the FNF maps resampled to 50-meter pixel size, Figure 9 shows the percentage of pixels classified as forest (FF) and non-forest (NF/NF) by TanDEM-X and ALOS-2, and as forest by only one sensor (F/NF or NF/F) at the state level and for the Amazon biome. Seventy-four percent of pixels were classified as forest by both sensors, and 16% as non-forest. The remaining 10% was classified as forest by only one sensor (either TanDEM-X or ALOS-2). The states of Maranhão and Tocantins, located in the border of the Cerrado biome, were the two states with the highest percentages of pixels classified as forest by only one of the sensors (23% and 20%, respectively).
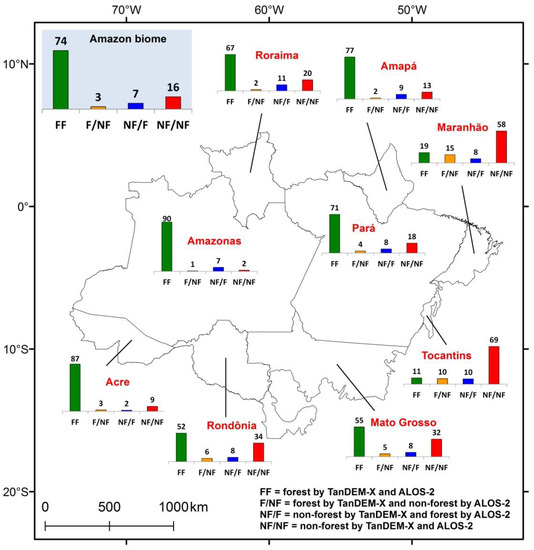
Figure 9.
Percentage of pixels classified by the TanDEM-X and ALOS-2 as: forest (FF); non-forest (NF/NF); forest and non-forest (F/NF); and non-forest and forest (NF/F) over the states covered by the Amazon biome.
For illustration purposes, Figure 10A,B shows two cases where TanDEM-X presented lower estimations of forest cover in comparison with those from ALOS-2 and another two cases (Figure 10C,D) where TanDEM-X forest estimation was higher. Basically, these figures show that TanDEM-X better depicts the smaller fragments of either forests or non-forests. In the ALOS-2 FNF map, relatively small non-forest fragments distributed along the riparian forests tended to be grouped as forest. On the other hand, small forest fragments randomly distributed in larger non-forest fragments were grouped as non-forest. This is probably related to the azimuth and range resolution of original data sets. The resolution of the input PALSAR-2 data is 36 m (azimuth) × 20 m (range), processed by a multi-looking filter to reduce speckle and resampled to 25 m. On the other hand, the input TanDEM-X data is 12 m × 12 m, processed by a multi-looking filter to obtain quicklooks of 50 m × 50 m resolution. The trend of TanDEM-X to depict small fragments of either forest or non-forest patches and the trend of ALOS-2 to group these small fragments into a larger adjacent class seem to be crucial in the quantitative estimations shown in this figure.
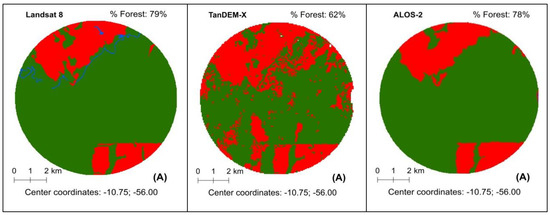
Figure 10.
Examples of forest estimations obtained by the TanDEM-X and ALOS-2 data sets over the Amazon biome showing cases of TanDEM-X forest underestimation in the municipalities of Nova Canaã do Norte (A) and Canarana (B), Mato Grosso State, as well as cases of ALOS-2 forest underestimation in the municipalities of Vale do Paraíso (C) and Colorado do Oeste (D), Rondônia State. The corresponding forest estimations from Landsat 8 are shown in the first column. Green = forest; red = non-forest; blue = water body.
3.2. Cerrado Biome
TanDEM-X estimated a total of 332,510 km2 of forests in the Cerrado biome (16% of the biome) while ALOS-2 estimated 374,683 km2 (18%) (Figure 2), that is, a difference of 42,173 km2 (2%) between these two estimates. These numbers provide a first indication that the two considered FNF maps over the Cerrado biome present quite similar results. Nevertheless, the relation between the percentages of forest estimation obtained by the TanDEM-X and ALOS-2 at the municipality level was very poor (ρ = 0.25) (Figure 11A). These estimates were statistically different (p-value << 0.01; Figure 11B). The majority of Cerrado municipalities presented dominant low forest coverage: Approximately 95% of municipalities with forest cover lower than 40% in both data sets; and at least half of these municipalities have forest cover lower than 15% (TanDEM-X median = 14.5%; and ALOS-2 median = 12.7%). These values represent three times less forest cover in the Cerrado than in the Amazon. Differently from the Amazon municipalities, TanDEM-X estimated more forest cover than did the ALOS-2. However, the interquartile range (Figure 11B) was larger in the ALOS-2 forest map than that from the TanDEM-X forest map, denoting more variability at the municipality level.
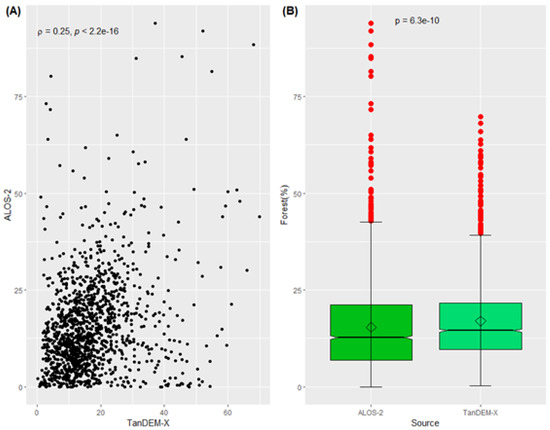
Figure 11.
Relationship between the percentage of forest estimations obtained by the TanDEM-X and ALOS-2 data sets (A) and the results of the Wilcoxon test (B) over the Cerrado biome at the municipality level.
According to [46], forests in this biome in 2015 covered an area of 440 thousand km2 (22% of the biome; 407 thousand km2 of native forests; 33 thousand km2 of reforestation; and 562 km2 of mangroves). These results show a relatively poor agreement between these three data sets. Previous studies have pointed out the difficulty of discriminating the three native vegetation formations of the Cerrado biome—grasslands, shrublands, and forestlands by satellite remote sensing data [15,59]. The major reasons are four-fold: (a) gradual transition between grasslands to shrublands and between shrublands to forestlands, making the definition of the boundaries of each formation quite difficult; (b) lack of homogeneous canopies in terms of height and density of tree crowns, because of the high biodiversity of the Cerrado; (c) the strong climatic seasonality of this biome, changing the spectral and radiometric features significantly, depending on the satellite overpass over the year; and (d) because most of the forests in the Cerrado are not dense, there is a significant influence of soil background in the SAR data, which is a complex task to take into consideration in the forest mapping efforts using SAR data. In some regions of the Cerrado (mainly in the eastern part of the Cerrado, states of Minas Gerais and Bahia), we find dry forests, which is difficult to be identified by remote sensing, especially if the images are acquired during the dry season [18].
Figure 12 shows the relation between the forest estimations obtained by the TanDEM-X and ALOS-2 satellites with those obtained by the Landsat 8 image interpretation of 690 image samples located in the Cerrado biome. The overall accuracy of the Landsat 8 image interpretation was 85.5%; omission errors of 39.1% and 8.2% for forest and non-forest discriminations, respectively; and commission errors of 34.3% and 9.8% (Supplementary Material, Table S2).
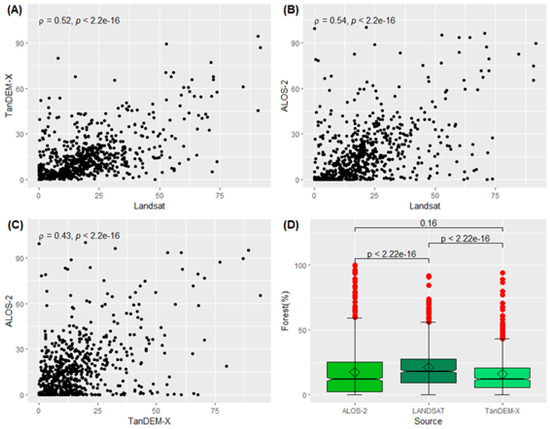
Figure 12.
Relationship between the percentages of forest estimations obtained by the TanDEM-X, ALOS-2, and Landsat 8 OLI image interpretation (A–C) and the results of Wilcoxon test (D) over the Cerrado biome at the local level (image samples).
Opposite to the Amazon biome, poor relations were found for the Cerrado (ρ = 0.52 for TanDEM-X; and ρ = 0.54 for ALOS-2). The critical point here is that the accuracy of the classification always depends strongly on the accuracy of the used reference data for training the algorithm. In the case of the TanDEM-X FNF map, three different references, one for tropical forests, one for temperate forests, and one for boreal forests were considered to generate the global product. In the case of ALOS-2 FNF map, 15 references from different countries were considered, as mentioned previously. None of these two products included highly seasonal savannahs in the training areas, which certainly contributes for the reduction of reliability in classifying sparse forests. In this specific case, we observed a probability of TanDEM-X and ALOS-2 forest map cover to be equal at the sampling scale (p-value = 0.16). However, both TanDEM-X and ALOS-2 forest maps were statistically different from Landsat. Also, the probability of the Landsat to estimate forest cover was higher than those from TanDEM-X and ALOS-2.
Seven percent of Cerrado pixels were classified as forest by the TanDEM-X and ALOS-2, while 73% were classified as non-forest (Figure 13). The remaining 20% were classified as forest by only one SAR sensor (either TanDEM-X or ALOS-2). The states of Maranhão and Mato Grosso presented the highest percentage of forests discriminated by only one SAR sensor (29% and 23%, respectively). Some states (e.g., Maranhão and Piauí) presented more pixels classified as forest by the TanDEM-X, while other states (e.g., Mato Grosso and Mato Grosso do Sul) presented more pixels classified as forest by the ALOS-2.
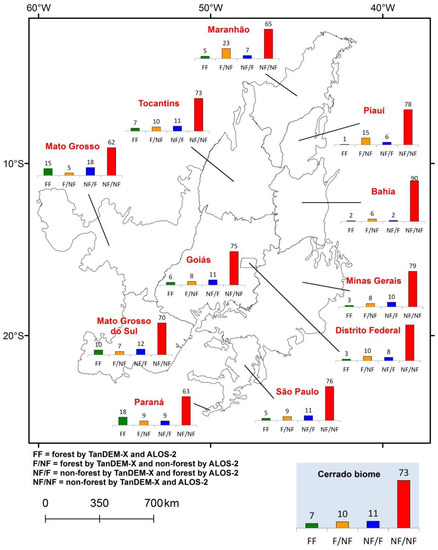
Figure 13.
Percentage of pixels classified by the TanDEM-X and ALOS-2 as: forest (FF); non-forest (NF/NF); forest and non-forest (F/NF); and non-forest and forest (NF/F) over the states covered by the Cerrado biome.
For illustration purposes, Figure 14 shows cases where the estimations of forest cover by TanDEM-X were lower than those from the ALOS-2 and vice-versa. In Figure 14A, forest corresponds to large areas of reforestation, some of them harvested during the Landsat 8 overpass. ALOS-2 detected more areas of reforestations; however, none of the SAR systems were able to detect harvested areas. This is one of the most difficult tasks in discriminating reforestation using fully automatic procedures since harvested areas can be classified as reforestation mainly based on contextual analysis, regardless of the satellite system. When the forest fragments are relatively large, we can note that ALOS-2 was able to depict more areas of forests (Figure 14B); however, when the forests are more fragmented, TanDEM-X was more efficient to depict those areas (Figure 14C). In Figure 14D, ALOS-2 missed a significant portion of forested areas. Both SAR-derived FNF maps did not depict the water reservoir showed in the blue color in the eastern part of the Landsat 8 RGB color composite (Figure 14A).
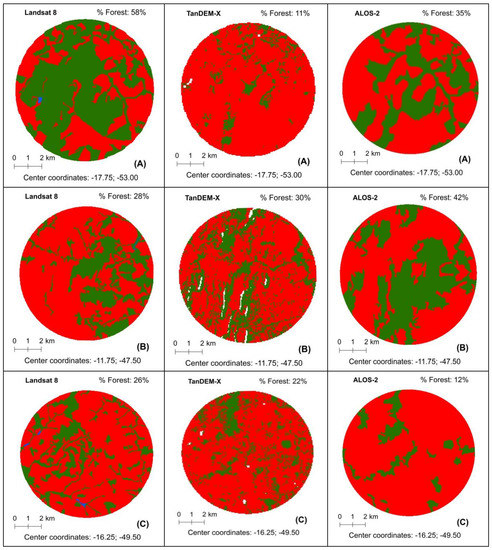
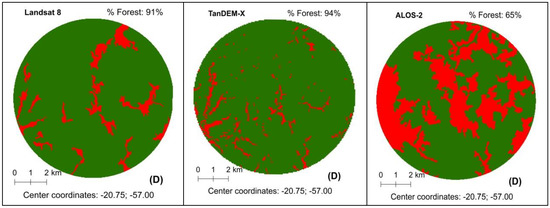
Figure 14.
Examples of forest estimations obtained by the TanDEM-X and ALOS-2 data sets over the Cerrado biome showing cases of TanDEM-X forest underestimation in the municipalities of Mineiros (A), Goiás State and Natividade (B), Tocantins State as well as cases of ALOS-2 forest underestimation in the municipalities of Inhumas (C), Goiás State and Porto Murtinho (D), Mato Grosso do Sul State. The corresponding forest estimations from Landsat 8 are shown in the first column. Green = forest; red = non-forest; blue = water body.
4. Conclusions
This study attempted to answer the following scientific question: How comparable are the analyzed global FNF maps derived from SAR and optical satellites? In order to answer this question, we selected the Brazilian Amazon and Cerrado biomes as the study cases. The forest estimations from TanDEM-X, ALOS-2, and Landsat 8 showed to be statistically different for both biomes and for the scales of municipality and sampling sites (except the forest estimation between TanDEM-X and ALOS-2 at the sampling level for the Cerrado biome). Nevertheless, 90% of pixels from the Amazon biome presented the same indication (forest or non-forest) in both SAR-based FNF maps; for the Cerrado biome, the percentage was 80%, indicating an overall good agreement. The differences are related to the distinct sensor configurations, different methodological approaches, and different forest definitions. We recommend the development of global FNF products that are specific to the tropical savannahs, typically marked by the presence of mosaics of grasses, shrubs, and trees with varying proportions and with high climatic seasonality or at least including some reference areas from tropical savannahs in the FNF classification procedures.
In this study, the results of Wilcoxon tests comparing the performance of ALOS-2, TanDEM-X, and Landsat 8 data were not helpful about the recommendation of which product to select. Perhaps the use of multi-temporal and multi-sensor SAR data to produce FNF maps, basically to take into consideration the seasonality and moisture effects in the image classification, can assist in answering this question. The launch of upcoming L band ALOS-4/PALSAR-3 satellite, with improvements, for example, in terms of observation frequency (every 2 weeks or 20 times a year in the Stripmap mode) will increase the data availability significantly. Another upcoming L band and S band SAR is the NASA-ISRO Synthetic Aperture Radar (NISAR), scheduled to be launched in 2022 with 12-day repeat cycle. The upcoming DLR´s TanDEM-L interferometric mission will fulfill the requirements for tomographic measurements of three-dimensional structure of vegetation, allowing the discrimination of forested and non-forested areas based on the height of canopy.
Supplementary Materials
The following are available online at https://www.mdpi.com/2072-4292/13/3/367/s1, Table S1: Classification agreement of systematic Landsat samples in the Amazon biome; Table S2: Classification agreement of systematic Landsat samples in the Cerrado biome.
Author Contributions
Conceptualization, E.E.S.; Investigation, E.E.S.; Writing—Original draft preparation, E.E.S., P.R., C.N.K., M.W., M.A., and Y.E.S.; Writing—Review and editing, E.E.S., P.R., and M.A.; Image interpretation, E.E.S., G.B., and D.M.F.; Supervision, E.E.S.; Visualization, E.E.S. and M.A.; Project administration, E.E.S. All authors have read and agreed to the published version of the manuscript.
Funding
This research was partially funded by the Brazilian Council for Scientific and Technological Development (CNPq, Grant 303502/2019-3).
Institutional Review Board Statement
Not applicable.
Informed Consent Statement
Not applicable.
Data Availability Statement
The data presented in this study are available upon request to the corresponding author.
Acknowledgments
This study was conducted under the Kyoto and Carbon (K&C) Initiative. The authors acknowledge Laerte G. Ferreira from the MapBiomas team (Federal University of Goiás) for kindly providing the independent validation data set of this project. We also thank the anonymous reviewers for their valuable comments.
Conflicts of Interest
The authors declare no conflict of interest.
References
- FAO. Global Forest Resources Assessment 2020. Key Findings; FAO: Rome, Italy, 2020; 16p. [Google Scholar]
- FAO. Global Forest Resources Assessment 2015, 2nd ed.; FAO: Rome, Italy, 2016; 54p. [Google Scholar]
- Shimada, M.; Itoh, T.; Motooka, T.; Watanabe, M.; Shiraishi, T.; Thapa, R.; Lucas, R. New global forest/non-forest maps from ALOS PALSAR data (2007–2010). Remote Sens. Environ. 2014, 155, 13–31. [Google Scholar] [CrossRef]
- Pendrill, F.; Persson, U.M.; Godar, J.; Kastner, T.; Moran, D.; Schmidt, S.; Wood, R. Agricultural and forestry trade drives large share of tropical deforestation emissions. Glob. Environ. Chang. 2019, 56, 1–10. [Google Scholar] [CrossRef]
- Batistella, M.; Robeson, S.; Moran, E.F. Settlement design, forest fragmentation, and landscape change in Rondônia, Amazônia. Photogramm. Eng. Remote Sens. 2003, 69, 805–812. [Google Scholar] [CrossRef]
- Siqueira-Gay, J.; Sonter, L.J.; Sánchez, L.E. Exploring potential impacts of mining on forest loss and fragmentation within a biodiverse region of Brazil’s northeastern Amazon. Resour. Policy 2020, 67, 101662. [Google Scholar] [CrossRef]
- Southworth, J.; Marsik, M.; Qiu, Y.; Perz, S.; Cumming, G.; Stevens, F.; Rocha, K.; Duchelle, A.; Barnes, G. Roads as drivers of change: Trajectories across the tri-national frontier in MAP, the southwestern Amazon. Remote Sens. 2011, 3, 1047–1066. [Google Scholar] [CrossRef]
- Foley, J.A.; DeFries, R.; Asner, G.P.; Barford, C.; Bonan, G.; Carpenter, S.R.; Chapin, F.S.; Coe, M.T.; Daily, G.C.; Gibbs, H.K.; et al. Global consequences of land use. Science 2005, 309, 570–574. [Google Scholar] [CrossRef]
- Barlow, J.; Lennox, G.D.; Ferreira, J.; Berenguer, E.; Lees, A.C.; Mac Nally, R.; Thomson, J.R.; Ferraz, S.F.D.B.; Louzada, J.N.; Oliveira, V.H.F.; et al. Anthropogenic disturbance in tropical forests can double biodiversity loss from deforestation. Nature 2016, 535, 144–147. [Google Scholar] [CrossRef]
- Zemp, D.C.; Schleussner, C.F.; Barbosa, H.M.J.; Rammig, A. Deforestation effects on Amazon forest resilience. Geophys. Res. Lett. 2017, 44, 6182–6190. [Google Scholar] [CrossRef]
- Spracklen, D.V.; Arnold, S.R.; Taylor, C.M. Observations of increased tropical rainfall preceded by air passage over forests. Nature 2012, 489, 282–285. [Google Scholar] [CrossRef]
- Hansen, M.C.; Potapov, P.V.; Moore, R.; Hancher, M.; Turubanova, S.A.; Tyukavina, A.; Thau, D.; Stehman, S.V.; Goetz, S.J.; Loveland, T.R.; et al. High-resolution global maps of 21st-century forest cover change. Science 2013, 342, 850–853. [Google Scholar] [CrossRef]
- JAXA. JICA-JAXA Forest Early Warning System in the Tropics. 2020. Available online: https://www.eorc.jaxa.jp/jjfast/ (accessed on 28 March 2020).
- INPE. TerraBrasilis. PRODES (Deforestation). Available online: http://terrabrasilis.dpi.inpe.br/app/map/deforestation?hl=pt-br (accessed on 28 March 2020).
- Sano, E.E.; Rosa, R.; Brito, J.L.S.; Ferreira, L.G. Land cover mapping of the tropical savanna region in Brazil. Environ. Monit. Assess. 2010, 166, 113–124. [Google Scholar] [CrossRef] [PubMed]
- Martone, M.; Rizzoli, P.; Wecklich, C.; González, C.; Bueso-Bello, J.L.; Valdo, P.; Schulze, D.; Zink, M.; Krieger, G.; Moreira, A. The global forest/non-forest map from TanDEM-X interferometric SAR data. Remote Sens. Environ. 2018, 205, 352–373. [Google Scholar] [CrossRef]
- Lewis, A.J.; Henderson, F.M.; Holcomb, D.W. Radar fundamentals. The geoscience perspective. In Manual of Remote Sensing. Principles and Applications of Imaging Radar. v. 2, 3rd ed.; Henderson, F.M., Lewis, A.J., Eds.; John Wiley & Sons: New York, NY, USA, 1998; pp. 131–181. [Google Scholar]
- Koyama, C.N.; Watanabe, M.; Hayashi, M.; Ogawa, T.; Shimada, M. Mapping the spatial-temporal variability of tropical forests by ALOS-2 L-band SAR big data analysis. Remote Sens. Environ. 2019, 233, 111372. [Google Scholar] [CrossRef]
- Chazdon, R.L.; Brancalion, H.S.; Laestadius, L.; Bennett-Curry, A.; Buckingham, K.; Kumar, C.; Moll-Rocek, J.; Vieira, I.C.G.; Wilson, S.J. When is a forest a forest? Forest concepts and definitions in the era of forest and landscape restoration. Ambio 2016, 45, 538–550. [Google Scholar] [CrossRef]
- UNFCCC. Report of the Conference of the Parties on its Seventh Session, 2002 (FCCC/CP/2001/13/Add.1, UNFCCC, Marrakesh, Morocco, 2001). Available online: http://unfccc.int/resource/docs/cop7/13a01.pdf (accessed on 11 September 2019).
- FAO. Global Forest Resources Assessment 2010. Terms and Definitions; FAO: Rome, Italy, 2010; 27p. [Google Scholar]
- Congalton, R.G.; Gu, J.; Yadav, K.; Thenkabail, P.; Ozdogan, M. Global land cover mapping: A review and uncertainty analysis. Remote Sens. 2014, 6, 12070–12093. [Google Scholar] [CrossRef]
- Koyama, C.N.; Watanabe, M.; Sano, E.; Nagatani, I.; Hayashi, M.; Tadono, T.; Shimada, M. On the challenges for operational deforestation detection in a pantropical L-band SAR early warning system—Understanding the stability of radar backscatter over tropical forest. Remote Sens. Ecol. Conserv. 2020. submitted, under review. [Google Scholar]
- Olofsson, P.; Foody, G.M.; Herold, M.; Stehman, S.V.; Woodcock, C.E.; Wulder, M.A. Good practices for estimating area and assessing accuracy of land change. Remote Sens. Environ. 2014, 148, 42–57. [Google Scholar] [CrossRef]
- IBGE. Manual Técnico da Vegetação Brasileira; IBGE: Rio de Janeiro, Brazil, 2012; 271p.
- Carvalho, W.; Mustin, K. The highly threatened and little-known Amazonian savannahs. Nat. Ecol. Evol. 2017, 1, 0100. [Google Scholar] [CrossRef]
- IBGE. Mapa de Biomas e de Vegetação; IBGE: Rio de Janeiro, Brazil, 2004. Available online: https://ww2.ibge.gov.br/home/presidencia/noticias/21052004biomashtml.shtm (accessed on 10 March 2020).
- Soares-Filho, B.; Rajão, R.; Macedo, M.; Carneiro, A.; Costa, W.; Coe, M.; Rodrigues, H.; Alencar, A. Cracking Brazil´s forest code. Science 2014, 344, 363–364. [Google Scholar] [CrossRef]
- Myers, N.; Mittermeier, R.A.; Mittermeier, C.G.; Fonseca, G.A.B.; Kent, J. Biodiversity hotspots for conservation priorities. Nature 2000, 403, 853–858. [Google Scholar] [CrossRef]
- Ratter, J.A.; Ribeiro, J.F.; Bridgewater, S. The Brazilian Cerrado vegetation and threats to its biodiversity. Ann. Bot. 1997, 80, 223–230. [Google Scholar] [CrossRef]
- Joly, C.A.; Padgurschi, M.C.G.; Pires, A.P.F.; Agostinho, A.A.; Marques, A.C.; Amaral, A.G.; Cervone, C.O.F.O.; Adams, C.; Baccaro, F.B.; Sparovek, G.; et al. Apresentando o diagnóstico brasileiro de biodiversidade e serviços ecossistêmicos. In Diagnóstico Brasileiro de Biodiversidade e Serviços Ecossistêmicos; Joly, C.A., Scarano, F.R., Seixas, C.S., Metzger, J.P., Ometto, J.P., Bustamante, M.M.C., Padgurschi, M.C.G., Pires, A.P.F., Castro, P.F.D., Gadda, T., et al., Eds.; Editora Cubo: São Carlos, Brazil, 2019; pp. 351p. [Google Scholar]
- Klink, C.A.; Machado, R.B. Conservation of the Brazilian Cerrado. Conserv. Biol. 2005, 19, 707–713. [Google Scholar] [CrossRef]
- Françoso, R.D.; Brandão, R.; Nogueira, C.C.; Salmona, Y.B.; Machado, R.B.; Colli, G.R. Habitat loss and the effectiveness of protected areas in the Cerrado biodiversity hotspot. Nat. Conserv. 2015, 13, 35–40. [Google Scholar] [CrossRef]
- Alencar, A.; Shimbo, J.Z.; Lenti, F.; Balzani Marques, C.; Zimbres, B.; Rosa, M.; Arruda, V.; Castro, I.; Fernandes Márcico Ribeiro, J.P.; Varela, V.; et al. Mapping three decades of changes in the Brazilian savanna native vegetation using Landsat data processed in the Google Earth Engine platform. Remote Sens. 2020, 12, 924. [Google Scholar] [CrossRef]
- Silva, V.P.R.; Silva, R.A.; Maciel, G.F.; Souza, E.P.; Braga, C.C.; Holanda, R.M. Soybean yield in the Matopiba region under climate changes. Rev. Bras. Eng. Agric. Ambient. 2020, 24, 8–14. [Google Scholar] [CrossRef]
- DLR. TanDEM-X Forest/Non-Forest Map—Global. Available online: https://download.geoservice.dlr.de/FNF50/ (accessed on 8 April 2020).
- Krieger, G.; Zink, M.; Bachmann, M.; Bräutigam, B.; Schulze, D.; Martone, M.; Rizzoli, P.; Steinbrecher, U.; Anthony, J.W.; De Zan, F.; et al. TanDEM-X: A radar interferometer with two formation-flying satellites. Acta Astronaut. 2013, 89, 83–98. [Google Scholar] [CrossRef]
- Rizzoli, P.; Martone, M.; Gonzalez, C.; Wecklich, C.; Borla Tridon, D.; Bräutigam, B.; Bachmann, M.; Schulze, D.; Fritz, T.; Huber, M.; et al. Generation and performance assessment of the global TanDEM-X digital elevation model. J. Photogramm. Remote Sens. 2017, 132, 119–139. [Google Scholar] [CrossRef]
- Martone, M.; Rizzoli, P.; Krieger, G. Volume decorrelation effects in TanDEM-X interferometric SAR data. IEEE Geosci. Remote Sens. Lett. 2017, 13, 1812–1816. [Google Scholar] [CrossRef]
- Kirches, G.; Santoro, M.; Wevers, J.; Boettcher, M.; Brockmann, C.; Lamarche, C.; Bontemps, S.; Deofurny, P. Land Cover CCI—Product User Guide—Version 2; ESA Public Document CCI-LC-PUG, Issue 2.4; University College London: London, UK, 2015. [Google Scholar]
- Körner, C. Climatic tree lines: Conventions, global patterns, causes. Erdkunde 2007, 61, 316–324. [Google Scholar] [CrossRef]
- Esch, T.; Marconcini, M.; Felbier, A.; Roth, A.; Heldens, W.; Huber, M.; Schwinger, M.; Taubenböck, H.; Müller, A.; Dech, S. Urban footprint processor—Fully automated processing chain generating settlement masks from global data of the tandem-X mission. IEEE Geosci. Remote Sens. Lett. 2013, 10, 1617–1621. [Google Scholar] [CrossRef]
- JAXA. PALSAR-2 Global Forest/Non-forest Map “2015”. 2020. Available online: https://www.eorc.jaxa.jp/ALOS/en/palsar_fnf/data/2015/map.htm (accessed on 8 April 2020).
- Thapa, R.B.; Itoh, T.; Shimada, M.; Watanabe, M.; Takeshi, M.; Shiraishi, T. Evaluation of ALOS PALSAR sensitivity for characterizing natural forest cover in wider tropical areas. Remote Sens. Environ. 2014, 155, 32–41. [Google Scholar] [CrossRef]
- Qin, Y.; Xiao, X.; Dong, J.; Zhang, G.; Roy, P.S.; Joshi, P.K.; Gilani, H.; Murthy, M.S.R.; Jin, C.; Wang, J.; et al. Mapping forests in monsoon Asia with ALOS PALSAR 50-m mosaic images and MODIS imagery in 2010. Sci. Rep. 2016, 6, 20880. [Google Scholar] [CrossRef] [PubMed]
- MapBiomas. MapBiomas v. 4.1. Available online: Mapbiomas.org (accessed on 28 August 2020).
- Souza, C.M., Jr.; Shimbo, J.Z.; Rosa, M.R.; Parente, L.L.; Alencar, A.A.; Rudorff, B.F.; Hasenack, H.; Matsumoto, M.; Ferreira, L.G.; Souza Filho, P.W.; et al. Reconstructing three decades of land use and land cover changes in Brazilian biomes with Landsat archive and Earth Engine. Remote Sens. 2020, 12, 2735. [Google Scholar] [CrossRef]
- Beuchle, R.; Grecchi, R.C.; Shimabukuro, Y.E.; Seliger, R.; Eva, H.D.; Sano, E.; Achard, F. Land cover changes in the Brazilian Cerrado and Caatinga biomes from 1990 to 2010 based on a systematic remote sensing sampling approach. Appl. Geogr. 2015, 58, 116–127. [Google Scholar] [CrossRef]
- Arai, E.; Sano, E.E.; Dutra, A.C.; Cassol, H.L.G.; Hoffmann, T.B.; Shimabukuro, Y.E. Vegetation fraction images derived from PROBA-V data for rapid assessment of annual croplands in Brazil. Remote Sens. 2020, 12, 1152. [Google Scholar] [CrossRef]
- Camara, G.; Souza, R.C.M.; Freitas, U.; Garrido, J. SPRING: Integrating remote sensing and GIS by object-oriented data model. Comput. Geosci. 1996, 34, 715–737. [Google Scholar] [CrossRef]
- R Core Team. R: A Language and Environment for Statistical Computing. Viena, R Foundation for Statistical Computing. 2020. Available online: https://www.R-project.org/ (accessed on 11 September 2020).
- Wickham, H. Ggplot2: Elegant Graphics for Data Analysis; Springer-Verlag: New York, NY, USA, 2016. [Google Scholar]
- IBGE. Monitoramento da Cobertura e Uso da Terra do Brasil 2014–2016; IBGE: Rio de Janeiro, Brazil, 2018; 29p.
- Barbosa, R.I.; Fearnside, P. Wood density of trees in open savannas of the Brazilian Amazon. For. Ecol. Manag. 2004, 199, 115–123. [Google Scholar] [CrossRef]
- Carvalho, R.; Aguiar, A.P.D.; Amaral, S. Diversity of cattle raising systems and its effects over forest regrowth in a core region of cattle production in the Brazilian Amazon. Reg. Environ. Chang. 2020, 20, 44. [Google Scholar] [CrossRef]
- Simões, R.; Picoli, M.C.A.; Camara, G.; Maciel, A.; Santos, L.; Andrade, P.R.; Sánchez, A.; Ferreira, K.; Carvalho, A. Land use and cover maps for Mato Grosso State in Brazil from 2001 to 2017. Sci. Data 2020, 7, 34. [Google Scholar] [CrossRef]
- Latrubesse, E.M.; Stevaux, J.C. Geomorphology and environmental aspects of the Araguaia fluvial basin, Brazil. Z. Geomorphol. 2002, 129, 109–127. [Google Scholar]
- Wang, Y.; Ziv, G.; Adami, M.; Almeida, C.A.; Antunes, J.F.G.; Coutinho, A.C.; Esquerdo, J.C.D.M.; Gomes, A.R.; Galbraith, D. Upturn in secondary forest clearing buffers primary forest loss in the Brazilian Amazon. Nat. Sustain. 2020, 3, 290–295. [Google Scholar] [CrossRef]
- Scaramuzza, C.A.M.; Sano, E.E.; Adami, M.; Bolfe, E.L.; Coutinho, A.C.; Esquerdo, J.C.; Maurano, L.E.; Narvaes, I.S.; Oliveira Filho, F.J.; Rosa, R.; et al. Land-use and land-cover mapping of the Brazilian Cerrado based mainly on Landsat-8 satellite images. Rev. Bras. Cartogr. 2017, 69, 1041–1051. [Google Scholar]


Publisher’s Note: MDPI stays neutral with regard to jurisdictional claims in published maps and institutional affiliations. |
© 2021 by the authors. Licensee MDPI, Basel, Switzerland. This article is an open access article distributed under the terms and conditions of the Creative Commons Attribution (CC BY) license (http://creativecommons.org/licenses/by/4.0/).