Article

Water Vapor Retrievals from Spectral Direct Irradiance Measured with an EKO MS-711 Spectroradiometer—Intercomparison with Other Techniques

1
Atmospheric Optics Group of Valladolid University (GOA–UVA), Valladolid University, 47001 Valladolid, Spain
2
Izaña Atmospheric Research Center (IARC), State Meteorological Agency of Spain (AEMET), 38001 Santa Cruz de Tenerife, Spain
3
Cimel Electronique, 75011 Paris, France
4
EKO INSTRUMENTS Europe B.V., 2521 The Hague, The Netherlands
5
Karlsruhe Institute of Technology (KIT), Institute of Meteorology and Climate Research (IMK-ASF), 76344 Karlsruhe, Germany
*
Author to whom correspondence should be addressed.
Remote Sens. 2021, 13(3), 350; https://doi.org/10.3390/rs13030350
Submission received: 16 December 2020 / Revised: 12 January 2021 / Accepted: 19 January 2021 / Published: 20 January 2021
(This article belongs to the Section Atmospheric Remote Sensing)

Abstract

:
Precipitable water vapor retrievals are of major importance for assessing and understanding atmospheric radiative balance and solar radiation resources. On that basis, this study presents the first PWV values measured with a novel EKO MS-711 grating spectroradiometer from direct normal irradiance in the spectral range between 930 and 960 nm at the Izaña Observatory (IZO, Spain) between April and December 2019. The expanded uncertainty of PWV (U P W V ) was theoretically evaluated using the Monte-Carlo method, obtaining an averaged value of 0.37 ± 0.11 mm. The estimated uncertainty presents a clear dependence on PWV. For PWV ≤ 5 mm (62% of the data), the mean U P W V is 0.31 ± 0.07 mm, while for PWV > 5 mm (38% of the data) is 0.47 ± 0.08 mm. In addition, the EKO PWV retrievals were comprehensively compared against the PWV measurements from several reference techniques available at IZO, including meteorological radiosondes, Global Navigation Satellite System (GNSS), CIMEL-AERONET sun photometer and Fourier Transform Infrared spectrometry (FTIR). The EKO PWV values closely align with the above mentioned different techniques, providing a mean bias and standard deviation of −0.30 ± 0.89 mm, 0.02 ± 0.68 mm, −0.57 ± 0.68 mm, and 0.33 ± 0.59 mm, with respect to the RS92, GNSS, FTIR and CIMEL-AERONET, respectively. According to the theoretical analysis, MB decreases when comparing values for PWV > 5 mm, leading to a PWV MB between −0.45 mm (EKO vs. FTIR), and 0.11 mm (EKO vs. CIMEL-AERONET). These results confirm that the EKO MS-711 spectroradiometer is precise enough to provide reliable PWV data on a routine basis and, as a result, can complement existing ground-based PWV observations. The implementation of PWV measurements in a spectroradiometer increases the capabilities of these types of instruments to simultaneously obtain key parameters used in certain applications such as monitoring solar power plants performance.

Graphical Abstract

1. Introduction

In recent decades, greenhouse gases (GHG) have become of major interest as main drivers of climate change [1]. The most important GHG is water vapor, since it efficiently interacts with both solar and terrestrial radiation, and its concentration in the atmosphere is driven by temperature, with a strong positive feedback in the Earth’s climate system [1]. Hence, it has been defined as an “essential climate variable” by the World Meteorological Organization (WMO) Global Climate Observing System (GCOS) program [2], with its observation being critical for characterizing the Earth’s climate system and its changes. Spatial and temporal changes in the distribution of the water vapor content have been pointed out as an indicator of climate change [3]. An increase in the tropospheric content of water vapor has been reported [4].
Apart from its key role in climate change, water vapor is involved in many other processes in the atmosphere; e.g., the Earth’s energy budget, the hydrological cycle, and in cloud and aerosol formation [5]. In addition, water vapor is one of the greatest sources of error in space-based remote sensing and communications, leading to errors in satellite pointing and attenuation on their signals [6]. In this context, precise measurements atmospheric water vapor content measurements with high temporal frequency and spatial resolution are mandatory.
To quantify the atmospheric water vapor content, the integrated precipitable water vapor (PWV) is widely used, which is defined as the total amount of water vapor present in a vertical atmospheric column from the observation site up to the top of atmosphere. The techniques to measure the PWV are very diverse and include airborne, space, and ground-based instruments using different approaches (passive or active sensors, different spectral regions or observation geometries). Focusing on ground-based measurement techniques, meteorological radiosondes provide precise humidity vertical profiles, and then obtaining integrated PWV values that have the disadvantage of corresponding to a relatively long time interval (60–90 min). Moreover, the number of PWV observations obtained each day with this technique is relatively low, since although there are 1300 stations spread all over the world (https://www.wmo.int/pages/prog/www/OSY/Gos-components.html#upper; last access 1 December 2020), only one or two launches are made at these stations per day (most of them only one), and the cost of each sounding is relatively high. Very accurate PWV values are retrieved from microwave radiometer profilers (MWP), which measure the radiation emitted by the atmosphere in the microwave spectral range. They have the advantage of measuring under any weather condition [7], but the inconvenient of its high cost and maintenance requirements. A less precise approach, but allowing PWV data to be provided under any condition as well, is the use of the Global Navigation Satellite System (GNSS) satellites to retrieve the water vapor content by means of the delay suffered by the signal received at the ground-receptors. By means of a post-processing procedure, it is possible to convert this delay in PWV, allowing a very high spatial coverage and temporal frequency [8].
Solar radiation measurements have been successfully used for the monitoring of the Earth’s gaseous composition since last century. Among existing solar measurement techniques, sun photometry is a well-developed tool for water vapor observations (e.g., [9,10,11,12,13,14,15,16,17,18] and references therein). Presently, the filter radiometers (Sun and Lunar photometers) initially devised to measure aerosols, may provide PWV retrievals by measuring the direct sunlight in spectral channels centered in the water vapor absorption bands, usually at 719, 817 and 946 nm [19]. The benefits of sun photometers (lower cost compared with other instruments and easy installation) lead them to be chosen as reference instruments to establish several worldwide networks: AErosol RObotic NETwork (AERONET; [20,21]), Global Atmospheric Watching Precision Filter Radiometer network (GAW-PFR; [22]) and Skynet Radiometers network (SKYNET; [23,24]).
More sophisticated PWV solar devices are spectrometers operating in the infrared domain such as those based on the Fourier Transform Infrared (FTIR) technique, which provide precise water vapor profiles and integrated PWV amounts by analyzing the measured high-resolution solar absorption spectra (e.g., [25,26,27]). In the visible and near infrared spectral range, PWV data can be also retrieved from direct irradiance measured by spectroradiometers, but the works on this matter are scarce (e.g., [28,29,30]). The first studies date from the beginning of the 20th century when a method to derive the PWV by spectroscopy was described [31] and later applied at Mount Wilson, California to retrieve the PWV [32]. Since then, several retrieval methodologies have been proposed to retrieve PWV from solar absorption spectra, including monochromatic approaches, spectral windows, differential optical absorption spectroscopy (DOAS), and iterative nonlinear fitting models (e.g., [10,11,12,13,29,30]).
Given the diversity of measurement techniques and approaches available in the literature, numerous comparison studies have been carried out in the last decades (e.g., [12,13,14,18,25,33,34,35]). These studies show differences ranging between 0.40% and −25.4%. A summary of the PWV intercomparison results obtained in this study is shown in Section 6.
The main advantage of a spectroradiometer is that, with a single instrument, a set of parameters can be accurately measured (spectral irradiance, integrated irradiance, aerosol optical depth, irradiance attenuation by clouds, and PWV) which are key input parameters of certain applications, such as determining the performance of solar plants. In this context, this paper presents for the first time the PWV retrievals of a novel grating spectroradiometer, the EKO MS-711. The PWV data were determined from the spectral direct normal irradiance (DNI) measurements in the spectral range between 930 and 960 nm taken at the Izaña Observatory (IZO). The quality assessment of the new EKO PWV retrievals was carried out using the Monte-Carlo method and was complemented with the comparison to reference techniques available at IZO between 1 April and 31 December 2019: radiosonde, GNSS, CIMEL-AERONET sun photometer and FTIR. The work is divided in 7 sections: Section 3 describes the main characteristics of the Izaña station, and the instruments and techniques used in this work. Section 4 and Section 5 details the approach used to determine PWV and its associated uncertainty estimated from Monte-Carlo method, respectively, while Section 6 shows the comparison to the reference PWV observations. Finally, a summary and the main conclusions are given in Section 7.

2. Site Description

The observations used in this work were performed at the Izaña Observatory (IZO) that is part of the Izaña Atmospheric Research Center (IARC) from the State Meteorological Agency of Spain (AEMET). This sub-tropical observatory is located on Tenerife island (The Canary Islands, Spain; 28.3 ° N, 16.5 ° W) at 2373 m a.s.l.
In 1984, the observatory became a station of the World Meteorological Organization (WMO) Background Atmospheric Pollution Monitoring Network (BAPMoN), and since 1989 it has been operating as a Global Atmosphere Watch (GAW) station. Furthermore, IZO has also contributed to different international networks such as: the Network for the Detection of Atmospheric Composition Change (NDAAC) since 1999, Total Carbon Column Observing Network (TCCON) since 2007, Aerosol RObotic NETwork (AERONET) since 2003, and Baseline Surface Radiation Network (BSRN) since 2009. Moreover, in 2014, IZO was designated by WMO as a CIMO (Commission for Instruments and Methods of Observation) test bed for aerosols and water vapor remote sensing instruments [36]. More details of the station and the measurement programs can be found in [37].
Given the altitude and location of the IZO, it is normally above a temperature inversion layer, avoiding possible mixture processes with local pollution from low levels of the island. Consequently, if offers excellent conditions to perform in situ and remote sensing atmospheric measurements of aerosols and trace gases under free troposphere conditions. With respect PWV, IZO is characterized by very dry conditions. Ref. [35] studied the TCCON FTIR and CIMEL-AERONET PWV time series between 2007 and 2019 at IZO, observing that the wettest months occur in summer (maximum PWV in August) and the driest months correspond to winter (minimum PWV in February), with a total average PWV of 4.8 ± 2.8 mm from TCCON FTIR, and 3.8 ± 1.4 mm from CIMEL-AERONET.

3. Materials and Methods

3.1. EKO MS-711 Spectroradiometer

Within the framework of the Izaña Observatory WMO–CIMO testbed activities, an EKO MS-711 grating spectroradiometer was deployed and set in a DNI measurement mode. The MS-711 spectroradiometer model was originally devised to measure global solar spectral radiation. By attaching a collimation tube to the sensor head, the instrument Field of View (FOV) can be narrowed to a 5 ° , and, when assembled on a solar tracker, it can measure the spectral DNI. The instrument measures in the 300–1100 nm spectral range with a bin width of 0.4 nm and a bandpass of nominally <7 nm (defined as the full width at half maximum (FWHM)) [38,39]. The instrument was installed on an EKO sun-tracker STR-21G-S2. With this configuration, the solar DNI spectrum is sampled with a temporal resolution of 1 min, with the integration time of each measurement varying between 10 ms to 5 s, depending on the light intensity. For more details refer to [40].

3.2. Ancillary Instrumentation
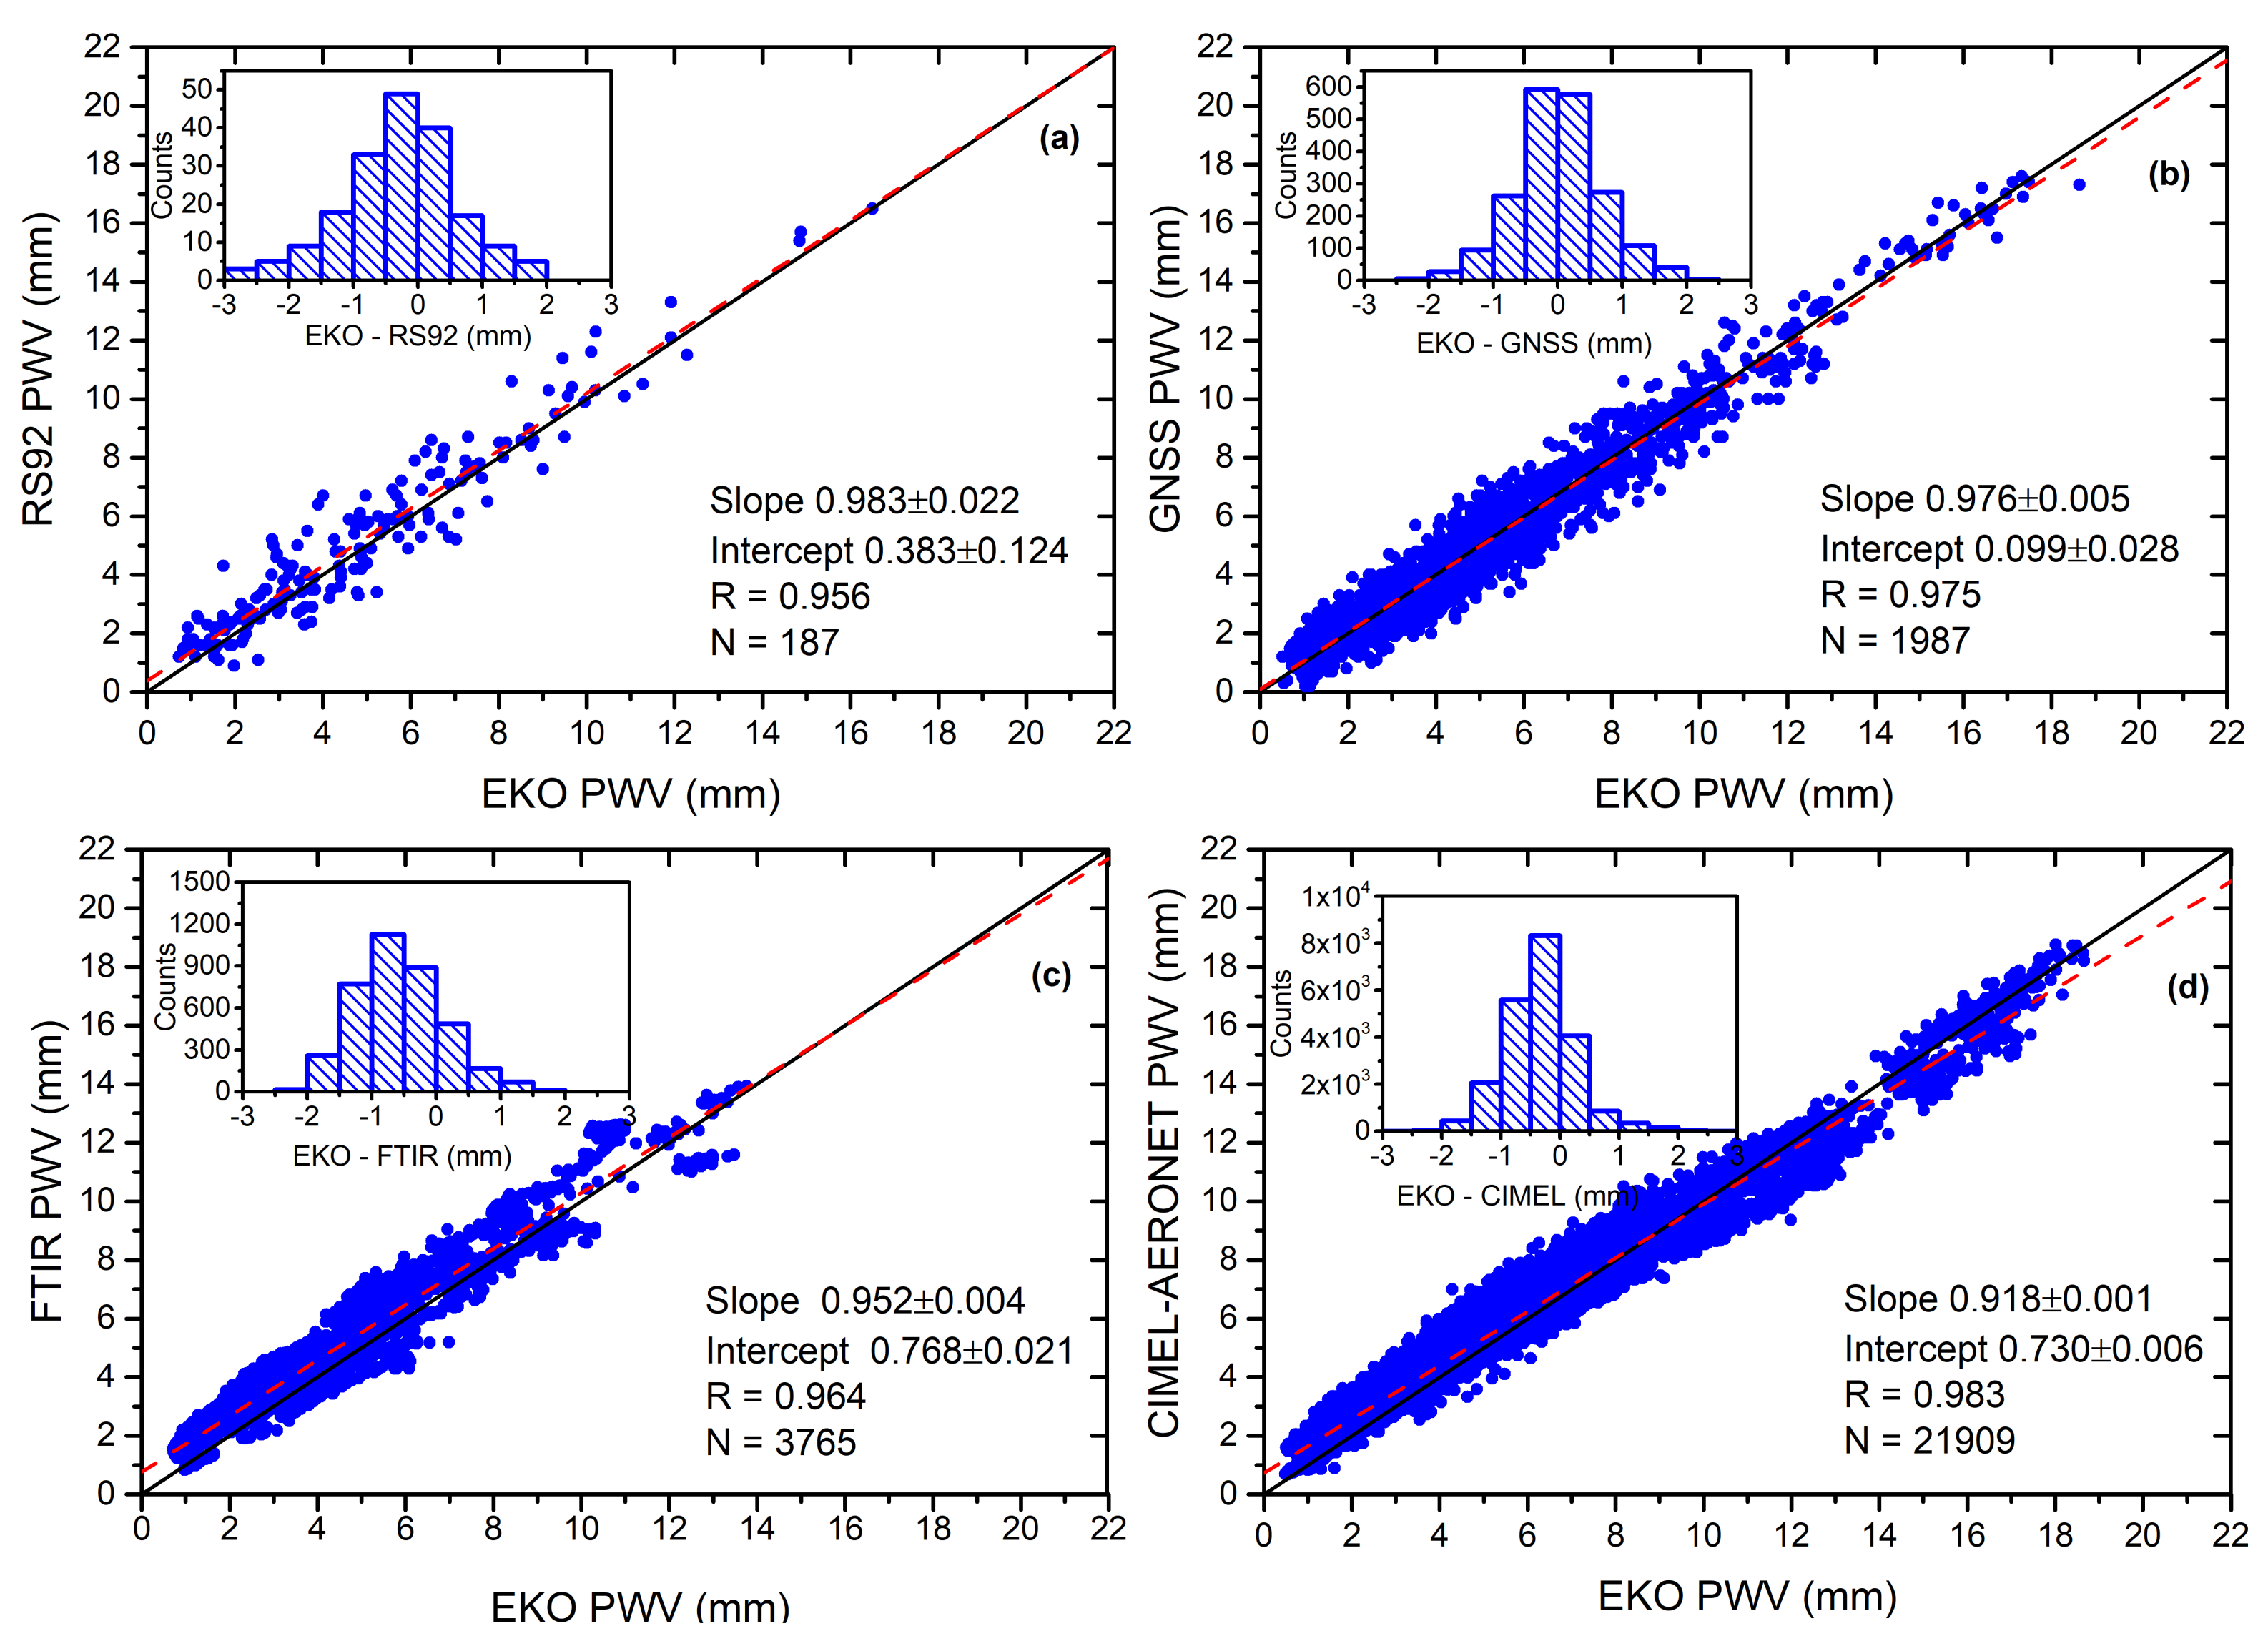
  • Meteorological Radiosonde (RS92)
    Since June 2005, meteorological radiosondes are routinely launched twice daily, at ∼ 11:15 and ∼ 23:15 UTC at the Güimar station (28.32°N, 16.38°W, 105 m a.s.l.) situated at the coastline, approximately 15 km to the southeast of IZO at Tenerife island. This station is part of the Global Climate Observing System (GCOS)–Upper-Air Network (GUAN) (WMO GRUAN station #60018). Since 2008 the Vaisala RS-92 radiosondes corresponding to 12 UTC (hereafter, RS92) have been used.
    The PWV content in the atmosphere column is determined from the measured vertical profiles of temperature, relative humidity and atmospheric pressure acquired with the meteorological radiosondes [6]. The obtained PWV values have been post-corrected for radiation dependence (daytime radiosondes) and temperature following et al. [41]. The precision is 5% for total column water vapor in the lower and middle troposphere, increasing to between 10% and 20% in the upper troposphere for very dry conditions [6,25].
  • Global Navigation Satellite System (GNSS)
    Using GNSS receivers, it is possible to determine the PWV content due to the delay of the signal caused by water vapor molecules [8,42]. The principle of the PWV retrieval lies in the decomposition of the indicated signal delay received from the GNSS receivers in components such as the ionosphere, the clock, the geometric and the neutral atmosphere’s delays. Ref. [8] developed the technique to evaluate the atmospheric delay caused by refractivity effects, which occurs mainly in the troposphere, and split it into two components, the zenith hydrostatic delay (ZHD) and the zenith wet delay (ZWD). The ZHD is caused by dry air plus the non-dipole contribution of water vapor and can be accurately modelled from the surface pressure, altitude and latitude [8]. The PWV is calculated from the ZWD by the knowledge of a weighted mean temperature of the atmosphere, as defined in [8].
    In this work, PWV retrievals from a Leica GRX 1200GG pro GPS/GLONASS receiver, installed at IZO since 2008, have been used. This receiver belongs to the Spanish National Geographic Institute (IGN), and forms part of the Network of European Meteorological Services (EUMETNET) GPS water vapor program (EGVAP) [43]. The GNSS PWV retrievals came from precise orbits and are available every hour (GNSS-P; [41]). Their expected precision is of 20% for PWV < 3.5 mm and about 10% above this value [25].
  • CIMEL Sun Photometer
    Since 2003, IZO has formed part of AERONET that is a federation of ground-based remote sensing aerosol networks [20]. The reference instrument of AERONET is the CIMEL Electronique CE318-T multiband sun photometer [44] that performs measurements of spectral sun and moon irradiance and sky radiances, at 340, 380, 440, 500, 675, 870 and 1020 nm with a FOV of 1.3 ° [45]. An additional channel centered at 940 nm (with a FWHM of 10 nm) is used to retrieve PWV, following the procedure described in [21], with an uncertainty of 10%. Ref. [25] found that the uncertainty for this instrument depends on humidity conditions, with 7% for humid conditions and 25% for very dry conditions (PWV ≤ 2 mm). In this work, we use AERONET Version 3.0 Level 1.5 data (http://aeronet.gsfc.nasa.gov, last access: 10 December 2020).
  • FTIR
    Within the IZO’s atmospheric research activities, the FTIR solar measurements started in 1999 in the framework of a collaboration between the AEMET and the KIT (Karlsruhe Institute of Technology) [46], contributing to NDACC and TCCON networks since 1999 and 2007, respectively.
    In this work, the FTIR PWV data retrieved within the TCCON activities are used [47]. These data are derived with the 2014 version of the GGG processing software [26] by analyzing direct solar absorption spectra measured between 4500 and 6500 cm 1 (corresponding to wavelengths λ between 1500 and 2200 nm) at a spectral resolution of 0.02 cm 1 . The latter represents a resolution power λ / Δ λ at 5000 cm 1 of about 2.5 × 10 5 [25]. The aperture diameter is limited to 0.5 mm, leading to a narrow spectrometer’s FOV angle of only 0.07°. Several scans are co-added to increase the signal-to-noise ratio and, thus, the sampling frequency of TCCON FTIR PWV data is about 2 min at IZO. Using collocated meteorological radiosoundings at globally distributed TCCON sites, a scale factor of 1.0180 ± 0.0040 has been determined for the TCCON FTIR water vapor columnar products (XH 2 O) [26].
    Recently, at IZO, Ref. [35] further studies corroborated these results, obtaining a mean bias of −0.006 mm (−1.3%) when comparing TCCON FTIR PWV values to those obtained from meteorological radiosondes launched on Tenerife island and processed according to the GRUAN scheme (http://www.gruan.org, last access: 28 November 2020). The Almansa’s study also found a relative difference of +3.4% respect to collocated CIMEL-AERONET data (FTIR-CIMEL). Further details of the FTIR program at IZO are given [25,37,46].

4. PWV Retrieval Method

The basis of the methodology used in this work lies in the Beer-Lambert-Bouguer law [33,48]. In spectral regions of strong variation of the spectral molecular absorption, as the water vapor absorption band, this law can be modified as follows:
D N I ( λ ) = D N I o ( λ ) e τ ( λ ) m T w ( λ )
where DNI( λ ) is the direct normal irradiance at wavelength λ measured by the spectroradiometer, D N I o ( λ ) is the top of atmosphere irradiance corrected for the Sun-Earth distance, τ ( λ ) is the optical depth, m is the optical air mass and T w ( λ ) is the water vapor transmittance. Considering that the most important components for τ ( λ ) in the considered absorption band are the Rayleigh optical depth and the aerosols (Figure 1), this equation can be written as follows:
D N I ( λ ) = D N I o ( λ ) e [ τ R ( λ ) m R τ a ( λ ) m a ] T w ( λ )
where τ R ( λ ) is the molecular Rayleigh scattering [49] that depends on the station pressure, m R is the Rayleigh air mass calculated to according to [50], τ a ( λ ) is the extinction aerosol optical depth (AOD) and m a is the aerosol air mass calculated according to [51].
The dependence of T w ( λ ) with PWV was studied by [10,52], obtaining the following dependence:
T w ( λ ) = e a ( m w P W V ) b
where m w is the water vapor air mass that is approximately equal to m a , PWV is the columnar water vapor content, and a and b are constants. Ref. [12] found that these constants depend on wavelength position, the shape and width of the filter functions, the atmospheric pressure and temperature at the station as well as the vertical distribution of water vapor. Substituting Equations (2) and (3) into Equation (1), we obtain the following expression:
D N I ( λ ) = D N I o ( λ ) e [ τ R ( λ ) m R τ a ( λ ) m a ] e a ( m w P W V ) b
Therefore, the PWV can be determined from the following equation:
P W V = 1 m w [ 1 a [ l n D N I o ( λ ) D N I ( λ ) ) τ R ( λ ) m R τ a ( λ ) m a ] ] 1 b
The PWV has been determined in the spectral range between 930 and 960 nm (Figure 1), considering the integrated band, with a modification of Equation (3), as follows:
T w ( Δ λ ) = λ 1 λ 2 1 D N I o ( λ ) [ D N I ( λ ) e τ R ( λ ) m R + τ a ( λ ) m a ] d λ Δ λ
where Δ λ = λ 2 λ 1 : λ 1 and λ 2 are the wavelength limits (930 and 960 nm, respectively).
In preliminary analysis of this study, the approach of [30] was used, obtaining PWV retrievals very similar (not shown here) to those obtained with the approximation indicated below. Since the moderate resolution of the EKO MS-711 spectroradiometer (10 nm) in the spectral range in which the PWV is retrieved, we decided to choose a more robust method in which the whole spectral range in which the water vapor absorbs significantly is used, to minimize the signal-to-noise ratio.
The PWV can be derived from as follows:
P W V ( Δ λ ) = 1 m w [ 1 a l n [ λ 1 λ 2 1 D N I ( λ ) [ D N I o ( λ ) τ R ( λ ) m R τ a ( λ ) m a ] d λ Δ λ ] ] 1 b
The coefficients a and b have been determined from Equation (3) by a fitting plot in logarithm scale of the l n ( l n ( 1 / T w ( Δ λ ) ) ) against l n ( m w P W V ) resulting in a line with the slope equals to b, and the intercept equals to ln(a) [10] (Figure 2). To do so, the T w ( Δ λ ) has been simulated using the MODTRAN 6 model [53] multiple runs varying the solar zenith angle (SZA) between 0° and 90° with steps of 1° and water vapor from 0 to 40 mm with steps of 2 mm steps at the site altitude of 2373 m a.s.l., and considering the standard midlatitude summer atmosphere model [54]. The modelled spectra were convolved with the slit function of the EKO MS-711.
D N I o ( λ ) was determined using the modified Langley-plot technique [14,40] for each wavelength between 930 and 960 nm (Figure 2). The τ a ( λ ) has been determined from the DNI measurements performed with the EKO MS-711 following the methodology described in [40]. In that work the AOD values were evaluated at the 340, 380, 440, 500, 675 and 870 nm wavelengths, thus the spectral AOD between 930 and 960 nm has been derived by applying the Ångström formula [55]. It is important to note that the FOV of the EKO spectroradiometer is 5°, whereby the AOD retrievals have been post-corrected of circumsolar radiation following the procedure presented in [40]. The effect of the large EKO MS-711 FOV on the measured solar absorption spectra was studied in [40] by the circumsolar ratio (CR) defined as:
C R ( % ) = C S R D N I S U N + C S R 100
where C S R is the circumsolar radiation coming from within the instrument FOV, and D N I S U N is the direct normal irradiance coming from the Sun disc. The CR definition allow us to provide the relation between the D N I S U N and the D N I measured with the EKO:
D N I S U N = D N I ( 100 C R ( % ) )
To study the possible effect of the EKO FOV on the PWV retrievals, D N I S U N and CSR have been simulated varying the PWV between 0 and 20 mm for AOD of 0.05, 0.10 and 0.20 in the spectral range between 930 and 960 nm. The simulations were done by using the LibRadtran model [56,57], following the procedure explained in [40]. The results are shown in Figure 3 for a SZA of 30°. As can be seen in the figure, CR is under 0.8% for all the simulations done, independently of the wavelength, AOD or PWV values. The Figure 3 also points out that the most influent parameter on the CR is the AOD, as in [40]. However, for the AOD values typically found at IZO (0.05 and even lower) [37], the CR impact drops to less than 0.2%. Finally, the PWV content has no appreciable effect on the CR and, therefore, no corrections due to FOV impact on the DNI measurements have been applied on the EKO PWV retrievals.

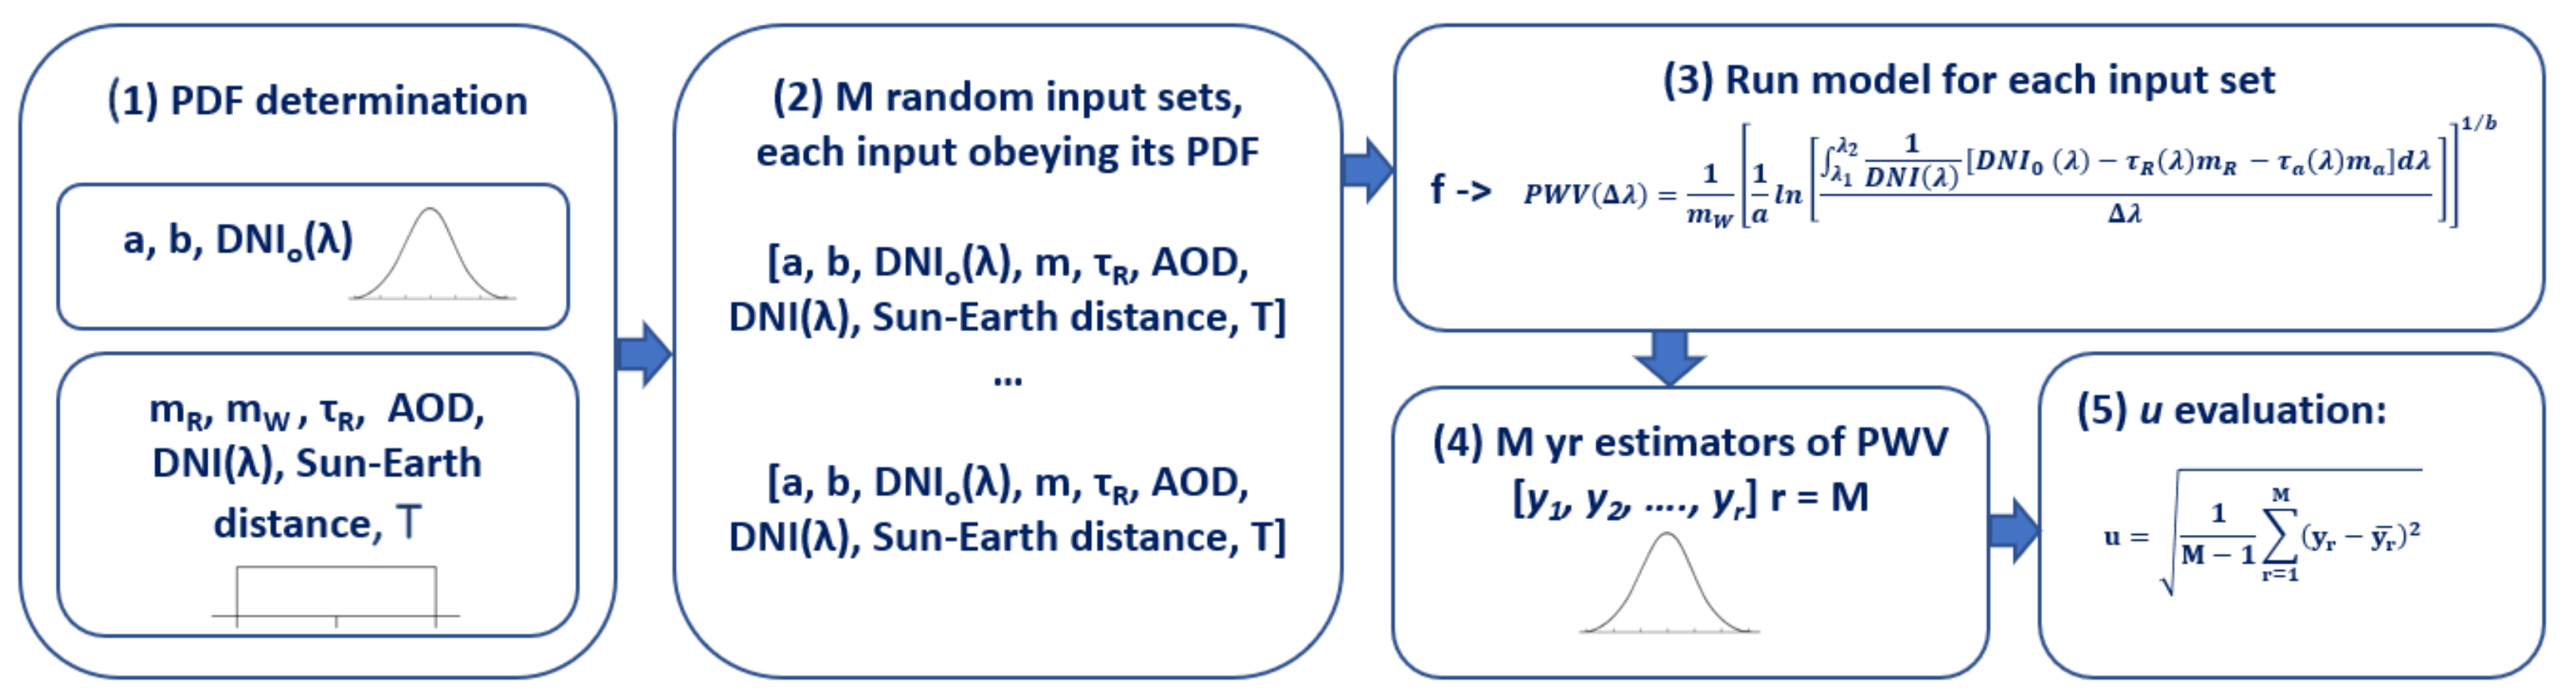
5. PWV Uncertainty Analysis

This section presents the uncertainty estimation of the EKO PWV retrievals due to the propagation of uncertainties associated with the parameters and measurements involved in the PWV retrieval presented in the previous section. To do so, the standard and internationally recognized methods proposed by the BIPM (Bureau International des Poids et Mesures), as the so-called GUM guides (Guide to the Expression of Uncertainty in Measurement, [58,59,60,61]) have been followed to evaluate the uncertainty. In particular, we have adopted the widely used Monte-Carlo method (MCM), as explained in [59], and only a short outline with the most important concepts used in this procedure is given in this paper. Refer to the cited guides for a detailed description.
The associated uncertainty of a measure or variable X is stated by a distribution function, determining the probability that its value is less than or equal to any value x. The derivative of this distribution function is the probability density function (PDF), which provides the probability element, i.e., the probability that x < X < x + dx [58]. In this work we are assuming that all variables considered in the analysis are uncorrelated and for all the measured ones the uncertainty is of type-B ([58], 4.3). This implies the available information about their uncertainties is only a bound p such that the probability of the value X to be in the range [X − p, X + p] is one, and zero out of this interval ([59], 4.3.7), defining therefore a rectangular PDF distribution.
Considering a model f (e.g., an equation) such that for input parameters X an output variable Y can be obtained, in the MCM, M random input values are assigned to the inputs X, obeying the distribution defined by their PDF, and therefore obtaining M output estimators of Y (y r ) through the model f. Thus, in summary, the MCM propagates the input PDFs to obtain a discrete representation of the output PDF. The latter can be characterized by the standard uncertainty (u, [58], 7), which is the uncertainty of a measurement expressed as a standard deviation, estimated by the following expression:
u = 1 M 1 r = 1 M ( y r y r ¯ ) 2
The number of runs (M) depends on the level of confidence desired for the uncertainty of Y. In the GUM framework, this coverage probability represents the probability that the value of Y is within a range of values with a stated probability. In the MCM, it is equivalent to the expanded uncertainty in the propagation of uncertainties obtained by the way defined in [58]. In the current work M has been set equal to 10 6 to reach a 95% of coverage probability or level of confidence ([59], 7.2). The Python module MetroloPy (https://pypi.org/project/metrolopy/; last access: 16 October 2020) has been used to perform the MCM calculations.
To estimate the standard uncertainty of PWV amounts, the MCM has been applied considering that our model f is given by Equation (7), where the input parameters (X) considered are listed in Table 1. This table also displays the uncertainty values used, their references, and the PDF assigned to each of them. Please note that previously the MCM has been also used to evaluate the uncertainty associated with the coefficients a and b by using Equation (3), and the D N I o ( λ ) by considering the Modified Langley-Plot technique, since no information about their uncertainty were available. The PDFs for a, b and D N I o ( λ ) have been assumed as normal distributions, once evaluated with the MCM, while the rest of the variables as rectangular distributions since they are obtained from references.
The MCM PDFs obtained for the input variables a, b, and D N I o ( λ ) fits very well to normal distributions, which was corroborated by applying the Anderson-Darling test [64]. In this test, the data sample is tested against a specific distribution (normal, lognormal, etc.), being its null hypothesis that the sample follows the distribution. This test was also applied also to the MCM results of each PWV retrieval, obtaining a high agreement of the PDF to a normal distribution.
This fact allows us to associate an expanded uncertainty (U P W V ) to each PWV retrieval as two times the standard uncertainty (u) obtained from the MCM application. It is important to ensure these preliminary assumptions since if the PDF of the MCM result for each retrieval were not close to the normal distribution, large differences could be introduced in the estimated MCM coverage interval (JCGM [59], 5.11.6.d and 9.2.4).
Once the PDFs for the input parameters are stated Equation (7) is run M times obtaining M estimators of each PWV. After sorting in ascending order ([60], 7) and applying Equation (10) to these M estimators, the standard uncertainty and the coverage interval are obtained. The Figure 4 shows a schema of the PVW standard uncertainty determination.
The temporal evolution of the EKO PWV amounts between April and December 2019 and the relative U P W V is shown in Figure 5. The relative U P W V ranges between about 3% (0.13 mm) and 34% (0.81 mm) with a mean and standard deviation of 9.8 ± 4.1% (0.37 ± 0.11 mm), respectively. From this figure the dependence of the U P W V on the PWV content (Figure 6) becomes evident: higher PWV amounts provide lower relative U P W V values. For PWV ≤ 5 mm (62% of the data), the mean of the U P W V is 11.9 ± 3.9% (0.31 ± 0.07 mm), while for PWV> 5 mm (38% of the data) is 6.5 ± 1.1% (0.47 ± 0.08 mm). Also, U P W V shows a strong dependence with AOD (Figure 6), again the higher AOD values lead to lower relative U P W V . For AOD ≤ 0.10 (95% of the data), the mean of U P W V is 10.1 ± 4.1% and for AOD > 0.10 (5% of the data) the mean decreases until 5.9 ± 1.4%.
Please note that the highest uncertainties in PWV are obtained under pristine conditions (AOD < 0.03). For hazy conditions (AOD > 0.1), always caused by the presence of Saharan dust at the Izaña Observatory, the uncertainty in PWV is within 10%. The explanation for these results is found in the fact that the observations of PWV and mineral dust are not independent. The Saharan dust-laden air masses (higher values of AOD) are also associated with higher PWV compared to pristine free troposphere conditions [65,66,67] in which the observed PWV (≤ 2 mm) is close to the instrumental detection limit. Therefore, the percentage uncertainty of PWV under moderate-high AOD is much lower than that obtained in extremely dry conditions.
The MCM analysis allows the relative contribution of each uncertainty source to be determined and, therefore, the potential improvements to be identified. The most important contributors to the uncertainty are the DNI and AOD, with a mean contribution of 49% and 42%, respectively. The DNI o ( λ ) contributes a mean of 9.2% and the input of the rest of parameters is less than 0.01%. Therefore, more precise direct solar measurements and AOD estimations, will yield more precise EKO retrievals.

6. Results: Comparison to PWV Observations

In this section, we present the comparison between the EKO PWV retrievals determined in the spectral range between 930 and 960 nm and other techniques available (RS92, GNSS, CIMEL-AERONET and FTIR) at Izaña Observatory between April and December 2019.
The comparisons were done considering the different temporal resolution of each technique available at IZO. To avoid redundant data, each EKO measurement is only paired once to the reference observations, considering the closest measurement in time for each temporal window. For RS92, as the reference time, we choose the time at a half of the observation (a sonde takes approximately one hour between its launch and its burst in the upper troposphere-lower stratosphere). Therefore, we have taken the EKO PWV values 30 min after the launch time, which is the expected time for the radiosonde to reach the IZO altitude (2.4 km) [25]. The GNSS PWV values have a temporal frequency of 1 h, thereby the closest GNSS record within 5 min around each EKO measurement have been paired. Finally, for FTIR and CIMEL-AERONET the temporal window was reduced to 2 min around each EKO measurement. This approach produced quasi-synchronous and non-duplicated comparison sets of 187 data for RS92/EKO, 1987 data for GNSS/EKO, 3765 data for FTIR/EKO and 21,909 data for CIMEL-AERONET/EKO. Figure 7 summarizes the comparison of the paired PWV observations.
To quantify the difference of the EKO PWV respect to the PWV of different techniques, we have calculated the PWV bias (EKO – XXX, in mm) and relative PWV differences ((EKO – XXX)/XXX), in %). As a summary, Table 2 lists the metrics considered to quantify the differences, for which the following expressions were used:
M B = 1 n i ( E K O i X X X i )
R M S E = 1 n i ( E K O i X X X i ) 2
where XXX represents the PWV of the reference techniques RS92, GNSS, FTIR and CIMEL-AERONET.
The comparisons show a good agreement between EKO PWV and the different techniques with Pearson correlation coefficients (R) higher than 0.950 (Table 2; Figure 7). The 86% of the differences between EKO and GNSS and CIMEL-AERONET PWVs are within the range ±1 mm (Figure 7), decreasing to 75% and 70%, for RS92 and FTIR, respectively.
The smallest differences respect to EKO PWV are obtained for the CIMEL-AERONET PWV with a RMSE, STD and R of 0.67 mm (12.8%), 0.59 mm (13.6%) and 0.983, respectively, while the greatest differences are found respect to RS92 PWV with a RMSE, STD and R of 0.94 mm (18.5%), 0.89 mm (25.3%) and 0.956, respectively. However, it should be noted that the best slope obtained (Figure 7) corresponds to the fit between RS92 versus EKO PWV with a value of 0.983. The difference is low between EKO PWV and CIMEL-AERONET PWV because both instruments measure directly the sunlight and the technique applied in both instruments is similar to determine the PWV, while that the RS92 is an in situ technique and therefore air mass differences may result [25].
It is important to note that the number of paired EKO/CIMEL-AERONET PWV measurements (N 21909) is much higher than for the rest of the techniques. On the other hand, when analyzing the bias among techniques, the least differences are found respect to GNSS PWV with MB of 0.02 (3.3%), while the largest differences are respect to CIMEL-AERONET and FTIR PWV with MB of 0.33 mm (9.5%) and −0.57 mm (14.5%), respectively. These systematic differences can be attributed the possible calibration inaccuracy of the AERONET PWV product [35], while the differences found respect to FTIR PWV are likely due to spectroscopy inconsistences between the different spectral ranges in which the PWV is determined (930–960 nm for EKO PWV and 1500–2200 nm for FTIR PWV). The bias found respect to different techniques are within the uncertainty determined with the Monte-Carlo method (Section 5) with values ranging between 0.13 and 0.81 mm.
The PWV relative differences are found to be dependent on the PWV content, such that they considerably decrease when comparing EKO PWV values higher than 5 mm (Table 2).
Under wettest conditions (PWV > 5 mm), the systematic differences drop to −0.26 mm (−1.6%) between RS92 and EKO PWV, 0.08 mm (2.2%) between GNSS and EKO PWV, −0.45 mm (−4.9%) between FTIR and EKO PWV and 0.11 mm (1.9%) between CIMEL-AERONET and EKO PWV. Although the agreement improves the systematic differences, RMSE of 1.00 (12.2%) between RS92 and EKO PPWV, 0.79 mm (10.2%) between GPS and EKO PWV, 1.02 mm (13%) between FTIR and EKO PWV and 0.71 mm (8.9%) between CIMEL-AERONET and EKO PWV were obtained.
These results are within the same order of magnitude as those found by other authors at IZO (Table 3), i.e., ref. [25] found differences of −25.4 ± 12.7% between FTIR and CIMEL-AERONET PWV, −5.36 ± 19.5% between FTIR and GPS PWV, and −3.33 ± 15.5% between FTIR and RS92 PWV in the period 2005 and 2009. Ref. [34] compared the PWV obtained with Lunar CIMEL photometer at IZO between July and August 2011, and reported differences of 1.8 and 2.5 mm respect to GNSS and RS92 PWV, respectively. Ref. [35] found relative differences of 9.1% between FTIR and ZEN-R52 radiometer PWV and 17.1% between CIMEL-AERONET and ZEN PWV from August 2017 to June 2018. The results obtained in other PWV retrieval comparisons are also shown in Table 3, with similar differences than those obtained with the EKO MS-711.

7. Summary and Conclusions

In this study, we determined the first PWV retrievals performed with an EKO MS-711 grating spectroradiometer from normal direct irradiance in the spectral range between 930 and 960 nm at IZO, in the period April-December 2019 (Number of spectra: 30826). The EKO PWV was compared with PWV retrievals routinely obtained by four different techniques at IZO. The PWV values are in the 0.08–24.1 mm range, with most values (90% of data) below 8.6 mm.
The uncertainty estimation (U P W V ) of the EKO PWV retrievals was determined using the Monte-Carlo method, considering the propagation of uncertainties associated with the parameters and measurements involved in the PWV retrieval. The mean of UPWV is 0.37 ± 0.11 mm. The uncertainty presents a clear dependence with the PWV content. For PWV ≤ 5 mm (62% of the data), the mean is 0.31 mm, while for PWV > 5 mm (38% of the data) is 0.47 mm. These results are within the estimated range of precision established by different authors with other techniques.
The most important contributors to the PWV uncertainty are the DNI and AOD, with a mean contribution of 49% and 42%, respectively. The D N I o ( λ ) contributes a mean of 9.2% and m w with 0.013%. The rest of the parameters contribute less than 0.001%.
When comparing the EKO PWV with the rest of techniques available at IZO, our retrievals show a consistent agreement with them, with R > 0.950 for all comparisons. The smallest differences were obtained against the CIMEL-AERONET PWV with a RMSE and STD of 0.67 mm and 0.59 mm, respectively, while the most significant differences were found against the RS92 PWV with a RMSE and STD of 0.94 mm and 0.89 mm, respectively. Concerning the bias, we find the least differences between GNSS and EKO PWV with MB of 0.02, and the largest differences against CIMEL-AERONET and FTIR techniques with MB of 0.33 mm and −0.57 mm, respectively. These differences decrease considerably for atmosphere conditions with PWV ≥ 5 mm, obtaining MB values ranging from −0.45 mm (against FTIR PWV) to 0.11 mm (against CIMEL-AERONET PWV). These results confirm that the methodology applied in this work to obtain the PWV is consistent with the different techniques available at IZO, with at least the same order of error. This work, together with [40], demonstrate the capability of the EKO MS-711 spectroradiometer to provide high-quality AOD and PWV measurements, with excellent results when compared against well characterized instruments with established records for reliability. Considering that the EKO MS-711 spectroradiometer was designed for global spectral radiation measurements, it is remarkable that with a technical adaptation, accurate and satisfactory PWV results were possible on its D N I ( λ ) measurement configuration. The main advantage of a spectroradiometer is that with a single instrument, a set of parameters can be accurately measured (spectral irradiance, integrated irradiance, aerosol optical depth, irradiance attenuation by clouds, and PWV) which are key input parameters of certain applications, such as determining the performance of solar power plants.

Author Contributions

R.D.G., E.C. and O.E.G. have wrote the main part of the paper, R.D.G., E.C. V.E.C. and O.E.G. are designed the structure and methodology of the paper. R.D.G. computed all the calculations performed in the paper. R.D.G. and Á.B. discussed the methodology applied in this work. O.E.G., Á.B. and A.F.A. discussed the results and participated in the PWV retrievals. R.R. performed the maintenance and daily checks of the EKO MS-711 spectroradiometer. J.G. has provided the data of FTIR PWV, P.M.R.-C. has provided the PWV data from RS92 and GNSS techniques. M.P. and K.H. provided detailed technical information of the EKO MS-711 spectroradiometer. K.H. enabled the EKO MS-711 used in this study to be evaluated in the WMO–CIMO Izaña test bed by taking care of all the associated logistics. All authors discussed the results and contributed to the final paper. All authors have read and agreed to the published version of the manuscript.

Funding

This study has been performed thanks to regular funds from the State Meteorological Agency of Spain (AEMET) to the World Meteorological Organization (WMO) Commission for Instruments and Methods of Observations (CIMO) Izaña Testbed for Aerosols and Water Vapor Remote Sensing Instruments and the European Community Research Infrastructure Action under the FP7 ACTRIS grant, agreement no. 262254.

Institutional Review Board Statement

Not applicable for studies not involving human or animals.

Informed Consent Statement

Not applicable for studies not involving human.

Data Availability Statement

The EKO MS-711 data might be available upon request from EKO Instruments and Izaña WMO–CIMO test bed. The CIMEL-AERONET data from the Izaña Atmospheric Observatory (“Izana”) are available on the AERONET. The TCCON Izaña FTIR PWV data are available at TCCON Caltech DATA archive at https://data.caltech.edu. The GNSS and RS92 data used are available from the authors upon request.

Acknowledgments

This work has been developed within the framework of the activities of the World Meteorological Organization (WMO) Commission for Instruments and Methods of Observation (CIMO) Izaña test bed for aerosols and water vapor remote sensing instruments. The authors are grateful to EKO Instruments for its availability that the EKO-MS711 spectroradiometer has been tested and evaluated independently by the WMO–CIMO Izaña testbed. The LibRadtran Radiative Transfer Model has been used to estimate the circumsolar radiation. AERONET sun photometers at Izaña have been calibrated within the AERONET Europe TNA, supported by the European Community Research Infrastructure Action under the FP7 ACTRIS grant, agreement no. 262254. The Izaña FTIR station and their observations have been supported by the German Bundesministerium für Wirtschaft und Energie (BMWi) via DLR under grants 50EE1711A-B&D, and by the Ministerio de Economía y Competitividad from Spain through the project INMENSE (CGL2016-80688-P).

Conflicts of Interest

The authors declare no conflict of interest.

References

  1. IPCC. The Physical Science Basis; Intergovernmental Panel on Climate Change: Genève, Switzerland, 2013. [Google Scholar]
  2. Bojinski, S.; Verstraete, M.; Peterson, T.C.; Richter, C.; Simmons, A.; Zemp, M. The concept of essential climate variables in support of climate research, applications, and policy. Bull. Am. Meteorol. Soc. 2014, 95, 1431–1443. [Google Scholar] [CrossRef]
  3. Cubasch, U.; Wuebbles, D.; Chen, D.; Facchini, M.C.; Frame, D.; Mahowald, N.; Winther, J.G. Introduction. In Climate Change 2013: The Physical Science Basis. Contribution of Working Group I to the Fifth Assessment Report of the Intergovernmental Panel on Climate Change; Cambridge University Press: Cambridge, UK, 2013. [Google Scholar]
  4. Hartmann, D.L.; Tank, A.M.K.; Rusticucci, M.; Alexander, L.V.; Brönnimann, S.; Charabi, Y.A.R.; Dentener, F.J.; Dlugokencky, E.J.; Easterling, D.R.; Kaplan, A.; et al. Observations: atmosphere and surface. In Climate Change 2013 the Physical Science Basis: Working Group I Contribution to the Fifth Assessment Report of the Intergovernmental Panel on Climate Change; Cambridge University Press: Cambridge, UK, 2013. [Google Scholar]
  5. Trenberth, K.E.; Stepaniak, D.P. The flow of energy through the earth’s climate system. Q. J. R. Meteorol. Soc. 2004, 130, 2677–2701. [Google Scholar] [CrossRef] [Green Version]
  6. Miloshevich, L.M.; Vömel, H.; Whiteman, D.N.; Leblanc, T. Accuracy assessment and correction of Vaisala RS92 radiosonde water vapor measurements. J. Geophys. Res. Atmos. 2009, 114. [Google Scholar] [CrossRef] [Green Version]
  7. Güldner, J. A model-based approach to adjust microwave observations for operational applications: Results of a campaign at Munich Airport in winter 2011/2012. Atmos. Meas. Tech. 2013, 6, 2879–2891. [Google Scholar] [CrossRef]
  8. Bevis, M.; Businger, S.; Herring, T.A.; Rocken, C.; Anthes, R.A.; Ware, R.H. GPS meteorology: Remote sensing of atmospheric water vapor using the global positioning system. J. Geophys. Res. Atmos. 1992, 97, 15787–15801. [Google Scholar] [CrossRef]
  9. Volz, F.E. Economical Multispectral Sun Photometer for Measurements of Aerosol Extinction from 0.44 µm to 1.6 µm and Precipitable Water. Appl. Opt. 1974, 13, 1732–1733. [Google Scholar] [CrossRef]
  10. Bruegge, C.J.; Conel, J.E.; Green, R.O.; Margolis, J.S.; Holm, R.G.; Toon, G. Water vapor column abundance retrievals during FIFE. J. Geophys. Res. Atmos. 1992, 97, 18759–18768. [Google Scholar] [CrossRef]
  11. Michalsky, J.J.; Liljegren, J.C.; Harrison, L.C. A comparison of Sun photometer derivations of total column water vapor and ozone to standard measures of same at the Southern Great Plains Atmospheric Radiation Measurement site. J. Geophys. Res. Atmos. 1995, 100, 25995–26003. [Google Scholar] [CrossRef]
  12. Halthore, R.N.; Schwartz, S.E.; Michalsky, J.J.; Anderson, G.P.; Ferrare, R.A.; Holben, B.N.; Ten Brink, H.M. Comparison of model estimated and measured direct-normal solar irradiance. J. Geophys. Res. Atmos. 1997, 102, 29991–30002. [Google Scholar] [CrossRef] [Green Version]
  13. Ingold, T.; Schmid, B.; Mätzler, C.; Demoulin, P.; Kämpfer, N. Modeled and empirical approaches for retrieving columnar water vapor from solar transmittance measurements in the 0.72, 0.82, and 0.94 μ absorption bands. J. Geophys. Res. Atmos. 2000, 105, 24327–24343. [Google Scholar] [CrossRef]
  14. Schmid, B.; Michalsky, J.; Slater, D.; Barnard, J.; Halthore, R.; Liljegren, J.; Holben, B.; Eck, T.; Livingston, J.; Philip, B.R.; et al. Comparison of columnar water-vapor measurements from solar transmittance methods. Appl. Opt. 2001, 40, 1886–1896. [Google Scholar] [CrossRef] [PubMed] [Green Version]
  15. Zhang, Y.; Li, X.; Gu, X. Estimation of water vapor amount over Beijing from sun photometer measurements. J. Remote Sens. 2006, 10, 749. [Google Scholar]
  16. Haiou, Z.; Youfei, Z.; Ziying, C.; Chao, P. Retrieval of Atmospheric Column Water Vapor Content over Zhengzhou with Sun-Photometer. Available online: https://kns.cnki.net/kcms/detail/detail.aspx?dbcode=CJFD&dbname=CJFD2009&filename=QXKJ200905014&v=%25mmd2B7DBZDjW1N2icVGIHYL6gzYNnYsdUFVptFZjcCzESKFxG%25mmd2BCi%25mmd2FFnMpe4WcDWl0oto (accessed on 19 January 2021).
  17. Che, H.; Gui, K.; Chen, Q.; Zheng, Y.; Yu, J.; Sun, T.; Zhang, X.; Shi, G. Calibration of the 936 nm water-vapor channel for the China aerosol remote sensing NETwork (CARSNET) and the effect of the retrieval water-vapor on aerosol optical property over Beijing, China. Atmos. Pollut. Res. 2016, 7, 743–753. [Google Scholar] [CrossRef] [Green Version]
  18. Campanelli, M.; Mascitelli, A.; Sanò, P.; Diémoz, H.; Estellés, V.; Federico, S.; Iannarelli, A.M.; Fratarcangeli, F.; Mazzoni, A.; Realini, E.; et al. Precipitable water vapour content from ESR/SKYNET sun–sky radiometers: validation against GNSS/GPS and AERONET over three different sites in Europe. Atmos. Meas. Tech. 2018, 11, 81–94. [Google Scholar] [CrossRef] [Green Version]
  19. WMO. Environmental Pollution Monitoring and Reasearch Programme; GAW Report No. 43; WMO: Geneve, Switzerland, 1986. [Google Scholar]
  20. Holben, B.; Eck, T.; Slutsker, I.; Tanré, D.; Buis, J.; Setzer, A.; Vermote, E.; Reagan, J.; Kaufman, Y.; Nakajima, T.; et al. AERONET—A Federated Instrument Network and Data Archive for Aerosol Characterization. Remote Sens. Environ. 1998, 66, 1–16. [Google Scholar] [CrossRef]
  21. Smirnov, A.; Holben, B.; Lyapustin, A.; Slutsker, I.; Eck, T. AERONET processing algorithms refinement. In AERONET Workshop; El Arenosillo: Mazagón, Spain, 2004; pp. 10–14. [Google Scholar]
  22. Wehrli, C. Calibrations of filter radiometers for determination of atmospheric optical depth. Metrologia 2000, 37, 419. [Google Scholar] [CrossRef]
  23. Campanelli, M.; Estelles, V.; Smyth, T.; Tomasi, C.; Martìnez-Lozano, M.; Claxton, B.; Muller, P.; Pappalardo, G.; Pietruczuk, A.; Shanklin, J.; et al. Monitoring of Eyjafjallajökull volcanic aerosol by the new European Skynet Radiometers (ESR) network. Atmos. Environ. 2012, 48, 33–45. [Google Scholar] [CrossRef]
  24. Campanelli, M.; Nakajima, T.; Khatri, P.; Takamura, T.; Uchiyama, A.; Estelles, V.; Liberti, G.L.; Malvestuto, V. Retrieval of characteristic parameters for water vapour transmittance in the development of ground-based sun–sky radiometric measurements of columnar water vapour. Atmos. Meas. Tech. 2014, 7, 1075–1087. [Google Scholar] [CrossRef] [Green Version]
  25. Schneider, M.; Romero, P.M.; Hase, F.; Blumenstock, T.; Cuevas, E.; Ramos, R. Continuous quality assessment of atmospheric water vapour measurement techniques: FTIR, Cimel, MFRSR, GPS, and Vaisala RS92. Atmos. Meas. Tech. 2010, 3, 323–338. [Google Scholar] [CrossRef] [Green Version]
  26. Wunch, D.; Toon, G.C.; Blavier, J.F.L.; Washenfelder, R.A.; Notholt, J.; Connor, B.J.; Griffith, D.W.T.; Sherlock, V.; Wennberg, P.O. The total carbon column observing network. Philos. Trans. R. Soc. Ser. A Math. Phys. Eng. Sci. 2011, 369, 2087–2112. [Google Scholar] [CrossRef] [Green Version]
  27. Schneider, M.; Barthlott, S.; Hase, F.; González, Y.; Yoshimura, K.; García, O.E.; Sepúlveda, E.; Gomez-Pelaez, A.; Gisi, M.; Kohlhepp, R.; et al. Ground-based remote sensing of tropospheric water vapour isotopologues within the project MUSICA. Atmos. Meas. Tech. 2012, 5, 3007–3027. [Google Scholar] [CrossRef] [Green Version]
  28. Cachorro, V.; De Frutos, A.; Casanova, J. Determination of total vertical water vapor in the atmosphere. Atmos. Res. 1986, 20, 67–74. [Google Scholar] [CrossRef]
  29. Cachorro, V.E.; Utrillas, P.; Vergaz, R.; Durán, P.; de Frutos, A.M.; Martinez-Lozano, J.A. Determination of the atmospheric-water-vapor content in the 940-nm absorption band by use of moderate spectral-resolution measurements of direct solar irradiance. Appl. Opt. 1998, 37, 4678–4689. [Google Scholar] [CrossRef] [PubMed]
  30. Raptis, P.I.; Kazadzis, S.; Gröbner, J.; Kouremeti, N.; Doppler, L.; Becker, R.; Helmis, C. Water vapour retrieval using the Precision Solar Spectroradiometer. Atmos. Meas. Tech. 2018, 11, 1143–1157. [Google Scholar] [CrossRef]
  31. Fowle, F. The spectroscopic determination of aqueous vapor. Astrophys. J. 1912, 35, 149. [Google Scholar] [CrossRef]
  32. Fowle, F. The determination of aqueous vapor above Mount Wilson. Astrophys. J. 1913, 37, 359. [Google Scholar] [CrossRef]
  33. Schmid, B.; Thorne, K.; Demoulin, P.; Peter, R.; Mätzler, C.; Sekler, J. Comparison of modeled and empirical approaches for retrieving columnar water vapor from solar transmittance measurements in the 0.94-µm region. J. Geophys. Res. Atmos. 1996, 101, 9345–9358. [Google Scholar] [CrossRef]
  34. Barreto, A.; Cuevas, E.; Damiri, B.; Romero, P.M.; Almansa, F. Column water vapor determination in night period with a lunar photometer prototype. Atmos. Meas. Tech. 2013, 6, 2159–2167. [Google Scholar] [CrossRef] [Green Version]
  35. Almansa, A.F.; Cuevas, E.; Barreto, A.; Torres, B.; García, O.E.; Delia García, R.; Velasco-Merino, C.; Cachorro, V.E.; Berjón, A.; Mallorquín, M.; et al. Column Integrated Water Vapor and Aerosol Load Characterization with the New ZEN-R52 Radiometer. Remote Sens. 2020, 12, 1424. [Google Scholar] [CrossRef]
  36. WMO. Commission for Instruments and Methods of Observation, Sixteenth Session WMO; No.1138; Secretariat of the World Meteorological Organization: Saint Petersburg, Russia, 2014. [Google Scholar]
  37. Cuevas, E.; Milford, C.; Bustos, J.J.; García, O.E.; García, R.D.; Gómez-Peláez, A.J.; Guirado-Fuentes, C.; Marrero, C.; Prats, N.; Ramos, R.; et al. Izaña Atmospheric Research Center Activity Report 2017–2018. Technical Report WMO/GAW No. 247, World Meteorological Organization & Izaña Atmospheric Resear Center (AEMET). 2019. Available online: https://izana.aemet.es/wp-content/docs/Izana_Report_2017_2018.pdf (accessed on 19 January 2021).
  38. Egli, L.; Gröbner, J.; Hülsen, G.; Bachmann, L.; Blumthaler, M.; Dubard, J.; Khazova, M.; Kift, R.; Hoogendijk, K.; Serrano, A.; et al. Quality assessment of solar UV irradiance measured with array spectroradiometers. Atmos. Meas. Tech. 2016, 9, 1553–1567. [Google Scholar] [CrossRef] [Green Version]
  39. Pavanello, D.; Galleano, R.; Zaaiman, W.; Ankit, M.; Kouremeti, N.; Gröbner, J.; Hoogendijk, K.; Po, M.; Lisbona, E.; Alius, W.; et al. Results of the IX International Spectroradiometer Intercomparison and impact on precise measurements of new photovoltaic technologies. Prog. Photovolt. Res. Appl. 2020, 29, 109–123. [Google Scholar] [CrossRef]
  40. García-Cabrera, R.D.; Cuevas-Agulló, E.; Barreto, A.; Cachorro, V.E.; Pó, M.; Ramos, R.; Hoogendijk, K. Aerosol retrievals from the EKO MS-711 spectral direct irradiance measurements and corrections of the circumsolar radiation. Atmos. Meas. Tech. 2020, 13, 2601–2621. [Google Scholar] [CrossRef]
  41. Romero Campos, P.M.; Marrero de la Santa Cruz, C.L.; Alonso-Pérez, S.; Cuevas Agulló, E.; Afonso Gómez, S.; Ortiz de Galisteo, J.P. Una climatología del agua precipitable en la región subtropical sobre la isla de Tenerife basada en datos de radiosondeos; Nota Técnica Digital N° 6; Agencia Estatal de Meteorología: Madrid, Spain; Available online: http://www.aemet.es/documentos/es/conocermas/publicaciones/NT6-Tenerife.pdf (accessed on 19 January 2021).
  42. Yuan, L.L.; Anthes, R.A.; Ware, R.H.; Rocken, C.; Bonner, W.D.; Bevis, M.G.; Businger, S. Sensing climate change using the global positioning system. J. Geophys. Res. Atmos. 1993, 98, 14925–14937. [Google Scholar] [CrossRef] [Green Version]
  43. Romero Campos, P.M.; Agulló, C.; Ramón, R.; de Vargas, M.V.P.; Schneider, M. Programa de vapor de agua en columna del Centro de Investigación Atmosférica de Izaña: Análisis e Intercomparación de diferentes Técnicas de Medida; Nota Técnica Digital N° 1; NIPO 784-09-009-9; Agencia Estatal de Meteorología: Madrid, Spain, 2009; pp. 1–67. Available online: http://www.aemet.es/es/conocermas/recursos_en_linea/publicaciones_y_estudios/publicaciones/detalles/Programa_de_vapor_de_agua (accessed on 19 January 2021).
  44. Barreto, A.; Cuevas, E.; Granados-Muñoz, M.J.; Alados-Arboledas, L.; Romero, P.M.; Gröbner, J.; Kouremeti, N.; Almansa, A.F.; Stone, T.; Toledano, C.; et al. The new sun-sky-lunar Cimel CE318-T multiband photometer a comprehensive performance evaluation. Atmos. Meas. Tech. 2016, 9, 631–654. [Google Scholar] [CrossRef] [Green Version]
  45. Torres, B.; Toledano, C.; Berjón, A.; Fuertes, D.; Molina, V.; Gonzalez, R.; Canini, M.; Cachorro, V.E.; Goloub, P.; Podvin, T.; et al. Measurements on pointing error and field of view of Cimel-318 Sun photometers in the scope of AERONET. Atmos. Meas. Tech. 2013, 6, 2207–2220. [Google Scholar] [CrossRef] [Green Version]
  46. Schneider, M.; Blumenstock, T.; Chipperfield, M.P.; Hase, F.; Kouker, W.; Reddmann, T.; Ruhnke, R.; Cuevas, E.; Fischer, H. Subtropical trace gas profiles determined by ground-based FTIR spectroscopy at Izaña (28.5deg; N, 16.3deg; W): Five-year record, error analysis, and comparison with 3-D CTMs. Atmos. Chem. Phys. 2005, 5, 153–167. [Google Scholar] [CrossRef] [Green Version]
  47. Blumenstock, T.; Hase, F.; Schneider, M.; García, O.; Sepúlveda, E. TCCON data from Izana. In TCCON Data from Izana (ES), Release GGG2014.R1 (Version R1) [Data Set]; CaltechDATA: Pasadena, CA, USA, 2017. [Google Scholar] [CrossRef]
  48. Thomason, L.; Herman, B.M.; Schotland, R.M.; Reagan, J.A. Extraterrestrial solar flux measurement limitations due to a Beer’s law assumption and uncertainty in local time. Appl. Opt. 1982, 21, 1191–1195. [Google Scholar] [CrossRef]
  49. Hansen, J.E.; Travis, L.D. Light scattering in planetary atmospheres. Space Sci. Rev. 1974, 16, 527–610. [Google Scholar] [CrossRef]
  50. Kasten, F.; Young, A.T. Revised optical air mass tables and approximation formula. Appl. Opt. 1989, 28, 4735–4738. [Google Scholar] [CrossRef]
  51. Kasten, F. A new table and approximation formula for the relative optical air mass. Arch. Meteor. Geophy. B 1966, 14, 206–223. [Google Scholar] [CrossRef]
  52. Halthore, R.N.; Markham, B.L.; Deering, D.W. Atmospheric Correction and Calibration During Kurex-91. In Proceedings of the International Geoscience and Remote Sensing Symposium (IGARSS ’92), Houston, TX, USA, 26–29 May 1992; Volume 2, pp. 1278–1280. [Google Scholar] [CrossRef]
  53. Berk, A.; Hawes, F. Validation of MODTRAN® 6 and its line-by-line algorithm. J. Quant. Spectrosc. Radiat. Transf. 2017, 203, 542–556. [Google Scholar] [CrossRef]
  54. Anderson, G.P.; Clough, S.A.; Kneizys, F.; Chetwynd, J.H.; Shettle, E.P. AFGL atmospheric constituent profiles (0.120 km). In Technical Report; Air Force Geophysics Lab Hanscom AFB MA: Lexington, MA, USA, 1986. [Google Scholar]
  55. Ångström, A. Techniques of determinig the turbidity of the atmosphere. Tellus 1961, 13, 214–223. [Google Scholar] [CrossRef] [Green Version]
  56. Mayer, B.; Kylling, A. Technical note: The libRadtran software package for radiative transfer calculations—Description and examples of use. Atmos. Chem. Phys. 2005, 5, 1855–1877. [Google Scholar] [CrossRef] [Green Version]
  57. Emde, C.; Buras-Schnell, R.; Kylling, A.; Mayer, B.; Gasteiger, J.; Hamann, U.; Kylling, J.; Richter, B.; Pause, C.; Dowling, T.; et al. The libRadtran software package for radiative transfer calculations (version 2.0. 1). Geosci. Model Dev. 2016, 9, 1647–1672. [Google Scholar] [CrossRef] [Green Version]
  58. Bipm, I.; Ifcc, I.; Iso, I.; Iupap, O. Evaluation of Measurement Data—Guide to the Expression of Uncertainty in Measurement, JCGM 100: 2008 GUM 1995 with Minor Corrections. Available online: https://ncc.nesdis.noaa.gov/documents/documentation/JCGM_100_2008_E.pdf (accessed on 19 January 2021).
  59. Jcgm, Y. Evaluation of Measurement Data—Supplement 1 to the “Guide to the Expression of Uncertainty in Measurement”—Propagation of Distributions Using a Monte Carlo Method; Organisation for Standardization: Geneva, Switzerland, 2008. [Google Scholar]
  60. Metrology, J.C. Evaluation of Measurement Data—An Introduction to the “Guide to the Expression of Uncertainty in Measurement” and Related Documents (JCGM 104: 2009); Organisation for Standardization: Geneva, Switzerland, 2009. [Google Scholar]
  61. Bipm, I.; Ifcc, I.; Iso, I.; Iupap, O. Evaluation of measurement data—Supplement 2 to the ‘Guide to the expression of uncertainty in measurement’—Extension to any number of output quantities. JCGM 2011, 102, 2011. [Google Scholar]
  62. Fröhlich, C.; Shaw, G.E. New determination of Rayleigh scattering in the terrestrial atmosphere. Appl. Opt. 1980, 19, 1773–1775. [Google Scholar] [CrossRef]
  63. Spencer, R.P.; Lange, R.C.; Treves, S. Use of 135mBa and 131Ba as bone-scanning agents. J. Nucl. Med. 1971, 12, 216–221. [Google Scholar]
  64. Stephens, M.A. EDF statistics for goodness of fit and some comparisons. J. Am. Stat. Assoc. 1974, 69, 730–737. [Google Scholar] [CrossRef]
  65. Rodriguez-Franco, J.J.; Cuevas, E. Characteristics of the subtropical tropopause region based on long-term highly resolved sonde records over Tenerife. J. Geophys. Res. Atmos. 2013, 118, 10754–10769. [Google Scholar] [CrossRef] [Green Version]
  66. Andrey, J.; Cuevas, E.; MC, P.; Alonso-Pérez, S.; Redondas, A.; Gil-Ojeda, M. Quantification of ozone reductions within the Saharan air layer through a 13-year climatologic analysis of ozone profiles. Atmos. Environ. 2014, 84, 28–34. [Google Scholar] [CrossRef]
  67. García, R.D.; Barreto, A.; Cuevas, E.; Gröbner, J.; García, O.E.; Gómez-Peláez, A.; Romero-Campos, P.M.; Redondas, A.; Cachorro, V.E.; Ramos, R. Comparison of observed and modeled cloud-free longwave downward radiation (2010–2016) at the high mountain BSRN Izaña station. Geosci. Model Dev. 2018, 11, 2139–2152. [Google Scholar] [CrossRef] [Green Version]
Figure 1. Direct normal irradiance, DNI ( λ ), performed with the EKO MS-711 spectroradiometer on 20 May 2019 (13:00 UTC) at IZO. The blue box indicates the water vapor absorption band selected in this work for the PWV retrievals (930–960 nm). The zoomed graphic shows the direct transmittance simulated with MODTRAN model between 850 and 1000 nm on 20 May 2019 (13:00 UTC).
Remotesensing 13 00350 g001
Figure 2. (a) Scatterplot of l n ( l n ( 1 / T w ( Δ λ ) ) ) versus l n ( m w P W V ) between 930 and 960 nm. The fitting parameters are shown in the legend and (b) Modified Langley-Plot at 940 nm on 20 May 2019 at IZO. R is the Pearson correlation coefficient and N is the number of data points.
Remotesensing 13 00350 g002
Figure 3. Simulations of CR (%) as a function of wavelength at a SZA of 30° for PWV values of 5, 10, 15 and 20 mm and AOD of 0.05, 0.10 and 0.20.
Remotesensing 13 00350 g003
Figure 4. Schema of the Monte-Carlo method procedure applied for the uncertainty evaluation.
Remotesensing 13 00350 g004
Figure 5. Time series of PWV determined from normal direct irradiance (DNI) measured with an EKO MS 711 between April and December 2019 at IZO. The color scale indicates the relative U P W V in %. The small figure represents the histograms of the relative U P W V in %.
Remotesensing 13 00350 g005
Figure 6. Relative uncertainty of EKO PWV (%) versus (a) EKO PWV (mm) and (b) AOD at 500 nm (unitless).
Remotesensing 13 00350 g006
Figure 7. Scatterplot of EKO PWV (mm) versus (a) RS92 PWV, (b) GNSS PWV, (c) FTIR PWV, and (d) CIMEL-AERONET PWV between April and December 2019 at IZO. The dotted lines are the least-squares fits and the black solid lines are the diagonals (x = y). The least-squares fit parameters are shown in the legend (slope, intercept and Pearson correlation coefficient R). N is the amount of data. The small figures represent the occurrence distributions of the mean bias in mm (EKO PWV- XXX PWV).
Remotesensing 13 00350 g007
Table 1. Relative uncertainty in the input parameters, their corresponding references and the assumed probability density function (PDF). MCM: Monte-Carlo method.
ParameterUncertaintyReferencePDF
a0.00168MCMGaussian
b0.00485MCMGaussian
m R ; m w 0.065%[50]Rectangular
τ R 0.7%[62]Rectangular
τ a (AOD)0.02[40]Rectangular
D N I ( λ ) 3.8%Calibration Certificate EKO MS-711Rectangular
D N I o ( λ ) 4.1%MCMGaussian
Sun-Earth distance0.0001[63]Rectangular
Transmittance (MODTRAN)0.005[53]Rectangular
Table 2. Statistics of the comparison between EKO PWV (mm) determined between 930 and 960 nm and the PWV obtained from of RS92, GNSS, FTIR and CIMEL-AERONET at IZO between April and December 2019. (N: number of data, R: Pearson correlation coefficient, RMSE: root mean square error, MB: mean bias, STD: standard deviation).
NRRMSE (mm)MB (mm)STD (mm)
(%)(%)(%)
RS92/EKO1870.9560.94−0.300.89
(18.5%)(−4.7%)(25.3%)
All dataGNSS/EKO19870.9750.680.020.68
(14.1%)(3.3%)(26.7%)
FTIR/EKO37650.9640.88−0.570.68
(18.6%)(14.5%)(17.3%)
CIMEL-AERONET/EKO21,9090.9830.670.330.59
(12.8%)(9.5%)(13.6%)
RS92/EKO1180.7960.90−0.320.85
(27.6%)(6.5%)(29.8%)
EKO PWV ≤ 5 mmGNSS/EKO12300.8840.60−0.020.60
(20.0%)(4.0%)(32.6%)
FTIR/EKO26920.8830.82−0.610.55
(23.4%)(−18.3%)(17.5%)
CIMEL-AERONET/EKO13,1550.9370.640.470.44
(18.7%)(14.6%)(13.8%)
RS92/EKO690.9321.00−0.260.97
(12.2%)(−1.6%)(14.2%)
EKO PWV > 5 mmGNSS/EKO7570.9560.790.080.79
(10.2%)(2.2%)(12.1%)
FTIR/EKO10730.9191.02−0.450.91
(13.0%)(−4.9%)(12.3%)
CIMEL-AERONET/EKO87540.9660.710.110.71
(8.9%)(1.9%)(8.8%)
Table 3. Summary of comparisons of PWV between different techniques performed by others authors. (MWR: Microwave Radiometer; PSR: Precision Solar Spectroradiometer).
StationReferenciaPeriodInstrumentsResults
PWV Differences
(mm)(%)
Izaña (Spain) FTIR/CIMEL-AERONET−25.4 ± 12.7
[25]2005–2009FTIR/GNSS−5.36 ± 19.5
FTIR/RS92−3.33 ± 15.5
[34]July–August 2011Lunar CIMEL/GNSS1.8
Lunar CIMEL/RS922.5
[35]August 2017–June 2018FTIR/ZEN-R529.1
CIMEL-AERONET/ZEN-R5217.1
Bern (Switzerland)[33]1992–1993Sunphotometer/RS921.913
USA and Canada[12]July 1993; April 1994Sunphotometer/RS9210
September 1994Sunphotometer/MWR5
Rome (Italy) 1.356
Aosta (Italy)[18]2011, 2012 and 2014Sun-Sky radiometers/GNSS1.9713
Valencia (Spain) Sun-Sky radiometers/CIMEL-AERONET1.288
Lindenberg (Germany) PSR/CIMEL-AERONET1.100.7
[30]May 2014–April 2016PSR/GNSS0.500.40
PSR/RS920.400.50
Publisher’s Note: MDPI stays neutral with regard to jurisdictional claims in published maps and institutional affiliations.

