Article

The Novel Microwave Temperature Vegetation Drought Index (MTVDI) Captures Canopy Seasonality across Amazonian Tropical Evergreen Forests

1
Guangzhou Institute of Geochemistry, Chinese Academy of Sciences, Guangzhou 510640, China
2
Southern Marine Science and Engineering Guangdong Laboratory (Guangzhou), Guangzhou 511458, China
3
Key Lab of Guangdong for Utilization of Remote Sensing and Geographical Information System, Guangdong Open Laboratory of Geospatial Information Technology and Application, Guangzhou Institute of Geography, Guangdong Academy of Sciences, Guangzhou 510070, China
4
Laboratoire des Sciences du Climat et de l’Environnement, IPSL, CEA-CNRS-UVSQ, Université Paris-Saclay, 91191 Gif sur Yvette, France
5
University of Chinese Academic of Sciences, Beijing 100049, China
6
School of Earth Science, Chengdu University of Technology, Chengdu 610059, China
7
Guangdong Province Key Laboratory for Climate Change and Natural Disaster Studies, School of Atmospheric Sciences, Sun Yat-sen University, Zhuhai 519082, China
*
Author to whom correspondence should be addressed.
Remote Sens. 2021, 13(3), 339; https://doi.org/10.3390/rs13030339
Submission received: 24 November 2020 / Revised: 14 January 2021 / Accepted: 18 January 2021 / Published: 20 January 2021
(This article belongs to the Special Issue Forest Dynamics and Degradation Monitoring in the Brazilian Amazon)

Abstract

:
Despite its perennial canopy, the Amazonian tropical evergreen forest shows significant canopy growth seasonality, which has been represented by optical satellite-based observations. In this paper, a new Microwave Temperature–Vegetation Drought Index (MTVDI) based on Advanced Microwave Scanning Radiometer for the Earth Observing System (AMSR-E) sensors was used to capture the canopy seasonality from 2003 to 2010 in comparison with four climatic dryness indicators (Palmer Drought Severity Index (PDSI), Climatological Water Deficit (CWD), Terrestrial Water Storage (TWS), Vapor Pressure Deficit (VPD)) and two photosynthesis proxies (Enhanced Vegetation Index (EVI) and Solar-Induced chlorophyll Fluorescence (SIF)), respectively. Our results suggest that the MTVDI shows opposite seasonal variability with two photosynthesis proxies and performs better than the four climatic dryness indicators in reflecting the canopy photosynthesis seasonality of tropical forests in the Amazon. Besides, the MTVDI captures wet regions that show green-up during the dry season with mean annual precipitation higher than 2000 mm per year. The MTVDI provides a new way for monitoring the canopy seasonality of tropical forests from microwave signals.

Graphical Abstract

1. Introduction

The Amazon rainforest, holding 50% of tropical forests carbon stocks [1], accounting for about 15% of global terrestrial photosynthesis [2], is commonly known as an important and continuous part of Earth system functioning [3]. Understanding the seasonal and interannual variations of photosynthesis and other gross CO2 fluxes of wet tropical forests offers insights about how they may respond to climate change [4]. Despite its perennial canopy, the Amazonian tropical evergreen forests show significant seasonality in leaf age groups (e.g., young leaves, mature leaves and old leaves) [5], precipitation and radiation [6,7], which dominate regulating the seasonal cycles of carbon and water fluxes [8].
Satellite optical remote-sensing sensors also discern significant canopy seasonality, i.e., a dry-season green-up phenomenon compared to the wet seasons in the parts of Amazon tropical evergreen forest [5,9,10,11,12,13]. For example, some studies analyzed Moderate Resolution Imaging Spectrometer (MODIS) Enhanced Vegetation Index (EVI) and showed that the canopy of the tropical forests ‘greened up’ during higher-sunlight dry seasons [14], which increased greenness by 25% with sunlight during the dry season across Amazonian tropical forests [11]. However, such a dry-season green-up in Amazonia from optical signal was questioned by several studies [15,16,17]. The optical-based signals are easily affected by land cover conditions and atmospheric conditions such as aerosols, atmospheric gases, clouds, and water vapor [10,18,19,20,21]. That is the main cause of the biases on optical reflectance changes, i.e., the interpretation of near-infrared reflectance changes can be induced by cloud/aerosols contaminations and surface anisotropy and varying sensor and illumination geometries [5,15,16,17]. Studies have shown that removing artifacts of changing sun-sensor geometry in optical remote sensing red and near-infrared reflectance data will eliminate the appearance of a green up (the change of EVI) during dry season months [15]. Thus, more investigations from other types of satellite signals independent of optical sensors are needed to verify such a dry-season green-up phenomenon across Amazonian tropical evergreen forests.
Unlike optical sensors, microwave sensors are seen as an important alternative for monitoring vegetation dynamics [22]. It detects and receives the electromagnetic radiation and scattering characteristics of the measured object in the microwave band (1 mm < wavelength < 1 m) to identify distant objects [23]. This enables microwave sensors the ability of working under all atmospheric conditions and penetrating parts of vegetation canopies to detect targets below. Therefore, microwave remote sensing is often used to detect changes in canopy structure, biomass, soil moisture and vegetation water content [10,23,24]. Up to now, several studies have been carried out to evaluate the drought impacts on Amazonian tropical forests. For example, novel low-frequency microwave satellite data (L-VOD, L band Vegetation Optical Depth) was not only used to precisely monitor the aboveground carbon (AGC) changes, but was also definitely used to monitor the intensity and spatial distribution of AGC restoration in the tropical forest [25,26]. The data from satellite microwave sensors which measure precipitation (TRMM, Tropical Rainfall Measuring Mission) and canopy backscatter (QSCAT, Quick Scatterometer) are also used to quantify the relative severity of recent droughts and potential impacts on Amazonian tropical forests, and they showed severe water shortage in western Amazonia during the drought period of 2005 [27]. Although focused on drought, the above microwave studies with relatively satisfactory experimental results fully demonstrate the great potential of microwave data and its application advantages in tropical rain forest. However, to date, few microwave remote sensing studies are focused on detecting the dry-season green-up of tropical evergreen forests. The application of microwave signals in assessing the seasonality of tropical forests has not been thoroughly studied and should be investigated more extensively.
The Microwave Temperature–Vegetation Drought Index (MTVDI) is a microwave drought index proposed by Liu et al. [10] in 2017 based on both the theory of Temperature–Vegetation Drought Index (TVDI) [28] and brightness temperature data (Tb) of the Advanced Microwave Scanning Radiometer for the Earth Observing System (AMSR-E) microwave sensor. It not only utilized the advantage of TVDI, which combines land surface temperature (Ts) with Normalized Difference Vegetation Index (NDVI) when monitoring the vegetation drought condition but also overcame the shortage of optical remote sensing, which is greatly influenced by atmospheric conditions. The value of MTVDI ranges from 0 to 1, indicating the change from humid to drought conditions. Liu et al. [10] firstly derived Ts based on the AMSR-E 18.7 GHz horizontal, 23.8 GHz and 89.0 GHz vertical polarized Tb, and then developed the Microwave Normalized Difference Vegetation Index (MNDVI) from the AMSR-E 23.8 GHz Microwave Polarization Difference Index (MPDI) and, finally, constructed MTVDI based on Ts and MNDVI derived from microwave signals.
In this paper, we use the MTVDI to investigate the seasonality of canopy growth across the tropical evergreen forests of the Amazon. And we compared MTVDI with four climatic dryness indicators including Terrestrial Water Storage (TWS) [29], Vapor Pressure Deficit (VPD) [30], Palmer Drought Severity Index (PDSI) [31], and Climatological Water Deficit (CWD) [32] and two canopy photosynthesis proxies including Enhanced Vegetation Index (EVI) [33] and Solar-Induced Chlorophyll Fluorescence (SIF) [34]. The scientific objectives of our study were (1) to assess the capacity of AMSRE-MTVDI in capturing the tropical forests phenology over the Amazon and (2) to investigate the differences in the response of tropical evergreen forests to climatic seasonal variability (light and water) in different regions of the Amazon.

2. Materials and Methods

2.1. Study Area

The Amazon basin (20° S–10° N by 50° W–80° W) is the largest basin of the world in terms of area (7.05 × 10⁶ km2), has a tropical rain forest climate, and covers about 40% of South America [35]. Annual average precipitation and runoff are ∼2100 mm/year and 1000 mm/year respectively [36], and, in some areas of the northern portions, yearly rainfall can exceed 4000 mm [35,37]. Here, we mainly focused on tropical evergreen forests (Figure 1). We firstly overlapped the boundary of the Amazon basin and the evergreen forest map from MODIS Land Cover product (MCD12C1) [38] in 2005, and then we removed the coastal area in the northeast considering the contamination of Tb data caused by water [39].

2.2. AMSR-E Data Processing

The Advanced Microwave Scanning Radiometer (AMSR) for the Earth Observing System (AMSR-E) developed by the Japan Aerospace Exploration Agency (JAXA) was launched in May 2002 on NASA’s (National Aeronautics and Space Administration) Aqua satellite [40,41] and worked until October 2011. AMSR-E was the successor of AMSR, which had lost due to satellite malfunction in October 2003, and nearly had the same characteristics as AMSR. ASMR-2, as the successor of AMSR-E, launched in May 2012 is still working. The detailed characteristics and performance of the AMSR family can be seen from reference [42].
In this study, the AMSR-E/Aqua ascending daily global 0.25-degree Tb data from 2003 to 2010 were provided by the National Snow and Ice Data Center (NSIDC) (http://nsidc.org/). For AMSR-E data preprocessing, first, we conducted a simple atmospheric correction for the L-band, C-band, and X-band on the global scale by using Earth Vegetation Atmosphere (EVA) model [43]. Second, we used spectral difference statistics (means and standard deviations) to identify pixels contaminated by radio frequency influence (RFI) and used RFI of K-band (RFIK) to shield high-frequency RFI for radio frequency interference correction [44,45]. Finally, we aggregated daily Tb data into monthly by using the average method.

2.3. Developing MTVDI

Here, we used Liu et al. [10]’s method to calculate the MTVDI. First, we calculated Ts (Formula (1) in Liu et al. [10]) based on the AMSR-E 89.0 GHz vertical polarization Tb (Tb89V), 23.8 GHz vertical polarization Tb (Tb23V) and 18.7 GHz horizontal polarization Tb (Tb18H) (Formula (1)):
T s   =   6.134 × 10 3 ( T b 18 H 278.818 ) 2   +   9.934   × 10 3 ( T b 23 V     216.029 ) 2     0.353   T b 89 V   +   349.582
where Tb18H, Tb23V and Tb89V are 18.7 GHz horizontal polarization Tb, 23.8 GHz vertical polarization Tb, and 89.0 GHz vertical polarization Tb respectively.
Then, the microwave normalized vegetation index (MNDVI) (Formula (2)) was calculated based on AMSR-E 23.8 GHz microwave polarization difference index (MPDI) (Formula (3)).
MNDVI = 0.231   × l n ( MPDI ) 0.578
where MPDI is the microwave polarization difference index of AMSR-E 23.8 GHz.
MPDI =   T b V T b H T b V + T b H
where TbV and TbH are the 23.8 GHz vertical polarization Tb and 23.8 GHz horizontal polarization Tb respectively.
Finally, based on the NDVI-Ts triangle space and definition of the temperature vegetation dryness index (TVDI) [28], we plotted the scatter diagrams between MNDVI and Ts to construct the MTVDI triangle space (see Figure 2). In the MTVDI (Ts-MNDVI) triangle space, the wet edge means that the vegetation growth is not limited by water due to sufficient soil water supply and the surface evapotranspiration is equal to the potential evapotranspiration, while the dry edge represents that the effectiveness of soil moisture is low and the surface evapotranspiration is small. That means wet edge and dry edge represent the thresholds of the wettest and driest condition of vegetation for a given MNDVI. Detailed methods for constructing the MTVDI triangle space were shown in Formulas (4)–(6).
MTVDI   =   T s T s m i n T s m a x T s m i n
T s m a x = a × MNDVI + b
T s m i n = c × MNDVI + d
where MNDVI is the Microwave Normalized Difference Vegetation index, a and b are the slope and intercept of dry edge; c and d are the slope and intercept of wet edge. T s m a x and T s m i n are the maximum and minimum surface temperature observation for a given MNDVI.

2.4. Climatic Dryness Indicators and Canopy Photosynthesis Proxies for Comparing the MTVDI Seasonality

In this study, we used Pearson correlation coefficient (Pearson R) and Nash–Sutcliffe efficiency coefficient (NSE) [46] to compare the seasonal variations between MTVDI and different climatic dryness indicators, and to evaluate the capability of MTVDI seasonality in representing the canopy photosynthesis seasonality (Table 1).

2.4.1. Terrestrial Water Storage

The Terrestrial Water Storage (TWS) obtained by gravity measurement represents a vertically integrated estimation of water storage, including groundwater, soil water content, surface water, ice, snow and biological water content [47,48]. That is, the larger the TWS value indicates more surface water reserves. The TWS seasonality is significantly related to the variability in precipitation or runoff, evapotranspiration [49,50]. After obtaining the terrestrial water reserves, each component can be estimated, such as the combination of water balance equation and hydrological model to estimate groundwater reserves, soil water content, evapotranspiration, and calculation of precipitation-evapotranspiration difference, river flow, etc. TWS measured by Gravity Recovery and Climate Experiment (GRACE) is widely used in previous studies [49,50,51]. Here, we used 0.5° monthly TWS data from the reconstructed GRACE Dataset (GRACE_REC_v03) [29].

2.4.2. Vapor Pressure Deficit

The Vapor Pressure Deficit (VPD) is the deficit between the amount of moisture in the air and how much moisture the air can hold when it is saturated [30,52]. That means, VPD can reflect the atmospheric dryness. The vegetation stomatal size is sensitive to the change of VPD [53]. When the VPD is higher, the vegetation water is stressed and it tends to close their stomata to prevent further water loss and hydraulic failure [54], therefore the evaporation will decrease [55]. In this study, we used a 0.125° spatial resolution ERA-Interim dataset, which is reanalysis products based on the Integrated Forecast System of European Centre for Medium–Range Weather Forecasts (ECMWF-IFS) [56], to calculate the VPD. The mathematical definition is as follows [30].
VPD = SVP AVP
AVP = 6.112   × f w   × e 17.67 T d T d + 243.5
SVP = 6.112   × f w   × e 17.67 T a T a + 243.5
where SVP and AVP are saturated vapor pressure and actual vapor pressure (hPa), respectively. T a and T d are the land air temperature (°C) and dew point temperature (°C), respectively.
f w = 1 + 7 × 10 4 + 3.46 × 10 6 P m s t
P m s t =   P m s l ( ( T a + 273.16 ) ( T a + 273.16 ) + 0.0065 × Z ) 5.625
where Z is the altitude (m). P m s t is the air pressure (hPa), and P m s l is the air pressure at mean sea level (1013.25 hPa).

2.4.3. Palmer Drought Severity Index

As one of the commonly used remote sensing drought monitoring models, the Palmer Drought Severity Index (PDSI) is a good indicator for quantitatively describing drought conditions [31]. PDSI is built based on meteorological data from field observations of meteorological monitoring stations, such as standard precipitation data, previous precipitation data, and temperature. And it is fully taken into account the moisture conditions and duration at a specific time and in previous periods [57]. The PDSI is a two-layer model to assess soil water balance by accounting for both water supply and demand to express the severity of drought within a period when the water supply in a region is continuously lower than normal [58]. The positive and negative values of PDSI indicate wetter and drier conditions, respectively. Here, we used the time-series monthly PDSI from Terraclimate PDSI datasets [59].

2.4.4. Climatological Water Deficit

The Climatological Water Deficit (CWD) is defined as the most negative value of climatological water deficit, related to the rainfall regime [32]. Therefore, CWD computed from the Climatic Research Unit and National Centers for Environmental Prediction (CRUNCEP) precipitation monthly dataset [60] was calculated to the analysis of the forest water stress [9]. Many studies have pointed out that the average evapotranspiration (E) in tropical forest areas determines whether the vegetation is in a state of water scarcity. The threshold is 100 mm per month [61,62,63,64]. Thus, the calculation logic relationship is
If C W D n 1 ( i , j ) E ( i , j ) + P n ( i , j ) < 0   ; Then   C W D n ( i , j ) = C W D n 1 ( i , j ) E ( i , j ) + P n ( i , j )   ; Else   C W D n ( i , j ) = 0 .
therefore, when the monthly rainfall (P) for each month (n) is lower than this threshold, the forest enters into water deficit. Therefore, smaller values of CWD indicate more severe drought with less precipitation.

2.4.5. Enhanced Vegetation Index

The Enhanced Vegetation Index (EVI) characterizes vegetation density, a greater value of EVI indicates a better growth of the vegetation canopy (i.e., canopy has more leaves). The EVI can optimize the vegetation signal by eliminating canopy background coupling and reducing the atmospheric impact on the signal, and because the index signal receives a composite of leaf area and chlorophyll content, thus it is not saturated in dense forests, so making it more sensitive to changes in vegetation canopy structure in dense vegetation areas [11,33,65]. Here, we obtained monthly 0.05 degree EVI (MYD13C3) from MODIS website (https://modis.gsfc.nasa.gov/data/dataprod/mod13.php) and resampled it to 0.25 × 0.25 degree by using bilinear interpolation method [10].

2.4.6. Solar-Induced Chlorophyll Fluorescence

The Solar-Induced Chlorophyll Fluorescence (SIF) is radiation generated between 650nm and 800nm after vegetation absorbs energy [66]. It is not saturated in dense forests, and is sensitive to the rate of photosynthetic electron transmission and the ratio of absorbed radiation. It can directly measure the functional status of vegetation and can eliminate the constraints imposed by the sunlight or sensor geometry on the vegetation index [67,68]. Therefore, the SIF can characterize the growth status and photosynthesis ability of vegetation. The satellite SIF data has been widely used to capture the photosynthetic activity of terrestrial forests [34,68,69,70]. In the previous study, Guan et al. [61] identified a large-scale, dry-season green-up area located in the northern, wetter part of Amazonia based on SIF and MODIS EVI. In this study, the satellite SIF data covering the Amazon tropical forests was provided from the monthly GOME-2 product-level 3 version 26 (V26) [34], which was retrieved from observation from multiple wavelengths from 2007 to 2015.

2.5. Nash–Sutcliffe Efficiency Coefficient

Nash–Sutcliffe Efficiency (NSE) has been used to assess the predictive power of hydrological models [46], and it can be also used to quantitatively describe the accuracy of model outputs other than discharge as long as there is observed data to compare the model results. Therefore, it was widely used for optimizing parameter values of geophysical models [71], hydrology about water quality constituents such as sediment, nitrogen, phosphorus loading [72], climate variables [73,74], land–atmosphere heat flux [75] and Gross primary production (GPP) [76]. To only compare the phase of seasonality correcting for the impacts of different seasonal amplitudes, we used the Z-transformed variables to calculate the NSE between modeled and observation-based data.
N S E = 1 t = 1 T ( M T V D I t O b s t ) 2 t = 1 T ( O b s t O b s ¯ ) 2
where M T V D I t is the normalized MTVDI data at time t, and O b s t is the normalized photosynthesis proxies (EVI and SIF) or drought indicators (TWS, VPD, PDSI and CWD) at time t (month). NSE is sensitive to both absolute values and seasonal variations [77]. The range of NSE is ( , 1].
An efficiency of 1 (NSE = 1) corresponds to a perfect match of modeled outputs to the observed data. An efficiency of 0 (NSE = 0) indicates that the model predictions are as accurate as the mean of the observed data, whereas an efficiency less than zero (NSE < 0) occurs when the model outputs perform poorly in comparison with the observed data.
Particularly, the MTVDI has a negative correlation with CWD, PDSI, TWS, EVI, and SIF, therefore, we used minus MTVDI to calculate NSE between MTVDI and those indicators.

3. Results

3.1. The MTVDI Triangle Space

The monthly Ts-MNDVI triangle space in 2004 is shown in Figure 2. The magnitude of the Ts and MNDVI vary between 280–330 (K) and 0–1.2, respectively. The dry edges (red) of MTVDI represent the driest condition (Tsmax) at the specified MNDVI, and the wet edges (blue) represent the wettest condition (Tsmin). Due to the space limitations, the monthly MNDVI-Ts triangle space in 2003 and 2005 to 2010 are listed in the support materials (Supplementary Materials Figures S1–S7).
The slope, intercept, and correlation coefficient (R) of regression of the dry and wet edges in each month of 2004 are shown in Supplementary Materials Table S1. The slopes of the dry edges are less than 0, while the slopes of wet edges are greater than 0. The negative slopes of the dry edges show a negative correlation between Ts and MNDVI, indicating the lower Tsmax when MNDVI increases; while the positive slopes of the wet edges indicate that the Tsmin increases with the increasing of MNDVI (Supplementary Materials Table S1).

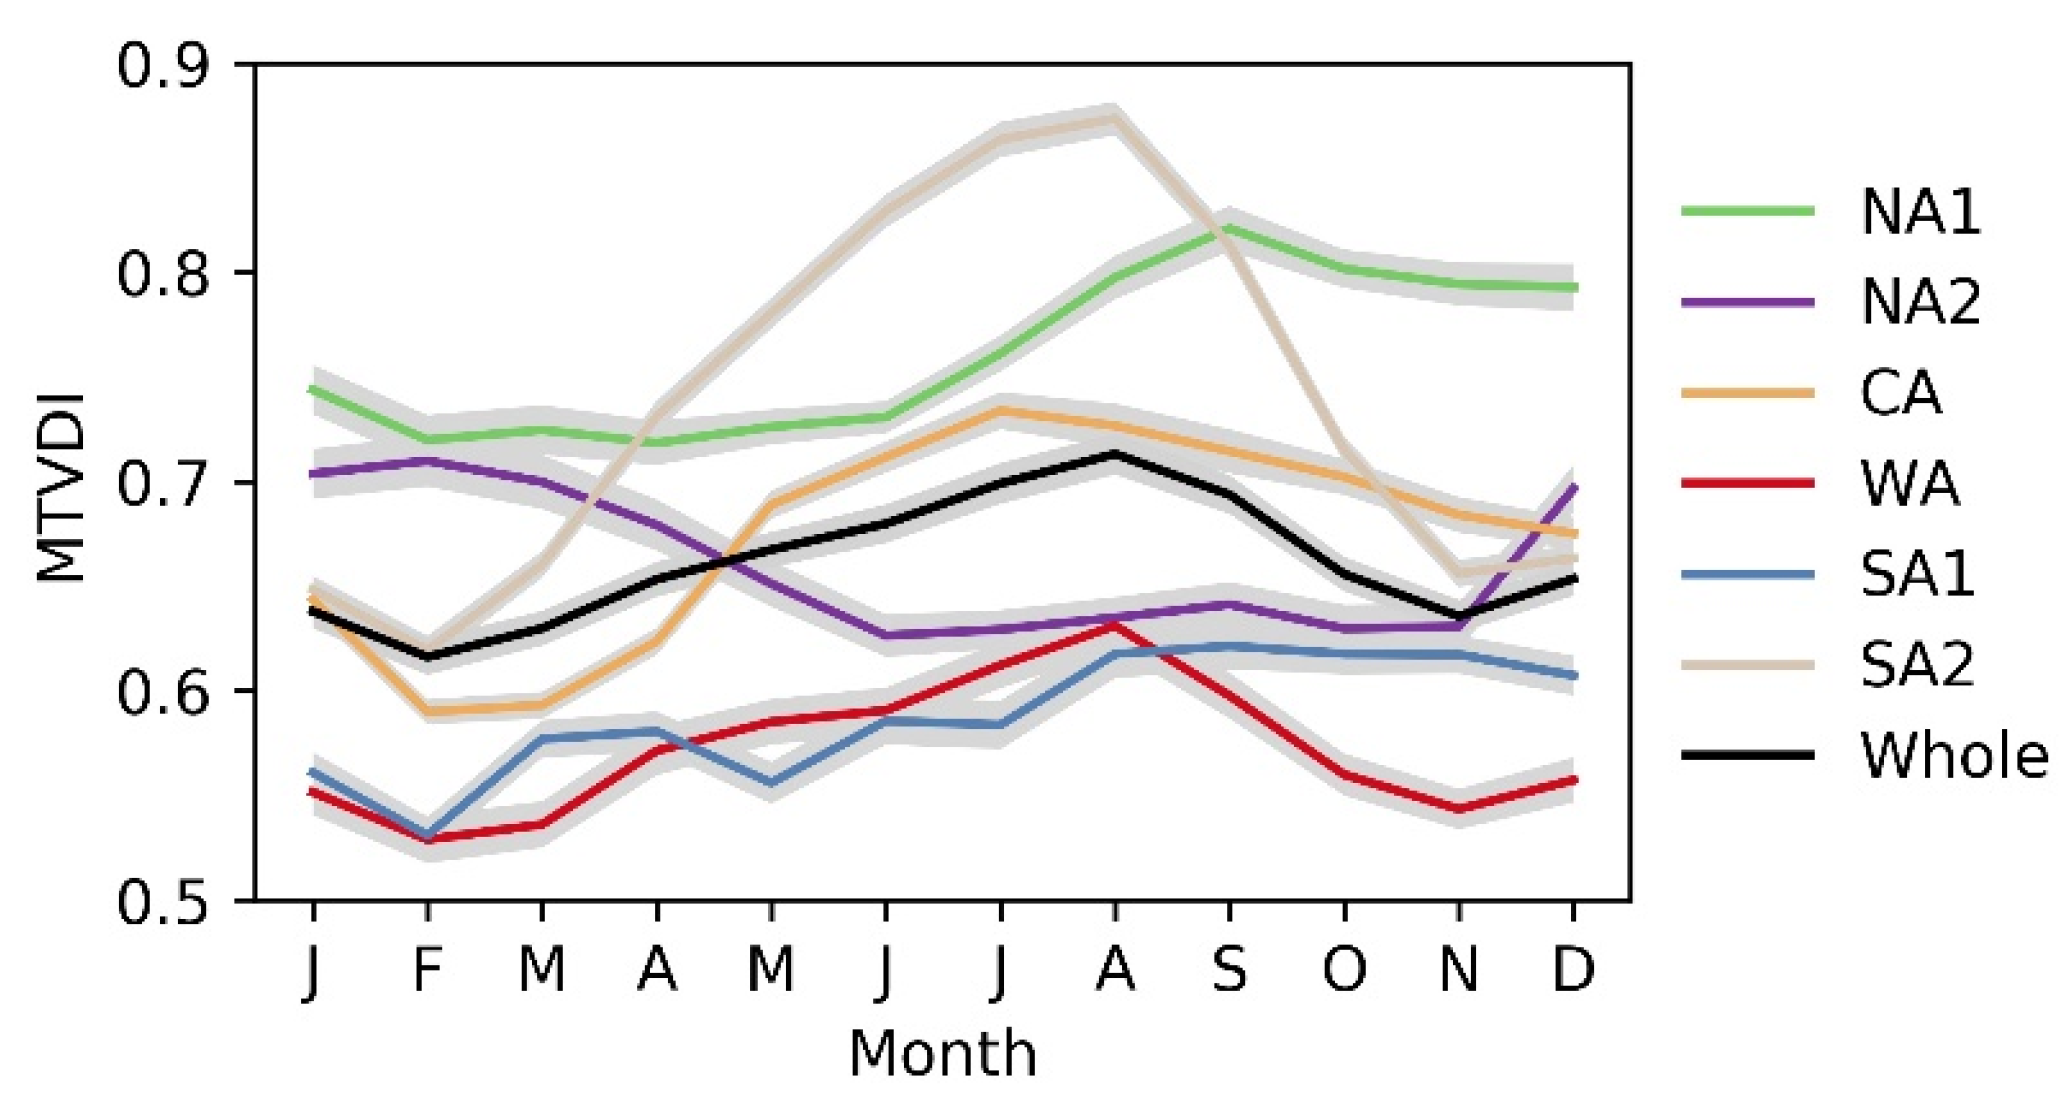
3.2. Seasonality of MTVDI

The spatial pattern of MTVDI differs greatly in different seasons (Figure 3), showing a clear transition of higher MTVDI pixels from north to south. From November to March, the drought mainly occurred in the northern Amazon tropical forests, which corresponds to the wet season in the southern hemisphere and dry season in the northern hemisphere. From the start of May to the end of September drought goes southward and then it releases from October to the end of the year. It is because during the period from March to September, the southern hemisphere gradually experiences dry season from north to south. It is notable that in the northeastern part of the study area encountered drought throughout the whole year.
To better understand the spatial divergences of Amazon tropical forests, we use the K-means clustering analysis [78,79] of MTVDI to group the study areas into six parts, named as NA1 (Northern Amazon 1), NA2 (Northern Amazon 2), CA (Central Amazon), WA (Western Amazon), SA1 (Southern Amazon 1), SA2 (Southern Amazon 2) (Figure 4). This result is similar to the seasonality cluster map identified from monthly climatology data of Ts, QSCAT, and reflectance of near-infrared band (NIR) for the Amazon tropical forests [79]. Results indicate the good ability of the MTVDI in reflecting the light and water differences across Amazon tropical forests.
The seasonal variations of MTVDI over Amazonian tropical forests are presented in Figure 5. For all Amazonian tropical forests (black solid curve in Figure 5), the MTVDI increases in May at the end of the wet-season period and peaks around August during the dry-season period, and then drops down in November at the end of the dry season [54]. Among the six subregions, NA1 region shows annual higher MTVDI (annual mean MTVDI = 0.76), while SA1 region has the smallest MTDVI throughout the year (annual mean MTVDI = 0.58). In particular, the MTVDI in SA2, CA, WA, and NA1 regions show significantly seasonality, with an increase at the early stages of the dry season, a peak in August in the dry season and a drop during the wet season. However, the MTVDI in NA2 region shows the opposite pattern, where MTVDI increases at the start of November, but reaches its lowest point from June to October.

3.3. Compare MTVDI Seasonality against with Climatic Dryness Indicators

To test the robustness of MTVDI, we compared it with four climatic dryness indicators: TWS, VPD, PDSI and CWD, respectively (Figure 6). In general, the seasonality of MTVDI shows consistency with VPD, of which positive value indicates drier condition, but shows opposite trends to those of CWD, TWS, and PDSI, of which negative value means drier conditions (Figure 6). This is also shown in six subregions (Supplementary Materials Figure S8). We further used NSE to compare the seasonality matching between MTVDI and four climatic dryness indicators. The seasonality of MTVDI matches well with those of VPD (NSE = 0.40) and CWD (NSE = 0.25), compared with those of PDSI (NSE = −0.56) and TWS (NSE = −0.72), especially in the regions NA1, WA, CA, and SA2 (Supplementary Materials Table S2).
The spatial patterns of correlation between seasonality of MTVDI and seasonality of VPD, CWD, TWS, PDSI at the pixel level are shown in Figure 7. In general, MTVDI has better correlation (red pixels) with VPD (Figure 7a, |Mean R| = 0.44) and CWD (Figure 7b, |Mean R| = 0.35) than TWS (Figure 7c, |Mean R| = 0.24) and PDSI (Figure 7d, |Mean R| = 0.05) in seasonal variability. Previous studies have shown the great potential of VPD in representing the Amazonian phenology [5]. Therefore, MTVDI not only has the potential to represent the Amazonian tropical forest phenology, being well matched with VPD in seasonality (NSE = 0.40), but also can be used as an integrated drought index. MTVDI relates to both atmospheric drought (VPD) and soil water stress (CWD), especially in southern regions of Amazon tropical forests (SA2) (Table S4), where there is a transition from predominantly light-adapted to water-adapted canopy phenology from west to east [80]. Besides, in the southern of NA1, the northern of WA, and the CA regions, the MTVDI has poor correlation with all of four climatic dryness indicators (Supplementary Materials Table S3). It is because those pixels are distributed along the river and has lower brightness temperatures and higher polarization differences due to contamination of water [39].

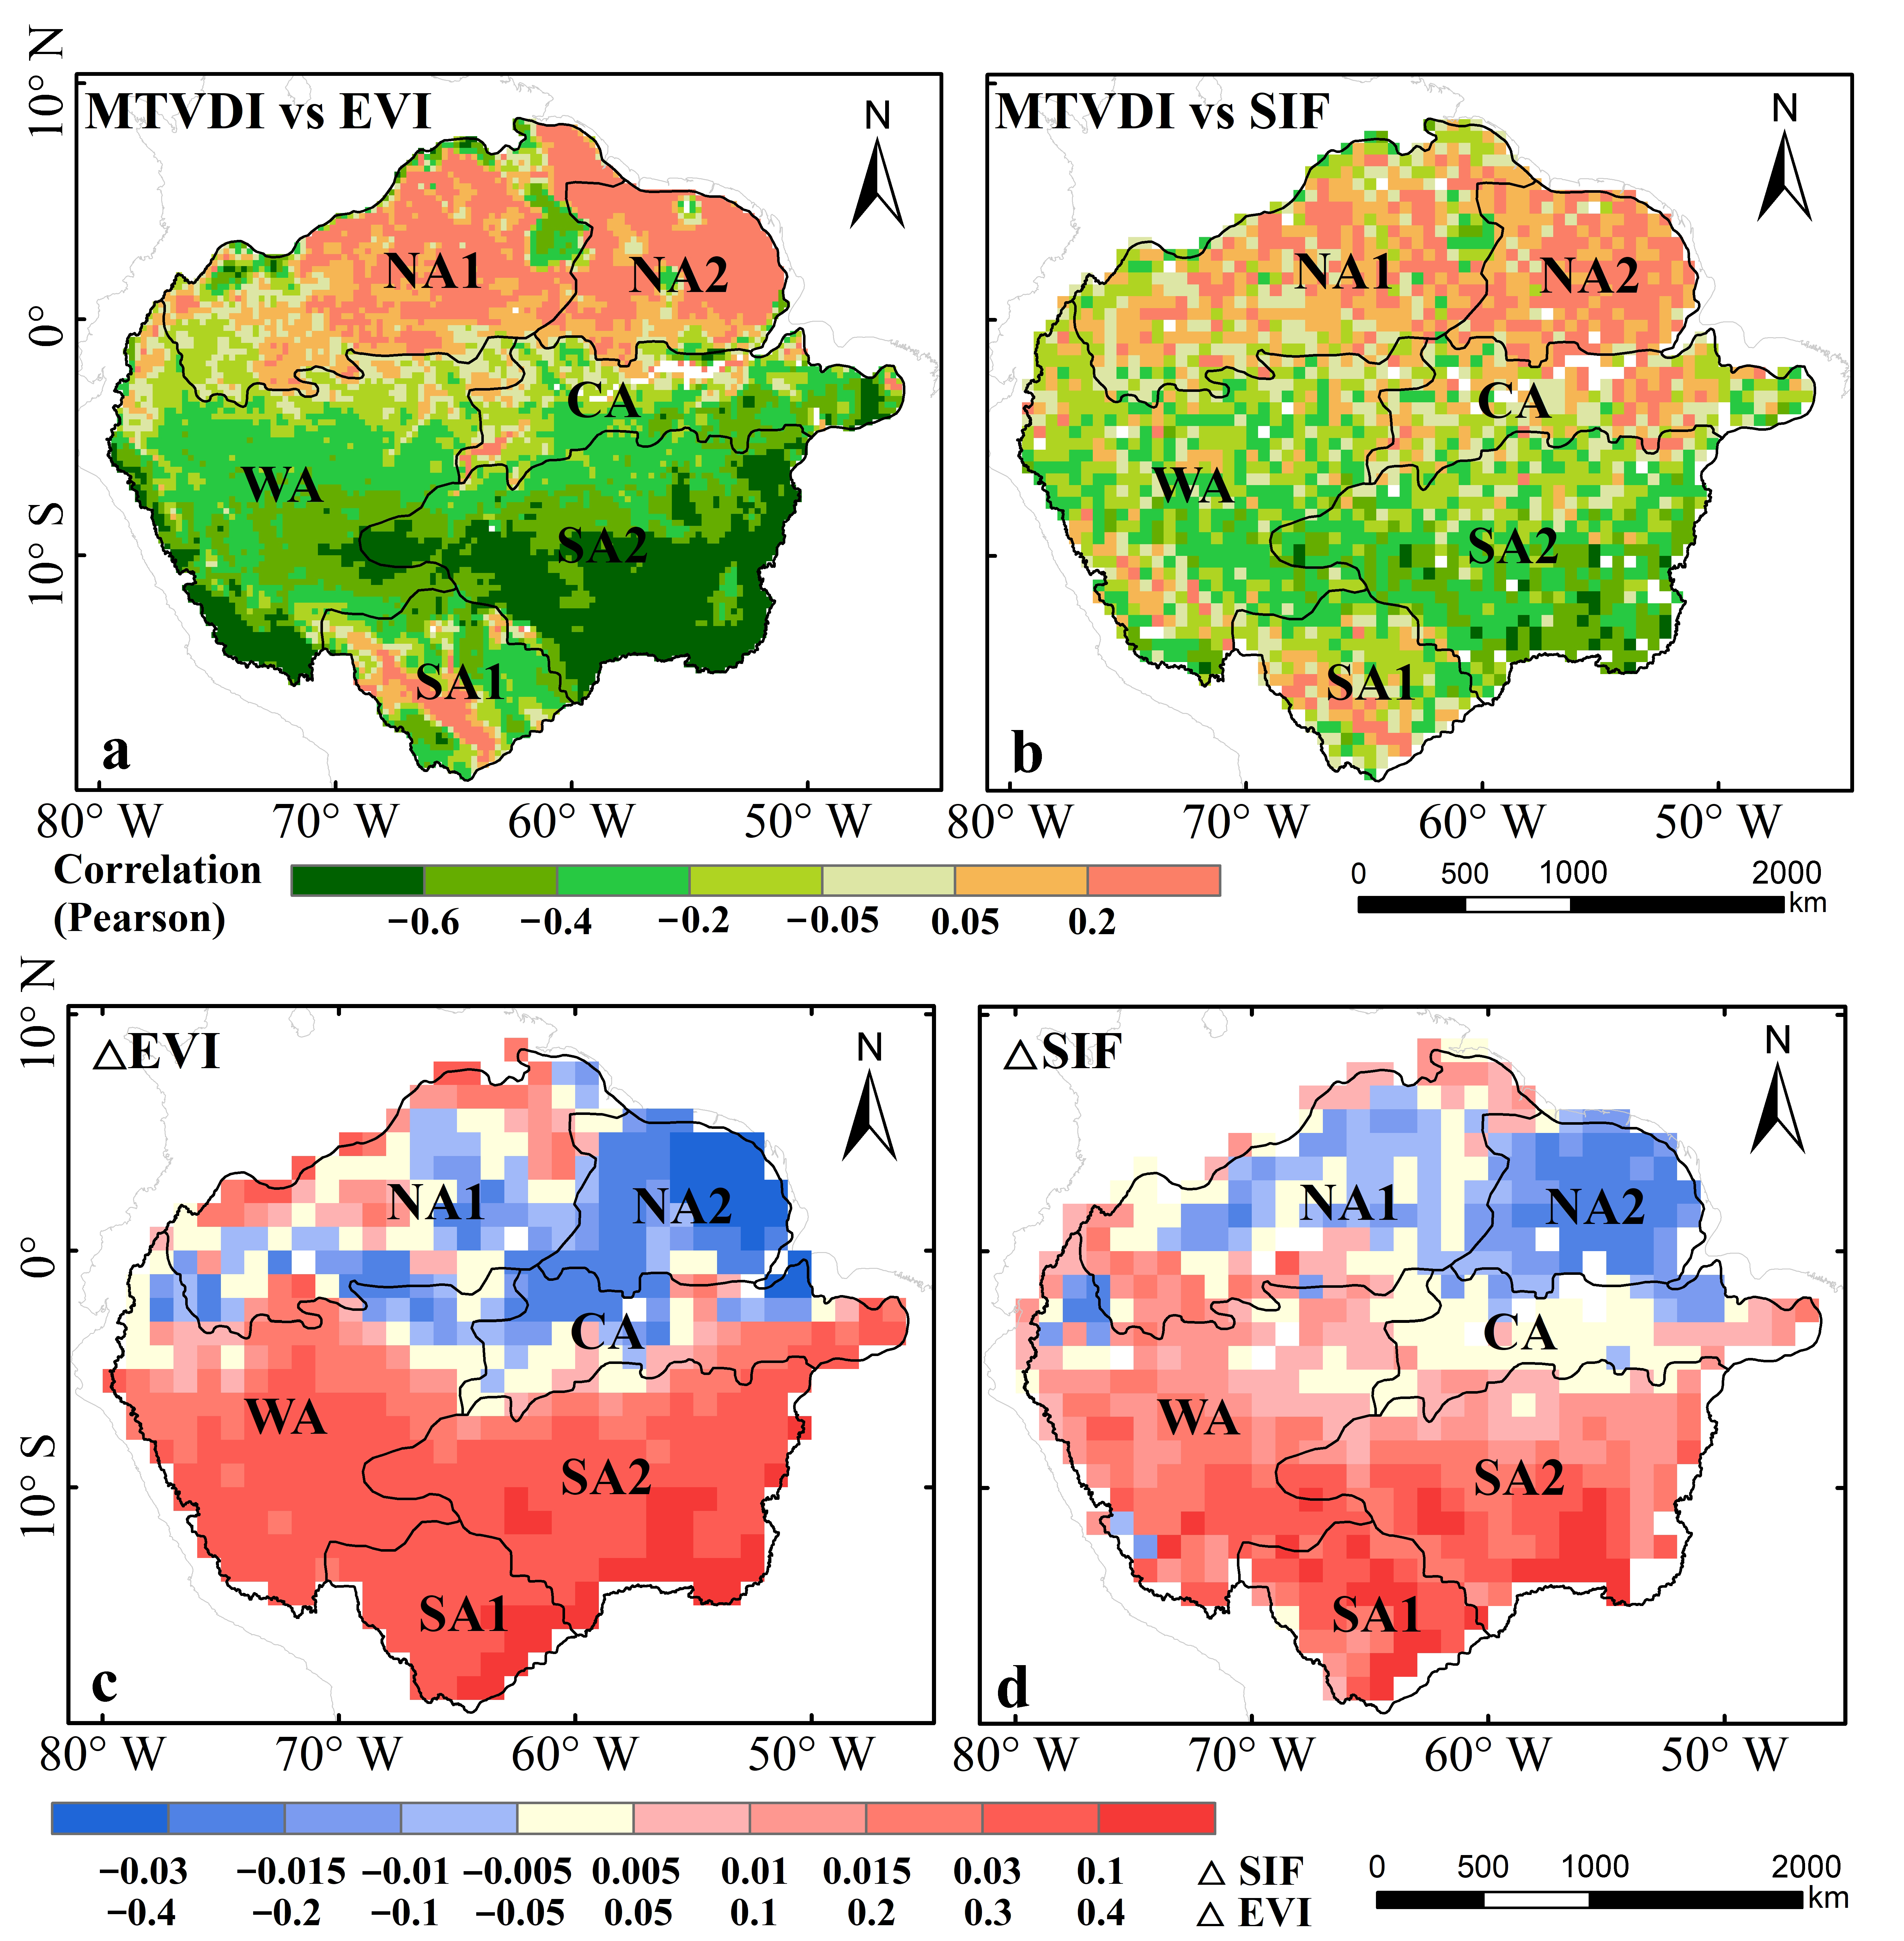
3.4. Capability of MTVDI Seasonality in Representing Canopy Photosynthesis Seasonality

We further compare MTVDI with photosynthesis proxies, the Enhanced Vegetation Index (EVI) and Solar-Induced Chlorophyll Fluorescence (SIF), which were found to have the capability of representing the Amazon dry-season green up [14,67]. The seasonality of MTVDI, SIF and EVI of the whole study area are presented in Figure 8. From Jan to Jun, both EVI and SIF decline and reach the lowest values in Jun. After Jun, EVI and SIF begin to rebound and reached the initial level of about Jan. On the contrary, the MTVDI shows an approximately opposite variation, which corresponds to the fact that the growth of vegetation is inhibited during the drought period (dry season) and is enhanced during the wet season. Therefore, the approximately opposite seasonality between MTVDI and EVI (NSE = 0.75), SIF (NSE = 0.35) indicate that MTVDI has a good capability in reflecting the photosynthesis seasonality of tropical forests in Amazon. Especially in the SA2 (NSE of EVI and SIF are 0.95 and 0.79, respectively) and WA regions (NSE of EVI and SIF are 0.75 and 0.39, respectively) (Supplementary Materials Figure S9, Table S2).
The spatial patterns of linear correlations at the pixel level are presented in Figure 9. In northern parts (NA1 and NA2) of the Amazon tropical forests, the MTVDI shows a positive correlation with both photosynthesis proxies, while in central (CA) and south parts (WA, SA1 and SA2) their correlations are negative. This result exactly coincides with Guan et al. [67]. Guan et al. [67] investigated the differences of the wet-season minus dry- season quantities of simulated ΔEVI and ΔSIF (Figure 9c,d), respectively, and found that those forests which green up during the dry season were located in wet regions with mean annual precipitation (MAP) higher than 2000 mm per year (blue pixels in Figure 9c,d). That is, the red pixels in Figure 9a,b with a positive correlation between EVI, SIF and MTVDI, where the forests show a dry-season green-up. In contrast, for the green pixels that show a negative relation, the forests, however, show canopy loss during dry-season periods. The MTVDI shows good capability in detecting the forest areas, which green up during the dry season in wet regions.

4. Discussions

4.1. MTVDI Captures Amazonian Seasonality

The comparison between MTVDI and drought indicators showed that MTVDI, as a drought indicator [5], matched well with most drought indicators (Supplementary Materials Tables S2 and S3). Results also indicated that the MTVDI performed well in distinguishing different dryness patterns over the Amazon tropical forests. Additionally, MTVDI kept consistent with VPD seasonality which showed great potential in representing the Amazonian phenology [5]. In general, our analysis indicated that MTVDI captures the drought-derived phenology in Amazon rainforest.
MTVDI showed an opposite relationship with photosynthesis proxies (EVI and SIF) on the scale of the entire study area (Figure 8), which was consistent with common sense for drought inhibited vegetation growth because increasing MTVDI cause leaf biomass loss and then decline SIF and EVI. But the correlation between MTVDI and photosynthesis proxies (EVI and SIF) show a divergent patterns between the northern and southern parts of the study area (Figure 9 and Supplementary Materials Figure S9). In southern and southwestern parts of the study area (CA, WA, SA1 and SA2), the opposite seasonal variations (Supplementary Materials Figure S9c–f) between MTVDI and EVI and SIF showed that the vegetation growth of those regions was mainly controlled by water supply [79]. Meanwhile, in the northern and northeastern part of the study area (NA1 and NA2), the consistent seasonal variations (Supplementary Materials Figure S9a,b) and positive correlation (Figure 9a,b) between MTVDI and EVI, SIF suggested the vegetation growth of those regions was restricted by the availability of radiation instead of water availability [6,11].
Seasonality of MTVDI showed consistent or opposite to those of photosynthesis proxies (EVI and SIF) in different subregions (Figure 8, Supplementary Materials Figure S9), which suggest MTVDI can capture the seasonality of both water-related and light-related forests, and matches well with the seasonality of VPD (Figure 6 s and Figure 7a), showing great potential in capturing well the canopy seasonality in Amazon tropical forests. MTVDI especially successfully detected the forest areas which green up during the dry season in wet regions with mean annual precipitation higher than 2000 mm per year (Figure 9c,d). It is because the MTVDI strictly adheres to the physical model, and its construction is closely related to two aspects: abiotic temperature (Ts) and biotic canopy characteristics (MPDI). MTVDI showed better performance in capturing canopy seasonality than climatic dryness indicators such as PDSI, CWD, TWS, and VPD across Amazon tropical forests.

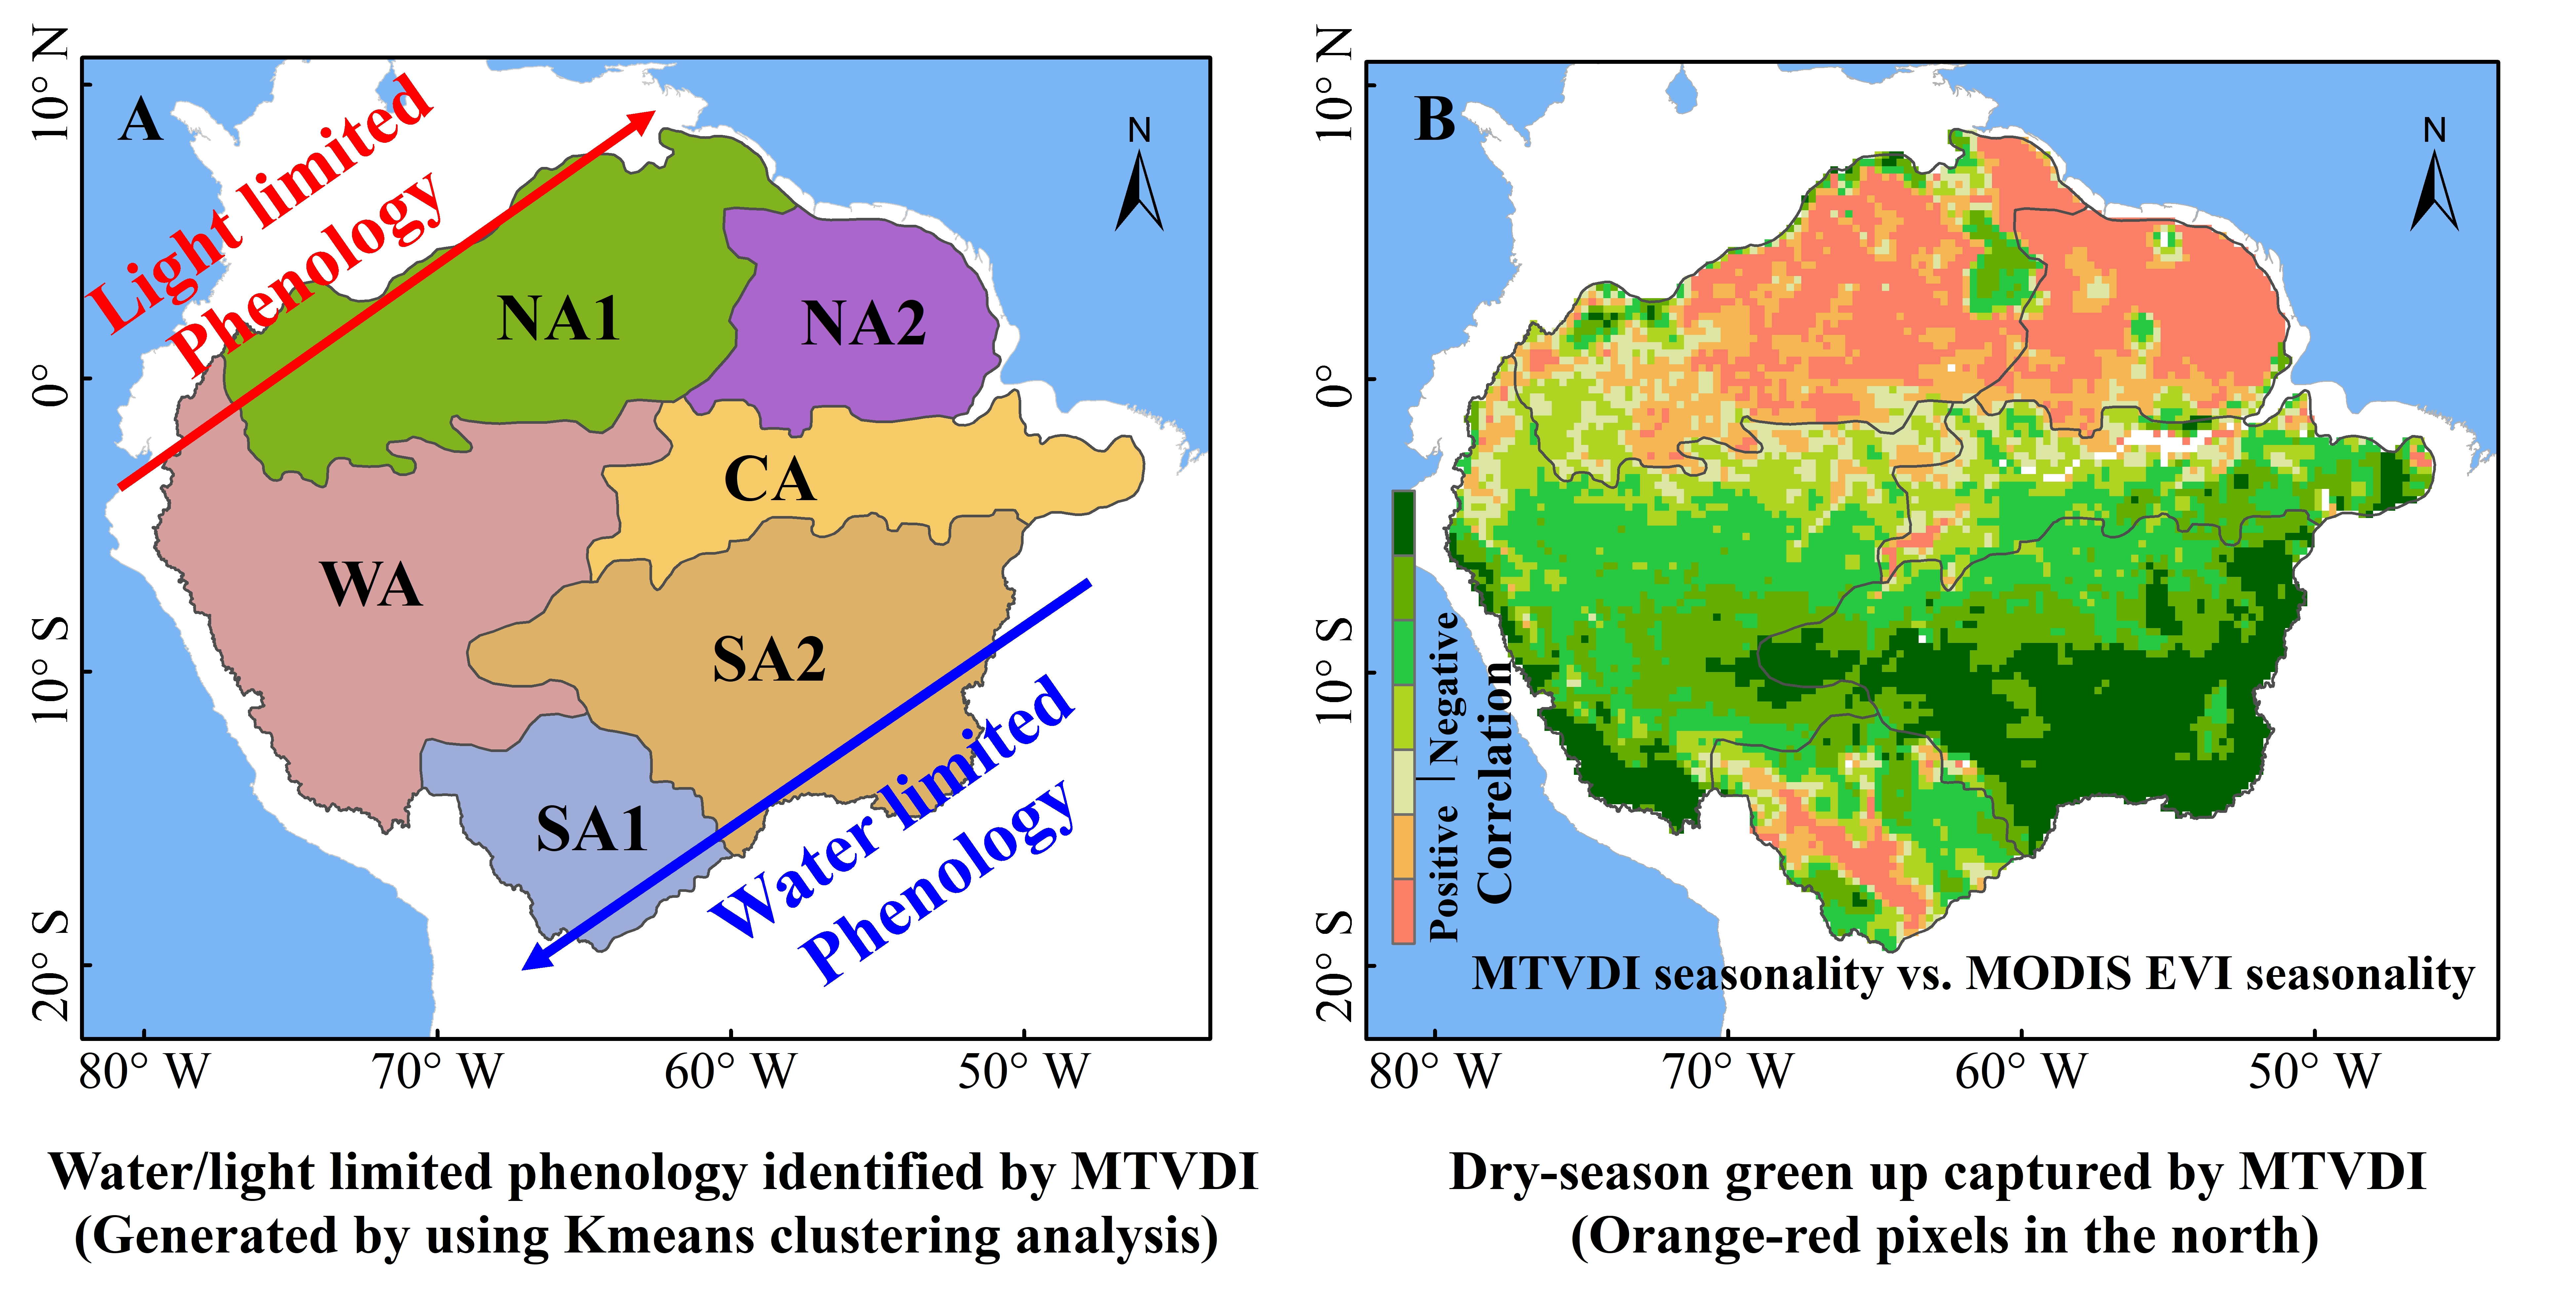
4.2. Light and Water Limitations Identified by MTVDI

The direction and mechanism of canopy seasonality over Amazon tropical forests at a large scale is a complicated and debated question. Some studies [67,81,82] used TWS and CWD data to detect the spatial pattern of canopy dry-season green-up in the Amazon. Meanwhile, in some other studies, VPD, which indicates how the dryness of air temperature affects the closure of plant stomata and thus controls physiological processes such as plant transpiration and photosynthesis [83], is used as a robust trigger of tropical forests canopy seasonality [5]. Actually, the above studies indicate two different viewpoints of Amazonian dry-season “green up”. The first is that it is more likely that Amazon tropical forests encounter soil water deficit during the dry season, while the second is that it is more likely that VPD triggers growth of new leaves and enhances canopy rejuvenation [5]. Wu et al. [8] shows significant canopy rejuvenation due to more new leaves growing in the dry season. Bertani et al. [66] also pointed out that in most parts of the Amazon tropical forests, the largest incident radiation was observed from Aug to Oct and induced an enhanced photosynthesis activity that occurs mainly from Sep to Dec.
Different clusters (Figure 4b) identified by monthly Ts, QSCAT, and NIR data represented different light and water constraints on tropical canopy phenology [79]. The water availability significantly dominated the canopy phenology in the southern parts (e.g., Figure 4b SA1 and SA2) and the canopy phenology of the northeastern parts (e.g., Figure 4b NA2), where there is a significant dry-season green-up, was strongly limited by light availability, and there was a southwest-to-northeast transition from predominantly water-adapted to light-adapted canopy seasonality. The MTVDI clusters (Figure 4a) showed a similar pattern with this previous study (Figure 4b), distinguishing the difference between water-controlled canopy seasonality and light-controlled canopy seasonality.

5. Conclusions

In this paper, a novel Microwave TVDI (MTVDI) that uses passive microwave remote sensing technology was used here to capture the canopy seasonality of tropical evergreen forests across Amazon. Our results indicated that the MTVDI showed consistent or opposite variability with photosynthesis proxies (i.e., EVI and SIF) in different subregions. The MTVDI not only performed better than other climatic dryness indicators such as PDSI. CWD, TWS, and VPD, but also showed good capability in detecting the forest areas which green up during the dry season in wet regions across Amazon tropical forests. MTVDI provides a new choice for the scientific community to investigate canopy growth dynamics in the Amazonian tropical forests.

Supplementary Materials

The following are available online at https://www.mdpi.com/2072-4292/13/3/339/s1, Figure S1: The monthly MNDVI-Ts space in 2003, Figure S2: The monthly MNDVI-Ts space in 2005, Figure S3: The monthly MNDVI-Ts space in 2006, Figure S4: The monthly MNDVI-Ts space in 2007, Figure S5: The monthly MNDVI-Ts space in 2008, Figure S6: The monthly MNDVI-Ts space in 2009, Figure S7: The monthly MNDVI-Ts space in 2010, Figure S8: The seasonality of MTVDI, PDSI, CWD, VPD, and TWS in 6 sub regions of Amazonian tropical forests, Figure S9: The seasonality curve of (a) EVI, (b) SIF in 6 sub regions of Amazonian tropical forests, Table S1: The slope, intercept and R of dry edges and wet edges of MNDVI-Ts triangle in 2004, Table S2: The NSE results of MTVDI against climatic dryness indicators and canopy photosynthesis proxies, Table S3: The statistics of the absolute value of regional mean correlation coefficient (R) of the regression between MTVDI and VPD, CWD, TWS and PDSI in each sub region.

Author Contributions

Conceptualization, X.C. and L.L.; methodology, L.L. and X.Y.; software, L.L. and X.Y.; validation, L.L., X.Y. and F.G.; formal analysis, X.Y. and F.G.; investigation, X.Y. and F.G.; resources, X.Y.; data curation, L.L. and X.Y.; writing—original draft preparation, L.L., X.Y. and F.G.; writing—review and editing, L.L., X.C., Y.S. and G.H.; visualization, L.L.; supervision, X.C., Y.S. and G.H.; project administration, X.C. and Y.S.; funding acquisition, X.C. and Y.S. All authors have read and agreed to the published version of the manuscript.

Funding

This research was funded by the National Natural Science Foundation of China, grant numbers 31971458, 41971275 and 41907289; the Key Special Project for Introduced Talents Team of Southern Marine Science and Engineering Guangdong Laboratory (Guangzhou), grant number GML2019ZD0301; the Guangdong Basic and Applied Basic Research Foundation, grant number 2020A151501091; the GDAS Special Project of Science and Technology Development, grant number 2020GDASYL-20200102002.

Institutional Review Board Statement

Not applicable.

Informed Consent Statement

Not applicable.

Data Availability Statement

The data presented in this study are available on request from the corresponding author.

Conflicts of Interest

The authors declare no conflict of interest.

References

  1. Pan, Y.; Birdsey, R.A.; Fang, J.; Houghton, R.; Kauppi, P.E.; Kurz, W.A.; Phillips, O.L.; Shvidenko, A.; Lewis, S.L.; Canadell, J.G.; et al. A Large and Persistent Carbon Sink in the World’s Forests. Science 2011, 333, 988–993. [Google Scholar] [CrossRef] [PubMed] [Green Version]
  2. Field, C.B.; Behrenfeld, M.J.; Randerson, J.T.; Falkowski, P. Primary Production of the Biosphere: Integrating Terrestrial and Oceanic Components. Science 1998, 281, 237–240. [Google Scholar] [CrossRef] [Green Version]
  3. Maslin, M.; Malhi, Y.; Phillips, O.; Cowling, S. New Views on an Old Forest: Assessing the Longevity, Resilience and Future of the Amazon Rainforest. Trans. Inst. Br. Geogr. 2005, 30, 477–499. [Google Scholar] [CrossRef]
  4. Boisier, J.P.; Ciais, P.; Ducharne, A.; Guimberteau, M. Projected Strengthening of Amazonian Dry Season by Constrained Climate Model Simulations. Nat. Clim. Chang. 2015, 5, 656–660. [Google Scholar] [CrossRef]
  5. Chen, X.; Maignan, F.; Viovy, N.; Bastos, A.; Goll, D.; Wu, J.; Liu, L.; Yue, C.; Peng, S.; Yuan, W.; et al. Novel Representation of Leaf Phenology Improves Simulation of Amazonian Evergreen Forest Photosynthesis in a Land Surface Model. J. Adv. Model. Earth Syst. 2020, 12, e2018MS001565. [Google Scholar] [CrossRef] [Green Version]
  6. Myneni, R.B.; Yang, W.; Nemani, R.R.; Huete, A.R.; Dickinson, R.E.; Knyazikhin, Y.; Didan, K.; Fu, R.; Juárez, R.I.N.; Saatchi, S.S.; et al. Large Seasonal Swings in Leaf Area of Amazon Rainforests. Proc. Natl. Acad. Sci. USA 2007, 104, 4820–4823. [Google Scholar] [CrossRef] [Green Version]
  7. Fu, Y.; Argus, D.F.; Freymueller, J.T.; Heflin, M.B. Horizontal Motion in Elastic Response to Seasonal Loading of Rain Water in the Amazon Basin and Monsoon Water in Southeast Asia Observed by GPS and Inferred from GRACE. Geophys. Res. Lett. 2013, 40, 6048–6053. [Google Scholar] [CrossRef]
  8. Wu, J.; Albert, L.P.; Lopes, A.P.; Restrepo-Coupe, N.; Hayek, M.; Wiedemann, K.T.; Guan, K.; Stark, S.C.; Christoffersen, B.; Prohaska, N.; et al. Leaf Development and Demography Explain Photosynthetic Seasonality in Amazon Evergreen Forests. Science 2016, 351, 972–976. [Google Scholar] [CrossRef] [Green Version]
  9. Anderson, L.O.; Ribeiro Neto, G.; Cunha, A.P.; Fonseca, M.G.; Mendes de Moura, Y.; Dalagnol, R.; Wagner, F.H.; de Aragão, L.E.O.C. Vulnerability of Amazonian Forests to Repeated Droughts. Philos. Trans. R. Soc. B Biol. Sci. 2018, 373. [Google Scholar] [CrossRef]
  10. Liu, L.; Liao, J.; Chen, X.; Zhou, G.; Su, Y.; Xiang, Z.; Wang, Z.; Liu, X.; Li, Y.; Wu, J.; et al. The Microwave Temperature Vegetation Drought Index (MTVDI) Based on AMSR-E Brightness Temperatures for Long-Term Drought Assessment across China (2003–2010). Remote Sens. Environ. 2017, 199, 302–320. [Google Scholar] [CrossRef]
  11. Huete, A.R.; Didan, K.; Shimabukuro, Y.E.; Ratana, P.; Saleska, S.R.; Hutyra, L.R.; Yang, W.; Nemani, R.R.; Myneni, R. Amazon Rainforests Green-up with Sunlight in Dry Season. Geophys. Res. Lett. 2006, 33. [Google Scholar] [CrossRef] [Green Version]
  12. Xiao, X.; Zhang, Q.; Saleska, S.; Hutyra, L.; De Camargo, P.; Wofsy, S.; Frolking, S.; Boles, S.; Keller, M.; Moore, B. Satellite-Based Modeling of Gross Primary Production in a Seasonally Moist Tropical Evergreen Forest. Remote Sens. Environ. 2005, 94, 105–122. [Google Scholar] [CrossRef]
  13. Merrick, T.; Pau, S.; Jorge, M.L.S.P.; Silva, T.S.F.; Bennartz, R. Spatiotemporal Patterns and Phenology of Tropical Vegetation Solar-Induced Chlorophyll Fluorescence across Brazilian Biomes Using Satellite Observations. Remote Sens. 2019, 11, 1746. [Google Scholar] [CrossRef] [Green Version]
  14. Saleska, S.R.; Wu, J.; Guan, K.; Araujo, A.C.; Huete, A.; Nobre, A.D.; Restrepo-Coupe, N. Dry-Season Greening of Amazon Forests. Nature 2016, 531, E4–E5. [Google Scholar] [CrossRef] [PubMed]
  15. Morton, D.C.; Nagol, J.; Carabajal, C.C.; Rosette, J.; Palace, M.; Cook, B.D.; Vermote, E.F.; Harding, D.J.; North, P.R.J. Amazon Forests Maintain Consistent Canopy Structure and Greenness during the Dry Season. Nature 2014, 506, 221–224. [Google Scholar] [CrossRef]
  16. Samanta, A.; Ganguly, S.; Hashimoto, H.; Devadiga, S.; Vermote, E.; Knyazikhin, Y.; Nemani, R.R.; Myneni, R.B. Amazon Forests Did Not Green-up during the 2005 Drought. Geophys. Res. Lett. 2010, 37. [Google Scholar] [CrossRef]
  17. Samanta, A.; Ganguly, S.; Myneni, R.B. MODIS Enhanced Vegetation Index Data Do Not Show Greening of Amazon Forests during the 2005 Drought. New Phytol. 2011, 189, 11–15. [Google Scholar] [CrossRef]
  18. Andela, N.; Liu, Y.Y.; van Dijk, A.I.J.M.; de Jeu, R.A.M.; McVicar, T.R. Global Changes in Dryland Vegetation Dynamics (1988–2008) Assessed by Satellite Remote Sensing: Combining a New Passive Microwave Vegetation Density Record with Reflective Greenness Data. Biogeosci. Discuss. 2013, 10, 8749–8797. [Google Scholar] [CrossRef]
  19. Liu, Y.Y.; de Jeu, R.A.M.; McCabe, M.F.; Evans, J.P.; van Dijk, A.I.J.M. Global Long-Term Passive Microwave Satellite-Based Retrievals of Vegetation Optical Depth. Geophys. Res. Lett. 2011, 38, L18402. [Google Scholar] [CrossRef] [Green Version]
  20. Xu, L.; Samanta, A.; Costa, M.H.; Ganguly, S.; Nemani, R.R.; Myneni, R.B. Widespread Decline in Greenness of Amazonian Vegetation Due to the 2010 Drought. Geophys. Res. Lett. 2011, 38. [Google Scholar] [CrossRef] [Green Version]
  21. Shi, J.; Jackson, T.; Tao, J.; Du, J.; Bindlish, R.; Lu, L.; Chen, K.S. Microwave Vegetation Indices for Short Vegetation Covers from Satellite Passive Microwave Sensor AMSR-E. Remote Sens. Environ. 2008, 112, 4285–4300. [Google Scholar] [CrossRef]
  22. Fan, L.; Wigneron, J.-P.; Xiao, Q.; Al-Yaari, A.; Wen, J.; Martin-StPaul, N.; Dupuy, J.-L.; Pimont, F.; Al Bitar, A.; Fernandez-Moran, R.; et al. Evaluation of Microwave Remote Sensing for Monitoring Live Fuel Moisture Content in the Mediterranean Region. Remote Sens. Environ. 2018, 205, 210–223. [Google Scholar] [CrossRef]
  23. Woodhouse, I.H. Introduction to Microwave Remote Sensing; CRC Press: Boca Raton, FL, USA, 2017; ISBN 1-351-98901-4. [Google Scholar]
  24. Zhang, A.; Jia, G. Monitoring Meteorological Drought in Semiarid Regions Using Multi-Sensor Microwave Remote Sensing Data. Remote Sens. Environ. 2013, 134, 12–23. [Google Scholar] [CrossRef]
  25. Wigneron, J.-P.; Fan, L.; Ciais, P.; Bastos, A.; Brandt, M.; Chave, J.; Saatchi, S.; Baccini, A.; Fensholt, R. Tropical Forests Did Not Recover from the Strong 2015–2016 El Niño Event. Sci. Adv. 2020, 6, eaay4603. [Google Scholar] [CrossRef] [Green Version]
  26. Fan, L.; Wigneron, J.-P.; Ciais, P.; Chave, J.; Brandt, M.; Fensholt, R.; Saatchi, S.S.; Bastos, A.; Al-Yaari, A.; Hufkens, K.; et al. Satellite-Observed Pantropical Carbon Dynamics. Nat. Plants 2019, 5, 944–951. [Google Scholar] [CrossRef]
  27. Saatchi, S.; Asefi-Najafabady, S.; Malhi, Y.; Aragão, L.E.O.C.; Anderson, L.O.; Myneni, R.B.; Nemani, R. Persistent Effects of a Severe Drought on Amazonian Forest Canopy. Proc. Natl. Acad. Sci. USA 2013, 110, 565–570. [Google Scholar] [CrossRef] [Green Version]
  28. Sandholt, I.; Rasmussen, K.; Andersen, J. A Simple Interpretation of the Surface Temperature/Vegetation Index Space for Assessment of Surface Moisture Status. Remote Sens. Environ. 2002, 79, 213–224. [Google Scholar] [CrossRef]
  29. Humphrey, V.; Gudmundsson, L. GRACE-REC: A Reconstruction of Climate-Driven Water Storage Changes over the Last Century. Earth Syst. Sci. Data 2019, 11, 1153–1170. [Google Scholar] [CrossRef] [Green Version]
  30. Yuan, W.; Zheng, Y.; Piao, S.; Ciais, P.; Lombardozzi, D.; Wang, Y.; Ryu, Y.; Chen, G.; Dong, W.; Hu, Z.; et al. Increased Atmospheric Vapor Pressure Deficit Reduces Global Vegetation Growth. Sci. Adv. 2019, 5, eaax1396. [Google Scholar] [CrossRef] [Green Version]
  31. Palmer, W. Meteorological Drought; Research Paper No. 45; U.S. Department of Commerce Weather Bureau: Washington, DC, USA, 1965.
  32. Malhi, Y.; Aragão, L.E.O.C.; Galbraith, D.; Huntingford, C.; Fisher, R.; Zelazowski, P.; Sitch, S.; McSweeney, C.; Meir, P. Exploring the Likelihood and Mechanism of a Climate-Change-Induced Dieback of the Amazon Rainforest. Proc. Natl. Acad. Sci. USA 2009, 106, 20610–20615. [Google Scholar] [CrossRef] [Green Version]
  33. Huete, A.; Didan, K.; Miura, T.; Rodriguez, E.P.; Gao, X.; Ferreira, L.G. Overview of the Radiometric and Biophysical Performance of the MODIS Vegetation Indices. Remote Sens. Environ. 2002, 83, 195–213. [Google Scholar] [CrossRef]
  34. Joiner, J.; Guanter, L.; Lindstrot, R.; Voigt, M.; Vasilkov, A.P.; Middleton, E.M.; Huemmrich, K.F.; Yoshida, Y.; Frankenberg, C. Global Monitoring of Terrestrial Chlorophyll Fluorescence from Moderate Spectral Resolution Near-Infrared Satellite Measurements: Methodology, Simulations, and Application to GOME-2. Atmos. Meas. Tech. 2013, 6, 2803–2823. [Google Scholar] [CrossRef] [Green Version]
  35. Chen, J.L.; Wilson, C.R.; Tapley, B.D. The 2009 Exceptional Amazon Flood and Interannual Terrestrial Water Storage Change Observed by GRACE. Water Resour. Res. 2010, 46. [Google Scholar] [CrossRef] [Green Version]
  36. Marengo, J.A. Characteristics and Spatio-Temporal Variability of the Amazon River Basin Water Budget. Clim. Dyn. 2005, 24, 11–22. [Google Scholar] [CrossRef]
  37. Costa, M.H.; Foley, J.A. A Comparison of Precipitation Datasets for the Amazon Basin. Geophys. Res. Lett. 1998, 25, 155–158. [Google Scholar] [CrossRef]
  38. Friedl, M.; Sulla-Menashe, D. MCD12C1 MODIS/Terra+ Aqua Land Cover Type Yearly L3 Global 0.05 Deg CMG V006 [Data Set]. NASA EOSDIS Land Process. DAAC 2015. [Google Scholar] [CrossRef]
  39. McFarland, M.J.; Miller, R.L.; Neale, C.M.U. Land Surface Temperature Derived from the SSM/I Passive Microwave Brightness Temperatures. IEEE Trans. Geosci. Remote Sens. 1990, 28, 839–845. [Google Scholar] [CrossRef]
  40. Kawanishi, T.; Sezai, T.; Ito, Y.; Imaoka, K.; Takeshima, T.; Ishido, Y.; Shibata, A.; Miura, M.; Inahata, H.; Spencer, R.W. The Advanced Microwave Scanning Radiometer for the Earth Observing System (AMSR-E), NASDA’s Contribution to the EOS for Global Energy and Water Cycle Studies. IEEE Trans. Geosci. Remote Sens. 2003, 41, 184–194. [Google Scholar] [CrossRef]
  41. Parkinson, C.L. Aqua: An Earth-Observing Satellite Mission to Examine Water and Other Climate Variables. IEEE Trans. Geosci. Remote Sens. 2003, 41, 173–183. [Google Scholar] [CrossRef]
  42. Imaoka, K.; Kachi, M.; Kasahara, M.; Ito, N.; Nakagawa, K.; Oki, T. Instrument Performance and Calibration of AMSR-E and AMSR2. Int. Arch. Photogramm. Remote Sens. Spat. Inf. Sci. ISPRS Arch. 2010, 38, 13–16. [Google Scholar]
  43. Kerr, Y.H.; Njoku, E.G. A Semiempirical Model for Interpreting Microwave Emission from Semiarid Land Surfaces as Seen from Space. IEEE Trans. Geosci. Remote Sens. 1990, 28, 384–393. [Google Scholar] [CrossRef]
  44. Owe, M.; de Jeu, R.; Holmes, T. Multisensor Historical Climatology of Satellite-Derived Global Land Surface Moisture. J. Geophys. Res. Earth Surf. 2008, 113. [Google Scholar] [CrossRef]
  45. Njoku, E.G.; Ashcroft, P.; Chan, T.K.; Li, L. Global Survey and Statistics of Radio-Frequency Interference in AMSR-E Land Observations. IEEE Trans. Geosci. Remote Sens. 2005, 43, 938–947. [Google Scholar] [CrossRef]
  46. Nash, J.E.; Sutcliffe, J.V. River Flow Forecasting through Conceptual Models Part I—A Discussion of Principles. J. Hydrol. 1970, 10, 282–290. [Google Scholar] [CrossRef]
  47. Syed, T.H.; Famiglietti, J.S.; Rodell, M.; Chen, J.; Wilson, C.R. Analysis of Terrestrial Water Storage Changes from GRACE and GLDAS. Water Resour. Res. 2008, 44. [Google Scholar] [CrossRef]
  48. Rodell, M.; Chen, J.; Kato, H.; Famiglietti, J.S.; Nigro, J.; Wilson, C.R. Estimating Groundwater Storage Changes in the Mississippi River Basin (USA) Using GRACE. Hydrogeol. J. 2007, 15, 159–166. [Google Scholar] [CrossRef] [Green Version]
  49. Reager, J.T.; Famiglietti, J.S. Characteristic Mega-basin Water Storage Behavior Using GRACE. Water Resour. Res. 2013, 49, 3314–3329. [Google Scholar] [CrossRef] [PubMed] [Green Version]
  50. Crowley, J.W.; Mitrovica, J.X.; Bailey, R.C.; Tamisiea, M.E.; Davis, J.L. Land Water Storage within the Congo Basin Inferred from GRACE Satellite Gravity Data. Geophys. Res. Lett. 2006, 33. [Google Scholar] [CrossRef]
  51. Ramillien, G.; Famiglietti, J.S.; Wahr, J. Detection of Continental Hydrology and Glaciology Signals from GRACE: A Review. Surv. Geophys. 2008, 29, 361–374. [Google Scholar] [CrossRef]
  52. Rawson, H.M.; Begg, J.; Woodward, R. The Effect of Atmospheric Humidity on Photosynthesis, Transpiration and Water Use Efficiency of Leaves of Several Plant Species. Planta 1977, 134, 5–10. [Google Scholar] [CrossRef]
  53. Cunningham, S.C. Stomatal Sensitivity to Vapour Pressure Deficit of Temperate and Tropical Evergreen Rainforest Trees of Australia. Trees 2004, 18, 399–407. [Google Scholar] [CrossRef]
  54. Tombesi, S.; Nardini, A.; Frioni, T.; Soccolini, M.; Zadra, C.; Farinelli, D.; Poni, S.; Palliotti, A. Stomatal Closure Is Induced by Hydraulic Signals and Maintained by ABA in Drought-Stressed Grapevine. Sci. Rep. 2015, 5, 12449. [Google Scholar] [CrossRef] [PubMed]
  55. Shirke, P.A.; Pathre, U.V. Influence of Leaf-to-Air Vapour Pressure Deficit (VPD) on the Biochemistry and Physiology of Photosynthesis in Prosopis Juliflora. J. Exp. Bot. 2004, 55, 2111–2120. [Google Scholar] [CrossRef] [PubMed]
  56. Dee, D.P.; de Uppala, S.M.; Simmons, A.J.; Berrisford, P.; Poli, P.; Kobayashi, S.; Andrae, U.; Balmaseda, M.; Balsamo, G.; Vitart, F.; et al. The ERA-Interim Reanalysis: Configuration and Performance of the Data Assimilation System. Q. J. R. Meteorol. Soc. 2011, 137, 553–597. [Google Scholar] [CrossRef]
  57. Mishra, A.K.; Singh, V.P. A Review of Drought Concepts. J. Hydrol. 2010, 391, 202–216. [Google Scholar] [CrossRef]
  58. Zhao, H.; Gao, G.; An, W.; Zou, X.; Li, H.; Hou, M. Timescale Differences between SC-PDSI and SPEI for Drought Monitoring in China. Phys. Chem. Earth Parts ABC 2017, 102, 48–58. [Google Scholar] [CrossRef]
  59. Abatzoglou, J.T.; Dobrowski, S.Z.; Parks, S.A.; Hegewisch, K.C. TerraClimate, a High-Resolution Global Dataset of Monthly Climate and Climatic Water Balance from 1958–2015. Sci. Data 2018, 5, 170191. [Google Scholar] [CrossRef] [Green Version]
  60. Viovy, N. CRUNCEP Version 7–Atmospheric Forcing Data for the Community Land Model. Available online: https://rda.ucar.edu/datasets/ds314.3/ (accessed on 19 May 2020).
  61. Aragão, L.; Malhi, Y.; Román-Cuesta, R.M.; Saatchi, S.; Anderson, L.; Shimabukuro, Y. Spatial Patterns and Fire Response of Recent Amazonian Droughts. Geophys. Res. Lett. 2007, 34. [Google Scholar] [CrossRef] [Green Version]
  62. Rocha, H.; Goulden, M.; Miller, S.; Menton, M.; Pinto, L.; Freitas, H.; Figueira, A. Seasonality of Water and Heat Fluxes over a Tropical Forest in Eastern Amazonia. Ecol. Appl. 2004, 14, 22–32. [Google Scholar] [CrossRef]
  63. von Randow, C.; Manzi, A.O.; Kruijt, B.; de Oliveira, P.J.; Zanchi, F.B.; Silva, R.L.; Hodnett, M.G.; Gash, J.H.C.; Elbers, J.A.; Waterloo, M.J.; et al. Comparative Measurements and Seasonal Variations in Energy and Carbon Exchange over Forest and Pasture in South West Amazonia. Theor. Appl. Climatol. 2004, 78, 5–26. [Google Scholar] [CrossRef]
  64. Shuttleworth, W.J.; Leuning, R.; Black, T.A.; Grace, J.; Jarvis, P.G.; Roberts, J.; Jones, H.G.; Jarvis, P.G.; Monteith, J.L.; Shuttleworth, W.J.; et al. Micrometeorology of Temperate and Tropical Forest. Philos. Trans. R. Soc. Lond. B Biol. Sci. 1989, 324, 299–334. [Google Scholar] [CrossRef]
  65. Gao, X.; Huete, A.R.; Ni, W.; Miura, T. Optical–Biophysical Relationships of Vegetation Spectra without Background Contamination. Remote Sens. Environ. 2000, 74, 609–620. [Google Scholar] [CrossRef]
  66. Bertani, G.; Wagner, F.; Aragão, L.; Anderson, L. Remote Sensing of Solar-Induced Chlorophyll Fluorescence for Describing Photosynthesis Seasonality in the Amazon Forest; INPE Press: Santos, SP, Brazil, 2017; ISBN 978-85-17-00088-1. [Google Scholar]
  67. Guan, K.; Pan, M.; Li, H.; Wolf, A.; Wu, J.; Medvigy, D.; Caylor, K.K.; Sheffield, J.; Wood, E.F.; Malhi, Y.; et al. Photosynthetic Seasonality of Global Tropical Forests Constrained by Hydroclimate. Nat. Geosci. 2015, 8, 284–289. [Google Scholar] [CrossRef]
  68. Lee, J.-E.; Frankenberg, C.; Tol, C.; Berry, J.; Guanter, L.; Boyce, C.; Fisher, J.; Morrow, E.; Worden, J.; Asefi-Najafabady, S.; et al. Forest Productivity and Water Stress in Amazonia: Observations from GOSAT Chlorophyll Fluorescence. Proc. R. Soc. B Biol. Sci. 2013, 280. [Google Scholar] [CrossRef] [PubMed] [Green Version]
  69. Frankenberg, C.; O’Dell, C.; Berry, J.; Guanter, L.; Joiner, J.; Köhler, P.; Pollock, R.; Taylor, T.E. Prospects for Chlorophyll Fluorescence Remote Sensing from the Orbiting Carbon Observatory-2. Remote Sens. Environ. 2014, 147, 1–12. [Google Scholar] [CrossRef] [Green Version]
  70. Joiner, J.; Yoshida, Y.; Guanter, L.; Middleton, E.M. New Methods for the Retrieval of Chlorophyll Red Fluorescence from Hyperspectral Satellite Instruments: Simulations and Application to GOME-2 and SCIAMACHY. Atmos. Meas. Tech. 2016, 9, 3939–3967. [Google Scholar] [CrossRef] [Green Version]
  71. Campforts, B.; Vanacker, V.; Vanderborght, J.; Baken, S.; Smolders, E.; Govers, G. Simulating the Mobility of Meteoric 10Be in the Landscape through a Coupled Soil-Hillslope Model (Be2D). Earth Planet. Sci. Lett. 2016, 439, 143–157. [Google Scholar] [CrossRef]
  72. Moriasi, D.N.; Arnold, J.G.; Liew, M.W.V.; Bingner, R.L.; Harmel, R.D.; Veith, T.L. Model Evaluation Guidelines for Systematic Quantification of Accuracy in Watershed Simulations. Trans. ASABE 2007. [Google Scholar] [CrossRef]
  73. Fernández-Peruchena, C.M.; Blanco, M.; Gastón, M.; Bernardos, A. Increasing the Temporal Resolution of Direct Normal Solar Irradiance Series in Different Climatic Zones. Sol. Energy 2015, 115, 255–263. [Google Scholar] [CrossRef]
  74. Soltani, S.; Modarres, R.; Eslamian, S.S. The Use of Time Series Modeling for the Determination of Rainfall Climates of Iran. Int. J. Climatol. 2007, 27, 819–829. [Google Scholar] [CrossRef]
  75. Jim, C.Y.; He, H. Estimating Heat Flux Transmission of Vertical Greenery Ecosystem. Ecol. Eng. 2011, 37, 1112–1122. [Google Scholar] [CrossRef]
  76. Dass, P.; Rawlins, M.A.; Kimball, J.S.; Kim, Y. Environmental Controls on the Increasing GPP of Terrestrial Vegetation across Northern Eurasia. Biogeosciences 2016, 13, 45–62. [Google Scholar] [CrossRef] [Green Version]
  77. Wu, K.; Johnston, C.A. Hydrologic Response to Climatic Variability in a Great Lakes Watershed: A Case Study with the SWAT Model. J. Hydrol. 2007, 337, 187–199. [Google Scholar] [CrossRef]
  78. Wilks, D.S. Statistical Methods in the Atmospheric Sciences; Academic Press: Cambridge, MA, USA, 2011; Volume 100, ISBN 0-12-385022-3. [Google Scholar]
  79. Xu, L.; Saatchi, S.S.; Yang, Y.; Myneni, R.B.; Frankenberg, C.; Chowdhury, D.; Bi, J. Satellite Observation of Tropical Forest Seasonality: Spatial Patterns of Carbon Exchange in Amazonia. Environ. Res. Lett. 2015, 10, 084005. [Google Scholar] [CrossRef]
  80. Jones, M.O.; Kimball, J.S.; Nemani, R.R. Asynchronous Amazon Forest Canopy Phenology Indicates Adaptation to Both Water and Light Availability. Environ. Res. Lett. 2014, 9, 124021. [Google Scholar] [CrossRef]
  81. Chen, J.L.; Wilson, C.R.; Famiglietti, J.S.; Rodell, M. Spatial Sensitivity of the Gravity Recovery and Climate Experiment (GRACE) Time-Variable Gravity Observations. J. Geophys. Res. Solid Earth 2005, 110. [Google Scholar] [CrossRef] [Green Version]
  82. Phillips, O.L.; Aragão, L.E.O.C.; Lewis, S.L.; Fisher, J.B.; Lloyd, J.; López-González, G.; Malhi, Y.; Monteagudo, A.; Peacock, J.; Quesada, C.A.; et al. Drought Sensitivity of the Amazon Rainforest. Science 2009, 323, 1344–1347. [Google Scholar] [CrossRef] [Green Version]
  83. Zhang, K.; de Almeida Castanho, A.D.; Galbraith, D.R.; Moghim, S.; Levine, N.M.; Bras, R.L.; Coe, M.T.; Costa, M.H.; Malhi, Y.; Longo, M.; et al. The Fate of Amazonian Ecosystems over the Coming Century Arising from Changes in Climate, Atmospheric CO2, and Land Use. Glob. Chang. Biol. 2015, 21, 2569–2587. [Google Scholar] [CrossRef]
Figure 1. Study area. The vegetation map was extracted from MODIS land cover product in 2005.
Remotesensing 13 00339 g001
Figure 2. The monthly land suface temperature (Ts)-Microwave Normalized Difference Vegetation Index (MNDVI) (Ts-MNDVI) space in 2004.
Remotesensing 13 00339 g002
Figure 3. Spatial pattern of MTVDI seasonality over Amazonian tropical forests. The seasonality represents the mean values of each month from 2003 to 2010. Subplots (al) are monthly mean MTVDI from Januray to December, respectively.
Remotesensing 13 00339 g003
Figure 4. The spatial distribution of (a) K-means clustering analysis map of MTVDI, (b) The seasonality cluster map identified from monthly data of land surface temperature (Ts), canopy backscatter from Quick Scatterometer (QSCAT), and reflectance of near-infrared (NIR).
Remotesensing 13 00339 g004
Figure 5. The seasonal variation of MTVDI over Amazonian tropical forests. The seasonality represents the mean values of each month from 2003 to 2010. NA1, NA2, CA, WA, SA1, and SA2 are the abbreviation of each subregion in Figure 4a. The gray shadings represent standard error of the mean (SEM).
Remotesensing 13 00339 g005
Figure 6. Seasonality of MTVDI, Palmer Drought Severity Index (PDSI), Climatological Water Deficit (CWD), Terrestrial Water Storage (TWS), and Vapor Pressure Deficit (VPD) in Amazonian tropical forests. The seasonality represents the mean values of each month from 2003 to 2010. The gray shadings represent standard error of the mean (SEM). The negative values of PDSI, CWD, and TWS mean a drier condition, and positive values of MTVDI and VPD indicate a drier condition.
Remotesensing 13 00339 g006
Figure 7. The spatial pattern of correlation between seasonality of MTVDI and seasonality of (a) Vapor Pressure Deficit (VPD), (b) Climatological Water Deficit (CWD), (c) Terrestrial Water Storage (TWS), and (d) Palmer Drought Severity Index (PDSI).
Remotesensing 13 00339 g007
Figure 8. The seasonality of MTVDI, Solar-Induced Chlorophyll Fluorescence (SIF) and Enhanced Vegetation Index (EVI). The seasonality represents the mean values of each month from 2003 to 2010. The gray shadings represent standard error of the mean (SEM).
Remotesensing 13 00339 g008
Figure 9. The spatial pattern of the correlation between seasonality of MTVDI and seasonality of (a) Enhanced Vegetation Index (EVI) and (b) Solar-Induced Chlorophyll Fluorescence (SIF). Multiyear average of wet minus dry season differences of simulated (c) ΔEVI and (d) ΔSIF.
Remotesensing 13 00339 g009
Table 1. Basic information of climatic dryness indicators and canopy photosynthesis proxies.
IndicatorEvaluation DatasetAbbr.Original Spatial ResolutionOriginal Temporal ResolutionPeriodReference
climatic dryness indicatorGRACE TWSTWS0.50°Monthly2003–2010Humphrey and Gudmundsson 2019 [29]
ERA-Interim VPDVPD0.125°Daily2003–2010Yuan et al., 2019; Dee et al., 2011 [30,56]
Terraclimate PDSIPDSI0.50°Monthly2003–2010Abatzoglou et al., 2018 [59]
Climatological Water DeficitCWD0.50°Monthly2003–2010Aragão et al., 2007 [61]
canopy photosynthesis proxyMODIS EVIEVI0.05°Monthly2003–2010Huete et al., 2002 [33]
GOME-2 SIF v26SIF0.50°Monthly2007–2010Joiner et al., 2013 [34]
Publisher’s Note: MDPI stays neutral with regard to jurisdictional claims in published maps and institutional affiliations.

